working papers series - center for sustainable...
TRANSCRIPT

Scaling Up Primary Education Services in Rural India
Nirupam Bajpai, Ravindra H. Dholakia and Jeffrey D. Sachs
CGSD Working Paper No. 28
November 2005
Working Papers Series Center on Globalization and Sustainable Development The Earth Institute at Columbia University www.earth.columbia.edu

Scaling up Primary Education Services in Rural India:
Public Investment Requirements and Policy Reform
Case Studies of Uttar Pradesh and Madhya Pradesh
Nirupam Bajpai, Ravindra H. Dholakia and Jeffrey D. Sachs
Abstract
We attempt to address two key questions in this paper: 1) In terms of state-wide scaling up of rural services (in Uttar Pradesh, and Madhya Pradesh) in the area of primary education, what will it cost financially and in terms of human resources to scale-up these services in all the rural areas of these two states? And 2) what policy, institutional and governance reforms may be necessary so as to ensure proper service delivery? As is well known, merely setting up more schools, for instance, is not going to be enough; higher public investments in these areas needs to be accompanied by systemic reforms that will help overhaul the present service delivery system, including issues of control and oversight, for example.
Nirupam Bajpai is Senior Development Advisor and Director of the South Asia Program at CGSD. He is also a member of the UN Millennium Project. Ravindra H. Dholakia is Professor of Economics at the Indian Institute of Management at Ahmedabad in India. Jeffrey D. Sachs is Director of the Earth Institute at Columbia University and Special Advisor to the United Nations Secretary General, Kofi Annan.
During the week of November 14, 2005, Nirupam Bajpai submitted this paper to His Excellency, Dr. A P J Abdul Kalam, President of India and the Honorable Dr. Manmohan Singh, Prime Minister of India. Nirupam Bajpai also presented and discussed this paper with Dr. Montek Singh Ahluwalia, Deputy Chairman, Planning Commission, Digvijaya Singh, General Secretary, All India Congress Committee and former Chief Minister of Madhya Pradesh, Babulal Gaur, Chief Minister of Madhya Pradesh, Mulayam Singh Yadav, Chief Minister of Uttar Pradesh, Vijay Singh, Chief Secretary of Madhya Pradesh and R Ramani, Chief Secretary of Uttar Pradesh and several other senior civil servants in Delhi, Bhopal and Lucknow.
2

Scaling up Primary Education Services in Rural India: Public Investment Requirements and Policy Reform
Case Studies of Uttar Pradesh and Madhya Pradesh
Key Recommendations
Per our estimates of the financial requirements of scaling up primary education services in rural Uttar Pradesh (UP) and Madhya Pradesh, (MP) additional public spending of Rs.161 per capita is needed for UP and Rs.65 per capita for MP. In 2004-05, on a per capita basis, the allocation to the primary education sector is almost the same in MP (Rs. 386) and UP (Rs. 376). Thus, scaling up of primary education in rural MP and UP on a per capita basis amounts to increasing the budget allocation by 8 percent in MP and 21 percent in UP. Although financially this is achievable in one year, at least in MP, however, it may be spread over the next 3 to 4 years in both the states considering implementation problems and delays in construction of school buildings. MP needs to focus more on two key aspects: one, to get all the children from the poor families and special focus groups, such as girls and children from the SC and ST communities that are out of school into school and two, to strive harder to attain and sustain higher levels of quality in their primary schools. While the former may require measures, such as higher levels of financial incentives for poor parents to send their children to school, improved quality and quantity of the mid-day meals being provided, and wide-ranging awareness programs, the latter may require drastic changes in the learning methods and techniques, making classroom activities more experimental and enjoyable for the children, improved teacher training, and of course upgrading the school infrastructure. By contrast, UP needs to focus more on construction of more schools (25,426 additional schools are needed per our calculations) and hiring more teachers, (314,839 additional teachers are needed per our calculations) areas where MP seems to have achieved a fair bit. Of course, UP too needs to attain higher enrollment levels and improve the quality of teaching. We recommend the following areas for much greater attention: school infrastructure, functioning, curriculum and instructional resources, stricter control over and improved oversight of teachers’ improved and rigorous teachers’ training, and improved quality and quantity of mid-day meals. With regard to the Panchayati Raj Institutions, (PRIs) and their ability to deliver, the following questions need to be looked into: Has the power and authority that has been devolved to the PRIs on paper actually reached the people? Do they understand their duties/responsibilities on the one hand and their authority on the other? Do the PRIs have the capacity to manage schools? Are there regular (on an on-going basis) and comprehensive capacity building programs in place? And are any measures being undertaken to ensure that the caste and patriarchy do not prejudice effective management at the local level? The syllabus and contents of the textbooks used in Mathematics, English and Environment studies in UP need serious modifications and improvements in style, relevance and simplification. In MP, the textbooks on Environmental studies need to introduce General Science more intensely than what is done presently. Like MP, English should be formally introduced from Standard I in UP also. Refer to Appendices 3 and 4. Schools with fewer rooms should run in two shifts making better use of resources. This is equally applicable in both MP and UP. There is likely to be resistance from regular teachers, but it has to
3

be overcome, if needed, by the use of para-teachers from the village itself. If the timings of the classes are decided in consultation with Village Education Committees (VEC) and the Ward Education Committees (WEC), the problem of early dropout of children on economic considerations can also be resolved. This will improve the quality of education by removing the congestion and overcrowding due to simultaneous running of classes in the same room. There is an urgent need to consider revision of the basic norm of a school with only two classrooms and an office room with a verandah to a minimum of three classrooms. This will also have implications on the revision of financial norms. The current financial norms are based wrongly on economizing resources to compromise on the quality of construction. They result in greater need for minor and major repairs much before they should normally be due. The maintenance budget available to schools annually needs substantial increase. We have recommended almost four-fold increase to improve the conditions. Discretion in the hands of a principal of the school for using the maintenance budget and such other day-to-day matters should be increased. For every single and small decision, he/she should not be made to seek approval and concurrence by the president of VEC or the WEC. There is a need to appoint a cook-cum-cleaner-helper in all primary schools. Currently, this is a responsibility of the village Panchayat, but hardly any Panchayats fulfill their obligations. As a result, it is the teacher who cooks the midday meal, serves and cleans up utensils. If he finds any time thereafter he may also teach! If an additional local help is regularly available again on an ad hoc basis, it can substantially improve the quality of instruction in the class and also help maintain cleanliness in the premises of the school. Every school must maintain a small garden as well. The helper can also look after the garden. The incentive schemes need better targeting and management. The scholarship amount of Rs.250 to Rs.300 is handed over to the students in the beginning of the year itself. As a result, the attendance in the class drops sharply thereafter, having very adverse impact on the performance of the students. Instead, the scholarship amount should be divided into monthly installments of Rs.30 and paid to the students over 10 months with a condition of satisfactory attendance record during the previous month. Such an implementation will have less chances of abuse. All scholarships or cash subsidies given to students of different categories should be of the same amount for Classes I through III and should be of progressively higher amounts for Classes IV and V. Like all the cash subsidies and school uniforms, the textbooks and stationary should also be given only to the children from the target group, i.e. to the families below the poverty line and SC/ST categories. There is an urgent need to relax approvals to the private schools, particularly in UP. The official procedures and formalities to get an approval and recognition for private aided and non-aided schools should be simplified and expedited. State government can think of collecting small fees from the non-target group population to provide better facilities like library, play ground with toys and sports equipments, small laboratory equipments for conducting experiments prescribed in their environment textbooks, etc. In terms of furniture, the schools need to be better equipped. They should have one steel cupboard per classroom, a table and a chair per classroom, and a table and three chairs for the office room. Currently none of these are available. Moreover, students in rural areas may not sit on benches in
4

the government schools, but can certainly sit on carpets. Similarly, separate toilets for boys and girls should be constructed on an urgent basis in very school. Para-teachers should be given rigorous training for 30 days in a year and should be paid the same allowance (Rs.70 / day) as the regular teachers. Moreover, they should also be given the teaching contingency on par with regular teachers (Rs.500 p.a.) on completion of one academic year. Labor laws need to be reformed. The total number of leaves in a year that a regular teacher is entitled to is far in excess of what can be tolerated in an essential service like primary education. Moreover, the practice of having half-a-day casual leave also doubles the number of casual leaves effectively. This contributes to teachers’ absenteeism, insincerity and irregularity ultimately discouraging students and harming the cause of education. Such laws need immediate revision. We suggest an education sector strategy for India that is based on the objectives of the Sarva Siksha Abhiyan (SSA) not only at the national level, but also more importantly at the state and district levels. States and districts should strive hard to attain the goals laid out in the SSA, especially for the laggard states and districts, with particular focus on the 150 most backward districts of the country. Based on SSA’s national goals, state governments should announce targets for education to be met at the state and district levels by the year 2010. We suggest that the central government should plan to convene a meeting of Chief Ministers and Education Ministers of all Indian States in 2006 to discuss how the states will meet the education targets of SSA. This meeting will allow states to present their most successful initiatives, so that all states can adopt “best practices” in public education.
5

Scaling up Primary Education Services in Rural India: Public Investment Requirements and Policy Reform1
Case Studies of Uttar Pradesh and Madhya Pradesh
Nirupam Bajpai, Ravindra H. Dholakia and Jeffrey D. Sachs2
This report is based on the work undertaken during Year I of a two-year project on scaling up primary education services in rural India. The report focuses on two states: Uttar Pradesh (henceforth UP) and Madhya Pradesh (henceforth MP). Unnao district in UP and Raisen district in MP were taken up for in-depth studies. Furthermore, detailed questionnaires were administered in five villages in each of the two districts that were distinct from each other and representative of the different conditions so that these could be reasonably extrapolated to the district.
We attempt to address two key questions in this report:
1) In terms of state-wide scaling up of rural services (in Uttar Pradesh and Madhya Pradesh) in the area of primary education, what will it cost financially and in terms of human resources to scale-up these services in all the rural areas of these two states? And
2) What policy, institutional and governance reforms may be necessary so as to ensure proper service delivery? As is well known, merely setting up more primary schools, for instance, is not going to be enough; higher public investments in these areas needs to be accompanied by systemic reforms that will help overhaul the present service delivery system, including issues of control and oversight, for example.
Elementary education was all along a part of the Directive Principles of State Policy in the Indian Constitution. Since the 83rd Amendment to the Indian Constitution, however, it is recognized as a fundamental right. The constitution states, “… the State shall endeavour to provide, within a period of ten years …., for free and compulsory education for all children until they complete the age of fourteen years” (Article 45 of the Constitution). Literacy with primary education covering the three R’s – reading, writing and arithmetic – is widely accepted as an essential ingredient of civilized existence, and an inevitable feature reflecting the quality of life. Education provides freedom from ignorance, access to information, technology, and communication channels, broader outlook, and ability to respect other viewpoints. It is, therefore, rightly treated as a merit 1 This report is based on the work undertaken for a project entitled ‘Scaling up Services in Rural India’ that is housed at the Center on Globalization and Sustainable Development (CGSD) of the Earth Institute at Columbia University. CGSD is grateful to The William and Flora Hewlett Foundation for providing financial support to this project and especially thanks Smita Singh, Program Director, Global Development, and Shweta Siraj-Mehta, Program Officer for discussions and their keen interest in this project. 2 Nirupam Bajpai is Senior Development Advisor and Director of the South Asia Program at CGSD. Ravindra H. Dholakia is Professor of Economics at the Indian Institute of Management at Ahmedabad in India. Jeffrey D. Sachs is Director of the Earth Institute at Columbia University and Special Advisor to the United Nations Secretary General, Kofi Annan. The authors thank Sudarshana Kundu for research assistance and Rasnanda Panda and Shreekant Iyengar for help in fieldwork and data collection.
6

good to be provided to all citizens by the government as a matter of their right. Given the state of current technology, formal education does not fulfill the criteria of non-excludability and non-rivalry in consumption. Private returns or benefits also justify the private costs, because the issue of externalities is largely off-set by the economies of scale in this sector. The case for public provisioning of primary education is, therefore, based on non-affordability and unduly high discount rates used by the poor. Secondly, the dimensions of space and distance are also important because the direct consumers of primary education are the small children living all over the space. Private players can and do provide the service in this sector, but would not find it viable to reach every nook and corner. Thirdly, public provisioning is required in this sector also to provide a choice or an option to consumers so that the quality and price of the private players can be regulated and indirectly controlled. Scaling up of rural services in the primary education sector should be viewed from this perspective.
In order to address the question of the magnitude of scaling up primary education services in rural areas, we have selected two large states in India. Uttar Pradesh and Madhya Pradesh. UP is the most populous state of India with 16.4 percent of India’s population and MP is the second biggest state with 9.4 percent of geographical area of the country. Both these states are among economically most backward states in the country with relatively very high proportion of the poor. Moreover, MP has the largest tribal population, and UP has the largest Muslim and scheduled caste populations in the country. Attainment of the millennium development goals (MDGs) by 2015 individually in both these states is definitely a challenging task. The rural areas in both these states are relatively more lagging and need urgent attention. The estimates of the requirement of financial and human resources to scale up the rural primary education in these two states are likely to be on the upper end for making any generalization about the country as a whole. However, the issues pertaining to the quality of the service, effective delivery and incentive structure are likely to remain the same everywhere in rural India. Primary education refers to the education of children between the ages 6-11 years (Standard/Grade I through V). As mentioned above, universalization of primary education (UPE) is a constitutional provision in India and there has been a steady expansion in the spread of primary education since Indian independence in 1947. The Indian educational system is the second largest in the world after China. In 2001-02, there were nearly 0.66 million primary schools in India providing access to 84 percent of habitations with a primary school located within a distance of one kilometer. Table 1 shows literacy rates for India as a whole and by sex. It also shows the decadal rates of change from 1901 to the present.3 Literacy rates have increased for both males and females, and though the latter continues to lag behind the former, there has been a narrowing of the male-female gap in literacy: from 24.8 percent in 1991 to 21.7 percent in 2001. In 2001, the absolute number of illiterates declined historically for the
3 Before the 1991 census, only those belonging to the age-group 0-4 years were excluded from the population in order to compute literacy rates and the basis of the computation was the entire population. From the 1991 census onward, literacy rates were computed based on the population aged 7+ years and above.
7
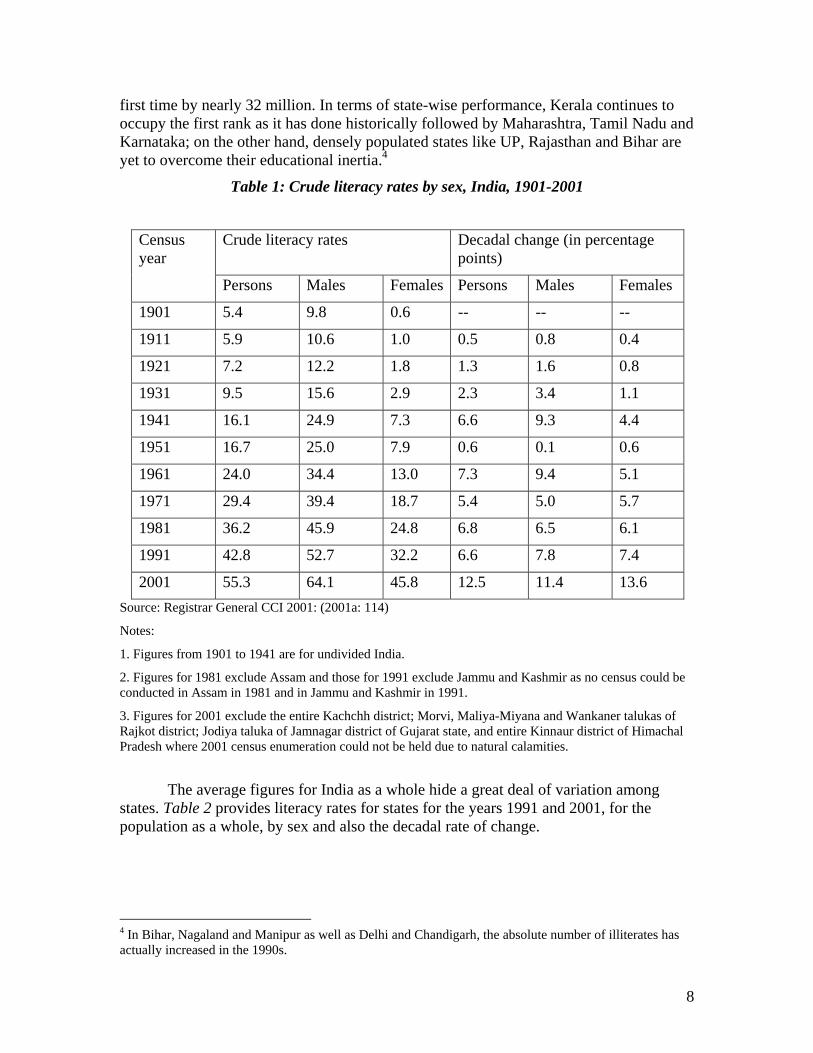
first time by nearly 32 million. In terms of state-wise performance, Kerala continues to occupy the first rank as it has done historically followed by Maharashtra, Tamil Nadu and Karnataka; on the other hand, densely populated states like UP, Rajasthan and Bihar are yet to overcome their educational inertia.4
Table 1: Crude literacy rates by sex, India, 1901-2001
Crude literacy rates Decadal change (in percentage points)
Census year
Persons Males Females Persons Males Females
1901 5.4 9.8 0.6 -- -- --
1911 5.9 10.6 1.0 0.5 0.8 0.4
1921 7.2 12.2 1.8 1.3 1.6 0.8
1931 9.5 15.6 2.9 2.3 3.4 1.1
1941 16.1 24.9 7.3 6.6 9.3 4.4
1951 16.7 25.0 7.9 0.6 0.1 0.6
1961 24.0 34.4 13.0 7.3 9.4 5.1
1971 29.4 39.4 18.7 5.4 5.0 5.7
1981 36.2 45.9 24.8 6.8 6.5 6.1
1991 42.8 52.7 32.2 6.6 7.8 7.4
2001 55.3 64.1 45.8 12.5 11.4 13.6 Source: Registrar General CCI 2001: (2001a: 114)
Notes:
1. Figures from 1901 to 1941 are for undivided India.
2. Figures for 1981 exclude Assam and those for 1991 exclude Jammu and Kashmir as no census could be conducted in Assam in 1981 and in Jammu and Kashmir in 1991.
3. Figures for 2001 exclude the entire Kachchh district; Morvi, Maliya-Miyana and Wankaner talukas of Rajkot district; Jodiya taluka of Jamnagar district of Gujarat state, and entire Kinnaur district of Himachal Pradesh where 2001 census enumeration could not be held due to natural calamities.
The average figures for India as a whole hide a great deal of variation among
states. Table 2 provides literacy rates for states for the years 1991 and 2001, for the population as a whole, by sex and also the decadal rate of change.
4 In Bihar, Nagaland and Manipur as well as Delhi and Chandigarh, the absolute number of illiterates has actually increased in the 1990s.
8

Table 2: Literacy rates for all Indian states, 1991 and 2001 State and Union Territory 1991 2001 Gains in literacy rates
(2001-1991) Persons Male FemalePersons Male Female Persons Male Female
INDIA 52.2 64.1 39.3 65.4 75.6 54.0 13.0 11.5 14.7
Haryana 55.9 96.1 40.5 68.6 79.3 56.3 12.7 10.2 15.8
Himachal Pradesh 63.9 75.4 52.1 77.1 86.0 68.1 13.2 10.6 16.0
Jammu & Kashmir 51.5 63.3 38.8 65.4 75.9 54.2 13.9 12.6 15.4
Punjab 58.5 65.7 50.4 70.0 75.6 63.6 11.5 9.9 13.2
Rajasthan 38.6 55.0 20.4 61.0 76.5 44.3 22.4 21.5 23.9
Chandigarh (UT) 77.8 82.0 72.3 81.8 85.7 76.7 4.0 3.7 4.4
Delhi (UT) 75.3 82.0 67.0 81.8 87.4 75.0 6.5 5.4 8.0
Bihar 37.5 51.4 22.0 47.5 60.3 33.6 10.0 8.9 11.6
Sikkim 56.9 65.7 46.8 69.7 76.7 61.5 12.8 11.0 14.7
West Bengal 57.7 67.8 46.6 69.2 77.6 60.2 11.5 9.8 13.6
Orissa 49.1 63.1 34.7 63.6 76.0 51.0 14.5 12.9 16.3
A & N Islands (UT) 73.0 79.0 65.5 81.2 86.1 75.3 8.2 7.1 9.8
Assam 52.9 61.9 43.0 64.3 71.9 56.0 11.4 10.0 13.0
Arunachal Pradesh* 41.6 51.5 29.7 54.7 64.1 44.2 13.1 12.6 14.5
Manipur 59.9 71.6 47.6 68.9 77.9 59.7 9.0 6.3 12.1
Meghalaya 49.1 53.1 44.9 63.3 66.1 60.4 14.2 13.0 15.5
Mizoram 82.3 85.6 78.6 88.5 90.7 86.1 6.2 5.1 7.5
Nagaland 61.7 67.6 54.8 67.1 71.8 61.9 5.4 4.2 7.1
Tripura 60.4 70.6 49.7 73.7 81.5 65.4 13.3 10.9 15.7
Madhya Pradesh 44.2 58.5 29.4 64.1 76.8 50.3 19.4 18.3 20.9
Uttar Pradesh 41.6 54.8 24.4 57.4 70.2 43.0 16.7 15.4 18.6
Gujarat 61.3 73.1 48.6 70.0 80.5 58.6 8.7 7.4 10.0
Maharashtra 64.9 76.6 52.3 77.3 86.3 67.5 12.4 9.7 15.2
D & N Haveli (UT) 40.7 53.6 27.0 60.0 73.3 43.0 19.3 19.7 16.0
Daman & Diu (UT) 71.2 82.7 59.4 81.1 88.4 70.4 9.9 5.7 11.0
Andhra Pradesh 44.1 55.1 32.7 61.1 70.9 51.2 17.0 15.8 18.5
Goa 75.5 83.6 67.1 82.3 88.9 75.5 6.8 5.3 8.4
Karnataka 56.0 67.3 44.3 67.0 76.3 57.5 11.0 9.0 13.2
Kerala 89.8 93.6 86.2 90.9 94.2 87.9 1.1 0.6 1.7
Tamil Nadu 62.7 73.8 51.3 73.5 82.3 64.6 10.8 8.5 13.3
Lakshadweep (UT) 81.8 90.2 72.9 87.5 93.2 81.6 5.7 3.0 8.7
Pondicherry (UT) 74.7 83.7 65.6 81.5 88.9 74.1 6.8 5.2 8.5
Source: Census of India, 1991 and 2001.
9

Table 3 - Percentage Distribution of Districts Ranked on the basis of a Composite Index of socio-economic & demographic indicators
State Total
No. of districts
0-100 101-200 201-300
301-400
401-569
All
Group-I 1. Andhra Pradesh 23 8.7 47.8 39.1 4.3 0.0 100.0 2. Gujarat 25 8.0 60.0 16.0 12.0 4.0 100.0 3. Haryana 19 21.1 57.9 21.1 0.0 0.0 100.0 4. Karnataka 27 48.1 29.6 18.5 0.0 0.0 100.0 5. Kerala 14 92.9 7.1 0.0 0.0 0.0 100.0 6. Maharashtra 35 17.1 40.0 31.4 11.4 0.0 100.0 7. Punjab 17 70.6 29.4 0.0 0.0 0.0 100.0 8. Tamil Nadu 30 93.3 6.7 0.0 0.0 0.0 100.0 Sub-total (1 to 8) 190 42.1 35.3 17.4 4.7 0.5 100.0 Group-II 9. Assam 20 10.0 5.0 35.0 30.0 20.0 100.0 10. Bihar 55 0.0 0.0 0.0 7.3 92.7 100.0 11. Madhya Pradesh 61 0.0 6.6 32.8 24.6 36.1 100.0 12. Orissa 30 0.0 6.7 46.7 43.3 3.3 100.0 13. Rajasthan 32 0.0 0.0 0.0 28.1 71.9 100.0 14. Uttar Pradesh 83 0.0 6.0 10.8 27.7 55.4 100.0 15. West Bengal 18 11.1 22.2 33.3 27.8 5.6 100.0 Sub-total (9 to 15) 299 1.3 5.3 18.7 25.1 49.5 100.0 Total 489 17.2 17.0 18.2 17.2 30.5 100.0 Source of basic data: District-wise Social, Economic & Demographic Indicators, National Commission on Population, Government of India 2001. If one were to look at the states in terms of a composite index based on indicators of socio-demographic characteristics, the divide between the Indian states shows up even more starkly. Rankings have been made on the basis of data provided by the National Commission on Population (see Table 3). These rankings bring out the extent of intra-state disparities along with the intensity of the differences among the states in social/demographic development. While all states have some districts which are relatively backward, the proportion of such districts is far larger in the Group II states than in Group I states5. The majority of the districts in Group I states come within the first 200, whereas in the case of Group II states, the bulk fall in the beyond-200 category. None of the districts of Kerala, Punjab and Tamil Nadu rank beyond the first 200, whereas 93 percent of the districts in Bihar, 72 percent of Rajasthan, 55 percent of UP and 36 percent in MP are placed in the 400 and beyond category. 5 States have been divided in two groups. In Group I are relatively better off states with respect to socio-economic and demographic indicators. Group I states are: Andhra Pradesh, Gujarat, Haryana, Karnataka, Kerala, Maharashtra, Punjab, and Tamil Nadu. In Group II, the states are: Assam, Bihar, Madhya Pradesh, Orissa, Rajasthan, Uttar Pradesh and West Bengal. Data is prior to bifurcation of Bihar, MP and UP.
10

In 2001, Kerala, Maharashtra and Himachal Pradesh had more than 75 percent of their population of 7+ years literate. On the other hand, less than half of Bihar’s population of seven years and above was literate with female literacy rate being only 33.6 percent. In terms of zones, states in the South and West outperform states in the North and East. Between 1997 and 2002, the gross primary school enrolment rate6 for India was 111 for males and 92 for females. The net primary school enrolment rate,7 on the other hand, was only 78 for males and 64 for females. The net primary school attendance rate between 1999 and 2002 was 79 for males and 73 for females. However, of the children who entered primary school, only 68 percent reached grade V between 1995 and 1999 (UNICEF, 2004).
Table 4 provides decadal data on gross primary school enrolments by sex between 1950-51 and 2001-2002. As can be seen from the table there has been a steady increase in the numbers of boys and girls attending primary school over time. Girls’ enrolment has been steadily increasing over time and in 2000-01, nearly 50 percent of girls in the age-group 6-11 were enrolled in school. These statistics are heartening because at least until
Table 4: Gross Primary School Enrolment by sex: 1950-51 to 2000-01
Primary School Year Boys Girls Total
1950-51 13.8 5.4 19.2 1960-61 23.6 11.4 35.0 1970-71 35.7 21.3 57.0 1980-81 45.3 28.5 73.8 1990-91 57.0 40.4 97.4 2000-01 64.0 49.8 113.8
Table 5: Rural-Urban Literacy Rates 1991-2001
YEAR MALE FEMALE PERSONS 1991 (7 years and above) - RURAL 57.87 30.62 44.69 - URBAN 81.09 64.05 73.08 - TOTAL 64.13 39.29 52.21 2001 (7 years and above) - RURAL 71,18 46.58 59.21 - URBAN 86.42 72.99 80.06 - TOTAL 75.85 54.16 65.38
Source: Ministry of Education, GOI and Census of India, 1991, 2001 6 Gross primary school enrolment rate is computed as the number of children enrolled in primary school regardless of age divided by the population of that age group. 7 Net primary school enrolment rate is computed as the number of children in that age group enrolled in primary school divided by the population of that age group.
11

the 1990s, one of the most dismal aspects of India’s education system was the large percentage of the population in the younger age groups that were out of school. Despite the strong constitutional backing for the provision of primary education in India8 and its expansion over time, the system is characterized not only by low achievements, but also by large unevenness of achievements. Huge gaps remain between rural and urban areas, and the probability of getting any education at all sharply depends on gender, caste and income. Women, scheduled castes and tribes and the poor are faced with formidable barriers when it comes to getting basic education. Of the 200 million children in the age group 6-14, it is estimated that 59 million are out of school. Of these 35 million are girls and 24 million are boys (Ministry of Human Resources Development, GOI).
Apart from socio-economic determinants, the educational infrastructure and the management and the governance of the educational system in India are far from efficient or sufficient. The government is the largest provider of education in India with only about 10 percent of primary schools being in the private sector.9 The quality of education provided by the public education system is low which translates into low educational abilities even for those who are able to complete primary education cycle. Moreover, there is a lot of ‘waste’ in the educational system with dropout rates as high as 40 percent for the country as a whole and in some Indian states; they are as high as 75 percent. Though the number of primary schools in the country increased, more than 100,000 habitations still do not have access to a primary school within a distance of one kilometer. Teacher-pupil ratios are inadequate: less than 2 teachers are available in rural areas to teach a class size of around 100 students. Teacher motivation and teaching incentives are also very weak. India perhaps has the highest rate of teacher truancy10 in the world. Existing Infrastructure and Performance in MP and UP
UP and MP were below the national average in the overall effective literacy rate in 2001. They were also below the national average in 1991. The basic reason for their overall lower literacy rates is extremely low literacy among females (Table 6). Both the states have made remarkable progress in improving their literacy rates during the 1990s.
8 In 2002, the Supreme Court of India decreed that free primary education was a constitutional right. 9 Around 3% of private schools are aided by the government, which makes government intervention in the education sector even greater.
10 According to a joint Harvard University and World Bank study (Burns et al. 2003) during which school visits to 3,700 randomly selected government primary schools, largely in rural areas, in 20 Indian states were undertaken, the study concluded that, at any time, 25 percent of the teachers were absent from schools. Studies conducted in other countries showed India to be one of the worst cases. Bangladesh's teacher-truancy rate was 16 percent. Zambia's was 17 percent. Only Uganda was worse, with 27 percent. Similarly, the Public Report on Basic Education (PROBE) in India examined potential reasons for teacher truancy or poor performance. Surveyed teachers were largely content with salary (68 percent) and leave entitlements (86 percent). The most common complaint was that schools are under-equipped, under-funded, under-staffed, and overcrowded. More than half had a leaking roof, 89 percent lacked functioning toilets, and half had no water supply. Some school buildings were misused as cattle sheds, police camps, teacher residences, or for drying cow-dung cakes.
12

Their rate of improvement is considerably higher than the nation. Table 6 show that MP is catching up with the national average very rapidly and in male literacy, it has surpassed the national average in 2001. UP is still lagging behind.
Table 6: Effective Literacy Rates, 1991 and 2001. 1991 Census 2001 Census States Male Female Persons Male Female Persons
MP 58.4 28.9 44.2 76.8 50.3 64.1 UP 55.7 25.3 41.6 70.2 43.0 57.4 India 64.1 39.3 52.2 75.9 54.2 65.4 Source: Census of India, 1991 and 2001.
The spread of basic infrastructure with a primary school available within one
kilometer distance exists in both UP and MP almost to the same extent as the national average. In 1996-97, 18.3 percent villages in MP and 20.1 percent villages in UP did not have a school within one kilometer distance (Hirway and Mahadevia, 2004, p.310). By September 2002, however, this proportion has come down to 10.8 percent in MP and 12 percent in UP. Table 7 presents the enrolment by sex in the primary schools (classes I through V) in the two states as on September 2002; and Table 8 provides number of schools by classrooms in these two states.
Table 7: Sex-wise Enrolment in Primary School (Class I to V) in MP and UP as on September 30, 2002 in million
MP UP Sex Total Rural / Total Total Rural / Total Boys 4,140,536 72.85% 12,227,344 81.32% Girls 3,569,822 73.27% 10,484,963 82.05% Total 7,710,358 73.05% 22,712,307 81.66% Source: www.indiastat.com
It can be seen from these tables that the proportion of rural enrolment in the primary school is about 9 percentage points higher in UP than in MP. The rural enrolment proportion is marginally higher among girls than among boys in both the states. Thus, while this is certainly encouraging, it is equally important for the girls to complete schooling rather than dropping out. Moreover, the primary schools in both the states are relatively small. In MP almost 59 percent of the primary schools have only upto 3 rooms, whereas in UP it is 72.4 percent. Thus, in these schools, two and often three classes operate in the same classroom, and that too, simultaneously. There is a serious constraint of availability of classrooms. Several of these primary schools also suffer from the lack of other physical infrastructure like buildings, classrooms, toilets, separate toilets for girls, electricity, drinking water, and blackboards (see Table 9). It is clear from Table 9 that elementary schools in UP, relative to MP have better physical infrastructural facilities like blackboards, buildings, toilets, drinking water, condition of classrooms, and number of classrooms. However, their major problem is the congestion in the classroom. 55 to 60 percent of pupils study in schools with student-classroom ratio (SCR) greater
13

than 60. In MP, this proportion is half. Table 9 also reveals that pre-primary education is more popular in MP than in UP.
Table 8: Number of Primary and Upper Primary Schools by Classrooms in MP and UP, 2003-04
MP UP Number of Classrooms Schools % Schools %
1 5641 7.8 2367 2.12 19928 27.5 41768 37.73 16874 23.3 36110 32.64 5742 7.9 10446 9.45 4500 6.2 9895 8.9
6 or more 19777 27.3 10147 9.2Total 72462 100.0 110733 100.0
Source: www.indiastat.com Availability of trained manpower to take up teaching in this sector is also very important for successful and effective delivery of the service to the target group. Table 10 presents the number of teachers in recognized primary schools in the two states. As per the table, there were 0.17 million primary teachers in MP and 0.29 million in UP in September 2001. Although MP had only 67 percent of them trained, UP had almost 95 percent trained teachers. However, these numbers are only of the teachers in regular employment.
In 1994, the Central government launched the District Primary Education Programme (DPEP) and subsequently in 2000, the Sarva Shiksha Abhiyan (SSA). DPEP aimed to attain the goal of universal elementary education through district specific planning, decentralized management and community participation, empowerment and capacity building at all levels (Ministry of Education, GOI).
The stated objectives of the DPEP are:
• Provide all children with access to primary education. • Reduce dropout rates at the primary school level to less than 10%. • Reduce differences in enrolment, dropout rates, and learning achievement among
gender and social groups to less than 5%. • Raise the average achievement of students in language and mathematics by 25%
and by 40% in other subjects. • Strengthen the capacity of national, state and district level institutions and
organizations for planning, management and evaluation of primary education.
In order to be selected for the DPEP, the district has to have female literacy rates that are below the national average. Moreover those states are selected for DPEP where the Total Literacy Campaign (TLC) has generated a demand for elementary education.
14

When the program was launched in 1994, it covered forty-two districts in seven states, namely Assam, Haryana, Karnataka, Kerala, Madhya Pradesh, Maharashtra and Tamil Nadu. Later, it was extended to Uttar Pradesh, Bihar, West Bengal, Orissa, Andhra Pradesh, Gujarat and Himachal Pradesh. Currently, the program covers 176 districts in 15 states of India. These states together have 60 percent of the child population in India. Another 60-65 districts are slated be brought into the DPEP fold.
DPEP is a centrally sponsored scheme with the central government providing 85 percent of funds and the state government providing the remaining 15 percent. The share of the central government comes from external assistance from bilateral and multilateral agencies such as the World Bank, IDA, DFID, EC, UNICEF and the government of Netherlands. Some of these funds are in the form of soft loans while others are outright grants. Under the DPEP, a maximum of Rupees 40 million is provided for implementation and a project’s life lasts between five and seven years. Of the total project cost, 70 percent has to be spent on improving the quality of education, whereas only 24 percent can be spent on civil works and 6 percent on management.
15

Table 9: Infrastructure Availability in Elementary Schools in MP and UP, 2003-04
State / Description
Prim
ary
only
Prim
ary
with
Upp
er
Prim
ary
Prim
ary
+Upp
er
Prim
ary
+ Se
cond
ary
+Hi g
her
Upp
er P
rim
ary
only
Upp
er P
rim
ary
+ Se
cond
ary
+ H
ighe
r
Madhya Pradesh 1) % School with Pre-primary 36.8 47.7 55.8 0 0 2) % of Single Teacher schools 13.4 5.2 4.8 9.7 1.6 3) % of Enrol. In Single Teach. Sch. 9.1 3.2 5.0 4.7 1.0 4) % of Single Classroom Schools 8.9 4.5 2.0 3.2 1.8 5) % of Schools with SCR* > 60 16.1 23.6 14.8 9.2 15.8 6) % of Enrol. In schools with SCR* > 60 29.8 41.9 28.8 20.0 23.0 7) % of No Female Teacher Schools 45.9 32.8 41.8 32.7 16.2 8) % of Schools without Blackboards 11.3 13.9 27.5 15.8 15.6 9) % of Schools with Common Toilets 23.8 43.1 64.4 20.8 47.6 10) % of Schools with Girls’ Toilets 13.6 33.7 67.7 14.2 41.3 11) % of Schools without Buildings 6.3 33.0 31.3 0.2 5.5 12) % of Enrol. In Schools without Buildings 5.3 3.1 1.2 29.2 6.0 13) % of School with Drinking Water Facility 81.8 87.4 92.3 78.6 88.6 Total Classrooms (CR) (in ’00) 1280 572 171 217 56 Other Rooms (in ’00) 369 145 51 81 21 % of CR needing Minor Repairs 29.2 22.1 13.2 29.7 21.4 % of CR needing Major Repairs 9.9 6.5 2.5 9.2 6.0
Uttar Pradesh 1) % School with Pre-primary 7.3 3.0 6.3 0 0 2) % of Single Teacher schools 16.1 2.4 2.4 13.4 1.8 3) % of Enrol. In Single Teach. Sch. 13.3 4.3 1.8 7.5 1.9 4) % of Single Classroom Schools 2.2 0.5 0.3 1.2 0.4 5) % of Schools with SCR* > 60 49.6 32.7 22.4 16.5 13.4 6) % of Enrol. In schools with SCR* > 60 66.1 52.2 37.6 36.1 22.1 7) % of No Female Teacher Schools 39.8 36.2 51.4 69.8 41.6 8) % of Schools without Blackboards 2.9 9.7 5.2 3.4 3.4 9) % of Schools with Common Toilets 65.6 83.3 83.7 66.7 88.0 10)% of Schools with Girls’ Toilets 50.8 77.6 77.6 54.1 80.7 11) % of Schools without Buildings 1.2 17.1 2.4 0 0.2 12) % of Enrol. In Schools without Buildings 0.8 0.1 0.3 1.3 0 13) % of School with Drinking Water Facility 94.9 97.8 97.9 90.4 98.6 Total Classrooms (CR) (in ’00) 3247 256 40 870 122 Other Rooms (in ’00) 965 53 10 318 41 % of CR needing Minor Repairs 24.3 12.4 14.4 18.8 10.4 % of CR needing Major Repairs 9.3 3.9 2.6 8.2 2.5 *SCR = Student – Class Ratio Source: www.dpepmis.org
16

Table 10: Number of Regular Teachers in Primary Schools, September 2001
State Number of Regular Teachers % Trained
MP 173,770 67% UP 293,911 95%
Source: www.indiastat.com
The central government launched the Sarva Shiksha Abhiyan (Universal Elementary Education11) in 2001.12 As mandated by the 86th amendment to the Indian Constitution, free and compulsory education to all children between the ages 6-14 was to be provided as a Fundamental Right. The goal of SSA is to achieve Universalization of Elementary Education (UEE) to all children between the ages 6-14 by 2010. It is an umbrella plan for elementary education in India and includes the DPEP. The objectives of the SSA are:
• All children in school, Education Guarantee Center, Alternative School, ‘Back to School’ camp by 2003.
• All children complete five years of primary schooling by 2007. • All children complete eight years of schooling by 2008. • Focus on quality primary education with emphasis on education for life. • Bridge social and gender gaps in primary education by 2007 and in elementary
education by 2010. • Universal retention by 2010.
The SSA will not seek to dislodge or supersede state educational infrastructure.
However, it will seek greater community participation and to that effect will aim at decentralization of the school system with community ownership of schools. SSA is being implemented in partnership with State Governments to cover the entire country and address the needs of 192 million children in 1.1 million habitations. The program seeks to open new schools in those habitations which do not have schooling facilities and strengthen existing school infrastructure through provision of additional classrooms, toilets, drinking water, maintenance grant and school improvement grants. Existing schools with inadequate teacher strength are supposed to be provided with additional teachers, while the capacity of existing teachers is being strengthened by extensive training, grants for developing teaching-learning materials and strengthening of the academic support structure at a cluster, block and district level. The financial obligation by the government towards SSA has been estimated to be an additional Rupees 6 billion over the next ten years13 to be shared by the central and state governments. The assistance
11 Primary education refers to the first five years of schooling and Elementary Education to the first eight years of schooling. 12 The idea was recommended to the Prime Minister of India by Bajpai and Sachs (2000). 13 There has been a continual upward revision of the estimated financial requirements for achieving universal elementary education. In 1997 when the 93rd amendment bill was introduced, it was estimated
17

under the SSA program was planned to be on 85:15 sharing arrangement during the IX Five-Year Plan14, 75:25 sharing arrangement during the X Five-Year Plan, and 50:50 sharing thereafter between the Central government and the State governments.
DPEP focused on increasing enrolment and literacy in the lagging states and helped hire para-teachers15, called Shiksha Mitras on an ad hoc basis. These Shiksha Mitras are substantial in numbers. It is not that Shiksha Mitras have lower academic qualifications than the regular teachers. In fact, a large proportion of them have graduate and postgraduate qualifications. The academic qualification profile of teachers in MP is better than in UP. About 15 percent of the regular teachers in UP have qualifications of secondary school or below. This proportion in MP is less than 10 percent. In order to better understand the situation prevailing in the rural areas of these two states, Table 11 presents number of elementary schools, enrolment and number of teachers including the regular and Shiksha Mitras by different categories of schools in the year 2003-04.
From Table 11, we can see that in rural areas, average enrolment per school is considerably lower in MP than UP, both in the government schools (104 v/s. 180) and in the private schools (139 v/s. 236). Enrolment per teacher is also significantly lower in MP than in UP, the overall average ratio being 25.3 in MP and 57.3 in UP. It is interesting to see that, while the average size of a private school in rural area is greater than the government school in both the states, their average enrolment per teacher is considerably lower. This is because the availability of teachers in the private schools measured by teachers per school is considerably higher than the government schools (12.3 v/s. 3.5 in MP and 6.2 v/s. 3.3 in UP). Thus, the private schools have addressed important concerns of the parents about the availability of teachers in the school and amount of attention given to their children by the teachers in the school. The fact that private schools survive and attract a large number of students in the face of almost free primary public schools in the two states indicates a strong desire and preference on the part of parents for better quality of primary education for their children.
Table 11 also reveals that private schools in the elementary education sector play
an important role on margin in rural areas of both the states. In rural MP, they contribute 8.4 percent in all categories of schools, whereas in rural UP, it is almost 15 percent. In terms of enrolment and teachers, private schools have a larger share in the elementary education in both the states. In enrolment, they contribute 10.8 percent in MP and 18.6 percent in UP; and in teachers their share is 24.3 percent in MP and 28 percent in UP. Thus, the private sector schools cannot be ignored in the elementary education sector of rural MP and UP.
that an additional Rupees 800 million would be required annually for elementary education. By 2002, when the bill was passed, the estimate had gone up to Rupees 980 million. 14 The IX Five-Year Plan was from 1997-2002 and the X Plan runs from 2002-07. 15 Para teachers are full-time teachers who are para-professionals. They are paid lower than government teachers and are mostly employed from the local community.
18

Table 11: Rural Elementary Schools, Enrolment and Teachers in MP and UP, 2003-04
Schools Enrolment Teachers State/Type of Schools Govt. Private Govt. Private Govt. Private MP (Rural) Primary only 46366 3003 4319528 298267 133116 19588Primary with Upper Primary 9236 2339 1515834 413225 49893 37358
Primary + Upper Primary + Secondary/Higher
755 482 152656 103332 7238 14966
Upper Primary only 10811 285 978028 33771 41698 2390Upper Primary + Secondary/Higher 606 92 107072 11424 5531 1923
No response in school category 24 1 699 186 172 8
Total 67798 6202 7073817 860205 237648 76225UP (Rural) Primary only 87047 10862 16302051 2302476 228779 63422Primary with Upper Primary 364 1760 116542 801057 2914 17351
Primary + Upper Primary + Secondary/Higher
73 209 22164 86989 575 2082
Upper Primary only 15743 4384 2161909 843827 54543 24160Upper Primary + Secondary/Higher 120 817 23824 229116 813 5139
No response in school category 16 0 0 0 35 0
Total 103363 18032 18626490 4263465 287659 112154Source: www.dpepmis.org
We can also see from Table 11 that elementary schools in UP are bigger than in MP in terms of number of children, but are smaller in terms of teachers. It is not surprising, therefore, to find gross enrolment ratio in elementary education (i.e. standards I to VII or age 6 to 14 years) is only 75.3 percent in UP as compared to 83.3 percent in MP16. Thus, in relative terms, MP seems to have better soft-infrastructure in primary education than UP. The lower dropout rates (Table 12) in MP than in UP might be ascribed to the better soft infrastructure.
16 If we consider the gross enrolment ratio in lower primary i.e. standard I – V (age 6-11 years), it is 85.7% in UP and 93.8% in MP in 2002-03. However, the net enrolment rate in the same year is estimated as 78.6% and 72.5% respectively in UP and MP. This happens because of predominance of tribal population in MP leading to late schooling.
19

Table 12: Sex-wise Gross Dropout Rates in Primary and Elementary Education in 2002-03 (in %)
MP UP Sex Classes I – V Classes I – VIII Classes I – V Classes I – VIII Boys 29.24 46.22 44.69 54.57 Girls 29.96 55.32 49.75 64.56 Total 29.55 50.11 46.63 58.43 Source: www.indiastat.com
Administration and Delivery System
As mentioned earlier, primary education is a sector where the federal government already has considerable presence through substantial programs like DPEP and the Sarva Shiksha Abhiyan. This is over and above the regular state government’s departmental schemes in the sector. As a result, the whole administrative structure and delivery mechanism is more complicated than other sectors. Both MP and UP are covered under DPEP as well as SSA. Thus, in both these states, there are three different types of primary education programs running in parallel, viz. SSA, DPEP and Basic (i.e. regular state government program). There are, moreover, three types of recognized schools viz. the government, private, but aided by the government, and private non-aided, but recognized by the government. In the rural areas, the district level is the most relevant and important highest point. The District Education Officer (DEO) is the highest authority in education with all administrative and financial regulations relevant for primary education in rural areas. For the training of primary school teachers and other academic staff, the District Institute for Education and Training (DIET) operates along with Basic Shiksha Adhikari (BSA) at the district level in charge of monitoring this activity. He also supervises all the block level officers, called Assistant Basic Shiksha Adhikaris (ABSA) who, in turn, monitor all the school teachers and headmasters of primary schools in the block. At the block level, there is a Block Resource Centre (BRC) that imparts training to the teachers in the block. Every block is further divided into Nyaya Panchayats (or village Panchayats) who also have their own Resource Centers. The ABSAs are generally direct recruits whereas the BRC heads are from the senior teachers or headmasters. At the village level, three is a Village Education Committee (VEC) presided over by the Village Pradhan or Sarpanch, a political leader in the village. The headmaster of the school is the secretary of the VEC and there are additionally two parents nominated by the ABSA or BRC on VEC. It is such a committee that looks after the day-to-day functioning and overseeing of the school. Similarly, at the block and Tehsil level, there is a Ward Education Committee that looks after the block level schools. All these committees also put checks and balances on the resources transferred from above. Thus, neither the headmaster nor the president of the VEC can withdraw any amount from the bank without the prior approval of each other and the nominated members of VEC. Such a process is perhaps followed with an intention to stop any possible misuse of the funds
20

meant for the school, but they may create avoidable delays and, timely use of funds may have to be sacrificed. However, senior officials in the government have favorable inclination to involve the Pachayati Raj Institutions (PRIs) rather than operating through the regular departmental district or block level administration of the state government. In MP there are additional schools operated under Education Guarantee Scheme (EGS). These schools are generally started at selected hamlets of villages to make the primary education more accessible to population. These schools start with standard I in the first year, and progressively cover standards II and III in two more years. Depending on the need and the availability of another school nearby for the standard IV and V, a decision is taken to extend it to include these standards. Otherwise, the school runs with only standards I to III. This is a flexible structure created to offer a very utility oriented location-specific service to distant locations so that young children are not deprived of learning opportunities because of sheer distance. Rapid strides in effective literacy and considerable increase in primary enrolment in MP could be due to such useful and thoughtful interventions by the government. We will discuss EGS in some detail later in the paper. Findings of the Household Survey In order to examine the gap in the existing rural primary education services in UP and MP particularly to address the needs of the poor and economically backward segments of the population, it was necessary to better understand the difficulties and problems in the delivery of the services on one hand, and the issues in extending the coverage of the target population on the other hand. This required familiarity with ground conditions in the villages and an idea about the perception and utilization of the available services by the target population. Unnao district from UP and Raisen district from MP were selected in consultation with the state governments of UP and MP for further investigation. Considering the cost in terms of time and effort, it was decided to select five villages from each district and survey selected households belonging to the economically backward segment in these villages to get their perception and service-use characteristics17. Simultaneously, it was decided to conduct a separate survey of the primary schools existing in the same and surrounding villages to get an idea about utilization, availability of manpower, school supplies, midday meals, and teachers’ and officials’ perception of the problems. Selection of villages for the sample survey was critical because it required reflecting the socioeconomic milieu in rural areas of the district and the state. We
17 During the course of this study, we traveled extensively in and around the selected villages from the two districts of Unnao (UP) and Raisen (MP). We had detailed interactions with the District Collectors of Unnao and Raisen. We met teachers and students who were present in the schools during our unannounced visits. Discussions were also held with Sarpanchs and other members of the panchayats besides a large number of villagers. We also spoke at length with the Principal Secretaries of the Education and Planning Departments among others of the Governments of UP and MP. One of the most striking things during these school visits was to see the dilapidated condition of the buildings, which typically had just two rooms for teaching Grades I through V. Many school building walls had major water seepage, buildings were not usable due to prolonged decay, lack of repairs, incomplete construction and lack of maintenance
21

considered the Census information on all the villages in the district pertaining to size of the village in terms of number of households, literacy rate, female literacy, work participation rate, proportion of scheduled castes (SC) and scheduled tribe (ST) population, and geographical location of the village. Based on correlations of these characteristics, we finally decided to select the villages on the basis of the following three
Table 13: Selected Villages for Sample Survey with Some Characteristics Raisen
Name of Village Tehsil # of
HH Total
Population% of
SC\ST Population
Literacy Rate
Female Literacy
Rate Working
PopulationWorker-
Population Ratio
Gadarwara Silwani 43 256 57.42 0.449 0.352 146 0.570Imaliya Gondi Goharganj 76 403 84.62 0.524 0.435 188 0.467
Pati Raisen 112 689 43.39 0.578 0.481 198 0.287Purohit Pipriya Baraily 114 630 16.51 0.402 0.201 353 0.560
Salahpur Surbarri Gairatganj 86 580 93.10 0.676 0.643 259 0.447
Raisen District Rural 162945 918354 - 0.571 0.477 349984 0.381
Unnao
Name of Village Tehsil # of
HH Total
Population% of
SC\ST Population
Literacy Rate
Female Literacy
Rate Working
PopulationWorker-
Population Ratio
Baruaghat Safipur 364 2009 41.70 0.434 0.259 796 0.396Behta Unnao 430 2731 29.50 0.546 0.473 1037 0.380Bilahaor Hasanganj 100 510 88.80 0.276 0.176 310 0.608Digvijaipur Bighapur 79 600 0.00 0.582 0.419 248 0.413Majharia Purwa 184 1062 27.90 0.417 0.272 354 0.333Unnao District Rural 398756 2288781 - 0.425 0.309 814741 0.356
Source: Census of India, 2001
criteria: (i) proportion of SC/ST population; (ii) size of the village; and (iii) geographical spread. Table 13 presents the selected villages and some of their basic characteristics. The next step was to draw the sample of the households to be surveyed with a formal questionnaire. The household questionnaire is provided in Appendix 1. In order to select the households on a random basis, we would require a complete list of households18.
18 Such a list was readily available for most of the selected villages for the families living below poverty line. These lists are prepared by the district administration for implementing various government schemes with the help of local staff.
22

Proportional sample of households was randomly drawn from each village. Table 14 provides the broad characteristics of the selected sample in each district particularly classified by occupational categories like agricultural laborers, marginal farmers, small farmers, and other labor households.
Table 14: Some General Findings from Household Survey
Raisen District Unnao District Category
AL NAL MF SF Raisen AL NAL MF SF Unnao
Total # of households 54 27 29 34 144 56 77 49 7 189
Total population 349 179 171 203 902 331 392 274 42 1039
Average Family size 5.6 5.85 5.97 5.9 5.8 5.91 5.09 5.59 6 5.65
Average family annual income (Rs.)
8603 10867 9428 10212 9777 6711 9621 8008 7357 7924
Average land per landowning families (in Ha.)
0 0 1.82 1.27 1.5 - - 0.438 1.22 1.658
% HH with Cattle 72 67 100 97 83 80 73 86 100 80
Average # of cattle per family
3.08 1.56 3.03 3 2.73 2.04 1.82 2.64 1.14 1.91
% of Households having 2 or more rooms
31.48 33.33 48.28 41.18 37.5 32.14 27.27 44.9 57.14 34.39
% of Households having cement house
1.852 0.000 3.448 2.941 2.083 26.79 42.86 20.41 57.14 32.80
%of Households having Tractor
0 0 3.448 0 0.694 3.57 3.90 10.20 14.29 5.82
%of Households having Cycle
37.04 40.74 44.83 35.29 38.89 48.21 49.35 48.98 57.17 49.21
% of Households having electricity
55.56 77.78 62.07 50.00 59.72 7.14 1.30 2.04 0.00 3.17
Literacy rate % 45.56 51.40 59.06 51.72 51.94 46.53 52.30 56.20 78.57 58.40
% of Earning population 25.79 31.28 27.49 28.08 28.16 24.47 25.26 23.72 23.81 24.31
Source: Sample Survey, 2005 AL = Agricultural labor; NAL = Non-agricultural labor; MF = Marginal farmer & SF = Small farmer
23

Table 14 confirms the general impression that among the poor, the agricultural labor households are the poorest. However, compared to the land owning poor, viz. marginal and small farmers, the non-agricultural labor households are relatively better off. This is because the proportion of earning members in the household is higher among the non-agricultural laborers. It is interesting to note that a large proportion of the poor households owned cattle, and that the average cattle holding per household was around 3 in MP and 2 in UP. Similarly, almost half of the poor households owned some means of transport like a bicycle or a scooter in both the states. It is surprising to find that the proportion of cement houses was substantially higher in UP than in MP, but the proportion of households having electricity was significantly lower in UP than in MP. Rural electrification in MP has certainly been more effective with greater coverage among the target population than in UP. The average family income in both the districts is considerably low in our sample confirming that our sample essentially captures the conditions of the economically most backward segments of the population in these two states. Table 15 presents some crucial findings from our household survey of the poor in Raisen and Unnao districts. From the table, we can see that school attendance among the children in the age-group of 6 to 14 years is considerably higher in Raisen (MP) than Unnao (UP). Moreover, there is hardly any disparity between boys and girls in this. In fact, in Raisen, the school attendance proportion is marginally higher among girls than boys. In order to ensure universal enrolment, while a lot of effort is required in the rural areas of both the states; UP needs a more concerted effort to make the poor consume this service effectively. Our findings also reveal that almost 51 percent of children in Raisen have to go more than one kilometer to attend a school; the proportion is much more at 62 percent in Unnao. This could be because in Unnao, about 13 percent of the children are attending private schools compared to only 2 percent in Raisen. The private schools are usually not located in every small village, and the children may have to travel longer distances and pay higher costs. Average cost of education per child to a family turns out substantially higher in Unnao than in Raisen.
Table 15: Findings of the Household Survey in MP and UP 2005 Item Raisen (MP) Unnao (UP)
% of children attending school 92% 84% - Male 92% 84%
- Female 91% 83% % of children traveling a distance > 1 K.M. for school 51% 62% % of children attending a private school 2% 13% Average Household annual cost per child Rs.198 Rs.227 - Boys Rs.230 Rs.256 - Girls Rs.181 Rs.207 Source: Sample Survey, 2005
It would be interesting to compare our findings with a much larger scale survey conducted by NCAER in the rural UP in 1994. They reported non-attendance rate to be only 6.8 percent in rural UP. Their non-attendance was defined as “never attended” rather than our definition of “not attending”. Our estimate of about 16 percent is, therefore,
24

possible without assuming any deterioration in the overall conditions. The NCAER survey had found that the factors perceived to lead to non-enrolment and discontinuation of children in the school were predominantly arising out of demand and interest in the school and studies related matters. Customs and cultural factors did play a role, but were not found to be significant. Even a decade back, supply factors were not found to be the major problem in the NCAER Survey. However, this conclusion is not warranted because if the interest in studies and school is a dominant factor, it is dependent directly on the quality of education, facilities and regularity of schools. All these are supply side features. Our survey of households also revealed the coverage of children among the poor under various cost items of schooling like uniform, textbooks, school supplies, transport facility, library facility, sports facility and midday meals. Table 16 summarizes the findings.
Table 16: Access to Primary School Facilities in Rural MP and UP – Findings of Sample Survey, 2005 (in %)
Raisen (MP) Unnao (UP) Facility Boys Girls Children Boys Girls Children % Getting school uniform 17.4 76.2 45.6 01.0 03.8 02.2 % Getting Textbooks 93.6 97.2 95.3 81.4 81.3 81.3 % Getting school supplies 03.2 01.4 02.4 01.5 00.6 01.1 % Getting transport facility 0 0 0 0 0 0 % Getting library facility 07.7 02.1 05.0 02.0 01.9 01.9 % Getting sports facility 22.9 15.6 19.5 16.7 08.8 13.2 % Getting midday meal 68.2 80.4 74.0 75.6 78.8 77.0 Source: Sample Survey, 2005
The table reveals differences in the operation of the primary education programs in the rural areas of the two states. In MP, girls get school uniform in the government schools. Even boys belonging to scheduled tribes and poor strata get school uniform from the government schools. In UP, however, giving the school uniform from the school is not practiced on a large scale. In both the states school supplies and transport facilities are not provided, but textbooks are provided in the government schools. Sports and library facilities are again largely absent and their access to the poor children is very limited wherever they exist. Boys get marginally higher access than girls. However, in both MP and UP, the midday meal to the primary school children is provided. Similarly, the scheme of giving cash subsidy to the needy children exists in the rural areas of both the states. From our sample in Raisen, about 56 percent of the poor children going to school received cash subsidy, whereas in Unnao about 76 percent of the poor children received cash subsidy. The average amount of subsidy also differs substantially in MP and UP. In Raisen, it is only Rs.133 per child per annum, while in Unnao, it is Rs.300. The cash subsidy is generally given to the students belonging to scheduled castes and tribes only. Even the students from other backward classes and castes like other backward castes (OBCs) are not given the cash subsidy. Higher subsidy in UP basically compensates the poor children from SC/ST category for the school uniform and school supplies.
25

We also found that the average private expenditure on education in the rural areas is about Rs.421 per annum per household in Raisen and Rs.473 in Unnao. It works out to 4.4 percent of the household income of the poor in Raisen and 6.2 percent in Unnao. On per capita annual basis, the poor in the rural MP spend about Rs.73 and in rural UP about Rs.84 on primary education. However, per student cost is about Rs.198 in rural MP and Rs.227 in rural UP. Thus, the cash subsidy in MP covers about two-third cost to the household on an average, whereas it not only covers the full cost, but also provides additional one-third as an incentive to the family in the rural UP. Findings from School Survey
Since our primary objective in this paper is to provide estimates of resources required for scaling up rural primary education services, and also give some suggestions to improve the quality of the service in MP and UP, we conducted a specially designed sample survey of 18 primary schools in Raisen and 24 schools in Unnao. We covered 15 village level schools in Raisen and 14 in Unnao; one block level school in Raisen and 9 in Unnao; and two private schools in Raisen and one in Unnao. The questionnaire for schools is given in Appendix 2.
During our field visits we observed that most of the village schools have buildings and classrooms that are in very poor condition. As reported by the district administration, about 30 to 35 percent of the classrooms require either minor repairs or major repairs. The school infrastructure is in dilapidated conditions with walls having water seepage, uneven floors, lack of proper ventilation, ceilings leaking in monsoon, inadequate space to accommodate all the children when they are all present, children sitting on floor, blackboards of poor quality, and of course insufficient rooms for the number of standards. The conditions are so bad that teachers find it easier to take classes out in the open under a tree or in verandah. In the rainy season, the classes and the school buildings are in such a bad condition that teaching gets suspended for days together. This introduces an element of irregularity and when mixed with the insincerity of teachers it becomes a major deterrent for the rural children to pursue their studies. The problem of teachers abstaining on days together without official leaves sanctioned by the authorities is also a widespread phenomenon in the rural areas. The school teachers often do not live in the same village, and prefer to commute from a nearby urban location. Their loyalty gets divided as a result. The school timings are decided by the bus timings that the teachers use to commute from their home to the school in the village. This happens because, as per the government norms, residing within 5 kilometers is considered as staying in the headquarter itself. Once this is accepted in principle, it is very difficult to monitor whether the distance is actually 5 kilometers or 50 kilometers. While it is often argued that higher salaries of teachers would provide sufficient incentives for them to live in a village itself, in practice, however this is unlikely to solve
26

the problem19. This is because of their preference to live in urban centers where they would have access to better facilities and living conditions. Unless better infrastructure and facilities are also made available in the villages themselves, the teachers are unlikely to live in the village for longer periods of time. In the short to medium term, however, the only solution is to provide employment to local persons from the village itself by hiring them as Para-teachers even if their formal academic qualifications are lower. They can be given more intensive training before appointment which is temporary and subject to continuation on satisfactory performance. In short, if the government cannot modify the labor laws, it should use whatever flexibility is available within the existing laws to ensure performance. In the longer run, however the problem can be effectively solved only by upgrading the overall infrastructure like electricity, sanitation, drinking water, health facilities, road connectivity and entertainment channels in all villages. Only then can we expect regular teachers to live in the villages. Another major problem in the rural areas of these two states that came to sharp notice during our field visits and analysis of the sample data was the high dropout rates among pupils. Table 17 provides estimates of the dropout rates in the village schools of our sample.
Table 17: Dropout Rates in Village Schools, in Raisen (MP) and Unnao (UP) Districts
Standards Raisen (MP) Unnao (UP) I to II 7% 15% II to III 1 % 3% III to IV 6% 13% IV to V 10% 16% Source: Sample survey of Village Schools, 2005.
Relatively high dropout rates in UP are again confirmed by our sample survey. Even in MP, the dropout rate is high for standards IV to V. The school functionaries ascribed it to economic destitution and extreme poverty. Several household activities like fetching firewood and water, baby-sitting their younger siblings, etc., and other gainful activities like supporting parents and sharing or helping them in their activities are important reasons why children (both boys and girls) tend to withdraw. During the off season, the families are without regular employment and source of income. In the government supported programs, they also tend to involve children indirectly, if not 19 High teacher salaries also do not seem to provide adequate incentives for better teacher performance (Grover and Singh, 2002; World Bank, 1997). Moreover, politically strong teacher unions further weakens accountability of teachers. Another lacuna in the education system is teacher qualification. While in some states such as Tamil Nadu, most teachers have the basic requirements of a high school degree and two years of training, in other states, this is not the case. Moreover, teacher training programs do not take into account the reality of the environments and constraints under which teaching actually takes place into account. No attention is paid to the fact that in most schools, the same teacher is responsible for more than one Grade. More often than not more than one Grade occupies the same classroom as we observed during our school visits. In a study of two districts of Tamil Nadu, Grover and Singh (2002) report that nearly 80 % of schools have multi-grade classrooms and that this was representative of schools in Tamil Nadu as a whole.
27

directly. Sometimes, the children substitute their parents’ casual activities to relieve them so that they can go for such programs. Moreover, monetary incentives in the form of scholarships become a great pulling factor for attendance to school till the amount gets disbursed in September or October. Thereafter, the attendance drops, affecting the passing/failure rate at the end of the year. The scholarship amount needs to be distributed in small amounts monthly throughout the year depending on the effective presence of the pupil in the school during the previous month.
Poor quality20 and irregular teaching would also be contributory factors for high dropout rates as pointed out by households in our surveys21. We, therefore, examined the textbooks and syllabus of standards I through V in both the states. A brief contents analysis of the textbooks by standards is presented for MP in Appendix 3 and for UP in Appendix 4. The quality of textbooks, contents and the way they are presented particularly in English and Mathematics are far from satisfactory in UP. While English is formally introduced from standard I in MP, it is introduced only from standard III in UP and then, very unrealistically it tries to cover ground in standards IV and V. This puts endue pressure on rural students and teachers. The books have to be designed keeping in mind relevance and usefulness to the rural environment of students. In UP they demand a lot of effort both from the teachers and the students, which in itself is a discouraging factor. In MP, on the other hand, the textbooks are more suited to the level and learning abilities of the students. In MP, however, the teaching of general science gets a backseat. Let us now consider certain norms for costing provision of the primary school with all relevant facilities in adequate quantity and quality to ensure better quality of education. These norms are obtained from the government departments in both the states and modified to accommodate quality concerns in consultation with school functionaries at the ground level. Table 18 provides these norms.
20 The caste system also plays a role in the quality of teaching imparted to students. Especially in areas where children belong to castes lower down in the social hierarchy and teachers belong to dominant castes. The social attitudes towards the former are reproduced inside schools. This further de-motivates students from education, and compounds further the problem of non-enrolment, low attendance and dropping out of those enrolled. 21 One World Bank (1997) study estimated that 45% of girls and 41% of boys drop out before reaching Grade V. Our sample shows overall dropout rate of 22% in MP and 40% in UP.
28

Table 18: Cost Norms for Primary Education in Rural Areas – MP and UP, 2005
Item
Per
Uni
t Cos
t (R
s.)
No.
of U
nits
R
equi
red
/ Sch
ool
Remarks / Details
1) School building 350,000 1 3 CR + 10 R + Verandah 2) New classroom 96,000 - Extension if needed. 3) Major repairs 20,000 - Per classroom 4) Minor repairs 10,000 - Per classroom 5) Regular maintenance 15,000 1 Utilities + color + garden
6) Toilets 30,000 1 unit Unit of 1 for boys + 1 for girls
7) Furniture 13,000 - - Tables 500 3 - Chairs 300 6 - Cupboard 2,500 3 - Blackboard (wall) 500 3 - Blackboard (hanging) 200 4
8) Teacher salary (regular) 110,000 2 Regular teachers are on scale
9) Para-teachers 12,000 3 Local and ad hoc. 10) Teaching contingency 500 5 To each teacher
11) Teacher training stipend 1,400 2 For regular teachers @ Rs.70 for 20 days / year
12) Training of Para-teachers 2,100 3 @ Rs.70 for 30 days / year.
13) Helpers (staff) 6,000 1 Cleaning, gardening, cooking and general.
14) Textbooks + stationery 60 - To every student from BPL families.
15) Scholarship 300 - To every student from BPL families.
Source: Our discussions and survey, 2005.
29

Estimating the Gap in Service
It is important to note that efforts to scale up rural primary education services in
all the lagging regions have recently picked up. There has been a substantial increase in the number of classrooms, schools and teachers in the rural areas to raise the enrolment in the primary education. However, the situation on ground is still far from satisfactory. Substantial efforts are needed to scale up the services of primary education in rural areas in the two states. The existing situation as in 2003-04 points to the sharp differences in the two states. In order to estimate the gap or shortfall in the services in the two states, we begin by first estimating the number of children in the age group 6 – 11 years in the rural areas of MP and UP in 2003 -04 and 2006-07. Table 19 presents these estimates derived from the 2001 Census by assuming annual growth of 2 percent.
Table 19: Estimates of Children in Rural Areas of MP and UP Belonging to Age Group 6 – 11 years in million
Children (6 – 11 years) States 2003-04 2006-07 MP (Rural) 7,509,024 7,942,237 UP (Rural) 23,777,654 25,149,442 Basic Source: Census of India, 2001.
There was already a shortfall in the actual enrolment in 2003-04 in both the states, the one in UP being almost 6 times the one in MP. We consolidate and present the existing scenario with the required and desirable levels of services in the sector in Table 20; and the underlying existing and desirable parameter values in Table 21. From the Tables 20 and 21, we can see that MP and UP have very different problems. MP has already built a large number of classrooms and schools and has recruited a number of teachers and para-teachers. Their problem now is to increase utilization and improve the enrolment per teacher and classroom. Some population growth and better incentives would largely solve the problem. We have, therefore, set the target values for parameters keeping in view the geographical spread and low density factor of rural MP. On the other hand, UP is very densely populated and suffers from the problem of inadequacy of classroom and teachers.
30

Table 20: Gap between Required and Existing Level of Services in Primary Education in Rural MP and UP
States / Year Schools Enrolment Teachers Classrooms (CR)
1) 2003-04 (Existing situation) MP (Rural) 62181 6802842 262159 155452 UP (Rural) 100315 19631279 315123 3192672) 2003-04 ( Required numbers with existing parameters) MP (Rural) 68638 7509024 289997 171596 UP (Rural) 120841 23777654 382824 3866913) 2003-04 ( The gap as per existing parameters) (2 – 1) MP (Rural) 6457 706182 27838 16144 UP (Rural) 20526 4146375 67701 674244) 2003-04 ( Required numbers with desirable parameters) MP (Rural) 63538 7942237 265271 158845 UP (Rural) 125741 25149442 629962 3772235) 2006-07 ( The gap as per desirable parameters) (4 – 1) MP (Rural) 1357 113935 3112 3393 UP (Rural) 25426 5518163 314839 57956Source: Tables 11, 19 and 21.
Table 21: Selected Parameters – Existing and Desirable States / Years Enrol. / CR. CR / School Teacher / CR Enrol. / Teacher 1) 2003-04 (Existing values) M.P. (Rural) 43.76 2.5 1.69 26 U.P. (Rural) 61.49 3.2 0.99 62 2) 2003-04 (Desirable values) M.P. (Rural) 50.00 2.5 1.67 30 U.P. (Rural) 66.67 3.0 1.67 40 Source: 1) www.dpepmis.org; 2) Our discussions and survey, 2005. As a result of bad management, there is congestion and overcrowding in classrooms. It is also because the existing number of teachers, including para-teachers is almost half the number required for proper delivery of educational services. It may be noted that we have recommended a reduction in the enrolment per teacher from existing 62 to 40, but propose to increase enrolment per classroom from the current 61.5 to 66.7. This is not inconsistent considering that we propose to increase teacher per classroom from 0.99 to 1.67. In order to ensure better utilization of the infrastructure, we suggest that the primary school having 3 classrooms be run in two shifts – the morning shift with classes 1 to 3 and the afternoon shift for classes 4 and 5 or vice-versa. If the schools have at least 5 teachers, including para-teachers this should be possible. It would reduce the congestion and help improve the quality of education imparted. We now turn to estimating the financial resources required to scale up the services of primary education in rural areas of MP and UP. Given the relatively better position of MP in the number of schools, classrooms and teachers, we have considered only one
31

additional regular teacher per new school in MP, but two additional regular teachers per new school in UP. The rest of the short-fall of teachers in primary schools in the two states (as given in Table 20 row 5) should be met by para-teachers. We also take note of the major repairs, minor repairs and toilets needed in the existing schools in both the states and provide for the same. Similarly, a helper per school is also provided for cooking the midday meals, cleaning, gardening, etc. We present our estimates in Table 22.
Table 22: Additional Expenditure Requirement for Scaling up of Rural Primary Education in MP and UP (Cost Rs. Million)
MP UP Item Unit Cost (Rs.’000) No. of Units Cost No. of Units Cost
1) Classrooms 96 3393 325.7 57956 5563.8 2) New school with toilets + furniture – classrooms
105 1357 142.5 25426 266.7
3) Major repairs 20 12916 258.3 28201 564.0 4) Minor repairs 10 40146 401.5 74470 744.7
5) Toilets* (30)4 124362 (3730.9) 497.4 156441 (4693.2)
625.8 Total capital cost - - 1625.4 - 10168.0 6) Maintenance 15 63538 953.1 125741 1886.1 7) Regular teacher 110 1357 149.3 50852 5593.7 8) Para-teachers 12 1755 21.1 263987 3167.8 9) Teaching costing 0.5 3112 1.6 314839 157.4 10) Training stipend (R) 1.4 1357 1.9 50852 71.2 - Para-teachers 2.1 1755 3.7 263987 554.4 11) Helper 6 63538 381.2 125741 754.4 12) Textbooks + stationery 0.06 113935 6.8 5518163 331.1
13) Scholarship 0.3 45574 13.7 2207265 662.2 Total recurring cost - - 1532.4 - 13178.3 Total cost - - 3157.8 - 23346.3 Per capita capital cost (Rs.) 33 70 Per capita recurring cost (Rs.) 32 91
Per capita total cost (Rs.) 65 161 * Note: Cost of toilets is shared by the Public Health Department. The cost for education department for a twin-toilet unit (M/F) is Rs.4000. Source: (1) Tables 9, 11, 18 and 20 (2) Census of India, 2001.
32

Table 22 shows that the total additional requirement of financial resources is Rs.3 billion in MP and Rs.23 billion in UP to scale up the efforts on the primary education front in the rural areas. This is because the federal government has already stepped up resource allocation to this sector through special programs like DPEP and SSA in the recent past. The introduction of some flexibility in the form of para-teachers, and additional resources for incentives to children, training of teachers and classroom building has reduced the additional requirement of resources in this sector. Moreover, financing of these additional resources is already being taken care of by the award of the 12th Finance Commission (TFC). The TFC has specially recognized primary education and primary health as the sectors requiring greater resource support in the lagging states. This would be in addition to the normal allocation by the Center and the States to these two sectors. It recognizes that, in spite of considerable funds made available to states by the Center through the Plan route, the availability of funds would still be less than the requirements. TFC has observed that the lagging states have frequently failed to utilize the Central grant fully because of the condition that they have to contribute 25 percent of the scheme outlay from their own resources. To overcome this deficiency in fiscal capacity, the TFC has specially augmented grants-in-aid to the lagging states in these two sectors with proper conditionality to ensure right use of those funds. Under the award, both UP and MP are getting additional grants-in-aid as given in Table 23.
Table 23: Total Additional Grants-in-Aid by 2009-10 under the Award of TFC States Primary Education Primary Health
MP (Rs. Billion) 4.5956 1.8164 UP (Rs. Billion) 44.5407 23.1238
Source: Report of TFC (2004), pp.180-181.
Before we move on to our recommendations, let us briefly examine the budget allocations in the two states in 2004-05 on education and culture. Table 24 gives these estimates.
Table 24: Budget Allocation to Education & Culture in MP and UP, and All-India (Centre + States)
States/ Year Revenue
Expenditure (Rs. Million)
Capital Outlay (Rs. Million)
Total Outlay (Rs. Million)
Per Capita Expenditure
(In Rs.) MP (2004-05) 24492.5 220.8 24713.3 386 UP (2004-05) 65442.6 779.7 66222.3 376 All-India (2003-04) 813915.8 11266.4 825182.2 779 Source: i) RBI (Dec. 2004): State Finances – A Study of Budgets of 2004-05. ii) MoF (Aug.2004): Indian Public Finance Statistics, 2003-04.
We can see from Table 24 that on per capita basis, the allocation to education sector is almost the same in MP and UP in 2004-05. The central government’s allocation
33

is marginally more than these two states on per capita basis. Since Rs.779 per capita expenditure represents a combined Center + State budget for the country as a whole, we may expect that with greater allocation of the Center to the lagging states, overall per capita expenditure by the government sector would almost remove any imbalance due to deficiency of fiscal capacity in the lagging states like UP and MP. Whatever would still remain would be removed by the TFC’s award. Thus, scaling up of primary education in rural MP and UP on a per capita basis amounts to increasing the budget allocation by 8 percent in MP and 21 percent in UP. Although financially this is feasible and can be achieved in one year, at least in MP, however, we may spread it over the next 3 to 4 years in both the states considering implementation problems and delays in construction of schools and classrooms. Rural School System and Quality
While there has been a continuous upsurge in the number of schools established at
the primary level, thus increasing physical access to schools, the low quality of education provided in these schools remains a critical issue in India’s educational system. Low quality education implies that even those children who have completed five years of primary schooling may not be functionally literate and numerate. Thus, while an increase in literacy rates is of significance, we cannot overlook the fact that the numbers may be misleading as to what such literacy rates actually means about the presence of effective literacy and numeric skills in the children.
The quality of ‘literates’ of the rural school system is very low. The actual quantity of schooling that children experience and the quality of teaching they receive are extremely insufficient to any mastery of basic literacy and numeric skills. Surprisingly, this seems to be true in the educationally more advanced states as well. In Maharashtra, for instance, community based surveys of twenty eight cities and eight rural districts found that only 30 percent of boys and girls in the age group 6-14 could read basic text fluently or do simple arithmetic (Banerji, 2003). Grover and Singh (2002) too found in their study of two districts of Tamil Nadu that most students lacked functional literacy and numeric skills. Similar results were also reported by the PROBE team (1999) in their surveys of four North Indian states. Leclercq (2002) in his study of two districts of MP found that in most schools visited, few children could read basic texts fluently. Needless to say that we too found similar results during our field investigations in rural MP and UP. The emphasis currently is on rote learning and there was little attempt in teaching activities to impart understanding or comprehension of the text.
Educational deprivation in India has, among others, two crucial dimensions: lack
of schools and the low quality of teaching. The latter is the outcome of a combination of lack of school supplies, lack of teacher testing, very ineffective control and oversight of their functioning and weak links between the school system and the society. In India, there has been a greater emphasis on the provision of more schools (‘quantity’) than on activities that actually take place inside classrooms (‘quality’).
As noted earlier, most schools do not have enough classrooms to accommodate all
children. School structures also lack basic facilities such as running water and toilets.
34

These problems are more acute in some states than in others. A study of Uttar Pradesh found that 54 percent of schools did not have running water and as high as 80 percent of schools did not have latrines (World Bank, 1997). Grover and Singh (2002) in their study of schools in two districts of Tamil Nadu found that of the twenty schools they visited, only two had toilets, of which only one was functional and only two schools had running water on their premises. Lack of access to toilets and running water reduce student attendance as students have to go home to use these facilities. The lack of separate toilets for boys and girls also influence parents’ incentives to send daughters to school.
Educational outcomes depend on the number of teachers and their qualifications, availability of teaching and learning resources in schools such as textbooks and blackboards, and their use made by teachers in actual classroom activities. Educational outcomes also depend on how much teaching actually takes place, which in turn depends on the number of hours (and days) the school is operational, whether teachers are present or absent, and for each student, whether he or she attends school or not and for how long.
Again, as noted above, teacher availability in rural areas continues to be low. Teachers posted to rural and remote areas usually apply for transfers and in general their willingness to be posted in such areas is rather low. This leads to severe imbalances in the distribution of school resources between rural and urban areas and adds to the low teacher-pupil ratios generally observed within the school system. Pupil-teacher ratios are very high, especially in rural areas - around 63 students per teacher for rural India as a whole. The all-India average is around 46 students per teacher. The pupil-teacher ratio for UP (67 per teacher) is almost double that of MP (35 per teacher). Additionally, given the large presence of single and two-teacher schools, there is multi-grade teaching, a fact that detracts from the quality of teaching even further and not captured by pupil-teacher ratios. Moreover, teacher absenteeism is a pervasive phenomenon, especially in rural areas. This effectively reduces the teacher-pupil ratio even further. There is little effective monitoring of teacher attendance. A lot of teaching time is devoted in many schools by teachers to paperwork than in actual teaching.
It is interesting to compare the number of regular teachers employed in the rural
areas of some of the largest Chinese provinces with those employed in rural UP and MP. In 2003, for instance, in the Chinese provinces of Henan, Shandong and Sichuan, the number of regular teachers employed in their primary schools were way above those in UP and MP relative to their rural population of school going children.
The central Chinese province of Henan with a rural population that was around 77 percent of its total population of 92.5 million had a total of 488, 490 full-time primary school teachers. Of this, almost 77 percent or 374,936 were teaching in the rural areas. Similarly, in the coastal Chinese province of Shandong where the rural population was around 66 percent of its total population of 90.7 million, there were 380,066 full-time primary school teachers, of which almost 63 percent or 238,720 were serving in the rural areas. In the Sichuan province in southwestern China, almost 70 percent of their province-wide primary school teachers were located in the rural areas, that is, 221,109
35

teachers. As against these, in 2003, while rural MP had 133,116 regular teachers, rural UP had 228,779 teachers only, lower than those in Shandong, but with almost double the rural population of Shandong.
In addition to the much larger number of teachers in these Chinese provinces, it is also important to say a few words about the functioning of some of the rural Sichuan schools that we visited in the outskirts of Chengdu in 2004. By and large, all the state-run primary schools that we visited22 (unannounced) were functional, had fairly well constructed buildings with numerous class rooms as most Grades from I through V had several sections. We rarely heard of complaints regarding lack of teachers, teaching materials, shortages of drinking water or bathroom facilities that one comes across so often while visiting rural schools in UP or MP. In fact, in some rural schools we were pleasantly surprised to see children in Grades IV and V being taught how to use computers, say word processing using MS Word or data entry using MS Excel, of course in southern Mandarin Chinese. The most serious problem that we came across in rural Sichuan schools was the very poor quality of teaching English language. Of course, we emphasize that the above description of the schools is based on our observations in a small number of schools that we visited and so these characteristics cannot be generalized for all of rural China’s primary schools.
Under the Law on Nine-Year Compulsory Education, primary schools are tuition-free and reasonably located for the convenience of children attending them; students would attend primary schools in their neighborhoods or villages. Parents paid a small fee per term for books and other expenses such as transportation, food, and heating. Under the education reform, students from poor families received stipends, and state enterprises, institutions, and other sectors of society were encouraged to establish their own schools.
The primary-school curriculum consisted of Chinese, mathematics, physical education, music, drawing, and elementary instruction in nature, history, and geography, combined with practical work experiences around the school compound. A foreign language, often English, was introduced in about the third grade. The rural schools generally operated on a flexible schedule geared to the needs of the agricultural seasons. To promote attendance and allow the class schedule and academic year to be completed, agricultural seasons were taken into account.
The low quality of the school system in UP and MP contributes to parental apathy
towards actually sending their children to school even when most parents recognize the importance of education as a means to social and economic mobility for their children and have strong educational aspirations for their children. Teacher apathy comes out very strongly in small surveys conducted by research teams with the aim to adjudge the teaching-learning processes as they are taking place in schools. For instance, the PROBE team (1999) reports that there was no teaching going on in half the sample schools visited by them, a problem further compounded by dismal infrastructure, overcrowded
22 Bajpai and Sachs China visit in summer 2004.
36

classrooms and lack of teaching materials and resources.23 Grover and Singh (2002) found that in nearly 70 percent of the schools visited in two districts of Madurai and Villupuram in Tamil Nadu, no instruction was taking place. Such severe teacher apathy and lack of commitment undermines the efficiency of the education system drastically.
The following areas, in our view, need much greater attention: school infrastructure, functioning, curriculum and instructional resources, stricter control over and improved oversight of teachers’ presence and behavior, improved and rigorous teachers’ training, and improved quality and quantity of mid-day meals.
The school system is also not without ‘corruption’. Misuses of school funds as
well as recruitment of relatives and friends as teachers are not uncommon – there is a market in public employment in India, where positions can be bought by means of social connections and bribes. Even in states that are better off in terms of physical infrastructure and other teaching/learning inputs, weak accountability plagues the system and negatively influences learning outcomes, the ultimate goal of education. Some steps in improving the management of the school system has been taken in some states via administrative decentralization, that is by giving control of local schools to village level bodies such as the gram panchayats and the formation of village education committees. Notable in this regard has been the educational reforms undertaken in MP. Next, we look at some of the initiatives that the MP government has taken in this regard.
Education sector Reforms in Madhya Pradesh Over the 1990s, the education sector in MP witnessed substantial delegation of powers to the local panchayat bodies and Village Education Committees, (VECs) thereby decentralizing the school management to the district and sub-district levels. The panchayats were made responsible for the recruitment and transfer of teachers, construction of school buildings, and procurement of school equipments. Parent Teacher Associations (PTAs) have been set-up with substantive powers in school management. The PTA and VEC have been given powers to decide on issues that impinge on the daily functioning of the school, such as school timings, local holidays, and monitoring the regular functioning of the school. Teachers are accountable to the local PTA and the VEC rather than the district and state-level bureaucracy as was the case in the pre-reform period.
Interestingly, during the 1990s, (the time when decentralization took place in MP) the state has had significant achievements in the area of education. During 1991-2001, MP’s literacy rate rose by 19.4 percent as against the national average of 13.2 percent. Male and female literacy rates during the decade rose by 18.3 percent and 20.9 percent as against the national average of 11.7 and 14.9 percent narrowing the gap between female and male literacy levels. Two key reasons that have been attributed for this success in MP are the above mentioned decentralization process and the Education Guarantee Scheme24
23 These visits were unannounced. 24 Launched in January 1997, EGS is a demand-based and time bound strategy of the MP government to universalize access. Under the scheme, the government guarantees to provide a primary school in a
37

(EGS). EGS has provided a cost effective solution to the delivery of primary education without compromising on quality (Vyasulu, 1999). The underlying reason as to why EGS has been so successful in MP has to do with political decentralization through the Panchayati Raj system. The Seventy Third Constitutional Amendment provided an enabling context for a sharper focus towards human development goals with a changeover to a participatory model. Education and health became part of the main agendas of the elected representatives of the Panchayati Raj Institutions (PRIs) in MP.
However, observers note that while these reforms have increased physical access to schools in MP, quality-wise this new system does not deviate much from the old system and is characterized by the same set of practices that account for malfunctioning of the public educational system (Leclercq, 2002). Moreover, these educational reforms, focusing on ‘alternative schools’ create a second track school system which can lead to increased enrolment in the short run, however, in the long run they could contribute to further social differentiation and social inequality (Drèze and Sen, 2002).
With regard to the PRIs and their ability to perform, the following questions need to be looked into: Has the power and authority that has been devolved to the PRIs on paper actually reached the people? Do they understand their duties/responsibilities on the one hand and their authority on the other? Do the PRIs have the capacity to manage schools? Are there regular and comprehensive capacity building programs in place? And are any measures being undertaken to ensure that the caste and patriarchy do not prejudice effective management at the local level?
As per the statistics provided by the MP government, the state universalized
access to primary schooling in August of 1998 essentially via the EGS25 by adding around 30,540 new primary schools spread all over the state. However, the main challenge for MP is the education of the poor children and improving educational opportunities for the special focus groups, such as girls and the children from the SC and ST communities. Despite the universalization of access, and increase in the provisioning of infrastructure and teachers, the problem of retention, substantial reduction in drop out rates and improved learning levels for all children remains. Be that as it may, decentralizing the school management to the district and sub-district levels in MP has certainly been a change of policy in the right direction. Concluding Remarks
Relative to the health sector, the education sector has not suffered as much for lack of public spending, though there is certainly room to do much more. In part, this is explained by the role played by the federal government in the primary education sector, especially since 1994. With the initiation of schemes, such as DPEP in 1994 and SSA in 2001, the federal government has helped make available fairly large sums of money to habitation where there is no school within a kilometer within a period of 90 days of receiving a demand for a school by the local community. 25 EGS won the Gold Award at the first Commonwealth International Innovations Award in 1998.
38

the state governments. The lack of federal government’s involvement in the health sector relative to the education sector may also be due to the fact that while health (public health and sanitation; hospitals and dispensaries) is in the State list per the Indian Constitution, whereas education is in the Concurrent list26. For details on health sector financing and reform, refer to our companion report on scaling up primary health services in rural India (Bajpai et al., 2005a).
The conditions of primary schooling in rural areas, of course, cannot be studied in isolation. The shortfalls in health, education, and population control among others are all mutually interactive. Illiterate mothers are much more likely than literate mothers to suffer the deaths of young children due to disease, since literate mothers are more effective at care giving and at seeking out medical help in emergencies. High infant mortality rates promote high fertility rates, since households have many children to compensate for the risks of childhood deaths. High fertility rates, in turn, promote a social bias against educating young girls, since parents lack the resources to provide a quality education for all of their children, and therefore invest scarce resources in boys, for whom the market returns to investment are higher and moreover girls are married while they are still very young and therefore investing in their education is not considered worthwhile.
MP needs to focus more on two key aspects: One: to get all the children from the poor families and special focus groups, such as girls and children from the SC and ST communities that are out of school into school, and Two: to strive harder to attain and sustain higher levels of quality in their primary schools. While the former may require measures, such as higher levels of financial incentives for poor parents to send their children to school, improved quality and quantity of the mid-day meals being provided, and wide-ranging awareness programs, the latter may require drastic changes in the learning methods and techniques, making classroom activities more experimental and enjoyable for the children, improved teacher training, and of course upgrading the school infrastructure. By contrast, UP needs to focus more on construction of more schools and hiring more teachers, areas where MP seems to have done substantially better. Of course, UP too needs to attain higher enrollment levels and improve the quality of teaching. By our calculations, the shortfall of schools in rural MP is merely 1,357 and that of teachers is 3,112. As against these numbers, those for UP are significantly higher. In order to scale up rural primary education services in UP, the state requires 314,839 additional teachers and 25,426 additional schools.
Interestingly enough, in rural UP even in villages that are not electrified and have serious shortages of clean drinking water, there are privately-run primary schools. On an average, these private schools charge anywhere between Rs.40 to 50 per child per month as school fees and are seen to be functioning quite well. These private schools are able to run essentially because the public schools are by and large dysfunctional and there is
26 According to the Seventh Schedule, Article 246 of the Indian Constitution, subjects have been divided under three lists. These are: Union List, State List and the Concurrent List. Subjects under the Union list are exclusively under the jurisdiction of the Federal Government and those under the State list are exclusively under the purview of the State Governments. However, the subjects under the Concurrent list are under both the federal and state governments, though historically the federal government has always prevailed over the states when a dispute has arisen over any matter which is under the Concurrent list.
39

effective demand from the parents of relatively better off sections of the village to send their children to school. Such private schools are far less in number in rural MP than in rural UP since the public schools in rural MP are relatively better performing and are far more in number relative to rural MP’s population.
Even though the number of private schools may be rising, however, under no circumstances can they be a substitute for the public schools in rural UP where there were around 24 million children in the 6-11 age group in 2003-04. In a recent study (Singh and Sridhar, 2002) conducted in two regions of Uttar Pradesh, namely Firozabad and Deoria, it was found that though the proportion of students in private schools was consistently rising, the government schools still scored over private ones in the area of gender sensitivity. This differs with an earlier study (Drèze and Gazdar, 1997), which noted that government schools were marked by chronic absenteeism of teachers and low levels of female enrollment and attendance. By contrast, private schools (only recognized) have higher attendance levels and low dropout rates, but are dominated by male students (Singh and Sridhar, 2002). This is not surprising since parents want to invest in educating their sons rather than daughters.
MP has taken large steps forward in the spread of primary education, as is evidenced by increasing enrolment rates for both boys and girls, as well as increasing literacy rates. These achievements have been the result both of greater funds allocated to the education sector and also due to programs and schemes that focus on specific lacunae in the educational infrastructure and the educational system. These programs and schemes seek to align supply side incentives with demand side incentives and generate positive synergy between the two.
Apart from household income/wealth, caste and gender continue to determine access to education. The poor, girls, and members of scheduled castes and tribes still face formidable barriers in acquiring basic education. In recent years, the situation has improved for female schooling, especially in the younger age-groups. However, the discrepancies between rural and urban areas continue to be large and the educational situation of scheduled castes and tribes lags considerably behind the rest of the population. In terms of quality of education provided, the system underperforms critically. In terms of learning outcomes, even the graduates of the primary school system lack basic functional literacy and numeric skills. Weak teacher motivations, their apathy towards teaching and high teacher truancy plague the educational system.
One policy initiative that has been successful is the provision of mid-day meals in
primary schools. It has increased enrolment, attendance and retention, especially of girls. Moreover, to a certain extent, it also helps take care of nutritional needs of students. This not only affects positively the health of poor students but also improves learning outcomes by ending ‘school hunger’.
The state of the quality of education provided and hence the quality of literacy in
the ‘literate’ population is worrisomely low, both in MP and UP. The quantity and quality of education provided should be such that all children of school going age must be in school, remain in school till they complete the school cycle and when they leave school they should have mastered the three R’s firmly.
40

References Aggarwal, Yash (1999), ‘Trends in Access and Retention: A Study of Primary Schools in DPEP Districts,’ Educational Consultants of India Ltd., New Delhi. Bajpai, Nirupam, Jeffrey Sachs and Nicole Volavka. (2005). ‘India’s Challenge to Meet the Millennium Development Goals’, Background paper for the United Nations Millennium Project Task Force on Poverty and Economic Development, UN Millennium Project, New York and Center on Globalization and Sustainable Development, Columbia University, Working Paper No. 24, New York. Bajpai, Nirupam, Ravindra Dholakia and Jeffrey Sachs. (2005a). ‘Scaling up Primary Health Services in Rural India: Case Studies of Uttar Pradesh and Madhya Pradesh’, Mimeo, Center on Globalization and Sustainable Development, Columbia University, New York. Bajpai, Nirupam and Sangeeta Goyal. (2004) ‘Primary Education in India: Quality and Coverage Issues,’ Background paper for the United Nations Millennium Project Task Force on Poverty and Economic Development, UN Millennium Project, New York and Center on Globalization and Sustainable Development, Columbia University, Working Paper No. 11, New York. Bajpai, Nirupam and Jeffrey Sachs (2000), ‘India’s Decade of Development,’ Working Paper 46, Center for International Development, Kennedy School of Government, Harvard University. Banerji, Rukmini (2003), ‘Making the Grade: Teach Children the Joy of Learning.’ Times of India, July 14, New Delhi. Burns, B, A Mingat and R Rakotomalala. (2003), ‘Achieving Primary Education by 2015: A Chance for Every Child’, World Bank, Washington, D.C. Drèze, Jean and Aparajita Goyal, (2003), ‘Future of Mid-Day Meals,’ Economic and Political Weekly, November 1. Drèze, Jean and Amartya Sen (2002), ‘India Development and Participation,’ Oxford University Press, New Delhi. Drèze, Jean and Geetha Gandhi Kingdon (2001), ‘School Participation in Rural India,’ Review of Development Studies 5. Drèze, Jean and H. Gazdar (1997) ‘Uttar Pradesh: The Burden of Inertia’, in Drèze, J. and A. Sen eds. (1997) Indian Development: Selected Regional Perspectives, Clarendon Press, Oxford.
41

Filmer, Deon and Lant Pritchett (2001), ‘Estimating Wealth Effects without Expenditure Data – or Tears: An Application to Educational Enrollments in States of India, Working Paper, The World Bank, Washington D.C. Geetha Rani, P, (2003), ‘Financing Primary Education and Sarva Shiksha Abhiyan,’ National Institute of Educational Planning and Administration, New Delhi. Government of India, (2004), ‘Report of the Twelfth Finance Commission, New Delhi.
Government of India, (Aug.2004) Indian Public Finance Statistics, 2003-04, Ministry of Finance.
Government of Uttar Pradesh, (2004). Annual Plan – 2004/05, State Planning Commission, Volume I, Parts I and II.
Government of Madhya Pradesh. Madhya Pradesh Human Development Report 1998 and 2002. Government of India. Economic Survey, various issues, Ministry of Finance. Government of India. Census of India, 1991 and 2001. Government of India. Selected Educational Statistics 1997-98, Ministry of Education. Grover, Shuchi and Nishu Harpreet Singh (2002), ‘The Quality of Primary Education: A Case Study of Madurai and Villupuram Districts in Tamil Nadu, India,’ Center for International Development, Harvard University. Hirway Indira and Darshini Mahadevia (2005): Gujarat Human Development Report, 2004, Ahmedabad: Mahatma Gandhi Labour Institute, June. Leclercq, Francois. (2003). ‘Education Guarantee Scheme and Primary Schooling in Madhya Pradesh’, Economic and Political Weekly, Special Articles 05-10. Mahal, Ajay; et al. (2001). ‘Decentralization and Public Service Delivery in Health and Education Services: Evidence from Rural India.’ In J.J. Dethier, ed., Governance, Decentralization and Reform in China, India and Russia. Boston: Kluwer Academic Publishers. Mehta, Arun. (2003). ‘Elementary Education in India: Where do we Stand?’, National Institute of Educational Planning and Administration, New Delhi. PROBE Team (1999), Public Report on Basic Education, Oxford University Press, Oxford.
Reserve Bank of India. (Dec. 2004): State Finances – A Study of Budgets of 2004-05
42

Sachs, Jeffrey D. and Nirupam Bajpai. (2001) ‘The Decade of Development: Goal Setting and Policy Challenges in India,’ Working Paper No. 62, Center for International Development, Kennedy School of Government, Harvard University.
Singh, Shailendra and Kala Seetharam Sridhar (2002) ‘Government and Private Schools: Trends in Enrolment and Retention’, Economic and Political Weekly, Vol. 37, No. 41. Sood, Akshay (2003), ‘Critical Issues in Primary Education,’ Economic and Political Weekly, June 21. Tilak, J. B. G. (2004), ‘Public Subsidies in Education in India,’ Economic and Political Weekly, January 24. Vyasulu, Vinod (1999), ‘MP’s EGS: What are the Issues’, Economic and Political Weekly, June 12. World Bank (1997), Development in Practice: Primary Education in India, Allied Publishing, New Delhi. Web sources: http://www.stats.gov.cn/english/statisticaldata/yearlydata/yb2004-e/html/U2128ae.htm http://www.chinatoday.com/city/a.htm
43

APPENDIX 1
Household Questionnaire (For “Scaling up Services in Rural India” project
by the Earth Institute, Columbia University) Village: _____________ Tehsil: _____________ District: __________ State: ____________ Head of HH: __________________(M/F); Investigator: _____________________________ Date: _______
A. 1 Type of HH: MF/SF/OF/AL/RA/Others; 2. Size of HH: _____ 3. Family Income: Rs_____ p.a
4. Caste: SC/ ST/ OBC/ Others; 5. Religion: Hindu/ Muslim/ Others
B. HH Assets: 1. Land in Ha.: ________; 2. Irrigated Land in Ha.: _________; 3. Well: Yes/No; 4. Canal: Govt./ Society/ Private/ Pipe Type of Dwelling: 5. Rooms: One/ Two/ Three/ More( ) 6. Material: Cement/ Wood/ Mud/ Grass/ Steel sheet 7. No. of Animals/ Cattle: ______ Buffalo: ____; Cows: ___; Bullocks: ___; Goats & Sheep: ___; Donkey: ___; Poultry: ____ 8. Vehicles: Car: Yes/ No; Two-wheeler: Yes/ No; Tractor: Yes/ No; Cycle: Yes/ No;
Tempo: Yes/ No; Cart: Yes/ No; Others (________):Yes/ No;

9. Durable Goods: TV: Yes/ No; Radio: Yes/ No; Fridge: Yes/ No; Stove: Gas/ Kerosene/ Earthen
Sewing Machine: Yes/ No; Thrasher: Yes/ No; Pump/ Engine: Yes/ No In Numbers: Cots: ____; Tables: _____; Chairs: ______; Cupboards: ______ C. Information on HH Amenities:
1. Is the HH electrified? Yes/ No. 2. How many points of electricity? _____
3. Electricity available for: _____ hrs./ day. 4. For ____ days/ week. 5. Amount of light bill: Rs.______ p.a.; 6. Source of drinking water: Winter: Tap/ Well/ Public Well/ Public Tap/ Pond/ Canal/ Other ( )Summer: Tap/ Well/ Public Well/ Public Tap/ Pond/ Canal/ Other ( )Monsoon: Tap/ Well/ Public Well/ Public Tap/ Pond/ Canal/ Other ( ) 7. Distance to the source of drinking water: ______ k.m. 8. Do you filter water? Yes/ No 9. Do you boil the water? Yes/ No. 10. Money spent on drinking water: Rs.______
11. Facility for Latrine and Toilet: Exclusive/ Common/ Open space 12. Sewerage: Underground/ Covered path/ Open path/ No system 13. Drainage: Underground/ Covered path/ Open path/ No system
45

14. Road cleaning and waste removing facility: Yes/ No; 15. ______ times per week.
D. Information on HH Members:
Member Sl. No Questions
1 2 3 4 5 6 7 8 1 Name
2 Relation with Head of HH.
3 Sex (M/F) 4 Age (yrs.)
5 Main activity
during year @
6 Subsidiary activity@
7 Level of education.
8 Enrolled in school? (Y/N)
9 Gainfully employed (Y/N)
10 Where?--In Family/Outside
11 For how many days / year?
12 Earnings per month. (Rs.)
13 Hospitalisation last year (Y/N)
14
Any major sickness last year (Name the disease)
15 How many days in the year for the sickness?
16 Is medicine taken? (Y/N)
17 For how many days?
46

18 From where? (Public/ Private)
19 At what cost? (Rs. /p.m.)
@ Farmer – Ag.; Animal Husbandry – AH; Poultry – P; Rural Artisan – RA; Any Service – SS; Agri. Labor – AL; Other Labor – OL ; Household work - HH ; Attending school – ST ; No Activity – nil.
E. Health Related Information: a) Maternal Health: 1. # of deliveries performed in the HH: ______ so far. 2. # of children survived: _______ (out of the above) 3. # of children died during the delivery: _______ 4. # of deliveries attended by Dai : _______ 5. # of deliveries in hospital: _____; Govt. ______; Private: ______ 6. # of deliveries at home not attended by a trained Dai : ______ 7. Did the mother get antenatal checkups? Yes/No; ______ times. 8. Did the mother receive any injection / vaccination? Yes/No
9. Did the mother get any medicines / tablets? Yes/No 10. Did the mother die at the time of delivery? Yes/No; Which delivery?
_______ 11. If yes, the cause. _________________ 12. Was THE delivery attended by a Dai / Nurse/ doctor? Yes/No
47

b) Infants’ Health (<3 months):
1. Do infants get normal breast-feeding? Yes/No
2. If no, is it attended by medical personnel? Yes/No
3. Do infants (< 3 months) suffer from:
4. Infections? Yes/No; If yes, which type? _____
5. Diarrhea? Yes/No
6. Do they receive medial treatment? Yes/No c) Child Health:
1. # of children surviving below 5 years: ______
2. # of children died within one year of birth: ______
3. # of children died before reaching 5 years of age: _____
4. These deaths occurred due to: Diarrhea/ Jaundice/ Malaria/ Respiratory/ Anemia/ Underweight/ Others ( )
5. Did the children receive immunization/ vaccination/ Tika ?:
Yes/No
6. BCG: Yes/No ; DPT1: Yes/No; DPT2: Yes/No; DPT3: Yes/No; Polio: Yes/No; MMR: Yes/No; Measles: Yes/No.
(Note: If more than one child is below 5 years of age, mention separately if any one/more of them did not receive immunization / vaccination.)
7. Do children (< 5 yrs.) suffer from :
o Diarrhea: Yes/No; _____ times/year.
48

o Fever: Yes/No; _____ times/year.
o Malaria: Yes/No; ______ times/year.
o Typhoid: Yes/No
o Ear Infection: Yes/No; ____ times/year.
o Respiratory Disease: Yes/No; _____ times/year.
o Jaundice: Yes/No
8. Do the children (< 5 yrs.) receive medical check-up? Yes/No
9. Do they get medicines? Yes/No
10. From where? Public/Private
d) Medical Facilities:
1. Are you satisfied with existing medical facilities in your village? Yes/No
2. Do you go to the Govt. PHC/ CHC/ Town Referral/ Private Doctor/
Tantrik?
3. When you visit, is the doctor available? Yes/No
If No, what do you do? Buy/ Go to private doctor.
4. What is the distance you travel for medical facility? ______ k.m.
5. On the whole, how do you rate the medical facilities available to you ? By Govt. __________; by Private Sector: ____________ (Excellent – 5; Very good - 4; Good - 3; Fair – 2; Poor – 1; Very poor
– 0)
49
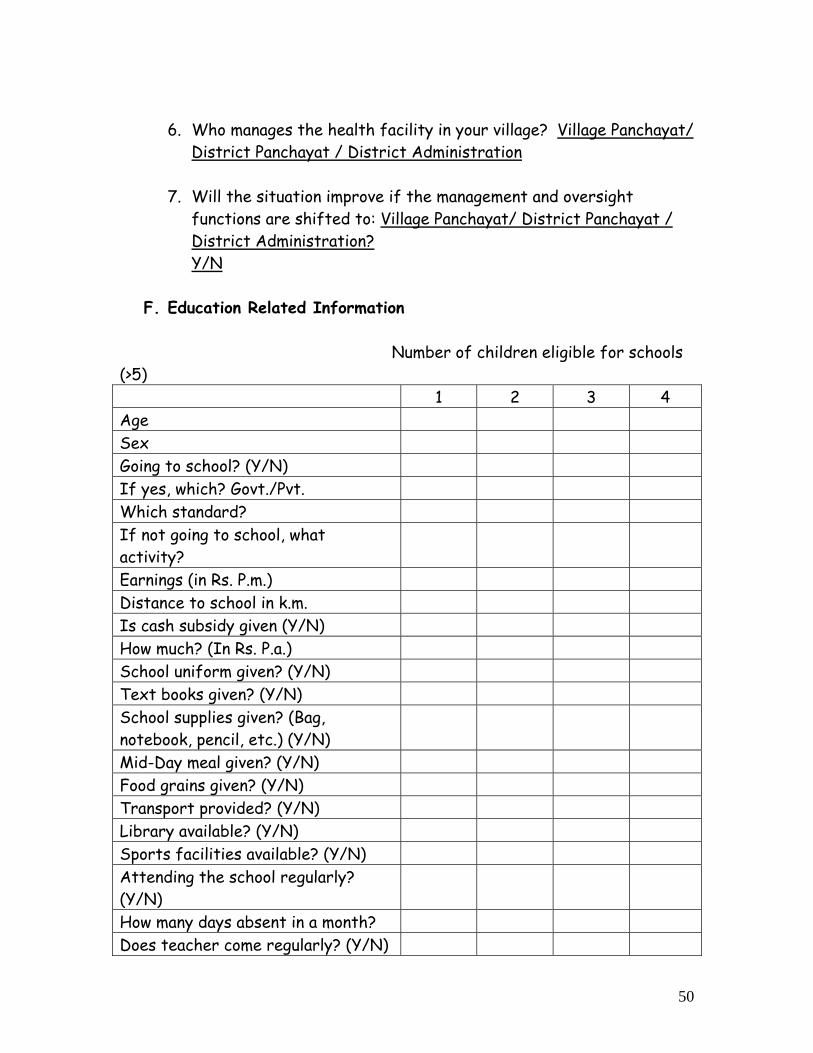
6. Who manages the health facility in your village? Village Panchayat/
District Panchayat / District Administration
7. Will the situation improve if the management and oversight functions are shifted to: Village Panchayat/ District Panchayat / District Administration? Y/N
F. Education Related Information
Number of children eligible for schools (>5) 1 2 3 4 Age Sex Going to school? (Y/N) If yes, which? Govt./Pvt. Which standard? If not going to school, what activity?
Earnings (in Rs. P.m.) Distance to school in k.m. Is cash subsidy given (Y/N) How much? (In Rs. P.a.) School uniform given? (Y/N) Text books given? (Y/N) School supplies given? (Bag, notebook, pencil, etc.) (Y/N)
Mid-Day meal given? (Y/N) Food grains given? (Y/N) Transport provided? (Y/N) Library available? (Y/N) Sports facilities available? (Y/N) Attending the school regularly? (Y/N)
How many days absent in a month? Does teacher come regularly? (Y/N)
50

If not attending school, why? @ Are you satisfied with the school facilities? (Low/Medium/High)
What is the cost of studying in Rs./p.a. Fees Private Tuition School supplies
@ HH activities – HH; Employment – Em; Sickness – Sk; Marriage – Ma; No interest – Ni; Irregularity of teachers – It; Behavior of teacher – Bt; Others – Ot (specify).
1. Who manages the primary school in your village? Village Panchayat/ District Panchayat / District Administration
2. Will the situation improve if the management and oversight
functions are shifted to: Village Panchayat/ District Panchayat / District Administration? Y/N
G. Investigator’s Notes / Observations:
51
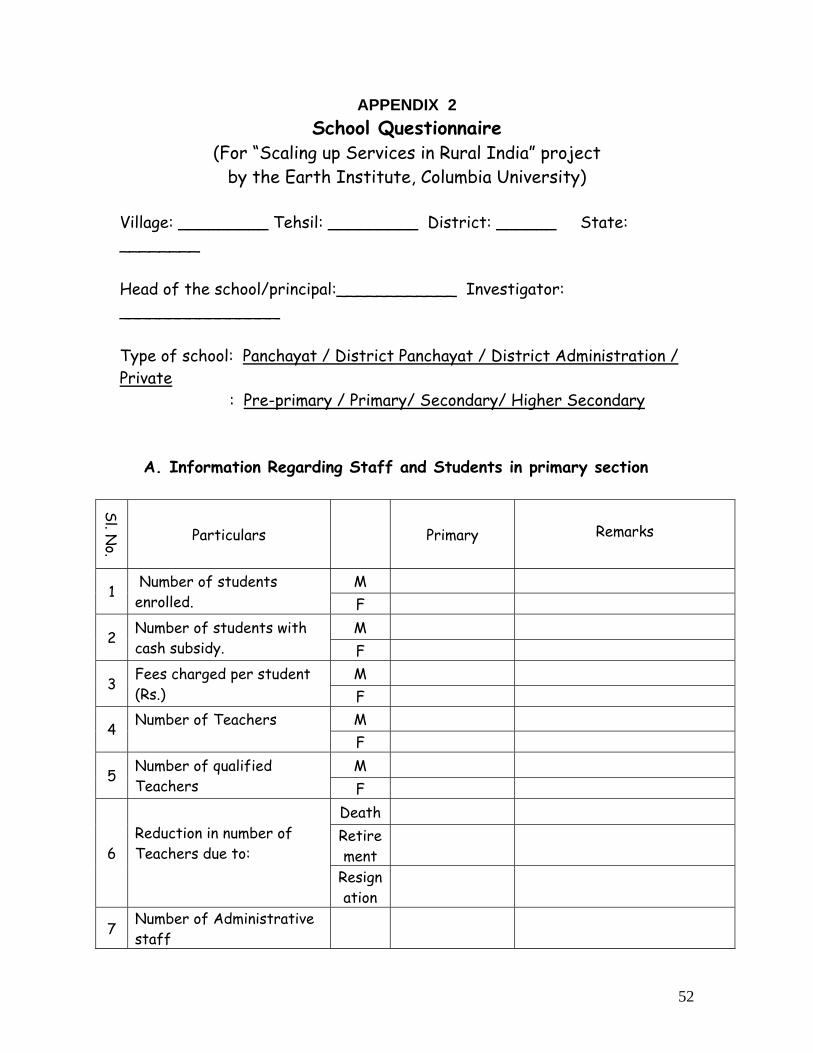
APPENDIX 2 School Questionnaire
(For “Scaling up Services in Rural India” project by the Earth Institute, Columbia University)
Village: _________ Tehsil: _________ District: ______ State: ________ Head of the school/principal:____________ Investigator: ________________ Type of school: Panchayat / District Panchayat / District Administration / Private : Pre-primary / Primary/ Secondary/ Higher Secondary
A. Information Regarding Staff and Students in primary section
Sl. No.
Particulars Primary
Remarks
M 1 Number of students
enrolled. F M
2 Number of students with cash subsidy. F
M 3 Fees charged per student
(Rs.) F M
4 Number of Teachers F
M 5 Number of qualified
Teachers F Death Retirement
6 Reduction in number of Teachers due to: Resign
ation
7 Number of Administrative staff
52

8 Salary bill of teachers per month (Rs.)
9 Salary bill of Administrative staff per month (Rs.)
B. Information Regarding Infrastructure in primary school:
Sl. No Particulars No. of
Units
Capital Cost / Unit (Rs.)
Recurrent and O&M Cost / Unit (Rs.)
1 Classrooms 2 Blackboard 3 Desk/Bench 4 Chairs
Male 5 Toilet Female
6 School Administration 7 School mid-day Meals (Y/N)
8 Transportation Facilities (Y/N)
C. Information about costs incurred for students
Sr No.
Particulars No. of Units
Recurrent and O&M Cost / Unit (Rs.)
Remarks
1 Textbooks 2 Uniform
3 School Supplies (Slate-pen, exercise books, pens, pencils etc.)
4 Examination Related Cost
53

Dropout and Completion Rates:
How many standards are there in the school? :______ Year wise & standard wise enrolment in the school
Standard 2004-05 2003-04 2002-03 2001-
02 2000-
01 1 2 3 4 5
E. Information Regarding Teacher’s presence and working: How many teachers stay in the village? : __________ How many teachers stay outside the village? : __________ What proportion of the year does the school normally function? : 20%/40%/60%/80%/100%. Are there multiple classes being handled by one teacher? Y/N If yes, details: ____________ Is the school managed by the Village Panchayat?: Y/N If yes, are there any problems? Enumerate. Will the situation improve if the management and oversight functions are shifted to District Panchayat / District Administration? Y/N Explain.
54

F. Information to be sought from Teacher’s Training College/
Educational Authority:
Particulars Capital Cost
per unit (Rupees)
Recurrent cost per
unit (Rupees)
Norms
Teacher’s pre-service training
Teacher’s in-service training
Curriculum development
Making a new Classroom
Transport Facility
Toilets
Student-Teacher Ratio
Mid-day Meal
Others
G. Investigator’s Notes / Observations:
55

APPENDIX 3
Content Analysis of Primary School Textbooks in MP Board Schools
Appendix Table 3.1: Number of Textbooks by Classes in MP Standard/Grade No. of books Name of the books Pages including cover page
I 3 Bhasha Bharati Ganit English Reader
114 140 92
II 3 Bhasha Bharati Ganit English Reader
116 137 84
III 4
Bhasa Bharati Ganit English Reader Paryabaran Adhyayan
118 148 124 124
IV 4
Bhasha Bharati Ganit English Reader Paryabaran Adhyayan
164 196 124 124
V 4
Bhasha Bharati Ganit English Reader Paryabaran Adhyayan
126 220 112 172
Source: Education Department, Government of Madhya Pradesh
English
Standard/Grade Content in brief Observations
Standard I
Simple Rhymes, small and capital letters, count and write, draw objects, oral sentences, manners, reading, recognizing animal and birds and their pronunciation, matching the pictures and words
English to Hindi pronunciation and meaning is given. Not difficult for teachers and students in rural areas.
Standard II
Listening, speaking, reading and writing of small words and sentences, paper work in the form of preparing different objects like boat, lion, rocket etc; word formation, numbers and counting in English, count and write
Same as above
Standard III
Conversation in detail, word power, and word formation, sentence formation with grammar, days, months in English, small stories about family, village, awareness about different objects and their utilities
The exercises at the end of the lessons are also explained in Hindi. Written to facilitate learning and teaching.
Standard IV Longer lessons of 50 and 100 words, sentence formation with grammar, surrounding and different places and their
Exercises appear to be lengthy – greater effort needed from students and teachers in rural areas.
56
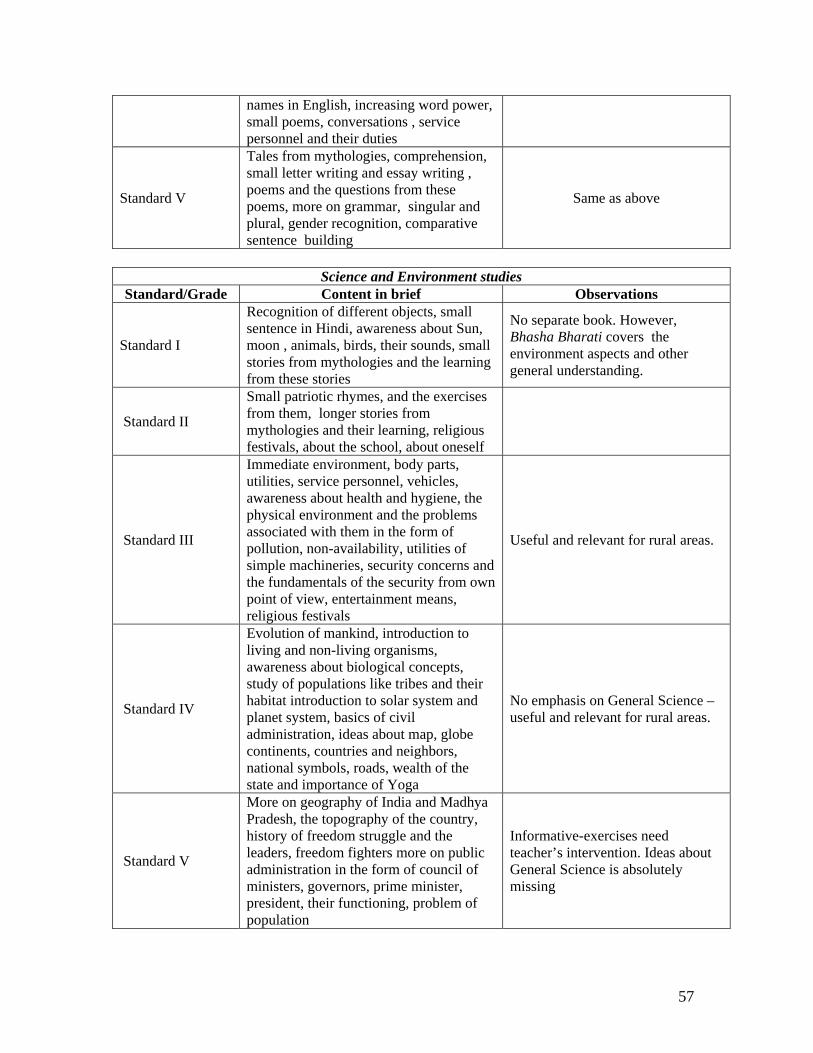
names in English, increasing word power, small poems, conversations , service personnel and their duties
Standard V
Tales from mythologies, comprehension, small letter writing and essay writing , poems and the questions from these poems, more on grammar, singular and plural, gender recognition, comparative sentence building
Same as above
Science and Environment studies
Standard/Grade Content in brief Observations
Standard I
Recognition of different objects, small sentence in Hindi, awareness about Sun, moon , animals, birds, their sounds, small stories from mythologies and the learning from these stories
No separate book. However, Bhasha Bharati covers the environment aspects and other general understanding.
Standard II
Small patriotic rhymes, and the exercises from them, longer stories from mythologies and their learning, religious festivals, about the school, about oneself
Standard III
Immediate environment, body parts, utilities, service personnel, vehicles, awareness about health and hygiene, the physical environment and the problems associated with them in the form of pollution, non-availability, utilities of simple machineries, security concerns and the fundamentals of the security from own point of view, entertainment means, religious festivals
Useful and relevant for rural areas.
Standard IV
Evolution of mankind, introduction to living and non-living organisms, awareness about biological concepts, study of populations like tribes and their habitat introduction to solar system and planet system, basics of civil administration, ideas about map, globe continents, countries and neighbors, national symbols, roads, wealth of the state and importance of Yoga
No emphasis on General Science – useful and relevant for rural areas.
Standard V
More on geography of India and Madhya Pradesh, the topography of the country, history of freedom struggle and the leaders, freedom fighters more on public administration in the form of council of ministers, governors, prime minister, president, their functioning, problem of population
Informative-exercises need teacher’s intervention. Ideas about General Science is absolutely missing
57

Mathematics Standard/Grade Content in brief Observations
Standard I
Numbers, counting through objects, comparison between large and small, tall and short, more and less, matching objects through counting, writing of numbers, reciting the numbers (1-100), simple addition, ascending order, descending order, simple subtraction, shape and size, nearest and farthest
Exercises are simple enough and appear to test the pupil’s awareness and knowledge rather than the memory power – useful and relevant for rural areas.
Standard II
Number system, counting, more on ten, hundred, thousand, writing words for numbers and vice-versa, importance on memorizing the numbers up to 100, addition and subtraction of two digit numbers, simple multiplication of one digit and two digit numbers, introductory menstruation, time, days, months and years, introducing rupees and coins, weight and measures without details of units
Same as above
Standard III
Numbers up to 1000, addition, subtraction, multiplication and division up to three digits, fractions and points, small sums involving the above, calculations of time, calendar, weight and measures with units, simple co-ordinate geometry, mensuration, sums on rupees and coins
Same as above
Standard IV
Numbers up to 10,000 and above, idea about 1,000, 100,000, million etc, sums on addition, subtraction, multiplication and division, writing four digit numbers both in words and numbers, ascending and descending order of four digit numbers, complex additions and subtractions, divisions of three and four digit numbers, small sums on income and expenditure, profit and loss, sums on height and weight, their units, more on mensuration with sums on area calculation etc, more of co-ordinate geometry, and drawing of angles sums on fractions and points.
There is a sudden increase in the level of difficulty and greater effort is required for students and teachers from previous standard.
Standard V
Numbers up to ten million, addition, subtraction, multiplication and division up to eight numbers, writing style of these numbers both in words and letters, complicated sums on these eight digit numbers, fill in the blanks type exercises
Logically follows from standard 4 text books. Exercises are heavy and time consuming – more effort from teachers and students is required. Good understanding of basics and fundamentals needed for the
58

for comprehension, LCM , HCF and the sums, more rigorous sum on income, expenditure, profit and loss, time, calendar, simple interest calculation, percent calculation, preparing bills and introduction of accounts, more on co-ordinate geometry and mensuration involving sums on angles, areas, construction of angles, working of different compass box instruments, clock and anti clockwise movements and their significance and sums on them.
teachers to do justice.
General Observation
• The quality of the book is good both in terms of printing and paper. • The content of the books in most of the subjects are well sequenced. • The texts on English are good and appear to be less burdensome to the students. • The teachers should not find it difficult to teach these subjects as these are well
sequenced. • The mathematics text books for standard 4 and 5 are heavy in content, but several
exercises and examples help clarify concepts. • Surprisingly, there is no introduction of General Science in the syllabus. • It appears there is more emphasis on language and literature in standard 3, 4 and
five as they have separate books for these subjects under the title Bhasha Bharati and Bharati, which cover to a larger extent the language, literature, history and culture in the form of stories.
59

APPENDIX 4
Content Analysis of Primary School Textbooks in UP Board Schools
Appendix Table 4.1: Number of Textbooks by Standards in U.P.
Standard/Grade No. of books Name of the books Pages including cover page
I 1 Bhasa Kiran 90
II 2 Bhasa Kiran Bal Ganit
85 85
III 4
Bhasa Kiran Bal Ganit Elementary English Hamara Paribesh
85 92 68 96
IV 5
Bhasa Kiran Bal Ganit Elementary English Hamara Samaj Gyan Vigyan
130 154 67 114 116
V 5
Bhasa Kiran Bal Ganit Elementary English Hamara Samaj Gyan Vigyan
131 164 67 139 116
Source: Education Department, Government of Uttar Pradesh
English Standard Content in brief Observations
Standard I No English Need to introduce English Standard II No English
Standard III
Alphabet identification, practice, drawing lines, Alphabets and corresponding objects, vowels and consonants, small and capital letters, matching the small with capital letters, rhymes in English, counting in English, the numbers, plural and singular, putting articles like “a” and “an”, This and That, sentence formation, conversation
There is English to Hindi translation of selected words, their pronunciation and also meaning. This may facilitate the students in picking up the word and its meaning. However, looking differently, it may not increase the pupil’s ability to comprehend.
Standard IV
Conversations, Self identifications, fun with numbers, rhymes, manners , big words and their spellings, small lessons, small stories, story telling, introduction to tenses and grammars
Exercises are practice oriented and require high involvement from the teacher’s side.
Standard V Longer lessons, poems, comprehensions, In the very third year, long essays
60

question answers from these poems and lessons more emphasis on grammar and long sentence formation.
and poems would be difficult for rural children as well as teachers. Contents do not match with family environment and background of rural children.
Mathematics Standard Content in brief Observations
Standard 1
Counting, writing, count and write, draw objects as per the numbers, additions, subtractions, mathematical rhymes and puzzles, after numbers, before numbers and missing numbers
Puzzles appear to be complicated for Standard I students in rural areas.
Standard II
Numbers, counting, ten, hundred, thousand etc. ascending order, descending order, greater than less than with symbols, additions, subtractions, multiplications and divisions of three digit numbers, rupees and calculations, time and calculations, income –expenditure, height and weight calculations along with the relevant units, year-month and days calculations
Explained in a story telling format – exercises at the end of each section or topic – requires good understanding and efforts from the teacher.
Standard III
Four digit calculations through games, calculations, multiplicative and additive factors, introduction to mensuration, co-ordinate geometry in the form of dot, line, straight line. More advanced sums.
Requires better understanding of fundamentals in teachers – Difficult conceptualization for average children in rural areas.
Standard IV
Four and five digit numbers, writing in words and numbers, fractions and their addition, subtraction, multiplication, division, more on height, weight measurements, unit and calendar type sums
Heavy sums and exercises at the end of chapters. –Difficult for conceptualization for rural children and teachers. –However, plenty of examples are given prior to the exercises.
Standard V
LCM, HCF, Income-expenditure statement preparations, multiple digit multiplication and subtraction, more on co-ordinate geometry and mensuration, interest and simple interest calculations, profit and loss concepts, power and points
Structured better as compared to Standard IV. The exercises and examples are plenty. – More conceptual than practical.
61

General Science and Environment Studies Standard Content in brief Observations
Standard I
Rhymes on nation, habits in a lyrical format, Identification of different objects around us, comparison in size, identification of vehicles, drawing of simple objects, small stories on daily habits, recognition of seasons
The ideas communicated appear to be good, but difficult for teachers to teach in Grade I
Standard II
Relationships, etiquettes, small rhymes on water, fire, birds, tastes, about villages, towns, personal hygiene, different occupations, national symbols, climate, small stories from mythologies, fairs and festivals
-Nil-
Standard III
Surrounding environment, natural and man-made objects, body parts and their utilities, food habits and nutrition, idea about map, globe; ASIA as a continent, location of India, evolution of human life in a simpler story format, stories from mythologies on friendship, fairs and festivals in a longer version, religion, small scientific experiments, idea about environmental pollutions and its causes, consequences and the ways of controlling these pollution at our level; basics of public administration and different layers of administration from Panchayat to district level.
The exercises at the end appear to be little lengthy – considerable efforts from teachers is required.
Standard IV
Introduction to biology, living organisms their properties; human body parts, its utilities in detail from biology point of view, their working, botanical and zoological terms like chlorophyll, photosynthesis, the cycle of environment change; health and hygiene, introductory physics and chemistry in the form of different objects, their properties, working, matters and their properties; a number of small scientific experiments; soil and its properties, introduction to planetary and solar system, scientific interpretation of work and energy.
Conduct of the experiments is doubtful. Exercises are very exhaustive. Extensive effort from teachers is required.
Standard V
Biology in a greater detail; idea about different type of species, their functions, growth, interdependence between living and non-living organisms, introducing scientists like Charles Darwin, Einstein, Galileo, their contributions in brief and
Gradual increase in the rigor of the content. – Good effort required from teachers to do justice.
62

in story format, more on nutrition, vitamins, disease pattern, ways and means of first aid treatment, properties of air, wave and introductory optics, more on work and energy along with their measuring units, introduction to simple mechanics and its working and the science behind it.
General Observation
• Printing Quality/Paper is poor. Must be difficult to keep for the entire year by small children particularly in rural environment.
• From standard III onwards, small scientific experiments are included. On the face of it though these are simple but how far the school is equipped with the required instruments is doubtful as in most of the schools the basic infrastructure is lacking.
• Course and textbooks on general science and environmental studies need teachers with some science background. A generalist may not be able to do justice. Regular training for a few days in a year may not replace the background.
• As far as English teaching is concerned, the problem is also severe as there may not be trained English teachers handling the classes in standard IV and V. Apart from spelling errors in question papers, there may be serious concerns about the competence of existing teachers to handle the subject in rural areas.
63