working party of the trade committee electronic
TRANSCRIPT
Organisation for Economic Co-operation and Development
TAD/TC/WP(2019)19/FINAL
Unclassified English - Or. English
4 November 2019
TRADE AND AGRICULTURE DIRECTORATE
TRADE COMMITTEE
Working Party of the Trade Committee
Electronic transmissions and international trade – Shedding new light on the
Moratorium Debate
Purpose: This paper examines issues related to electronic transmissions and trade, including the
Moratorium on customs duties on electronic transmissions. It was scoped in
TAD/TC/WP(2019)9/REV1.
Preparation: This paper was prepared by Andrea Andrenelli and Javier López-González of the OECD
Secretariat. It received useful comments from Rachel Bae, Francesca Casalini, Janos Ferencz, Gregoire
Garsous, Emily Gray, Evdokia Moisé, Taku Nemoto, Julia Nielson, Silvia Sorescu and Susan Stone
(TAD), and the OECD Centre for Tax Policy and Administration. This report was declassified by the Working Party of the Trade Committee.
Background: This study is foreseen under the Output Area 3.1.1.1.4 (Digital trade, emerging measures
and new technologies) of the Trade Committee’s 2019-2020 PWB.
Communication and dissemination: It is envisaged to publish this work as part of the OECD Trade Policy
Paper series.
Contacts:
Andrea ANDRENELLI ([email protected])
Javier LOPEZ GONZALEZ ([email protected])
JT03454091
OFDE
This document, as well as any data and map included herein, are without prejudice to the status of or sovereignty over any territory,
to the delimitation of international frontiers and boundaries and to the name of any territory, city or area.
2 TAD/TC/WP(2019)19/FINAL
Unclassified
Table of Contents
Note by the Secretariat .......................................................................................................................... 4
Executive summary ............................................................................................................................... 6
Electronic transmissions and international trade............................................................................... 8
1. Introduction ....................................................................................................................................... 8
2. What issues do electronic transmissions raise? .............................................................................. 8
2.1. What is the Moratorium and what does it apply to? ..................................................................... 9 2.2. What is the current evidence on the economic impact of the Moratorium? ............................... 10
3. Shedding new light on the Moratorium debate ............................................................................ 12
3.1. Putting potential revenue implications into perspective ............................................................. 12 3.2. Deepening the debate on tariffs .................................................................................................. 20 3.3. Thinking about the benefits of electronic transmissions ............................................................. 25
4. Policy considerations ....................................................................................................................... 29
Appendix .............................................................................................................................................. 36
Appendix A. Putting the estimates of the revenue implications into perspective .............................. 36 Appendix B. Welfare analysis of electronic transmissions ................................................................ 40 Appendix C. Empirical specification and data for analysis of business service inputs ..................... 44
Tables
Table 3.1. Summary of empirical literature ........................................................................................... 15 Table 3.2. Impact of reducing tariffs on digitisable goods (2018), 1000 USD ..................................... 27 Table 3.3. Role of digital technologies in determining export propensities .......................................... 28 Table A.1. Illustrative list of hardware and smart goods ....................................................................... 37 Table A.2. Banga (2019) results and relative revenue implications, 2017 or latest available year ...... 38 Table A.3. SMART Simulations – tariff reductions on digitisable goods, USD 1 000 ......................... 42 Table A.4. Estimations of the impact of foreign business service inputs on domestic value added in
exports ........................................................................................................................................... 45 Table A.5. Determinants of exporting propensities, role of webpages ................................................. 46 Table A.6. Determinants of exporting propensities, role of digital delivery ......................................... 47
Figures
Figure 3.1. Potential revenue implications by tariff rate in Banga (2019) ............................................ 13 Figure 3.2. Higher potential revenue losses are in countries which rely least on customs revenue as
a source of overall government revenue. ....................................................................................... 14

TAD/TC/WP(2019)19/FINAL 3
Unclassified
Figure 3.3. Share of imports of digitisable goods over total imports, 2017 (USD trillion) ................... 16 Figure 3.4. Digitisable goods concentrate in few product categories .................................................... 17 Figure 3.5. Sales of books in the US ..................................................................................................... 17 Figure 3.6. Changes in imports of hardware and digitisable goods (2011=100) ................................... 18 Figure 3.7. Trade in hearing aids 1996-2018 (2000=100) ..................................................................... 20 Figure 3.8. The effect of tariffs ............................................................................................................. 21 Figure 3.9. Share of overall revenue from customs and per capita GDP .............................................. 22 Figure 3.10. Share of customs revenue over total government revenue is declining ............................ 23 Figure 3.11. Trade costs and per capita GDP ........................................................................................ 26 Figure 3.12. Impact of digitally deliverable business services on domestic value added in exports
across countries at different levels of development ....................................................................... 28
Boxes
Box 3.1. Duty types and estimates of potential revenue losses ............................................................. 13 Box 3.2. Digitisation can increase goods trade: a case study of hearing aids ....................................... 20 Box 3.3. Using VAT/GST in digital and ecommerce............................................................................ 23 Box 3.4. Australia’s Goods and Services Tax on offshore intangible supplies ..................................... 24

4 TAD/TC/WP(2019)19/FINAL
Unclassified
Note by the Secretariat
This paper forms part of the work mandated under Output Area 3.1.1.1.4 (Digital trade,
emerging measures and new technologies) of the 2019-20 PWB as per the scoping paper
(TAD/TC/WP(2019)9/REV1) approved by the Working Party of the Trade Committee
(WPTC) after its meeting in June 2019. It is part of the digital trade ‘deep dives’ aiming to
provide agile and timely analysis on issues that are relevant to ongoing discussions.
The paper incorporates the comments received by the Working Party of the Trade Committee
in October 2019.
TAD/TC/WP(2019)19/FINAL 5
Unclassified
Key messages
What is the issue?
● Since 1998, WTO Members have extended a Moratorium on imposing customs duties on electronic
transmissions. However, with growing digital trade, discussions on whether or not to extend the
Moratorium have intensified, with some WTO members questioning its implications for government
revenue.
● As a result, new estimates of the revenue implications of the Moratorium have emerged. Owing to
different methods and assumptions, these range between USD 280 million and USD 8.2 billion,
underscoring wide disagreement on measurement.
Shedding new light on the Moratorium debate
● Notwithstanding methodological differences, current estimates suggest that the opportunity cost in
terms of foregeone revenue due to the Moratorium is likely to be low.
‒ At 0.08%-0.23% of overall government revenue, the estimates of potential foregone customs
revenue for developing countries are, in relative terms, low. In addition, the highest potential
impacts would occur in countries that rely least on customs revenue for their overall government
budget.
‒ At 1.2% of total trade, the highest estimated share of digitisable goods is also low. This will likely
remain low even with the advent of technologies such as 3D printing, which are unlikely to have
far-reaching implications on trade in the near term.
‒ Moreover, revenue impacts are likely to have been overestimated by certain studies owing to the
use of bound tariffs, the assumption that all goods that could be digitised would be digitised, and
not taking into account complementarities between electronic transmissions and growing trade in
other physical hardware.
● Tariffs also come with costs. They are associated with lower output and lower productivity and their
burden falls mainly on domestic consumers, not foreign firms. They are also an unstable source of
revenue. Alternatives exist in the form of non-discriminatory value added taxes or goods and services
taxes.
● Beyond differences over costs of lost revenue, there are also considerable benefits to being able to
conduct trade electronically which have often been overlooked in the Moratorium debate.
‒ If all goods that could be digitised were to become digitally transmitted today, consumer welfare
would increase by USD 940 million, outweighing costs associated with revenue loss by
USD 73 million. Additional welfare gains would also arise from reductions in transport costs.
‒ Analysis also shows that the use of foreign business services, which are increasingly digitally
delivered, is associated with growing export competitiveness. Access to such business services is
found to be most important for lower-middle income and lower income countries.
‒ Firm-level evidence also shows that digital technologies such as webpages or digital delivery
enable firms in developing countries, including SMEs, to become exporters, giving rise to new
opportunities to grow.
What does this mean?
● When countries consider whether to extend the Moratorium, it is important to consider not only
foregone revenue related to tariffs, but also to undertake a broader cost/benefit analysis of the
impacts across the economy and alternative revenue sources.
● Overall, the revenue implications of lifting the Moratorium are likely to be relatively small and
would come at the expense of more significant gains in consumer welfare and export
competitiveness.

6 TAD/TC/WP(2019)19/FINAL
Unclassified
Executive summary
The ability to engage in electronic transmissions, via digital networks, is a key feature
of the evolving digital trade environment. However, as more trade becomes digitally
deliverable, some WTO members are voicing concerns about possible foregone government
revenue due to the Moratorium on imposing customs duties on electronic transmissions. This
paper provides an overview of the different issues at stake in this debate.
Although there is no official WTO agreement on what electronic transmissions are, in
a trade context, they are generally understood to refer to digitally delivered trade. However,
the scope of the Moratorium has been interpreted in different ways. Some argue that it applies
to the content of the transmission while others say it applies to the transmission itself (the
‘medium’). Discussions have also focused on what tariffs could be charged on what products
absent the Moratorium.
This has translated into disagreement on how to measure the impact of the Moratorium.
Calculations require making assumptions about what trade flows might be digitisable, what
trade flows might already have been digitised and what trade flows could be digitised in the
future. There is also disagreement on methodological issues, including the use of bound versus
applied tariffs in the analysis. This has led to different estimates of the potential customs
revenue effect of the Moratorium ranging from USD 280 million to USD 8.2 billion, further
polarising the debate.
With no easy answer to what the correct counterfactual to the Moratorium should be,
it is worthwhile taking available estimates and putting them into perspective.
● At 0.08% - 0.23% of overall government revenue (on aggregate for developing
countries), the highest estimated potential foregone revenue is low. These foregone
revenue estimates are also found to be higher in countries with lower reliance on
customs revenue for their overall government budget.
● At 1.2% of total trade, the highest estimated share of digitisable goods as identified
in Banga (2019) is also low. Moreover, a careful assessment of 3D printing
technology suggests that this share is likely to remain relatively low in the coming
years.
Some of the existing studies are likely to overestimate the revenue implications of the
Moratorium. This is because of the use of bound tariffs in the analysis, the assumption that all
goods that could be digitised would be digitised, and not taking into account complementarities
between electronic transmissions and growing trade in related goods. Still, current estimates,
notwithstanding methodological differences, all point in a similar direction. The opportunity
cost of the Moratorium in terms of foregone government revenue is likely to be low.
There are also a number of issues that have not been readily explored in the literature
and which deserve further consideration:
● Tariffs are associated with lower output and lower productivity. The burden of
tariffs also falls mainly on domestic consumers who face higher prices rather than
on foreign firms.
● Tariffs can be an unstable source of revenue and alternatives exist in the form of
non-discriminatory forms of taxation such as value-added or goods and services
taxes.

TAD/TC/WP(2019)19/FINAL 7
Unclassified
Beyond differences over costs of lost revenue, there are also considerable benefits to
being able to conduct trade electronically which have often been overlooked in the Moratorium
debate:
● Being able to digitise goods is tantamount to a reduction in transport costs which
can be as high as 20-30% of overall trade costs. Since such costs tend to be highest
for developing countries, electronic transmissions have the potential to help level
the playing field in this area.
● Any tariff revenue reductions arising from the removal of tariffs on digitisable
goods would be offset by increases in consumer welfare, overall giving rise to net
welfare gains. Indeed, when tariff reductions on trade in digitisable goods are
simulated, consumer welfare increases by USD 940 million, outweighing costs
associated with revenue loss by USD 73 million. Additional welfare gains are also
likely to arise from reductions in transport costs, although these are more difficult
to model.
● The use of foreign business services, which can increasingly be digitally delivered,
is found to increase export competitiveness. Access to such business services is
found to be most important for lower middle income and lower income countries.
● Firm-level evidence confirms that digital technologies such as webpages or digital
delivery allow firms in developing countries, including SMEs, to become
exporters, giving rise to new opportunities to grow. Duties applied by other
countries on electronic transmissions, including content, could affect the ability of
domestic SMEs to export.
When countries consider whether to extend the Moratorium, they should take into
consideration the wider benefits of the Moratorium and not focus solely on the revenue
implications. The results in this analysis suggest that the revenue implications of the
Moratorium are likely to be relatively small and its discontinuation would cause wider
economic losses, including losses to consumer welfare and export competitiveness.

8 TAD/TC/WP(2019)19/FINAL
Unclassified
Electronic transmissions and international trade
1. Introduction
1. The digital transformation has led to considerable changes in the way we engage in
international trade. One important aspect of this evolving environment is the ability to transmit
electronic content via digital networks – often referred to as electronic transmissions. Since 1998,
WTO Members have regularly extended a Moratorium on imposing customs duties on electronic
transmissions (hereafter ‘the Moratorium’),1 most recently in 2017 at the eleventh WTO Ministerial
Conference in Buenos Aires (MC11). However, as digital trade grows and as discussions “to
commence WTO negotiations on trade-related aspects of electronic commerce” progress (WTO,
2019[1]) deliberations on electronic transmissions have been intensifying. Some WTO Members that
are not participating in the Joint Statement Initiative (JSI) have expressed concerns about the revenue
implications of the Moratorium (WTO, 2018[2]; WTO, 2019[3]).
2. Against this backdrop, this paper aims to provide an overview of the different issues at stake
in this debate, with a view to supporting ongoing dialogue at the WTO. This work seeks to step back
and think carefully through the numbers and the issues that countries may want to consider in deciding
how to approach the Moratorium. It is hoped that this approach will provide a useful analytical tool
for countries thinking through the issues, including at the national level.
3. To this end, this paper begins with an overview of what electronic transmissions refer to and
the key issues raised by the Moratorium. It then reviews the empirical literature to assess the different
approaches used to date to capture the economic impact of the Moratorium and their estimates. Section
3 then seeks to contextualise and shed new light on the debate by looking into issues that have often
been left out of discussions: first, by putting current estimates of the revenue implications of the
Moratorium into perspective; second, by looking more closely at who bears the costs of tariffs and at
other possible sources of revenue; and third, by taking account of some of the benefits that arise from
electronic transmissions. Finally, Section 4 summarises the main findings and makes some policy
observations.
2. What issues do electronic transmissions raise?
4. Although there is no WTO definition of “electronic transmissions” referred to in the various
ministerial decisions, in a trade context, they are generally understood to cover cross-border digital
delivery, a key element of the evolving digital trade landscape (López González and Jouanjean,
2017[4]).2
5. Issues around duties on electronic transmissions have been the subject of debate since WTO
discussions on e-commerce began in 1998. One of the most often raised questions relates to the
economic and fiscal implications of the Moratorium on imposing duties on electronic transmissions.
1 With the exception of the Ministerial Conference of Seattle in 1999 and Cancun in 2003.
2 This contrasts with traditional definitions of e-commerce, which are based on the ordering process.
Electronic transmissions refer to the digital element of the delivery, not the ordering.
TAD/TC/WP(2019)19/FINAL 9
Unclassified
For a number of developing countries, tariffs can constitute an important source of fiscal revenue and,
as such, some have voiced concerns about foregone revenue arising from the Moratorium (WTO,
2018[2]; WTO, 2019[3]).
6. The aim of this section is to provide a factual overview of the issues and debates around the
Moratorium, including what the Moratorium is and what the evidence says about its economic
implications.
2.1. What is the Moratorium and what does it apply to?
7. In parallel to the creation of the Work Programme on Electronic Commerce in 1998, WTO
Members declared that they would continue their existing practice of not imposing customs duties on
electronic transmissions. With the exception of the Ministerial Conferences in Seattle in 1999 and
Cancún in 2003, the Moratorium has, thus far, regularly been extended.3 Most recently, at MC11 in
Buenos Aires in 2017, agreement was found on maintaining “the current practice of not imposing
customs duties on electronic transmissions until our next session which we have decided to hold in
2019” (WTO, 2017[5]).
8. Even though the decision did not include a definition of electronic transmissions, WTO
discussions point to the assumption that the Moratorium covers digital delivery. This means that it
would not apply to other forms of digital trade or e-commerce such as physically delivered trade that
has been digitally ordered (Wunsch-Vincent, 2006, p. 21[6]).4 At the same time, the Moratorium states
only that it covers customs duties and, therefore, not domestic and internal taxes.
9. However, there continue to be unresolved questions about the Moratorium and uncertainties
about its coverage. For instance, absent the Moratorium, would duties apply to the transmission itself,
through which content is ‘transported’ (the digital delivery service) or would they apply to the content
of the transmission (Wunsch-Vincent, 2006, p. 39[6])? This issue was recently raised by Indonesia, who
argued that: “the extension of the moratorium applies only to the electronic transmissions and not to
products or contents which are submitted electronically” (WTO, 2017[7]). Another question relates to
whether electronic transmissions should be treated as goods or as services (see discussions in WTO
(2003[8])). Additionally, there has also been some debate about whether electronic transmissions,
including their content, can be considered ‘like’ their physical counterparts.
10. In case electronic transmissions are considered as services these would be governed by GATS.
Imposing duties on services would violate National Treatment obligations where commitments have
been made, since duties are, by definition, discriminatory taxes (WTO, 1998, pp. 9-10[9]). It was also
once suggested that electronic transmissions might be intellectual property (WTO, 1999[10]). If this
were to be the case, Indonesia and Singapore suggest “the question of customs duties would not come
into play. This is because it would be a question of royalties that have to be paid rather than tariffs”
(WTO, 1999, p. 4[10]).
3 The moratorium was not explicitly extended at the Ministerial Conference in Seattle (1999) and so
its status was uncertain for two years until Ministers renewed it at the 2001 Ministerial Conference
in Doha until the next Ministerial in Cancún (Wunsch-Vincent, 2006, p. 41[6]).
4 Panagariya (2000, p. 960[67]) notes that “at the outset […] there is no ambiguity at present regarding
the status of the goods ordered and paid for on Internet but delivered physically in the conventional
manner. Except for the order and payment themselves, these transactions are treated as goods trade
and the GATT discipline applies to them. The ambiguity arises only when the goods are delivered
on the Internet”.

10 TAD/TC/WP(2019)19/FINAL
Unclassified
11. Against this backdrop, some WTO Members, including India and South Africa, have
intensified their questioning of the revenue implications of the Moratorium (WTO, 2018[2]; WTO,
2019[3]) and Indonesia has signalled that they may begin to impose custom duties on the content of
electronic transmissions. In March 2018, Indonesia introduced a specific tariff line for electronically
transmitted content, laying the ground for enacting tariffs on electronically transmitted movies,
e-books, and software (Cory, 2019[11]; Buditomo, 2019[12]; Buditomo, 2018[13]).
12. In parallel, certain WTO Members are advocating that the Moratorium be made permanent.
For instance, under the Joint Statement Initiative on E-commerce, the EU has proposed that: “Members
shall not impose customs duties on electronic transmissions, which include the transmitted content”
(WTO, 2019[14]). The US and others also propose similar language (WTO, 2019[15]; WTO, 2019[16];
WTO, 2019[17]; WTO, 2019[18]).5
13. In addition, 56 WTO Members have signed at least one Regional Trade Agreement (RTA)
including a provision prohibiting the application of customs duties on electronic transmissions. The
majority (34) of these are RTAs between developed and developing countries; 19 RTAs are among
developing countries, and three RTAs are among developed countries only. Many of these provisions
bind signatories on a permanent basis (WTO, 2016[19]).
2.2. What is the current evidence on the economic impact of the Moratorium?
14. Many studies have sought to identify the economic impact of the Moratorium, however most
focus exclusively on its potential revenue implications. This is to the detriment of a more holistic
approach which would also take account of the benefits associated with trade cost reductions and
potential productivity gains.
15. An early attempt by Schuknecht and Pérez-Esteve (1999[20]) used a list of goods derived from
the Standard Industrial Trade Classification and the Harmonised System classification that included
cinematographic film, newspapers and videogames to provide upper bound estimates of possible tariff
revenue losses. Assuming that these goods would be fully digitised, and therefore that the extent of
foregone revenue would be equal to the loss of tariff revenue from these physical goods in 1996,
Schuknecht and Pérez-Esteve (1999[20]) reported modest revenue effects, amounting to less than 1%
of total tariff revenue across most countries. The paper also highlighted the strong potential of
electronic transmissions to enhance services trade, underscoring that modest tariff revenue losses
would need to be weighed against gains arising from growing trade in services (a point also made in
Mattoo and Schuknecht (2000[21]) and Mattoo, Pérez-Esteve and Schuknecht (2001[22])).
16. Using weighted average applied MFN tariffs in 1997, and assuming that a range of goods
would be fully digitised, Teltscher (2000[23]) argued that developing countries would incur 63% of the
total tariff revenue losses arising from the Moratorium. This is because, even if developing countries
have lower import volumes, they tend to apply higher tariffs on goods that are digitisable than
developed countries. That said, losses for developing countries would range between 0% and 6% of
customs revenue depending on the country, implying relatively modest overall losses in government
revenue, ranging between 0% and 0.07% of total revenues.
5 Some private sector organisations have also expressed their concerns and voiced their support to
the renewal of the Moratorium, including on a permanent basis (International Chamber of
Commerce, 2019[71]) (BSA, 2019[72]).
TAD/TC/WP(2019)19/FINAL 11
Unclassified
17. More recently, and at the request of WTO Members, WTO (2016[19]) re-examined and updated
analysis of tariff revenue losses arising from the Moratorium. Using a list of 30 HS 6 digit goods and
their applied tariff rates, WTO (2016[19]) estimated that the revenue collected from “digitisable goods”
had fallen from USD 1.2 billion in 2000 to USD 823 million in 2014 – a loss nearing
USD 400 million.6 This would amount to 0.26% of total estimated customs revenue in 2014, with only
four developing countries collecting more than 1.5% of total customs revenues from such tariffs.
18. Using an updated list of 38 goods that could be digitised (identified from the HS goods
classification) and the World Integrated Trade Solutions (WITS) partial equilibrium simulation model
(SMART), Banga (2017[24]) re-calculated the revenue implications of the Moratorium. The overall loss
of revenue, under the assumption that all digitisable goods would no longer be subject to tariffs, was
estimated to be around USD 280 million in 2015.
19. Banga (2019[25]) used an updated list of 49 goods, also using the HS classification, to estimate
the revenue impact of the Moratorium, focusing not only on the potential revenue loss arising from
these trade flows being fully digitised, but also on the revenue not collected on trade flows that might
have already been digitised such as e-books. To identify these, Banga (2019) created a counterfactual
projection of the value of trade that might have already been digitised by taking the growth rates of
trade in these goods between 1998-2010 and extrapolating these for the period 2011-2017.7 Using
average bound tariffs, Banga (2019[25]) argues that potential aggregate tariff revenue losses could
amount to USD 8 billion for developing countries and USD 212 million for developed economies in
2017. As expected, when using effectively applied duties, the foregone revenue is much reduced –
USD 2.7 billion for developing countries and USD 123 million for developed countries.
20. In a different vein and using a computable general equilibrium (CGE) model, Lee-Makiyama
and Narayanan (2019[26]) investigate the possible impact of applying tariffs on electronic
transmissions, moving beyond customs revenue considerations. Lee-Makiyama and Narayanan
(2019[26]) estimate that levying tariffs on digitally deliverable services could bring about GDP losses
ranging between USD 6.5 billion and USD 10.5 billion for developing countries.8 The paper argues
that, for countries such as India, the GDP losses would outweigh the revenue gains by a factor of 49.
21. Overall, estimates of the revenue implications of the Moratorium vary widely (see Table 3.1
for a summary), ranging from USD 280 million to USD 8.2 billion, depending on the trade flows
covered and tariffs applied (i.e., whether effectively applied, MFN or bound rates), as well as other
underlying assumptions.9 The variance in the results reflects the fact that providing precise estimates
of the impact of the Moratorium is difficult, requiring consideration of issues such as ‘likeness’ (for
instance, how similar an electronic transmission’s content is to its physical counterpart) and how
consumers might respond to changes in prices. It also entails making assumptions about how much
6 WTO (2016[19]) defines “digitisable goods” as “physical goods which have the potential to be
digitised and subsequently sent across borders digitally”.
7 Foregone revenue on customs duties not currently imposed on electronic transmissions is
calculated using the annual average rate of growth of trade in “digitisable goods” during the period
1998-2010 to proxy for trade in electronic transmissions for the period 2011-2017.
8 However, these numbers are likely to be driven by the assumption in footnote 19 that “imports do
not substitute domestic production”. This means that countries would pay higher prices for their
imports and would not be able to substitute these with domestic production giving rise to larger
impacts on GDP.
9 This includes the value of trade that might or might not be affected, the counterfactual scenario, or
whether or not it is assumed to be possible to impose duties on trade in services.
12 TAD/TC/WP(2019)19/FINAL
Unclassified
trade has already been digitised and how much will be digitised in the future. This explains why it has
been difficult to reach consensus figures on what might be at stake.
3. Shedding new light on the Moratorium debate
22. Understanding the full economic implications of the Moratorium requires putting the existing
empirical evidence into a wider context and broadening the debate. To this end, this section provides
a checklist of some of the factors to be considered, drawing on new and up-to-date data where possible
and, where not, using existing literature to identify likely impacts.
23. The first part of the section puts the current estimates of the revenue implications of the
Moratorium into perspective, looking at the share of revenue represented by the lost tariff revenue and
the share of trade likely to be affected. The section then discusses other issues that need to be
considered when thinking about the impact of the moratorium in terms of tariff revenue, including,
who bears the burden of tariffs and whether tariffs are an appropriate and/or efficient tool for raising
revenue or whether alternative taxation methods might be better suited for the digital economy.10
Finally, the section attempts to address a critical gap in the literature by providing an overview of some
of the broader economic benefits associated with electronic transmissions, including in terms of
welfare and productivity gains.
3.1. Putting potential revenue implications into perspective
24. Differences in estimates of the revenue implications of the Moratorium arise from different
choices in counterfactual scenarios or parameters. At one end of the spectrum, WTO (2016[19])
identifies revenue losses using applied tariffs for a set of 30 “digitisable goods”. At the other end,
Banga (2019[25]) uses an expanded list of 49 goods to construct a counterfactual scenario proxying for
trade that might have already been digitised, using their bound tariff to calculate potential revenue loss.
25. As is often the case with assumptions and counterfactual scenarios, there is no right answer.
Lists of digitisable goods can, and most likely will, be disputed. The same applies to estimates of the
amount of trade that has already been digitised or the type of tariff that should be used to calculate
revenue implications (although there appears to be a strong case, in the absence of precise revenue
data from customs, to favour estimations that use applied rather than bound tariffs – see Box 3.1).
26. Given disagreements in current estimates, there is value in taking a step back and putting the
different empirical estimates into perspective.
10 The feasibility of imposing customs duties on electronic transmissions was raised in a recent India
and South African Communication (WTO, 2019[3]). However, less researched areas such as the costs
involved might also be important in this context.
TAD/TC/WP(2019)19/FINAL 13
Unclassified
Box 3.1. Duty types and estimates of potential revenue losses
The use of bound tariffs to calculate potential foregone revenue from the Moratorium can pose
conceptual challenges. This is because it implicitly presumes that:
Countries would revert to bound tariffs where they have already agreed to preferential tariffs. It
also disregards the fact that some countries have already agreed, in their bilateral agreements, not
to charge customs duties on electronic transmissions (WTO, 2016[19]).
Governments would change their current tariff policy stance favouring revenue collection over
other objectives. Applied tariffs reflect a range of trade-offs which include, among others, consumer
welfare, export competitiveness and tariff revenue. Using bound tariffs in the analysis assumes
changes in current objectives in favour of higher tariffs than those currently applied. This change
in objectives would require further justification.
Changes in tariffs do not necessarily lead to changes in prices. That is, even if tariffs increase from
12% to 80%, as would be the case if Nigeria were to move to its bound rate for the goods covered
in Banga (2019), the value of trade that Nigeria would import under current analyses would remain
the same. A more realistic analysis would reflect that trade would likely go down as a result of the
change in price which would yield a smaller revenue effect than when calculated by simply
multiplying the tariff times the value of trade.
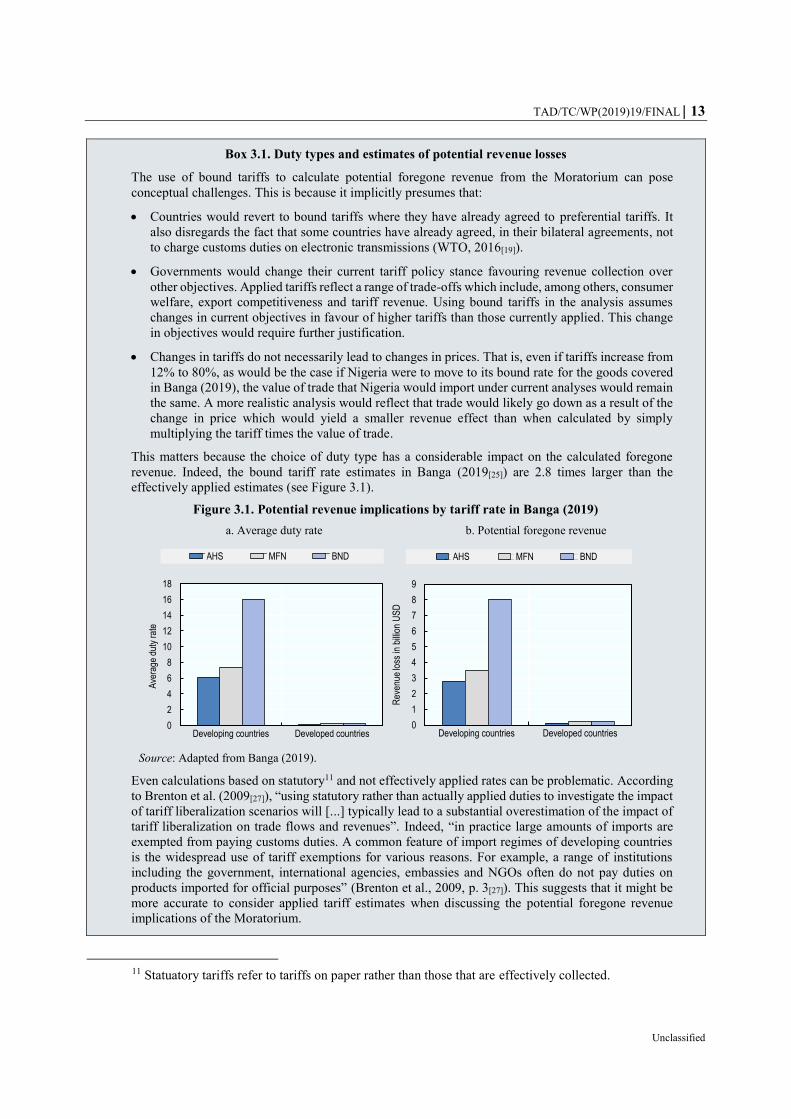
This matters because the choice of duty type has a considerable impact on the calculated foregone
revenue. Indeed, the bound tariff rate estimates in Banga (2019[25]) are 2.8 times larger than the
effectively applied estimates (see Figure 3.1).
Figure 3.1. Potential revenue implications by tariff rate in Banga (2019)
a. Average duty rate b. Potential foregone revenue
Source: Adapted from Banga (2019).
Even calculations based on statutory11 and not effectively applied rates can be problematic. According
to Brenton et al. (2009[27]), “using statutory rather than actually applied duties to investigate the impact
of tariff liberalization scenarios will [...] typically lead to a substantial overestimation of the impact of
tariff liberalization on trade flows and revenues”. Indeed, “in practice large amounts of imports are
exempted from paying customs duties. A common feature of import regimes of developing countries
is the widespread use of tariff exemptions for various reasons. For example, a range of institutions
including the government, international agencies, embassies and NGOs often do not pay duties on
products imported for official purposes” (Brenton et al., 2009, p. 3[27]). This suggests that it might be
more accurate to consider applied tariff estimates when discussing the potential foregone revenue
implications of the Moratorium.
11 Statuatory tariffs refer to tariffs on paper rather than those that are effectively collected.
0
2
4
6
8
10
12
14
16
18
Developing countries Developed countries
Ave
rage
dut
y ra
te
AHS MFN BND
0
1
2
3
4
5
6
7
8
9
Developing countries Developed countries
Rev
enue
loss
in b
illio
n U
SD
AHS MFN BND
14 TAD/TC/WP(2019)19/FINAL
Unclassified
3.1.1. Estimated foregone revenue as a share of overall revenue is small and concentrated
27. Existing estimates of potential foregone customs revenue vary widely – from USD 280 million to
USD 8.2 billion depending on the study (see Table 3.1). However, even when taking the highest estimates,
potential foregone revenue as a share of total revenue is relatively small, amounting to an average
0.08%-0.23% reduction in government revenue for developing countries (see Table A.2 for calculations
and disaggregated results). While potential revenue impacts tend to be higher for developing countries than
for developed countries (not unexpected, given that developing countries tend to levy higher tariffs on such
goods than developed countries), the potential for welfare gains from tariff liberalisation are higher for
developing countries than for developed countries.
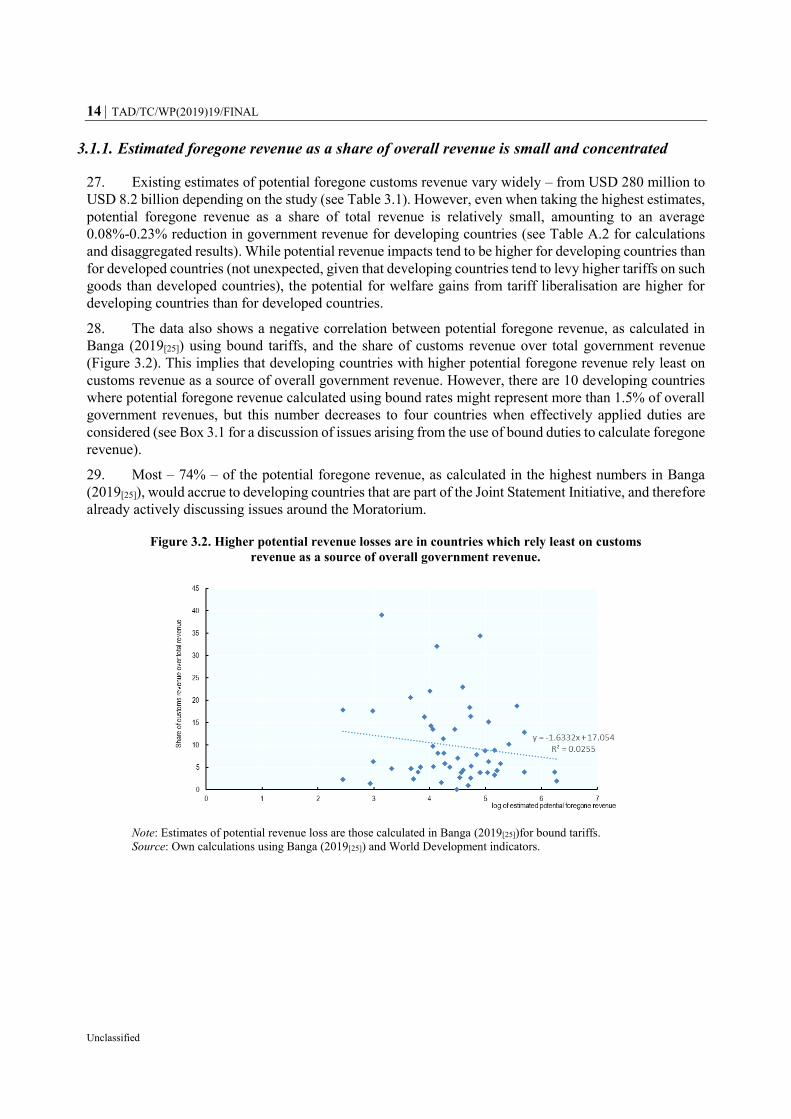
28. The data also shows a negative correlation between potential foregone revenue, as calculated in
Banga (2019[25]) using bound tariffs, and the share of customs revenue over total government revenue
(Figure 3.2). This implies that developing countries with higher potential foregone revenue rely least on
customs revenue as a source of overall government revenue. However, there are 10 developing countries
where potential foregone revenue calculated using bound rates might represent more than 1.5% of overall
government revenues, but this number decreases to four countries when effectively applied duties are
considered (see Box 3.1 for a discussion of issues arising from the use of bound duties to calculate foregone
revenue).
29. Most – 74% – of the potential foregone revenue, as calculated in the highest numbers in Banga
(2019[25]), would accrue to developing countries that are part of the Joint Statement Initiative, and therefore
already actively discussing issues around the Moratorium.
Figure 3.2. Higher potential revenue losses are in countries which rely least on customs
revenue as a source of overall government revenue.
Note: Estimates of potential revenue loss are those calculated in Banga (2019[25])for bound tariffs.
Source: Own calculations using Banga (2019[25]) and World Development indicators.
TAD/TC/WP(2019)19/FINAL 15
Unclassified
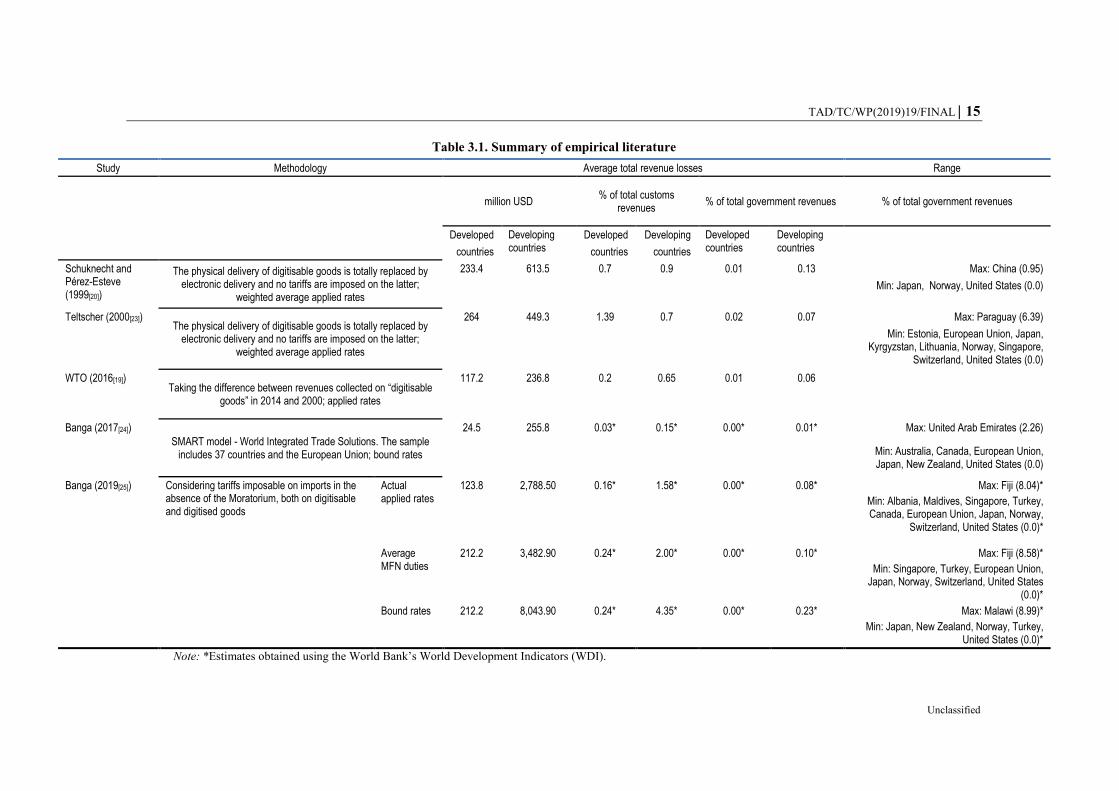
Table 3.1. Summary of empirical literature
Study Methodology Average total revenue losses Range
million USD % of total customs
revenues % of total government revenues % of total government revenues
Developed Developing countries
Developed Developing Developed countries
Developing countries
countries countries countries
Schuknecht and Pérez-Esteve (1999[20])
The physical delivery of digitisable goods is totally replaced by electronic delivery and no tariffs are imposed on the latter;
weighted average applied rates
233.4 613.5 0.7 0.9 0.01 0.13 Max: China (0.95)
Min: Japan, Norway, United States (0.0)
Teltscher (2000[23]) The physical delivery of digitisable goods is totally replaced by
electronic delivery and no tariffs are imposed on the latter; weighted average applied rates
264 449.3 1.39 0.7 0.02 0.07 Max: Paraguay (6.39)
Min: Estonia, European Union, Japan, Kyrgyzstan, Lithuania, Norway, Singapore,
Switzerland, United States (0.0)
WTO (2016[19]) Taking the difference between revenues collected on “digitisable
goods” in 2014 and 2000; applied rates
117.2 236.8 0.2 0.65 0.01 0.06
Banga (2017[24])
SMART model - World Integrated Trade Solutions. The sample includes 37 countries and the European Union; bound rates
24.5 255.8 0.03* 0.15* 0.00* 0.01* Max: United Arab Emirates (2.26)
Min: Australia, Canada, European Union, Japan, New Zealand, United States (0.0)
Banga (2019[25]) Considering tariffs imposable on imports in the absence of the Moratorium, both on digitisable and digitised goods
Actual applied rates
123.8 2,788.50 0.16* 1.58* 0.00* 0.08* Max: Fiji (8.04)*
Min: Albania, Maldives, Singapore, Turkey, Canada, European Union, Japan, Norway,
Switzerland, United States (0.0)*
Average MFN duties
212.2 3,482.90 0.24* 2.00* 0.00* 0.10* Max: Fiji (8.58)*
Min: Singapore, Turkey, European Union, Japan, Norway, Switzerland, United States
(0.0)*
Bound rates 212.2 8,043.90 0.24* 4.35* 0.00* 0.23* Max: Malawi (8.99)*
Min: Japan, New Zealand, Norway, Turkey, United States (0.0)*
Note: *Estimates obtained using the World Bank’s World Development Indicators (WDI).
16 TAD/TC/WP(2019)19/FINAL
Unclassified
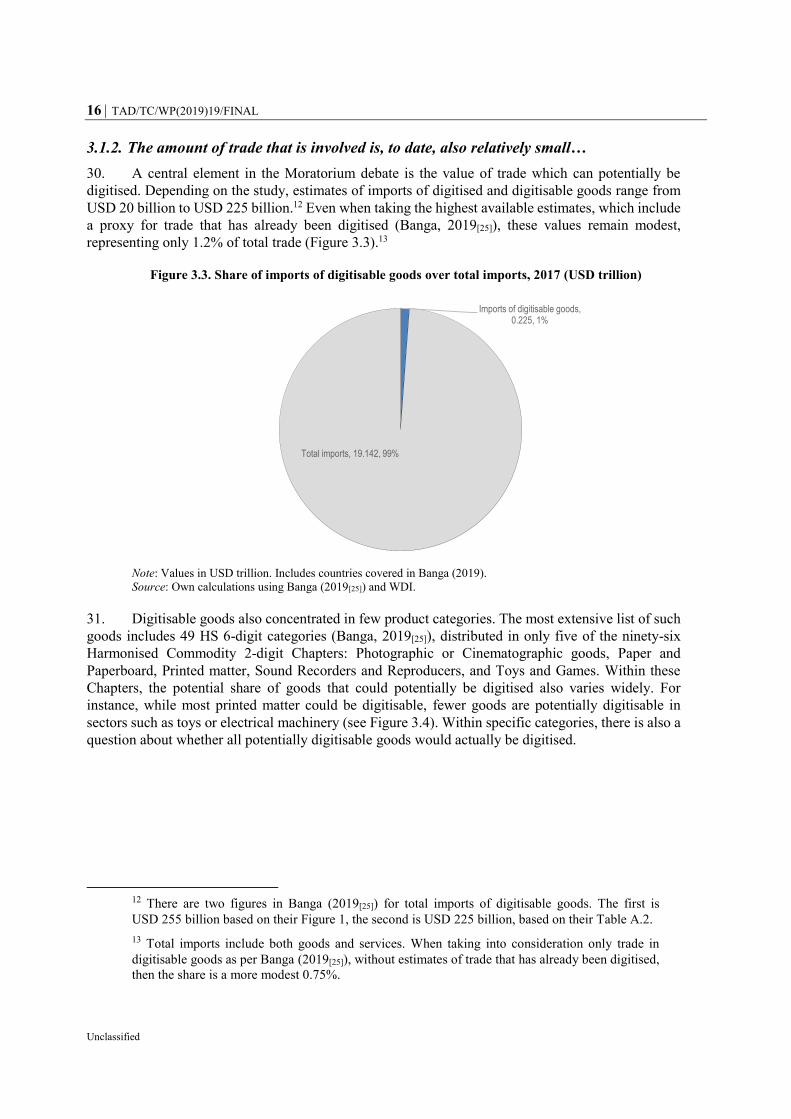
3.1.2. The amount of trade that is involved is, to date, also relatively small…
30. A central element in the Moratorium debate is the value of trade which can potentially be
digitised. Depending on the study, estimates of imports of digitised and digitisable goods range from
USD 20 billion to USD 225 billion.12 Even when taking the highest available estimates, which include
a proxy for trade that has already been digitised (Banga, 2019[25]), these values remain modest,
representing only 1.2% of total trade (Figure 3.3).13
Figure 3.3. Share of imports of digitisable goods over total imports, 2017 (USD trillion)
Note: Values in USD trillion. Includes countries covered in Banga (2019).
Source: Own calculations using Banga (2019[25]) and WDI.
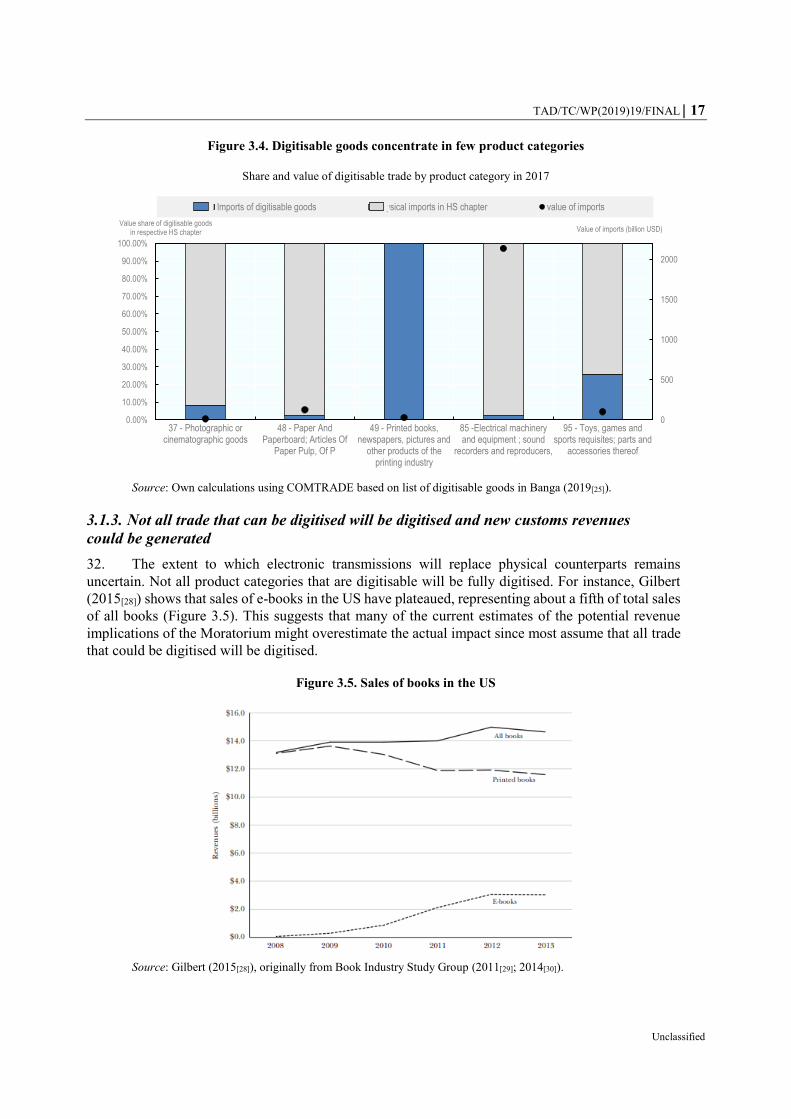
31. Digitisable goods also concentrated in few product categories. The most extensive list of such
goods includes 49 HS 6-digit categories (Banga, 2019[25]), distributed in only five of the ninety-six
Harmonised Commodity 2-digit Chapters: Photographic or Cinematographic goods, Paper and
Paperboard, Printed matter, Sound Recorders and Reproducers, and Toys and Games. Within these
Chapters, the potential share of goods that could potentially be digitised also varies widely. For
instance, while most printed matter could be digitisable, fewer goods are potentially digitisable in
sectors such as toys or electrical machinery (see Figure 3.4). Within specific categories, there is also a
question about whether all potentially digitisable goods would actually be digitised.
12 There are two figures in Banga (2019[25]) for total imports of digitisable goods. The first is
USD 255 billion based on their Figure 1, the second is USD 225 billion, based on their Table A.2.
13 Total imports include both goods and services. When taking into consideration only trade in
digitisable goods as per Banga (2019[25]), without estimates of trade that has already been digitised,
then the share is a more modest 0.75%.
Imports of digitisable goods, 0.225, 1%
Total imports, 19.142, 99%
TAD/TC/WP(2019)19/FINAL 17
Unclassified
Figure 3.4. Digitisable goods concentrate in few product categories
Share and value of digitisable trade by product category in 2017
Source: Own calculations using COMTRADE based on list of digitisable goods in Banga (2019[25]).
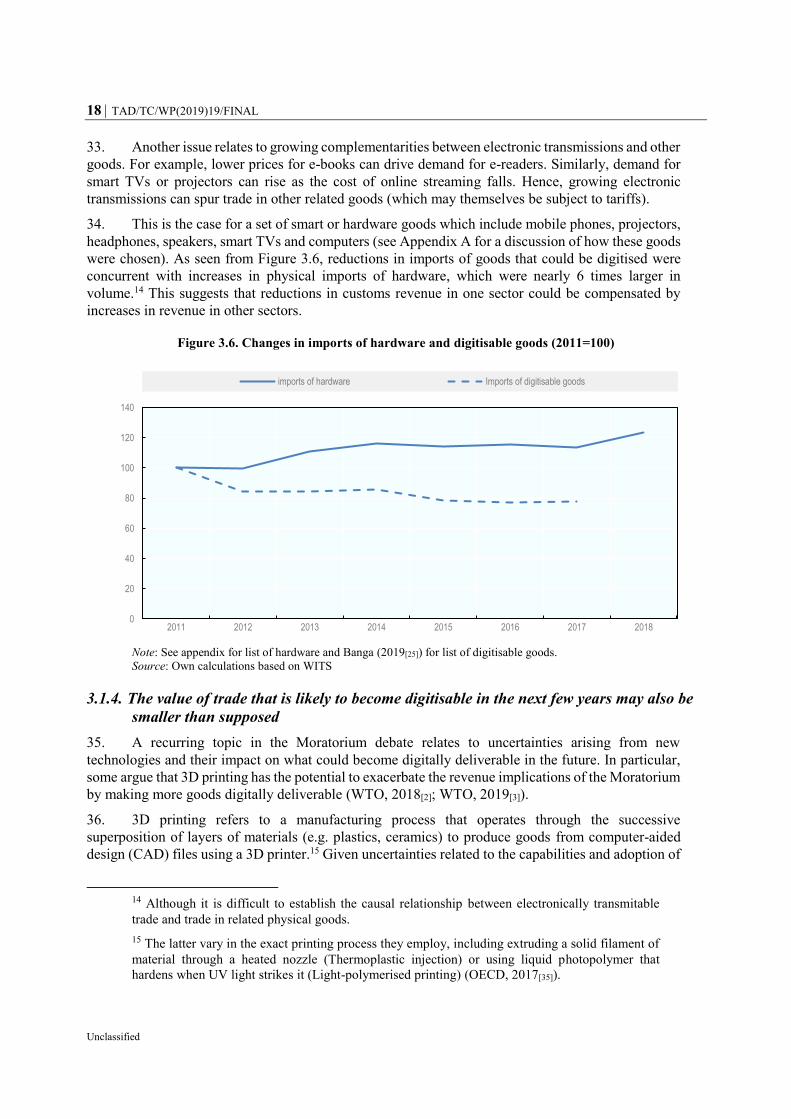
3.1.3. Not all trade that can be digitised will be digitised and new customs revenues
could be generated
32. The extent to which electronic transmissions will replace physical counterparts remains
uncertain. Not all product categories that are digitisable will be fully digitised. For instance, Gilbert
(2015[28]) shows that sales of e-books in the US have plateaued, representing about a fifth of total sales
of all books (Figure 3.5). This suggests that many of the current estimates of the potential revenue
implications of the Moratorium might overestimate the actual impact since most assume that all trade
that could be digitised will be digitised.
Figure 3.5. Sales of books in the US
Source: Gilbert (2015[28]), originally from Book Industry Study Group (2011[29]; 2014[30]).
0
500
1000
1500
2000
0.00%
10.00%
20.00%
30.00%
40.00%
50.00%
60.00%
70.00%
80.00%
90.00%
100.00%
37 - Photographic orcinematographic goods
48 - Paper AndPaperboard; Articles Of
Paper Pulp, Of P
49 - Printed books,newspapers, pictures and
other products of theprinting industry
85 -Electrical machineryand equipment ; sound
recorders and reproducers,
95 - Toys, games andsports requisites; parts and
accessories thereof
Value of imports (billion USD)Value share of digitisable goods
in respective HS chapter
Imports of digitisable goods Physical imports in HS chapter value of imports
18 TAD/TC/WP(2019)19/FINAL
Unclassified
33. Another issue relates to growing complementarities between electronic transmissions and other
goods. For example, lower prices for e-books can drive demand for e-readers. Similarly, demand for
smart TVs or projectors can rise as the cost of online streaming falls. Hence, growing electronic
transmissions can spur trade in other related goods (which may themselves be subject to tariffs).
34. This is the case for a set of smart or hardware goods which include mobile phones, projectors,
headphones, speakers, smart TVs and computers (see Appendix A for a discussion of how these goods
were chosen). As seen from Figure 3.6, reductions in imports of goods that could be digitised were
concurrent with increases in physical imports of hardware, which were nearly 6 times larger in
volume.14 This suggests that reductions in customs revenue in one sector could be compensated by
increases in revenue in other sectors.
Figure 3.6. Changes in imports of hardware and digitisable goods (2011=100)
Note: See appendix for list of hardware and Banga (2019[25]) for list of digitisable goods.
Source: Own calculations based on WITS
3.1.4. The value of trade that is likely to become digitisable in the next few years may also be
smaller than supposed
35. A recurring topic in the Moratorium debate relates to uncertainties arising from new
technologies and their impact on what could become digitally deliverable in the future. In particular,
some argue that 3D printing has the potential to exacerbate the revenue implications of the Moratorium
by making more goods digitally deliverable (WTO, 2018[2]; WTO, 2019[3]).
36. 3D printing refers to a manufacturing process that operates through the successive
superposition of layers of materials (e.g. plastics, ceramics) to produce goods from computer-aided
design (CAD) files using a 3D printer.15 Given uncertainties related to the capabilities and adoption of
14 Although it is difficult to establish the causal relationship between electronically transmitable
trade and trade in related physical goods.
15 The latter vary in the exact printing process they employ, including extruding a solid filament of
material through a heated nozzle (Thermoplastic injection) or using liquid photopolymer that
hardens when UV light strikes it (Light-polymerised printing) (OECD, 2017[35]).
0
20
40
60
80
100
120
140
2011 2012 2013 2014 2015 2016 2017 2018
imports of hardware Imports of digitisable goods
TAD/TC/WP(2019)19/FINAL 19
Unclassified
the technology, the implications of 3D printing for trade have been the subject of wide speculation,
with some suggesting that 3D printing might replace as much as two-fifths of world trade in goods by
2040 (Leering, 2017[31]).
37. However, adoption of 3D printing technology, while growing, has been slow (OECD, n.d.[32]).
There are also limitations to the use of 3D printing technologies. For instance, additive manufacturing
does not provide significant opportunities for economies of scale, implying that its ability to fully
replace more traditional manufacturing might be limited (Kommerskollegium, 2016[33]).16 High
specific costs are a central impediment to the widespread adoption of additive manufacturing systems
(Baumers et al., 2016[34]), and print-time and material use remain important factors that condition 3D
printing costs (OECD, 2017[35]). For these reasons, the technology is traditionally associated with the
production of smaller batches of more specialised and geometrically complex products, most useful in
manufacturing prototypes; materially simple or customised final consumer goods; and customised
intermediate products (see the example of air-cooling ducts in the F-18 Super Hornet Fighter-Jets in
Khajavi, Partanen and Holmström, (2014[36])).
38. The scope of products that can be printed depends on the size of the object and on the materials
used to print – the ‘ink’ (OECD, 2017[35]). 3D printers can be limited by the size of their casing
(Attaran, 2017[37]), although they are now being used to produce larger objects, as is the case in the
architecture industry (OECD, 2017, p. 178[35]). Limitations can also arise from the strength of the
materials used, which may condition the size of what can be printed (Huang et al., 2013, p. 1194[38]).
The scope of 3D printing can also be limited when it comes to micro or nano-products (OECD, 2017,
pp. 178-179[35]; Li et al., 2011[39]). Moreover, products requiring many different materials like, for
instance, mobile phones, are less likely to be fully 3D printable, at least in the near future (OECD,
2017, p. 179[35]).17 This suggests that, while 3D printing is a versatile technology, the scope of products
that can be 3D printed remains low.
39. At the same time, the adoption of additive manufacturing technology does not necessarily
imply a reduction in cross-border trade in goods. A variety of factors, including operating costs and
personnel costs might make it more convenient to deploy 3D printers in one location and then ship
products to service locations (‘centralised rapid manufacturing’) rather than adopting 3D printers in a
variety of locations and transferring digital files between these (‘distributed rapid manufacturing’)
(Holmström et al., 2009[40]). While the configuration of trade flows in selected product categories and
countries might change as a result, this does not necessarily imply a decrease in the value of
cross-border trade in goods. Indeed, in the case of hearing aids, the growing adoption of 3D printing
technologies has resulted in an increase rather than a decrease in trade in hearing aids (see Box 3.2).
Similarly, the wider adoption of 3D printing is likely to spur more trade in the raw materials, or natural
resources, used as ‘ink’ (Kommerskollegium, 2016[33]; Lee-Makiyama and Narayanan, 2019[26]).
40. Hence, while it is difficult to estimate the impact of an evolving technology, a review of the
existing literature suggests that dramatic changes in trade arising from the wider adoption of 3D
16A number of technical studies compare injection moulding techniques to additive manufacturing
for the production of spare parts, to identify the breakeven volumes at which it is more convenient
to deploy traditional injection moulding techniques than 3D printing. One result is that beyond
10 000 parts, traditional injection moulding techniques are more economical than additive
manufacturing. (Ruffo, Tuck and Hague, 2006[73]) (Hopkinson and Dickens, 2003[74]).
17 This does not mean that the technology cannot be used in manufacturing plants to print specific
components of a mobile phone that can then be assembled.

20 TAD/TC/WP(2019)19/FINAL
Unclassified
printing technology are unlikely in the short-term. According to McKinsey Global Institute (2019[41])
3D printing might replace between 1 and 2% of physical trade by 2030.
Box 3.2. Digitisation can increase goods trade: a case study of hearing aids
Hearing aid manufacturers rely on data for pre- and post-purchase customisation. They scan the
customers’ ear channels to produce a precise 3D-model of the inner ear which they then use to
3D-print a hearing aid in house and send to the customer. Once shipped to the customer, data flows
support remote technical calibration for better performance of the hearing aid (Casalini and López
González, 2019[42]).
Although trade in hearing aids remains modest, at around USD 4.7 billion, it has been growing at a
faster rate than trade in other products of that same chapter (see Figure 3.7) since the industry
switched to additive manufacturing techniques in around 2007. This suggests that 3D printing
technology can complement rather than substitute for physical trade.
Figure 3.7. Trade in hearing aids 1996-2018 (2000=100)
Note: Hearing aids identified using HS-code 902140 : ‘Hearing aids, excluding parts and accessories’
Source: Own calculations using WITS COMTRADE based on World Bank (2019[43]) quoting Freund,
Mulabdic and Ruta (n.d.[44]).
3.2. Deepening the debate on tariffs
41. There are a number of issues that have received less attention in the Moratorium debate but
which require further thought. These include discussions about who bears the burden of tariffs or
whether or not there are alternative sources of government revenue better suited to the digital economy.
3.2.1. Tariffs tend to tax domestic consumers and can have wider negative impacts
42. Customs duties are a form of discriminatory taxation applied to goods originating from abroad.
They create a wedge between domestic and foreign prices with consequences for consumers, government
revenue and domestic and foreign producers. Tariff increases often come at the expense of consumers who
end up paying higher prices. Part of the impact is a transfer from consumers to producers and to the
government, but there is also an associated deadweight loss to the economy (see Appendix B).

TAD/TC/WP(2019)19/FINAL 21
Unclassified
43. The extent to which consumers are affected depends, in part, on the tariff pass-through, which is
the degree to which increases in tariffs are translated into higher domestic prices. At one extreme, there
can be full pass-through when domestic prices increase in proportion to the tariff. At the other extreme,
tariffs can be fully absorbed by companies reducing their profit margins to compensate for the tariff
increase with a view to remaining competitive in the domestic market.
44. Recent evidence on the incidence of tariffs shows that a quasi-complete pass-through of tariffs to
domestic prices tends to be most common (Amiti, Redding and Weinstein, 2019[45]; Fajgelbaum et al.,
2019[46]; Cavallo et al., 2019[47]). This suggests that price increases arising from tariffs are most likely to
be absorbed by consumers and not foreign companies. That is, foreign companies will pass-on the price
increases to domestic consumers affecting their ability to afford electronically transmittable trade.
45. Moreover, tariffs can also have broader negative impacts over time. Recent work by Fajgelbaum
et al. (2019[46]) shows that “tariff increases lead, in the medium term, to economically and statistically
significant declines in domestic output and productivity. Tariff increases also result in more
unemployment, higher inequality and real exchange rate appreciation” (see Figure 3.1). Tariffs applied on
electronic transmissions, including content, could also lead to reductions in GDP as identified in Lee-
Makiyama and Narayanan (2019[26]).
Figure 3.8. The effect of tariffs
Note: The solid line indicates the response of the variable in question to a one standard deviation increase in
tariff. The dotted lines corresponds to the 90% confidence interval.
Source: Fajgelbaum et al. (2019[46]).

22 TAD/TC/WP(2019)19/FINAL
Unclassified
3.2.2. Alternative, non-discriminatory and more stable mechanisms for collecting revenue
exist
46. In the off-line world, relative to alternative taxes such as consumption or sales taxes, one
advantage of customs duties is that they apply to physical products crossing borders and therefore tend
to be “easy to collect” (Aizenman and Jinjarak, 2006[48]). They also have lower administrative costs
(World Bank, 1988[49]).18 This, coupled with more limited institutional capabilities, is why developing
countries tend to rely more on tariff revenues than developed countries (Aizenman and Jinjarak,
2006[48]) – see Figure 3.9. However, it is not clear that these differences remain in the case of tariffs
and taxes on electronic transmissions including content: there is little information about the likely fixed
set-up and administrative and compliance costs of a system for collecting tariffs on digital deliveries,
but it is likely to be similar to those for collecting consumption or sales taxes.
Figure 3.9. Share of overall revenue from customs and per capita GDP
Source: Own calculations from World Development Indicators.
47. Evidence suggests that developing countries adopting indirect taxes like value added taxes
(VAT) experience 40 to 50% less tax revenue instability than countries which do not have a VAT
system (Ebeke and Ehrhart, 2011[50]). There is also evidence that shifting from trade taxes to
consumption and income taxes might be desirable given that trade taxes can be an inefficient way of
raising government revenues (Kowalski, 2005[51]). Indeed, trade taxes apply to a narrow base, taxes
applied to either domestic production, consumption or both would have the advantage of being broader
based compared to trade taxes (Whalley, 2002[52]).
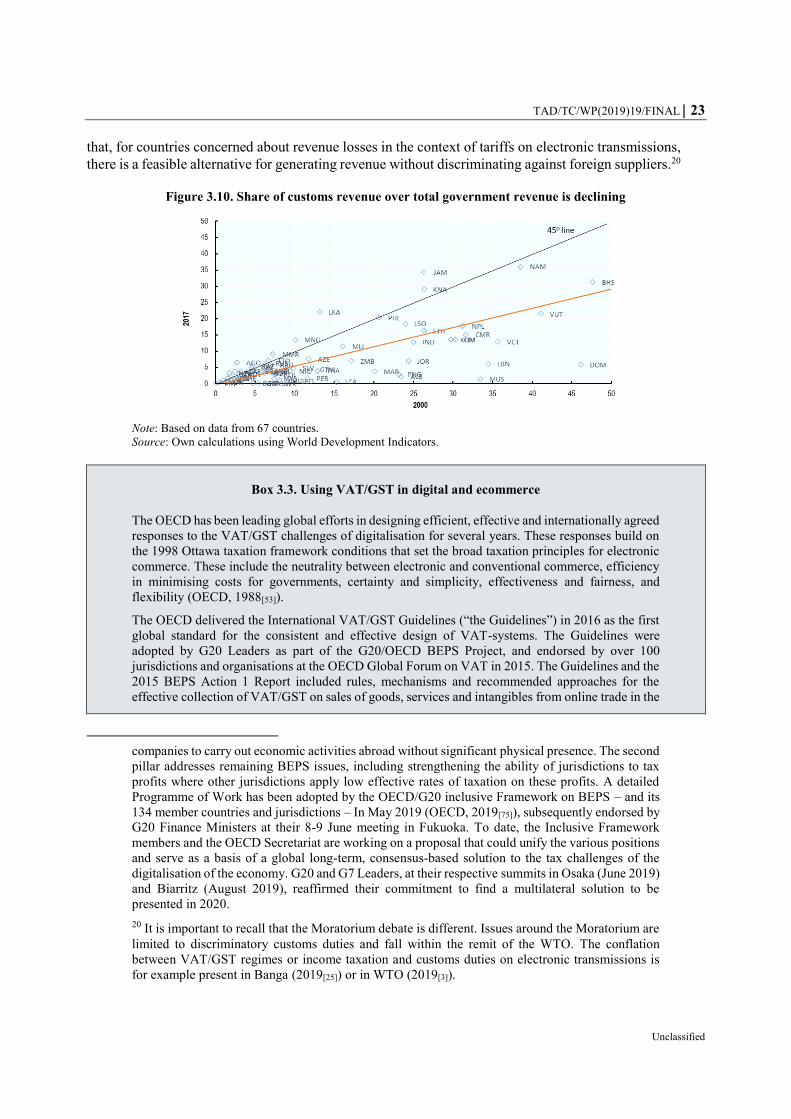
48. This is partly why countries are moving away from tariffs as a source of government revenue
(See Figure 3.10), including towards the implementation of VAT/Goods and Services Tax (GST)
systems. In the area of VAT/GST in the digital age, international cooperation has delivered concrete
solutions to address the challenges arising from digitalisation. The OECD has developed international
guidelines which are now implemented across many countries worldwide (Box 3.3).19 This suggests
18 The administrative costs of trade and excise taxes range from 1 to 3% of revenue collected,
whereas the corresponding figure for VATs can be as high as 5% (World Bank, 1988[49]).
19 This is not to be confused with OECD efforts related to income taxation in the digital economy.
These discussions are currently structured in two pillars: the first addresses the allocation of taxing
rights on income generated on cross-border activities, responding to technological change enabling
TAD/TC/WP(2019)19/FINAL 23
Unclassified
that, for countries concerned about revenue losses in the context of tariffs on electronic transmissions,
there is a feasible alternative for generating revenue without discriminating against foreign suppliers.20
Figure 3.10. Share of customs revenue over total government revenue is declining
Note: Based on data from 67 countries.
Source: Own calculations using World Development Indicators.
Box 3.3. Using VAT/GST in digital and ecommerce
The OECD has been leading global efforts in designing efficient, effective and internationally agreed
responses to the VAT/GST challenges of digitalisation for several years. These responses build on
the 1998 Ottawa taxation framework conditions that set the broad taxation principles for electronic
commerce. These include the neutrality between electronic and conventional commerce, efficiency
in minimising costs for governments, certainty and simplicity, effectiveness and fairness, and
flexibility (OECD, 1988[53]).
The OECD delivered the International VAT/GST Guidelines (“the Guidelines”) in 2016 as the first
global standard for the consistent and effective design of VAT-systems. The Guidelines were
adopted by G20 Leaders as part of the G20/OECD BEPS Project, and endorsed by over 100
jurisdictions and organisations at the OECD Global Forum on VAT in 2015. The Guidelines and the
2015 BEPS Action 1 Report included rules, mechanisms and recommended approaches for the
effective collection of VAT/GST on sales of goods, services and intangibles from online trade in the
companies to carry out economic activities abroad without significant physical presence. The second
pillar addresses remaining BEPS issues, including strengthening the ability of jurisdictions to tax
profits where other jurisdictions apply low effective rates of taxation on these profits. A detailed
Programme of Work has been adopted by the OECD/G20 inclusive Framework on BEPS – and its
134 member countries and jurisdictions – In May 2019 (OECD, 2019[75]), subsequently endorsed by
G20 Finance Ministers at their 8-9 June meeting in Fukuoka. To date, the Inclusive Framework
members and the OECD Secretariat are working on a proposal that could unify the various positions
and serve as a basis of a global long-term, consensus-based solution to the tax challenges of the
digitalisation of the economy. G20 and G7 Leaders, at their respective summits in Osaka (June 2019)
and Biarritz (August 2019), reaffirmed their commitment to find a multilateral solution to be
presented in 2020.
20 It is important to recall that the Moratorium debate is different. Issues around the Moratorium are
limited to discriminatory customs duties and fall within the remit of the WTO. The conflation
between VAT/GST regimes or income taxation and customs duties on electronic transmissions is
for example present in Banga (2019[25]) or in WTO (2019[3]).
24 TAD/TC/WP(2019)19/FINAL
Unclassified
consumers’ jurisdiction, to ensure tax neutrality between domestic and foreign suppliers, regardless
of their location.
Following the delivery of the Guidelines, the OECD has developed packages to ensure that the
recommended solutions are implemented effectively and consistently, that they are adjusted to the
rapidly changing economic context, and that the vulnerability of the international VAT framework
to fraud and avoidance from online trade be minimised. The 2017 report on “Mechanisms for the
Effective Collection of VAT/GST Where the Supplier is Not Located in the Jurisdiction of Taxation”
(OECD, 2017[54]) provides further detailed practical guidance to support their consistent and
effective implementation. Another recent key deliverable from this work is the report on “The Role
of Digital Platforms in the Collection of VAT/GST on Online Sales” (OECD, 2019[55]) which
provide guidance on a range of measures for enlisting e-commerce marketplaces and other digital
platforms in the collection of VAT on the sales that they facilitate.
Work is being developed with the active involvement of a wide range of jurisdictions beyond the
OECD membership, notably via the OECD Global Forum on VAT/GST – a unique global platform
for dialogue on international VAT/GST standards which brings together over 100 jurisdictions,
including regional and international organisations.
To date, over 50 jurisdictions have adopted rules for the application of VAT/GST to B2C supplies
of services and intangibles from online sales by foreign vendors in accordance with rules and
mechanisms recommended in the Guidelines and the 2015 BEPS Action 1 Report. The evidence on
the impact of these measures suggests that their implementation has greatly enhanced compliance
levels and yielded substantial tax revenues for market jurisdictions, and has levelled the playing field
between domestic suppliers and foreign vendors. Estimates on the tax revenue generated from the
adoption of the VAT/GST standards are available, including AUD 269 million and NZD 131 million
for Australia and New Zealand respectively in the first year of implementation, ZAR 3 billion for
South Africa over a 5 year period, and EUR 10.2 billion for the European Union over the first three
years of implementation (OECD, 2019, p. 6[56]).
49. Among those countries that have successfully implemented those solutions, Australia recently
adopted legislation imposing GST on imported services and digital products. This provides an example
of good practice on the use of taxes to address the tax challenges of the digital economy (Box 3.4).
Box 3.4. Australia’s Goods and Services Tax on offshore intangible supplies
On 1 July 2017, Australia extended its Goods and Services Tax (GST) to the sale of “imported
services and digital products to Australian consumers”. From this date, GST applies to all intangible
supplies such as the supply of digital content, games and software – as well as consultancy and
professional services performed offshore for customers in Australia.
Under these new arrangements, entities supplying these services and digital products, and who meet
the GST turnover threshold (of AUD 75 000 AUD in sales that are connected with Australia over a
12 month period), must register for GST, charge GST on these sales, and lodge returns with the
Australian Taxation Office.
The GST is levied on overseas suppliers for transactions involving Australian customers (B2C
transactions). The Goods and Services Tax Ruling 2017/1 provides greater detail on how overseas
suppliers can determine if the supply is connected with Australia – that is, if the recipient is an
Australian consumer.
Electronic Distribution Platforms (EDPs), which are entities that make supplies of services and
digital products available to end-consumers by means of electronic communication, are also subject
to the GST on the sales for which they are liable. EDPs are also required to register for GST, charge
GST on their sales and lodge returns if they meet the GST turnover threshold. However, only one
TAD/TC/WP(2019)19/FINAL 25
Unclassified
3.3. Thinking about the benefits of electronic transmissions
50. Another element that has often been neglected in the Moratorium debate is a wider discussion
of the benefits associated with being able to conduct trade electronically. Indeed, the empirical
literature has, to date, narrowly focused on the revenue implications and not the associated benefits.
Drawing on a combination of existing literature and new data, this section discusses how electronic
transmissions can enable desirable economic outcomes, including welfare gains and increases in
export competitiveness, outcomes which are put at risk by measures, such as tariffs, that increase their
cost.
3.3.1. Electronic transmissions can reduce trade costs and removing tariffs is, overall,
welfare enhancing
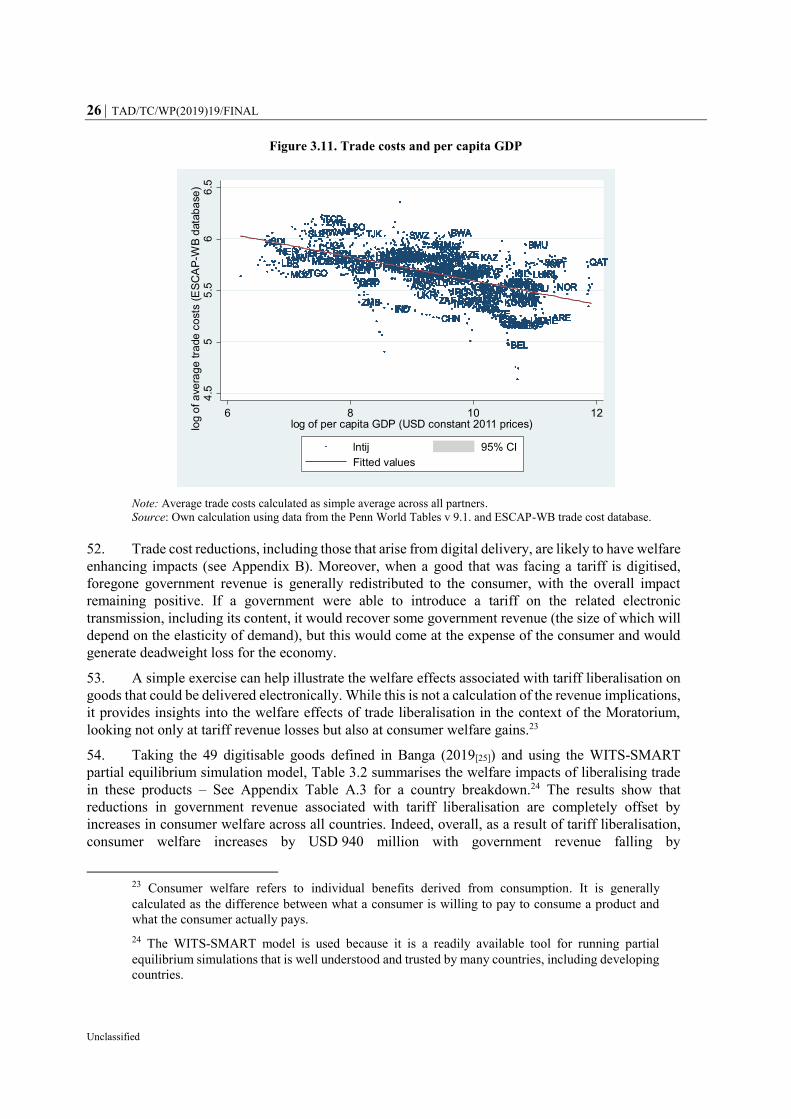
51. At its most basic, digitising goods is tantamount to a reduction in the cost of engaging in trade
(WTO, 2018[58]; López González and Ferencz, 2018[59]).21 Indeed, a good that was once delivered
physically but which can now be transmitted electronically will no longer incur transportation costs.
These, according to Duval, Utoktham and Kravchenko (2018[60]) can represent, on average, between
20-30% of total trade costs for goods (by contrast, tariff costs typically represent, on average, 2-3% of
trade costs).22 This suggests that, with greater connectivity, electronic transmissions can offer poorer
countries new opportunities to overcome their trade cost disadvantages (Figure 3.11).
21 Note that the process of digitalisation might also reduce overall costs of production. For instance,
a record label might no longer have to incur the costs related to producing the physical carrier
medium for records. This suggests that digitisation can also have important cost saving effects (see
Appendix B for a brief discussion of the welfare implications when we incorporate cost and transport
reductions).
22 Samuelson (1954[76]) introduced the concept of ‘iceberg costs’, to refer to transport costs,
suggesting that, when trading, exporters would need to send a higher value of a product given that a
part of the value of the product ‘melts’ as it arrives at its destination. The ability to transmit
electronically reduces the incidence of these costs dramatically.
entity is liable for the GST on a taxable sale. If an EDP is responsible for GST on a sale, no other
entity has GST obligations.
This reform ensures that imported services and digital products purchased by Australian consumers
face the same tax arrangements as those that are sourced from within Australia. This helps create a
level playing field between overseas and domestic suppliers of services and digital products, and
allows for the collection of GST on the increasing value of inbound intangible consumer supplies.
Source: (Australian Taxation Office, 2017[57]), https://www.ato.gov.au/Business/International-tax-
for-business/GST-on-imported-services-and-digital-products/
26 TAD/TC/WP(2019)19/FINAL
Unclassified
Figure 3.11. Trade costs and per capita GDP
Note: Average trade costs calculated as simple average across all partners.
Source: Own calculation using data from the Penn World Tables v 9.1. and ESCAP-WB trade cost database.
52. Trade cost reductions, including those that arise from digital delivery, are likely to have welfare
enhancing impacts (see Appendix B). Moreover, when a good that was facing a tariff is digitised,
foregone government revenue is generally redistributed to the consumer, with the overall impact
remaining positive. If a government were able to introduce a tariff on the related electronic
transmission, including its content, it would recover some government revenue (the size of which will
depend on the elasticity of demand), but this would come at the expense of the consumer and would
generate deadweight loss for the economy.
53. A simple exercise can help illustrate the welfare effects associated with tariff liberalisation on
goods that could be delivered electronically. While this is not a calculation of the revenue implications,
it provides insights into the welfare effects of trade liberalisation in the context of the Moratorium,
looking not only at tariff revenue losses but also at consumer welfare gains.23
54. Taking the 49 digitisable goods defined in Banga (2019[25]) and using the WITS-SMART
partial equilibrium simulation model, Table 3.2 summarises the welfare impacts of liberalising trade
in these products – See Appendix Table A.3 for a country breakdown.24 The results show that
reductions in government revenue associated with tariff liberalisation are completely offset by
increases in consumer welfare across all countries. Indeed, overall, as a result of tariff liberalisation,
consumer welfare increases by USD 940 million with government revenue falling by
23 Consumer welfare refers to individual benefits derived from consumption. It is generally
calculated as the difference between what a consumer is willing to pay to consume a product and
what the consumer actually pays.
24 The WITS-SMART model is used because it is a readily available tool for running partial
equilibrium simulations that is well understood and trusted by many countries, including developing
countries.
AGOAGOAGOAGOAGOAGOAGOAGOAGOAGOAGOAGOAGOAGOAGOAGOAGOAGOAGOAGOAGOAGOAGOAGOAGOAGOALBALBALBALBALBALBALBALBALBALBALBALBALBALBALBALBALBALBALBALBALBALBALBALBALBALB
AREAREAREAREAREAREAREAREAREAREAREAREAREAREAREAREAREAREAREAREAREAREAREAREAREARE
ARGARGARGARGARGARGARGARGARGARGARGARGARGARGARGARGARGARGARGARGARGARGARGARGARGARG
ARMARMARMARMARMARMARMARMARMARMARMARMARMARMARMARMARMARMARMARMARMARMARMARMARMARM
AUSAUSAUSAUSAUSAUSAUSAUSAUSAUSAUSAUSAUSAUSAUSAUSAUSAUSAUSAUSAUSAUSAUSAUSAUSAUSAUTAUTAUTAUTAUTAUTAUTAUTAUTAUTAUTAUTAUTAUTAUTAUTAUTAUTAUTAUTAUTAUTAUTAUTAUTAUT
AZEAZEAZEAZEAZEAZEAZEAZEAZEAZEAZEAZEAZEAZEAZEAZEAZEAZEAZEAZEAZEAZEAZEAZEAZEAZE
BDIBDIBDIBDIBDIBDIBDIBDIBDIBDIBDIBDIBDIBDIBDIBDIBDIBDIBDIBDIBDIBDIBDIBDIBDIBDI
BELBELBELBELBELBELBELBELBELBELBELBELBELBELBELBELBELBELBELBELBELBELBELBELBELBEL
BENBENBENBENBENBENBENBENBENBENBENBENBENBENBENBENBENBENBENBENBENBENBENBENBENBENBFABFABFABFABFABFABFABFABFABFABFABFABFABFABFABFABFABFABFABFABFABFABFABFABFABFA
BGDBGDBGDBGDBGDBGDBGDBGDBGDBGDBGDBGDBGDBGDBGDBGDBGDBGDBGDBGDBGDBGDBGDBGDBGDBGD
BGRBGRBGRBGRBGRBGRBGRBGRBGRBGRBGRBGRBGRBGRBGRBGRBGRBGRBGRBGRBGRBGRBGRBGRBGRBGR
BHRBHRBHRBHRBHRBHRBHRBHRBHRBHRBHRBHRBHRBHRBHRBHRBHRBHRBHRBHRBHRBHRBHRBHRBHRBHR
BIHBIHBIHBIHBIHBIHBIHBIHBIHBIHBIHBIHBIHBIHBIHBIHBIHBIHBIHBIHBIHBIHBIHBIHBIHBIH
BLRBLRBLRBLRBLRBLRBLRBLRBLRBLRBLRBLRBLRBLRBLRBLRBLRBLRBLRBLRBLRBLRBLRBLRBLRBLRBLZBLZBLZBLZBLZBLZBLZBLZBLZBLZBLZBLZBLZBLZBLZBLZBLZBLZBLZBLZBLZBLZBLZBLZBLZBLZ
BMUBMUBMUBMUBMUBMUBMUBMUBMUBMUBMUBMUBMUBMUBMUBMUBMUBMUBMUBMUBMUBMUBMUBMUBMUBMU
BOLBOLBOLBOLBOLBOLBOLBOLBOLBOLBOLBOLBOLBOLBOLBOLBOLBOLBOLBOLBOLBOLBOLBOLBOLBOL
BRABRABRABRABRABRABRABRABRABRABRABRABRABRABRABRABRABRABRABRABRABRABRABRABRABRA
BRBBRBBRBBRBBRBBRBBRBBRBBRBBRBBRBBRBBRBBRBBRBBRBBRBBRBBRBBRBBRBBRBBRBBRBBRBBRB
BWABWABWABWABWABWABWABWABWABWABWABWABWABWABWABWABWABWABWABWABWABWABWABWABWABWA
CANCANCANCANCANCANCANCANCANCANCANCANCANCANCANCANCANCANCANCANCANCANCANCANCANCAN
CHECHECHECHECHECHECHECHECHECHECHECHECHECHECHECHECHECHECHECHECHECHECHECHECHECHE
CHLCHLCHLCHLCHLCHLCHLCHLCHLCHLCHLCHLCHLCHLCHLCHLCHLCHLCHLCHLCHLCHLCHLCHLCHLCHL
CHNCHNCHNCHNCHNCHNCHNCHNCHNCHNCHNCHNCHNCHNCHNCHNCHNCHNCHNCHNCHNCHNCHNCHNCHNCHN
CMRCMRCMRCMRCMRCMRCMRCMRCMRCMRCMRCMRCMRCMRCMRCMRCMRCMRCMRCMRCMRCMRCMRCMRCMRCMR COLCOLCOLCOLCOLCOLCOLCOLCOLCOLCOLCOLCOLCOLCOLCOLCOLCOLCOLCOLCOLCOLCOLCOLCOLCOLCPVCPVCPVCPVCPVCPVCPVCPVCPVCPVCPVCPVCPVCPVCPVCPVCPVCPVCPVCPVCPVCPVCPVCPVCPVCPV
CRICRICRICRICRICRICRICRICRICRICRICRICRICRICRICRICRICRICRICRICRICRICRICRICRICRICYPCYPCYPCYPCYPCYPCYPCYPCYPCYPCYPCYPCYPCYPCYPCYPCYPCYPCYPCYPCYPCYPCYPCYPCYPCYP
CZECZECZECZECZECZECZECZECZECZECZECZECZECZECZECZECZECZECZECZECZECZECZECZECZECZE
DEUDEUDEUDEUDEUDEUDEUDEUDEUDEUDEUDEUDEUDEUDEUDEUDEUDEUDEUDEUDEUDEUDEUDEUDEUDEU
DNKDNKDNKDNKDNKDNKDNKDNKDNKDNKDNKDNKDNKDNKDNKDNKDNKDNKDNKDNKDNKDNKDNKDNKDNKDNK
DZADZADZADZADZADZADZADZADZADZADZADZADZADZADZADZADZADZADZADZADZADZADZADZADZADZA
ECUECUECUECUECUECUECUECUECUECUECUECUECUECUECUECUECUECUECUECUECUECUECUECUECUECU
ESPESPESPESPESPESPESPESPESPESPESPESPESPESPESPESPESPESPESPESPESPESPESPESPESPESP
FINFINFINFINFINFINFINFINFINFINFINFINFINFINFINFINFINFINFINFINFINFINFINFINFINFIN
FJIFJIFJIFJIFJIFJIFJIFJIFJIFJIFJIFJIFJIFJIFJIFJIFJIFJIFJIFJIFJIFJIFJIFJIFJIFJI
FRAFRAFRAFRAFRAFRAFRAFRAFRAFRAFRAFRAFRAFRAFRAFRAFRAFRAFRAFRAFRAFRAFRAFRAFRAFRAGBRGBRGBRGBRGBRGBRGBRGBRGBRGBRGBRGBRGBRGBRGBRGBRGBRGBRGBRGBRGBRGBRGBRGBRGBRGBR
GEOGEOGEOGEOGEOGEOGEOGEOGEOGEOGEOGEOGEOGEOGEOGEOGEOGEOGEOGEOGEOGEOGEOGEOGEOGEOGHAGHAGHAGHAGHAGHAGHAGHAGHAGHAGHAGHAGHAGHAGHAGHAGHAGHAGHAGHAGHAGHAGHAGHAGHAGHAGINGINGINGINGINGINGINGINGINGINGINGINGINGINGINGINGINGINGINGINGINGINGINGINGINGIN
GRCGRCGRCGRCGRCGRCGRCGRCGRCGRCGRCGRCGRCGRCGRCGRCGRCGRCGRCGRCGRCGRCGRCGRCGRCGRC
GTMGTMGTMGTMGTMGTMGTMGTMGTMGTMGTMGTMGTMGTMGTMGTMGTMGTMGTMGTMGTMGTMGTMGTMGTMGTM
HKGHKGHKGHKGHKGHKGHKGHKGHKGHKGHKGHKGHKGHKGHKGHKGHKGHKGHKGHKGHKGHKGHKGHKGHKGHKG
HNDHNDHNDHNDHNDHNDHNDHNDHNDHNDHNDHNDHNDHNDHNDHNDHNDHNDHNDHNDHNDHNDHNDHNDHNDHND
HRVHRVHRVHRVHRVHRVHRVHRVHRVHRVHRVHRVHRVHRVHRVHRVHRVHRVHRVHRVHRVHRVHRVHRVHRVHRVIDNIDNIDNIDNIDNIDNIDNIDNIDNIDNIDNIDNIDNIDNIDNIDNIDNIDNIDNIDNIDNIDNIDNIDNIDNIDN
INDINDINDINDINDINDINDINDINDINDINDINDINDINDINDINDINDINDINDINDINDINDINDINDINDIND
IRLIRLIRLIRLIRLIRLIRLIRLIRLIRLIRLIRLIRLIRLIRLIRLIRLIRLIRLIRLIRLIRLIRLIRLIRLIRL
IRQIRQIRQIRQIRQIRQIRQIRQIRQIRQIRQIRQIRQIRQIRQIRQIRQIRQIRQIRQIRQIRQIRQIRQIRQIRQ
ISLISLISLISLISLISLISLISLISLISLISLISLISLISLISLISLISLISLISLISLISLISLISLISLISLISL
ISRISRISRISRISRISRISRISRISRISRISRISRISRISRISRISRISRISRISRISRISRISRISRISRISRISR
ITAITAITAITAITAITAITAITAITAITAITAITAITAITAITAITAITAITAITAITAITAITAITAITAITAITA
JAMJAMJAMJAMJAMJAMJAMJAMJAMJAMJAMJAMJAMJAMJAMJAMJAMJAMJAMJAMJAMJAMJAMJAMJAMJAM
JORJORJORJORJORJORJORJORJORJORJORJORJORJORJORJORJORJORJORJORJORJORJORJORJORJOR
JPNJPNJPNJPNJPNJPNJPNJPNJPNJPNJPNJPNJPNJPNJPNJPNJPNJPNJPNJPNJPNJPNJPNJPNJPNJPN
KAZKAZKAZKAZKAZKAZKAZKAZKAZKAZKAZKAZKAZKAZKAZKAZKAZKAZKAZKAZKAZKAZKAZKAZKAZKAZ
KENKENKENKENKENKENKENKENKENKENKENKENKENKENKENKENKENKENKENKENKENKENKENKENKENKENKHMKHMKHMKHMKHMKHMKHMKHMKHMKHMKHMKHMKHMKHMKHMKHMKHMKHMKHMKHMKHMKHMKHMKHMKHMKHM
KORKORKORKORKORKORKORKORKORKORKORKORKORKORKORKORKORKORKORKORKORKORKORKORKORKOR
KWTKWTKWTKWTKWTKWTKWTKWTKWTKWTKWTKWTKWTKWTKWTKWTKWTKWTKWTKWTKWTKWTKWTKWTKWTKWTLBNLBNLBNLBNLBNLBNLBNLBNLBNLBNLBNLBNLBNLBNLBNLBNLBNLBNLBNLBNLBNLBNLBNLBNLBNLBN
LBRLBRLBRLBRLBRLBRLBRLBRLBRLBRLBRLBRLBRLBRLBRLBRLBRLBRLBRLBRLBRLBRLBRLBRLBRLBRLKALKALKALKALKALKALKALKALKALKALKALKALKALKALKALKALKALKALKALKALKALKALKALKALKALKA
LSOLSOLSOLSOLSOLSOLSOLSOLSOLSOLSOLSOLSOLSOLSOLSOLSOLSOLSOLSOLSOLSOLSOLSOLSOLSO
LTULTULTULTULTULTULTULTULTULTULTULTULTULTULTULTULTULTULTULTULTULTULTULTULTULTU
LUXLUXLUXLUXLUXLUXLUXLUXLUXLUXLUXLUXLUXLUXLUXLUXLUXLUXLUXLUXLUXLUXLUXLUXLUXLUX
LVALVALVALVALVALVALVALVALVALVALVALVALVALVALVALVALVALVALVALVALVALVALVALVALVALVA
MARMARMARMARMARMARMARMARMARMARMARMARMARMARMARMARMARMARMARMARMARMARMARMARMARMAR
MDAMDAMDAMDAMDAMDAMDAMDAMDAMDAMDAMDAMDAMDAMDAMDAMDAMDAMDAMDAMDAMDAMDAMDAMDAMDAMDGMDGMDGMDGMDGMDGMDGMDGMDGMDGMDGMDGMDGMDGMDGMDGMDGMDGMDGMDGMDGMDGMDGMDGMDGMDG
MDVMDVMDVMDVMDVMDVMDVMDVMDVMDVMDVMDVMDVMDVMDVMDVMDVMDVMDVMDVMDVMDVMDVMDVMDVMDVMEXMEXMEXMEXMEXMEXMEXMEXMEXMEXMEXMEXMEXMEXMEXMEXMEXMEXMEXMEXMEXMEXMEXMEXMEXMEX
MLIMLIMLIMLIMLIMLIMLIMLIMLIMLIMLIMLIMLIMLIMLIMLIMLIMLIMLIMLIMLIMLIMLIMLIMLIMLIMMRMMRMMRMMRMMRMMRMMRMMRMMRMMRMMRMMRMMRMMRMMRMMRMMRMMRMMRMMRMMRMMRMMRMMRMMRMMR
MNGMNGMNGMNGMNGMNGMNGMNGMNGMNGMNGMNGMNGMNGMNGMNGMNGMNGMNGMNGMNGMNGMNGMNGMNGMNG
MOZMOZMOZMOZMOZMOZMOZMOZMOZMOZMOZMOZMOZMOZMOZMOZMOZMOZMOZMOZMOZMOZMOZMOZMOZMOZMRTMRTMRTMRTMRTMRTMRTMRTMRTMRTMRTMRTMRTMRTMRTMRTMRTMRTMRTMRTMRTMRTMRTMRTMRTMRT
MUSMUSMUSMUSMUSMUSMUSMUSMUSMUSMUSMUSMUSMUSMUSMUSMUSMUSMUSMUSMUSMUSMUSMUSMUSMUSMWIMWIMWIMWIMWIMWIMWIMWIMWIMWIMWIMWIMWIMWIMWIMWIMWIMWIMWIMWIMWIMWIMWIMWIMWIMWI
MYSMYSMYSMYSMYSMYSMYSMYSMYSMYSMYSMYSMYSMYSMYSMYSMYSMYSMYSMYSMYSMYSMYSMYSMYSMYS
NAMNAMNAMNAMNAMNAMNAMNAMNAMNAMNAMNAMNAMNAMNAMNAMNAMNAMNAMNAMNAMNAMNAMNAMNAMNAMNERNERNERNERNERNERNERNERNERNERNERNERNERNERNERNERNERNERNERNERNERNERNERNERNERNER
NGANGANGANGANGANGANGANGANGANGANGANGANGANGANGANGANGANGANGANGANGANGANGANGANGANGANICNICNICNICNICNICNICNICNICNICNICNICNICNICNICNICNICNICNICNICNICNICNICNICNICNIC
NORNORNORNORNORNORNORNORNORNORNORNORNORNORNORNORNORNORNORNORNORNORNORNORNORNOR
NPLNPLNPLNPLNPLNPLNPLNPLNPLNPLNPLNPLNPLNPLNPLNPLNPLNPLNPLNPLNPLNPLNPLNPLNPLNPL
NZLNZLNZLNZLNZLNZLNZLNZLNZLNZLNZLNZLNZLNZLNZLNZLNZLNZLNZLNZLNZLNZLNZLNZLNZLNZLOMNOMNOMNOMNOMNOMNOMNOMNOMNOMNOMNOMNOMNOMNOMNOMNOMNOMNOMNOMNOMNOMNOMNOMNOMNOMN
PAKPAKPAKPAKPAKPAKPAKPAKPAKPAKPAKPAKPAKPAKPAKPAKPAKPAKPAKPAKPAKPAKPAKPAKPAKPAK
PANPANPANPANPANPANPANPANPANPANPANPANPANPANPANPANPANPANPANPANPANPANPANPANPANPAN
PERPERPERPERPERPERPERPERPERPERPERPERPERPERPERPERPERPERPERPERPERPERPERPERPERPER
PHLPHLPHLPHLPHLPHLPHLPHLPHLPHLPHLPHLPHLPHLPHLPHLPHLPHLPHLPHLPHLPHLPHLPHLPHLPHL
POLPOLPOLPOLPOLPOLPOLPOLPOLPOLPOLPOLPOLPOLPOLPOLPOLPOLPOLPOLPOLPOLPOLPOLPOLPOLPRTPRTPRTPRTPRTPRTPRTPRTPRTPRTPRTPRTPRTPRTPRTPRTPRTPRTPRTPRTPRTPRTPRTPRTPRTPRT
PRYPRYPRYPRYPRYPRYPRYPRYPRYPRYPRYPRYPRYPRYPRYPRYPRYPRYPRYPRYPRYPRYPRYPRYPRYPRY
QATQATQATQATQATQATQATQATQATQATQATQATQATQATQATQATQATQATQATQATQATQATQATQATQATQAT
RUSRUSRUSRUSRUSRUSRUSRUSRUSRUSRUSRUSRUSRUSRUSRUSRUSRUSRUSRUSRUSRUSRUSRUSRUSRUS
RWARWARWARWARWARWARWARWARWARWARWARWARWARWARWARWARWARWARWARWARWARWARWARWARWARWA
SAUSAUSAUSAUSAUSAUSAUSAUSAUSAUSAUSAUSAUSAUSAUSAUSAUSAUSAUSAUSAUSAUSAUSAUSAUSAU
SENSENSENSENSENSENSENSENSENSENSENSENSENSENSENSENSENSENSENSENSENSENSENSENSENSEN SGPSGPSGPSGPSGPSGPSGPSGPSGPSGPSGPSGPSGPSGPSGPSGPSGPSGPSGPSGPSGPSGPSGPSGPSGPSGP
SLESLESLESLESLESLESLESLESLESLESLESLESLESLESLESLESLESLESLESLESLESLESLESLESLESLE
SLVSLVSLVSLVSLVSLVSLVSLVSLVSLVSLVSLVSLVSLVSLVSLVSLVSLVSLVSLVSLVSLVSLVSLVSLVSLVSURSURSURSURSURSURSURSURSURSURSURSURSURSURSURSURSURSURSURSURSURSURSURSURSURSUR
SVNSVNSVNSVNSVNSVNSVNSVNSVNSVNSVNSVNSVNSVNSVNSVNSVNSVNSVNSVNSVNSVNSVNSVNSVNSVN SWESWESWESWESWESWESWESWESWESWESWESWESWESWESWESWESWESWESWESWESWESWESWESWESWESWE
SWZSWZSWZSWZSWZSWZSWZSWZSWZSWZSWZSWZSWZSWZSWZSWZSWZSWZSWZSWZSWZSWZSWZSWZSWZSWZ
SYCSYCSYCSYCSYCSYCSYCSYCSYCSYCSYCSYCSYCSYCSYCSYCSYCSYCSYCSYCSYCSYCSYCSYCSYCSYC
TCDTCDTCDTCDTCDTCDTCDTCDTCDTCDTCDTCDTCDTCDTCDTCDTCDTCDTCDTCDTCDTCDTCDTCDTCDTCD
TGOTGOTGOTGOTGOTGOTGOTGOTGOTGOTGOTGOTGOTGOTGOTGOTGOTGOTGOTGOTGOTGOTGOTGOTGOTGO
THATHATHATHATHATHATHATHATHATHATHATHATHATHATHATHATHATHATHATHATHATHATHATHATHATHA
TJKTJKTJKTJKTJKTJKTJKTJKTJKTJKTJKTJKTJKTJKTJKTJKTJKTJKTJKTJKTJKTJKTJKTJKTJKTJK
TUNTUNTUNTUNTUNTUNTUNTUNTUNTUNTUNTUNTUNTUNTUNTUNTUNTUNTUNTUNTUNTUNTUNTUNTUNTUN
TURTURTURTURTURTURTURTURTURTURTURTURTURTURTURTURTURTURTURTURTURTURTURTURTURTUR
TZATZATZATZATZATZATZATZATZATZATZATZATZATZATZATZATZATZATZATZATZATZATZATZATZATZA
UGAUGAUGAUGAUGAUGAUGAUGAUGAUGAUGAUGAUGAUGAUGAUGAUGAUGAUGAUGAUGAUGAUGAUGAUGAUGA
UKRUKRUKRUKRUKRUKRUKRUKRUKRUKRUKRUKRUKRUKRUKRUKRUKRUKRUKRUKRUKRUKRUKRUKRUKRUKR
URYURYURYURYURYURYURYURYURYURYURYURYURYURYURYURYURYURYURYURYURYURYURYURYURYURY
USAUSAUSAUSAUSAUSAUSAUSAUSAUSAUSAUSAUSAUSAUSAUSAUSAUSAUSAUSAUSAUSAUSAUSAUSAUSA
UZBUZBUZBUZBUZBUZBUZBUZBUZBUZBUZBUZBUZBUZBUZBUZBUZBUZBUZBUZBUZBUZBUZBUZBUZBUZB
ZAFZAFZAFZAFZAFZAFZAFZAFZAFZAFZAFZAFZAFZAFZAFZAFZAFZAFZAFZAFZAFZAFZAFZAFZAFZAFZMBZMBZMBZMBZMBZMBZMBZMBZMBZMBZMBZMBZMBZMBZMBZMBZMBZMBZMBZMBZMBZMBZMBZMBZMBZMB
ZWEZWEZWEZWEZWEZWEZWEZWEZWEZWEZWEZWEZWEZWEZWEZWEZWEZWEZWEZWEZWEZWEZWEZWEZWEZWE
4.5
55
.56
6.5
log o
f a
ve
rag
e tra
de
co
sts
(E
SC
AP
-WB
data
ba
se
)
6 8 10 12log of per capita GDP (USD constant 2011 prices)
lntij 95% CI
Fitted values

TAD/TC/WP(2019)19/FINAL 27
Unclassified
USD 865 million, giving rise to an overall net welfare increase of USD 73 million. Moreover, if, within
this framework, one were also able to account for gains associated with reductions in trade costs, the
net welfare gains would increase dramatically.
Table 3.2. Impact of reducing tariffs on digitisable goods (2018), 1000 USD
Tariff Revenue Consumer Surplus Net Impact
Developing - 844 078.67 917 813.11 73 734.44
Developed - 20 446.86 20 582.69 135.83
TOTAL - 864 525.53 938 395.80 73 870.27
Note: Based on WITS-SMART model. Developing countries are defined on the basis of WTO classification.
Source: Own calculations using the WITS-SMART model.
3.3.2. Digitally deliverable services increase domestic value added in exports
55. Another channel through which digital deliveries can benefit countries is through the input
channel. As is shown in Kowalski et al. (2015[61]) and Lopez-Gonzalez (2016[62]), the use of foreign
value added is associated with positive economic outcomes such as export diversification, productivity
growth and rising domestic value added in exports. Indeed, access to more and cheaper varieties of
intermediate goods and services enable firms, including SMEs (López González, 2017[63]), to reap
input benefits and grow their export competitiveness.
56. Moreover, exports of ICT-enabled services like telecommunication services, financial services
or other business services have grown at the average pace of 10-13% between 2005 and 2017 for
developing countries (Roy, 2019[64]). Indeed, 'other business services', which accounted for 23% of
total services exports in 2017, grew at an average annual pace of 11% between 2005 and
2017. Developing country exports form an integral part of these trends (Roy, 2019, p. 10[64]).
57. Taking foreign sourcing of business services as a proxy measure for digitisable inputs that can
be electronically transmitted such as software, Figure 3.12 highlights the positive impact of digitally
deliverable business services on domestic value added embodied in exports (See also Table A.4 and
Appendix C). Looking at differences across income levels reveals that impacts are highest for lower
middle income and lower income countries. These results reflect the increasing use of a range of
digitally deliverable inputs for which it can be more difficult to find domestic substitutes. To the extent
that these may be considered to attract tariffs, these types of services would become more expensive,
undermining these gains.

28 TAD/TC/WP(2019)19/FINAL
Unclassified
Figure 3.12. Impact of digitally deliverable business services on domestic value added in
exports across countries at different levels of development
Note: Figure shows standardised coefficients capturing impact of increasing foreign value added in business
services by one standard deviation on domestic value added in exports.
Source: Own calculations, see Appendix C and Table A.4.
3.3.3. Digitalisation enables more firms to become exporters
58. A last element that is worth highlighting is the role that digitalisation and adoption of digital
technologies can play in helping firms become exporters, notably firms in developing countries. Using
the World Bank Enterprise Survey, and following estimations in Lopez-Gonzalez (2017[63]; 2019[65])
and Lopez-Gonzalez and Sorescu (2019[66]), Table 3.3 shows that firms in developing countries that
use a webpage, including SMEs, have a higher propensity to become exporters than those that do not.
Moreover, albeit for a reduced sample, those that use the internet for digital delivery are also seen to
have higher export propensities.
59. This suggests that digitalisation, including the ability to deliver and to source digitally, is
associated with new export opportunities, including for SMEs. Duties applied by other countries on
electronic transmissions, including content, could affect the ability of domestic SMEs to export.
Table 3.3. Role of digital technologies in determining export propensities
All SME Large
Webpage 0.525*** 0.416*** 0.383***
(0.0206) (0.0216) (0.0352)
Observations 58,440 44,670 13,727
Use of internet for digital delivery 0.185*** 0.183*** 0.198**
(0.0525) (0.0561) (0.0928)
Observations 5,230 3,409 1,795
Note: Coefficients reflect estimates of the role of webpages and the use of the internet for digital delivery on
export propensities across firms of different sizes in developing countries. See Annex Tables 0.5 and 0.6. for
full estimates. Note that coefficients across estimations are not comparable, due, among other, to wide
differences in sample sizes.
Source: Own calculations based on World Bank Enterprise Survey and Lopez-Gonzalez (2017[63]; 2019[65]).

TAD/TC/WP(2019)19/FINAL 29
Unclassified
4. Policy considerations
60. This paper set out to provide an overview of the issues which are important in the Moratorium
debate. It put into perspective the empirical results in the literature, highlighting that the opportunity
cost of the Moratorium, in terms of foregone tariff revenue, is, on aggregate, relatively small. It also
reviewed the literature about 3D printing and established that, while difficult to estimate, dramatic
changes in trade arising from the wider adoption of the technology are unlikely in shorter term.
61. The paper also raised a number of issues that have not been extensively explored in discussions,
including that tariffs tend to be associated with lower output or productivity, and that they tend to fall
on domestic consumers rather than on foreign firms. The paper also highlighted that other feasible
options exist for generating government revenue, notably the use of non-discriminatory consumption
or sales taxes.
62. Finally, the paper highlights the benefits that are associated with electronic transmissions,
including for developing countries. For instance, since electronic transmissions imply considerable
reductions in transport costs, they can level the playing field for developing countries which tend to
face higher transportation costs. Tariff reductions are also associated with higher consumer welfare
and can increase export competitiveness, notably across goods and services sectors. Digital
technologies such as webpages and the ability to deliver content over the internet are also seen to
provide benefits to firms in developing countries, including SMEs, by increasing their ability to engage
in export markets. This suggests that the practice of not imposing tariffs on electronic transmissions is
likely to have delivered important gains both in terms of access to cheaper goods, but also in terms of
enabling firms to export without facing additional barriers.
63. Overall, this paper suggests that careful consideration to all these issues, and not just revenue
implications, should be given when thinking about whether or not to extend the Moratorium. This
requires a careful analysis of the costs and also the benefits associated with the Moratorium. Regarding
costs, it is important that revenue implications be considered in the context of overall government
revenue, and, even where recouping that revenue is the main concern, that consideration also be given
to alternative, broader-based, non-discriminatory taxes. At the same time, in forming an overall view,
countries may also wish to think about the broader economic benefits that arise from the Moratorium.
This includes lower prices for consumers (on whom the costs of tariffs fall), and greater export
competitiveness. This broader view of costs and benefits allows for a more holistic understanding of
countries’ interests in the Moratorium, than a focus on estimates of lost tariff revenue alone.
30 TAD/TC/WP(2019)19/FINAL
Unclassified
References
(n.a.) (n.d.), X. [77]
Aizenman, J. and Y. Jinjarak (2006), “Globalization and Developing Countries-a Shrinking Tax
Base?”, NBER Working Paper Series, No. 11933, National Bureau of Economic Research,
Cambridge, http://www.nber.org/papers/w11933.
[48]
Amiti, M., S. Redding and D. Weinstein (2019), “The Impact Of The 2018 Trade War on U.S.
Prices and Welfare”, Discussion Paper Series - International Trade and Regional Economics,
No. DP13564, Centre for Economic Policy Research, London.
[45]
Attaran, M. (2017), “The rise of 3-D printing: The advantages of additive manufacturing over
traditional manufacturing”, Business Horizons, Vol. 60/5, pp. 677-688,
http://dx.doi.org/10.1016/j.bushor.2017.05.011.
[37]
Australian Taxation Office (2017), GST on imported services and digital products,
https://www.ato.gov.au/Business/International-tax-for-business/GST-on-imported-services-
and-digital-products/ (accessed on 11 September 2019).
[57]
Banga, R. (2019), “Growing Trade in Electronic Transmissions: Implications for the South”,
UNCTAD Research Paper, No. 29, UNCTAD, Geneva.
[25]
Banga, R. (2017), “Rising Product Digitalisation and Losing Trade Competitiveness”,
UNCTAD/GDS/ECIDC, No. 3, UNCTAD, Geneva.
[24]
Baumers, M. et al. (2016), “The cost of additive manufacturing: Machine productivity,
economies of scale and technology-push”, Technological Forecasting and Social Change,
Vol. 102, pp. 193-201, http://dx.doi.org/10.1016/j.techfore.2015.02.015.
[34]
Book Industry Study Group (2014), Book -Stats: An Annual Comprehensive Study of the U.S.
Publishing Industry. Vol. 4, Association of American Publishers.
[30]
Book Industry Study Group (2011), BookStats: An Annual Comprehensive Study of the U.S.
Publishing Industry. Vol. 1, Association of American Publishers.
[29]
Brenton, P. et al. (2009), “Assessing the Adjustment Implications of Trade Policy Changes using
the Tariff Reform Impact Simulation Tool (TRIST)”, Policy Research Working Papers,
No. 5045, World Bank, Washington, http://dx.doi.org/10.1017/S1474745610000509.
[27]
BSA (2019), Why Should WTO Members Support Extension of the WTO Moratorium on
Customs Duties on Electronic Transmissions?, BSA | The Software Alliance.
[72]
Buditomo, R. (2019), What We Should Know About Duties on Intangible Goods, Baker
McKenzie, https://www.bakermckenzie.com/en/insight/publications/2019/02/what-should-
we-know (accessed on 17 May 2019).
[12]
TAD/TC/WP(2019)19/FINAL 31
Unclassified
Buditomo, R. (2018), Intangible Goods are Now Subject to Import Duty, Baker McKenzie,
https://www.bakermckenzie.com/en/insight/publications/2018/03/intangible-goods-import-
duty-indonesia (accessed on 17 May 2019).
[13]
Casalini, F. and J. López González (2019), “Trade and Cross-Border Data Flows”, OECD Trade
Policy Papers, No. 220, OECD Publishing, Paris, https://dx.doi.org/10.1787/b2023a47-en.
[42]
Cavallo, A. et al. (2019), Tariff Passthrough at the Border and at the Store: Evidence from US
Trade Policy (Preliminary), Mimeo.
[47]
Cory, N. (2019), The Ten Worst Digital Protectionism and Innovation Mercantilist Policies of
2018, The Information Technology and Innovation Foundation (ITIF), Washington.
[11]
Duval, Y., C. Utoktham and A. Kravchenko (2018), “Impact of implementation of digital trade
facilitation on trade costs”, ARTNeT Working Paper Series, No. 174, ESCAP, Bangkok.
[60]
Ebeke, C. and H. Ehrhart (2011), “Does VAT reduce the instability of tax revenues?”, Etudes et
Documents, No. 24, Centre d’Etudes et de Recherche sure le Développement International,
Clermont Ferrand, http://www.cerdi.org.
[50]
Fajgelbaum, P. et al. (2019), “The Return to Protectionism”, NBER Working Paper Series,
No. 25638, National Bureau of Economic Research, Cambridge,
http://www.nber.org/papers/w25638.
[46]
Freund, C., A. Mulabdic and M. Ruta (n.d.), “Is 3D printing a threat to global trade? The trade
effects you didn’t hear about”, No. forthcoming, The World Bank Group.
[44]
Gilbert, R. (2015), “E-books: A Tale of Digital Disruption”, Journal of Economic Perspectives,
Vol. 29/3, pp. 165–184, http://dx.doi.org/10.1257/jep.29.3.165.
[28]
Holmström, J. et al. (2009), “Rapid manufacturing in the spare parts supply chain: Alternative
approaches to capacity deployment”, Journal of Manufacturing Technology Management,
Vol. 21/6, pp. 687-697, http://dx.doi.org/10.1108/17410381011063996.
[40]
Hopkinson, N. and P. Dickens (2003), “Analysis of rapid manufacturing - Using layer
manufacturing processes for production”, Proceedings of the Institution of Mechanical
Engineers, Part C: Journal of Mechanical Engineering Science, Vol. 217/1, pp. 31-40,
http://dx.doi.org/10.1243/095440603762554596.
[74]
Huang, S. et al. (2013), “Additive manufacturing and its societal impact: A literature review”,
International Journal of Advanced Manufacturing Technology, Vol. 67/5-8, pp. 1191-1203,
http://dx.doi.org/10.1007/s00170-012-4558-5.
[38]
International Chamber of Commerce (2019), “The business case for a permanent prohibition on
customs duties on electronic transmissions”, ICC Issues Brief, No. 2, International Chamber
of Commerce, Paris.
[71]
Khajavi, S., J. Partanen and J. Holmström (2014), “Additive manufacturing in the spare parts
supply chain”, Computers in Industry, Vol. 65/1, pp. 50-63,
http://dx.doi.org/10.1016/j.compind.2013.07.008.
[36]
32 TAD/TC/WP(2019)19/FINAL
Unclassified
Kommerskollegium (2016), Trade Regulation in a 3D Printed World – a Primer, Swedish
National Board of Trade.
[33]
Kowalski, P. (2005), “Impact of Changes in Tariffs on Developing Countries’ Government
Revenue”, OECD Trade Policy Papers, No. 18, OECD Publishing, Paris,
https://dx.doi.org/10.1787/210755276421.
[51]
Kowalski, P. et al. (2015), “Participation of Developing Countries in Global Value
Chains: Implications for Trade and Trade-Related Policies”, OECD Trade Policy Papers,
No. 179, OECD Publishing, Paris, https://dx.doi.org/10.1787/5js33lfw0xxn-en.
[61]
Lee-Makiyama, H. and B. Narayanan (2019), “The Economic Losses from Ending the WTO
Moratorium on Electronic Transmissions”, Policy Brief, No. 3, European Centre for
International Political Economy, Brussels.
[26]
Leering, R. (2017), “3D printing: a threat to global trade”, Economic and Financial Analysis
Global Economics | Technology, ING.
[31]
Li, L. et al. (2011), “Laser nano-manufacturing - State of the art and challenges”, CIRP Annals -
Manufacturing Technology, Vol. 60/2, pp. 735-755,
http://dx.doi.org/10.1016/j.cirp.2011.05.005.
[39]
Lopez Gonzalez, J. (2016), “Using Foreign Factors to Enhance Domestic Export Performance: A
Focus on Southeast Asia”, OECD Trade Policy Papers, No. 191, OECD Publishing, Paris,
https://dx.doi.org/10.1787/5jlpq82v1jxw-en.
[62]
López González, J. (2019), “Fostering participation in digital trade for ASEAN MSMEs”, OECD
Trade Policy Papers, No. 230, OECD Publishing, Paris,
https://dx.doi.org/10.1787/63561b11-en.
[65]
López González, J. (2017), “Mapping the participation of ASEAN small- and medium- sized
enterprises in global value chains”, OECD Trade Policy Papers, No. 203, OECD Publishing,
Paris, https://dx.doi.org/10.1787/2dc1751e-en.
[63]
López González, J. and J. Ferencz (2018), “Digital Trade and Market Openness”, OECD Trade
Policy Papers, No. 217, OECD Publishing, Paris, https://dx.doi.org/10.1787/1bd89c9a-en.
[59]
López González, J. and M. Jouanjean (2017), “Digital Trade: Developing a Framework for
Analysis”, OECD Trade Policy Papers, No. 205, OECD Publishing, Paris,
https://dx.doi.org/10.1787/524c8c83-en.
[4]
López González, J. and S. Sorescu (2019), “Helping SMEs internationalise through trade
facilitation”, OECD Trade Policy Papers, No. 229, OECD Publishing, Paris,
https://dx.doi.org/10.1787/2050e6b0-en.
[66]
Mattoo, A., R. Perez-Esteve and L. Schuknecht (2001), “Electronic commerce, trade and tariff
revenue: A quantitative assessment”, World Economy, Vol. 24/7, pp. 955-970,
http://dx.doi.org/10.1111/1467-9701.00391.
[22]

TAD/TC/WP(2019)19/FINAL 33
Unclassified
Mattoo, A. and L. Schuknecht (2000), “Trade Polices for Electronic Commerce”, Policy
Research Working Paper, No. 2380, The World Bank, Washington.
[21]
McKinsey Global Institute (2019), Globalization in Transition: the Future of Trade and Value
Chains, McKinsey & Company.
[41]
OECD (2019), OECD/G20 Inclusive Framework on BEPS Progress report: July 2018 - May
2019, OECD, Paris.
[56]
OECD (2019), Programme of Work to Develop a Consensus Solution to the Tax Challenges
Arising from the Digitalisation of the Economy, OECD/G20 Inclusive Framework on BEPS,
OECD, Paris, http://www.oecd.org/tax/beps/programme-of-work-to-develop-a-consensus-
solution-to-the-tax-challenges-arising-from-the-digitalisation-of-the-economy.htm.
[75]
OECD (2019), The Role of Digital Platforms in the Collection of VAT/GST on Online Sales,
OECD, Paris, http://www.oecd.org/tax/consumption/the-role-of-digital-platforms-in-the-
collection-of-vat-gst-on-online-sales.pdf.
[55]
OECD (2017), Mechanisms for the Effective Collection of VAT/GST Where the Suppler is Not
Located in the Jurisdiction of Taxation, OECD , Paris.
[54]
OECD (2017), The Next Production Revolution: Implications for Governments and Business,
OECD Publishing, Paris, https://dx.doi.org/10.1787/9789264271036-en.
[35]
OECD (2001), Taxation and electronic commerce : implementing the Ottawa taxation
framework conditions., OECD, Paris.
[70]
OECD (1988), Electronic Commerce: Taxation Framework Conditions, OECD, Paris. [53]
OECD (n.d.), “3D printing and international trade”. [32]
Panagariya, A. (2000), “E-Commerce, WTO and Developing Countries”, The World Economy,
Vol. 23/8, pp. 959-978, https://doi.org/10.1111/1467-9701.00313.
[67]
Roy, M. (2019), “Elevating Services Services Trade Policy, WTO Commitments, and their Role
in Economic Development and Trade Integration”, Staff Working Paper, No. ERSD-2019-01,
WTO.
[64]
Ruffo, M., C. Tuck and R. Hague (2006), “Cost estimation for rapid manufacturing - Laser
sintering production for low to medium volumes”, Proceedings of the Institution of
Mechanical Engineers, Part B: Journal of Engineering Manufacture, Vol. 220/9, pp. 1417-
1427, http://dx.doi.org/10.1243/09544054JEM517.
[73]
Samuelson, P. (1954), “The Transfer Problem and Transport Costs: The Terms of Trade When
Impediments are Absent”, The Economic Journal, Vol. 64/254, pp. 264-289,
http://dx.doi.org/10.2307/2226834.
[76]
Schuknecht, L. and R. Pérez-Esteve (1999), “A Quantitative Assessment of Electronic
Commerce”, Staff Working Paper ERAD, No. 01, WTO, Geneva.
[20]
34 TAD/TC/WP(2019)19/FINAL
Unclassified
Teltscher, S. (2000), “Tariffs, Taxes and Electronic Commerce : Revenue Implications for
Developing Countries”, Policy Issues in International Trade and Commodities Study Series,
No. 5, UNCTAD.
[23]
Whalley, J. (2002), Taxes and Trade. [52]
World Bank (2019), World Development Report 2020 Trading for Development in the Age of
Global Value Chains: Grey Cover Draft, World Bank, Washington.
[43]
World Bank (1988), World Development Report 1988: Opportunities and Risks in Managing the
World Economy, World Bank, Washington.
[49]
WTO (2019), Joint Statement on Electronic Commerce. WT/L/1056. [1]
WTO (2019), Joint Statement on Electronic Commerce: Communication from Canada
(INF/ECOM/34).
[17]
WTO (2019), Joint Statement on Electronic Commerce: Communication from New Zealand
(INF/ECOM/33).
[16]
WTO (2019), Joint Statement on Electronic Commerce: Communication from Singapore
(INF/ECOM/25).
[18]
WTO (2019), Joint Statement on Electronic Commerce: Communication from the United States
(INF/ECOM/5).
[15]
WTO (2019), Joint Statement on Electronic Commerce: EU Proposal for WTO Disciplines and
Commitments Relating To Electronic Commerce: Communication from the European Union
(INF/ECOM/22).
[14]
WTO (2019), Work Programme on Electronic Commerce: The E-commerce Moratorium and
Implications for Developing Countries Communication from India and South Africa
(WT/GC/W/774), https://unctad.org/en/PublicationsLibrary/ser-rp-2019d1_en.pdf.
[3]
WTO (2018), Work Pogramme on Electronic Commerce: Moratorium on Customs Duties on
Electronic Transmissions: Need for a Re-think. Communication from India and South Africa
(WT/GC/W/747).
[2]
WTO (2018), World Trade Report, WTO, Geneva. [58]
WTO (2017), Statement by Indonesia: Facilitator’s Consultation on Electronic Commerce,
Mc11 declaration, and other relevant plenary sessions(WT/MIN(17)/68).
[7]
WTO (2017), Work Programme on Electronic Commerce: Ministerial Decision of 13 December
2017 (WT/MIN(17)/65).
[5]
WTO (2016), “Fiscal Implications of the Customs Moratorium on Electronic Transmissions: the
Case of Digitisable Goods”, WTO.
[19]

TAD/TC/WP(2019)19/FINAL 35
Unclassified
WTO (2016), “Fiscal Implications of the Customs Moratorium on Electronic Transmissions: the
Case of Digitisable Goods”, WTO.
[69]
WTO (2003), Fifth Dedicated Discussion on Electronic Commerce under the Auspices of the
General Council on 16 May and 11 July 2003: Summary by the Secretariat of the Issues
Raised (WT/GC/W/509).
[8]
WTO (1999), Work Programme on Electronic Commerce: Communication from Indonesia and
Singapore. WT/GC/W/247.
[10]
WTO (1998), The Work Programme on Electronic Commerce: Note by the Secretariat
S/C/W/68.
[9]
WTO (1998), The Work Programme on Electronic Commerce: Note by the Secretariat
S/C/W/68.
[68]
Wunsch-Vincent, S. (2006), The WTO, the Internet and Trade in Digital Products: EC-US
Perspectives, Hart Publishing, Portland.
[6]

36 TAD/TC/WP(2019)19/FINAL
Unclassified
Appendix
Appendix A. Putting the estimates of the revenue implications into perspective
This paper relies on a variety of sources to put the results of the empirical literature on the
revenue implications of the Moratorium into perspective. This includes ensuring that the
analysis reflects, as much as possible the same countries so as to not underestimate values. In
much of the analysis, data on average bound, MFN and applied rates on electronically
transmittable trade is obtained from Banga (2019[25]).
The World Development Indicators are used to measure total imports of goods and services in
Figure 3.3. The value of total imports of electronically transmittable trade included in the
estimation is taken from Banga (2019[25]), and includes both physical imports and digitally
delivered imports.
WITS COMTRADE data and HS correspondence tables are used to identify the share of
electronically transmittable trade in their respective HS chapters (Figure 3.4). The most
extensive list of such trade used in the literature is used (Banga, 2019[25]). However, the value
of imports is obtained from COMTRADE, and hence includes physical trade only.
WITS COMTRADE data is also used to measure imports in HS code 902140 and in HS chapter
90 for Figure 3.7.
At the country level, data on total revenue from customs duties and total government revenues
for developed and developing countries are obtained using the World Development Indicators
(Table 3.1). These are derived by calculating total government revenues by multiplying Tax
revenues as a % of GDP by GDP in USD at current prices for the year 2017. Second, the
estimate for revenues generated from customs duties is obtained by multiplying Customs and
other import duties (% of tax revenue) and total government revenues as obtained from the
calculation above.
Other estimates of revenues raised from customs duties at the country level are calculated using
WITS TRAINS data with a view to providing a measure of total revenues from customs (Table
A.2). This is obtained by retrieving imports and tariffs data on all HS commodities at the
6 digits level for all countries. The measure of revenues generated from imports is obtained by
multiplying the simple average of the duty rate for one HS 6-digits goods code by the value of
imports for each country on each bilateral trade flows. The sum of revenues obtained from all
HS codes and for each country is used as an estimate of total revenue from customs. Where
the year 2017 is not available, the latest available year is used. The methodology is adopted for
both Applied and MFN duties. EU countries are aggregated into the category ‘European
Union’ in order to obtain tariff data, and the tariff revenue losses estimated by Banga (2019[25])
are considered as the sum of the losses at the country level for this category.
Estimates for the value of trade in smart and hardware goods are obtained using COMTRADE
data and HS correspondence tables for cross-temporal comparison. Data on the value of
physical trade that is digitisable is obtained from Banga (2019[25]). The list of hardware and
smart goods includes items like mobile phones, speakers and headphones for illustrative
purposes, and is by no means an exhaustive list of hardware or smart goods. For the category

TAD/TC/WP(2019)19/FINAL 37
Unclassified
of smart goods, Apple’s HS 6-digits classification of selected Apple products was used (Table
A.1).25
Table A.1. Illustrative list of hardware and smart goods
Product HS-17 code Description
Mobile phones 8517.12 Telephones for cellular networks or for other wireless networks
8517.18 Other - Other apparatus for transmission or reception of voice, images or other data, including apparatus for communication in a wired or wireless network (such as a local or wide area network)
8517.62 Machines for the reception, conversion and transmission or regeneration of voice, images or other data, including switching and routing apparatus
8517.69 Other
Speakers 8518.1 -Microphones and stands therefor -Loudspeakers, whether or not mounted in their enclosures :
8518.21 Single loudspeakers, mounted in their enclosures 8518.22 Multiple loudspeakers, mounted in the same enclosure
8518.29 Other
Headphones 8518.3 Headphones and earphones, whether or not combined with a microphone, and sets consisting of a microphone and one or more loudspeakers
Computers 8471.41 Comprising in the same housing at least a central processing unit and an input and output unit, whether or not combined
8471.49 Other, presented in the form of systems
8471.5 Processing units other than those of subheading 8471.41 or 8471.49, whether or not containing in the same housing one or two of the following types of unit: storage units, input units, output units
8471.6 Input or output units, whether or not containing storage units in the same housing
8471.7 Storage units
8471.8 Other units of automatic data processing machines
8471.9 Other
25 Apple Inc. makes no representation or warranty as to the accuracy or reliability of the
classifications listed in this Classification Chart. Any use of such classifications by the user, is
without recourse to Apple Inc. and is at the users’ own risk. Apple Inc. is in no way responsible for
any damages whether direct, consequential, incidental, or otherwise, suffered by the user as a result
of using or relying upon such classifications, for any purpose whatsoever.
https://www.apple.com/fr/legal/more-resources/gtc.html
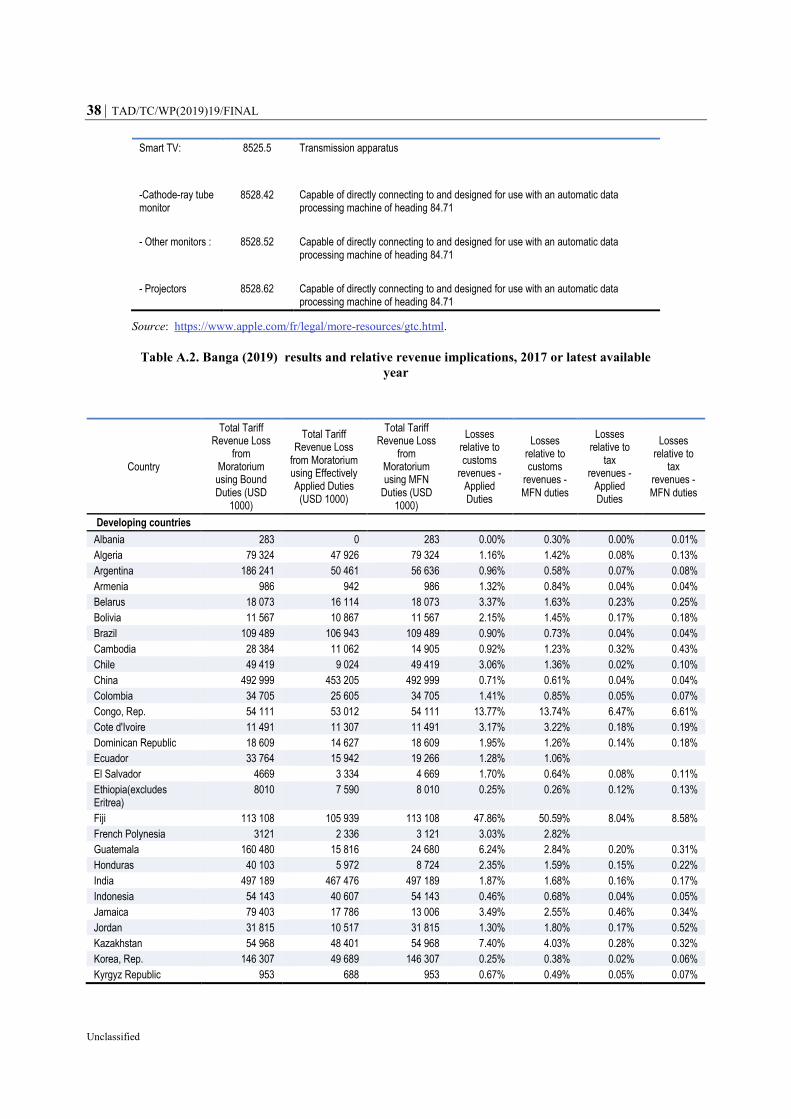
38 TAD/TC/WP(2019)19/FINAL
Unclassified
Smart TV: 8525.5 Transmission apparatus
-Cathode-ray tube monitor
8528.42 Capable of directly connecting to and designed for use with an automatic data processing machine of heading 84.71
- Other monitors : 8528.52 Capable of directly connecting to and designed for use with an automatic data processing machine of heading 84.71
- Projectors 8528.62 Capable of directly connecting to and designed for use with an automatic data processing machine of heading 84.71
Source: https://www.apple.com/fr/legal/more-resources/gtc.html.
Table A.2. Banga (2019) results and relative revenue implications, 2017 or latest available
year
Country
Total Tariff Revenue Loss
from Moratorium using Bound Duties (USD
1000)
Total Tariff Revenue Loss
from Moratorium using Effectively Applied Duties
(USD 1000)
Total Tariff Revenue Loss
from Moratorium using MFN
Duties (USD 1000)
Losses relative to customs
revenues - Applied Duties
Losses relative to customs
revenues - MFN duties
Losses relative to
tax revenues -
Applied Duties
Losses relative to
tax revenues - MFN duties
Developing countries
Albania 283 0 283 0.00% 0.30% 0.00% 0.01%
Algeria 79 324 47 926 79 324 1.16% 1.42% 0.08% 0.13%
Argentina 186 241 50 461 56 636 0.96% 0.58% 0.07% 0.08%
Armenia 986 942 986 1.32% 0.84% 0.04% 0.04%
Belarus 18 073 16 114 18 073 3.37% 1.63% 0.23% 0.25%
Bolivia 11 567 10 867 11 567 2.15% 1.45% 0.17% 0.18%
Brazil 109 489 106 943 109 489 0.90% 0.73% 0.04% 0.04%
Cambodia 28 384 11 062 14 905 0.92% 1.23% 0.32% 0.43%
Chile 49 419 9 024 49 419 3.06% 1.36% 0.02% 0.10%
China 492 999 453 205 492 999 0.71% 0.61% 0.04% 0.04%
Colombia 34 705 25 605 34 705 1.41% 0.85% 0.05% 0.07%
Congo, Rep. 54 111 53 012 54 111 13.77% 13.74% 6.47% 6.61%
Cote d'Ivoire 11 491 11 307 11 491 3.17% 3.22% 0.18% 0.19%
Dominican Republic 18 609 14 627 18 609 1.95% 1.26% 0.14% 0.18%
Ecuador 33 764 15 942 19 266 1.28% 1.06%
El Salvador 4669 3 334 4 669 1.70% 0.64% 0.08% 0.11%
Ethiopia(excludes Eritrea)
8010 7 590 8 010 0.25% 0.26% 0.12% 0.13%
Fiji 113 108 105 939 113 108 47.86% 50.59% 8.04% 8.58%
French Polynesia 3121 2 336 3 121 3.03% 2.82%
Guatemala 160 480 15 816 24 680 6.24% 2.84% 0.20% 0.31%
Honduras 40 103 5 972 8 724 2.35% 1.59% 0.15% 0.22%
India 497 189 467 476 497 189 1.87% 1.68% 0.16% 0.17%
Indonesia 54 143 40 607 54 143 0.46% 0.68% 0.04% 0.05%
Jamaica 79 403 17 786 13 006 3.49% 2.55% 0.46% 0.34%
Jordan 31 815 10 517 31 815 1.30% 1.80% 0.17% 0.52%
Kazakhstan 54 968 48 401 54 968 7.40% 4.03% 0.28% 0.32%
Korea, Rep. 146 307 49 689 146 307 0.25% 0.38% 0.02% 0.06%
Kyrgyz Republic 953 688 953 0.67% 0.49% 0.05% 0.07%
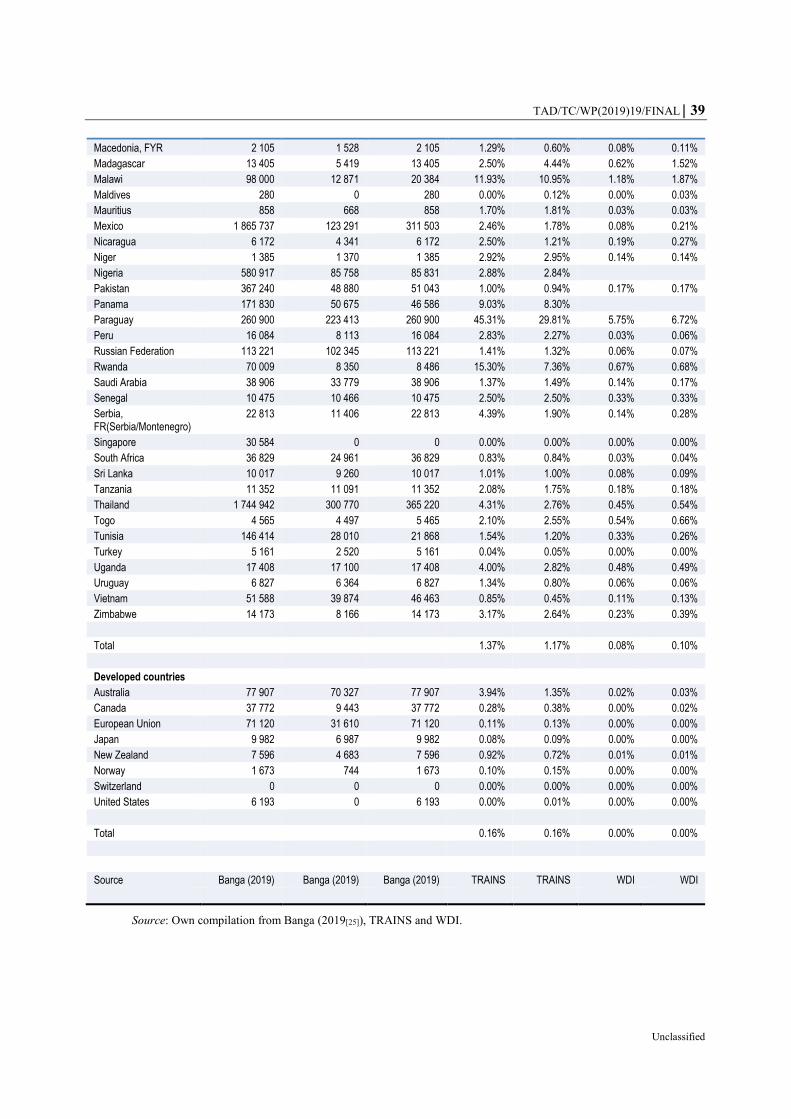
TAD/TC/WP(2019)19/FINAL 39
Unclassified
Macedonia, FYR 2 105 1 528 2 105 1.29% 0.60% 0.08% 0.11%
Madagascar 13 405 5 419 13 405 2.50% 4.44% 0.62% 1.52%
Malawi 98 000 12 871 20 384 11.93% 10.95% 1.18% 1.87%
Maldives 280 0 280 0.00% 0.12% 0.00% 0.03%
Mauritius 858 668 858 1.70% 1.81% 0.03% 0.03%
Mexico 1 865 737 123 291 311 503 2.46% 1.78% 0.08% 0.21%
Nicaragua 6 172 4 341 6 172 2.50% 1.21% 0.19% 0.27%
Niger 1 385 1 370 1 385 2.92% 2.95% 0.14% 0.14%
Nigeria 580 917 85 758 85 831 2.88% 2.84%
Pakistan 367 240 48 880 51 043 1.00% 0.94% 0.17% 0.17%
Panama 171 830 50 675 46 586 9.03% 8.30%
Paraguay 260 900 223 413 260 900 45.31% 29.81% 5.75% 6.72%
Peru 16 084 8 113 16 084 2.83% 2.27% 0.03% 0.06%
Russian Federation 113 221 102 345 113 221 1.41% 1.32% 0.06% 0.07%
Rwanda 70 009 8 350 8 486 15.30% 7.36% 0.67% 0.68%
Saudi Arabia 38 906 33 779 38 906 1.37% 1.49% 0.14% 0.17%
Senegal 10 475 10 466 10 475 2.50% 2.50% 0.33% 0.33%
Serbia, FR(Serbia/Montenegro)
22 813 11 406 22 813 4.39% 1.90% 0.14% 0.28%
Singapore 30 584 0 0 0.00% 0.00% 0.00% 0.00%
South Africa 36 829 24 961 36 829 0.83% 0.84% 0.03% 0.04%
Sri Lanka 10 017 9 260 10 017 1.01% 1.00% 0.08% 0.09%
Tanzania 11 352 11 091 11 352 2.08% 1.75% 0.18% 0.18%
Thailand 1 744 942 300 770 365 220 4.31% 2.76% 0.45% 0.54%
Togo 4 565 4 497 5 465 2.10% 2.55% 0.54% 0.66%
Tunisia 146 414 28 010 21 868 1.54% 1.20% 0.33% 0.26%
Turkey 5 161 2 520 5 161 0.04% 0.05% 0.00% 0.00%
Uganda 17 408 17 100 17 408 4.00% 2.82% 0.48% 0.49%
Uruguay 6 827 6 364 6 827 1.34% 0.80% 0.06% 0.06%
Vietnam 51 588 39 874 46 463 0.85% 0.45% 0.11% 0.13%
Zimbabwe 14 173 8 166 14 173 3.17% 2.64% 0.23% 0.39%
Total 1.37% 1.17% 0.08% 0.10%
Developed countries
Australia 77 907 70 327 77 907 3.94% 1.35% 0.02% 0.03%
Canada 37 772 9 443 37 772 0.28% 0.38% 0.00% 0.02%
European Union 71 120 31 610 71 120 0.11% 0.13% 0.00% 0.00%
Japan 9 982 6 987 9 982 0.08% 0.09% 0.00% 0.00%
New Zealand 7 596 4 683 7 596 0.92% 0.72% 0.01% 0.01%
Norway 1 673 744 1 673 0.10% 0.15% 0.00% 0.00%
Switzerland 0 0 0 0.00% 0.00% 0.00% 0.00%
United States 6 193 0 6 193 0.00% 0.01% 0.00% 0.00%
Total
0.16% 0.16% 0.00% 0.00%
Source Banga (2019) Banga (2019) Banga (2019) TRAINS TRAINS WDI WDI
Source: Own compilation from Banga (2019[25]), TRAINS and WDI.

40 TAD/TC/WP(2019)19/FINAL
Unclassified
Appendix B. Welfare analysis of electronic transmissions
The costs and benefits of electronic transmissions can be illustrated using traditional
welfare analysis, often used to identify the gains from trade. Indeed, Amiti, Redding and
Weinstein (2019[45]) argue that such models “are a powerful framework for understanding
what has happened to prices, quantities and welfare” arguing that “The deleterious impacts
of [...] tariffs have been largely in line with what one might have predicted based on a
simple supply and demand framework”.
With firms no longer having to incur the cost of transportation, the ability to deliver content
digitally can translate into a price reduction, the size of which would be proportional to the
transport cost saving (P0 to P1 in diagram below). The corresponding increase in demand
leads to a rise in imports and an associated increase in consumer surplus. This is the
difference between what a consumer is willing to pay and what she actually pays – the area
below the demand curve (in the example below the change is captured by the areas
A+B+C+D). But there is also a reduction in producer surplus. This is the difference
between what a supplier is willing to supply and what the supplier gets from selling in the
market—the area above the supply curve (in the example the change for producers is
captured by a loss equivalent to area A). The overall gain to the economy is the difference
between the consumer and the producer surplus. Since part of what the consumer gains is
what the producer loses, these elements cancel out. Overall, a net positive impact to the
economy emerges (captured by the area B+C+D).
However, if the good in question was already facing a tariff, then things get a little more
complicated, with implications for government revenue. As was the case earlier, the
digitisation of the item in question leads to a reduction in price, equivalent not only to the
transport cost reduction but also to the tariff which is no longer applied to the good. The
initial effect is a large increase in consumer surplus (equal to all the shaded areas), but part
of this welfare gain is a redistribution from the domestic producer (areas A and E) and
government revenue (areas C) to the consumer. The overall impact is positive and large,
marked by the diagonal striped areas (B+D+F+G+H+I+J).
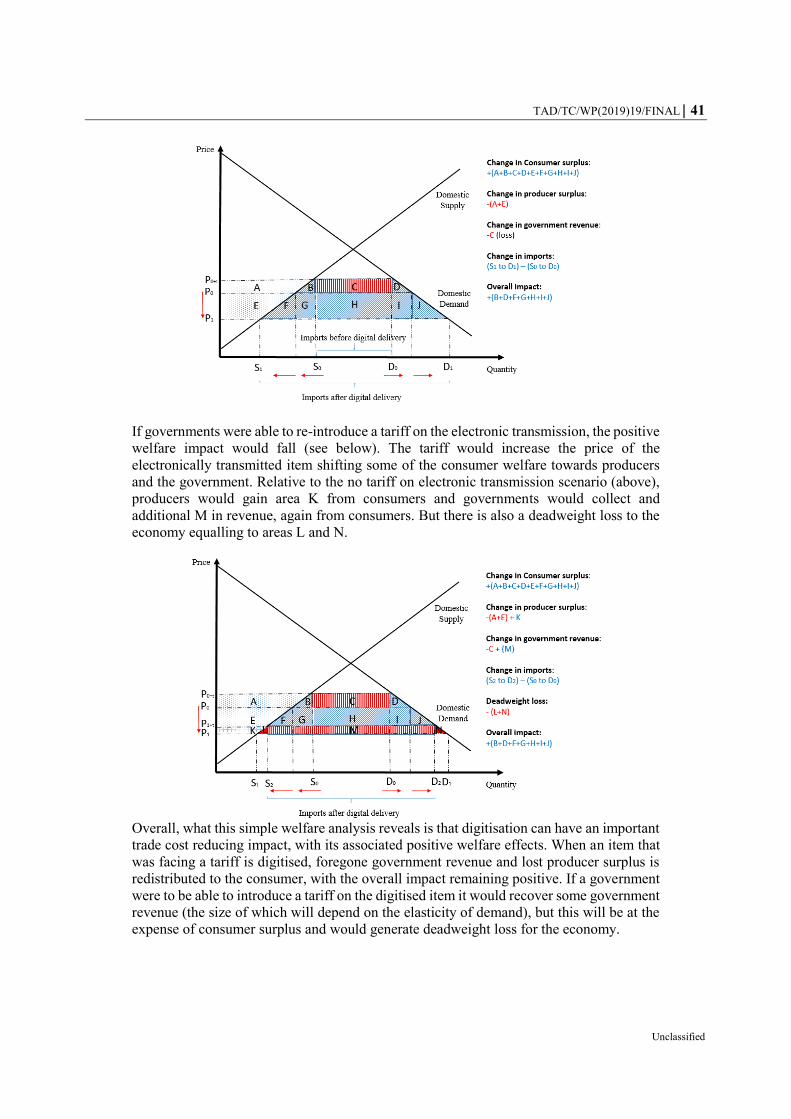
TAD/TC/WP(2019)19/FINAL 41
Unclassified
If governments were able to re-introduce a tariff on the electronic transmission, the positive
welfare impact would fall (see below). The tariff would increase the price of the
electronically transmitted item shifting some of the consumer welfare towards producers
and the government. Relative to the no tariff on electronic transmission scenario (above),
producers would gain area K from consumers and governments would collect and
additional M in revenue, again from consumers. But there is also a deadweight loss to the
economy equalling to areas L and N.
Overall, what this simple welfare analysis reveals is that digitisation can have an important
trade cost reducing impact, with its associated positive welfare effects. When an item that
was facing a tariff is digitised, foregone government revenue and lost producer surplus is
redistributed to the consumer, with the overall impact remaining positive. If a government
were to be able to introduce a tariff on the digitised item it would recover some government
revenue (the size of which will depend on the elasticity of demand), but this will be at the
expense of consumer surplus and would generate deadweight loss for the economy.

42 TAD/TC/WP(2019)19/FINAL
Unclassified
Ultimately, what this means is that customs duties on electronic transmissions will reduce
the benefits associated to digitisation (lowering trade costs), prioritising government
revenue over consumer welfare.
Table A.3. SMART Simulations – tariff reductions on digitisable goods, USD 1 000
Country Year Tariff Revenue Consumer Surplus Net Impact
Albania 2018 - - -
Algeria 2018 -18 279.00 20 510.84 2 231.84
Angola 2018 -7 302.25 8 100.07 797.82
Argentina 2018 -36 453.80 39 235.83 2 782.03
Armenia 2018 -312.16 322.32 10.16
Australia 2018 -8 102.89 8 149.47 46.58
Bangladesh 2016 -47 963.40 62 241.50 14 278.10
Belarus 2018 -3 785.49 3 942.62 157.13
Bolivia 2018 -5 354.98 5 571.00 216.02
Brazil 2018 -42 770.90 52 816.90 10 046.00
Cambodia 2016 -7 754.54 8 029.85 275.31
Canada 2018 -7 432.67 7 477.89 45.22
Chile 2018 -2 342.10 2 361.93 19.83
China 2018 -97 029.60 98 804.85 1 775.25
Colombia 2018 -9 622.59 9 978.91 356.32
Congo, Dem. Rep. 2014 -4 410.58 4 987.14 576.56
Costa Rica 2018 -658.53 665.49 6.96
Cote d'Ivoire 2018 -1 906.49 2 169.98 263.49
Dominican Republic 2018 -6 726.88 6 957.21 230.33
Ecuador 2018 -7 248.76 7 854.88 606.12
Egypt, Arab Rep. 2018 -14 145.70 15 817.83 1 672.13
El Salvador 2018 -2 169.93 2 246.97 77.04
Ethiopia(excludes Eritrea)
2018 -29 642.80 35 810.43 6 167.63
European Union 2018 -3 684.00 3 720.47 36.47
Fiji 2018 -1 639.64 1 773.53 133.89
French Polynesia 2018 -792.33 828.49 36.16
Guatemala 2015 -2 907.59 2 941.79 34.20
Honduras 2018 -1 151.80 1 181.83 30.03
India 2018 -172 188.00 179 575.50 7 387.50
Indonesia 2018 -7 601.75 7 701.60 99.85
Jamaica 2016 -3 030.65 3 242.36 211.71
Japan 2018 -350.60 352.59 1.99
Jordan 2017 -8 726.60 9 343.78 617.18
Kazakhstan 2018 -2 300.34 2 368.88 68.54
Kenya 2018 -5 440.90 5 906.76 465.86
Korea, Rep. 2018 -21 720.20 22 062.46 342.26
Kyrgyz Republic 2018 -517.96 535.73 17.77
Macedonia, FYR 2018 -133.95 135.68 1.72
Madagascar 2018 -5 448.19 5 826.71 378.52
Malawi 2016 -5 922.36 6 197.95 275.59
Malaysia 2016 -20 442.60 21 933.24 1 490.64
Maldives 2018 - - -
Mauritius 2018 -213.06 219.45 6.39
Mexico 2018 -60 597.60 61 956.26 1 358.66
Mongolia 2018 -1 700.73 1 826.63 125.90
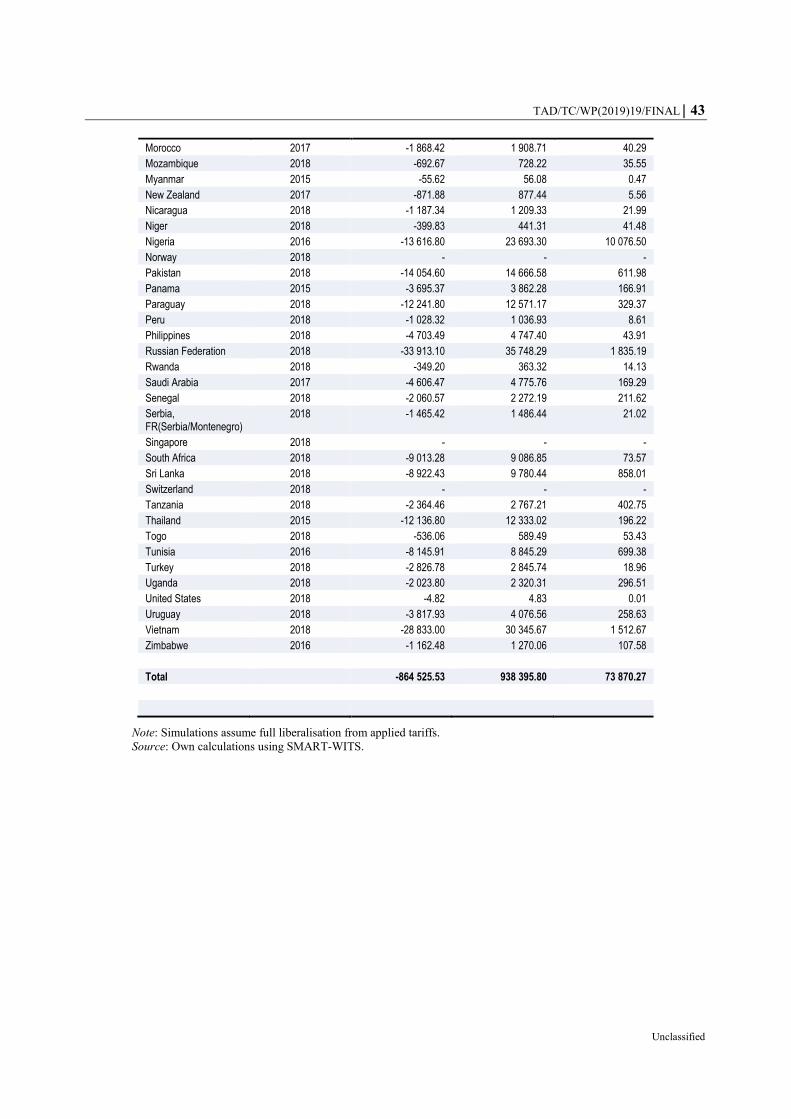
TAD/TC/WP(2019)19/FINAL 43
Unclassified
Morocco 2017 -1 868.42 1 908.71 40.29
Mozambique 2018 -692.67 728.22 35.55
Myanmar 2015 -55.62 56.08 0.47
New Zealand 2017 -871.88 877.44 5.56
Nicaragua 2018 -1 187.34 1 209.33 21.99
Niger 2018 -399.83 441.31 41.48
Nigeria 2016 -13 616.80 23 693.30 10 076.50
Norway 2018 - - -
Pakistan 2018 -14 054.60 14 666.58 611.98
Panama 2015 -3 695.37 3 862.28 166.91
Paraguay 2018 -12 241.80 12 571.17 329.37
Peru 2018 -1 028.32 1 036.93 8.61
Philippines 2018 -4 703.49 4 747.40 43.91
Russian Federation 2018 -33 913.10 35 748.29 1 835.19
Rwanda 2018 -349.20 363.32 14.13
Saudi Arabia 2017 -4 606.47 4 775.76 169.29
Senegal 2018 -2 060.57 2 272.19 211.62
Serbia, FR(Serbia/Montenegro)
2018 -1 465.42 1 486.44 21.02
Singapore 2018 - - -
South Africa 2018 -9 013.28 9 086.85 73.57
Sri Lanka 2018 -8 922.43 9 780.44 858.01
Switzerland 2018 - - -
Tanzania 2018 -2 364.46 2 767.21 402.75
Thailand 2015 -12 136.80 12 333.02 196.22
Togo 2018 -536.06 589.49 53.43
Tunisia 2016 -8 145.91 8 845.29 699.38
Turkey 2018 -2 826.78 2 845.74 18.96
Uganda 2018 -2 023.80 2 320.31 296.51
United States 2018 -4.82 4.83 0.01
Uruguay 2018 -3 817.93 4 076.56 258.63
Vietnam 2018 -28 833.00 30 345.67 1 512.67
Zimbabwe 2016 -1 162.48 1 270.06 107.58
Total -864 525.53 938 395.80 73 870.27
Note: Simulations assume full liberalisation from applied tariffs.
Source: Own calculations using SMART-WITS.
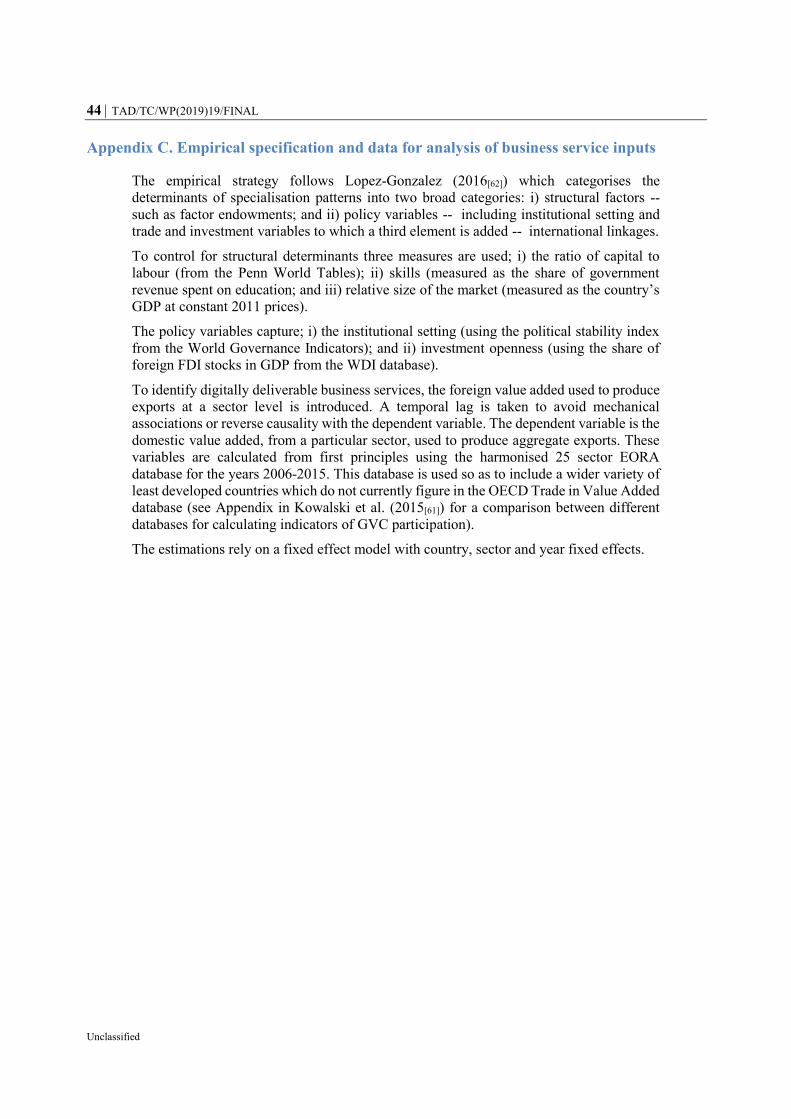
44 TAD/TC/WP(2019)19/FINAL
Unclassified
Appendix C. Empirical specification and data for analysis of business service inputs
The empirical strategy follows Lopez-Gonzalez (2016[62]) which categorises the
determinants of specialisation patterns into two broad categories: i) structural factors --
such as factor endowments; and ii) policy variables -- including institutional setting and
trade and investment variables to which a third element is added -- international linkages.
To control for structural determinants three measures are used; i) the ratio of capital to
labour (from the Penn World Tables); ii) skills (measured as the share of government
revenue spent on education; and iii) relative size of the market (measured as the country’s
GDP at constant 2011 prices).
The policy variables capture; i) the institutional setting (using the political stability index
from the World Governance Indicators); and ii) investment openness (using the share of
foreign FDI stocks in GDP from the WDI database).
To identify digitally deliverable business services, the foreign value added used to produce
exports at a sector level is introduced. A temporal lag is taken to avoid mechanical
associations or reverse causality with the dependent variable. The dependent variable is the
domestic value added, from a particular sector, used to produce aggregate exports. These
variables are calculated from first principles using the harmonised 25 sector EORA
database for the years 2006-2015. This database is used so as to include a wider variety of
least developed countries which do not currently figure in the OECD Trade in Value Added
database (see Appendix in Kowalski et al. (2015[61]) for a comparison between different
databases for calculating indicators of GVC participation).
The estimations rely on a fixed effect model with country, sector and year fixed effects.
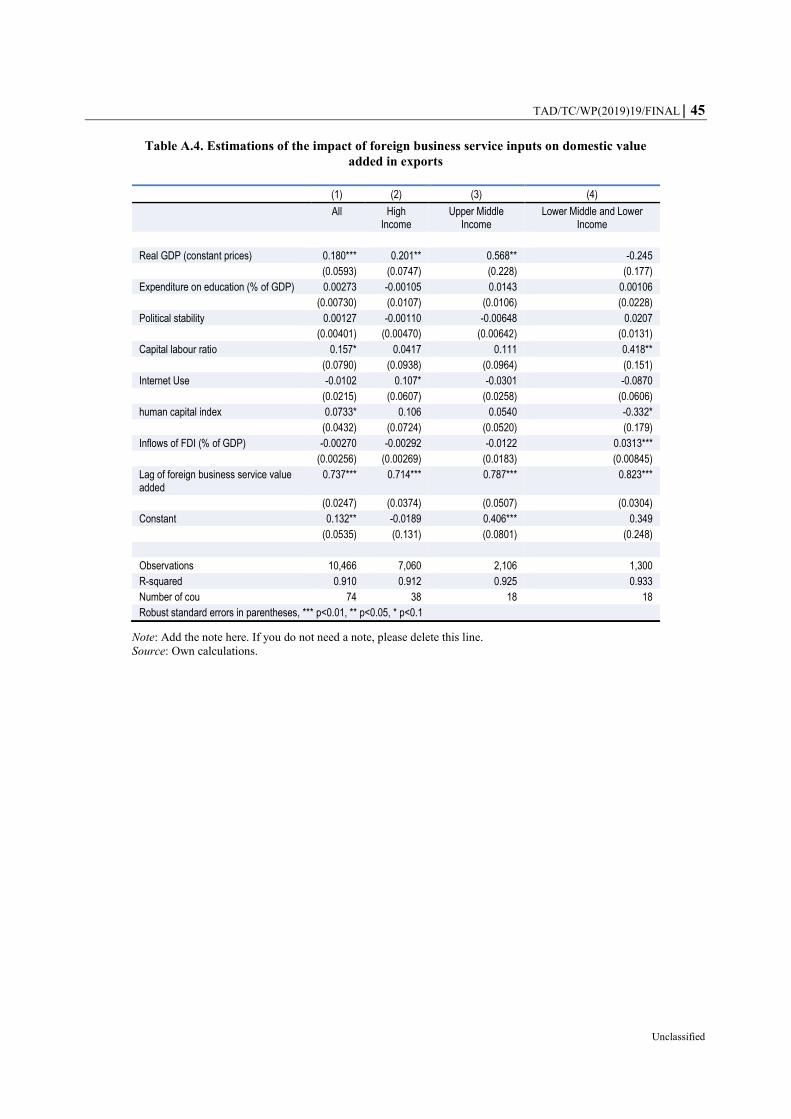
TAD/TC/WP(2019)19/FINAL 45
Unclassified
Table A.4. Estimations of the impact of foreign business service inputs on domestic value
added in exports
(1) (2) (3) (4) All High
Income Upper Middle
Income Lower Middle and Lower
Income
Real GDP (constant prices) 0.180*** 0.201** 0.568** -0.245
(0.0593) (0.0747) (0.228) (0.177)
Expenditure on education (% of GDP) 0.00273 -0.00105 0.0143 0.00106
(0.00730) (0.0107) (0.0106) (0.0228)
Political stability 0.00127 -0.00110 -0.00648 0.0207
(0.00401) (0.00470) (0.00642) (0.0131)
Capital labour ratio 0.157* 0.0417 0.111 0.418**
(0.0790) (0.0938) (0.0964) (0.151)
Internet Use -0.0102 0.107* -0.0301 -0.0870
(0.0215) (0.0607) (0.0258) (0.0606)
human capital index 0.0733* 0.106 0.0540 -0.332*
(0.0432) (0.0724) (0.0520) (0.179)
Inflows of FDI (% of GDP) -0.00270 -0.00292 -0.0122 0.0313***
(0.00256) (0.00269) (0.0183) (0.00845)
Lag of foreign business service value added
0.737*** 0.714*** 0.787*** 0.823***
(0.0247) (0.0374) (0.0507) (0.0304)
Constant 0.132** -0.0189 0.406*** 0.349
(0.0535) (0.131) (0.0801) (0.248)
Observations 10,466 7,060 2,106 1,300
R-squared 0.910 0.912 0.925 0.933
Number of cou 74 38 18 18
Robust standard errors in parentheses, *** p<0.01, ** p<0.05, * p<0.1
Note: Add the note here. If you do not need a note, please delete this line.
Source: Own calculations.
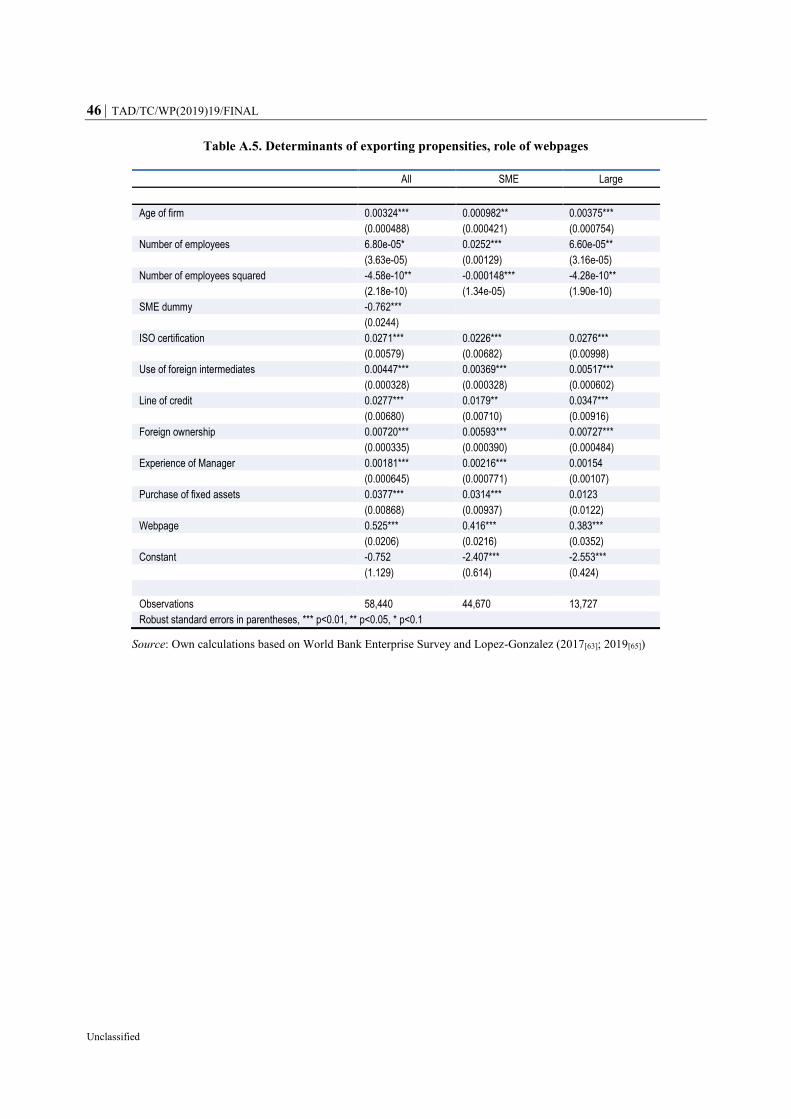
46 TAD/TC/WP(2019)19/FINAL
Unclassified
Table A.5. Determinants of exporting propensities, role of webpages
All SME Large
Age of firm 0.00324*** 0.000982** 0.00375***
(0.000488) (0.000421) (0.000754)
Number of employees 6.80e-05* 0.0252*** 6.60e-05**
(3.63e-05) (0.00129) (3.16e-05)
Number of employees squared -4.58e-10** -0.000148*** -4.28e-10**
(2.18e-10) (1.34e-05) (1.90e-10)
SME dummy -0.762***
(0.0244)
ISO certification 0.0271*** 0.0226*** 0.0276***
(0.00579) (0.00682) (0.00998)
Use of foreign intermediates 0.00447*** 0.00369*** 0.00517***
(0.000328) (0.000328) (0.000602)
Line of credit 0.0277*** 0.0179** 0.0347***
(0.00680) (0.00710) (0.00916)
Foreign ownership 0.00720*** 0.00593*** 0.00727***
(0.000335) (0.000390) (0.000484)
Experience of Manager 0.00181*** 0.00216*** 0.00154
(0.000645) (0.000771) (0.00107)
Purchase of fixed assets 0.0377*** 0.0314*** 0.0123
(0.00868) (0.00937) (0.0122)
Webpage 0.525*** 0.416*** 0.383***
(0.0206) (0.0216) (0.0352)
Constant -0.752 -2.407*** -2.553***
(1.129) (0.614) (0.424)
Observations 58,440 44,670 13,727
Robust standard errors in parentheses, *** p<0.01, ** p<0.05, * p<0.1
Source: Own calculations based on World Bank Enterprise Survey and Lopez-Gonzalez (2017[63]; 2019[65])

TAD/TC/WP(2019)19/FINAL 47
Unclassified
Table A.6. Determinants of exporting propensities, role of digital delivery
VARIABLES All SME Large
Age of firm 0.00282** 0.000536 0.00176
(0.00111) (0.00157) (0.00145)
Number of employees 0.000430*** 0.0310*** 0.000424***
(0.000142) (0.00350) (0.000132)
Number of employees squared -1.73e-08*** -0.000201*** -1.62e-08***
(6.55e-09) (3.69e-05) (6.01e-09)
SME dummy -0.755***
(0.0692)
ISO certification 0.0229 0.00643 0.0454**
(0.0144) (0.0181) (0.0231)
Use of foreign intermediates 0.00234*** 0.00184** 0.00367***
(0.000712) (0.000856) (0.00117)
Line of credit 0.173*** 0.101** 0.238***
(0.0503) (0.0498) (0.0745)
Foreign ownership 0.00841*** 0.0108*** 0.00604***
(0.000808) (0.00118) (0.000971)
Experience of Manager -0.000796 0.000275 -0.00178
(0.00189) (0.00236) (0.00266)
Purchase of fixed assets 0.169*** 0.0825 0.0883
(0.0394) (0.0524) (0.0626)
Use of internet for digital delivery 0.185*** 0.183*** 0.198**
(0.0525) (0.0561) (0.0928)
Constant -1.415*** -3.020*** -1.000***
(0.302) (0.469) (0.149)
Observations 5,230 3,409 1,795
Robust standard errors in parentheses, *** p<0.01, ** p<0.05, * p<0.1
Source: Own calculations based on World Bank Enterprise Survey and Lopez-Gonzalez (2017[63]; 2019[65]).