working together inspiring change plan 2017... · page 4 key drivers for success in developing this...
TRANSCRIPT

Page 1
Working Together Inspiring Change
BCHA GROUP
BUSINESS PLAN 2017-2022

Page 2

Page 3
EXECUTIVE SUMMARY Contents This Business Plan contains three main sections:
Operating Context (page 5) which outlines our current business activities and
the risks and trends within our social and political environment.
Corporate Objectives (page 15) which outlines our 12 priorities and targets
for the next 5 years.
Financial Plan (page 34) which sets out our view of our financial performance
for the next 5 years, including the impact of adverse scenarios (stress tests).
There are also a number of appendices providing information on our SWOT analysis, senior management structure, risk appetite, actions for Year One of the Plan and baseline performance. Mission Our Mission is to help people take control of their own lives. Wherever people feel vulnerable or don’t know where to turn, we equip them to find a way forward by offering the highest standards of support for housing, health, learning and work. Vision Our Vision is “Working together: Building better lives, better homes and better communities.” Values BCHA operates to a framework of ethical values which are: 1. Personal integrity 2. The importance of every individual 3. Outstanding service to people 4. The importance of working together 5. Professional competence Behaviours Accompanying our values are a number of behaviours, developed by the staff team: 1. Taking Pride and ownership in all I do 2. Being reliable and responsible 3. Encouraging initiative and creativity 4. Recognising and complimenting good work 5. Ensuring the person in front of me knows they are important 6. Having an attitude of achievement 7. Talking to each other and not about each other 8. Saying thank you

Page 4
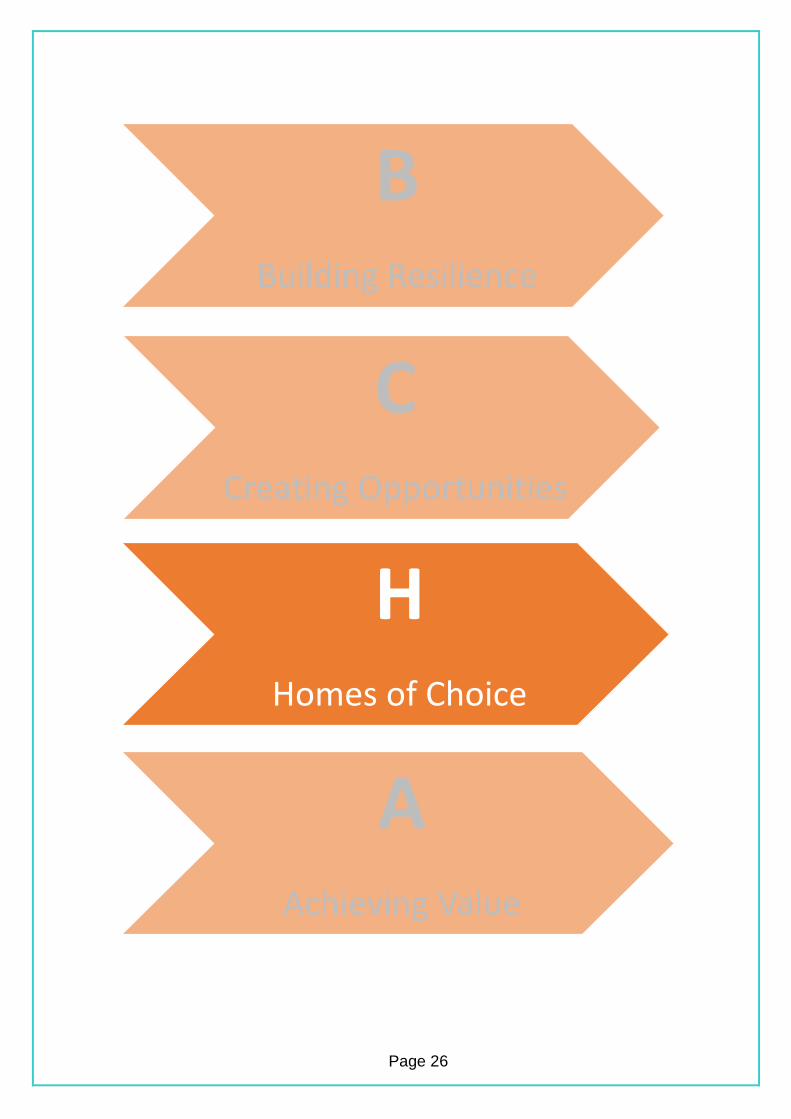
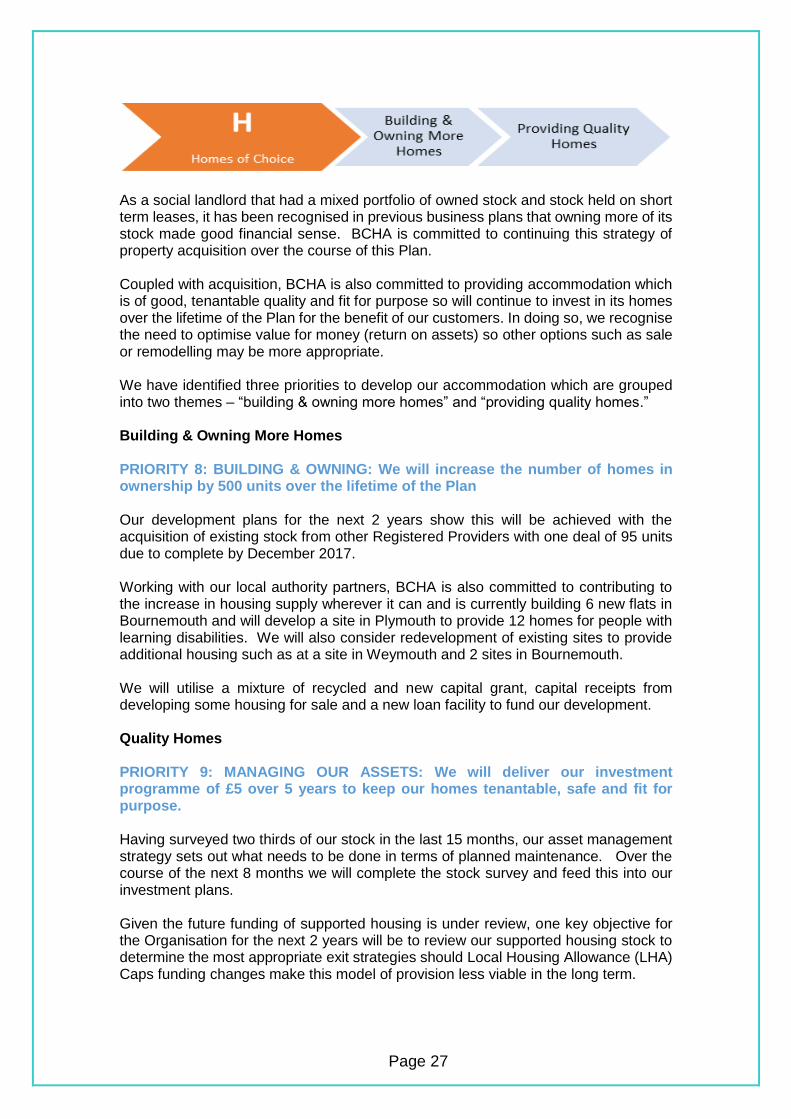
Key Drivers for Success In developing this business plan, the Board established that there were four key strategic issues underpinning the Business Plan. These issues are threads running through all business objectives. 1. Developing a Broader Business Model; Protecting the Income 2. Making sure we deliver Excellent Outcomes for Customers 3. Embedding a culture of Efficiency & Learning 4. Seeking Strategic Alliances with other organisations to deliver our objectives Strategic Themes In developing the Business Plan through a process of staff engagement in late 2016 and from further consideration by the Senior Leadership Team and Board in 2017, four overarching strategic themes were identified for the Plan. These themes are the blocks coloured orange. Within each theme, we have grouped our 12 corporate objectives (“priorities”) into sub-themes – the blocks coloured grey. This diagram is a useful visual summary of our Business Plan which is replicated throughout this document. The 12 priorities are described more fully, including targets assigned to them, in the Corporate Objectives section commencing on page 15. Baseline performance information, where applicable, is contained within Appendix 5.
B
Building Resilience
Promoting Inclusion
Inspiring Change
C
Creating Opportunities
Developing Communities
Developing Enterprise
H
Homes of Choice
Building & Owning More
Homes
Providing Quality Homes
A
Achieving Value
Excellent People
Efficiency & Quality

Page 5
OPERATING
CONTEXT

Page 6
1. INTRODUCTION Many business plans are published with little reference to an organisation’s history. This business plan coincides with a significant milestone….BCHA will be 50 years old in 2018. The organisation was founded on March 7th 1968 and was one of many housing organisations formed in response to the housing crisis highlighted in ‘Cathy Come Home’, a BBC play directed by Ken Loach, that was first screened on BBC1 in 1966. The drama highlighted the plight of a homeless family which led to a public outcry about the problem of homelessness in Britain. Up and down the country people came together to form housing associations in their communities, often in partnership with their local churches, to make a difference and provide homes for homeless people. So it was that BCHA came into being in 1968. 50 years on, homelessness and the lack of affordable housing are still major issues in the UK. As a society, we need more homes built of all types for people to buy as well as social and affordable rents. As a housing provider, BCHA also needs to continue to raise awareness amongst both the public and policy makers about homelessness, how these issues can affect people from all walks of life and the difference that even modest funding for services can make to the lives of those who find themselves without a home. This latest Business Plan, working within a context that has rarely been more challenging for housing associations, aims to make its contribution towards these necessary goals. We strike an optimistic vision for the coming five years of “working together – building better lives, better homes and better communities”. We look forward to working with you to begin this journey.

Page 7
2. GROUP & LEGAL STRUCTURE BCHA is an exempt charity registered under the Cooperative and Community Benefit Societies Act 2014 as well as a provider of social housing, registered with the Homes & Communities Agency (HCA). BCHA currently has five subsidiaries, none of which is registered with the HCA and each with its own board. A review of the structure completed in early 2017 will collapse this down to four subsidiaries by 2018 in order to create a more effective and streamlined Group. All subsidiaries align their business strategies and activity with this Plan and generate both a level of contribution to the Group as well as a surplus.
NB: Hyped BCHA, a dormant charity, has not been included in this chart.
3. GOVERNANCE & EXECUTIVE MANAGEMENT BCHA’s Board comprises 12 members; the majority are elected by shareholders at AGM’s. Although serving in a voluntary capacity, Board members possess a balance of skills and experience from public and private sectors. On its latest self-assessment, BCHA complies fully with its chosen Code of Governance and with the HCA’s Governance and Viability Standard (G2V2). The Senior Leadership Team (SLT) comprises the Chief Executive, 2 Directors, 3 Assistant Directors and 4 Heads of Service. A structure chart is in Appendix 2. 4. GROUP PROFILE at 31 March 2017
BCHA
New LeafSocial Enterprise Trading Company
Salisbury Trust for the Homeless
Salisbury-based homeless charity
Recoop
Charity working with older offenders
KeystoneWinchester-based homeless charity
1746homes
managed
of which,
55%homes owned
FTE Staff
295
Turnover
£20.7Mestimated year end position as accounts
unaudited at publication of Plan

Page 8
5. GROUP PROPERTY RENTAL PORTFOLIO at 31 MARCH 2017
Note: there were an additional 55 units owned but not in BCHA management and 12 owned units awaiting development at 31/3/2017.

Page 9
6. PROVISION OF COMMISSIONED SERVICES BCHA receives just under £6M pa from a range of commissioning sources to provide services to vulnerable people, with 80% being traditional housing-related support.
The £5.97M revenue excludes £346k (annualised) for contracts due to be decommissioned by 31 July 2017.
31%
5%3%
14%16%
11%
1%
15%4%
CONTRACT & GRANT REVENUE BY AREA AT 01-04-2017
Bournemouth
Devon
Dorset
Pan Dorset
Plymouth
Poole
Reading
SW Region
42.3%
20.6%
15.7%
16.0%
5.4%
CONTRACT & GRANT REVENUE BY DELIVERY TYPE AT 01-04-2017
Accom based
Community based
Mixed
Programme
Institution
7.1%
16.8%
1.6%
12.8%
7.7%27.0%
9.3%
17.7%
CONTRACT & GRANT REVENUE BY CUSTOMER GROUP AT 01-04-2017
Domestic Abuse
Generic
Jobseekers
Mental Health
Offenders
Single Homeless
Trafficked Victims
Young People

Page 10
7. MARKET ANALYSIS Rental Accommodation Demand & Competition BCHA works in areas where the provision of social housing is relatively low. As a larger provider of single persons’ and supported accommodation, there is little impact of the “Bedroom Tax” in relation to demand for family housing. Demand overall is good with losses from general needs properties being void (between tenants) improving from 1.9% of rental income in 2014/15 to 1.7% at the end March 2017. As a registered provider, we are not in direct competition with other larger providers given our specialism in supported housing. There is potential, though not strong, competition from larger private landlords in some conurbations such as Bournemouth particularly those with active building and refurbishment programmes. Local authorities also represent competition to housing supply and by providing services that were previously outsourced or traditionally provided by third parties. Customer Support Demand & Competition Centralised referral systems are in place in most commissioning areas, meaning regular ongoing tracking of demand. Void loss from empty bedspaces has fallen over the last three years from 8.7% of rent income in 2014/15 to 7.1% at the end of March 2017. As support provider, where margins are tight, keen competition comes from one of three sources – small, well-established local charities, larger national/specialist charities and organisations that can work across regions. Employment & Skills Programmes Demand & Competition BCHA currently provides a number of services for jobseekers and other people who want to improve their skills and confidence to improve their chances of obtaining voluntary or paid work. We also are a sub-contractor for the National Citizen Service a social development programme for young people aged 15-17. All programmes have steady referrals and, with a government focus on tackling long term unemployment, there are no indications this is set to change in the future as many of our residents will require active assistance to support them into employment. Competitor profile is similar to that for Customer Support although commissioning does tend to be sub-regional, favouring larger, prime contractors.

Page 11
8. OPERATING ENVIRONMENT – KEY ISSUES There are five key issues which will have a strong influence on the organisation over the foreseeable course of the Business Plan – each dealt with below. (1) Demographics & Social Need According to the ONS National Population Projections, the UK population will increase to 70 million by 2026, 62% due to natural growth and 38% due to net migration. In regional terms, the population of the SE is set to grow by 3.9% over the period 2017-22, and the SW by 3.4% over the same period [ONS Region and Country Profiles]. 20.2% of the population will be over 65 in 2025 (up from 17.8% in 2015) – the proportion of working age adults and children (15 years or younger) both falling. Black & Minority Ethnic (all categories other than White) populations in BCHA’s geography range from 2% (South Somerset) to 25% (Reading) against a SW average of 5% and a SE average of 10%. Census 2011 Housing & Homelessness
Social housing forms a low proportion of stock across our area of operations (and is similar to the England average of 17%) although Plymouth has the highest social rented stock at 20% CLG Number dwellings by tenure and district 2015. Bournemouth notably has a very low percentage of social rented dwellings (10%) but a large private rented sector (30% of dwellings, compared with 20% for England) 2011 Census.
First time buyer house price to earnings ratios continue to demonstrate an increasing affordability problem. At Dec 2016 the ratio was 5.9 for the SW and 6.1 for the Outer SE. Nationwide Building Society.
Trends in Homelessness applications across our geography show wide variation over the period 2014-16 with significant increases in Bournemouth and Portsmouth (247% and 125% respectively) and reductions in Wiltshire and South Somerset (34% and 27% respectively). The acceptance rate changed most notably in Bournemouth with 51% of applications accepted as homeless in 2016, up from 25% in 2014. Most partner authorities report reductions in the proportions of applications deemed intentionally homeless or non-priority need over this period. Department for Communities and Local Government.
Rough sleeping is on the increase, rising by 16% in England between 2015 and 2016. Exeter, Bournemouth and Portsmouth all feature within the highest counts in the South (excluding London). Department for Communities and Local Government
Homeless Link, using Health Needs Audits of 3,355 homeless people in England, report that 86% of respondents report a mental health issue, 78% a physical health problem, 41% drug misuse and 27% alcohol misuse. www.homelesslink.org.uk
Homeless Link further estimates that 38% of individuals in homelessness services have “complex needs” i.e. multiple needs which impact on each other.
Economic Activity & Skills
Unemployment rates for economically active adults aged 16-64 are below the national average of 4.7% (3.7% in the SW – trend reducing - and 3.5% in the SE – trend static). The national rate of unemployment for 16-24 year olds was 12.5% for the southern regions, trend reducing. Regional Labour Market Statistics March 2017, ONS.

Page 12
The economically inactive population (long term sick, students, and those looking after family) forms about 1 in 5 of the population in England (18.8% in the SW and 18.6% in the SE). Regional Labour Market Statistics Mar 2017, ONS.
1 in 5 working age adults lack any qualifications, but this is much lower in BCHA’s geography - ranging from 14.3% (Plymouth) to 8% (Winchester). Census 2011.
The latest CBI/Pearson Survey of British Business (July 2016) identifies that a high percentage of employers expect opportunities for low skilled workers to at best remain static.
Deprivation
Typically 1 in 4 households in England is designated as deprived in more than one dimension (housing, health, education and economic activity) with the North and London experiencing the worst levels. In BCHA’s geography, only Portsmouth and Plymouth are in the 50% most deprived top tier authorities at number 55 and 42 respectively. Indices of Deprivation 2015 – proportion of LSOA’s in top 10% of most deprived nationally.
Of the 13.5 million people designated as being in poverty, 55% are members of a working family (in the SW the figure is 60%). 3.8 million adults are working poor. New Policy Institute (JRF) Monitoring Poverty & Social Exclusion 2016.
Health
Over 10 million people (Just under 1 in 5) in England stated their health or disability limited their daily activities to some degree. The southern regions have lower proportions than the national average. Census 2011.
1 in 4 people in the UK will experience some form of mental ill health each year – depression and anxiety being the most common. Health and Social Care Information Centre,
the 2014 Health survey for England Numbers of people receiving Addiction Treatment Services have fallen steadily
since 2008 with the largest categories of use being opiates and alcohol. Adult
Substance Misuse Statistics from NDTMS 2015/16
There are around 800,000 people with dementia in the UK. By 2040, the number of people affected is expected to double - and the costs are likely to treble.
1 in 12 adults (16-59) and 1 in 5 young people admit to having taken drugs in the last year with trends decreasing. Home Office Drug Misuse: Findings from Crime Survey for England
& Wales 2015/16.
Social Trends
Social Media has mainstreamed. 60% of people in UK having a Facebook account; Instagram has 14 million UK users, with a skew towards a younger and more female user group. Twitter has 15 million UK users (80% are active on mobile devices). LinkedIn has 15 million users – 75% of users are aged over 35 and 79% are male. Avocadosocial.com
Surveys show that the growth in mobile technology is shaping customer behaviour towards instantaneous access, flexible, tailored services and increased competition for custom. Altair Ltd “Future Gazing, Future Shaping” 2016
Proposed Responses These statistics confirm the rationale for our range of services now and into the future, particularly by assisting people into the jobs market. In relation to the ageing population, it is not our intention to enter in the extra care market due to the extensive provision already available. However, we will need to consider how older residents can stay longer in their homes with wrap around care services. Services will need to

Page 13
become more flexible and delivered in more innovative ways in response to funding changes, the rise of technology and customer expectations. (2) National Policy This Business Plan was developed in the context of political developments in late 2016, early 2017, with a general election taking place in June 2017. The legislative programme contained the Homelessness Reduction Bill (improving rights for homeless people), the Housing White Paper (committing to boosting housing supply through a number of measures) and the Prisons and Courts Bill (introducing major reforms to prison administration and rehabilitation of offenders). It is not clear how the election will affect this programme. In addition, the review of the future funding of supported housing poses a significant threat to BCHA in the next two years and the uncertainty of the outcome of the UK’s withdrawal from the European Union may pose wider risks to the economy. Proposed Responses
Monitoring policy developments once the election has taken place and the new government is formed and assessing impacts on the Organisation.
Profiling and impact analysis of any proposed changes on our customers Campaigning directly or in concert with umbrella bodies such as Homeless Link to
influence policy-makers locally and nationally. (3) Welfare Reform As a large provider of single persons’ accommodation and accommodation which has been granted exemption from Universal Credit, the impact of Welfare Reform on BCHA has been less than for other associations. We estimate that only 1.5% of our residents have been affected by the benefits cap and just 7% affected by the “bedroom tax”. However, our biggest exposures are: JSA sanctions (particularly for young people) and the requirement for working age claimants to pay a proportion of Council Tax. Both severely impact on the ability of residents to pay rent. As there is unlikely to be a change of Government following the general election in 2017, current policy on reducing expenditure on welfare benefits will continue. Three areas posing risk for BCHA are (a) whether exempt status in relation to Universal Credit will remain into the medium term and (b) the acquisition of more general needs stock which is not exempt from Universal Credit (c) caps on rent allowances, particularly supported housing. Proposed Responses
Further improving rent collection and void turnaround Providing money advice, financial capability and digital inclusion services Looking to concentrate activity for particular customer groups in areas where
Welfare regulations are interpreted liberally Ensuring customers transitioning to work are supported to avoid financial hardship.
(4) Commissioning Landscape Many local authorities continue to implement significant cuts to their Adult Social Care budgets. BCHA was to some extent insulated from this as its partner authorities have only made modest spending reductions in preventative services. It is clear this is now

Page 14
changing and so we will need to continue to spread risk by concentrating our activities in our core areas and seeking new revenue streams from these bases. We also know that Payment By Results (PBR) contracts (of which we have experience mainly through employability and skills contracts) are likely to become more prevalent in public commissioning.
Proposed Responses
Diversifying into new markets. The new commissioning environments in health and probation and commercial offers are all potential opportunities
Use our experience of service delivery to influence how services are commissioned to increase effectiveness and reduce financial risk
Ensure our cash flow forecasts for PBR are extremely accurate and sensitivity tested to reduce exposures. Our risk appetite on PBR is “balanced” and we would seek to limit these types of contract.
(5) Social Housing Regulation Recent years have seen significant changes to the regulation of the sector ostensibly with a lighter touch environment. However, the HCA has three current areas of focus:
How providers identify and mitigate risk, particularly to social housing assets from non-social housing activities and a poor understanding of liabilities
How providers demonstrate value for money clearly to all stakeholders Whether providers are causing serious detriment to residents by poor stock
maintenance practices. Proposed Responses The Organisation commissioned an independent review of governance arrangements in 2016 and implemented a number of recommendations over the period to March 2017 to strengthen the organisation. BCHA will continue to review its practices from time to time over the lifetime of the Business Plan to ensure ongoing best practice and will utilise external expertise, as required in order to receive the highest governance grading (G1) from the Regulator.

Page 15
CORPORATE STRATEGY

Page 16
9. STRATEGIC ASSUMPTIONS The Board has agreed the following assumptions underpinning the Plan to 2022.
BCHA remains independent but collaboration with others is critical to our mission. Threats to income now cover both rent (statutory 1% reduction introduced in 2016
and welfare reforms) and revenue contracts (less commissioning) meaning there has to be a greater focus on diversifying income streams and controlling cost.
Property assets still remain a good investment in our area. Social need is still increasing and getting more complex. The “working poor” and
“just about managing” are now being increasingly recognized by government. Whilst interest rates remain low, there is still a degree of economic uncertainty,
particularly in relation to the UK’s impending withdrawal from the European Union. 10. KEY DRIVERS The following drivers are critical to the success of the Business Plan and need to be embedded at all levels of the organisation. Broader Business Model; Protecting Our Income – whilst continuing our commitment to helping those in greatest need in society we must ensure our financial strength by seeking a wider range of income sources to provide services and minimise risk. We must also seek to protect income through greater focus on maximising income collection (e.g. by minimising voids) and on stronger awareness of cost and waste Excellent Outcomes for Customers – not just doing the job, but doing it well. Aspiring to offer great service, going the extra mile to ensure satisfied customers and maximising value. Efficiency & Learning– there are many challenges facing us and we need to be able to plan for and adapt to these challenges in order to thrive as a business and continue our mission. Flexibility requires creativity and resilience, a preparedness to keep on learning and a keen focus on keeping costs down. Strategic Alliances - Working with others increases our capacity to do our job well, recognising more can be achieved with others than on our own. Alliances with specialist or larger organisations can complement what we do. Alternatively, mergers with similar-sized or smaller organisations can strengthen our assets and services and allow us to build more homes. 11. RISK APPETITE The Board has agreed a risk appetite where “BCHA seeks to work with disadvantaged individuals and families by providing accommodation, support and learning. In pursuance of its mission and strategic objectives, BCHA will operate across a spectrum of appetite for risk. The Organisation’s lowest risk appetite relates to safety, safeguarding and legal compliance; a cautious risk appetite is taken towards sustaining financial viability to keep the business strong thereby ensuring liquidity and protecting its social housing assets from undue risk. A balanced to moderate risk appetite is taken for stock investment and growth as well as new business, whether accommodation-based or not, provided that this does not compromise stated financial and performance targets.” The full appetite is contained within the appendices.

Page 17
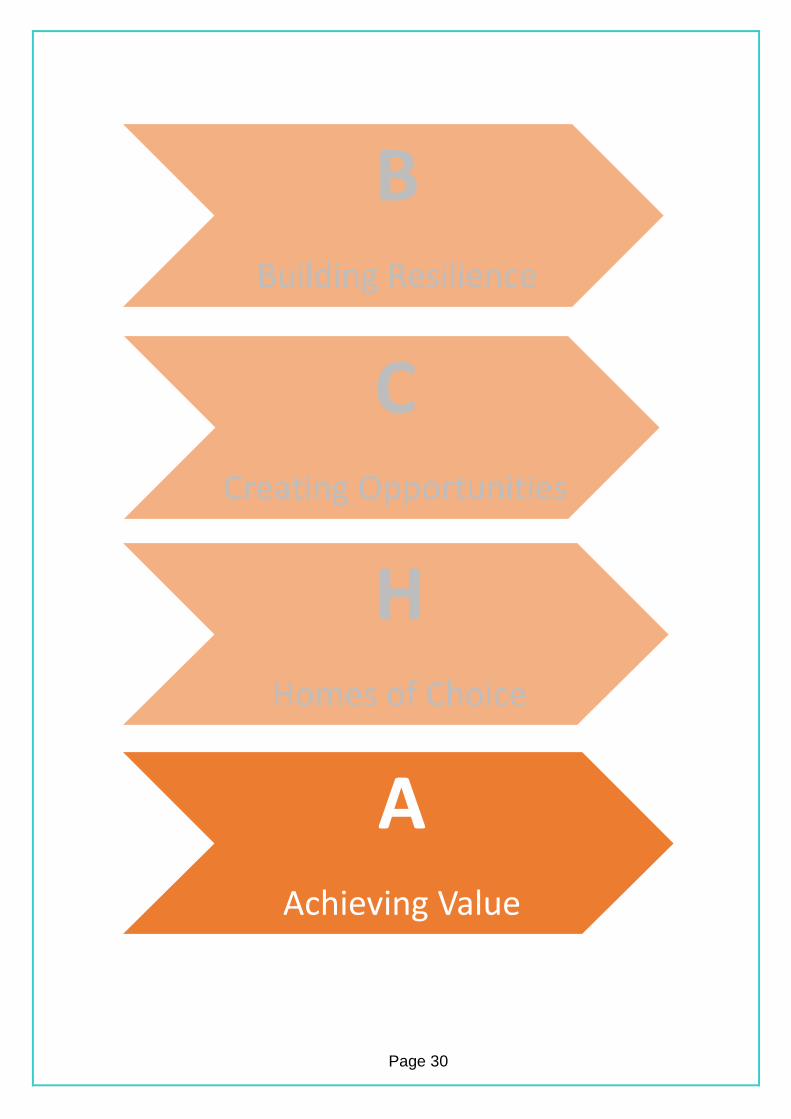
12. OBJECTIVES The Plan has four broad themes which best summarise our strategic direction: Building Resilience – equipping our customers with the skills, confidence and opportunities they need to maximise their chances of finding and sustaining a home and work and become fully included and accepted in society. Creating Opportunities – seeking to grow the range of services we provide across our geography to fulfil or support our mission. Homes of Choice - expanding the number of homes we own and ensuring that all of the stock we manage is of a high quality. Achieving Value – ensuring we have the people and financial resources to deliver the Business Plan efficiently and effectively. Objectives listed are broad ones spanning the duration of the Business Plan and will require further review by the Board should the operating environment change. Each year, an action plan will be developed and approved by the Board in relation to implementing activities underpinning each objective.
BBuilding Resilience
Promoting Inclusion
Inspiring Change
CCreating Opportunities
Developing Communities
Developing Enterprise
HHomes of Choice
Building & Owning More
Homes
Providing Quality Homes
AAchieving Value
Excellent People
Efficiency & Quality
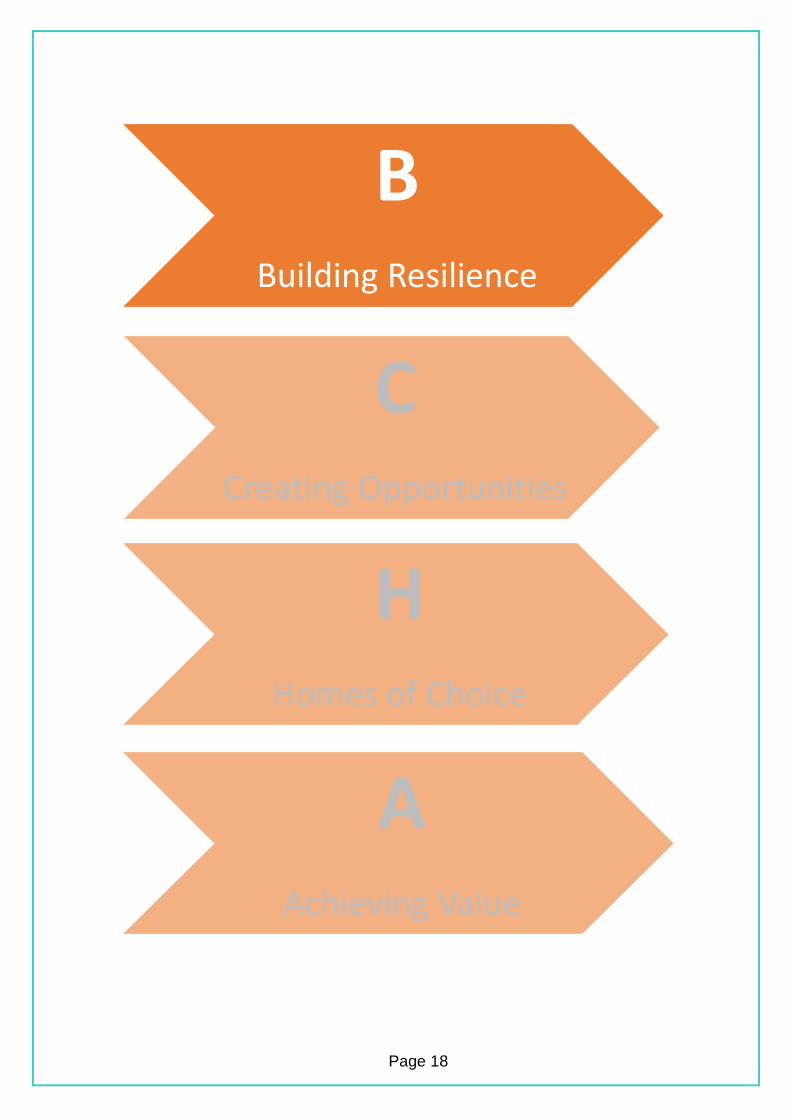
Page 18
BBuilding Resilience
CCreating Opportunities
HHomes of Choice
AAchieving Value

Page 19
Our customers face pretty significant challenges over coming years. The benefits system is undergoing major reform to encourage more people into work and will also require a high degree of self-reliance, even for some of the most vulnerable in society. Technology is changing at a rapid pace with more and more services, including those provided by government, becoming available on-line. The prevalence of more people with complex needs means the support our customers need is now greater than ever. It is for these reasons that BCHA believes it must continue to develop a range of solutions to ensure the most vulnerable in society are not left behind but are supported and encouraged to have the skills, confidence and resilience to manage these challenges as they get on with their lives. We have identified four priorities to help our customers which are grouped into two themes – “promoting inclusion” and “inspiring change.” Promoting Inclusion PRIORITY 1: FINANCIAL WELLBEING: We will develop a range of early intervention support to assist our customers with maintaining financial wellbeing and sustaining their tenancies. This will mean mapping services in our areas of operation to external support agencies to complement our work and enable customers to better self-manage on exiting our services. Developing customer profiling with our new Housing Management software will enable us to better target those most of risk of financial stress. PRIORITY 2: DIGITAL SERVICE: We will develop our on-line presence so that customers can access our housing or support services wherever they want, whenever they want. This will mean rolling out the Customer Portal within our new Housing Management software to enable customers to access rent account and repairs information. We will also need to explore funding opportunities to install wi-fi in our main accommodation services and consider innovative ways of providing lifeskills and crisis support on-line (e.g. through use of video or links to other guidance). As it is more cost-effective to transact on-line, we will look at incentives to encourage customers to do so. Inspiring Change
PRIORITY 3: BETTER OUTCOMES: We will seek to improve customer outcomes in our support services through application of the Psychologically Informed Environments (“Inspiring Change”) approach. In practice, this will entail the full implementation of the Inspiring Change Framework which comprises the five PIE standards. Initiatives will include investment in supported accommodation to ensure this is at the required standard, development of staff training and better sharing of “what works” across the organisation.

Page 20
PRIORITY 4: EMPLOYABILITY & SKILLS: We will build on the Employability and Skills services we currently provide and develop an offer for general needs customers and those in supported housing. First by undertaking research, we will understand the barriers into employment and be able to develop an effective strategy and an offer for our housing customers. This will mean Employability & Skills staff to work alongside housing officers and support workers to help customers build their confidence, motivation and skills to become work-ready. These posts may be funded through contracts commissioned by statutory partners and/or by internal investment
We plan to support 600 job outcomes over the lifetime of the Plan, half of which will be within current learning and work services and the remaining half amongst our accommodation-based customers.
Psychologically Informed Environments in Services for Homeless People – Good Practice Guide 2012 [Communities & Local Government, Southampton University et al]

Page 21
BUILDING RESILIENCE: Success Targets for 2022
See appendix 5 for baseline performance
•Current tenant arrears: <1.5%
•Former tenant arrears: <2%
•Planned exits from accommodation: 80%
•Financial Inclusion Officers: £2 return for each £1 salary cost
Financial Wellbeing
•75% of Customers transact online
•90% Customer satisfaction with chosen form of engagement
•Wi-fi access in all building-based services
Digital Service
•All supported housing & health services improve outcomes on 2016/17 baseline
•All Supported Housing at "Inspiring Change" Standard
Better Outcomes
•At least 600 Customers are supported to enter some form of paid work over the life of the Plan (half through existing services)
•At least 50% of accommodation-based Customers enhance their practical skills or qualifications each year
Employability & Skills

Page 22
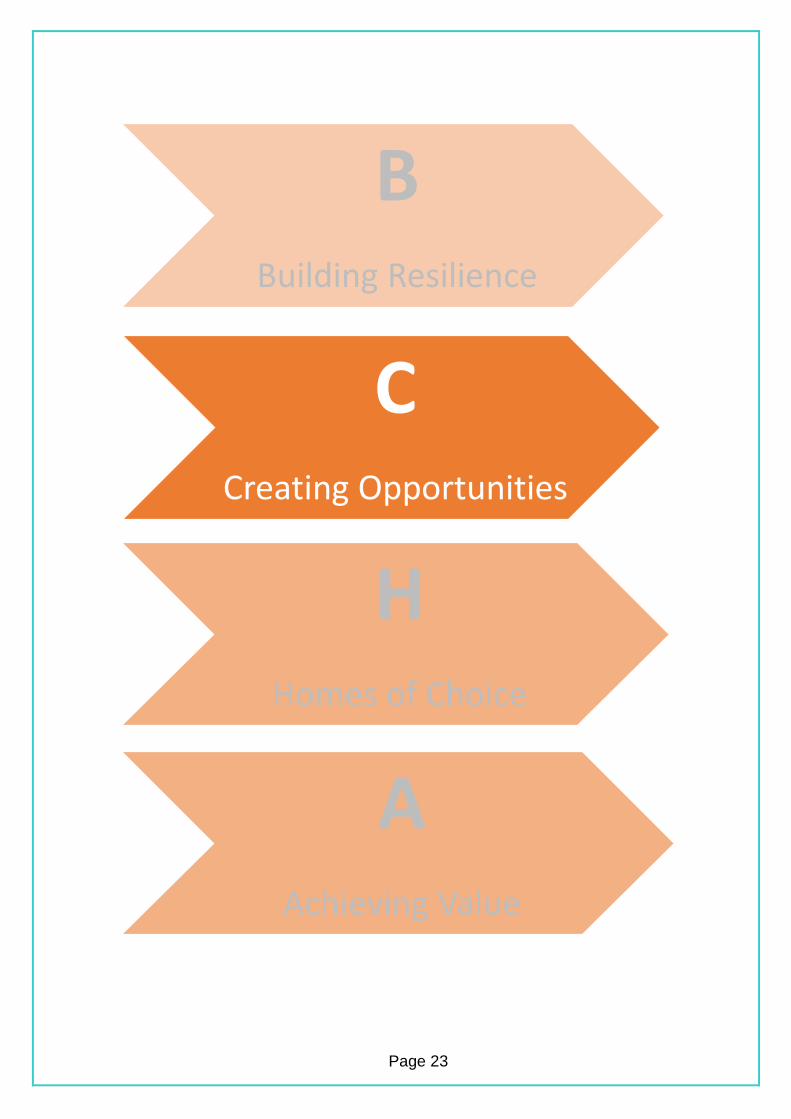
Page 23
BBuilding Resilience
CCreating Opportunities
HHomes of Choice
AAchieving Value

Page 24
BCHA prides itself on providing a wide range of services for some of the most vulnerable people in society. The funding we have traditionally relied upon will become scarcer. Our goal is to develop more flexible solutions across the South so we can continue our vital mission. We are keen to enter other commissioning arenas – notably Health and Probation. To that end, we will focus more on activity locality by locality and have recently restructured some of our operations to better achieve this. In addition, we have increasingly recognised the potential of generating unrestricted income to further support our mission. In 2014, we acquired a former Remploy factory (now simply “The Factory”) and have piloted a number of social and community enterprises which is something we would like to strengthen with the recent appointment of a new senior manager with expertise in this area. We have identified three priorities to grow our business which are grouped into two themes – “developing communities” and “developing enterprises.” Developing Communities PRIORITY 5: STRONG SERVICES: We will implement the new Care and Support Strategy which will focus on protecting existing contract income This will be achieved through implementation of Area Plans and will focus on retaining existing contracts (where these provide a net contribution to the organisation) and seeking new business in our core areas. Commissioning strategies in these areas have identified priorities such as more community based services (especially for older people), reducing homeless and rough sleeping, mental health and complex needs provision, young offenders, looked after children/children leaving care. PRIORITY 6: NEW PATHWAYS: We will seek to work in partnership with the Health and Social Care sectors to provide services for unmet needs. In the short-term we will need to demonstrate health outcomes in our current service offers to better understand how we can support health commissioners to meet their strategic priorities. Areas that we see as potential ones to attract funding are: end of life support for homeless people with chronic conditions, reablement services for hospitals and domiciliary support with care services for self funders. Developing Enterprise PRIORITY 7: DEVELOPING ENTERPRISE: We will seek to reinvigorate the Factory as a profitable social enterprise hub. In practice, our strategy will be to become a community development body which will seek to attract and incubate starter businesses looking for workspace and business support, specific to their needs. We will also seek to develop social enterprises targeted at benefiting our existing customers – for example through skills development or food/healthy eating services. Profits generated will then be reinvested in BCHA’s front-line services such as additional Financial Inclusion and Employability and Skills roles identified in the Building Resilience section.
Page 25
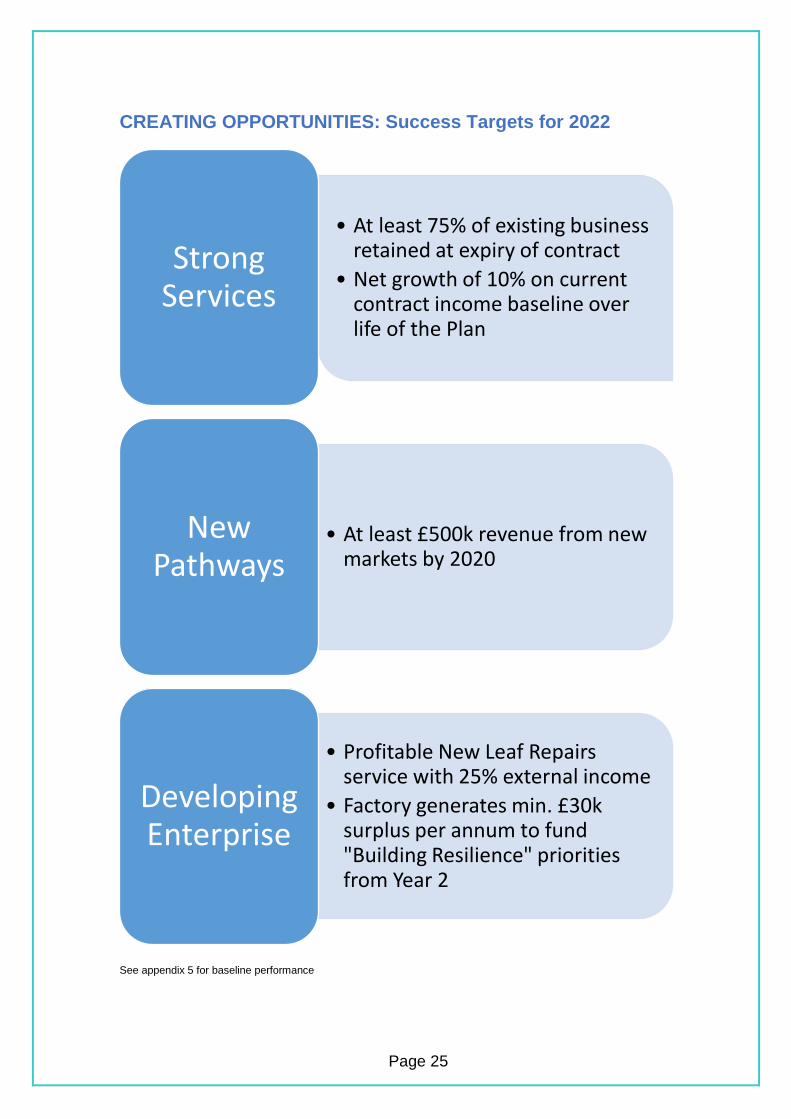
CREATING OPPORTUNITIES: Success Targets for 2022
See appendix 5 for baseline performance
• At least 75% of existing business retained at expiry of contract
• Net growth of 10% on current contract income baseline over life of the Plan
Strong Services
• At least £500k revenue from new markets by 2020
New Pathways
• Profitable New Leaf Repairs service with 25% external income
• Factory generates min. £30k surplus per annum to fund "Building Resilience" priorities from Year 2
Developing Enterprise
Page 26
BBuilding Resilience
CCreating Opportunities
HHomes of Choice
AAchieving Value
Page 27
As a social landlord that had a mixed portfolio of owned stock and stock held on short term leases, it has been recognised in previous business plans that owning more of its stock made good financial sense. BCHA is committed to continuing this strategy of property acquisition over the course of this Plan. Coupled with acquisition, BCHA is also committed to providing accommodation which is of good, tenantable quality and fit for purpose so will continue to invest in its homes over the lifetime of the Plan for the benefit of our customers. In doing so, we recognise the need to optimise value for money (return on assets) so other options such as sale or remodelling may be more appropriate. We have identified three priorities to develop our accommodation which are grouped into two themes – “building & owning more homes” and “providing quality homes.” Building & Owning More Homes PRIORITY 8: BUILDING & OWNING: We will increase the number of homes in ownership by 500 units over the lifetime of the Plan Our development plans for the next 2 years show this will be achieved with the acquisition of existing stock from other Registered Providers with one deal of 95 units due to complete by December 2017. Working with our local authority partners, BCHA is also committed to contributing to the increase in housing supply wherever it can and is currently building 6 new flats in Bournemouth and will develop a site in Plymouth to provide 12 homes for people with learning disabilities. We will also consider redevelopment of existing sites to provide additional housing such as at a site in Weymouth and 2 sites in Bournemouth. We will utilise a mixture of recycled and new capital grant, capital receipts from developing some housing for sale and a new loan facility to fund our development. Quality Homes PRIORITY 9: MANAGING OUR ASSETS: We will deliver our investment programme of £5 over 5 years to keep our homes tenantable, safe and fit for purpose. Having surveyed two thirds of our stock in the last 15 months, our asset management strategy sets out what needs to be done in terms of planned maintenance. Over the course of the next 8 months we will complete the stock survey and feed this into our investment plans. Given the future funding of supported housing is under review, one key objective for the Organisation for the next 2 years will be to review our supported housing stock to determine the most appropriate exit strategies should Local Housing Allowance (LHA) Caps funding changes make this model of provision less viable in the long term.

Page 28
PRIORITY 10: We will seek to ensure that we deliver effective and efficient services to customers In practice there will be two strands to this objective:
FIRST CLASS REPAIRS: Delivering a high performance responsive and
cyclical maintenance service
EFFECTIVE PROPERTY CARE: Promoting an ethos of property care.
In relation to responsive maintenance, customer satisfaction is high but performance is variable when compared with peers. Hence it is our intention to improve the efficiency of the service in terms of improving the proportion of planned maintenance spend, improving productivity and improving performance towards the Housemark Upper Quartile over the lifetime of the Plan. In doing so, we wish to obtain some form of recognised accreditation for the service such as HQN which will also assist our in-house team to generate some external revenue for the Organisation with, for example, local property management agents.. In relation to property care, the Organisation believes it must work more closely with customers to support them to look after their homes, thereby controlling responsive maintenance and voids costs. Measures we will take include assertive management to ensure customers look after their homes, increasing the range of educational material for property care and introducing a certification scheme that customers can use to demonstrate their ability to maintain a tenancy when applying for other accommodation.
Page 29
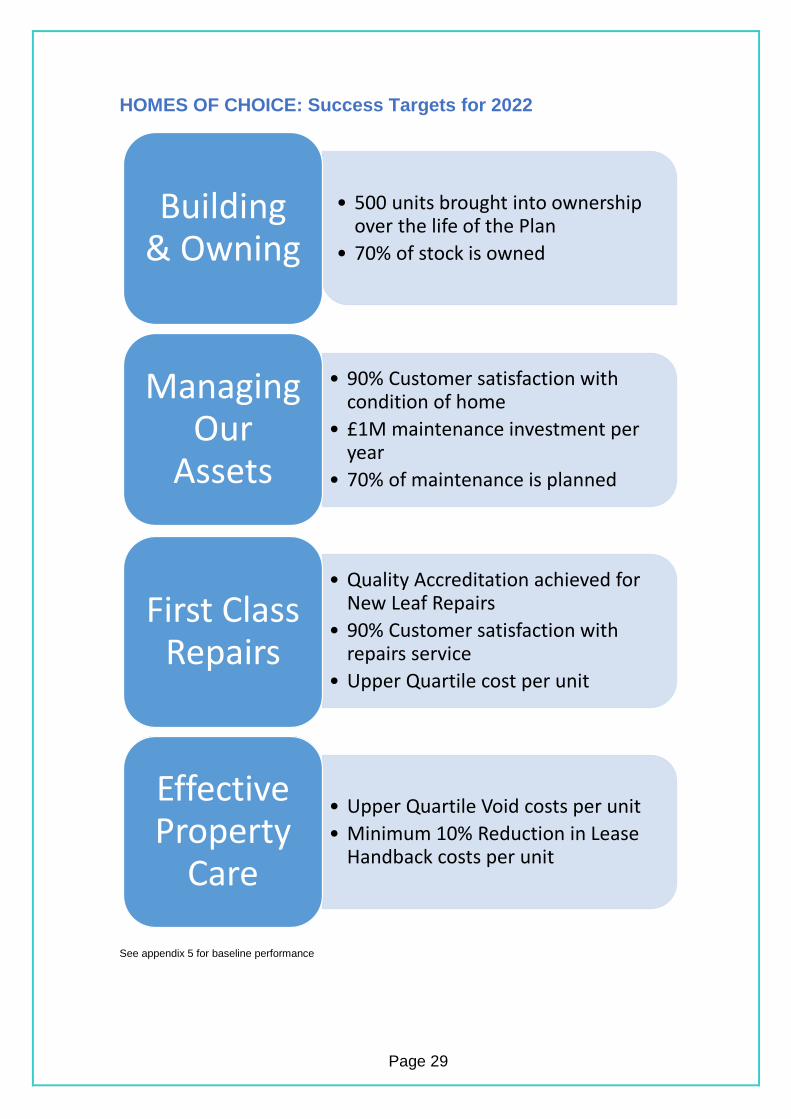
HOMES OF CHOICE: Success Targets for 2022
See appendix 5 for baseline performance
• 500 units brought into ownership over the life of the Plan
• 70% of stock is owned
Building & Owning
• 90% Customer satisfaction with condition of home
• £1M maintenance investment per year
• 70% of maintenance is planned
Managing Our
Assets
• Quality Accreditation achieved for New Leaf Repairs
• 90% Customer satisfaction with repairs service
• Upper Quartile cost per unit
First Class Repairs
• Upper Quartile Void costs per unit
• Minimum 10% Reduction in Lease Handback costs per unit
Effective Property
Care
Page 30
BBuilding Resilience
CCreating Opportunities
HHomes of Choice
AAchieving Value

Page 31
The Organisation faces two strategic tensions over coming years. Income from rents and revenue contracts is being squeezed downwards yet customers and commissioners alike expect services which are well-delivered and relevant to their needs. As costs need to be more tightly controlled, there is a risk that customers will become less satisfied and staff (our “People asset”) are put under more pressure to deliver. It is essential the Organisation manages this tension effectively. We have identified two priorities to improve our Organisation which are grouped into two themes – “strengthening the team” and “delivering efficiency and quality.” Excellent People PRIORITY 11: EXCELLENT PEOPLE: We will deploy and develop our People to deliver the Business Plan and work towards being an Employer of Choice. The new realities of our operating environment have put significant strain on staff teams that have had an impact on staff and turnover. BCHA is investing time in developing a new People Strategy and Plan by the autumn of 2017 that will focus on all key aspects of the employment cycle from attracting candidates to leaving the Organisation. Key themes will include:
Learning and development – particularly so frontline staff have the knowledge,
confidence and competence to deal with increasingly complex casework
Management and leadership development for current and aspiring leaders
Staff engagement and communication
Pay, reward, recognition and career progression
Performance management including effective and ongoing people reviews
Once our new strategy beds in, we will consider Employer of Choice recognition in the latter stages of the Business Plan. Efficiency and Quality PRIORITY 12: EFFICIENCY & QUALITY: We will produce annual statements for each service area so all staff are engaged with effective cost-control and service quality improvement for customers (internal and external). In practice, these plans will support our Value for Money Strategy and deliver excellent performance and satisfaction as efficiently as possible. These annual statements will ensure everyone throughout the Organisation is involved in thinking about how services are delivered so that money is not needlessly wasted and the customer experience is at the heart of what we do.

Page 32
ACHIEVING VALUE: Success Targets for 2022
See appendix 5 for baseline performance
• 90% Satisfaction with employer
• Permanent staff turnover < 16% per year
• in house leadership and development programme by Year 2
Excellent People
• Overall reduction in operating costs of 5%
• Benchmarked Upper Quartile performance
• Overall Customer satisfaction 90%
Efficiency & Quality

Page 33

Page 34
FINANCIAL PLAN

Page 35
13. FINANCIAL ASSUMPTIONS AND PROJECTIONS The financial plan is the latest update of the Group’s financial projections and sets out the resources required to achieve the business plan objectives. Year 1 of the plan is based on the 2017/18 budget with some minor adjustments to reflect up to date information. The projections feed into the 30-year Financial Forecasting Return (FFR) required by the Regulator. FINANCIAL ASSUMPTIONS The financial plan makes financial assumptions in both revenue and capital income, expenditure and growth. The key economic assumptions within the plan have been updated and are summarised below. These assumptions have been based on various sources of economic forecasts and consultation with the Group’s treasury advisers. All differential inflation rates are now linked to the Consumer Prices Index (CPI). This is considered to be the most appropriate headline inflation measure for both income and costs.
Year ending 31st March
1 2 3 4 5 Long term
2018 2019 2020 2021 2022
Inflation (CPI)
2.5% 2.0% 2.0% 2.0% 2.0%
Inflation (RPI)
3.25% 2.75% 2.75% 2.75% 2.75%
LIBOR (3 month)
0.75% 1.5% 2.0% 2.5% 3.0% 4.0%
Rental growth
-1.0% -1.0% 2.0% 2.0% 2.0%
Inflation The Bank of England’s latest quarterly inflation report (May 2017) is forecasting that CPI inflation will rise rapidly during 2017, peaking at just below 3% towards the end of 2017, before returning to the targeted 2% in the medium term. This increase is expected to be driven by rising import prices as a result of the fall in Sterling following the Brexit referendum. Interest rates The UK Bank Rate, which had been at 0.5% since 2009, was lowered to 0.25% in August 2016 as part of the Bank of England’s monetary stimulus to counter the perceived Brexit risk. Three month LIBOR (i.e. the market rate) is currently around 0.3%. The markets are pricing in the expectation that the Bank Rate will remain below 0.5% for the next two years. The Plan prudently assumes that rates will gradually rise over the next 5 years before reaching a long term rate of 4%. Rents and other income The Government’s 2015 Summer Budget introduced a number of significant changes to the housing sector. The key policy change was the requirement for rents to reduce by 1% per annum for the four years from April 2016. The rent reduction for supported housing was deferred by a year to April 2017. This was a significant departure from the existing policy framework of rents increasing by CPI+1% for the 10 years from April 2015.

Page 36
Rental income for the five years from April 2020 to March 2025 has been set at CPI. Whilst it is recognised that the five years of CPI plus 1% remains the current government policy there is concern that this is susceptible to change and it is prudent to plan for CPI only. Support income and service charges are assumed to increase in line with CPI. This remains a key risk and has been considered as part of the stress testing. Costs The key cost assumptions have been updated and are summarised below.
Year ending 31st March Cost inflation
2 3 4 5 Long term
2019 2020 2021 2022
Staff costs
2.0% 2.0% 2.0% 2.0% 2.0%
Overheads etc
2.0% 2.0% 2.0% 2.0% 2.0%
Maintenance costs
3.0%
3.0%
3.0%
3.0%
3.0%
Build costs
3.0%
3.0%
3.0%
3.0%
3.0%
The Plan remains susceptible to cost pressures. The Group retains control of staff costs and, through its in-house maintenance service, the labour element of maintenance costs. However, this is a further focus of stress testing. Significant savings have been achieved as part of the Group’s value for money plan which is being further reviewed and extended during 2017.
OPERATIONAL ASSUMPTIONS Voids and bad debts
General needs Supported housing
Void loss 1.5% 4%
Bad debt 2% 2%
It is expected that the reform of welfare benefits and the roll out of Universal Credit will increase the risk of bad debts. Given the complexity of the welfare changes this is very difficult to model. It is envisaged that any increase will substantially relate to general needs tenants with the impact growing quickly but then tailing off as the new regime beds in. There has been a concerted focus by operational staff to mitigate this risk. Stock condition The projections continue to reflect the respective stock condition information. Over the first five years of the Plan capitalised major repairs spend averages circa £1.1m per annum. The majority of the work will, wherever possible, be undertaken by in house teams within New Leaf to achieve VAT and cost efficiency. Disposals The Plan prudently assumes no asset disposals. This offers flexibility and risk mitigation.

Page 37
Consideration will be given to the disposal of poor performing assets as appropriate. TREASURY ASSUMPTIONS The key treasury assumptions include:
A minimum working capital requirement of £1m (plus overdraft facility of
£0.5m);
An extended facility with Triodos was completed in March 2017. This adds
£10.5m of new funding to be drawn over the next 2 years;
An additional £9.5m of debt is fixed for 10 years;
New borrowing to facilitate other, as yet uncommitted growth, is assumed to be
split 70/30 between fixed and variable rate with fixed rates of 4.5% and variable
rates of LIBOR plus 1.75% margin.
Loans from the Co-op Bank and the Dorset LEP (circa £5.5m in total) are
assumed not to be renewed in 2019 and are therefore refinanced.
DEVELOPMENT AND STOCK TRANSFERS
The development spend and stock acquisitions extracted from the annual cash flow and the related number of units is set out below:
Analysis of development spend & stock acquisitions
2018 2019 2020 2021 2022 2023
£000's £000's £000's £000's £000's £000's
Development spend (Note 1) 4,789 507 0 0 0 0
Stock acquisitions 13,267 8,528 8,784 9,048 9,319 9,599
Total gross spend 18,056 9,035 8,784 9,048 9,319 9,599
Development grant (Note 1) 3,599
Grant transferred on acquisition 10,708 3,708 3,819 3,934 4,052 4,174
Total grant 14,307 3,708 3,819 3,934 4,052 4,174
Net spend
Development 1,191 507 0 0 0 0
Stock acquisitions 2,559 4,820 4,965 5,114 5,267 5,425
Total net spend 3,750 5,327 4,965 5,114 5,267 5,425
Committed 1,661 7 0 0 0 0
Uncommitted 2,089 5,320 4,965 5,114 5,267 5,425
Total net spend 3,750 5,327 4,965 5,114 5,267 5,425
2018 2019 2020 2021 2022 2023
No. No. No. No. No. No.
Committed Units
Development 40 0 0 0 0 0
Stock acquisitions (Note 2) 55 0 0 0 0 0
95 0 0 0 0 0
Uncommitted units
Development 0 6 0 0 0 0
Stock acquisitions 91 72 72 72 72 72
91 78 72 72 72 72
Note 1 – the development spend and grant in 2018 includes significant amounts relating to refurbishment Note 2 – the 55 unit acquisition in 2018 completed in April 2017.

Page 38
The previously agreed transfer of 55 supported housing units (16 properties) from Knightstone HA completed in the first quarter of 2017/18 and has now been reflected in the Plan. The purchase price was circa £400k with the transfer of some £6.5m health authority grant. The latter will be important to BCHA’s net worth (reserves + grant) gearing calculation. Discussions have recently started with Sovereign Housing Association for the acquisition of a portfolio of 9 buildings (95 units) in Bournemouth, Exeter and South Devon. A number of these are already managed or leased by BCHA and this offers an opportunity to swap relatively expensive lease payments for loan finance at current low interest rates. An initial discounted cash flow (net present value) calculation by BCHA has indicated a value of circa £2.1m. This indicative offer has been received positively and formal heads of terms are being prepared. If accepted, completion could be achieved in the next 6 – 9 months. As last year, the Plan includes the assumed transfer of 360 general needs properties currently managed on behalf of Knightstone HA. This was previously assumed to take place in phases over 9 years whereas in the current Plan this has been accelerated to 5 years. This remains a key objective but is subject to further analysis and negotiation to determine value and priorities. GROUP RESULTS Turnover Turnover for the period to 2022 is forecast to rise from £20.4m in Year 1 to £21.5m in Year 5, an increase of 5.4%. Income is constrained by the government’s rent reduction policy to 2020. The analysis of turnover is set out in the chart below. The major income streams remain rent and service charges which represent 55% of turnover by 2022, revenue grants which represent 26% and learning and work income which is 5%. Management fee income falls from 5.6% in 2018 to 2.1% in 2022 in line with the assumed phased acquisition of managed stock.
-
5,000
10,000
15,000
20,000
25,000
2018 2019 2020 2021 2022
Tu
rno
ve
r £
'000
Turnover analysis
Rent Service charges Voids Revenue grants
Other income Management fees Learning & work RECOOP
New Leaf Grant amortisation

Page 39
Surplus The operating surplus and net surplus are set out in the chart below. The operating surplus improves from £1.6m in 2018 to £2.7m over the 5 year period as a result of cost improvements and the acquisition of managed and leased stock. The net surplus initially rises from £0.8m in 2018 but plateaus and slightly declines to £1.1m as interest rates are assumed to rise steadily (LIBOR increases from 0.75% to 3%).
Operating and net surplus margins The operating margin (operating surplus as a percentage of turnover) and net surplus margin (bottom line surplus as a percentage of turnover) are set out below. These mirror the movement in surpluses above. The operating margin improves from 8.1% in 2018 to 12.4% over the 5 year period. The net surplus margin initially rises from 3.9% in 2018 but slightly declines to 5.3% as interest rates rise.
0.0
0.5
1.0
1.5
2.0
2.5
3.0
2018 2019 2020 2021 2022
£ m
illio
n
Surpluses
Operating surplus Net surplus
0.0%
2.0%
4.0%
6.0%
8.0%
10.0%
12.0%
14.0%
2018 2019 2020 2021 2022
Margins
Operating margin Net surplus margin

Page 40
BALANCE SHEET Housing property cost increases from £77.3m in 2018 to £117.7m in 2022 as a result of development and stock acquisition activity. Amortised grant (“deferred income”) grows from £43.3m to £56.9m and loans by £27.1m to £40.4m over this period. Liquidity and Cashflow Undrawn loan funding of £10.5m is in place and is forecast to be drawn over the first two years of the Plan. Additional borrowing will be required to fund the on-going acquisition programme and discussion with potential funders is underway. The Group aims to have available secured loan facilities to cover 18 months activity. Units The Plan reflects the Group’s objective to take leased/managed stock into ownership. The proportion of owned stock increases from 52% in 2018 to 68% in 2022 and 72% in 2023.
LOAN COVENANTS The organisation has a range of loan covenant requirements with its funders. Interest cover is generally measured on the basis of earnings before interest tax depreciation amortisation with (capitalised) major repairs included (EBITDAMRI). The limit with two of BCHA’s funders was renegotiated to 110% in 2016/17 but the Co-op’s limit remains at 130% albeit on an EBITDA basis. Negotiations with Co-op are on-going. The chart below shows that interest cover is achieved across the 5 year period but is tight in 2018.
-
500
1,000
1,500
2,000
2,500
2018 2019 2020 2021 2022 2023
Un
its
Units
Owned Leased/managed Total

Page 41
Gearing Gearing measures the proportion of debt to the assets or “net worth” of the business. BCHA currently has two different measures across it funders as shown below. There is ample headroom against the property cost measure. The net worth (grant plus reserves) basis, measured against the most restrictive limit (with the Co-op), is achieved but becomes tight towards the end of the 5 year period. The majority of the Co-op debt will be repaid by this point and discussions continue with the bank to re-negotiate this limit.
0%
20%
40%
60%
80%
100%
120%
140%
160%
180%
200%
2018 2019 2020 2021 2022
Interest cover
Interest cover (EBITDAMRI) Interest cover lower limit
0%
10%
20%
30%
40%
50%
60%
70%
2018 2019 2020 2021 2022
Gearing
Gearing (Property cost) Gearing (Property cost) upper limit
Gearing (net worth) Gearing (net worth) upper limit

Page 42
Detailed Consolidated Statement of Comprehensive Income 2018 2019 2020 2021 2022
£000's £000's £000's £000's £000's
TURNOVER
Rent Receivable 6,936.90 7,188.70 7,162.40 7,285.70 7,431.40
Service Charge Income 4,397.50 4,556.60 4,648.40 4,740.90 4,835.70
Gross Rental Income 11,334.40 11,745.30 11,810.80 12,026.60 12,267.10
Less Voids (363.3) (337.2) (337.9) (344.2) (351.1)
Net Rental Income 10,971.20 11,408.10 11,472.80 11,682.40 11,916.00
Other Revenue Grants 5,135.10 5,263.50 5,368.80 5,476.20 5,585.70
Other Income 1,017.10 1,042.50 1,063.30 1,084.60 1,106.30
Total Turnover From Social Housing Lettings 17,122.40 17,123.40 17,124.40 17,125.40 17,126.40
Turnover - Other Social Housing Activities 1,141.60 982.10 809.90 630.50 443.50
Turnover - Non Social Housing Lettings Non Social Housing Turnover 1,725.40 1,768.60 1,803.90 1,840.00 1,876.80
Grant Amortisation 379 471.2 508.9 547.7 587.7
Total Turnover 20,369.50 20,936.00 21,027.70 21,261.30 21,516.00
OPERATING EXPENDITURE
Operating Costs Social Housing
Management Costs Total (3,899.90) (3,938.50) (4,016.00) (4,092.70) (4,171.10)
Service Costs (1,471.60) (1,461.30) (1,494.70) (1,528.60) (1,563.20)
Care And Support Costs (6,198.10) (6,353.00) (6,480.10) (6,609.70) (6,741.90)
Routine Maintenance (1,114.00) (1,204.00) (1,240.10) (1,279.10) (1,317.40)
Planned Maintenance (222.40) (272.80) (281.00) (290.20) (298.90)
Major Repairs (167.40) (167.60) (172.60) (177.80) (183.10)
Bad Debts (259.50) (242.10) (241.60) (246.00) (250.90)
Lease Charges (2,935.90) (2,367.20) (2,009.20) (1,635.80) (1,246.80)
Depreciation of Housing Properties (931.30) (1,093.90) (1,198.60) (1,305.60) (1,415.70)
Operating Costs Social Housing (17,200.10) (17,100.50) (17,133.90) (17,165.50) (17,189.00)
Non Social Housing Other Expenditure (1,523.10) (1,561.20) (1,592.40) (1,624.30) (1,656.70)
Other Activities Expenditure Total (1,523.10) (1,561.20) (1,592.40) (1,624.30) (1,656.70)
Operating Expenditure Total 18,723.20 18,661.70 18,726.30 18,789.80 18,845.70
Operating Surplus/(deficit) 1,646.20 2,274.30 2,301.40 2,471.60 2,670.30
Operating Margin 8.1% 10.9% 10.9% 11.6% 12.4%
Gain/(loss) on disposal of fixed asset Interest Receivable 7.2 8.9 3.3 3.3 3.3
Interest and financing costs (860.20) (1,015.80) (1,074.90) (1,297.40) (1,543.50)
Surplus before tax 793.3 1,267.4 1,229.7 1,177.4 1,130.1
Taxation 0 0 0 0 0
Surplus after tax 793.3 1,267.4 1,229.7 1,177.4 1,130.1
Net Margin 3.9% 6.1% 5.8% 5.5% 5.3%

Page 43
Consolidated Statement of Financial Position 2018 2019 2020 2021 2022
£ 000's £ 000's £ 000's £ 000's £ 000's
Fixed Assets Land & Buildings Total 77,251.80 87,312.40 97,152.60 107,288.00 117,727.50
Depreciation Land & Buildings Total (931.30) (2,025.30) (3,223.90) (4,529.50) (5,945.20)
Other Fixed Assets Tangible 2,091.60 1,928.70 1,762.00 1,591.50 1,417.10
Tangible fixed assets 78,412.00 87,215.80 95,690.70 104,350.00 113,199.40
Investments FA 485.00 485.00 485.00 485.00 485.00
Fixed Assets Total 78,897.00 87,700.80 96,175.70 104,835.00 113,684.40
Current Assets Trade and other debtors 1,471.00 1,562.90 1,636.90 1,711.30 1,786.00
Cash and cash equivalents 4,407.00 1,000.00 1,000.00 1,000.00 1,000.00
Current Assets Total 5,901.50 5,902.50 5,903.50 5,904.50 5,905.50
Creditors - amounts due within 1 year (2,487.00) (2,549.20) (2,600.20) (2,652.20) (2,705.20)
Net current assets/liabilities 3,391.00 13.70 36.70 59.10 80.80
Assets less current liabilities Total 82,288.10 87,714.50 96,212.40 104,894.10 113,765.20
Creditors - amounts due after more than 1 year Outstanding Loan Balance (27,078.30) (28,000.40) (31,958.10) (36,076.10) (40,352.90)
Deferred Income (43,261.50) (46,748.40) (50,058.90) (53,445.10) (56,909.40)
Long Term Creditors Balance (653.00) (403.00) (403.00) (403.00) (403.00)
Deferred Premium
Creditors - amounts due after more than 1 year (70,992.80) (75,151.80) (82,420.00) (89,924.30) (97,665.30)
Net assets Total 11,295.30 12,562.70 13,792.40 14,969.80 16,099.90
Reserves Income and Expenditure Reserve 6,509.30 7,776.70 9,006.40 10,183.80 11,313.90
Restricted Reserves 59 59 59 59 59
Designated Reserves 4,727.00 4,727.00 4,727.00 4,727.00 4,727.00
Total reserves 11,295.30 12,562.70 13,792.40 14,969.80 16,099.90

Page 44
Consolidated Statement of Cash Flow
Period: 01 April 2017 - 31 March 2047 2018 2019 2020 2021 2022
£000's £000's £000's £000's £000's
Total Receipts 19,730.90 20,130.70 20,203.20 20,393.20 20,602.60
Total Payments (10,061.20) (9,606.00) (9,424.00) (9,218.30) (8,998.40)
Cash Paid To Employees (7,291.80) (7,474.00) (7,623.50) (7,776.00) (7,931.50)
Cash flow from Operating Activities 2,377.90 3,050.70 3,155.70 3,398.90 3,672.70
Cash flow from investing activities Purchase of tangible fixed assets (19,071.30) (10,081.10) (9,861.10) (10,156.70) (10,461.20)
Proceeds from sale of tangible fixed assets 0.00 0.00 0.00 0.00 0.00
Grants received 14,306.50 3,708.10 3,819.40 3,934.00 4,052.00
Interest Received 7.20 8.90 3.30 3.30 3.30
Total Cash flow from investing activities (4,757.60) (6,364.00) (6,038.50) (6,219.50) (6,406.00)
Cash flow from financing activities Interest paid (862.60) (1,015.80) (1,074.90) (1,297.40) (1,543.50)
Interest element of finance lease rental payment New secured loans 6,000.00 4,500.00 0.00 0.00 0.00
Capital Repayments (475.70) (4,891.10) (342.20) (341.80) (341.80)
Loan Working Capital Movements Working Capital Loan Drawdown 296.80 1,313.20 4,299.90 4,459.80 4,618.60
Working Capital Loan Repayment (296.80) 0.00 0.00 0.00 0.00
Total Cash flow from financing activities 4,661.70 -93.70 2,882.80 2,820.60 2,733.30
Cash & cash equivalents at the beginning of year 2,125.00 4,407.00 1,000.00 1,000.00 1,000.00
Net Change in Cash & cash equivalents 2,282.00 (3,407.00) 0.00 0.00 0.00
Cash & cash equivalents at the end of year 4,407.00 1,000.00 1,000.00 1,000.00 1,000.00
Page 45
14. VALUE FOR MONEY Value for Money for BCHA means achieving the optimum level of social and business outcomes, to the complete satisfaction of our residents and commissioning partners, within the resources available to us.
We aim to ensure best use of resources (spending the right amount of money on the right things) through:
a rigorous business planning process proper scrutiny of new property developments and new business proposals based on detailed feasibilities
monitoring actual performance of projects against projected performance Resident Scrutiny of underperforming activities a staff reward scheme which provides a non-consolidated bonus for performance which achieves targets across a suite of corporate KPI’s.
robust control, reporting and systems of delegation annual efficiency gains and service improvement targets robust procurement arrangements production and publication of an annual self-assessment
Over the course of this Plan we will aim to improve our overall Value for Money by: Asset Management
Working towards a planned to responsive maintenance ratio of 70:30 (+/- 5%) Improving the productivity of our property maintenance operation, New Leaf Seeking to maximise accommodation provision by sale and re-provision of
unviable sitess or those with premium value Procurement
Maximising social, economic and environmental value for our communities through our procurement of works and services.
Housing Services
Seeking to become upper quartile in terms of our rent collection and lettings management costs, compared with our Housemark peer group
Improving customer satisfaction targets of at least 90% Staff Awareness and Lean Processes
Embedding awareness of Value for Money at all levels in the organisation Reviewing processes using the Lean framework to eliminate waste and ensure
efficiency Reinvestment
Seeking to obtain ongoing efficiency savings of at least £125,000 per annum for reinvestment in services for residents
Generating social enterprise profit to reinvest in services for residents and others.

Page 46
The 2017/18 budget reflects the savings identified to date from the procurement project with Capita. These total circa £300k mainly stemming from business material and facilities management consolidation, although other areas include energy, business rates, stationery, fleet, CCTV and invoice reduction. Maintenance costs have been set at £600 per unit, significantly down on previous years, to reflect procurement savings and tighter control of spend. Other significant savings have been achieved by restructuring the previously loss making activities of iSupport (CCTV monitoring etc) and Learning & Skills. These are now broadly break-even (before allocation of central costs). The new loan facility with Triodos has enabled a reduction in the minimum interest rate from 3.5% to 1.85% generating a saving of circa £190k pa on the existing £11.5m loan based on current rates. Lease acquisitions have been identified enabling the replacement of expensive rent payments with cheaper borrowing costs. A savings plan is currently being developed to consider all aspects of our business that can potentially improve our bottom line surplus. FINANCIAL STANDARDS (“GOLDEN RULES”)
Under the HCA’s “Governance and Financial Viability Standard” registered providers are required to manage their resources effectively to ensure their viability is maintained while ensuring that social housing assets are not put at undue risk. Registered providers shall also ensure that they have an appropriate, robust and prudent business planning, risk and control framework. The framework shall ensure: (a) there is access to sufficient liquidity at all times (b) financial forecasts are based on appropriate and reasonable assumptions (c) effective systems are in place to monitor and accurately report delivery of plans (d) the financial and other implications of risks to the delivery of plans are considered (e) registered providers monitor, report on and comply with their funders' covenants As part of BCHA’s control framework, we have already adopted a number of financial standards to support the development of the business, to enable monitoring and reporting of performance and to manage risk. These standards set out the financial parameters which are most important to ensure we are maintaining our financial viability and meeting obligations to our funders. The standards are limits set to maintain a margin of safety over the measures in our loan covenants and provide a cushion in managing liquidity and treasury risks. The performance of year 1 of the Plan against the financial standards approved by the Board as part of the Performance & Risk Framework in February is shown below. Other than the proportion of fixed rate debt the budget complies with the standards. This will be considered as part of the treasury strategy review to be presented to the Audit Risk & Treasury Committee in July.

Page 47
Standard Definition Measure Measure 2017/18
Operating margin minimum Operating Surplus : Total Turnover
5% 8.1%
Interest cover minimum including headroom
Interest Payable : Operating Surplus (loan agreements definitions)
1.3
1.38
(tightest)
Revenue contracts (supporting people, learning services and other non-social housing) as percentage of turnover maximum Payment By Results (PBR) element of revenue contracts as max % turnover
(1) Turnover from revenue contracts : Total Turnover (2) PBR element : Total turnover
40%
5%
33.7%
5%
Gearing maximum including headroom
Debt to property assets or Debt to Net worth (loan agreements definition)
50%
43%
Debt: turnover maximum Credit rating (Moody’s) definition)
3:1
1.33:1
Charged undrawn facilities and cash: committed spend (per Treasury Policy)
Charged undrawn facilities + cash to cover number of years projected cash flow
2 years
2 years
Forecast unencumbered but chargeable assets: forecast spend
100%
114%
Overall proportion of fixed (hedged) debt between 60% - 80% Minimum proportion of fixed debt over 10 years
(as per Treasury Policy)
75%
33%
74% (end of yr)
13%

Page 48
15. SCENARIO AND STRESS TESTING Part of the approval process for the Financial Plan is to test a range of scenarios which could affect the achievement of financial targets and breach existing loan covenants. These were presented and discussed by the Board and are reproduced below. Scenarios Individual stress tests are applied to the Plan to understand the key risk factors to the business. These are then combined to produce a “perfect storm” scenario. These tests have all be applied from year 2 (i.e. 2018/19) of the Plan.
Maintenance and build cost inflation increases by 1% (i.e. from 3% to 4%) Interest rates (LIBOR) increase by 1% (i.e. a long term rate of 5%) Bad debts are increased by 1% Voids increased by 1% Rental inflation reduced by 1% Revenue grant inflation reduced by 1% All scenarios above applied together.
Results The impact on EBITDAMRI interest cover and gearing ratios are set out below. The individual stress tests generally do not breach the financial standards interest cover limit (130%) until 2023 or 2024. The stresses do not breach the loan covenant limit (110%) until beyond 2027 and even then this only applies to the rent and revenue grant inflation scenarios. (The 130% EBITDA interest cover limit is not breached). The scenario of all the stresses combined leads to a breach in the financial standard in 2020 and the formal loan covenant in 2021. (The EBITDA limit is breached in 2024).
Testing against the gearing (net worth) generally shows breaches against the short term limit (50%) in 2023 with the combined scenario breaching in 2022. The stresses do not breach the longer term limit (65%) during the next 10 years although the combined scenario breaches this limit in 2028.
0%
20%
40%
60%
80%
100%
120%
140%
160%
180%
200%
2018 2019 2020 2021 2022 2023 2024 2025 2026 2027
Stress testing - interest cover (EBITDAMRI)
1. Maintenance & build costs up 1% 2. Interest rates increased by 1%
3. Bad debts increased by 1% 4. Voids increased by 1%
5. Rent inflation down 1% 6. Revenue grant inflation down 1%
7. All 6 scenarios Financial standard limit (130%)
Loan covenant limit (110%)

Page 49
None of the scenarios leads to a breach of the property cost gearing measure.
Risk of loss or decommissioning of support contracts With revenue support grants representing around 26% of turnover, and in an environment where these are subject to re-tender or possibly decommissioning by the local authority, there is a risk to this income. The Plan has been stressed to consider the impact of losing 25% of this income in year 2. The corresponding mitigation is that a high proportion of the costs associated with such contracts are direct and would either move to the new provider or end with the contract. As such it has been assumed that 90% of the related costs would be removed. The impact on interest cover is illustrated below with the tightest short term interest cover limit (130%) being marginally
0
0.1
0.2
0.3
0.4
0.5
0.6
0.7
2018 2019 2020 2021 2022 2023 2024 2025 2026 2027
Stress testing - gearing (net worth)
1. Maintenance & build costs up 1% 2. Interest rates increased by 1%
3. Bad debts increased by 1% 4. Voids increased by 1%
5. Rent inflation down 1% 6. Revenue grant inflation down 1%
7. All 6 scenarios Tightest short term limit (50%)
Long term limit (65%)
0
0.1
0.2
0.3
0.4
0.5
0.6
0.7
2018 2019 2020 2021 2022 2023 2024 2025 2026 2027
Stress testing - gearing (property cost)
1. Maintenance & build costs up 1% 2. Interest rates increased by 1%
3. Bad debts increased by 1% 4. Voids increased by 1%
5. Rent inflation down 1% 6. Revenue grant inflation down 1%
7. All 6 scenarios Limit (60%)

Page 50
breached in 2024. This timescale would allow for corrective measures to be put in place to resolve this.
Similarly, the gearing (net worth) shows a breach against the short term limit (50%) in 2023.
The focus of the business will be on winning or retaining high contribution contracts and exploring new income sources in the areas of health, justice and the like. Mitigations A number of mitigations have been considered in response to the combined stress scenarios. These include:
0
0.2
0.4
0.6
0.8
1
1.2
1.4
1.6
1.8
2
2018 2019 2020 2021 2022 2023 2024 2025 2026 2027
Stress testing - interest cover
Base case
Loss of 25% of SP income and 90% of related costs
Tightest short term limit (130%)
Long term limit (110%)
0
0.1
0.2
0.3
0.4
0.5
0.6
0.7
2018 2019 2020 2021 2022 2023 2024 2025 2026 2027
Stress testing - gearing (net worth)
Base case
Loss of 25% of SP income and 90% of related costs
Tightest short term limit (50%)
Long term limit (65%)

Page 51
freezing staff costs; and
delivering a further £250k of efficiency savings.
Whilst freezing staff costs is not a long term solution it could be appropriate in an “austerity” environment to buy time to restructure the business. The impact of applying these from year 2 of the Plan is illustrated below. Interest cover is dramatically improved and the combined mitigation brings cover back above the tightest short term limit.
Similarly, gearing (net worth basis) is brought back within the tightest short term limit.
0
0.5
1
1.5
2
2018 2019 2020 2021 2022 2023 2024 2025 2026 2027
Stress testing - interest cover
All 6 stressed scenarios
All 6 stressed scenarios with staff costs frozen
All 6 stressed scenarios with staff costs frozen + £250k efficiency savings
Tightest short term limit (130%)
Long term limit (110%)
0
0.1
0.2
0.3
0.4
0.5
0.6
0.7
2018 2019 2020 2021 2022 2023 2024 2025 2026 2027
Stress testing - gearing (net worth)
All 6 stressed scenarios
All 6 stressed scenarios with staff costs frozen
All 6 stressed scenarios with staff costs frozen + £250k efficiency savings
Tightest short term limit (50%)
Long term limit (65%)

Page 52
The other area where there is potential upside in the Plan is via treasury management. The Plan assumes prudent interest rates with a risk cushion of circa 0.5%. In the current environment there is an opportunity to lock into lower rates through a variety of lengths of hedging. As an illustration if the assumed LIBOR rate could be bettered by 0.5% the impact on interest cover is shown below. (There is marginal impact on gearing).
Other liquidity mitigations are being put in place to ensure that the Group has access to charged undrawn loan facilities and to identify a pool of assets that are suitable for disposal if the need arises. Development scenario The base case plan assumes very little new development beyond current commitments. The focus is on acquiring a significant number of leased/managed properties and the associated borrowing to fund this. The Group does have an ambition to continue to develop new homes if the grant and funding environment supports this. A scenario has therefore been considered where 15 new units are developed per annum for years 2 to 5 of the Plan (i.e. a total of 60 units) with an assumed grant rate of 30%. This results in peak debt rising to £51.1m in 2023 compared to £44.8m in the base case. As shown in the chart below the impact is modest in the early years but by 2022 interest cover is reduced by around 7% and by 2027 by 12% compared to the base plans. The tightest short term limit of 130% is breached in 2024 before gradually recovering.
0
0.2
0.4
0.6
0.8
1
1.2
1.4
1.6
1.8
2
2018 2019 2020 2021 2022 2023 2024 2025 2026 2027
Stress testing - interest cover
Base case LIBOR reduced by 0.5%
Tightest short term limit (130%) Long term limit (110%)

Page 53
The impact on gearing (net worth) is that the tightest short term limit (50%) is breached in 2021 to 2027 before gradually recovering. It reaches a maximum of 56% in 2023 which is still within the long term limit of 65%. If the short term limit has not been re-negotiated or removed by the expected refinancing of the Co-op bank in 2019 development ambitions would either need to be scaled back or offset against the acquisition programme of leased/managed stock. Indeed when the detailed terms of these two investment options are known the Group needs determine what mix delivers the best value given the limited borrowing capacity.
0
0.2
0.4
0.6
0.8
1
1.2
1.4
1.6
1.8
2
2018 2019 2020 2021 2022 2023 2024 2025 2026 2027
Development scenario - interest cover
Base case
Development scenario - 15 units pa for 4 years
Tightest short term limit (130%)
Long term limit (110%)
0
0.1
0.2
0.3
0.4
0.5
0.6
0.7
2018 2019 2020 2021 2022 2023 2024 2025 2026 2027
Development scenario - gearing (net worth)
Base case
Development scenario - 15 units pa for 4 years
Tightest short term limit (50%)
Long term limit (65%)

Page 54
The impact on the gearing (property cost) is less marked reaching a maximum of 37%, well within the current limit of 60%.
0
0.1
0.2
0.3
0.4
0.5
0.6
0.7
2018 2019 2020 2021 2022 2023 2024 2025 2026 2027
Development scenario - gearing (property cost)
Base case Development scenario - 15 units pa for 4 years Limit (60%)

Page 55
APPENDICES

Page 56
APPENDIX 1 – BCHA SWOT ANALYSIS
StrengthsMission centred
Staff skills & commitment
Networks & Partnerships
Range of services/tenures
Flexible & Adaptive
OpportunitiesHeadroom on assets
Social Enterprises
Complex Needs
Digital services
Unmet needs
WeaknessesStaff retention in some areas
Good practice sharing needs strengthening
Not saying "no"
Short-term revenue contracts
Tight Budgets
ThreatsIncome reduction
Complex Needs
Partner agency pressures
Government Policy
Welfare Reform
Brexit?
Lack of Move-on
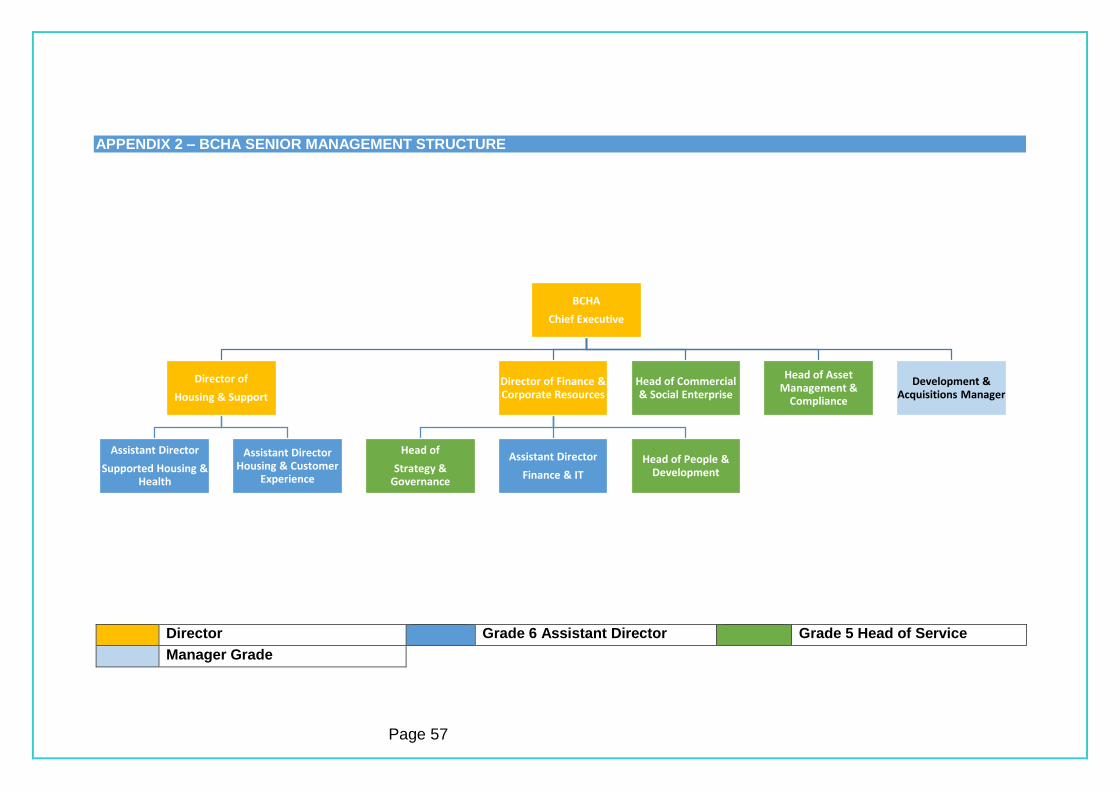
Page 57
APPENDIX 2 – BCHA SENIOR MANAGEMENT STRUCTURE
Director Grade 6 Assistant Director Grade 5 Head of Service
Manager Grade
BCHA
Chief Executive
Director of
Housing & Support
Assistant Director
Supported Housing & Health
Assistant Director Housing & Customer
Experience
Director of Finance & Corporate Resources
Head of
Strategy & Governance
Assistant Director
Finance & IT
Head of People & Development
Head of Commercial & Social Enterprise
Head of Asset Management &
Compliance
Development & Acquisitions Manager

Page 58
APPENDIX 3 - RISK APPETITE
RISK APPETITE Acceptable Safe Limits (Risk Tolerance)
Area Zero Tolerance
Cautious Balanced Moderate Strong Positive Adverse
Se
rvic
e G
row
th
New Business – Traditional Support Contracts
Contribution < 10% of commissioned value
New Business – Health, Offender and related sectors
Contribution < 10% of commissioned value
New Business – Learning/work contracts
NOT > 15% of Group turnover
<5% of turnover
New Business – PBR element of contracts
NOT >5% of turnover (PBR element ony)
New Customer Groups Non-mission groups unless to fund core activity
Social Enterprise – trading to external parties [inc i-support, exc DLO]
NOT > 5% Group turnover
Failure to break even
Partnerships & Mergers Purpose aligned No B/Sheet capacity or surplus; NOT>500 units
Sto
ck G
row
th
Development
Business Plan target NOT greater than BP target without Board approval
New business - Market Rent NOT > 50 units at one time
Voids <3%
New Business - Leasing Failure to break even (inc handback )
Stock Investment
Within budget
New Business - Sale 100% sale; Shared
ownership
Small scale development No Skills in house;
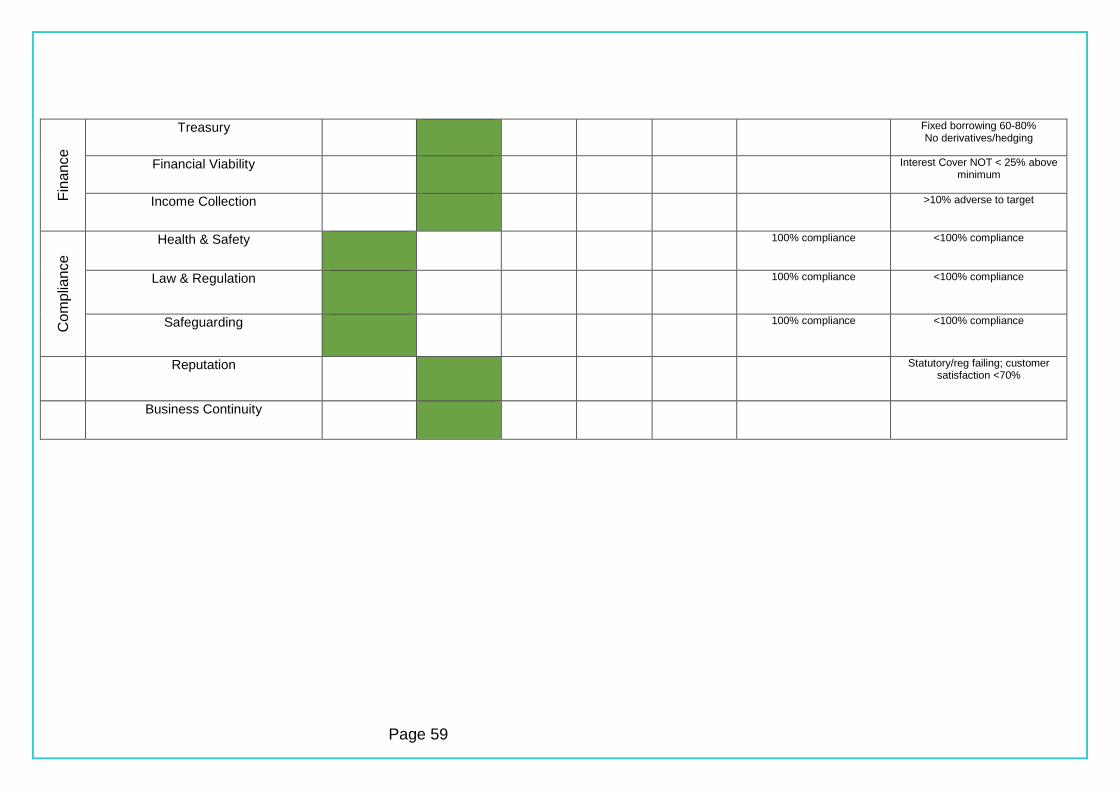
Page 59
Fin
an
ce
Treasury Fixed borrowing 60-80% No derivatives/hedging
Financial Viability
Interest Cover NOT < 25% above minimum
Income Collection >10% adverse to target
Co
mp
liance
Health & Safety
100% compliance <100% compliance
Law & Regulation
100% compliance <100% compliance
Safeguarding 100% compliance <100% compliance
Reputation
Statutory/reg failing; customer satisfaction <70%
Business Continuity

Page 60
APPENDIX 4 - YEAR ONE PLAN – BUILDING RESILIENCE THEME Objective
Sub-objective Task(s) Lead Timescale(s) Resources
Promoting Inclusion
1. Develop a range of early
intervention support to assist our customers with maintaining financial wellbeing and sustaining their tenancies.
Map community services that can assist/complement Inclusion work
Develop customer profiling Determine need and timing for
additional Financial Inclusion resources
Develop rent collection plan to reduce arrears/evictions
AD Housing & Customer
Experience supported by AD Supported
Housing & Health
31 Mar 2018 Existing budgets Efficiency Savings
Spend to Save
2. Develop our on-line presence so
that customers can access our housing or support services wherever they want, whenever they want.
Roll out Customer Portal for housing management system
Explore grant funding opportunities to install wi-fi in residential services
Establish monitoring to assess success of online
Introduce and incentivise on-line feedback
Consider subject matter for video guides
AD Housing & Customer
Experience
31 Mar 2018 Existing budgets Grant funding Sponsorship
Inspiring Change
3. Improve customer outcomes in
our support services through application of the Psychologically Informed Environments (“Inspiring Change”) approach
Develop costed programme of works for Inspiring Change
Implement comprehensive training plan for support staff
Establish “lead practioners” across service specialisms
AD Supported Housing & Health
31 May 2018 Budget Provisions
4. Build on the Employability and
Skills services we currently provide and develop an offer for general needs customers and those in supported housing.
Undertake analysis of customer base to identify barriers to employment and solutions
Seek funding or tender for external income to develop offer
Consider investment for inhouse posts
AD Housing & Customer
Experience AD Supported
Housing & Health Employability & Skills Manager
31 Dec 2017 Efficiency Savings
Spend to Save

Page 61
APPENDIX 4 - YEAR ONE PLAN – CREATING OPPORTUNITIES THEME Objective
Sub-objective Task(s) Lead Timescale(s) Resources
Developing Communities
5. Implement the new Care &
Support Strategy which will focus growing revenue contract income
Complete Care and Support Strategy by 31 July 2017
Implement Area Care and Support Plans
Review Bidding & Tendering processes
AD Housing & Customer
Experience supported by AD Supported
Housing & Health
31 Mar 2018 Existing budgets
6. Work in partnership with the Health and Social Care sectors to provide services for unmet needs
Develop suite of Health KPIs Explore opportunities for care
service for self funders Explore funding from heath
bodies Establish small pilot service
AD Supported Housing & Health
31 May 2018 Existing budgets Grant funding
Developing Enterprise
7. Reinvigorate the Factory as a
profitable social enterprise hub.
Explore funding to remodel Factory as co-working hub
Gain accreditation and/or support delivery contract relationships from bodies including Cooperatives Uk and Locality UK
Recruit Social Enterprise Development Manager
Explore development of enterprises such as “recipe boxes” for existing customers
Head of Commercial &
Social Enterprise
31 Mar 2018 Existing Budgets Reinvestment of
surpluses

Page 62
APPENDIX 4 - YEAR ONE PLAN –HOMES OF CHOICE THEME Objective
Sub-objective Task(s) Lead Timescale(s) Resources
Building & Owning More Homes
8. Increase the number of homes in
ownership by 500 units
Implement and achieve annual acquisition and development programme (min 100 units in 2017/18)
Chief Exec with Development
& Acquisitions Manager
31 Mar 2018 Loan facility and own funds;
Capital grant
9. Deliver our investment
programme to keep our homes tenantable, safe and fit for purpose.
Complete stock condition survey on remaining homes
Commence review of supported housing
Head of Asset Management &
Compliance
31 May 2018 Existing budgets
Providing Quality Homes
10a. Deliver a high performance
responsive and cyclical maintenance service
Implement performance improvement plan
Complete preparations for accreditation of service in Year 2
Seek external commercial customers
Head of Commercial &
Social Enterprise (with AD Housing
& Customer Experience)
31 May 2018 Existing Budgets
10b. Promote an ethos of property
care
Commence 6 monthly property inspections
Introduce tenancy accreditation certificate
Develop “help yourself” step by step video video and electronic DIY maintenance guides
AD Housing & Customer
Experience AD Supported
Housing & Health
31 Dec 2017 Existing budgets and efficiency
savings

Page 63
APPENDIX 4 - YEAR ONE PLAN –ACHIEVING VALUE Objective
Sub-objective Task(s) Lead Timescale(s) Resources
Excellent People
11. Deploy and develop our People
to deliver the Business Plan and work towards being an Employer of Choice
Through collaboration across the business draft the People Strategy & Plan 2017-22 aligned to corporate objectives and identify priority actions
Approve People Strategy & Plan 2017-22
Work collaboratively to meet agreed timescales and outcomes
Implement integrated People and Payroll system
Head of People & Development
31 Oct 2017
31 Mar 2017
Existing budgets Efficiency Savings
Efficiency & Quality
12. Produce annual statements for
each service area so all staff are engaged with effective cost-control and service quality improvement for customers (internal and external).
Develop bottom up cost reduction plan to ensure at least 5% operating cost savings
Devise template for quality plan Teams to discuss and complete
plans Quarterly monitoring introduced
to SLT
Director Finance & Corporate Resources
Head of Strategy & Governance
31 Oct 2017 Existing Budgets

Page 64
APPENDIX 5 – BASELINE PERFORMANCE IN RELATION TO BUSINESS PLAN TARGETS
THEME Indicator 2022 Target 31 March 2017
Financial Wellbeing Current tenant arrears <1% 3.9% (all housing types)
Financial Wellbeing Former tenant arrears <2% 13.8% (all housing types)
Financial Wellbeing Positive exits 80%
82.1% (all housing types)
Financial Wellbeing Financial Inclusion Return
£2:£1
Evaluation to be undertaken
Digital Service Online transaction 75% of customers
Customer portal not yet in operation
Digital Service Customer Satisfaction with form of contact
90% Question not yet asked
Digital Service Wi-fi access
100% supported housing
Not yet adapted
Better Outcomes Various Improvement on 16/17 Baseline
To be established during 2017
Better Outcomes Inspiring Change Standard
100% supported housing
To be established during 2017
Employability & Skills Customers into work 600 (120 per year)
114 (2016/17)
Strong Services Business Retention
75% of contract value 88%
Strong Services Net Growth 10% on 2016/17 baseline
From 31/03/2017 position
New Pathways New services in new markets
£500,000 by 2020 From 31/03/2017 position
Developing Enterprise New Leaf Repairs In profit; 25% ext income
£14.5k surplus; 0% ext income
Developing Enterprise Investment surplus £30,000 pa for “building resilience”
£21,560
Building & Owning Owned Stock growth 500 units over 5 years (100 per year)
66 units (over 2016/17)
Building & Owning % Owned stock 70%
56%
Managing our Assets Customer satisfaction condition of home
90% 79.2% (2017 STAR survey)
Managing our Assets Planned maintenance investment
£1M pa Will be monitored annually
Managing our Assets Planned: responsive spend
70%:30% 21%:79%
First Class Repairs Accreditation
Achieved Work not yet started
First Class Repairs Customer satisfaction repairs
90% 67.7% (2017 STAR survey)
First Class Repairs Cost per unit Upper Quartile
Middle Lower Quartile
Effective property care Void cost per unit Upper Quartile
Middle Lower Quartile
Effective property care Lease Handback cost per unit
10% Reduction From 31/03/2017 position
Excellent People Satisfaction with Employer
90%
87% (last survey 2016)
Excellent People Staff Turnover <16% pa
23%
Efficiency & Quality Operating costs 5% reduction by 2022
From 31/03/2017 position
Efficiency & Quality Performance vs VFM statement measures
Upper Quartile Variable vs benchmark group
Efficiency & Quality Customer Satisfaction overall
90% 74.7% (2017 STAR survey)

Page 65