working with disadvantaged youth - doleta.gov · working with disadvantaged youth ... pact findings...
TRANSCRIPT

Working with Disadvantaged Youth
Thirty-Month Findings from the Evaluation of the
Center for Employment Training Replication Sites
Cynthia Miller
Johannes M. Bos Kristin E. Porter Fannie M. Tseng Fred C. Doolittle
Deana N. Tanguay Mary P. Vencill
June 2003

The Center for Employment Training Replication Study is funded by the U.S. Department of Labor’s Employment and Training Administration. Dissemination of MDRC publications is also supported by the following foundations that help fi-nance MDRC’s public policy outreach and expanding efforts to communicate the results and impli-cations of our work to policymakers, practitioners, and others: The Atlantic Philanthropies; the Al-coa, Ambrose Monell, Bristol-Myers Squibb, Fannie Mae, Ford, Grable, Starr, and Surdna Founda-tions; and the Open Society Institute.
The findings and conclusions in this report do not necessarily represent the official positions or poli-cies of the funders. For information about MDRC® and copies of our publications, see our Web site: www.mdrc.org.
Copyright © 2003 by MDRC. All rights reserved.

-iii-
Overview Young people who lack postsecondary education or vocational credentials face an uphill battle in the competition for jobs. Two prior studies found that the services of the Center for Employment Training (CET) in San Jose, California, significantly increased low-income youths’ and single-mothers’ chances of finding employment and also raised their earnings. CET is noted for enrolling trainees with little prescreening, for providing training in a worklike setting, for requiring a full-time commitment from trainees, for involving employers in the design and delivery of training, for integrating instruc-tion in basic skills into the training, and for allowing trainees to progress as they master competencies, without any fixed schedule.
In the early 1990s, the U.S. Department of Labor (DOL) provided funds for CET to provide technical assistance to other organizations interested in replicating the CET model, thus adding new programs beyond CET’s traditional base in San Jose and elsewhere in the western states. This study examines the experiences of youth in twelve CET sites outside San Jose: six in eastern states and the Midwest begun as part of the DOL-sponsored replication effort and six western programs operated as part of CET’s service network. This report summarizes the implementation findings and presents initial im-pact findings based on a random assignment research design and a survey conducted 30 months after application to CET.
Key Findings • The fidelity of program services to the original CET model varied greatly across the sites, affect-
ing both implementation and impacts. Four study sites (all older, CET-operated programs) im-plemented the model with high fidelity; six sites operated programs with medium fidelity; and two sites implemented the model with low fidelity. Intensive participation in training and strong organizational stability were the two aspects of the CET model that were most difficult to achieve in the replication sites.
• In the high-fidelity sites, access to the program increased youths’ participation in training activi-ties substantially above the level for the control group and increased the percentage of youths completing a training certificate. In the medium- and low-fidelity sites, impacts on service receipt and completion were smaller.
• In the high-fidelity sites, access to the program produced substantial positive impacts across a range of employment-related outcomes for young women, as reflected by the percentage of young women ever working, employment rates at the follow-up survey, and (quite probably) earnings — though the small sample prevents a statistically significant finding.
• For young men, the results in high-fidelity sites were either negative or negligible. The earnings of the program group were less than those of the control group — a result driven by declines in em-ployment and hours worked, probably related to shifts in participants’ industry and occupation of employment.
• In the medium- and low-fidelity sites, impacts were either negative or negligible across a range of outcomes. Program group youth in the lower-fidelity sites had lower employment and earnings; impacts were especially disappointing for those without a high school credential and those who were teenagers when they entered the sample.
Longer-term follow-up may produce more encouraging findings for men and for the low- and medium-fidelity sites. The strong economy during the follow-up period for this report allowed youth with low skills to find jobs, possibly lessening the impact of the CET program. The longer follow-up period now under way extends into the recent economic slowdown and provides an opportunity to see whether the enhanced skills produced by CET have positioned the program group members to better withstand a weaker job market.


-v-
Contents Overview iii List of Tables and Figures vii Preface xi Acknowledgments xiii Executive Summary ES-1 1 Introduction 1 The Evaluation of the Center for Employment Training Replication Sites: An Overview 1 The Challenge: Preparing Out-of-School Youth for Work 3 The Response: Development of the CET Replication Project 5 The CET Replication Evaluation: Site Selection and Startup 8 The CET Program Model 10 Implementing the CET Model 12 Characteristics of the Youth Participating in the Study 15 Factors Likely to Influence the Outcomes and Impacts of the Replication Project 24 Overview of This Report 28 2 Participation in CET’s Education and Training Services and the Impacts on Education and Training Credentials 29 Summary of Findings 29 Participation in Training by the Program Group at CET-Operated Sites 31 Impacts on Education and Training 43 Impacts on Receipt of Education and Training Credentials 55 Conclusion 60 3 The Impacts of the CET Model on Employment, Benefit Receipt, and Income 64 Summary of Findings 64 Employment Experiences of Disadvantaged Youth 66 Impacts on Employment and Earnings 71 Impacts on Benefit Receipt and Income 78 Subgroup Impacts 80 Conclusion 96

-vi-
4 The Impacts of the CET Model on Household and Family Structure, Alcohol and Marijuana Use, and Arrests 97 Summary of Findings 97 Impacts on Household and Family Structure, Alcohol and Marijuana Use, and Arrests 98
Subgroup Impacts 102 Conclusion 113 Appendices A: Training Participation as Reported in the Follow-Up Survey and in the Management Information Systems 117 B: Survey Nonresponse and Bias 131 C: Selected Impacts, by Site 137
References 145 Recent Publications on MDRC Projects 147 About MDRC 154

-vii-
List of Tables and Figures Table 1.1 Summary of Replication Sites’ Fidelity to the CET Model 14 1.2 Characteristics of the CET Replication Sample Compared with CET Subsamples from JOBSTART and MFSP and with JTPA Title II-C Youth 17 1.3 Characteristics of the Control Group at the 30-Month Survey 20 1.4 Characteristics of the Control Group at the 30-Month Survey, by Age, Gender, and Ethnicity 22 1.5 Selected Characteristics of Sample Members, by Site Fidelity 25 2.1 CET Participation by Program Group Members in CET-Operated Sites, as Captured by CET MIS 32 2.2 Length and Intensity of CET Participation by Program Group Members in CET-Operated Sites, as Captured by CET MIS 35 2.3 Average Hours of CET Participation by Selected Subgroups of Participants, as Captured by CET MIS 37 2.4 Average Number of Months and Hours of CET Participation, as Captured by CET MIS 38 2.5 Average Number of Months and Hours of CET Participation, by Type of Training, as Captured by CET MIS 39 2.6 Selected Program Outcomes, as Captured by CET MIS 41 2.7 Program Completion with Employment, as Captured by CET MIS 42 2.8 Impacts on Survey-Reported Participation in Education and Training 45 2.9 Impacts on Survey-Reported Hours of Participation in Education and Training 48 2.10 Impacts on Percentages Reporting Participation in Training in Months 1 to 6 on the Survey, by Subgroup 49 2.11 Impacts on Reported Hours of Participation in Training in Months 1 to 6 on the Survey, by Subgroup 50 2.12 Impacts on Percentages Reporting Participation in Training in Months 1 to 6 on the Survey, by Site Fidelity and Site Fidelity/Gender Groups 52 2.13 Impacts on Reported Hours of Participation in Training in Months 1 to 6 on the Survey, by Site Fidelity and Site Fidelity/Gender Groups 53 2.14 Impacts on Survey-Reported Receipt of Education and Training Credentials 57 2.15 Impacts on Percentages Reporting Receipt of a Training Certificate, by Subgroup 59 2.16 Impacts on Percentages Reporting Receipt of a Training Certificate, by Site Fidelity and Site Fidelity/Gender Groups 61 3.1 Employment and Income of the Control Group 68 3.2 Employment Experience of Youth in the Control Group 70 3.3 Impacts on Employment and Earnings 74

-viii-
3.4 Impacts on Job Characteristics 75 3.5 Impacts on Employment Stability 77 3.6 Impacts on Benefit Receipt and Income 81 3.7 Impacts, by Site Fidelity 83 3.8 Impacts, by Gender 86 3.9 Impacts, by Education Level 88 3.10 Impacts, by Age at Random Assignment 91 3.11 Comparison of Effects for Women and for Men in the High-Fidelity Sites 93 4.1 Impacts on Household Structure and Housing Status 99 4.2 Impacts on Family Structure and Child Care 100 4.3 Impacts on Alcohol and Marijuana Use and Arrests 101 4.4 Impacts, by Site Fidelity 103 4.5 Impacts, by Age at Random Assignment 106 4.6 Impacts, by Gender 109 4.7 Impacts, by Education Level 114 A.1 Number and Percentage of MIS-Survey Match Sample Who Reported That They Had Participated in Training Since Random Assignment 121 A.2 Number and Percentage of MIS-Survey Match Sample Who Reported That They Had Participated in Training Since Random Assignment, by Site Fidelity Rating 122 A.3 Number and Percentage of MIS-Survey Match Sample Who Reported That They Had Received Training Since Random Assignment, by CET MIS Skill Code 123 A.4 Number and Percentage of MIS-Survey Match Sample Who Reported That They Had Received Training Since Random Assignment, by Subgroups Defined by Demographic Characteristics 124 A.5 Number and Percentage of MIS-Survey Match Sample Who Reported That They Had Received Training Since Random Assignment, by Year of Random Assignment 125 A.6 Types of Training Reported by Participants Who Reported That They Had Participated in Training Since Random Assignment 126 A.7 Relationship Between the Number of Months That Respondents Received CET Training and the Reporting of Training Activity in the Survey 127 A.8 Relationship Between the Number of Hours That Respondents Received CET Training and the Reporting of Training Activity in the Survey 128 A.9 Relationship Between the MIS Status Codes and the Reporting of Training Activity in the Survey 129 B.1 Survey Response Rates (Percentages) 132
B.2 Comparison of the Characteristics of the Baseline Survey Sample 134
C.1 Percentage Reporting Participation in Training in Months 1 to 6 on the Survey, by Site 138
-ix-
C.2 Reported Hours of Participation in Training in Months 1 to 6 on the Survey, by Site 139 C.3 Reported Receipt of a Training Certificate, by Site 140 C.4 Number of Months Employed in Months 25 to 29, by Site 141 C.5 Total Earnings in Months 25 to 29, by Site 142 C.6 Reported Alcohol Consumption in the Month Before Follow-Up, by Site 143 C.7 Reported Having Had a Child Since Random Assignment, by Site 144 Figure 1.1 Locations of the CET Replication Sites 9 2.1 Participation in CET Training, by Month After Random Assignment 34 3.1 Monthly Employment Rates for the Control Group 67 3.2 Monthly Employment Rates for the Program and Control Groups 72 3.3 Monthly Benefit Receipt for the Program and Control Groups 79 A.1 Reporting of Training Participation in Survey and CET MIS Data, by Month After Random Assignment 119


-xi-
Preface
One of society’s most intractable and challenging issues has been how best to prepare young people — especially those without postsecondary education or training — to compete in the labor market. Unemployment rates among youth, and especially among young men, re-mained high even during the economic expansion of the 1990s, in part due to the growing skill requirements of jobs. Employment prospects are even worse for youth who have not completed high school. Unfortunately, the history of employment and training programs for at-risk youth has not been encouraging.
The program developed by the Center for Employment Training (CET) is an exception. Headquartered in San Jose, California, CET received extensive attention in the early 1990s be-cause, in two major studies, its program was the only one that was able to increase the employ-ment and earnings of disadvantaged youth. The CET replication study was an outgrowth of this remarkable performance. Initiated and funded by the U.S. Department of Labor in the early 1990s, this evaluation is designed to test the ability to replicate the CET model beyond its tradi-tional base in San Jose and to assess whether and how programs in 12 replication sites benefit out-of-school youth.
This report is the second in a series evaluating the CET model’s effects in the replica-tion sites, and it presents the findings after 30 months. The earlier report described the model’s implementation across the 12 sites and presented early findings on youths’ participation in its services. A future report will examine the replication programs’ effects after 54 months.
The 30-month story is best told as a site story. The implementation report showed that the sites varied in their ability to replicate the CET model; only four sites implemented the model with high fidelity. Not surprisingly, these site differences led to differences in impacts on participation and employment. The high-fidelity sites increased youths’ participation in em-ployment and training activities and led to fairly large increases in the receipt of training creden-tials, as compared with youth in the control group. The impacts were much smaller, however, in the sites that implemented the model less successfully.
In terms of employment outcomes, the major success story in the high-fidelity sites was for young women. In these sites, the CET model led to a substantial increase in the number of women who worked during the follow-up period and to a large increase in their earnings. In contrast, these same sites produced small and even negative effects for young men. The model’s impacts in the medium- and low-fidelity sites were either negative or negligible.
Although the findings for young women are encouraging — especially in light of wel-fare reform and time limits on benefits — the lack of positive impacts for males in the high-

-xii-
fidelity sites continues a disappointing pattern for disadvantaged men. The results for men across a range of studies suggest that employment programs have not yet been able to address some of the key barriers that men face in trying to acquire training and move into better jobs. However, during the follow-up period for this report, the programs operated in an expanding economy, leading to employment rates for the control group that were higher than expected and that created a high hurdle for the program to beat. This was especially true for the young men in the sample. The longer follow-up period of 54 months will extend into the current economic slowdown, providing an opportunity to see if the enhanced skills produced by the CET model will help young people weather a weaker labor market.
Kent McGuire Senior Vice President

-xiii-
Acknowledgments
This report reflects the input and support of many people. We first want to thank the U.S. Department of Labor for recognizing the importance of continuing to fund research on “what works” for disadvantaged youth. We also thank staff at the Center for Employment Training headquarters in San Jose and at each of the participating CET sites around the country.
At the Department of Labor, Dan Ryan and David Lah have provided continuing sup-port for the evaluation as well as helpful comments on an earlier draft of this report. Thomas NaSell was also active in this effort, prior to his retirement. At MDRC, we thank Rob Ivry for helpful comments on an earlier draft. Also at MDRC, Vanessa Martin processed and analyzed data from the 30-month survey and coordinated the production of the report. At Berkeley Policy Associates, Kalpna Mistry provided valuable research assistance with the reporting of the find-ings. Robert Weber edited the document, and Stephanie Cowell prepared it for publication.
The Authors


ES-1
Executive Summary
Young people who lack postsecondary education or vocational credentials face an up-hill battle in the competition for jobs. The Center for Employment Training (CET) in San Jose, California, produced strong positive impacts for youth in two prior national studies. CET is noted for enrolling trainees with little prescreening, for providing training in a worklike setting, for requiring a full-time commitment from trainees, for involving employers in the design and delivery of training, for integrating instruction in basic skills into the training, and for allowing trainees to progress as they master competencies, without any fixed schedule. Two national ran-dom assignment studies (the JOBSTART Demonstration for young high school dropouts and the Minority Female Single Parent Demonstration) included CET as a site and found positive employment impacts; importantly, all other sites in both studies had little or no impacts on these outcomes. Building on this record of demonstrated effectiveness, the U.S. Department of Labor (DOL) funded CET to replicate its programs in new sites in eastern states and the Midwest. Some of these new sites — as in the existing western network — were operated by CET, while others were operated by other organizations.
MDRC and Berkeley Policy Associates (BPA) are collaborating on the evaluation of this replication effort, under contract to DOL. The evaluation documents the replication sites’ fidelity of services to the CET approach and uses a random assignment design to assess pro-gram impacts on education, training, employment and earnings, and other relevant outcomes. It is being conducted in twelve sites: six relatively new programs, established in the early 1990s, that were part of the DOL replication effort (two of which were operated by CET) and six more-established programs, in operation between 5 and 20 years, that are part of the network of pro-grams in western states that was created and operated by CET. The first report in this evaluation described program implementation in the twelve sites, the preprogram characteristics of the study sample, and early participation in program activities.1 The present report adds an analysis of program outcomes and net impacts as captured by a survey conducted approximately 30 months after random assignment.
The overall study sample includes 1,485 youth between ages 16 and 22. Approxi-mately half were randomly assigned to the program group and received access to CET ser-vices, and half were randomly assigned to the control group and were not given access to CET services but were able to enroll in other education and training activities. The sample is broadly representative of youth served in federally funded employment and training pro-grams, though it does have slightly higher percentages of school dropouts and parents than are
1Stephen Walsh, Deana Goldsmith, Yasuyo Abe, and Andrea Cann, Evaluation of the Center for Em-ployment Training Replication Sites (2000).

ES-2
found in the national service population and substantially higher percentages of Hispanic and African-American youth, because of the urban location of most of the study sites. Eighty-eight percent of the study sample completed a 30-month follow-up survey, producing an overall impact sample of 1,306 for this report.
Findings in Brief • Implementation of the CET approach is difficult, and the fidelity of program
services to the original CET model varied greatly across the sites, affecting both implementation and program impacts.
• In the four sites implementing the CET model with high fidelity, access to the program increased youths’ participation in training activities substantially above the level for the control group and increased the percentage of youth completing a training certificate. In the medium- and low-fidelity sites, the impacts on service receipt and completion were smaller.
• In the high-fidelity sites, access to the program produced substantial positive impacts across a range of employment-related outcomes for young women. These included impacts on the percentage ever working, on employment rates at the follow-up survey, and (quite probably) on total earnings — though the small sample prevents a statistically significant finding.
• For young men, the results in high-fidelity sites were either negative or neg-ligible. As in the past, it has proved difficult to improve the employment prospects of low-income young men.
• In the medium- and low-fidelity sites, impacts were either negative or negli-gible across a range of outcomes for the full sample and for all key sub-groups.
• These findings are similar to prior results from CET-San Jose, where imple-mentation was very strong and the research findings were largely driven by positive impacts for young women. The employment impacts reported here occurred during a period of strong demand for labor that provided unusual job opportunities for youth with low skills, so the longer-term follow-up that is now under way is important because it will extend into the recent eco-nomic slowdown.

ES-3
Implementation of the CET Model in the Study Sites • The CET approach is difficult to implement — only four of the twelve
study sites put all the key aspects of the model in place — and sites with greater fidelity of implementation produced stronger impact findings.
Implementation of the model was strongest among four of the established western sites that were part of the network of programs that CET developed and operated as it gradually ex-panded its operations. These high-fidelity sites were able to put in place all the key aspects of the program. Other sites that were newly established, that were operated by organizations other than CET, or that shared both characteristics had much more difficulty implementing the full model. Six sites implemented it with medium fidelity, and two did so with low fidelity. Because of their location in the western states, the four high-fidelity sites served many Hispanic clients. An analysis of site impacts that controlled for the characteristics of each site’s sample revealed that differences in findings across sites were largely driven by fidelity of program implementa-tion rather than by differences in sample characteristics. Thus, much of the analysis focuses on grouping the sites by the strength of their implementation.
The weaker-implementing sites tended to lack intensive participation in training and strong organizational stability. CET offers full-time services and seeks to involve participants intensely in education and training to quickly prepare them for work. Only the high-fidelity sites were able to generate the intense participation called for in the CET approach. Successful im-plementation also requires the sustained attention of leaders committed to the approach. This was present in the high-fidelity sites, but the medium- and low-fidelity sites tended to have turnover in leadership, funding changes that led them to depart from the CET approach, or even closure of the programs because of administrative problems or changing priorities.
• In the high-fidelity sites, access to CET significantly increased participa-tion in skills training during the early months of follow-up.
In the high-fidelity sites, survey respondents in the program group reported an average of 218 hours of skills training in the first six months of follow-up (including zeros for those who reported no participation in skills training), compared with 36 hours for control group members — an impact of 183 hours. In the medium- and low-fidelity sites, the comparable average in-creases were only 62 hours and 20 hours, respectively.
• Access to CET significantly increased receipt of training credentials, with the largest increase occurring in the high-fidelity sites.
By the end of the follow-up period, 39 percent of program group members reported re-ceiving a training credential, compared with 25 percent of control group members, for a differ-

ES-4
ence of 15 percentage points. In the high-fidelity sites, the difference in credential receipt was 24.9 percentage points; smaller impacts were found in the medium- and low-fidelity sites.
Impacts on Employment and Other Outcomes • The period covered in this report was one of strong demand for low-
skilled labor, which led to unusually favorable employment outcomes for members of the control group.
Youth with low skills had better job prospects within the strong economy of the mid to late 1990s than in other recent periods. Thus, to produce positive employment impacts, the pro-gram faced an unusually high benchmark of employment among control group members. Al-though youth typically apply for a training program like CET when they are unemployed, nearly 20 percent of the control group reported employment in the month following their entry into the research sample. Over the follow-up period, this employment rate gradually rose; in the final month of follow-up, more than 60 percent of the control group — and about 55 percent of those without a high school education — reported employment. As a further illustration, in the high-fidelity sites, 83 percent of women in the control group and 100 percent of men reported working at some point during the follow-up period.
• In the high-fidelity sites, the CET model led to a substantial increase in women’s employment and earnings and to an increase in marriage, childbearing, and arrests for younger sample members, but it had nega-tive impacts on young men’s employment and earnings.
Given the strong labor demand reported above, the program’s employment impacts are especially interesting. For women in high-fidelity sites, the program increased the percentage who ever worked during the follow-up period (from 83 percent to 92 percent) and who were working at the time of the follow-up survey (from 47 percent to 61 percent). In addition, it ap-peared to increase earnings in the last six months of follow-up, from $3,610 to $4,228, and earn-ings over the entire period, from $12,325 to $14,094 — but neither of these results was statisti-cally significant, given the relatively small sample size. For men, access to CET led to a decline in the percentage who ever worked in the follow-up period (from 100 percent to 93 percent) and to a decrease in earnings in the last six months (from $6,391 to $4,954).
These different results by gender are related to the higher levels of control group em-ployment for men and to shifts in particpants’ industry and occupation that the program pro-duced for each gender. For women, the CET model produced a shift away from retail trade and toward other industries (especially transportation) and a shift away from service occupations to clerical, with an increase in the percentage of women earning $7 to $9 per hour. For men, access

ES-5
to CET led to shifts into the construction and manufacturing industries, without an accompany-ing move into the occupations for which they were trained. In combination, these shifts pro-duced a slight (statistically insignificant) increase in hourly earnings but a decline in average hours worked (largely because of a decline in the percentage of men working more than 40 hours per week). It appears that although the training may have induced shifts in industries, the new skills did not position the men to maintain their work hours over time in these more skill-intensive settings.
• In the medium- and low-fidelity sites, impacts were either negligible or negative for both employment-related and other outcomes.
Most impacts in the lower-fidelity sites were not statistically significant. But access to CET reduced the employment rates and the third-year earnings of youth who lacked a high school diploma at program entry. Further, the programs in these sites also reduced the employ-ment rates of women and program entrants older than 19 and reduced the third-year earnings of teenage entrants. These negative impacts highlight the importance of implementing the program strongly.
Implications The findings in this report clearly highlight the importance of implementing the CET
approach strongly; the sites showing high fidelity to the CET model produced more substantial impacts. The results at this stage for young women appear similar to those in earlier studies: Where CET is implemented well, there are positive impacts on employment-related outcomes. Unfortunately, the current findings also continue a pattern of disappointing results for young men within employment and training evaluations. In part, this pattern appears to be linked to young men’s relatively high employment rates in the absence of special training and to the in-ability of training to shift them into more stable and higher-paying jobs. The findings could re-flect the short duration of the training and the reluctance of employers to hire young men (espe-cially those of color) for more demanding, more rewarding jobs.
It is also important to remember the context in which these findings rest: The very strong demand for low-skilled workers boosted the employment and earnings of the control group to higher levels than in past studies, making it more difficult for the program to produce positive impacts. The longer-term follow-up that is now under way will extend into the current economic slowdown, providing an opportunity to see whether the enhanced skills that are pro-duced by the CET model will help young people to maintain their employment and earnings better than their counterparts who do not have access to this program.


-1-
Chapter 1
Introduction
The Evaluation of the Center for Employment Training Replication Sites: An Overview
One of the most intractable and challenging issues in our society and economy has been how best to prepare young people — especially those with significant barriers to employment — to compete in the labor market and to mature into productive members of society. Over the past several decades, numerous programs have attempted to prepare out-of-school youth for careers and fulfilling adult lives; yet most of the programs that were rigorously evaluated were found to have little impact on outcomes for youth. For example, the U.S. Department of Labor (DOL) funded a multi-year random assignment evaluation of Title II-A of the Job Training Partnership Act (JTPA) that examined the effects of employment and training programs on youth in 15 sites around the United States.1 This evaluation found that JTPA programs had largely negligible and sometimes negative impacts on employment and self-sufficiency out-comes for out-of-school youth.2 Many observers inferred from these findings — and from simi-lar findings from the evaluation of JOBSTART, a more intensive program targeted at out-of-school youth — that employment programs could not effectively serve these youth. However, others interpreted these findings as indicators that strategies for serving this group should be reexamined and that new approaches building on exemplary programs and approaches should be replicated and tested more broadly.
The Center for Employment Training (CET) in San Jose, California, was one employ-ment and training program that showed considerable promise as an alternative to prevailing em-ployment and training services for youth. Two national random assignment evaluations of pro-grams in which CET was included as a site — the Minority Female Single Parent Demonstra-tion (MFSP) and the JOBSTART Demonstration — showed that CET was uniquely able to achieve positive results.3 Building on this track record of effectiveness, DOL in 1992 initiated and funded the CET replication demonstration, which eventually operated in 22 sites. In each site, the national CET office in San Jose cooperated with a local CET program (ranging from newly formed entities to long-established organizations) to implement employment and training services for out-of-school youth, modeled on the services and program approach that character-ize CET-San Jose.
1The evaluation had 16 sites overall, but one site did not include youth in the sample. 2Bloom et al., 1997. 3Zambrowski, Gordon, and Berenson 1993; Cave, Bos, Doolittle, and Toussaint, 1993.

-2-
The CET service design has several distinctive features that are described in detail later in this chapter. Chief among them are the worklike environment in which participants learn job-specific skills, the requirement that participants make a full-time commitment to the program, and the close involvement of industry in the program’s design and operation.
MDRC and Berkeley Policy Associates (BPA) are collaborating on the Evaluation of the CET Replication Sites, which includes documenting the replication process and assessing program impacts on education, training, employment, and other relevant outcomes for out-of-school youth. This is the second report of the evaluation. The interim report described the pro-gram’s implementation experience, the baseline characteristics of the youth who participated in the study, and early participation in program activities.4 The present report adds an analysis of program outcomes and net impacts through the 30-month follow-up survey. A final report ex-amining outcomes through the 54-month follow-up survey will be released in 2004.
Like the JTPA, JOBSTART, and MFSP evaluations, the Evaluation of the CET Repli-cation Sites employs a random assignment research design, which is considered to be the best possible research design in terms of producing unbiased estimates of program effects. Between November 1995 and September 1999, researchers recruited a sample of 1,485 out-of-school youths. After the youths were determined to be eligible to receive the CET services funded un-der this evaluation, they were enrolled in the study and were randomly assigned to either the program group (748 members) or the control group (737 members). Program group members were entitled to receive CET services. Control group members were barred from receiving CET services for 24 months, although they could enroll in other local service programs. CET opera-tions have been studied through a series of in-person visits to the replication sites. The impacts on employment, education, and other outcomes for the youth in the evaluation are being as-sessed through follow-up surveys administered by the Institute for Survey Research (ISR) at Temple University, at 30 months and 54 months after random assignment. The present report presents the results of the 30-month survey; the 54-month survey is still being fielded.
This first chapter summarizes the 2000 interim report on implementation and sets the stage for the remainder of this report. The next section discusses the issues and challenges asso-ciated with youth employment and establishes the context for the CET replication effort. Subse-quent sections describe the CET program model in detail, the implementation experience in the replication sites, and the characteristics of participants at baseline (random assignment) and fol-low-up. The chapter concludes with a discussion of the factors that are likely to influence pro-gram outcomes and an overview of the report’s remaining chapters.
4Walsh, Goldsmith, Abe, and Cann, 2000.

-3-
The Challenge: Preparing Out-of-School Youth for Work Over the past three decades, the difficulties that adolescents face as they approach adult-
hood have increased noticeably. Young people encounter increasingly stiff competition in the labor market; the skill levels demanded in the workplace have grown significantly, eroding em-ployment opportunities and earnings for those with fewer skills and lower education levels.5 As jobs become more knowledge-intensive and technology-intensive, they increasingly require that workers be literate, educated, and ready to learn. Employers typically expect entry-level work-ers to have solid basic skills and to be prepared to learn technical and job-specific skills quickly. The range of career paths that can be followed by individuals who have no postsecondary edu-cation has narrowed.
Even when they do find jobs, young workers can expect lower real earnings than were achieved in previous decades. Between 1973 and 1995, for instance, median inflation-adjusted earnings of young adult men declined by over 31 percent. In 1995, nearly half of young adults were unemployed, unable to find a full-time job, or earning less than $300 per week.6 This ero-sion of young people’s earning power stems from the widening mismatch between their educa-tion and skill levels and the requirements of an ever-changing labor market. Even though the first follow-up period of this evaluation has been characterized by solid growth in the overall economy, the labor market challenges faced by disadvantaged youth have persisted.
Generally speaking, disadvantaged youth are the last to benefit from expanding job op-portunities and the first to feel the brunt of recession. During 2001 and early 2002, for instance, the total decline in employment among all young adults ages 16 to 24 was 984,000, or 53 per-cent of the total job losses among all U.S. adults — despite the fact that these same young adults represented only about 15 percent of all employed adults at the beginning of this time period.7
Career prospects are most severely limited for youth who have not completed high school. In 1999, the National Center for Education Statistics reported that five of every hundred high school students had dropped out during the previous school year. This estimate is similar to data reported over the preceding decade. About 2.4 million youth ages 16 to 24 lack a high school diploma or a General Educational Development (GED) certificate and are no longer in school. Only one in six of these young people are able to find a full-time job paying more than poverty-level wages (corresponding to $320 per week).
Young people who drop out of high school face significant and persistent obstacles. They can expect to raise their children in poverty, as did most of their parents; many will give
5Smith, 1997. 6Sum and Pines, 1997. 7Sum, McLaughlin, Motroni, and Palma, 2002; Brown, 2002.

-4-
up on a system that offers them few second chances. The resulting frustration, low self-esteem, and alienation contribute to other social problems, such as substance abuse, teenage childbear-ing, criminal activity, violence, and family instability.
A variety of programs, using different approaches, aim to combat the failure of many young people to develop the knowledge and skills needed to live productive adult lives. The overriding goal of such programs is to prepare at-risk youth for careers as adults — careers that provide advancement opportunities and that pay well enough to support a family and lead a ful-filling life.
Researchers and practitioners in the youth employment and youth development fields have been discouraged by the outcomes achieved by most employment programs serving at-risk and out-of-school youth. Historically, federally funded programs designed to assist at-risk youth attain employment and self-sufficiency have consisted of a patchwork of short-term stand-alone services delivered by a loosely coordinated network of providers, often resulting in redundan-cies and inefficiencies and seldom producing the desired results.
The National JTPA Study is possibly the largest evaluation of federally funded employ-ment and training services for youth to date.8 First implemented between 1987 and 1989 and funded by DOL, this evaluation measured the impacts of JTPA-funded services for economically disadvantaged adults and out-of-school youth. Sixteen sites participated in the study, which en-rolled 20,601 individuals, including 5,690 economically disadvantaged out-of-school youth.
The National JTPA Study assessed the impacts of three major “service strategies,” includ-ing classroom training in occupational skills, on-the-job training/job search assistance, and other services, which consisted of an assortment of basic education and employment-related services. Study participants were recommended for one of these three types of services and then were as-signed to either an experimental group or a control group. Long-term outcomes were measured through two follow-up surveys and analysis of Unemployment Insurance wage records.
The findings from the National JTPA Study for out-of-school youth were striking. Counter to the program’s intention, 18 months after random assignment, the cumulative earn-ings of male out-of-school youth in the experimental group were at best no better and, based on survey data, were lower than their counterparts in the control group. For male out-of-school youth who were recommended for on-the-job training/job search assistance or other services, these negative impacts were statistically significant, suggesting that access to JTPA services actually reduced their earnings. Earnings impacts were slightly negative, but not statistically significant, for male out-of-school youth who were recommended for classroom training — the
8See Bloom et al., 1993, 1995, 1997; Orr et al., 1996.

-5-
strategy most similar to services offered by CET-San Jose in other studies. Analysis of these results also suggested that the experiences of male out-of-school youth who had a prior arrest record may have been responsible for the poor findings on male out-of-school youth in general. Impacts for female out-of-school youth were essentially negligible.
In the short run, policymakers responded to the findings of the National JTPA Study by reducing funding for youth programs. In the longer run, the authors of the Workforce Invest-ment Act (WIA) of 1998 clearly recognized the importance of developing successful strategies for serving youth, especially out-of-school youth. In contrast to the predecessor Job Training Partnership Act, WIA encouraged the development of long-term comprehensive youth services and mandated that 30 percent of youth funds be used to serve out-of-school youth. Those who conducted the WIA Implementation Readiness reviews identified serving out-of-school youth as one of the most crucial issues facing state and local government. As demonstrated by the high unemployment rates for the 14- to 21-year-old population served by WIA, youth who are not in school continue to have problems connecting to the labor market. The 2002 DOL guid-ance letter also pointed out that identifying youth in need of services is not nearly as challenging as is recruiting them and keeping them engaged in the program long enough to impart the needed basic skills, work readiness skills, and occupational skills.9
The Response: Development of the CET Replication Project The CET replication effort was an outgrowth of the remarkable performance of a single
employment and training program: the Center for Employment Training. CET is a community-based employment and training organization with headquarters in San Jose, California. CET received extensive attention in the early 1990s through the involvement of its San Jose head-quarters in two major random assignment studies of employment and training programs for dis-advantaged youth: the Minority Female Single Parent Demonstration and the JOBSTART Demonstration.
CET Achievements in the Minority Female Single Parent Demonstration
The Minority Female Single Parent Demonstration (MFSP) was initiated by The Rockefeller Foundation, was implemented between 1982 and 1988, and was evaluated by Mathematica Policy Research.10 The goal of the MFSP Demonstration was to increase the self-sufficiency of single mothers and to decrease their reliance on welfare. Four community-based organizations (CBOs), including CET-San Jose, participated in the demonstration. Nearly 4,000
9U.S. Department of Labor/ETA, 2002. 10Burghardt, Rangarajan, Gordon, and Kisker, 1992; Zambrowski, Gordon, and Berenson, 1993.

-6-
women were enrolled in the study; half were randomly assigned to a treatment group and were allowed access to services, and half were randomly assigned to a control group and were not eligible for services from the CBOs during the 30-month period following their assignment.
The MFSP Demonstration was designed to provide a comprehensive set of employ-ment-related services, along with child care assistance, basic education, occupational skills training, and job placement assistance. The configuration of these services in the four demon-stration sites, however, varied substantially. In addition, the sites’ service designs evolved over the 30-month period of operation.
Evaluators conducted follow-up surveys of enrollees 12 and 30 months after their ap-plication to the program, to assess changes in employment and earnings, income, welfare re-ceipt, educational attainment, and social and psychological well-being. In several of these areas, impacts were negligible for enrollees at all four participating CBOs. Only CET-San Jose pro-duced measurable gains in average earnings and educational attainment.
CET-San Jose’s earnings impacts for the initial 30-month follow-up period totaled $2,062 per enrollee.11 These gains persisted for an extremely long period. A subsequent follow-up survey limited to CET-San Jose enrollees and conducted 60 months after program entry found program group members still averaging close to $100 per month more in earnings than control group members.12 These gains were statistically significant — and were unprecedented for a random assignment evaluation of an employment and training program that targeted youth.
The exceptional results for CET-San Jose in the MFSP demonstration generated intense speculation among evaluators about the reasons for its success. Although the study had not been designed to identify specific program components responsible for these results, the evaluators hypothesized that several distinctive features of the CET-San Jose program might help explain its performance. These features were not found at the other CBOs in this demonstration and in-cluded the immediate availability of occupational training to applicants, without regard to prior education or test results; close coordination with employers to ensure that training courses were targeted to hiring needs; extensive job placement assistance; and assistance with locating and paying for child care.
CET Achievements in the JOBSTART Demonstration
The JOBSTART Demonstration sought to test whether an array of comprehensive em-ployment-related services could be implemented within the constraints of the Job Training Part-nership Act and whether such services could produce gains in educational attainment, employ-
11Burghardt, Rangarajan, Gordon, and Kisker, 1992. 12Zambrowski, Gordon, and Berenson, 1993.

-7-
ment, earnings, and other outcomes. Like MFSP, JOBSTART utilized a classic experimental design with long-term tracking of enrollees. But unlike the MFSP study, which set no restric-tions on age, JOBSTART targeted economically disadvantaged youths ages 17 to 21 who had dropped out of school. A total of 2,312 such youths were enrolled in the study, and follow-up surveys were conducted at 12, 24, and 48 months after random assignment.
Thirteen sites, including CET-San Jose, participated in the JOBSTART Demonstration, which operated between 1985 and 1988. Sites were selected to include an array of organiza-tional types: community-based organizations, Job Corps centers, adult vocational schools, and a community college. Sites were required to implement a service model that included self-paced basic skills training, occupational skills training, training-related support services, and job placement assistance. Sites were required to offer participating youth at least 200 hours of basic skills training and at least 500 hours of occupational skills training.
Overall, JOBSTART’s results mirrored those found in the National JTPA Study, show-ing few positive impacts across the 13 sites. CET-San Jose again was the exception. Its impacts on earnings averaged close to $7,000 per enrollee over the 48-month follow-up period. These results were statistically significant even though the CET-San Jose sample was very small (only 167 youths). As a result, the CET program attracted much attention from policymakers and pro-gram developers intent on improving employment and training services for young people. As with the MFSP study, JOBSTART’s evaluators could not definitively explain CET’s out-standing program effects, but they offered similar hypotheses for its success. These included the absence of educational requirements for entry into the program, an organizational emphasis on employment as the chief goal for trainees, training courses targeted to local job openings, strong job placement efforts, substantial services provided during a relatively short period, and a strong local labor market.13
The Genesis of the CET Replication Project
Encouraged by CET-San Jose’s performance in both the JOBSTART and the MFSP evaluations, the U.S. Department of Labor sought to test whether CET-San Jose’s successes could be replicated. Specifically, DOL wanted to determine whether programs like CET-San Jose could be implemented successfully in different settings and whether the resulting programs would have similarly positive effects for youth.
In 1992, DOL initiated a process to replicate the CET approach.14 DOL awarded CET’s corporate office — headquartered in San Jose — the first of several grants to provide technical
13Burghardt, Rangarajan, Gordon, and Kisker, 1992; Cave, Bos, Doolittle, and Toussaint, 1993. 14U.S. Department of Labor, 1992.
-8-
assistance to local employment and training programs and to organizations interested in replicating the CET model. Organizations interested in receiving such training were encouraged to submit applications to DOL. Selected organizations received no funding but were eligible to receive CET’s technical assistance to help sites replicate CET’s services.
Because CET had long administered training centers in several western states, the repli-cation sites that were selected were focused on eastern states and the Midwest. DOL initially selected 10 organizations to receive technical assistance — all east of the Mississippi River. From 1994 through 1997, 12 more organizations were selected to receive technical assistance from CET.
DOL saw sufficient promise in the replication sites to commission a rigorous evaluation of their impacts on out-of-school youth. Thus, in 1995, DOL invited existing replication sites to participate in a random assignment evaluation. Random assignment at replication sites began in 1995 and continued through 1999.
The CET Replication Evaluation: Site Selection and Startup As shown in Figure 1.1, the CET replication evaluation involved twelve sites. The se-
lection process proved to be more difficult than anticipated. Of the first ten eastern and mid-western replication sites that DOL invited to participate in the evaluation, six accepted. Potential obstacles to participation may have included the need for sites to expand services to out-of-school youths, the need to secure required local matching funds, or the reluctance to participate in a random assignment study. Such studies typically create new responsibilities for participat-ing programs, requiring them to deny services to some applicants, which, in turn, can create the need to step up recruitment to produce a sufficiently large research sample. Many organizations are unwilling to take on this burden. Of the six sites that agreed to participate in the replication evaluation, many faced challenges in implementing the CET model, and some sites struggled to implement key program elements. Further, enrollment of youth at many sites also lagged behind expectations.
To supplement the initial group of eastern and midwestern replication sites, DOL awarded a separate grant to CET in July 1997 to support expansion of the evaluation with six West Coast sites. These sites were selected at random from among the seventeen sites directly administered by CET in California and Nevada, as were two of the eastern and midwestern sites.15 All of these West Coast sites had been operating for at least five years and, in some cases, for as many as twenty years. These western centers generally were considered to have
15The remaining eastern and midwestern sites included two community-based organizations and two ad-ministrative entities under the Job Training Partnership Act.

-9-
already overcome the implementation challenges faced by the newer eastern and midwestern sites, and their inclusion was expected to increase the number of youths who would participate in the evaluation.
The inclusion of these western sites in the evaluation also offered an opportunity to test a more mature version of a replication of the CET model than was possible at the eastern and midwestern replication sites. As a result, the evaluation now offers an opportunity to compare the performance of relatively new eastern and midwestern replication sites with the perform-ance of CET’s existing and highly experienced network of western sites. This helps to address the extent to which CET-San Jose’s many years of development and experience (which it shares with many of the other western sites) account for its success in serving out-of-school youth.
Evaluation of the CET Replication Sites
Figure 1.1
Location of Replication Sites
• Riverside Oxnard •
Oakland • • Reno • San Francisco
• New York
Camden •Chicago • • Newark
• Reidsville
• Orlando
• El Centro
• Santa Maria

-10-
The CET Program Model Despite the great attention given to the CET model by researchers and policymakers, its
components have never been strictly defined. Researchers have pointed to the distinctive fea-tures of CET’s programs in San Jose and elsewhere, but there is no conclusive research regard-ing the relative importance of these features to the success of CET-San Jose. DOL’s efforts to encourage organizations to apply for technical assistance to replicate the CET model high-lighted CET-San Jose’s results in past evaluations, but the department never specified the key features to be replicated.16 Materials produced by CET have sometimes identified distinctive aspects of its program, but they have also reflected the organization’s own uncertainty about the reasons for its success.17 It is widely recognized that CET-San Jose is different from other em-ployment and training programs in many regards, and yet the importance of these differences to the program’s success is not fully understood. Furthermore, because of the focus on the San Jose program itself, little is known about the extent to which the economy and other contextual factors contributed to its successes.
For the purposes of this report, the distinctive elements of the CET model can be sum-marized as follows:18
• Provision of employment and training services in a worklike setting. Employment and training services that mirror the workplace provide the core feature of the CET model. Occupational training emphasizes job-specific skills, and trainees advance at their own pace by demonstrating their attain-ment of specific competencies. Even basic skills training is designed to mir-ror the workplace. Individuals requiring assistance with English, reading, or math receive this instruction in the context of tasks that they might encounter in the jobs for which they are being trained. Trainees do not terminate from CET programs until they find employment, and CET provides active job placement assistance to locate positions for its trainees. These features reflect a key assumption of the CET approach: that trainees should learn in an envi-ronment that resembles the workplace.
• Intensive participation in services. While most training programs offer a part-time schedule of classes, the CET model requires a full-time commit-ment from trainees. This requirement accustoms trainees to a regular work schedule, and it provides the time necessary for them to acquire the skills of their intended trade. It also allows them to acquire these skills quickly, mini-
16U.S. Department of Labor, 1992, 1995. 17Tershy, 1995. 18For more extensive details, see Walsh, Goldsmith, Abe, and Cann (2000).

-11-
mizing the “opportunity cost” of participation in training (that is, the wages lost while participants substitute training for employment).
• Employers’ involvement in the design and delivery of training. Close connections with industry enhance the responsiveness of CET programs to employers, facilitating the design of services that meet employers’ needs. These connections also provide CET programs with access to jobs for their graduates. Each CET program is supposed to have a job developer who works closely with local industry. CET programs develop their connections with industry actively and continuously. Rather than seeking out employers only when trainees are ready for placement, CET programs involve employ-ers in the design of their programs and as reviewers of training curricula. The recruitment of industry representatives as instructors further enhances con-nections with employers. In each of these ways, CET programs integrate em-ployers’ needs and build relationships that enhance success in job placement.
• Organizational capacity and stability. Although inherently difficult to rep-licate, organizational capacity and stability have played a clear role in the past success of CET. CET-San Jose is the headquarters of a substantial community-based organization that has existed for 33 years, during which it has evolved from a single center to a network of more than 30 sites. Simulta-neously, it has developed a cadre of highly experienced and dedicated man-agers. Although difficult to replicate, these features cannot be ignored. CET as an organization has proved highly resilient and has withstood three dec-ades of changes in policy and funding priorities for employment and training organizations. Stable funding and staff are considered essential elements of organizational capacity that enable organizations like CET to focus on their mission — to prepare trainees for employment — instead of focusing all their energy on their own survival. Only stable organizations can pursue the more advanced goals of developing training programs that provide a work-like environment, of ensuring the intensive participation of trainees, and of involving employers in their programs. These goals demand substantial commitments of time and energy from training organizations and their staff. They also require steady funding and organizational stability over an ex-tended period.
• Enrollment and orientation. Much of the attention given to the CET model has emphasized the sequence of services provided to young trainees. These services begin with the intake process. CET has often been noted for providing relatively open access to its programs with little up-front screening. Prospec-tive applicants are not excluded from participation based on test scores, and in-

-12-
dividuals who are considered too hard to serve by other employment and train-ing providers may often participate at CET. Instead of prescreening applicants, CET conducts an extensive preenrollment orientation that stresses the pro-gram’s rigor and the level of commitment expected from students. During this enrollment phase, many less-motivated applicants drop out of the program.
Implementing the CET Model The first research report for this evaluation focused on the replication sites’ imple-
mentation of the CET model (as found at CET-San Jose). Specifically, the report emphasized four distinctive elements of the CET model, which were introduced above and can be summa-rized as follows:19
• Employment and training services designed to mirror the workplace • Intensive participation in such services • Close involvement of industry in program design and operation • Organizational capacity and stability
As part of the implementation research, the 12 replication sites were assessed regarding their fidel-ity to each of these four elements. (Box 1.1 provides examples of different degrees of site fidelity.) Programs that scored high on all these elements were considered to manifest high fidelity to the CET model and were expected to produce more favorable outcomes in the impact analysis.
In summary, the extent of fidelity to the CET model was found to be disappointingly low. Most replication sites had limited success implementing the CET model, and even sites that partially succeeded in replicating the CET model had difficulty sustaining their programs for the full demonstration period. This was true not only for most of the newer eastern and midwestern sites but even for some of the longer-established West Coast sites.
Table 1.1 summarizes the replication sites’ fidelity to key aspects of the CET model. As it shows, only four sites had overall ratings of high fidelity to the CET model. These were the most mature of the western sites — members of the CET network that had been operating for more than twenty years and had become experienced in their delivery of CET services. One site had a moderately high overall rating: an eastern site operated by a large and very stable com-munity development corporation. Five sites were rated as moderately successful in replicating the CET model, including the four sites that were part of the CET network (two western sites, two eastern sites, and the Midwest site) but had been operating for fewer years than the most successful sites — although three of those sites closed their doors before the end of the evalua-
19Walsh, Goldsmith, Abe, and Cann, 2000.

-13-
Box 1.1
Comparison of the CET Model in High-Fidelity and Low-Fidelity Sites
High-Fidelity Sites Low-Fidelity Sites
Design of Services The site closely followed the CET model. Classes were self-paced, competency-based, and operated on an open-entry, open-exit basis. The training of-fered was for jobs demanded in the local commu-nity, and the center was modeled after the work-place in most regards (for example, by having stu-dents clock-in upon arrival each day). Participants had not completed services at CET until they were placed in a job.
The site diverged from the CET model in several im-portant regards. Courses relied on fixed start and end dates. Participants were expected to progress through the course in a lockstep fashion. Some courses required a GED as a prerequisite, screening out potential par-ticipants. Participants were trained for jobs that were not in demand locally. and they received little or no assistance with job placement. Staff typically lost track of participants after coursework was completed.
Participation in Services Participants were actively engaged. Attendance was strong, and participants completed all competencies before graduation. Participants remained in the pro-gram until job placement.
The site had difficulty keeping participants in class. Students typically dropped out before completing their competencies and before receiving job placement assis-tance.
Industry Involvement The site had a strong connection with employers in the industries for which participants trained. Em-ployers were connected to the center through an Industrial Advisory Board and Technical Advisory Committees. Employers’ representatives reviewed curricula, worked with job developers to hire gradu-ates, and donated equipment for training.
The site had no regular or formal connection to em-ployers in the industries for which participants trained. No Industrial Advisory Board or Technical Advisory Committees were active. Curricula were not reviewed or updated to reflect current industry practices. Local employers did not recognize credentials from the site as meaningful.
Organizational Capacity The site had more than 20 years of experience oper-ating the CET model, and the director had been with the site for more than 10 years. Multiple funding sources sustained the training center, which had strong relationships with funders and local employ-ers. The center was well respected by service pro-viders and others in the community.
Unstable funding caused substantial turnover among management and staff. Staff positions went unfilled, and the staff who were hired were not always from industry. Additional new staff and management were not trained in or faithful to the CET model.

Evaluation of the CET Replication Sites
Table 1.1
Eastern/Midwestern Sites Western Sites
Summary of Replication Sites' Fidelity to the CET Model
Feature of Model
New
York
New
ark
Camden
Reidsville
Orlando
Chicago
Reno
San Francisco
El Centro
Oxnard
Riverside
Santa Maria
Training that mirrors the workplace MH M M M MH M MH MH H H H H
Intensive participation in training L L L L L L L L H H H H
Employer involvement in design, training M H M L M H M M H H H H
Organizational stability L M L L L L L L H H H H
Overall fidelity to the CET model M MH ML L M M M M H H H H
SOURCE: Walsh, Goldsmith, Abe, and Cann, 2000.
NOTES: L = low; M = medium; H = high; ML = medium to low; MH = medium to high.
-14-
-15-
tion. The remaining two sites were rated as relatively unsuccessful in implementing the CET model, and one of those sites also closed its doors before the evaluation ended.
In summary, the CET model proved challenging to implement in its entirety, but many of its features appear adaptable to mainstream employment and training programs serving out-of-school youth. A majority of the replication sites achieved at least moderate success in provid-ing a worklike training environment and involving industry in the design and operation of their services. One-third offered training programs that concentrated intensive participation over a relatively short period of time. Sites implemented these features in a wide variety of organiza-tional and geographic contexts. Although the features are not typically seen in other mainstream employment and training programs, there appear to be few inherent obstacles to implementing these aspects of the CET model, given sufficient commitment from policymakers, funders, and program operators.
A greater challenge for the sites than implementing the CET model was sustaining it. While most of the 12 replication sites implemented at least some features that were consistent with the CET model, several programs could not be sustained. Four of the sites closed their doors before the demonstration had ended, and three others faced serious difficulties in main-taining operations.
The difficulties that the sites encountered in sustaining operations suggests that future attempts to replicate the CET model or similar promising program models for youth should consider organizational stability as a critical factor affecting program sustainability. CET-San Jose has taken more than thirty years to establish and refine its own program of employment and training services, yet the replication sites sought to develop a similar model in as few as three years. The sites that were most successful in sustaining their programs had operated em-ployment and training programs for many years and had weathered numerous previous chal-lenges. These sites had close connections to their communities and to local funders, and they could rely on these connections to gain support for innovative programs. The sites that were operated by less experienced organizations faced greater difficulties in implementing the CET model, and they were more likely to fail.
Characteristics of the Youth Participating in the Study
Comparisons with the Youth in Other Studies
The Evaluation of the CET Replication Sites was designed to test whether the impacts achieved by CET-San Jose in earlier studies could be replicated in other locations. The evalua-tion was also designed to produce findings that could inform programs providing similar types of services to out-of-school youth under existing employment and training programs. At the

-16-
time that the CET replication study began, the greatest source of funding for such programs was Title II-C of JTPA, and eligibility rules for the evaluation were modeled on the rules for youth served in JTPA programs.20 This section considers both of the evaluation’s goals by comparing the baseline characteristics of the youth served at the replication sites with the characteristics of youth served under JTPA and in the JOBSTART and MFSP evaluations.
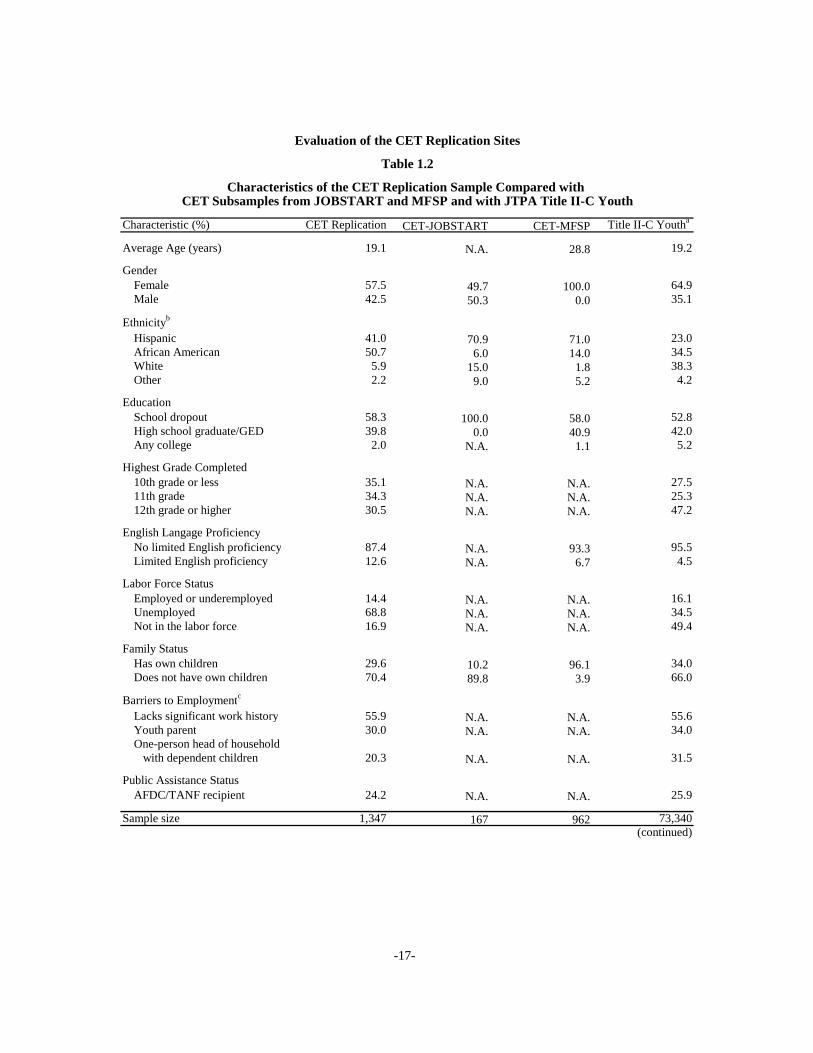
As is evident in Table 1.2, the youths randomly assigned in the CET replication evalua-tion entered the study with different demographic characteristics and educational backgrounds than those served by CET-San Jose in the JOBSTART and MFSP studies. By design, the MFSP group consisted entirely of females, virtually all of whom had children when they entered the study. At 29, their average age was significantly higher than the ages of sample members in the JOBSTART and CET replication studies. Approximately 60 percent of sample members in the CET replication study are female; only 30 percent are parents; and participants’ average age at random assignment was approximately 19. The primary distinguishing characteristic of the JOBSTART sample in San Jose was that all of those sample members were high school drop-outs, also by design. In contrast, approximately 40 percent of the MFSP and CET replication study samples already had a high school diploma or GED at the time of their entry into the study. Also, the CET replication study sample contains relatively fewer Hispanics and more African-Americans than either the JOBSTART or the MFSP group, which reflects the geo-graphic dispersion of the replication study sample.
Both the CET-MFSP and the CET-JOBSTART samples were limited to San Jose, where CET serves primarily Latino clients. Differences in data collection systems and defini-tions precluded straightforward comparisons across these three samples with respect to many other characteristics that may constitute barriers to employment.
Table 1.2 shows that the youth in the CET replication study sample are broadly repre-sentative of youth served in occupational training programs under Title II-C of JTPA in many ways.21 This means that an important goal of the replication study is being met: testing CET’s approach among a more nationally representative population of out-of-school youths. Both the CET replication study sample and the national Title II-C subsample contain large proportions of
20JTPA has since been replaced by the Workforce Investment Act of 1998 (WIA), but the eligibility rules
for youth served under the new program remain largely similar. Eligible youth must be economically disadvan-taged and between the ages of 14 and 21. All youth who were randomly assigned under the CET replication demonstration met these requirements. In addition, the demonstration was limited to youth not currently en-rolled in school — a group that has received special consideration under WIA, which specifically reserves 30 percent of its youth funds for programs serving this population.
21To ensure a closer comparison with the replication sites, the JTPA sample was limited to out-of-school youth between ages 17 and 21 who participated in occupational training. These youth were terminated from JTPA Title II-C programs between June 1, 1997, and June 30, 1998.
-17-
Characteristic (%) CET Replication CET-JOBSTART CET-MFSP Title II-C Youtha
Average Age (years) 19.1 N.A. 28.8 19.2
GenderFemale 57.5 49.7 100.0 64.9Male 42.5 50.3 0.0 35.1
Ethnicityb
Hispanic 41.0 70.9 71.0 23.0African American 50.7 6.0 14.0 34.5White 5.9 15.0 1.8 38.3Other 2.2 9.0 5.2 4.2
EducationSchool dropout 58.3 100.0 58.0 52.8High school graduate/GED 39.8 0.0 40.9 42.0Any college 2.0 N.A. 1.1 5.2
Highest Grade Completed10th grade or less 35.1 N.A. N.A. 27.511th grade 34.3 N.A. N.A. 25.312th grade or higher 30.5 N.A. N.A. 47.2
English Langage ProficiencyNo limited English proficiency 87.4 N.A. 93.3 95.5Limited English proficiency 12.6 N.A. 6.7 4.5
Labor Force StatusEmployed or underemployed 14.4 N.A. N.A. 16.1Unemployed 68.8 N.A. N.A. 34.5Not in the labor force 16.9 N.A. N.A. 49.4
Family StatusHas own children 29.6 10.2 96.1 34.0Does not have own children 70.4 89.8 3.9 66.0
Barriers to Employmentc
Lacks significant work history 55.9 N.A. N.A. 55.6Youth parent 30.0 N.A. N.A. 34.0One-person head of household with dependent children N.A. N.A.
Public Assistance StatusAFDC/TANF recipient 24.2 N.A. N.A. 25.9
Sample size 1,347 167 962 73,340(continued)
Evaluation of the CET Replication Sites
Table 1.2
Characteristics of the CET Replication Sample Compared with CET Subsamples from JOBSTART and MFSP and with JTPA Title II-C Youth
20.3 31.5

-18-
school dropouts and unemployed youth. In addition, many youth in both groups are parents. However, youth in the CET replication study appear to have faced somewhat more difficult cir-cumstances than their JTPA counterparts. While 53 percent of JTPA youth were school drop-outs, 58 percent of replication youth indicated this status. Youth in the CET replication study were almost twice as likely as JTPA youth to be unemployed. Also, slightly more JTPA youth had children and cited parenthood as a barrier to employment, but similar proportions of the two groups were receiving welfare at the time of their application (24 percent of the CET replication study sample versus 26 percent of Title II-C youth).
The most substantial demographic difference between the two samples is seen in their racial and ethnic makeup. Table 1.2 shows that the CET replication study sample is predomi-nantly African-American or Hispanic (91.7 percent combined), whereas these two groups ac-counted for only 57.5 percent of Title II-C youth nationwide. Other demographic differences are less dramatic. Thus, the sample of youth served by the replication sites shares many characteris-tics with youth who received occupational training in mainstream JTPA programs. These two groups appear to have faced similar obstacles to obtaining employment. Therefore, the results from the CET evaluation will be broadly generalizable to the broader population of youth who are eligible to participate in federally funded job training programs.
Table 1.2 (continued)
SOURCE: BPA calculations from CET baseline data. For JOBSTART data, see Cave et al., 1993; for MFSP; for MFSP data, see Burghardt et al., 1992; for JTPA data, see Bloom et al., 1993.For certain demographic characteristics, sample sizes for the CET replication study sample may be smaller than indicated due to missing data. Total sample size ranged from 1,021 cases to 1,347 cases, depending on the demographic characteristic analyzed.
NOTES: The sample analyzed here includes both program and control group sample members. aTo ensure a closer comparison with the replication sites, the JTPA sample was limited to out-of-school youth between the ages of 17 and 21 who participated in occupational training. These youth terminated from JTPA Title II-C programs between June 1, 1997, and June 30, 1998. bThe baseline form in which these data were collected offered program applicants the choice of describing themselves as Hispanic; Black, non-Hispanic; White, non-Hispanic; Asian or Pacific Islander; or American Indian or Alaskan Native. The term African-American is used in this report, but some Black, non-Hispanic applicants may not have selected this term to describe themselves. In addition, due to the fairly low numbers of Asian, Pacific Islander, American Indian, and Alaskan applicants, all applicants identifying with one of these groups have been combined into the Other category. cDue to a change in the format of the evaluation’s intake questionnaire, we were unable to distinguish between members of the CET replication study who did not have barriers to employment and sample members who did not respond to the barriers-to-employment question. Therefore, the figures reported represent the percentage of the total sample who affirmatively identified themselves as having a barrier to employment.

-19-
Characteristics of the CET Youth at the 30-Month Survey
It is also helpful to consider the challenges and barriers that youth in the CET study faced in obtaining and retaining employment during the study period. The CET baseline and survey data include indicators for a number of the challenges and barriers, such as those related to family, housing, and arrests. The findings for the control group are particularly important, because they document the experience of youth in the absence of any treatment.
Thirty months after the out-of-school youth applied to CET, survey respondents were young adults between the ages of 19 and 24. At this time, as is seen in Table 1.3, almost half of the young adults in the control group were still living with their parent(s) or another adult rela-tive.22 Most were still single, although about 13 percent were married and another 20 percent were living with a partner. Almost 40 percent of the youth in the control group faced the chal-lenge of being a young parent when they applied for CET. However, by Month 30, nearly 60 percent of them were parents, and most were living with all their children.
Of the respondents who were living with children,23 over half were living with a spouse or partner (not shown in the table), and many were living with their parents or other family members. However, more than 20 percent of those living with children at the time of follow-up (or 10 percent of all control sample members) were single heads of household — raising chil-dren without a spouse or partner in the household and not living with others. Although em-ployed, the young parents in this sample most often relied on family and household members for child care. Among the parents who were responsible for a child while at their most recent job, half had their children cared for in their own home; approximately a third had their young-est child cared for in another home.
The survey asked a number of questions about the frequency and amount of alcohol and marijuana use in the month preceding the survey. Table 1.3 shows that 30 percent of the control sample reported consuming any alcohol in the prior month and that 9 percent reported using marijuana. These percentages are both relatively low, compared with findings in a national sur-vey of young people of similar ages. The National Household Survey on Drug Abuse (NHSDA) for 2001 found that more than half of people between the ages of 18 and 25 reported drinking in the previous month (more than 60 percent of those between ages 21 and 25) and that 16 percent of people in this same age group had used marijuana in the past month.24 Table 1.3 also shows that only about 2 percent of all control group members reported having received any treatment or counseling in the year prior to follow-up.
22This includes siblings. The survey did not ask the ages of siblings, so it is possible that some of them were not adults.
23This includes stepchildren and other children living in the household. 24U.S. Department of Health and Human Services, 2001.

-20-
Outcome Percentage
Household StructureLiving with parent(s) or other adult relative 44.6Living with spouse or partner 33.0Living with other adults 12.3Living alone 6.9Living with children only 10.3
Housing StatusOwns home 4.1Rents own home 43.6Pays rent to person in household 26.1Doesn’t pay rent 23.5Lives in nonprivate household 2.5Lived in public housing since random assignment 13.5Received housing assistance since random assignment 9.9
Family Structure Marital status
Currently married and living with spouse 12.9Separated or living apart from spouse 3.6Divorced 0.5Widowed 0.2Never Married 82.9
Childbearing and childrenHas own children at follow-up 56.5Had child since random assignment 33.0Had first child since random assignment 17.7Living with all own children 46.9Pregnant at follow-up 7.9
Child CareEver used child care for youngest childwhile working at most recent job 45.5
Care in child’s home 22.7Care in other home 15.8Care at daycare center 6.4School, after-school, or Head Start program 8.3
Alcohol and Marijuana UseReported alcohol consumption in month before follow-up 29.7Reported marijuana use in month before follow-up 9.4Reported receiving treatment or counseling for use of
alcohol or drugs since random assignment 2.2
Arrests Arrested since random assignment 12.6
Sample size 641
Table 1.3
Characteristics of the Control Group at the 30-Month Survey
Evaluation of the CET Replication Sites
SOURCES: MDRC calculations from CET enrollment form and 30-month follow-up survey.NOTE: For some outcomes, the sample size may be smaller than the full sample size due to some missing observations.

-21-
Table 1.4 presents the characteristics of several subgroups of the control sample and
shows some significant differences by age, gender, and ethnicity. Perhaps the most notable dif-ferences are those by gender. At follow-up, 67 percent of the women but only 41 percent of the men in the control group were parents. In addition, as the top panel of the table shows, 17 per-cent of all women were single heads of household at follow-up, compared with less than 1 per-cent of men. These findings show the considerable obstacles facing women in the control group. More than a third of the women gave birth to a child after random assignment, which may have made it more difficult for them, from the start, to continue participating in alternative job train-ing programs or to be employed. Although few men had the burden of being a single head of household, many still faced responsibilities of parenthood.
With respect to age, members of the younger group, as expected, were more likely to be living with their parents and less likely to be married or to have children. Nonetheless, the pro-portion of the younger group who had children was fairly high, at 46 percent.
The subgroup analysis by race also reveals some interesting differences, mainly related to household composition and marriage. For example, the Hispanic control group members were more likely than their African-American counterparts to be living with their parents at follow-up and were more likely to be married and living with their spouse (Table 1.4). And although child-bearing patterns were similar for the two groups, 17 percent of the African-American youth were single heads of household, compared with only 5 percent of the Hispanic youth.
Table 1.4 also reveals large differences between men and women in terms of alcohol and marijuana use and in arrest records. In the month preceding the survey, men were about twice as likely to have consumed alcohol and were more than three times as likely to have used marijuana. The table also shows that 25 percent of the men had been arrested at least once since random assignment, compared with just 4 percent of the women. This analysis reveals a signifi-cant barrier to employment for a relatively large percentage of the men in the control group. Although these men sought to acquire training and to find jobs, employers are often reluctant to hire young men with arrest records.25
Characteristics of the CET Youth, by Site Fidelity
Since the evaluation sites that closely followed the CET model (the high-fidelity sites) had stronger impact findings than the sites that diverged from the CET model (the medium/low-fidelity sites), a comparison of the baseline demographic characteristics and educational back-grounds of the two groups provides a context in which to examine the impact findings. The
25See, for example, Holzer, 1996.

Outcome and Subgroup 19 and Younger Older Than 19 Women Men Black Hispanic
Household Structure (%)Living with parent(s) or other adult relative 52.6 41.8 38.8 53.7 38.0 52.5Living with spouse or partner 29.3 34.9 33.7 32.5 24.6 41.0Living with other adults 12.0 12.8 12.5 12.7 10.1 13.5Living alone 7.7 6.1 4.3 10.0 9.6 2.8Living with children only 7.2 11.8 17.3 0.8 17.1 4.8
Housing Status (%)Rents own home 36.1 46.8 52.9 30.5 47.4 39.7Pays rent to person in household 27.8 25.7 23.0 30.5 25.8 28.7Doesn’t pay rent 28.3 21.3 19.2 29.7 21.3 24.3
Family Structure (%)Marital status
Currently married and living with spouse 10.5 14.0 13.5 12.1 6.2 20.9Separated or living apart from spouse 2.2 4.4 4.6 2.5 3.1 3.6Divorced 0.0 0.7 0.9 0.0 0.7 0.0Widowed 0.6 0.0 0.0 0.4 0.3 0.0Never Married 86.7 80.8 81.0 84.9 89.7 75.5
Childbearing and childrenHas own children at follow-up 45.6 61.1 67.4 40.6 59.5 52.6Had child since random assignment 27.2 34.8 35.0 28.6 32.8 31.7
Child Care (%)Ever used child care for youngest childwhile working at most recent job 34.6 48.9 57.0 28.2 46.3 42.6
Alcohol and Marijuana Use (%)Reported alcohol consumption in month before follow-up 27.2 30.3 19.1 43.6 26.2 30.8
Reported marijuana use in month before follow-up 12.3 8.5 4.9 16.2 11.0 7.3
Reported receiving treatment or counseling for use of alcohol or drugs since random assignment 2.8 2.2 0.9 4.6 2.4 2.0
(continued)
Ethnicity
Table 1.4
Evaluation of the CET Replication Sites
Characteristics of the Control Group at the 30-Month Survey, by Age, Gender, and Ethnicity
Age Gender
-22-

Outcome and Subgroup 19 and Younger Older Than 19 Women Men Black Hispanic
Arrests (%)Arrested since random assignment 17.1 10.3 3.7 25.2 11.2 12.5
Sample size 182 408 348 241 295 249
Table 1.4 (continued)
Age Gender Ethnicity
SOURCES: MDRC calculations from CET enrollment form and 30-month follow-up survey.
NOTE: For some outcomes, the sample size may be smaller than the full sample size due to some missing observations.
-23-

-24-
overall impact sample consisted of 1,306 youths; 393 youths were in the four high-fidelity sites, and 913 youths were in the eight medium/low-fidelity sites.
Table 1.5 presents selected characteristics of the sample members according to site fi-delity rating. The most notable differences are seen in the ethnicity subgroups. The differences are the result of the CET sample’s being largely representative of the populations at the various site locations. For example, the high-fidelity sites, which are located in the western states, are predominantly Hispanic (92 percent), whereas the medium/low-fidelity sites, which are located in eastern and midwestern states, are mainly African-American (73 percent).
Table 1.5 also reveals significant differences in regard to education, employment, fam-ily status, and barriers to employment. Overall, the youth in the high-fidelity sites were at a greater disadvantage in terms of education. They were more likely to be high school dropouts and, thus, were considerably less likely to have more than a high school education. However, the percentage of youths in the high-fidelity sites whose English proficiency was limited was somewhat lower (10 percent) than the percentage of such youths in the medium/low-fidelity sites (13 percent).
With respect to employment, there were slightly more youth employed in the high-fidelity sites (16 percent) than in the low-fidelity sites (14 percent). In addition, approximately 11 percent of youths in the high-fidelity sites — and nearly twice as many (20 percent) in the medium/low-fidelity sites — were not in the labor force.
In general, although the differences between the two groups’ family status are nomi-nal, there is one substantial difference: The youths in the medium/low-fidelity sites were al-most twice as likely as those in the high-fidelity sites to be a single head of household with dependent children.
The greatest barrier to employment for youths in both the high-fidelity and the me-dium/low-fidelity sites was the lack of work history. Moreover, 21 percent of youth in the high-fidelity sites — and over twice as many (44 percent) in the medium/low-fidelity sites — faced the challenge of parenthood.
Factors Likely to Influence the Outcomes and Impacts of the Replication Project
At least two factors can be expected to complicate a straightforward interpretation of this evaluation’s impact analyses. First, the implementation study of the CET replication sites

-25-
Characteristic (%) High-Fidelity Sites Medium/Low-Fidelity Sites
Average Age (years) 19.0 19.2
Gender
Female 48.1 64.3Male 51.9 35.7
Ethnicitya
Hispanic 92.3 18.2African-American 2.1 72.6White 4.1 6.7Other 1.5 2.5
Education
Less than high school education 61.5 54.9High school graduate/GED 38.2 42.2More than high school education 0.3 2.9
English Language Proficiency
No limited English proficiency 89.9 87.1Limited English proficiency 10.1 12.9
Labor Force Status
Employed or underemployed 16.2 13.5Unemployed 72.4 66.7Not in the labor force 11.4 19.8
Family Status
Single head of household with dependent children 14.4 26.8
Single, nondependent 25.3 25.5Dependent 38.6 22.8Other 21.7 24.8
Barriers to Employmentb
Lacks significant work history 63.6 69.3
Youth parent 21.1 44.1One-person head of household
with dependent children 14.6 28.9
Public Assistance
AFDC/TANF recipient 9.6 32.7
Sample size 393 913(continued)
Table 1.5
Evaluation of the CET Replication Sites
Selected Characteristics of Sample Members, by Site Fidelity

-26-
revealed that several sites experienced serious difficulties in operating the program.26 Second, the evaluation was carried out during years of extremely strong economic growth, when young people could find employment with little difficulty, whether or not they had received high-quality training. While additional factors — such as data limitations or hard-to-measure features of the local environments in which the replication sites were operating — may also influence the measured outcomes and impacts, it seems likely that replication difficulties and the strong economy are particularly important complicating factors.
The Challenges of Replication
In many respects, the replication of the CET model parallels efforts to replicate other promising programs. Such efforts have been especially common in the field of education, but employment and training programs have also seen numerous replication attempts.27 Evaluators and policymakers have learned from these attempts that replication rarely succeeds in creating programs identical to the original model. New programs inevitably differ from their precursors, even when explicitly modeled upon them. These differences need not necessarily be attributed to poor implementation or other failings of the new programs or of the designers of the model.28
26Walsh, Goldsmith, Abe, and Cann, 2000. 27See, for example, Ferguson, Clay, Snipes, and Roaf (1996). 28Some observers of replication attempts in schools argue that most designers of reforms are, indeed, at fault
for failing to consider and plan for local adaptation of new policies. See Pauly (1991) for an examination of sev-eral prominent replication failures and for recommendations about educational replication efforts in general.
Table 1.5 (continued)
SOURCES: Calculations based on baseline and 30-month follow-up survey data.
NOTES: The sample analyzed here includes both program and control group sample members. Sample sizes vary for individual measures because of missing values. aThe baseline form in which these data were collected offered program applicants the choice of describing themselves as Hispanic; Black, non-Hispanic; White, non-Hispanic; Asian or Pacific Islander; or American Indian or Alaskan Native. The term African-American is used in this report, but some Black, non-Hispanic applicants may not have selected this term to describe themselves. In addition, due to the fairly low numbers of Asian, Pacific Islander, American Indian, and Alaskan applicants, all applicants identifying with one of these groups have been combined into the Other category. b Due to a change in the format of the evaluation’s intake questionnaire, we were unable to distinguish between members of the CET replication study who did not have barriers to employment and sample members who did not respond to the barriers-to-employment question. Therefore, the figures reported represent the percentage of the total sample who affirmatively identified themselves as having a barrier to employment.

-27-
They may arise, instead, from differences in the contexts in which promising program models are implemented.
Differences in local labor markets, funding sources, and target populations were among the contextual factors that influenced the replication of the CET model. These differences led rep-lication sites to make different choices in adapting the CET model to local circumstances, yet at least one-third of the replication sites still provided a worklike training environment, involved in-dustry in the design and operation of their services, and offered training programs that concen-trated participation over a relatively short period of time. Given the site-to-site variation in fidelity to the CET model, it may be instructive to compare the outcomes at the four mature western sites, which had high fidelity to the CET model, with the outcomes at the remaining eight sites, which experienced more difficulty replicating all the features of the CET service design.
The Importance of Local Labor Markets
Among the greatest challenges in interpreting impact data from a multisite demonstration is determining what would have happened to the individuals who were served had the program not existed. The experience of control group members offers the best indicator of how program participants would have fared had they not received CET services. Conditions in local labor mar-kets not only influence a replication site’s ability to carry out its mandate but also influence the outcomes achieved by those who complete the program — and the opportunities available to other young job-seekers in the same locality, particularly members of the control group.
During most of the study period, the CET replication sites operated in the context of an overall economic expansion that made employment opportunities readily available to youth and thus to members of the control group. By the time the last sample member was enrolled in the evaluation in 1999, national unemployment rates had declined to a 30-year low of 4 percent, and the economy was in the ninth year of solid growth. These economic trends reshaped the labor market for all American workers, including the out-of-school youth targeted by the evaluation.
Changes in the labor market for youth are readily apparent from an examination of un-employment rates. Between 1992 and 1999, unemployment for out-of-school youth between the ages of 16 and 24 dropped by more than a quarter, from 11.8 to 8.6 percent.29 The absolute number of youth in the labor force increased by only 2.7 percent during this period, yet the population of employed out-of-school youth increased by 7.6 percent. Unemployment declined for nearly all major subgroups of youth, but especially for young men. Overall, male out-of-
29Employment and earning figures in this section are based on BPA tabulations of the Annual Demo-graphic Files of the Current Population Survey, March 1992 and March 1999. These data have been adjusted, using CPS-provided weights, to ensure that they can be generalized to the national population of out-of-school youth. Earnings data are based on constant 1999 dollars.

-28-
school youths experienced a 38.0 percent decline in unemployment; white, African-American, and Hispanic male youth experienced declines of 42.4, 24.3, and 40.8 percent, respectively. Un-employment among young women fell by 7.2 percent, with decreases of 11.6, 5.9, and 8.3 per-cent for white, African-American, and Hispanic young women.
Employment gains for out-of-school youth translated into earnings gains as well. Among all out-of-school youth between the ages of 16 and 24, weekly wages increased by 4.8 percent between 1992 and 1999, while hourly wages increased by 8.8 percent. Hourly wages for females increased by 11.2 percent, with increases of 20.7, 17.9, and 9.7 percent, respectively, for whites, African-Americans, and Hispanics. Hourly wages for young men increased by 7.3 percent, with increases of 7.6, 6.6, and 7.5 percent for whites, African-Americans, and Hispanics.
In light of the overall strong economy, it is not difficult to imagine that the evaluation’s control group members may have fared well in the job market without the assistance of the pro-gram. In order to be enrolled for the study, these youth had to have applied for services from a CET replication site, thereby demonstrating their motivation and intent to seek employment. Once denied services, they were likely to have sought similar services from another program or simply to have found a job on their own, without undue difficulty. In fact, by the time CET en-rollees were ready to seek employment, many members of the control group already had several weeks or months of job experience, a relationship with an employer, and an opportunity to demonstrate their labor market attachment.
Overview of This Report The remainder of the report is organized as follows. Chapter 2 presents rates of participa-
tion in CET activities using data from the program’s Management Information Systems (CET MIS data). It also uses data from the 30-month survey to present impacts on rates of participation and the attainment of training credentials. Chapter 3 presents impacts on employment and earn-ings over the follow-up period, and Chapter 4 presents impacts on other outcomes, including liv-ing arrangements, childbearing, drug and alcohol use, and arrests. Each of the chapters starts by examining impacts for the sample as a whole, across all sites. They then compare impacts for high-fidelity versus medium/low-fidelity sites and present impacts for other key subgroups.

-29-
Chapter 2
Participation in CET’s Education and Training Services and the Impacts on Education and Training Credentials
This 30-month report on the Evaluation of the Center for Employment Training (CET) Replication Sites turns now to examine enrollees’ participation in skills training. This chapter describes the extent to which the CET program increased participation over what would have happened in the program’s absence and the extent to which participation in training led to re-ceipt of credentials.
Summary of Findings • Participation in skills training by CET enrollees was substantial but less
intensive than intended. Approximately three-quarters of those assigned to the program group in CET-operated sites received CET services. CET par-ticipants at these sites received an average of about six months, or 629 hours, of training — compared with a published course length ranging from 630 to 1,112 hours. Only about 56 percent of CET participants completed training with employment, as intended by the program. Participation and program outcomes were significantly stronger in sites that ranked high in their fidelity to the CET model.
• Control group members had substantial access to alternative skills training options, and a significant proportion reported participating in skills training. Over the 30-month follow-up period, more than one in five control group members received skills training. On average, they spent 201 hours in training activities, which amounts to an average of 935 hours of skills training per control group participant.
• Program group members reported significantly less participation on the survey than was recorded by CET’s Management Information Systems (CET MIS); as a result, estimated program impacts on participation are modest. Fewer than one in three program group members reported partici-pating in skills training. After 30 months, many participants did not recall their CET experience. As a result, the overall estimated program effect on participation in skills training was only 9.3 percentage points, and the overall program-control difference in reported hours of skills training was not statis-tically significant.
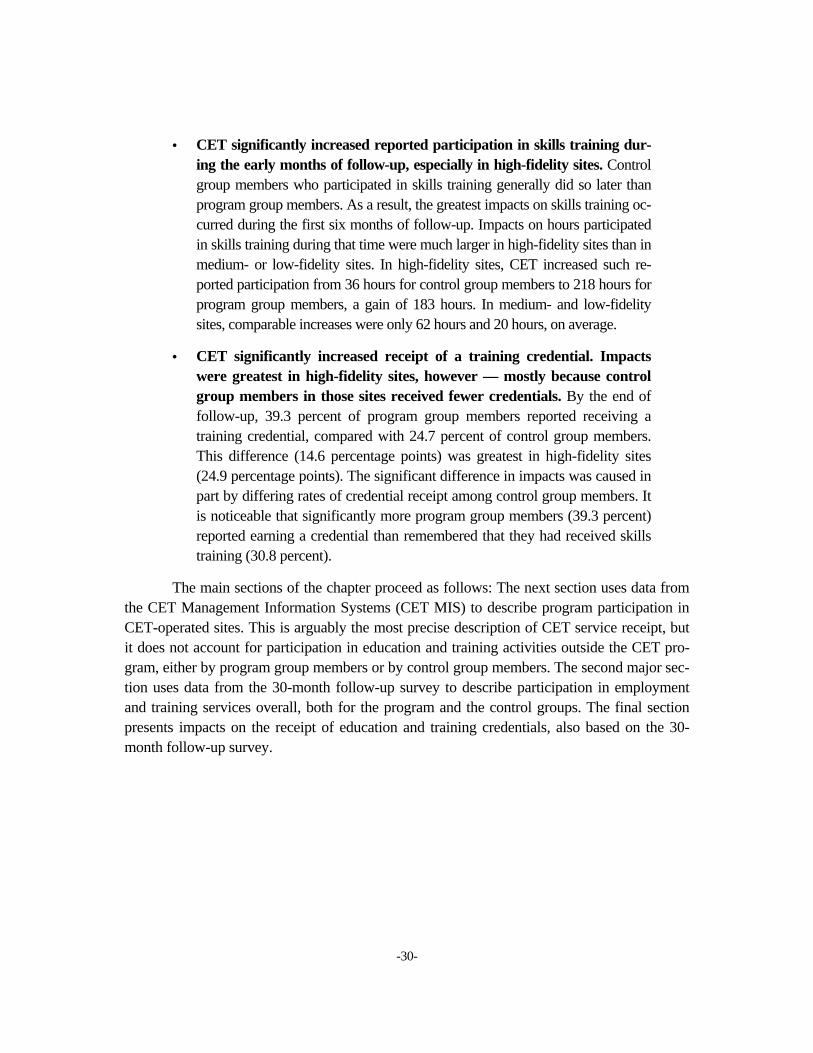
-30-
• CET significantly increased reported participation in skills training dur-ing the early months of follow-up, especially in high-fidelity sites. Control group members who participated in skills training generally did so later than program group members. As a result, the greatest impacts on skills training oc-curred during the first six months of follow-up. Impacts on hours participated in skills training during that time were much larger in high-fidelity sites than in medium- or low-fidelity sites. In high-fidelity sites, CET increased such re-ported participation from 36 hours for control group members to 218 hours for program group members, a gain of 183 hours. In medium- and low-fidelity sites, comparable increases were only 62 hours and 20 hours, on average.
• CET significantly increased receipt of a training credential. Impacts were greatest in high-fidelity sites, however — mostly because control group members in those sites received fewer credentials. By the end of follow-up, 39.3 percent of program group members reported receiving a training credential, compared with 24.7 percent of control group members. This difference (14.6 percentage points) was greatest in high-fidelity sites (24.9 percentage points). The significant difference in impacts was caused in part by differing rates of credential receipt among control group members. It is noticeable that significantly more program group members (39.3 percent) reported earning a credential than remembered that they had received skills training (30.8 percent).
The main sections of the chapter proceed as follows: The next section uses data from the CET Management Information Systems (CET MIS) to describe program participation in CET-operated sites. This is arguably the most precise description of CET service receipt, but it does not account for participation in education and training activities outside the CET pro-gram, either by program group members or by control group members. The second major sec-tion uses data from the 30-month follow-up survey to describe participation in employment and training services overall, both for the program and the control groups. The final section presents impacts on the receipt of education and training credentials, also based on the 30-month follow-up survey.

-31-
Participation in Training by the Program Group at CET-Operated Sites
Participation Rates
Table 2.1 displays participation rates for the program group members in CET-operated sites, as captured by the CET MIS data. The analysis excludes 174 sample members who were assigned to the program group and were enrolled in a CET program but whose program was not operated by the Center for Employment Training corporation. (This was the case in Camden, Newark, Orlando, and Reidsville.) The table shows that 75 percent of the program group at the CET-operated sites participated in training at CET. This means that, after having been randomly assigned to the program group and having attended an orientation, they were formally enrolled in the program and participated in at least one class. The other 25 percent did not show up or were not officially enrolled. There are several reasons why a member of the program group might choose not to participate in training at a CET site, even after having applied for admission and being assigned to the program group. Especially in a healthy labor market, the opportunity costs of participating in training may be high, and applicants may decide to forgo the opportu-nity to enroll in CET in order to be able to take or keep a job. In addition, program group mem-bers may have decided to participate in different training activities, for which they may have had a concurrent application. Finally, some sites — especially those that experienced implementation problems — may have had trouble keeping youth interested in the training after they were accepted into the program.
The sites varied significantly in terms of training participation. Table 2.1 examines CET participation rates by site fidelity ratings that were summarized in the evaluation’s interim re-port about implementation (see Table 1.1 in Chapter 1 for details). In the interim report, sites’ fidelity to the CET model was rated based on four criteria: design of services, participation in services, industry involvement with CET, and organizational capacity and stability.1 Using these ratings, the sites were divided into three categories of fidelity to the CET model: high, medium, and low. Among the eight CET-operated sites, El Centro, Oxnard, Riverside, and Santa Maria were rated “high-fidelity”; they were well-established West Coast sites that had been in opera-tion for at least 20 years. The remaining four CET-operated sites, — Chicago, New York, Reno, and San Francisco — were rated “medium-fidelity.”2 (Among CET-operated sites, there were no low-fidelity sites.) Table 2.1 shows that high-fidelity sites achieved higher participation rates than medium-fidelity sites. However, the lower participation rate for the medium-fidelity sites is
1Walsh, Goldsmith, Abe, and Cann, 2000. 2Of the four replication sites that were not operated by CET, Newark and Orlando were rated medium in
fidelity to the CET model, and Camden and Reidsville were rated low.

-32-
skewed by the inclusion of Chicago, which had a particularly low participation rate.3 When Chicago is excluded, the participation rate for the remaining medium-fidelity sites is 80 percent — only slightly lower than the 88 percent participation rate for high-fidelity sites.
3The very low participation rate at the Chicago site is largely explained by early implementation problems.
The Chicago site experienced problems finding funding in the early stages of the implementation process. In (continued)
Participation Rate (%) Program Group
All CET-run sites 74.6
Chicago 52.2El Centro 76.9New York 77.7Oxnard 94.4Reno 100.0Riverside 93.2San Francisco 79.5Santa Maria 80.0
Site Fidelity RatingsHigh 87.5Medium 66.7
Month After Random Assignment3 62.76 49.912 5.618 1.324 0.430 0.2
Sample size 461
Table 2.1
CET Participation by Program Group Membersin CET-Operated Sites, as Captured by CET MIS
Evaluation of the CET Replication Sites
SOURCE: BPA calculations from CET MIS data.
NOTE: The sample used in this table only includes program group members in eight CET sites (Chicago, El Centro, New York, Oxnard, Reno, Riverside, San Francisco, and Santa Maria).

-33-
As discussed in the interim report, when Chicago is excluded, the overall average par-ticipation rate increases from 75 percent to 84 percent, which is very close to participation rates found at the CET-San Jose site in other studies. Eighty-four percent of program group members in the Minority Female Single Parent (MFSP) Demonstration who were assigned to train at CET-San Jose participated in training at that site, while the participation rate for program group members assigned at CET-San Jose in the JOBSTART Demonstration was 89 percent. Almost all of these CET participation rates are higher than the participation rate for out-of-school youths in the National JTPA Study.4 In that study, only 48.3 percent of female out-of-school youths and 42.6 percent of male out-of-school youths who were assigned to the program group and were recommended for classroom training actually received JTPA services.5
A comparison of the baseline characteristics of program group members who partici-pated in CET training and those who did not participate reveals some important differences be-tween the two groups — differences that held up when the analysis controlled for variation in participants’ characteristics across the sites.6 Compared with nonparticipants, those who partici-pated were more likely to have a high school diploma at the time of their application. The analysis also shows that applicants whose English proficiency was limited were less likely to participate in training than those whose English proficiency was not limited.
An examination of training participation as measured by month after random assign-ment (Figure 2.1) shows that about 12 percent of CET participants dropped out of training within the first three months after random assignment. The data also show that most of the CET training took place within the first 12 months. By Month 12 after random assignment, only 6 percent of participants were still participating in CET training; and by Month 24 after random assignment, virtually no program group members were still training at CET.
Length and Intensity of CET Training
Table 2.2 displays the hours and months spent in training by program group members who participated in training at CET sites. On average, CET participants were in CET programs for 6.2 months. This is comparable to the number of months spent in training by participants at CET-San Jose in the MFSP and JOBSTART Demonstrations. The table shows that there is sig-nificant variation in the distribution of months spent in training: 27 percent of participating
addition, due to its source for matching funds, the site recruited harder-to-serve youths, including youths who were wards of the state and who were expected to become economically self-supporting at the age of 18.
4See Cave, Bos, Doolittle, and Toussaint (1993); Gordon and Burghardt (1990); Bloom et al. (1993). 5See Bloom et al. (1993), pp. 192, 206. 6To explain the determinants of CET participation, a probit model was estimated, and site dummies were
included as independent variables.
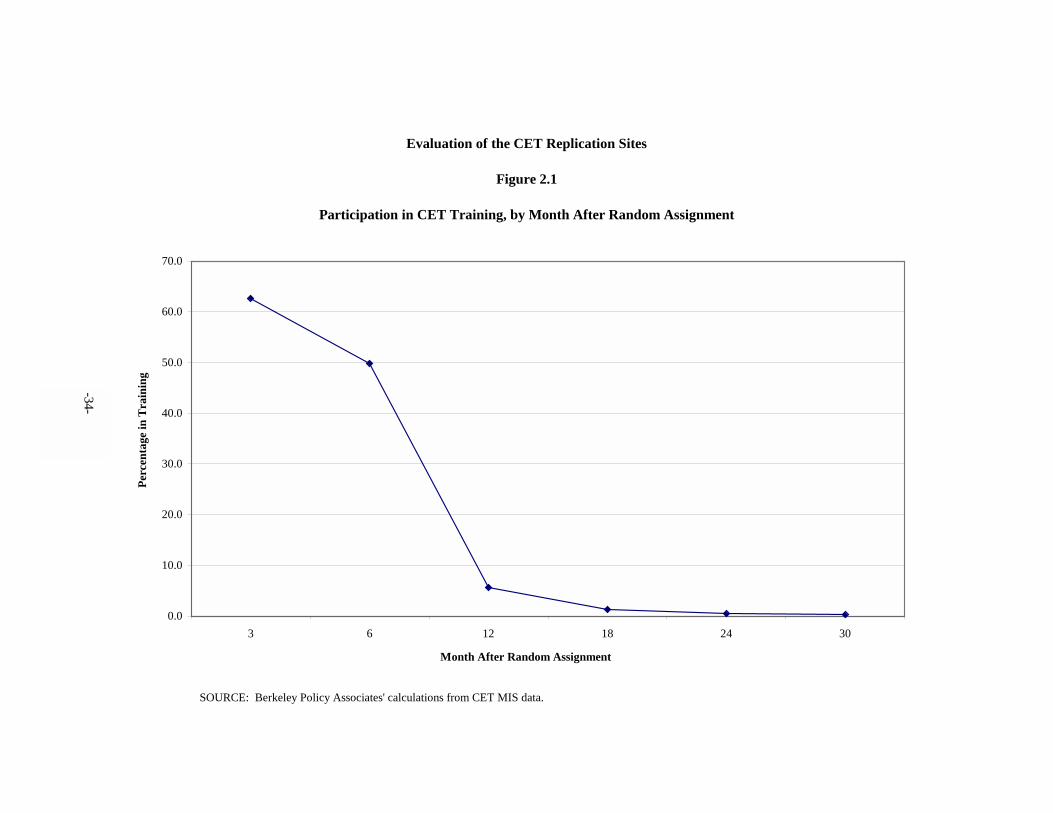
-34-
Evaluation of the CET Replication Sites
Figure 2.1
Participation in CET Training, by Month After Random Assignment
0.0
10.0
20.0
30.0
40.0
50.0
60.0
70.0
3 6 12 18 24 30
Month After Random Assignment
Perc
enta
ge in
Tra
inin
g
SOURCE: Berkeley Policy Associates' calculations from CET MIS data.
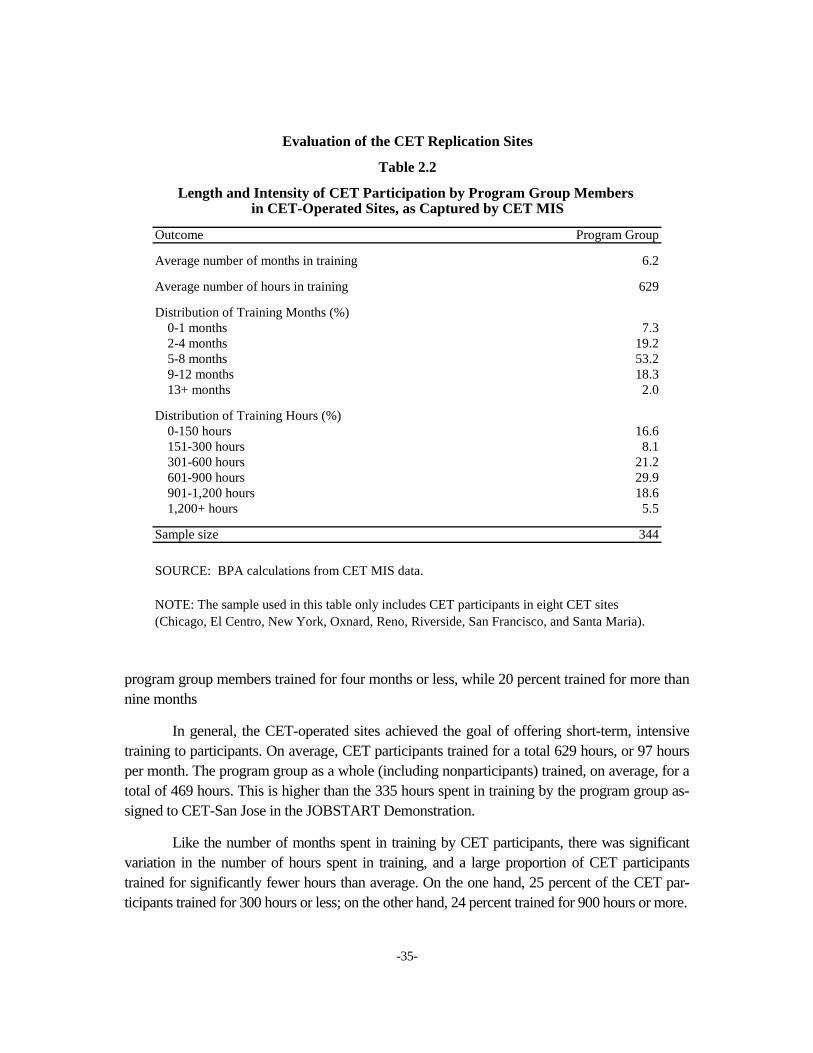
-35-
program group members trained for four months or less, while 20 percent trained for more than nine months
In general, the CET-operated sites achieved the goal of offering short-term, intensive training to participants. On average, CET participants trained for a total 629 hours, or 97 hours per month. The program group as a whole (including nonparticipants) trained, on average, for a total of 469 hours. This is higher than the 335 hours spent in training by the program group as-signed to CET-San Jose in the JOBSTART Demonstration.
Like the number of months spent in training by CET participants, there was significant variation in the number of hours spent in training, and a large proportion of CET participants trained for significantly fewer hours than average. On the one hand, 25 percent of the CET par-ticipants trained for 300 hours or less; on the other hand, 24 percent trained for 900 hours or more.
Outcome Program Group
Average number of months in training 6.2
Average number of hours in training 629
Distribution of Training Months (%)0-1 months 7.32-4 months 19.25-8 months 53.29-12 months 18.313+ months 2.0
Distribution of Training Hours (%)0-150 hours 16.6151-300 hours 8.1301-600 hours 21.2601-900 hours 29.9901-1,200 hours 18.61,200+ hours 5.5
Sample size 344
Table 2.2
Length and Intensity of CET Participation by Program Group Members in CET-Operated Sites, as Captured by CET MIS
Evaluation of the CET Replication Sites
SOURCE: BPA calculations from CET MIS data.
NOTE: The sample used in this table only includes CET participants in eight CET sites (Chicago, El Centro, New York, Oxnard, Reno, Riverside, San Francisco, and Santa Maria).

-36-
In theory, although CET training is open-ended and there are no fixed start and end dates, a comparison of actual training months and hours to published schedules shows that a significant proportion of the sample trained for shorter periods than recommended by CET. On average, the published course completion times for skills training were 30.6 weeks (roughly 7.1 months) and 943 hours — substantially more than the 6.2 months and 469 hours found for this sample. How-ever, as discussed above, CET training is skill-specific, and there is substantial variation in pub-lished course completion times across different types of courses; published CET course comple-tion times range from 630 hours (approximately 6 months) for retail and electronic mechanic courses to 1,092 hours (approximately 10 months) for the medical assistant course.
Length and Intensity of Participation in CET Training, by Subgroup
The findings show that there was some variation in the participation in CET training across subgroups defined by baseline characteristics. Table 2.3 displays the average hours of participation at CET sites, by subgroups defined by certain demographic characteristics. The p-values in the right-hand columns show the specific probability that the difference between the subgroups was the result of chance. Asterisks indicate the statistical significance levels of these differences.
Note that this report does not display impacts or outcomes by subgroups defined by race/ethnicity. It was found that participants’ racial/ethnic backgrounds were highly correlated with site fidelity ratings. For example, a large proportion of the program’s Hispanic youths (70.4 percent) trained at high-fidelity sites. Similarly, most African-American participants (92.8 percent) trained at medium-fidelity sites, and only 1.3 percent trained at high-fidelity sites. Therefore, dif-ferences in impacts and outcomes by race/ethnicity may be attributable to the sites where partici-pants trained and to the quality of training that they received. Of course, the opposite effect is also possible — that differences in impacts across sites are driven by differences in race/ethnicity across sites. However, as mentioned throughout the report, statistical tests indicate that differences in sites’ impacts are not due to differences across sites in enrollees’ characteristics.
Table 2.3 shows some statistically significant differences in subgroups’ hours of par-ticipation. CET participants who had a high school diploma participated in training for more hours than participants who completed only tenth or eleventh grade. However, those who completed ninth grade or less also trained for more hours than those who completed only tenth or eleventh grade. In addition, participants whose English proficiency was limited spent more hours in training than those whose English proficiency was not limited. Differences in hours of participation were not statistically significant for subgroups defined by gender, age, previous receipt of Aid to Families with Dependent Children (AFDC), employment status, or family structure.

-37-
Average Hours P-Value forOutcome of Attendance Difference
Gender Female 628 0.800 Male 629
Age 16-18 years 619 0.710 19-20 years 623 21-22 years 648
Education Completed 9th grade or less 654 0.010 ** Completed 10th or 11th grade 555 Obtained high school diploma 685
Previous AFDC Receipt Received AFDC 614 0.770 Did not receive AFDC 654
Employment Status at Baseline Employed 623 0.960 Not employed 616
Has Dependents Yes 650 0.180 No 610
Limited English Proficiency Yes 774 0.030 ** No 616
Sample size 344
Average Hours of CET Participation by Selected Subgroups
Table 2.3
of Participants, as Captured by CET MIS
Evaluation of the CET Replication Sites
SOURCE: BPA calculations from CET MIS data.
NOTES: The sample used in this table only includes experimentals who were assigned to one of the eight CET sites (Chicago, El Centro, New York, Oxnard, Reno, Riverside, San Francisco, Santa Maria) and who subsequently enrolled at a CET site. Statistical significance levels are indicated as ***=1 percent; **=5 percent; *=10 percent.
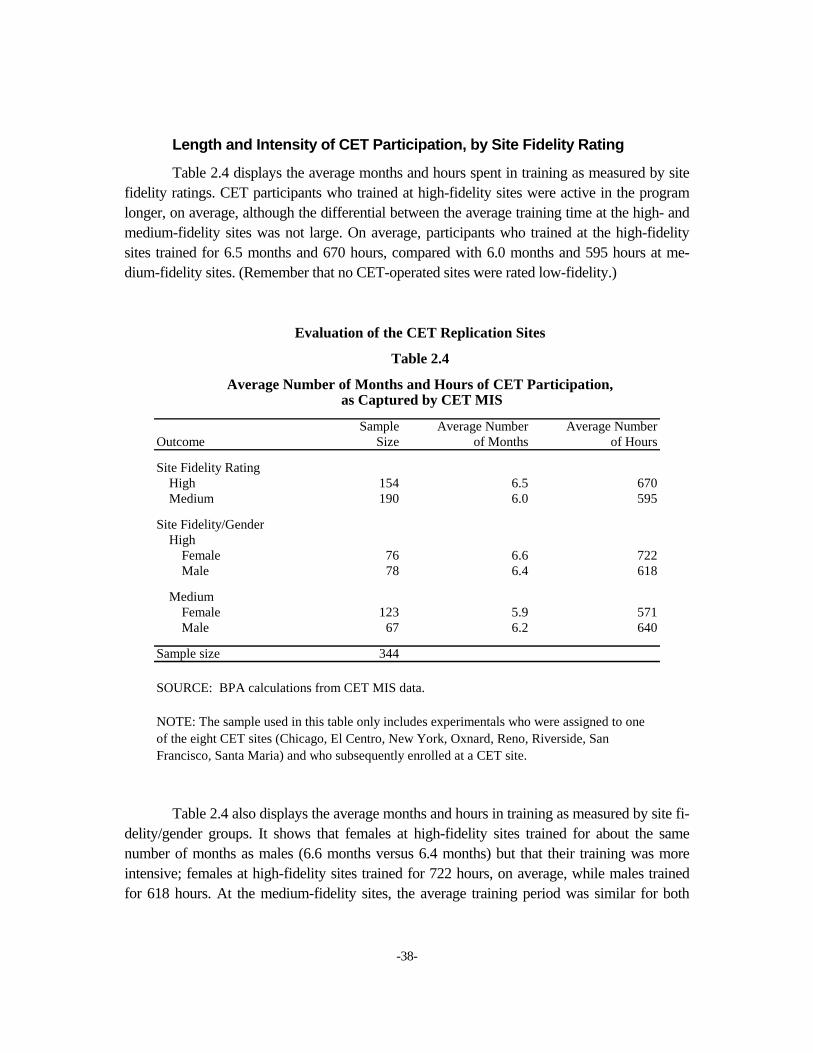
-38-
Length and Intensity of CET Participation, by Site Fidelity Rating
Table 2.4 displays the average months and hours spent in training as measured by site fidelity ratings. CET participants who trained at high-fidelity sites were active in the program longer, on average, although the differential between the average training time at the high- and medium-fidelity sites was not large. On average, participants who trained at the high-fidelity sites trained for 6.5 months and 670 hours, compared with 6.0 months and 595 hours at me-dium-fidelity sites. (Remember that no CET-operated sites were rated low-fidelity.)
Table 2.4 also displays the average months and hours in training as measured by site fi-delity/gender groups. It shows that females at high-fidelity sites trained for about the same number of months as males (6.6 months versus 6.4 months) but that their training was more intensive; females at high-fidelity sites trained for 722 hours, on average, while males trained for 618 hours. At the medium-fidelity sites, the average training period was similar for both
Sample Average Number Average Number
Outcome Size of Months of Hours
Site Fidelity RatingHigh 154 6.5 670Medium 190 6.0 595
Site Fidelity/GenderHigh
Female 76 6.6 722Male 78 6.4 618
MediumFemale 123 5.9 571Male 67 6.2 640
Sample size 344
Evaluation of the CET Replication Sites
Table 2.4
Average Number of Months and Hours of CET Participation,as Captured by CET MIS
SOURCE: BPA calculations from CET MIS data.
NOTE: The sample used in this table only includes experimentals who were assigned to one of the eight CET sites (Chicago, El Centro, New York, Oxnard, Reno, Riverside, San Francisco, Santa Maria) and who subsequently enrolled at a CET site.

-39-
groups, but males spent more hours in training, on average, than females did (640 hours versus 571 hours).
Participation in CET Training, by Skill
Table 2.5 displays the average months and hours of CET participation as measured by type of skills training. The two courses most widely utilized by CET participants were medical clerical training (27 percent) and office training (26 percent).
In accordance with the CET model, the focus of skills training activities varies across the sites. As discussed in the interim report, the skills training offered by each CET program is linked to the perceived employment needs of local industry. So, for example, large proportions of CET participants in Chicago (43 percent) and New York (60 percent) received medical assis-
Percentage of Published Type of Training Sample Size Participants Average Hours Course Hours
Accounting 17 4.9 682 899Office skills 89 25.9 677 875Medical insurance billing 11 3.2 975 802Medical clerical 91 26.5 571 1,112Medical clinical 8 2.3 694 665Retail 3 0.9 710 630Electronic mechanic 4 1.2 434 630Metal trade 31 9.0 618 913Building and maintenance 51 14.8 630 929Shipping and receiving 39 11.3 558 815
Sample size 344
Table 2.5
Evaluation of the CET Replication Sites
Average Number of Months and Hours of CET Participation, by Type of Training, as Captured by CET MIS
SOURCE: BPA calculations from CET MIS data.
NOTE: The sample used in this table only includes experimentals who were assigned to one of the eight CET sites (Chicago, El Centro, New York, Oxnard, Reno, Riverside, San Francisco, Santa Maria) and who subsequently enrolled at a CET site.

-40-
tant training, while large percentages of participants in Reno (78 percent) and Riverside (56 per-cent) received office training.7
Table 2.5 also displays the published average course hours for each type of training. As mentioned earlier, there is substantial variation in published course hours. In addition, the table shows that, with the exception of training for medical insurance billing and medical clinical skills, average actual hours of course participation substantially lag behind published course hours (by as much as 541 hours for medical clerical training, which, at 1,112 hours, is the most intensive training program that CET offers).
Completion of CET Training: Participants’ Termination Status Codes
Table 2.6 provides an early glimpse of the “outcomes” of training, as captured by CET’s own Management Information Systems (MIS); the table displays CET MIS status codes for participants. A participant who exits from the program is assigned one of three status codes: (1) dropped out of training within one week of enrollment, (2) withdrew from training without employment, and (3) completed training with employment.8 The table shows that a significant proportion (40 percent) of CET participants in the sample withdrew from training without em-ployment and that 5 percent dropped out of the program within one week of enrollment; 56 per-cent of CET participants completed their training with employment.
Participants’ status codes show significant variation when analyzed by site fidelity rating: Highly rated sites had far higher “with employment” completion rates and far lower one-week dropout rates than did sites that were rated medium-fidelity. In the sites that were rated high-fidelity, 70.1 percent of CET participants completed training with employment, while only 43.7 percent of participants at the sites that were rated medium-fidelity completed training with em-ployment. The high-fidelity sites had an average one-week dropout rate of 0.5 percent, while the medium-fidelity sites had an average one-week dropout rate of 8.4 percent. Table 2.6 also exam-ines participants’ status codes by site fidelity/gender groups. In the high-fidelity sites, females were more likely than males to complete training with employment (76.3 percent versus 64.1 per-cent), while they were less likely than males to withdraw from the program without employment (23.7 percent versus 34.6 percent). At the medium-fidelity sites, males had the better outcomes; 59.7 percent of males but only 35.0 percent of females completed training. At the medium-fidelity sites, 32.8 percent of males versus 56.1 percent of females withdrew from the program.
7Walsh, Goldsmith, Abe, and Cann, 2000. 8In the CET model, training is not supposed to be completed until a participant finds employment. It
should also be noted that the MIS status codes are based on participants’ reports. Moreover, sites may vary in their policies regarding keeping status code information up to date.
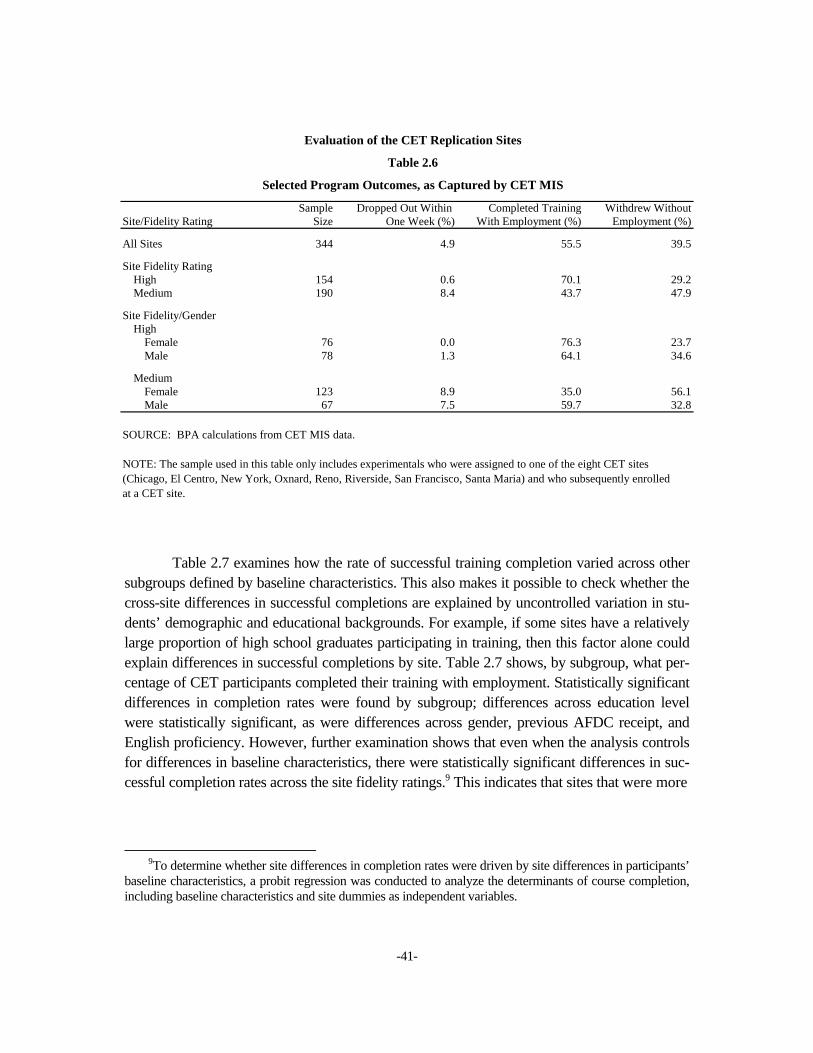
-41-
Table 2.7 examines how the rate of successful training completion varied across other subgroups defined by baseline characteristics. This also makes it possible to check whether the cross-site differences in successful completions are explained by uncontrolled variation in stu-dents’ demographic and educational backgrounds. For example, if some sites have a relatively large proportion of high school graduates participating in training, then this factor alone could explain differences in successful completions by site. Table 2.7 shows, by subgroup, what per-centage of CET participants completed their training with employment. Statistically significant differences in completion rates were found by subgroup; differences across education level were statistically significant, as were differences across gender, previous AFDC receipt, and English proficiency. However, further examination shows that even when the analysis controls for differences in baseline characteristics, there were statistically significant differences in suc-cessful completion rates across the site fidelity ratings.9 This indicates that sites that were more
9To determine whether site differences in completion rates were driven by site differences in participants’
baseline characteristics, a probit regression was conducted to analyze the determinants of course completion, including baseline characteristics and site dummies as independent variables.
Sample Dropped Out Within Completed Training Withdrew Without
Site/Fidelity Rating Size One Week (%) With Employment (%) Employment (%)
All Sites 344 4.9 55.5 39.5
Site Fidelity RatingHigh 154 0.6 70.1 29.2Medium 190 8.4 43.7 47.9
Site Fidelity/GenderHigh
Female 76 0.0 76.3 23.7Male 78 1.3 64.1 34.6
MediumFemale 123 8.9 35.0 56.1Male 67 7.5 59.7 32.8
Table 2.6
Selected Program Outcomes, as Captured by CET MIS
Evaluation of the CET Replication Sites
SOURCE: BPA calculations from CET MIS data.
NOTE: The sample used in this table only includes experimentals who were assigned to one of the eight CET sites (Chicago, El Centro, New York, Oxnard, Reno, Riverside, San Francisco, Santa Maria) and who subsequently enrolled at a CET site.

-42-
Completed Training P-Value for Outcome (%) with Employment Difference
GenderFemale 50.8 0.037 **Male 62.1
Age16-18 years 55.3 0.89119-20 years 54.621-22 years 57.6
EducationCompleted 9th grade or less 59.3 0.013 ***Completed 10th or 11th grade 45.9Obtained high school diploma 62.3
Previous AFDC ReceiptReceived AFDC 37.3 0.007 ***Did not receive AFDC 57.1
Employment Status at BaselineEmployed 67.4 0.069 *Not employed 52.6
Has DependentsYes 49.5 0.222No 56.9
Has Limited English Proficiency Yes 74.2 0.032 ** No 54.0
Sample size 344
Evaluation of the CET Replication Sites
Table 2.7
Program Completion with Employment, as Captured by CET MIS
SOURCE: BPA calculations from CET MIS data.
NOTES: The sample used in this table only includes experimentals who were assigned to one of the eight CET sites (Chicago, El Centro, New York, Oxnard, Reno, Riverside, San Francisco, Santa Maria) and who subsequently enrolled at a CET site. Statistical significance levels are indicated as ***=1 percent; **=5 percent; *=10 percent.

-43-
successful in implementing and replicating the CET model also experienced more success in placing participants into employment upon exit from the program.
Impacts on Education and Training This section of the chapter focuses on differentials in training receipt between the pro-
gram group and the control group. In order to accurately assess CET’s effects on postprogram outcomes, it must first be determined whether CET had an effect on the types of training that program group members participated in and on the length and timing of participation. If, for example, the control group received training and education services that were similar to the ser-vices that the program group received, it would be difficult to interpret subsequent program im-pacts on employment, earnings, and other outcomes.
The following discussion analyzes service receipt differentials along three dimensions: (1) whether the participation rates in training and education activities and the timing of that par-ticipation differed between the program and control groups; (2) whether the length and amount of training were greater for program group members than for control group members; and (3) whether program impacts differed for subgroups defined by demographic characteristics and by site fidelity. Because the analyses are based on 30-month follow-up survey data instead of CET MIS data, the discussion examines training participation for all program group members (in-cluding those who participated at the four replication sites that were not operated by CET: Camden, Newark, Orlando, and Reidsville) and for all control group members.
There are pronounced differences between the two data sources. Whereas the CET MIS data are administrative-level data on training participation as tracked and recorded by staff at the CET-operated sites, the training participation data from the follow-up survey are self-reported by program and control group members at least 30 months after random assignment. Because of recall problems, one might expect the survey-reported participation rates and hours of participa-tion to be somewhat lower than those calculated from the CET MIS data. Indeed, there was sub-stantial underreporting of training by program group members in the survey, and it is possible that estimated service-related impacts will be biased downward, particularly if program group members are more likely to underreport training activity than control group members.10
10That would be likely, because program group members had access to more training than the control
group, so they would presumably also be more likely to forget about some training. As described in Appendix A, significant discrepancies exist between the rates of training receipt as reported on the 30-month survey and as reported by CET MIS data. The latter rates are significantly higher in all sites in which both data sources are available. Appendix B presents an analysis of response bias for the 30-month survey. The analysis indicates that the survey sample is representative of the full sample and that impact estimates using the survey are unlikely to suffer from nonresponse bias.

-44-
Main Findings
• Effects on reported participation in training were strongest in the first six months after random assignment. However, these impacts were modest.
• Effects on participation rates and hours of participation were largely limited to vocational training activities.
• Effects on participation and hours of participation in vocational training ac-tivities did not vary significantly across subgroups defined by demographic characteristics. However, these impacts did vary substantially across site fi-delity ratings, indicating that differences in site implementation and fidelity to the CET model had large effects on program participation.
Participation in Education and Training by the Control Group
The CET control group was not an unserved control group. As is discussed below, more than 50 percent of control group members reported receiving some kind of education, training, or job search service during the 30-month follow-up period, and more than one in five participated in skills training activities. Throughout the follow-up period, control group members spent 201 hours in skills training, on average, which amounts to an average of 935 hours per participant. Thus, it appears that sample members who were assigned to the control group were able to find skills training services elsewhere if they wanted them and if they were motivated enough to participate for a significant amount of time in those activities once they entered them.
Consistent with their rate of participation in skills training, a significant number of con-trol group members received a training certificate. By Month 30 of follow-up, 25 percent of the control group reported receiving such a credential.
Impacts on Participation in Education and Training
The CET program’s impacts on participation in education and training activities are displayed in Table 2.8 by month after random assignment. These impacts are also presented for three categories of activities: (1) vocational training, (2) education, and (3) job club/job search. Vocational training activities include vocational training, on-the-job training, and other training activities. Education activities include high school classes, GED preparation and basic skills classes, English as a Second Language classes, and college courses for credit. Table 2.8 also displays impacts on participation in any training or education activity (an aggregate measure of participation in all three categories). The table shows that slightly more than 50 percent of all sample members (in both groups) recalled participating in any education or training activity

-45-
Program Control P-Value for Outcome (%) Group Group Difference Difference
Participation in Any ActivityMonths 1-30 54.3 51.6 2.8 0.317Months 1-6 28.7 18.1 10.6 *** 0.000Months 7-12 23.8 22.6 1.2 0.595Months 13-18 19.0 23.5 -4.5 ** 0.049Months 19-30 32.7 34.1 -1.3 0.613At follow-up 18.4 18.6 -0.2 0.931
Participation in Training ActivitiesMonths 1-30 30.8 21.5 9.3 *** 0.000Months 1-6 19.0 7.0 12.0 *** 0.000Months 7-12 12.6 10.0 2.7 0.132Months 13-18 5.1 10.3 -5.2 *** 0.000Months 19-30 11.1 12.3 -1.2 0.491At follow-up 3.4 4.5 -1.1 0.309
Participation in Job Club/Job Search Activities
Months 1-30 11.2 8.6 2.6 0.117Months 1-6 3.0 0.5 2.5 *** 0.000Months 7-12 4.3 1.7 2.6 *** 0.006Months 13-18 2.8 3.3 -0.5 0.564Months 19-30 6.6 6.2 0.4 0.755At follow-up 2.1 2.0 0.1 0.854
Participation in Education ActivitiesMonths 1-30 33.6 37.1 -3.4 0.190Months 1-6 11.8 12.1 -0.3 0.869Months 7-12 11.4 14.1 -2.7 0.150Months 13-18 13.5 14.1 -0.6 0.740Months 19-30 22.5 24.0 -1.5 0.509At follow-up 14.3 14.1 0.2 0.908
Sample size 665 641
Table 2.8
Impacts on Survey-Reported Participation in Education and Training
Evaluation of the CET Replication Sites
SOURCES: BPA calculations from CET enrollment form and 30-month follow-up survey data.
NOTES: Calculations used data for all sample members for whom there were follow-up survey data, including those with values of zero for outcomes and those who were assigned to CET but did not participate. Estimates were regression-adjusted using ordinary least squares, controlling for pre-random assignment characteristics of sample members. Rounding may cause slight discrepancies in the calculations of sums and differences. For some outcomes, the sample size may be smaller than the full sample size due to some missing observations. A two-tailed t-test was applied to differences between the program and control groups. Statistical significance levels are indicated as ***= 1 percent; **=5 percent; *=10 percent.

-46-
during the follow-up period. There was no overall program effect on this outcome. It was posi-tive and statistically significant only during the first six months after random assignment — when 28.7 percent of program group members recalled such participation, compared with 18.1 percent of the control group.
Overall, as expected, program impacts on participation were concentrated in the area of vocational training. During the first six months after random assignment, these impacts were substantial: 19.0 percent of the program group reported participating in vocational training, compared with only 7.0 percent of the control group, for a difference of 12.0 percentage points. Inasmuch as CET programs were designed to be short term, these effects were expected to de-cline quickly, and they did. During Months 7 to 12, there was no significant impact; and by the end of the first year of follow-up, the program’s effect on participation in vocational training had become negative. Altogether, 30.8 percent of the program group and 21.5 percent of the control group recalled participating in any vocational training during the follow-up period. The difference of 9.3 percentage points was statistically significant.
Although these impacts may seem small, note that the figures presented in Table 2.8 probably represent lower bounds on the true program impacts, because of the apparent underre-porting of CET participation discussed earlier. On the 30-month follow-up survey, only 54 per-cent of the program group reported having participated in any training or education activity, compared with a rate of 75 percent in the CET MIS data.
The impact on participation in job club/job search activities during the first six months after random assignment was very small (2.5 percent) but still statistically significant. Very few sample members reported having participated in these activities: 3.0 percent of program group members and 0.5 percent of the control group. Although job search is a key component of the CET model, the survey respondents clearly did not remember it as a separate training activity.
The difference between the two groups’ participation in education activities other than vocational training was not statistically significant throughout the 30-month follow-up period. This suggests that control group members — who did not have access to CET services — did not engage in other education activities as a substitute.
Impacts on the Intensity of Participation in Education and Training Activities
Like the program impacts on participation in education and training activities, program impacts on hours of participation in these activities were most significant during the first six months after random assignment, and they again were concentrated in vocational training activi-ties. Table 2.9 shows that, on average, the program group participated in vocational training ac-tivities for 127 hours during this time, while the control group participated for 32 hours, yield-

-47-
ing an impact of 95 hours. Note that the average participating program group member was ac-tive in vocational training for 763 hours (127/.19), compared with 457 hours (32/.07) for a par-ticipating control group member. Thus, in addition to increasing the rate of participation in vo-cational training among sample members, CET also increased the intensity of their participation (as reported), especially during the first six months of follow-up.
After the first six months of follow-up, these positive impacts disappeared. During Months 13 to 18, the program impact on training receipt became negative and was statistically significant; participation by program group members dropped by almost half, and the average hours of participation by the control group increased slightly. Impacts on hours of participation in education and job club/job search activities were statistically insignificant for most time peri-ods. Program impacts on hours of participation in all activities generally mirror the impacts on hours of participation in vocational training activities — they were positive and significant dur-ing the first six months after random assignment and then decreased thereafter. The impacts on hours of participation in all activities are smaller than the impacts on hours of participation in vocational training activities, because the aggregate impacts are diluted by the inclusion of edu-cation and job club/job search activities, which were largely unaffected by CET.
Note that — as is the case for participation rates — the survey-reported hours of par-ticipation in education and training activities are much lower than the related figures based on the CET MIS data. For example, calculations from the survey data show that program group members participated in any employment or training activity for 422 hours in the 30 months after random assignment, whereas calculations from the CET MIS data show that, on average, program group members participated in training activities for 628 hours. These discrepancies are influenced to some extent by the fact that the hours of training as calculated from the survey data include participants at the replication sites that were not operated by CET — Camden, Newark, Orlando, and Reidsville — which had lower fidelity to the CET model. Nonetheless, the inclusion of these sites in the survey-calculated participation figures does not explain all the differences between the two data sources.
Impacts on Participation, by Subgroup
Table 2.10 shows CET’s impacts on participation in training and education during the first six months after random assignment for subgroups defined by demographic characteristics. The first objective in examining these impacts is to determine whether the program’s positive and statistically significant aggregate impacts on participation within the first six months after
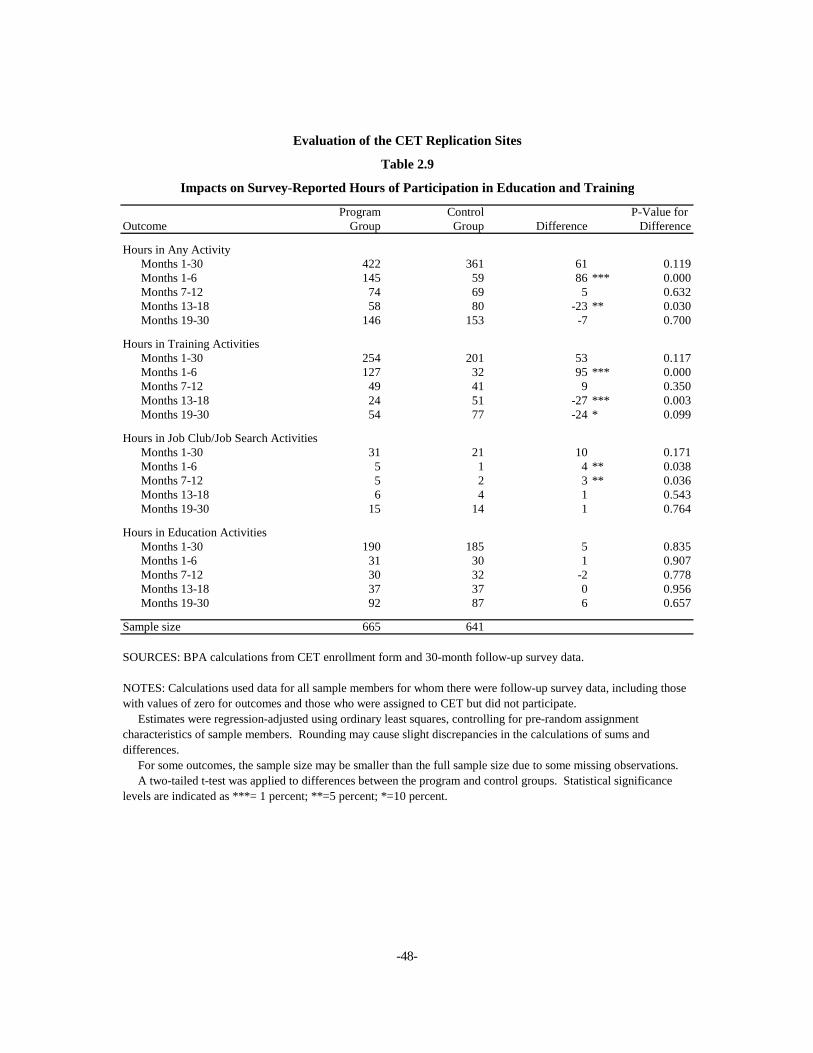
-48-
Program Control P-Value for Outcome Group Group Difference Difference
Hours in Any Activity Months 1-30 422 361 61 0.119Months 1-6 145 59 86 *** 0.000Months 7-12 74 69 5 0.632Months 13-18 58 80 -23 ** 0.030Months 19-30 146 153 -7 0.700
Hours in Training Activities Months 1-30 254 201 53 0.117Months 1-6 127 32 95 *** 0.000Months 7-12 49 41 9 0.350Months 13-18 24 51 -27 *** 0.003Months 19-30 54 77 -24 * 0.099
Hours in Job Club/Job Search Activities Months 1-30 31 21 10 0.171Months 1-6 5 1 4 ** 0.038Months 7-12 5 2 3 ** 0.036Months 13-18 6 4 1 0.543Months 19-30 15 14 1 0.764
Hours in Education Activities Months 1-30 190 185 5 0.835Months 1-6 31 30 1 0.907Months 7-12 30 32 -2 0.778Months 13-18 37 37 0 0.956Months 19-30 92 87 6 0.657
Sample size 665 641
Table 2.9
Impacts on Survey-Reported Hours of Participation in Education and Training
Evaluation of the CET Replication Sites
SOURCES: BPA calculations from CET enrollment form and 30-month follow-up survey data.
NOTES: Calculations used data for all sample members for whom there were follow-up survey data, including those with values of zero for outcomes and those who were assigned to CET but did not participate. Estimates were regression-adjusted using ordinary least squares, controlling for pre-random assignment characteristics of sample members. Rounding may cause slight discrepancies in the calculations of sums and differences. For some outcomes, the sample size may be smaller than the full sample size due to some missing observations. A two-tailed t-test was applied to differences between the program and control groups. Statistical significance levels are indicated as ***= 1 percent; **=5 percent; *=10 percent.

-49-
random assignment held up across a range of subgroups. The second objective is to describe how CET’s impacts differed across subgroups during the first six months of follow-up.
Table 2.10 shows that, overall, the program’s impacts on participation in training did hold up across subgroups defined by gender, age, education, previous AFDC receipt, and Eng-lish proficiency. For the most part, the differences in subgroup impacts were not statistically significant.
P-Value forProgram Control P-Value Subgroup
Outcome (%) Group Group Difference for Difference Difference
GenderFemale 16.3 8.3 8.1 *** 0.001 0.030 **Male 22.5 6.0 16.5 *** 0.000
Age16-18 years 17.9 6.2 11.7 *** 0.001 0.86419-20 years 18.8 7.0 11.8 *** 0.00021-22 years 15.9 7.0 8.9 * 0.071
EducationCompleted 9th grade or less 12.2 6.5 5.6 0.339 0.451Completed 10th or 11th grade 19.5 6.5 13.0 *** 0.000Obtained high school diploma 21.2 7.4 13.8 *** 0.000
Previous AFDC ReceiptReceived AFDC 14.5 6.7 7.7 * 0.051 0.238Did not receive AFDC 20.3 7.1 13.2 *** 0.000
Limited English Proficiency Yes 17.6 11.0 6.6 0.344 0.455 No 18.7 6.7 12.1 *** 0.000
Sample size 665 641
Months 1 to 6 on the Survey, by Subgroup
Table 2.10
Evaluation of the CET Replication Sites
Impacts on Percentages Reporting Participation in Training in
SOURCES: BPA calculations from CET enrollment form and 30-month follow-up survey data.
NOTES: Calculations used data for all sample members for whom there were follow-up survey data, including those with values of zero for outcomes and those who were assigned to CET but did not participate. Estimates were regression-adjusted using ordinary least squares, controlling for pre-random assignment characteristics of sample members. Rounding may cause slight discrepancies in the calculations of sums and differences. For some outcomes, the sample size may be smaller than the full sample size due to some missing observations. A two-tailed t-test was applied to differences between the program and control groups. Statistical significance levels are indicated as ***= 1 percent; **=5 percent; *=10 percent.

-50-
Table 2.11 displays CET’s impacts on the number of hours of participation in voca-tional training activities during the six months after random assignment. The impacts on hours of participation follow a pattern very similar to the pattern for participation rates. Most impacts remained positive and statistically significant when the sample was divided into subgroups, and the differences in impacts across most subgroups were not statistically significant.
P-Value for Program Control P-Value Subgroup
Outcome Group Group Difference for Difference Difference
GenderFemale 114.3 34.5 79.8 *** 0.000 0.313Male 143.9 34.2 109.6 *** 0.000
Age16-18 years 104.6 22.1 82.5 *** 0.000 0.82719-20 years 121.8 38.0 83.9 *** 0.00021-22 years 152.4 37.6 114.8 ** 0.021
EducationCompleted 9th grade or less 75.9 35.2 40.8 0.309 0.105Completed 10th or 11th grade 120.6 39.2 81.4 *** 0.000Obtained high school diploma 159.1 27.1 132.0 *** 0.000
Previous AFDC ReceiptReceived AFDC 105.0 31.8 73.2 ** 0.021 0.406Did not receive AFDC 138.6 35.1 103.5 *** 0.000
Limited English ProficiencyYes 122.0 88.4 33.6 0.560 0.266No 128.8 28.8 100.0 *** 0.000
Sample size 665 641
Months 1 to 6 on the Survey, by Subgroup
Evaluation of the CET Replication Sites
Impacts on Reported Hours of Participation in Training in
Table 2.11
SOURCE: BPA calculations from CET enrollment form and 30-month follow-up survey data.
NOTES: Calculations used data for all sample members for whom there were follow-up survey data, including those with values of zero for outcomes and those who were assigned to CET but did not participate. Estimates were regression-adjusted using ordinary least squares, controlling for pre-random assignment characteristics of sample members. Rounding may cause slight discrepancies in the calculations of sums and differences. For some outcomes, the sample size may be smaller than the full sample sizesc due to some missing observations. A two-tailed t-test was applied to differences between the program and control groups. Statistical significance levels are indicated as ***= 1 percent; **=5 percent; *=10 percent.

-51-
Impacts on Participation, by Site Fidelity
Table 2.12 displays CET’s impacts on participation in vocational training activities within six months of random assignment, according to site fidelity ratings.11 The impact on vo-cational training for high-fidelity sites was 24.3 percentage points, compared with 7.2 percent-age points for medium-fidelity sites and 3.7 percentage points for low-fidelity sites.
As shown in Table 2.13, differences in participation impacts across site fidelity ratings were also reflected in the number of hours of training during Months 1 to 6. In high-fidelity sites, the hours of training increased from 36 hours for the control group to 218 hours for the program group. In medium-fidelity sites, CET increased training from 31 hours to 42 hours. And in low-fidelity sites, the effect was an increase from 21 hours to 42 hours. It is evident from this pattern of impacts that the sites that succeeded in implementing and replicating the CET model were also better able to keep participants engaged in training activities.
Tables 2.12 and 2.13 also display impacts according to site fidelity/gender groups. Be-cause the sample sizes for these subgroups are small, the differences in impacts were not statis-tically significant, for the most part. Table 2.12 shows that the impact on participation in train-ing at high fidelity sites was somewhat greater for females (26.5 percentage points) than for males (23.6 percentage points). As shown in Table 2.13, CET’s impact on training hours for females at the high-fidelity sites (237.4 hours) was nearly twice as great as the impact for males (143.9 hours) — a difference that was marginally statistically significant.
Comparison of CET’s Participation Impacts with Impacts in Other Studies
As discussed earlier, CET’s impacts on participation in training and education activities — as well as its impacts on hours of participation in those activities — seem fairly low. Com-parisons with the JOBSTART and MFSP Demonstrations confirm this. In both studies, the im-pacts on education and training participation appear to have been substantially larger than the impacts found in this CET study, yet a direct comparison across the three studies is difficult be-cause of differences in methodologies and data. First, both the MFSP and the JOBSTART stud-ies conducted 12-month follow-up surveys, while the present study conducted its first follow-up at 30 months after random assignment. It is possible that this follow-up period was simply too long for respondents to accurately recall their participation in short-term employment and train-ing services. Second, while the CET evaluation relies exclusively on survey data to estimate
11Impacts by individual site are shown in Appendix C.
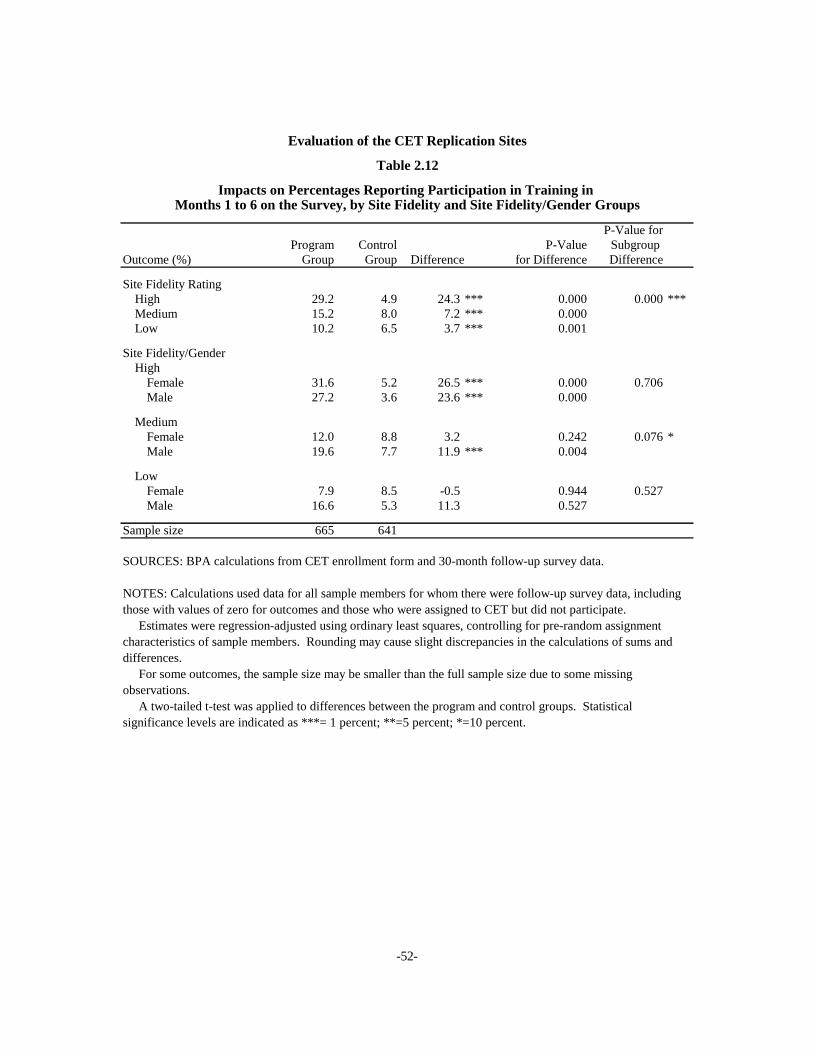
-52-
P-Value forProgram Control P-Value Subgroup
Outcome (%) Group Group Difference for Difference Difference
Site Fidelity RatingHigh 29.2 4.9 24.3 *** 0.000 0.000 ***Medium 15.2 8.0 7.2 *** 0.000Low 10.2 6.5 3.7 *** 0.001
Site Fidelity/GenderHigh
Female 31.6 5.2 26.5 *** 0.000 0.706Male 27.2 3.6 23.6 *** 0.000
MediumFemale 12.0 8.8 3.2 0.242 0.076 *Male 19.6 7.7 11.9 *** 0.004
LowFemale 7.9 8.5 -0.5 0.944 0.527Male 16.6 5.3 11.3 0.527
Sample size 665 641
Evaluation of the CET Replication Sites
Table 2.12
Impacts on Percentages Reporting Participation in Training in Months 1 to 6 on the Survey, by Site Fidelity and Site Fidelity/Gender Groups
SOURCES: BPA calculations from CET enrollment form and 30-month follow-up survey data.
NOTES: Calculations used data for all sample members for whom there were follow-up survey data, including those with values of zero for outcomes and those who were assigned to CET but did not participate. Estimates were regression-adjusted using ordinary least squares, controlling for pre-random assignment characteristics of sample members. Rounding may cause slight discrepancies in the calculations of sums and differences. For some outcomes, the sample size may be smaller than the full sample size due to some missing observations. A two-tailed t-test was applied to differences between the program and control groups. Statistical significance levels are indicated as ***= 1 percent; **=5 percent; *=10 percent.

-53-
P-Value forProgram Control P-Value for Subgroup
Outcome Group Group Difference Difference Difference
Site Fidelity RatingHigh 218.4 35.8 182.6 *** 0.000 0.000 ***Medium 93.8 31.4 62.4 *** 0.000Low 41.5 21.4 20.1 *** 0.000
Site Fidelity/GenderHigh
Female 270.7 33.3 237.4 *** 0.000 0.134Male 173.0 29.1 143.9 *** 0.000
MediumFemale 70.0 31.7 38.4 ** 0.033 0.137Male 128.6 35.2 93.5 *** 0.004
LowFemale 21.6 26.0 -4.4 0.857 0.384Male 117.7 13.2 104.5 0.419
Sample size 665 641
Table 2.13
Impacts on Reported Hours of Participation in Training in Months 1 to 6
Evaluation of the CET Replication Sites
on the Survey, by Site Fidelity and Site Fidelity/Gender Groups
SOURCES: BPA calculations from CET enrollment form and 30-month follow-up survey data.
NOTES: Calculations used data for all sample members for whom there were follow-up survey data, including those with values of zero for outcomes and those who were assigned to CET but did not participate. Estimates were regression-adjusted using ordinary least squares, controlling for pre-random assignment characteristics of sample members. Rounding may cause slight discrepancies in the calculations of sums and differences. For some outcomes, the sample size may be smaller than the full sample size due to some missing observations. A two-tailed t-test was applied to differences between the program and control groups. Statistical significance levels are indicated as ***= 1 percent; **=5 percent; *=10 percent.
-54-
participation impacts, similar impacts in the JOBSTART Demonstration were calculated from a combination of MIS data and survey data. Doing so may have artificially increased that study’s participation impacts, making any comparisons with CET difficult.
Participation impacts found in the MFSP study were also significantly higher than in this study. In the MFSP study, the impact on the percentage participating in any program within 12 months after random assignment was 49.4 percentage points. Unlike the JOBSTART study, the MFSP study used only survey data to calculate impacts on participation. However, in the survey data used for the MFSP study, program group respondents were prompted specifically about their participation in the MFSP program. In contrast, for the survey data used in this study, respondents were not asked at all about their participation in the CET program; instead, they were asked more generic questions about participation in vocational training activities, education activities, and job club/job search activities. In the MFSP study, the combination of a relatively early follow-up interview and a specific MFSP-related prompt resulted in a very high percentage (82.4 percent) of program group members responding that they had participated in any employment program since random assignment. In the CET study, the corresponding figure is only 30.8 percent.
Conclusions About Participation Impacts
The foregoing analysis of CET’s impacts on participation in employment and training activities indicates that, in general, the sites achieved the goal of replicating the CET model and providing short-term, intensive vocational training and employment search services to program group participants. However, the impacts appear to be much smaller than might have been ex-pected, especially at sites where fidelity to the CET model was low. Partly, this finding is ex-plained by apparent recall problems in the survey.
As expected, CET had its greatest impact on participation and hours of participation in vocational training during the first six months after random assignment. Program impacts on participation in job club/job search activities, though much smaller, were also positive and sta-tistically significant. By contrast, as would be expected, program impacts on participation in education activities were statistically insignificant and, in some cases, negative.
Evaluating the exact magnitude of participation impacts is difficult, given the survey’s apparent underreporting of participation. However, the fact that such a large percentage of par-ticipants could not recall having received any training at all is a sobering indication of the ap-parently limited influence that the program had on participants’ lives.

-55-
Impacts on Receipt of Education and Training Credentials This section focuses on the question of whether CET increased receipt of education or
training credentials. Such credentials have meaning to those who earn them beyond the value of the underlying education or training. On the job market, the value of obtaining education or training credentials lies partly in the signal that such credentials present to prospective employ-ers. A recognized training credential informs a prospective employer that the credentialed job candidate has mastered a certain set of useful skills and possesses the perseverance and ability to earn such a credential.
In general, because the CET model focuses primarily on providing intensive, short-term vocational training, the program group members would be more likely to obtain specific voca-tional training credentials and may be less likely to earn such unspecialized credentials as a Gen-eral Educational Development (GED) certificate, high school diploma, or college credential.
Findings in Brief
• The CET model had significant positive impacts on the attainment of training credentials. By Month 30 after random assignment, 39.3 percent of program group members had received a training credential, compared with only 24.7 percent of the control group.
• The CET model had no impact on the attainment of a high school diploma or GED.
• The CET programs were especially successful in helping participants whose English proficiency was limited. Among such participants, almost half (48.8 percent) of the program group earned training credentials by the Month 30, compared with only 13.3 percent of the control group.
• High-fidelity sites achieved the largest impacts on credential receipt. These impacts were further strengthened by the fact that control group members in high-fidelity sites were less likely to receive credentials than control group members in other sites.
Education and Training Credentials Among the Control Group
At random assignment, participants were not asked whether they had previously earned any training credentials. However, 5.6 percent of the sample reported that they had received training credentials by the first month after random assignment. The proportion of the program group who had received training credentials by the first month after random assignment (7.2

-56-
percent) was slightly higher than the proportion of the control group who had received training credentials (3.9 percent).
Although CET served out-of-school youth, it did not exclusively serve high school dropouts, and 42 percent of sample members had graduated from high school or held a GED certificate when they applied for the program. Of the 58 percent who did not have a high school diploma or GED certificate at random assignment, roughly half (51 percent) had completed the tenth grade or less, and the other half had completed the eleventh grade. Because of random assignment, there was no significant difference in the preprogram education levels of program and control group members.
The education levels of this sample are very similar to the CET subsample of the MFSP Demonstration and to the out-of-school youth subsample in the National JTPA Study.12 In con-trast, the JOBSTART program was designed specifically for high school dropouts, so that no one in that demonstration had a high school diploma or GED.
Impacts on Receipt of Education and Training Credentials
Table 2.14 displays the impacts on the receipt of a training certificate, high school di-ploma, and GED certificate. Impacts are shown for the end of Months 1, 6, 12, 18, and 30 of the follow-up period. The impacts for the first month after random assignment are included as a proxy for any credentials that sample members might already have earned by the date of ran-dom assignment. The table shows that the differences between the program and control groups were very small.
The program had positive and statistically significant impacts on the receipt of training credentials. By Month 30 of follow-up, 39.3 percent of the program group and 24.7 percent of the control group had earned training credentials, yielding an impact of 14.6 percentage points. Given that a fairly high percentage of the control group received training credentials by this time, the magnitude of this impact is impressive.13
CET also accelerated the receipt of training credentials. Whereas control group members earned training credentials steadily throughout the follow-up period, a much larger proportion of program group members received training credentials within the first year after random assign-
12In the CET-subsample of the MFSP Demonstration, 40.6 percent of the control group and 39.4 percent of the program group had a high school diploma or GED. In the National JTPA Study, 50.8 percent of female out-of-school youths had a high school diploma or GED, compared with 40.8 percent of male out-of-school youths.
13It should also be noted that the number of program group members who reported receiving a training credential by Month 30 exceeded the number who reported participating in any training, which provides addi-tional evidence that training participation was underreported on the survey.

-57-
Program Control P-Value for Outcome (%) Group Group Difference Difference
Received High School Diploma byMonth 1 47.6 48.6 -1.0 0.416Month 6 48.2 48.9 -0.7 0.596Month 12 48.5 49.7 -1.2 0.362Month 18 49.1 50.1 -1.0 0.451Month 30 49.7 51.1 -1.5 0.304
Received GED by Month 1 8.5 7.3 1.2 0.416Month 6 10.0 10.2 -0.2 0.903Month 12 12.7 12.2 0.5 0.777Month 18 13.7 13.8 -0.1 0.971Month 30 16.0 16.1 -0.1 0.967
Received Training Certificate by Month 1 7.2 3.9 3.3 ** 0.011Month 6 17.0 7.6 9.4 *** 0.000Month 12 30.5 11.4 19.1 *** 0.000Month 18 34.0 16.1 17.9 *** 0.000Month 30 39.3 24.7 14.6 *** 0.000
Sample size 665 641
Table 2.14
Impacts on Survey-Reported Receipt of Education and Training Credentials
Evaluation of the CET Replication Sites
SOURCES: BPA calculations from CET enrollment form and 30-month follow-up survey data.
NOTES: Calculations used data for all sample members for whom there were follow-up survey data, including those with values of zero for outcomes and those who were assigned to CET but did not participate. Estimates were regression-adjusted using ordinary least squares, controlling for pre-random assignment characteristics of sample members. Rounding may cause slight discrepancies in the calculations of sums and differences. For some outcomes, the sample size may be smaller than the full sample size due to some missing observations. A two-tailed t-test was applied to differences between the program and control groups. Statistical significance levels are indicated as ***= 1 percent; **=5 percent; *=10 percent.

-58-
ment. By Month 12 of follow-up, 30.5 percent of the program group had earned a training creden-tial, compared with only 11.4 percent of the control group. This is not surprising, because most CET training is completed within one year. However, this finding also indicates that, on average, program group members had earned training credentials and would have been ready for the job market earlier than control group members. Chapter 3 examines whether this acceleration in the receipt of training credentials had a positive effect on subsequent employment outcomes.
Table 2.14 shows that there was no program effect on receipt of a high school diploma. By the end of follow-up, the percentage of program group members who reported having a high school diploma had increased to 49.7 percent, compared with 51.1 percent of the control group. This program-control group difference was not statistically significant. The table also shows that there were no impacts on receipt of a GED certificate. The percentage of the program group who received a GED increased from 8.5 percent in the first month after random assignment to 16.0 percent by the end of follow-up. During that time, the percentage of the control group who received a GED grew from 7.3 percent to 16.1 percent. The program-control group differences were not statistically significant.
Impacts on Training Credentials, by Subgroup
Table 2.15 shows CET’s impacts on the attainment of training credentials by sub-groups. In general, positive effects on credential receipt were sustained across most subgroups, although some subgroups experienced stronger effects than others. For example, a larger impact was found for high school graduates than for those who entered the study without a high school diploma — a difference that may reflect the fact that high school graduates had an easier time securing a credential once they entered the program.
Although most of the subgroup differences in impacts on credential receipt were not statistically significant, there were some exceptions. The program was particularly successful in helping participants whose English proficiency was limited; the impacts for them were much larger than for sample members whose English proficiency was not limited. Among program group members who had limited English proficiency, a sizable percentage (48.8 percent) ob-tained a training credential, whereas the corresponding percentage of control group members who obtained a training credential was very low (13.3 percent).14
14There was only a small correlation between site fidelity ratings and the number of participants whose
English proficiency was limited. In the high-fidelity sites, 9.8 percent of participants had limited English profi-ciency; in the medium-fidelity sites, 13.9 percent; and in the low-fidelity sites, 2.9 percent. Thus, site fidelity only minimally affected the better impacts for participants whose English proficiency was limited.

-59-
P-Value forProgram Control P-Value for Subgroup
Outcome (%) Group Group Difference Difference Difference
Gender 0.471Female 41.5 28.3 13.2 *** 0.000Male 36.7 19.6 17.1 *** 0.000
Age 0.73616-18 years 34.2 23.1 11.1 ** 0.01719-20 years 41.8 26.0 15.8 *** 0.00021-22 years 40.7 27.3 13.3 * 0.062
Education 0.271Completed 9th grade or less 30.1 23.0 7.1 0.420Completed 10th or 11th grade 32.9 21.7 11.2 *** 0.004Obtained high school diploma 49.7 30.4 19.3 *** 0.000
Previous AFDC Receipt 0.438Received AFDC 38.6 28.0 10.6 * 0.075Did not receive AFDC 40.5 24.7 15.8 *** 0.000
Limited English Proficiency 0.016 **Yes 48.8 13.3 35.5 *** 0.000No 39.4 26.2 13.2 *** 0.000
Sample size 665 641
Table 2.15
Evaluation of the CET Replication Sites
Impacts on Percentages Reporting Receipt of a Training Certificate, by Subgroup
SOURCES: BPA calculations from CET enrollment form and 30-month follow-up survey data.
NOTES: Calculations used data for all sample members for whom there were follow-up survey data, including those with values of zero for outcomes and those who were assigned to CET but did not participate. Estimates were regression-adjusted using ordinary least squares, controlling for pre-random assignment characteristics of sample members. Rounding may cause slight discrepancies in the calculations of sums and differences. For some outcomes, the sample size may be smaller than the full sample size due to some missing observations. A two-tailed t-test was applied to differences between the program and control groups. Statistical significance levels are indicated as ***= 1 percent; **=5 percent; *=10 percent.

-60-
Impacts on Training Credentials, by Site Fidelity
As was the case for CET’s impacts on training participation, there were significant dif-ferences in impacts on credential receipt across site fidelity ratings. Again, high-fidelity sites had significantly better impacts than low- or medium-fidelity sites. However, part of this differ-ence seems to reflect variation in control group outcomes. For example, Table 2.16 shows, 43.7 percent of the program group in high-fidelity sites received a training credential, compared with 38.6 percent in medium-fidelity sites. Credential receipt rates for the control groups were 18.8 percent in high-fidelity sites and 26.9 percent in medium-fidelity sites. Apparently, earning a training credential outside the CET program was more difficult in high-fidelity sites.
Table 2.16 also displays training credential impacts for site fidelity/gender groups. The training credential impact at high-fidelity sites was substantially higher for females than for males (35.2 versus 19.1 percentage points), though this difference was not statistically signifi-cant. It should be noted again that differences across site fidelity/gender groups are unlikely to be statistically significant because the sample sizes are small.
Comparison of Impacts on Education and Training Credentials with Impacts in Other Studies
As discussed earlier, it is difficult to compare the impacts found in this study with im-pacts found in other studies, because of the difference in the timing of the follow-up survey. However, CET’s impacts on the receipt of training credentials are somewhat comparable to those found in the JOBSTART Demonstration.15 In the JOBSTART study, the impact on re-ceiving a trade certificate or license by the end of Month 48 was 15.8 percentage points: 33.1 percent of the program group and 17.3 percent of the control group had received a training cre-dential at that time. This impact is close to CET’s 14.6 percentage point impact, although higher percentages of both the program and the control group received training credentials in this study. Because CET’s study sample was substantially better educated on average than the JOBSTART sample, it is reasonable to expect that the rate of credential receipt should exceed the rate found in JOBSTART; better-educated participants face fewer barriers to completing training and are likely to complete training faster.
Conclusion Despite the differences between this study’s two data sources — the 30-month survey
and the CET MIS data — the findings tell a fairly consistent story with respect to participation in CET. One part of the story is that not all the people who participated in CET reported having
15The MFSP and JTPA studies did not include information about the attainment of training credentials.

-61-
P-Value forProgram Control P-Value for Subgroup
Outcome (%) Group Group Difference Difference
Site Fidelity Rating 0.021 **High 43.7 18.8 24.9 *** 0.000Medium 38.6 26.9 11.7 *** 0.000Low 28.6 29.3 -0.7 0.944
Site Fidelity/GenderHigh 0.083 *
Female 50.6 15.4 35.2 *** 0.000Male 38.7 19.7 19.1 *** 0.004
Medium 0.309Female 39.9 31.4 8.5 ** 0.045Male 36.0 20.4 15.6 *** 0.005
Low 0.151Female 31.2 37.2 -6.1 0.646Male 34.4 0.3 34.7 0.205
Sample size 665 641
Table 2.16
Impacts on Percentages Reporting Receipt of a Training Certificate,
Evaluation of the CET Replication Sites
Difference
by Site Fidelity and Site Fidelity/Gender Groups
SOURCES: BPA calculations from CET enrollment form and 30-month follow-up survey data.
NOTES: Calculations used data for all sample members for whom there were follow-up survey data, including those with values of zero for outcomes and those who were assigned to CET but did not participate. Estimates were regression-adjusted using ordinary least squares, controlling for pre-random assignment characteristics of sample members. Rounding may cause slight discrepancies in the calculations of sums and differences. For some outcomes, the sample size may be smaller than the full sample size due to some missing observations. A two-tailed t-test was applied to differences between the program and control groups. Statistical significance levels are indicated as ***= 1 percent; **=5 percent; *=10 percent.

-62-
done so on the survey. For this reason, participation rates from the survey understate actual par-ticipation achieved by the CET programs. Such recall bias is a common problem that becomes more severe the longer the follow-up period. But what are the implications of this bias for the estimated impacts of the program, which are estimated using the survey data? On the one hand, the impacts on participation, which were fairly modest, are probably somewhat underestimated, although it is difficult to determine by how much. On the other hand, the fairly substantial im-pacts on the receipt of training credentials are probably not biased. Thus, although the participa-tion impacts may not tell the whole story, the data on credentials do.
The other part of the story is a site story: The impacts on participation and credential re-ceipt were large in the high-fidelity sites but were modest to nonexistent in the medium- and low-fidelity sites. In addition, in the medium- and low-fidelity sites, the program appears simply to have sped up participation; by the last month of follow-up, similar proportions of both the program and the control group in these sites reported having participated in some type of em-ployment and training activity.
Impacts on participation and credential receipt are an important component of any evaluation of a service program, since they set the stage for the subsequent impacts on such out-comes as participants’ employment and earnings. A key question answered by the analysis of participation impacts is whether or not the service differential created by the program is large enough to provide a fair test of the program’s services. Thus, even if the CET model is effective at increasing employment and earnings, if the program increased participation by only a small amount, there is little reason to expect it to have any effects on labor market outcomes. In that case, effects on employment would not necessarily be a fair assessment of the CET model. (Of course, it is possible that the program could improve participants’ outcomes in the absence of increases in participation if the quality and type of training that it provided were different.)
Based on the findings presented here, one can conclude that this evaluation provides a fair test of the CET model, but only in the high-fidelity sites. In these sites, the program in-creased participation substantially, especially in the early months, and it also greatly increased the number of youth who earned training credentials. The next question regarding the high-fidelity sites is whether or not these changes led to changes in participants’ employment and earnings. In the medium- and low-fidelity sites, in contrast, the training differential that CET created was fairly small. It is important to keep the participation figures in mind when interpret-ing subsequent impacts on employment and other outcomes. For this reason, the remaining chapters present CET’s subsequent impacts according to site fidelity ratings.

-63-
Despite the lack of large training differentials, a lot can be learned from the experiences of sample members at medium- and low-fidelity sites. First, in these sites, the evaluation is still a fair test of the replication effort itself, that is, the sites’ ability to make a real difference in training receipt for this group of young people and to replicate the various components of the CET model. Differences in the sites’ implementation experiences may suggest lessons for in-creasing and sustaining participation. Second, even in the medium- and low-fidelity sites, the evaluation presents a test of the “net” difference that CET makes, compared with alternative training options available to young people.

-64-
Chapter 3
The Impacts of the CET Model on Employment, Benefit Receipt, and Income
The original program of the Center for Employment Training (CET) in San Jose, Cali-fornia, has been one of the few bright spots in an otherwise disappointing history of employ-ment and training programs for youth. The Evaluation of the CET Replication Sites was de-signed to test the robustness of those earlier results. Could the CET model be implemented in other places? If so, would it increase employment and earnings among disadvantaged youth? The interim report showed that about a third of the replication sites were able to fully implement the CET model,1 and Chapter 2 shows that the program — especially in the fully implemented, high-fidelity sites — increased participation in certain activities. This chapter examines whether access to the program increased youths’ employment, earnings, and income.
Summary of Findings • For the full sample, the CET model had few effects on employment,
earnings, and income during the first 30 months, even in the high-fidelity sites where the model was well implemented. As expected, the CET model reduced employment rates in the early months after random as-signment, while youth in the program group participated in training. And al-though the program in some sites led to a small increase in employment to-ward the end of the first year, this increase did not last for more than a few months. The sites that implemented the program most successfully produced the biggest changes in employment, including a fairly large drop in employ-ment rates while participants were in training and moderate increases in em-ployment in the subsequent months. These effects, however, did not persist beyond the beginning of the first year, in part because many of the youth who went to work because of the program did not stay employed for long.
• In the high-fidelity sites, the CET model led to a fairly large increase in employment and earnings for females but had the opposite effect for males. The limited effects found for the overall sample in the high-fidelity sites mask two opposing gender effects. On the one hand, the program in-creased the percentage of females who worked during the follow-up period,
1Walsh, Goldsmith, Abe, and Cann, 2000.

-65-
and it also increased their average earnings — effects that are fairly large compared with other programs for young women. On the other hand, fewer of the males in the program group worked during the follow-up period, and they had lower earnings. Employment and training programs have typically had more success with women than men, and the results show that CET was no different. A possible reason for this pattern is that the men in these pro-grams face more employment barriers than the women, such as prior arrest records, drug use, and the perception among prospective employers that it is more risky to hire young men than young women. However, the fact that CET reduced employment among males is concerning. Perhaps the young men in the program decided to hold out for higher-wage jobs that never ma-terialized, or perhaps they received training for jobs that were not available in their local area.
• In the sites that were less successful in implementing the CET model, the program reduced employment and earnings for youth who did not have a high school diploma and for those younger than age 19. In the medium- and low-fidelity sites, the program reduced employment for these two groups of young people while they participated in services, but it never increased employment after that point. In other words, some youth stayed out of jobs to participate in training but never found jobs after leaving training. As with the effects for males in the high-fidelity sites, the reasons for these effects are not clear. Nonetheless, the reduction in employment is an important side effect of the program that should be monitored.
It may not be surprising that the overall program had little effect on these young people, given that several sites had so much difficulty fully implementing the CET model. The real test of the model, then, is in the high-fidelity sites, and the results for the first 30 months show that the model was successful for females but not males. The next step is to see whether the effects for young women persist beyond Month 30 and to see whether the training received by the young men eventually leads to positive effects. One reason for the program’s lack of effects among males may be that it operated in a relatively strong economy, at least during the first 25 to 30 months covered by this report — meaning that many of the youth in the evaluation were able to find jobs on their own. The 54-month follow-up period for the next report, which will cover the recent economic slowdown, will provide a test of this hypothesis and, more broadly, a test of the CET model in a weaker labor market. Finally, the lack of effects for males may sim-ply be further evidence that what works for women does not work for men. In this case, the next step in helping disadvantaged young men is to take what is good about CET and build on it.

-66-
Employment Experiences of Disadvantaged Youth Before examining the effects of the program on young people’s labor market outcomes,
it is helpful to document what their experiences would have been in the absence of the program. Over time, how many would have gone to work, and in what types of jobs? This information provides some sense of what the program is up against — or, alternatively, where there is room for the program to produce improvements. To present this counterfactual, this section looks at the employment experiences of those members of the study sample who were in the control group and thus were not eligible to receive CET services.
Figure 3.1 shows the percentage of control group members who were employed in each month after random assignment, or entry into the evaluation. In the month after they entered the evaluation, for example, only about 19 percent were working. Monthly employment rates in-creased substantially over the follow-up period, with the result that more than 60 percent of the control group worked in Month 30. Thus, although these youth were relatively disadvantaged, a high proportion of them went to work — a trend that may reflect the strong economy of the mid to late 1990s. As a comparison, the control group in the JOBSTART evaluation, although consisting entirely of high school dropouts, had average employment rates between 40 percent and 45 per-cent during the third year of follow-up. In this CET study, as shown later, 54 percent of the youth without a high school diploma were working at the time of the 30-month follow-up survey.2
Table 3.1 presents additional employment outcomes for the control group. Almost 90 percent worked at some point during the follow-up period, whereas only 57 percent were working at the 30-month point — reflecting a considerable amount of job loss. The next several rows of the table show what is behind these numbers: Among control group members who went to work at some point during the first follow-up year, about half (47 percent) stayed employed consistently, or for 20 or more months. On the other hand, over a third (37 percent) stayed employed for less than 12 months. Although the overall employment rate is fairly high for the control group, there is some room for improvement in terms of employment stability, or job retention.
The next rows of Table 3.1 present data on earnings. Among control group members who worked during the last five months of follow-up, average earnings on an annual basis were $11,679. In the JOBSTART evaluation, average earnings (adjusted for inflation) were about $10,700 for those who worked during the third year of follow-up. Average earnings for the CET control group are fairly low, in part because some people did not work all five months of the period. Looking only at those who worked in every month of Months 25 to 29 (48 percent of the
2The third year of follow-up for the JOBSTART sample roughly corresponds to the year 1989, compared
with about 1999 for the CET sample. Although unemployment rates were somewhat lower in 1999 than 1989, the economy was relatively strong in both years.
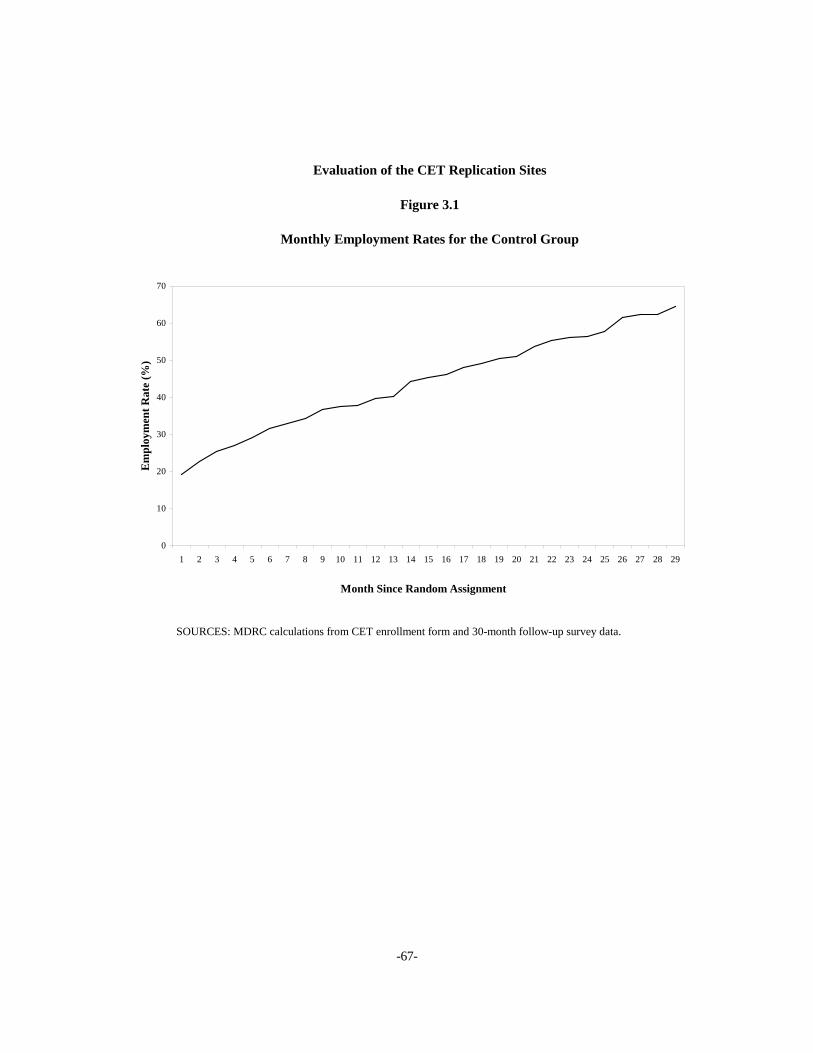
-67-
Evaluation of the CET Replication Sites
Figure 3.1
Monthly Employment Rates for the Control Group
0
10
20
30
40
50
60
70
1 2 3 4 5 6 7 8 9 10 11 12 13 14 15 16 17 18 19 20 21 22 23 24 25 26 27 28 29
Month Since Random Assignment
Empl
oym
ent R
ate
(%)
SOURCES: MDRC calculations from CET enrollment form and 30-month follow-up survey data.

-68-
sample), average earnings on an annual basis were about $15,000, which implies a wage of be-tween $7 and $8 per hour.
The lower panel of Table 3.1 presents the control group members’ benefit receipt and income. For this sample, the receipt of public benefits is fairly low. In Month 29, less than 10 percent received welfare (Temporary Assistance for Needy Families [TANF] benefits), and only 17 percent received food stamps. Although welfare receipt is expected to be low because only about half the sample have children, the rates of food stamp receipt are surprisingly low, considering that most people in the sample were probably eligible for some benefits. Finally, the control group’s average family income in the year before the survey was $15,255. As a com-
Table 3.1
Employment and Income of the Control Group
Outcome
Employment
Ever worked during follow-up (%) 89.6
Working at survey (%) 57.1
Went to work within first year (%) 57.0Among those:
Stayed employed consistently for less than 12 months 37.0Stayed employed consistently for 12 to 20 months 16.0Stayed employed consistently for more than 20 months 47.0
Worked during Months 25 to 29 (%) 73.8Average annual earnings ($) 11,679
Worked every month in Months 25 to 29 (%) 48.0Average annual earnings ($) 15,085
Benefits and Income
Received welfare in Months 25 to 29 (%) 9.8
Received food stamps in Months 25 to 29 (%) 16.7
Total family income in year before survey ($) 15,255
Sample size 641
Evaluation of the CET Replication Sites
SOURCES: MDRC calculations from CET enrollment form and 30-month follow-up survey data.
NOTE: For some outcomes, the sample size may be smaller than the full sample size due to some missing observations.

-69-
parison, the poverty line in 1999 ranged from about $11,000 for a family of two to $17,000 for a family of four.
The employment data for the control group suggest that the sample can be subdivided into two groups of about equal size — people who worked fairly consistently throughout the period and those who did not. Knowing the relative sizes of these two groups is important for interpreting the impacts of the program, since there is clearly more room for improvement for the latter group. Considering the control group members who would have gone to work any-way, perhaps aided by the strong economy: CET has little room to increase employment rates or job retention, but it may be able to increase their earnings by helping them get better jobs. For the control group members who did not work consistently, CET may increase employment and earnings by helping them find better jobs and by helping them stay in these jobs longer.
Table 3.2 presents more detail about these two kinds of control group members, hereaf-ter referred to as the high-employment group (worked every month of the last five months of follow-up) and the low-employment group (did not work every month of the last five months of follow-up). Among the high-employment group, 86.7 percent were working at the time of the survey, compared with only 32.4 percent of the low-employment group. The next several rows of the table show why so few of the latter group were employed at the survey. Among those in the low-employment group who worked during the first year, the majority did not work for more than 12 consecutive months.
What types jobs did people in the two groups take? The next several rows of Table 3.2 present information on the characteristics of respondents’ most recently held or current job as of the 30-month survey. On average, they earned between $7 and $8 per hour — higher than the federal minimum wage but still low. The high-employment group earned about 10 percent higher wages than the other group. Perhaps as expected, the most common industry of employ-ment for both groups, but especially for the low-employment group, was retail trade, which runs the gamut from department stores to eating and drinking establishments to clothing stores. The most commonly held job within retail trade was in eating and drinking establishments. In this sense, there seems to be room for improvement in helping these young people find better jobs. Members of the high-employment group were somewhat more likely to work in the profes-sional services industry, and the majority of these workers were in health care, such as in hospi-tals, nursing homes, and medical offices.
How did these control group members find their job and, if they were not working at the time of the survey, why did they leave their job? The next several rows of Table 3.2 show that many young people still rely on informal networks to find work: Nearly half the sample, for both groups, reported that they had learned of their job through a friend or relative. Other re-search has suggested that the high reliance on informal networks among disadvantaged youth is

-70-
Worked Consistently, Did Not Work Consistently,Outcome Months 25 to 29 Months 25 to 29
Employment
Ever worked during follow-up (%) 100.0 79.2
Working at survey (%) 86.7 32.4
Went to work within first year (%) 63.0 50.2Among those:
Stayed employed consistently for less than 12 months 19.0 63.8Stayed employed consistently for 12 to 20 months 10.6 24.7Stayed employed consistently for more than 20 months 70.4 11.9
Average annual earnings in Year 3 ($) 15,086 2,654
Average wage at most recent job ($) 7.80 7.05
Industry of most recent job (%)Construction/manufacturing 16.7 14.7Retail trade 24.8 35.3 Eating/drinking establishments 7.5 13.5Professional services 20.1 14.7 Health services 11.6 8.7Other services 17.7 17.5Other industry 20.7 17.9
Method of finding most recent job (%)Public or private employment service 8.5 9.5Newspaper or other media ads 18.0 20.2Friend or relative 45.2 44.8School training program 7.5 4.4Other method 19.0 18.3
If not working at survey, reason why (%)Laid off 23.1 10.7Job ended 10.3 11.2Fired 12.8 8.4Quit 48.7 37.7No response given 5.1 32.1
Demographics (%)
Female 56.3 61.6Black 47.7 53.6Hispanic 47.7 37.1White 4.1 7.9High school dropout 50.4 61.5Less than age 19 30.9 29.9
Sample size 294 318
Table 3.2
Evaluation of the CET Replication Sites
Employment Experience of Youth in the Control Group
SOURCES: MDRC calculations from CET enrollment form and 30-month follow-up survey data.NOTE: For some outcomes, the sample size may be smaller than the full sample size due to some missing observations.

-71-
an employment barrier, given that many live in economically isolated areas.3 The next several rows of the table show the reason for leaving the most recent job, for those who were not work-ing at the time of the survey. The short job tenure for the low-employment group does not seem to be because the jobs were temporary in nature; almost half of the respondents who were not employed at time of the survey reported that they had quit or been fired.
The bottom panel of Table 3.2 shows whether consistent employment among the con-trol group members was associated with several demographic characteristics. On the one hand, for example, the likelihood of working consistently during the follow-up period does not appear to be strongly related to age, since similar percentages of both samples were under age 19. On the other hand, the low-employment group has higher percentages of females, African-Americans, and respondents without a high school diploma. The relatively high percentage of Hispanic respondents in the high employment group may reflect the fact that they were concen-trated primarily in the western sites, which had higher employment rates, on average, than the other sites.
The data for the control group show that although there is room for improvement in the employment of these young people, CET will have to clear a higher hurdle than perhaps was originally expected. Although a significant proportion of control group members had steady work during the follow-up period, they earned moderate to low wages, on average, because many worked in traditionally low-wage jobs that offered limited advancement. CET’s intensive training was expected to increase earnings by helping participants find better jobs.
Impacts on Employment and Earnings Figure 3.2 presents monthly employment rates for the program and control groups. The
effects of the program show up immediately, as the employment rate in Month 1 for the program group is about 4 percentage points lower than the rate for the control group. The reduction in em-ployment is statistically significant in Months 2 through 5 and is an expected outcome of the pro-gram, since part of the model is for individuals to participate in intensive training for the first sev-eral months. The lower employment rates for the program group through Month 9 are consistent with the findings in Chapter 2 showing an increase in participation in Months 1 through 8.
For both groups, monthly employment rates over the follow-up period increased fairly substantially, from 20 percent to 60 percent. However, the similarity of the two graph lines in Figure 3.2 shows that the program did not increase employment rates. In Month 27, for exam-ple, employment rates were 62 percent for both groups. Although there was a slight increase in
3Ihlanfeldt, 1997; Wilson, 1987.

-72-
Evaluation of the CET Replication Sites
Figure 3.2
Monthly Employment Rates for the Program and Control Groups
0
10
20
30
40
50
60
70
1 2 3 4 5 6 7 8 9 10 11 12 13 14 15 16 17 18 19 20 21 22 23 24 25 26 27 28 29
Month Since Random Assignment
Empl
oym
ent R
ate
(%)
Program Group
Control Group
SOURCES: MDRC calculations from CET enrollment form and 30-month follow-up survey data.

-73-
work during the months immediately after the training period (Months 11 through 13), these impacts were not statistically significant.
Table 3.3 presents summary measures of employment and earnings for the program and control groups. Almost 90 percent of both groups worked at some point during the follow-up period, but less than 60 percent reported working at the time of the survey. The differences be-tween the program and control groups were small and not statistically significant. The next sev-eral rows of the table present summary measures of employment and earnings for each six-month interval of the follow-up period. (The last interval covers the five months from Month 25 through Month 29 and has been converted to a six-month equivalent.) The number of months worked each period increased, reflecting the rising employment rates shown in Figure 3.2. On average, program group members worked 1.2 months during the first six-month interval, com-pared with 3.7 months during the last interval. Earnings also increased over time, from $1,161 in the first six months to $4,075 in the last period. As expected, employment and earnings were somewhat less for the program group than control group during the first six months, when most training occurred. After that point, however, earnings and employment were not higher for the program group and, in fact, were lower during the last two periods, although the differences were not statistically significant.
The average earnings shown in Table 3.3 were calculated over the full sample, and the nonworking respondents were counted as having zero earnings. As such, the average earnings do not accurately represent the earnings of the working respondents. Their average earnings can be estimated for the last follow-up period by dividing the average earnings for the full sample by the percentage of the sample who worked during that period, giving $4,845 for the program group and $4,870 for the control group.
One goal of the program was to help participants find better jobs than they otherwise would have found, thus increasing their earnings over time. Although Table 3.3 shows no effect on average earnings, Table 3.4 looks in more detail at whether the program affected the types of jobs that participants found; it presents information on wage rates, benefits provided, weekly hours worked, and the industry and occupation of individuals’ most recent or current job at the time of the survey. The first several rows of the table present the distribution of wage rates, which were calculated for the entire sample rather than just for people who worked, in order to preserve the experimental comparison between the full program and control groups. Thus, the proportion in each of the wage categories does not sum to 100 percent but sums to the percent-age of the sample who worked at some point during the follow-up period: 87.1 percent of the program group and 89.6 percent of the control group. The most common wage earned for both groups was between $5.00 and $7.00 per hour. Although this is consistent with a federal mini-mum wage of $5.15, the majority of respondents in this wage category were earning between

-74-
Program Control P-Value for Outcome Group Group Difference Difference Impact (%)
Ever worked during follow-up (%) 87.1 89.6 -2.5 0.166 -2.7
Working at survey (%) 54.7 57.3 -2.6 0.348 -4.5
Number of months worked (%)Months 1 to 6 1.2 1.6 -0.3 ** 0.017 -19.7Months 7 to 12 2.2 2.2 0.0 0.943 0.5Months 13 to 18 2.8 2.7 0.1 0.515 3.7Months 19 to 24 3.1 3.2 -0.1 0.557 -2.7Months 25 to 29a 3.6 3.7 -0.1 0.688 -1.6
Earnings ($)Months 1 to 6 1,161 1,411 -250 * 0.088 -17.7Months 7 to 12 2,367 2,313 54 0.789 2.3Months 13 to 18 3,167 3,164 3 0.990 0.1Months 19 to 24 3,578 3,807 -229 0.348 -6.0Months 25 to 29a 4,075 4,312 -237 0.328 -5.5
Total earnings over follow-up ($) 13,502 14,094 -592 0.482 -4.2
Sample size 665 641
Table 3.3
Evaluation of the CET Replication Sites
Impacts on Employment and Earnings
SOURCES: MDRC calculations from CET enrollment form and 30-month follow-up survey data.
NOTES: Calculations used data for all sample members for whom there were follow-up survey data, including those with values of zero for outcomes and those who were assigned to CET but did not participate. Estimates were regression-adjusted using ordinary least squares, controlling for pre-random assignment characteristics of sample members. Rounding may cause slight discrepancies in the calculations of sums and differences. For some outcomes, the sample size may be smaller than the full sample size due to some missing observations. A two-tailed t-test was applied to differences between the program and control groups. Statistical significance levels are indicated as ***= 1 percent; **=5 percent; *=10 percent. aIn order to have consistent categories, Months 25 to 29 have been converted to the equivalent of a six-month period.
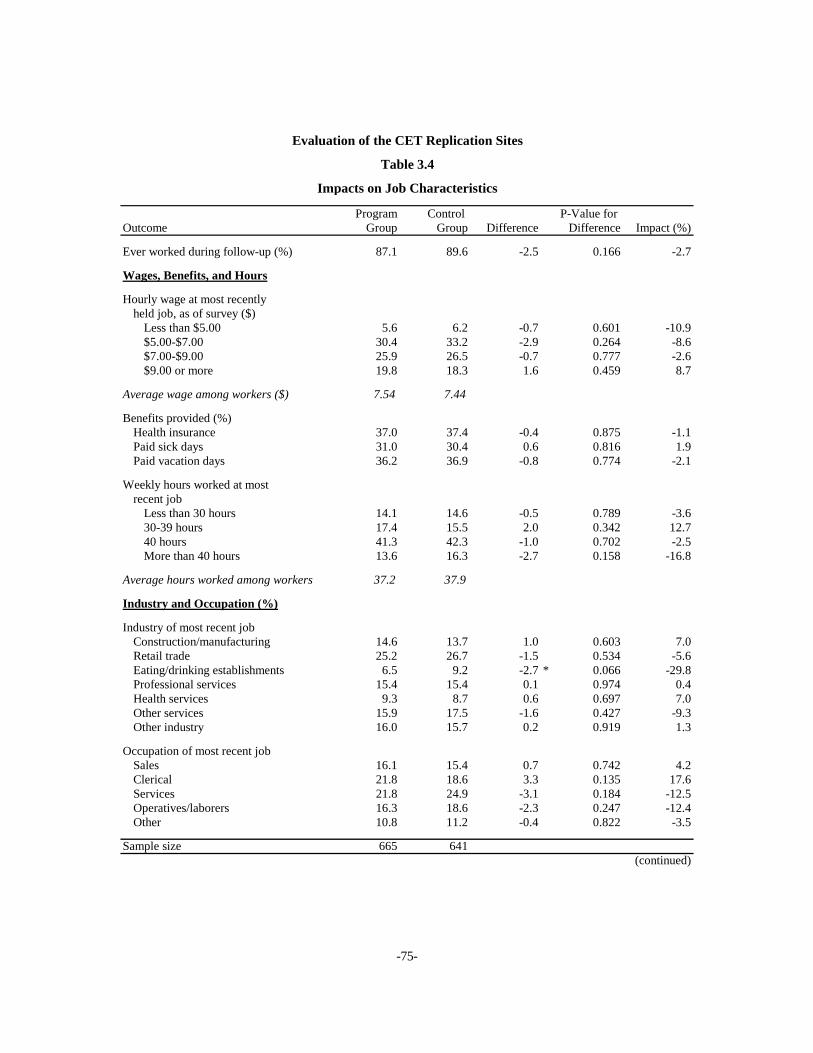
-75-
Evaluation of the CET Replication Sites
Table 3.4
Impacts on Job Characteristics
Program Control P-Value for Outcome Group Group Difference Difference Impact (%)
Ever worked during follow-up (%) 87.1 89.6 -2.5 0.166 -2.7
Wages, Benefits, and Hours
Hourly wage at most recently held job, as of survey ($)
Less than $5.00 5.6 6.2 -0.7 0.601 -10.9$5.00-$7.00 30.4 33.2 -2.9 0.264 -8.6$7.00-$9.00 25.9 26.5 -0.7 0.777 -2.6$9.00 or more 19.8 18.3 1.6 0.459 8.7
Average wage among workers ($) 7.54 7.44
Benefits provided (%)Health insurance 37.0 37.4 -0.4 0.875 -1.1Paid sick days 31.0 30.4 0.6 0.816 1.9Paid vacation days 36.2 36.9 -0.8 0.774 -2.1
Weekly hours worked at most recent job
Less than 30 hours 14.1 14.6 -0.5 0.789 -3.630-39 hours 17.4 15.5 2.0 0.342 12.740 hours 41.3 42.3 -1.0 0.702 -2.5More than 40 hours 13.6 16.3 -2.7 0.158 -16.8
Average hours worked among workers 37.2 37.9
Industry and Occupation (%)
Industry of most recent jobConstruction/manufacturing 14.6 13.7 1.0 0.603 7.0Retail trade 25.2 26.7 -1.5 0.534 -5.6Eating/drinking establishments 6.5 9.2 -2.7 * 0.066 -29.8Professional services 15.4 15.4 0.1 0.974 0.4Health services 9.3 8.7 0.6 0.697 7.0Other services 15.9 17.5 -1.6 0.427 -9.3Other industry 16.0 15.7 0.2 0.919 1.3
Occupation of most recent jobSales 16.1 15.4 0.7 0.742 4.2Clerical 21.8 18.6 3.3 0.135 17.6Services 21.8 24.9 -3.1 0.184 -12.5Operatives/laborers 16.3 18.6 -2.3 0.247 -12.4Other 10.8 11.2 -0.4 0.822 -3.5
Sample size 665 641(continued)

-76-
$6.00 and $6.50 per hour. CET did not have much effect on wage rates, other than a small but statistically insignificant increase in the number of respondents earning $9.00 or more per hour.
The next three rows of Table 3.4 present the percentages of the sample who had each of three key job benefits: health insurance offered by the employer, paid sick days, and paid vaca-tion. Among those who worked at some point during follow-up, about 42 percent (37 per-cent/87 percent) worked for an employer who offered health insurance. These numbers for job benefits are lower than national averages, and they likely reflect the fact that lower-wage jobs do not typically offer such benefits. CET had no effect on job quality as measured by these types of benefits.
The data on hours worked show that most of the sample worked full time or more in their current or most recent job, as of the survey; 41 percent of the program group worked ex-actly 40 hours per week, and 14 percent worked more than 40 hours per week. CET did not af-fect hours worked. These data show that the low levels of job benefits for these workers did not seem to reflect the fact that most of them worked in part-time jobs, which typically do not offer benefits. Only about 15 percent of the sample worked fewer than 30 hours per week.
The lower panel of Table 3.4 presents information on the industry and occupation of re-spondents’ current or most recent job. The only statistically significant difference between the program and control groups was in the percentage of respondents working in eating and drink-ing establishments. Although the program may have helped participants avoid these types of low-paying jobs, it is not clear what other types of jobs they took, since the reduction in em-ployment in this industry is not matched by an increase anywhere else. In fact, the impact on employment in this industry (2.7 percentage points) matches the reduction in the percentage of the sample who worked during the follow-up period (2.5 percentage points, in the table’s top row). One possibility is that the program reduced employment among people who otherwise
Table 3.4 (continued)
SOURCES: MDRC calculations from CET enrollment form and 30-month follow-up survey data.
NOTES: Calculations used data for all sample members for whom there were follow-up survey data, including those with values of zero for outcomes and those who were assigned to CET but did not participate. Estimates were regression-adjusted using ordinary least squares, controlling for pre-random assignment characteristics of sample members. Rounding may cause slight discrepancies in the calculations of sums and differences. For some outcomes, the sample size may be smaller than the full sample size due to some missing observations. A two-tailed t-test was applied to differences between the program and control groups. Statistical significance levels are indicated as ***= 1 percent; **=5 percent; *=10 percent.

-77-
would have taken these types of jobs; for example, it may have done so by encouraging them to hold out for better jobs. The result, however, was that they did not find any work.
The results so far indicate that the program had little effect on overall employment rates or the types of jobs people held. Table 3.5 looks in more detail at work patterns by examining the timing of employment and employment stability. The first row shows the percentages of the sample who went to work within the first 12 months after random assignment. The next several
Evaluation of the CET Replication Sites
Table 3.5
Impacts on Employment Stability
Program Control P-Value for Outcome (%) Group Group Difference Difference Impact (%)
Went to work within first year and… 60.2 57.2 3.0 0.319 5.3Worked less than 12 consecutive months 22.1 20.7 1.4 0.578 6.8Worked 12-20 consecutive months 9.5 9.2 0.3 0.876 3.1Worked more than 20 consecutive months 28.7 27.4 1.3 0.629 4.9
Total months worked during follow-up0 months 16.6 14.0 2.6 0.204 18.41-5 months 16.6 18.5 -1.9 0.372 -10.46-11 months 18.9 19.0 -0.1 0.976 -0.412-19 months 19.6 20.0 -0.4 0.868 -1.920 months or more 28.3 28.5 -0.2 0.937 -0.7
Number of jobs held1 36.1 39.8 -3.6 0.177 -9.12 or 3 40.5 40.2 0.4 0.886 1.04 or more 10.0 9.0 1.0 0.518 11.5
Sample size 665 641
SOURCES: MDRC calculations from CET enrollment form and 30-month follow-up survey data.
NOTES: Calculations used data for all sample members for whom there were follow-up survey data, including those with values of zero for outcomes and those who were assigned to CET but did not participate. Estimates were regression-adjusted using ordinary least squares, controlling for pre-random assignment characteristics of sample members. Rounding may cause slight discrepancies in the calculations of sums and differences. For some outcomes, the sample size may be smaller than the full sample size due to some missing observations. A two-tailed t-test was applied to differences between the program and control groups. Statistical significance levels are indicated as ***= 1 percent; **=5 percent; *=10 percent.

-78-
rows divide this employment into stable versus unstable employment. For the program group, for example, 60 percent were employed at some point within the first year; 22 percent went to work within the first year and had unstable employment, or stayed employed without interrup-tion for less than one year; and 29 percent had stable employment. Thus, the slight majority of respondents who went to work in the first year worked consistently (29 percent/60 percent). However, the comparable numbers for the control group were very similar, showing that the program had no significant effect either on the timing of job-taking or on subsequent employ-ment stability.
The middle and bottom panels of Table 3.5 present the total number of months worked during the follow-up period and the number of jobs that respondents held. Although there were no significant differences, the pattern of results gives hints as to the types of youth the program may have affected. Recall that the program slightly reduced the percentage who worked at some point during the follow-up period, although this effect was not statistically significant. The most notable effect here — although also insignificant — is a reduction in the percentage who held only one job during the period. Thus, the program may have reduced employment among those who would not have become reemployed after a job loss — potentially a relatively disadvan-taged group. Of course, it is difficult to prove that that the program affected this group by dis-couraging them from taking any job. (However, the results for several subgroups in a later sec-tion show that the program’s reduction in employment was concentrated among the more dis-advantaged segment of the sample.) Even if this were true, any effects were very small and not statistically significant. The primary point to take away from the sum of the evidence is that the program did not lead to any noticeable increase in employment among youth in the program group, nor did it help them find better or more stable jobs.
Impacts on Benefit Receipt and Income Figure 3.3 presents data on the monthly receipt of welfare (AFDC or TANF) and food
stamps for the program and control groups. The rates of receipt were fairly low: Only about 10 percent to 13 percent of the sample received welfare in any given month, while about 16 percent to 20 percent received food stamps. Comparing the graph lines for the program and control groups shows that the program increased welfare receipt in the early months of follow-up, al-though only the impacts through Month 4 were statistically significant. This increase in benefit receipt may be expected and matches the reduction in employment during these same months. The increase also highlights that some youth cannot afford to stay out of the job market for long to participate in training without other sources of income. The increase in welfare receipt did not last beyond the first year. Effects on food stamp receipt show the opposite pattern, a statistically significant reduction in use among the program group through the beginning of the second year. The reduction during these months most likely reflects the increase in the employment rates that

-79-
Evaluation of the CET Replication Sites
Figure 3.3
Monthly Benefit Receipt for the Program and Control Groups
0
5
10
15
20
25
30
35
40
45
50
1 2 3 4 5 6 7 8 9 10 11 12 13 14 15 16 17 18 19 20 21 22 23 24 25 26 27 28 29
Month Since Random Assignment
Bene
fit R
ecei
pt (%
)
Program Group
Control Group
Food Stamps
Welfare
SOURCES: MDRC calculations from CET enrollment form and 30-month follow-up survey data.

-80-
were observed for the program group at the end of the first year. As with welfare receipt, how-ever, the effects did not last.
Table 3.6 presents summary measures of welfare and food stamp receipt over the fol-low-up period as well as total family income in the year prior to the survey. On average, the sample received welfare for about 1.5 months during each year of follow-up and food stamps for a little more than 2.0 months. The pattern of impacts is similar to those shown in Figure 3.3 (a first-year increase in welfare receipt and a second-year reduction in food stamp receipt), but none of the impacts was statistically significant.
The bottom panel of Table 3.6 presents family income for respondents in the year prior to the survey. Average incomes for both groups were fairly low, at around $15,000 to $16,000. The program group had a slightly higher income, by $672, but this difference was not statisti-cally significant and most likely reflects the program group’s higher rates of welfare and food stamp receipt in the last year of follow-up, since average earnings were similar for both groups. The bottom rows of the table show the distribution of income, which is helpful in showing whether a program — although not affecting income on average — may have changed the pro-portions of people who had either very low or very high incomes. As the data show, however, the CET model did not have any effects on the distribution of income.
Subgroup Impacts Although the evidence so far indicates that the program did not have much effect on the
sample as a whole, it is often the case that employment and training programs have effects on certain segments of the sample, such as those who have less work experience or lower levels of education. This section examines the program’s effects for subgroups defined by site fidelity, gender, education level, and age at program entry. Site fidelity, in particular, is likely to be an important factor, given the findings from earlier research that the sites varied widely in how successfully they implemented the CET model.
Site Fidelity, Gender, Education Level, and Age
For the following analyses, it is important to keep in mind that the sample sizes of the subgroups are generally half the size of the full sample; in addition, the smaller the sample, the less likely a given impact will be statistically significant.

-81-
Evaluation of the CET Replication Sites
Table 3.6
Impacts on Benefit Receipt and Income
Program Control P-Value for Outcome Group Group Difference Difference Impact (%)
Benefit Receipt
Number of months received welfare
Months 1 to 12 1.6 1.4 0.2 0.354 12.1Months 13 to 24 1.5 1.4 0.1 0.642 6.4Months 25 to 29a 1.5 1.2 0.3 0.167 21.3
Number of months received food stamps
Months 1 to 12 2.1 2.3 -0.2 0.285 -10.0Months 13 to 24 2.2 2.4 -0.1 0.607 -4.9Months 25 to 29a 2.4 2.1 0.3 0.178 14.7
Income
Total family income in year before survey ($) 15,956 15,284 672 0.279 4.4
Total income (%)Less than $5,000 23.0 24.4 -1.4 0.568 -5.9$5,000-$10,000 12.4 12.5 -0.2 0.936 -1.3$10,000-$15,000 20.9 21.1 -0.2 0.943 -0.8$15,000-$25,000 21.3 20.9 0.4 0.884 1.7More than $25,000 22.5 21.0 1.4 0.565 6.8
Sample size 665 641
SOURCES: MDRC calculations from CET enrollment form and 30-month follow-up survey data.
NOTES: Calculations used data for all sample members for whom there were follow-up survey data, including those with values of zero for outcomes and those who were assigned to CET but did not participate. Estimates were regression-adjusted using ordinary least squares, controlling for pre-random assignment characteristics of sample members. Rounding may cause slight discrepancies in the calculations of sums and differences. For some outcomes, the sample size may be smaller than the full sample size due to some missing observations. A two-tailed t-test was applied to differences between the program and control groups. Statistical significance levels are indicated as ***= 1 percent; **=5 percent; *=10 percent. aIn order to have consistent categories, Months 25 to 29 have been converted to the equivalent of a 12-month period.

-82-
Table 3.7 presents comparisons of program impacts in high-fidelity sites versus me-
dium/low-fidelity sites.4 El Centro, Oxnard, Riverside, and Santa Maria were determined by the implementation research to be high-fidelity sites that successfully implemented all of CET’s key components; the other eight sites were able to implement only one or two of the key compo-nents.5 The rightmost column of the table indicates whether the differences in impacts between the two sets of sites were themselves statistically significant and did not arise by chance. Al-though few of the site differences were statistically significant, they nonetheless show some in-teresting patterns.6
The most obvious site difference is that the program in the medium/low-fidelity sites reduced the percentages of the sample who worked during the follow-up period and who were employed at the time of the survey; 50.4 percent of the program group were working at the sur-vey, compared with 56.9 percent of the control group. Thus, the overall finding that the program had little effect on employment masks a negative impact in the medium/low-fidelity sites and an offsetting positive (although statistically insignificant) impact in the high-fidelity sites.
There was also a site difference in employment impacts over time. The next several rows of Table 3.7 show that both sets of sites reduced employment during the first six months, given participation in the program, but that the medium/low-fidelity sites did not recoup this loss during the subsequent periods. Employment rates for the program group in these sites re-mained below those of the control group throughout the follow-up period. In the high-fidelity sites, in contrast, employment was somewhat higher for the program group during the second year. The impact in these sites, however, did not persist into the third year. Other analyses (not shown) indicate that part of the reason that the impacts did not persist was that some of the youth who went to work because of the program did not stay employed consistently.
The next several rows of Table 3.7 show that the program led to lower earnings for the program group in both sets of sites. The reduction of $448 in the last period of follow-up in the high-fidelity sites, although not statistically significant, is somewhat puzzling, given the similar employment rates in that period. (Later analyses will show that this reduction in earnings partly reflects a reduction in work hours for some of the sample.) Another interesting difference be-tween the two sets of sites is the big shift in workers’ occupations in the high-fidelity sites, where the program reduced employment in service occupations and increased work in sales and
4Variations in participants’ characteristics across sites could confound some of the findings presented by
site. However, statistical tests revealed that differences in impacts across sites still generally held when the analysis controlled for participants’ characteristics as measured at random assignment.
5Walsh, Goldsmith, Abe, and Cann, 2000. 6Impacts on selected outcomes are shown by site in Appendix B.

P-Value for Program Control P-Value for Program Control P-Value for Subgroup
Outcome Group Group Difference Difference Group Group Difference Difference Difference
Ever worked during follow-up (%) 92.3 91.3 1.0 0.716 84.7 89.1 -4.4 * 0.050 0.130
Working at survey (%) 64.6 58.5 6.1 0.217 50.4 56.9 -6.6 ** 0.046 0.032 **
Number of months workedMonths 1 to 6 1.2 1.8 -0.6 *** 0.009 1.3 1.5 -0.2 0.175 0.138Months 7 to 12 2.4 2.3 0.1 0.724 2.1 2.2 -0.1 0.667 0.596Months 13 to 18 3.1 2.9 0.1 0.677 2.7 2.6 0.0 0.878 0.788Months 19 to 24 3.5 3.4 0.0 0.898 3.0 3.2 -0.2 0.272 0.479Months 25 to 29a 4.1 4.1 0.0 0.982 3.4 3.5 -0.1 0.533 0.739
Total earnings ($)Months 1 to 6 986 1,611 -625 ** 0.016 1,221 1,340 -118 0.504 0.105Months 7 to 12 2,694 2,625 70 0.857 2,206 2,202 4 0.988 0.884Months 13 to 18 3,879 3,642 236 0.617 2,836 2,990 -154 0.566 0.472Months 19 to 24 4,095 4,372 -277 0.553 3,335 3,595 -261 0.367 0.977Months 25 to 29a 4,557 5,095 -538 0.244 3,860 3,996 -136 0.639 0.460
Total earnings over follow-up ($) 15,308 16,321 -1,014 0.525 12,635 13,253 -618.0 0.538 0.833
Occupation (%)Sales 16.2 9.7 6.5 * 0.059 16.0 17.9 -1.9 0.438 0.046 **Clerical 26.5 14.5 12.1 *** 0.003 20.1 20.0 0.2 0.943 0.012 **Services 12.9 23.0 -10.1 ** 0.010 25.3 26.0 -0.7 0.806 0.054 *
Number of months onwelfare, Months 25 to 29 0.1 0.2 -0.1 0.229 0.9 0.7 0.2 * 0.086 0.036 **
Number of months on food stamps, Months 25 to 29 0.2 0.2 0.1 0.510 1.3 1.2 0.2 0.186 0.463
Family income ($) 18,005 17,086 918 0.444 15,022 14,626 396 0.592 0.710
Sample size(continued)
Table 3.7
Evaluation of the CET Replication Sites
Impacts, by Site Fidelity
393 913
High-Fidelity Sites Medium/Low-Fidelity Sites
-83-

Table 3.7 (continued)
SOURCES: MDRC calculations from CET enrollment form and 30-month follow-up survey data.
NOTES: Calculations used data for all sample members for whom there were follow-up survey data, including those with values of zero for outcomes and those who were assigned to CET but did not participate. Estimates were regression-adjusted using ordinary least squares, controlling for pre-random assignment characteristics of sample members. Rounding may cause slight discrepancies in the calculations of sums and differences. For some outcomes, the sample size may be smaller than the full sample size due to some missing observations. A two-tailed t-test was applied to differences between the program and control groups. Statistical significance levels are indicated as ***= 1 percent; **=5 percent; *=10 percent. aIn order to have consistent categories, Months 25 to 29 have been converted to the equivalent of a six-month period.
-84-

-85-
clerical occupations. Thus, CET did seem to train participants for jobs that they otherwise would not have taken.
Despite the shift in types of jobs, however, even the high-fidelity sites failed to increase employment and earnings. And, for whatever reason, the sites that were less successful in im-plementing the CET model actually discouraged some youth from taking jobs. (As the next ta-ble shows, this effect was especially pronounced for the less educated group.) Although few of these impacts were statistically significant, the pattern of effects as analyzed by site fidelity rat-ing is notably different. The following analysis presents subgroup impacts for all sites combined and for the high-fidelity and the medium/low-fidelity sites separately.
Table 3.8 presents results separately for women and men. The pattern of effects across all sites combined is generally similar for the two groups, with the exception of a fairly large decrease in males’ earnings in the third year. The program also seems to have increased family income for young men, despite the fall in their earnings. Dividing the sample into high-fidelity versus medium/low-fidelity sites tells a different story. In the high-fidelity sites, the overall find-ing of no positive effects masks fairly substantial positive effects for women, which were offset by similar negative effects for men. For example, CET increased the percentage of women who were working at the time of the survey, by 13.8 percentage points, or from 47.2 percent to 61 percent. Women’s average earnings during the last period were also higher, by $618 — al-though this was statistically insignificant, given the small sample size. For men, in contrast, the program group in the high-fidelity sites was less likely to have worked during the follow-up period and had lower earnings during the last period. The next section looks in more detail at the different effects for women and men in the high-fidelity sites.
Table 3.9 presents impacts according to education level. Although few of these differ-ences were statistically significant, the data show that the program’s negative effects on em-ployment were concentrated on the less educated subgroup. For those without a high school diploma, for example, the program group had lower average earnings than the control group during the last 12 months of the follow-up period. They also had higher rates of welfare and food stamp receipt. In contrast, the rightmost columns of the table show mostly small, but posi-tive, impacts on employment and earnings for the more educated subgroup. Dividing the sample into high-fidelity versus medium/low-fidelity sites (the last two panels of the table) shows that the negative effects for the less educated subgroup were entirely due to the large negative ef-fects in the medium/low-fidelity sites. In these sites, 40.0 percent of the program group worked at the time of the survey, compared with 53.2 percent of the control group — a 13.2 percentage point decrease. In contrast, the high-fidelity sites increased employment for the less educated subgroup, although the impact was not statistically significant and had little effect for the more educated group.

P-Value for Program Control P-Value for Program Control P-Value for Subgroup
Outcome Group Group Difference Difference Group Group Difference Difference Difference
Full Sample
Ever worked during follow-up (%) 85.0 87.4 -2.3 0.357 90.0 92.2 -2.2 0.393 0.961
Working at survey (%) 52.7 54.6 -1.9 0.600 58.5 62.2 -3.6 0.401 0.756
Number of months workedMonths 1 to 6 1.1 1.3 -0.2 0.131 1.5 1.8 -0.4 * 0.090 0.646Months 7 to 12 2.0 2.1 0.0 0.887 2.5 2.3 0.2 0.517 0.549Months 13 to 18 2.7 2.6 0.1 0.533 3.1 2.9 0.1 0.610 0.991Months 19 to 24 3.1 3.1 0.0 0.833 3.3 3.4 -0.1 0.672 0.840Months 25 to 29a 3.6 3.5 0.1 0.737 3.7 4.0 -0.3 0.262 0.286
Total earnings ($)Months 1 to 6 923 1,061 -138 0.406 1,476 1,902 -426 0.127 0.375Months 7 to 12 2,020 1,872 148 0.521 2,929 2,924 5 0.990 0.747Months 13 to 18 2,818 2,718 100 0.722 3,821 3,834 -13 0.975 0.825Months 19 to 24 3,307 3,374 -67 0.819 4,072 4,469 -397 0.373 0.535Months 25 to 29a 3,797 3,717 80 0.784 4,536 5,154 -618 0.156 0.183
Total earnings over follow-up ($) 11,998 11,886 112 0.909 15,981 17,302 -1,321 0.399 0.438
Family income ($) 14,891 14,863 29 0.971 17,843 16,002 1,842 * 0.090 0.174
High-Fidelity Sites
Ever worked during follow-up (%) 91.8 82.5 9.3 * 0.066 92.7 99.6 -6.8 ** 0.013 0.005 ***
Working at survey (%) 61.0 47.2 13.8 * 0.060 69.4 67.5 1.8 0.781 0.225
Earnings in Months 25 to 29a ($) 4,228 3,610 618.2 0.289 4,954 6,391 -1437.0 ** 0.045 0.025 **
(continued)
Table 3.8
Evaluation of the CET Replication Sites
Impacts, by Gender
Women Men
-86-

P-Value for Program Control P-Value for Program Control P-Value for Subgroup
Outcome Group Group Difference Difference Group Group Difference Difference Difference
Medium/Low-Fidelity Sites
Ever worked during follow-up (%) 82.5 89.4 -6.9 ** 0.020 87.8 87.8 0.0 0.994 0.151
Working at survey (%) 50.1 56.9 -6.8 0.105 51.1 59.1 -8.0 0.162 0.863
Earnings in Months 25 to 29a ($) 3,677 3,731 -53.6 0.877 4,162 4,475 -313.2 0.582 0.696
Sample size 753 517
Table 3.8 (continued)
Women Men
SOURCES: MDRC calculations from CET enrollment form and 30-month follow-up survey data.
NOTES: Calculations used data for all sample members for whom there were follow-up survey data, including those with values of zero for outcomes and those who were assigned to CET but did not participate. Estimates were regression-adjusted using ordinary least squares, controlling for pre-random assignment characteristics of sample members. Rounding may cause slight discrepancies in the calculations of sums and differences. For some outcomes, the sample size may be smaller than the full sample size due to some missing observations. A two-tailed t-test was applied to differences between the program and control groups. Statistical significance levels are indicated as ***= 1 percent; **=5 percent; *=10 percent. aIn order to have consistent categories, Months 25 to 29 have been converted to the equivalent of a six-month period.
-87-
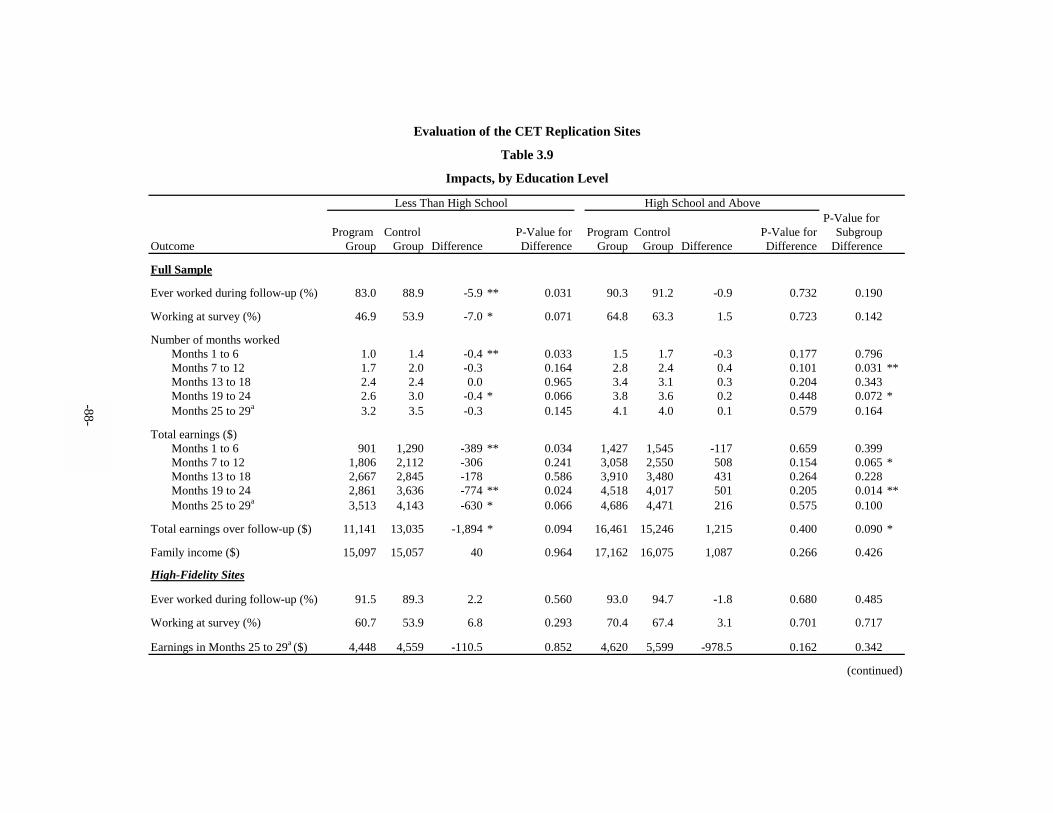
P-Value for Program Control P-Value for Program Control P-Value for Subgroup
Outcome Group Group Difference Difference Group Group Difference Difference Difference
Full Sample
Ever worked during follow-up (%) 83.0 88.9 -5.9 ** 0.031 90.3 91.2 -0.9 0.732 0.190
Working at survey (%) 46.9 53.9 -7.0 * 0.071 64.8 63.3 1.5 0.723 0.142
Number of months workedMonths 1 to 6 1.0 1.4 -0.4 ** 0.033 1.5 1.7 -0.3 0.177 0.796Months 7 to 12 1.7 2.0 -0.3 0.164 2.8 2.4 0.4 0.101 0.031 **Months 13 to 18 2.4 2.4 0.0 0.965 3.4 3.1 0.3 0.204 0.343Months 19 to 24 2.6 3.0 -0.4 * 0.066 3.8 3.6 0.2 0.448 0.072 *Months 25 to 29a 3.2 3.5 -0.3 0.145 4.1 4.0 0.1 0.579 0.164
Total earnings ($)Months 1 to 6 901 1,290 -389 ** 0.034 1,427 1,545 -117 0.659 0.399Months 7 to 12 1,806 2,112 -306 0.241 3,058 2,550 508 0.154 0.065 *Months 13 to 18 2,667 2,845 -178 0.586 3,910 3,480 431 0.264 0.228Months 19 to 24 2,861 3,636 -774 ** 0.024 4,518 4,017 501 0.205 0.014 **Months 25 to 29a 3,513 4,143 -630 * 0.066 4,686 4,471 216 0.575 0.100
Total earnings over follow-up ($) 11,141 13,035 -1,894 * 0.094 16,461 15,246 1,215 0.400 0.090 *
Family income ($) 15,097 15,057 40 0.964 17,162 16,075 1,087 0.266 0.426
High-Fidelity Sites
Ever worked during follow-up (%) 91.5 89.3 2.2 0.560 93.0 94.7 -1.8 0.680 0.485
Working at survey (%) 60.7 53.9 6.8 0.293 70.4 67.4 3.1 0.701 0.717
Earnings in Months 25 to 29a ($) 4,448 4,559 -110.5 0.852 4,620 5,599 -978.5 0.162 0.342
(continued)
Table 3.9
Evaluation of the CET Replication Sites
Impacts, by Education Level
Less Than High School High School and Above
-88-

P-Value for Program Control P-Value for Program Control P-Value for Subgroup
Outcome Group Group Difference Difference Group Group Difference Difference Difference
Medium/Low-Fidelity Sites
Ever worked during follow-up (%) 78.5 88.6 -10.1 *** 0.005 89.0 90.0 -1.0 0.769 0.062 *
Working at survey (%) 40.0 53.2 -13.2 *** 0.006 61.8 62.3 -0.4 0.937 0.071 *
Earnings in months 25 to 29a ($) 3,095 3,845 -750.2 * 0.084 4,630 4,108 522.6 0.252 0.043 **
Sample size 663 499
Table 3.9 (continued)
Less Than High School High School and Above
SOURCES: MDRC calculations from CET enrollment form and 30-month follow-up survey data.
NOTES: Calculations used data for all sample members for whom there were follow-up survey data, including those with values of zero for outcomes and those who were assigned to CET but did not participate. Estimates were regression-adjusted using ordinary least squares, controlling for pre-random assignment characteristics of sample members. Rounding may cause slight discrepancies in the calculations of sums and differences. For some outcomes, the sample size may be smaller than the full sample size due to some missing observations. A two-tailed t-test was applied to differences between the program and control groups. Statistical significance levels are indicated as ***= 1 percent; **=5 percent; *=10 percent. aIn order to have consistent categories, Months 25 to 29 have been converted to the equivalent of a six-month period.
-89-

-90-
Table 3.10 presents impacts as grouped by age. Although these differences are less pro-nounced than the impacts grouped by gender and by education level, they do show a pattern: re-duced earnings for the younger sample and increased earnings for the older sample. These differ-ences, however, were not statistically significant. The program also led to an increase in family income for the older group, even though earnings and benefit receipt were similar for the program and control groups. (Although this effect may have arisen because of a change in living arrange-ments and family size, Chapter 4 shows that there were no significant changes of this type for the older sample.) The impacts separated by site show that the negative employment and earnings effects for the younger group were concentrated entirely in the medium/low-fidelity sites.
Explaining the Gender Effects in the High-Fidelity Sites
CET in the high-fidelity sites led to an increase in employment and earnings for females but had the opposite effect for males (Table 3.8). Why did the two groups have such different experiences under CET? The top panel of Table 3.11 presents data on participation in training in the high-fidelity sites and shows that the two genders participated in different activities. The majority of young women participated in accounting and office training. In contrast, most young men received training in nonclerical jobs, such as building and maintenance and metal trade. As shown in Chapter 2, an additional gender difference was that the women trained for more hours, on average, than the men. Program impacts on hours of training and on the receipt of training credentials were also larger for women.
The panel “Industry and Occupation” of Table 3.8 shows the implications of these differ-ences in training for the types of jobs that participants held. For women, the impacts on “industry of most recent job” show that the program increased employment in the “other industry” category, primarily transportation. This increase came from women who would not have worked without the program and from women who would have worked in different industries, particularly retail trade. Consistent with these industry changes and the training data, the program increased em-ployment in clerical occupations. The wages and hours data show that most of these new jobs were full-time jobs that paid above the minimum wage. In fact, the average wages among workers in the program group were $0.30 higher than the average wages for workers in the control group. The reduction in the percentage of women earning $5 to $7 per hour shows that CET helped some women get higher-paying jobs than they otherwise would have had.
The story was different for males. For them, the program reduced employment in the “other industry” category, largely by reducing employment in transportation and agriculture and increasing employment in construction. Thus, as a result of the program, some men who would have worked in transportation or agriculture did not work at all during the follow-up period (shown by the reduction in the percentage who ever worked), and some men who would have worked in these industries moved into construction. The data on occupation show an increase in

P-Value for Program Control P-Value for Program Control P-Value for Subgroup
Outcome Group Group Difference Difference Group Group Difference Difference Difference
Full Sample
Ever worked during follow-up (%) 88.7 88.8 -0.2 0.954 85.8 90.1 -4.3 * 0.059 0.289
Working at survey (%) 53.9 54.5 -0.6 0.901 56.5 58.7 -2.2 0.515 0.794
Number of months workedMonths 1 to 6 1.0 1.3 -0.3 0.156 1.3 1.6 -0.3 * 0.083 0.923Months 7 to 12 1.8 2.1 -0.3 0.212 2.4 2.2 0.2 0.350 0.119Months 13 to 18 2.5 2.7 -0.2 0.455 2.9 2.7 0.3 0.161 0.155Months 19 to 24 2.8 3.2 -0.4 0.108 3.3 3.2 0.1 0.697 0.122Months 25 to 29a 3.5 3.6 -0.1 0.726 3.7 3.7 0.0 0.920 0.729
Total earnings ($)Months 1 to 6 786 1,114 -328 0.133 1,291 1,542 -252 0.208 0.797Months 7 to 12 1,790 2,146 -355 0.280 2,568 2,399 169 0.527 0.215Months 13 to 18 2,748 3,137 -389 0.349 3,325 3,185 140 0.645 0.304Months 19 to 24 3,181 4,037 -856 * 0.057 3,737 3,695 42 0.893 0.101Months 25 to 29a 3,781 4,221 -440 0.316 4,249 4,310 -61 0.845 0.481
Total earnings over follow-up ($) 11,434 13,866 -2,433 * 0.093 14,317 14,172 144 0.897 0.157
Family income ($) 15,510 16,330 -820 0.487 16,328 14,966 1,362 * 0.079 0.122
High-Fidelity Sites
Ever worked during follow-up (%) 93.7 93.4 0.2 0.955 91.5 90.0 1.5 0.687 0.826
Working at survey (%) 63.3 53.1 10.3 0.224 66 61 5 0.404 0.626
Earnings in Months 25 to 29a ($) 4,386 4,456 -69.8 0.920 4,620 5,420 -800 0.192 0.429
(continued)
Table 3.10
Evaluation of the CET Replication Sites
Impacts, by Age at Random Assignment
Age 19 and Younger Older Than 19
-91-
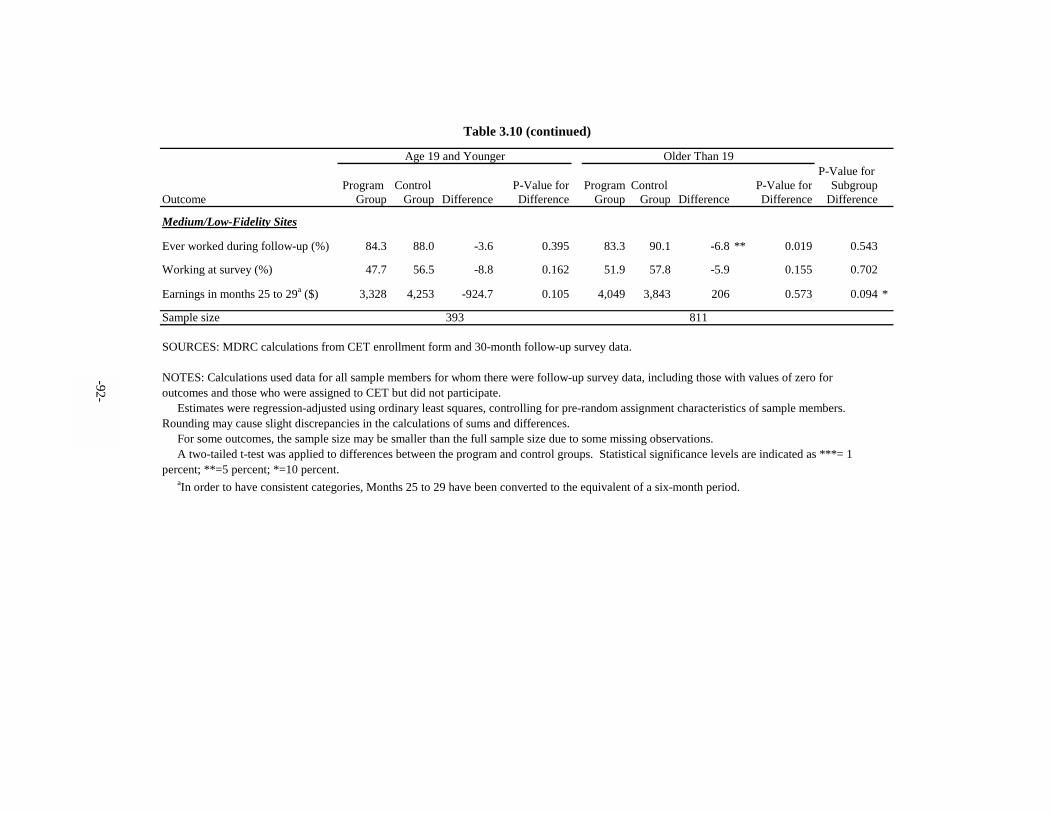
P-Value for Program Control P-Value for Program Control P-Value for Subgroup
Outcome Group Group Difference Difference Group Group Difference Difference Difference
Medium/Low-Fidelity Sites
Ever worked during follow-up (%) 84.3 88.0 -3.6 0.395 83.3 90.1 -6.8 ** 0.019 0.543
Working at survey (%) 47.7 56.5 -8.8 0.162 51.9 57.8 -5.9 0.155 0.702
Earnings in months 25 to 29a ($) 3,328 4,253 -924.7 0.105 4,049 3,843 206 0.573 0.094 *
Sample size 811393
Table 3.10 (continued)
Age 19 and Younger Older Than 19
SOURCES: MDRC calculations from CET enrollment form and 30-month follow-up survey data.
NOTES: Calculations used data for all sample members for whom there were follow-up survey data, including those with values of zero for outcomes and those who were assigned to CET but did not participate. Estimates were regression-adjusted using ordinary least squares, controlling for pre-random assignment characteristics of sample members. Rounding may cause slight discrepancies in the calculations of sums and differences. For some outcomes, the sample size may be smaller than the full sample size due to some missing observations. A two-tailed t-test was applied to differences between the program and control groups. Statistical significance levels are indicated as ***= 1 percent; **=5 percent; *=10 percent. aIn order to have consistent categories, Months 25 to 29 have been converted to the equivalent of a six-month period.
-92-

P-Value for Program Control P-Value for Program Control P-Value for Subgroup
Outcome Group Group Difference Difference Group Group Difference Difference Difference
Participation in CET Training (%)
Accounting 15.8 N.A. 3.8 N.A.Office skills 60.5 7.7Medical insurance billing 6.6 0.0Medical clerical 7.9 2.6Medical clinical 0.0 0.0Retail 2.6 1.3Electronic mechanic 1.3 3.8Metal trade 0.0 39.7Building and maintenance 1.3 26.9Shipping and receiving 3.9 14.1
Program Impacts
Ever worked during follow-up (%) 91.8 82.5 9.3 * 0.066 92.7 99.6 -6.8 ** 0.013 0.005 ***
Total earnings during follow-up ($) 14,094 12,325 1,769 0.365 16,886 19,613 -2,727 0.279 0.157
Industry and Occupation (%)
Industry of most recent jobConstruction/manufacturing 10.1 10.0 0.2 0.966 36.5 28.1 8.4 0.209 0.305Retail trade 28.1 34.5 -6.4 0.367 19.8 19.4 0.4 0.951 0.458Eating/drinking establishments 10.4 10.8 -0.5 0.923 4.5 7.4 -2.9 0.380 0.671Professional services 16.0 23.3 -7.2 0.229 7.8 5.9 1.9 0.588 0.189Health services 12.3 11.0 1.3 0.792 4.8 3.0 1.7 0.532 0.937Other services 16.6 10.8 5.8 0.265 13.3 18.2 -4.9 0.341 0.143Other industry 20.9 3.1 17.8 *** 0.000 15.4 27.0 -11.7 ** 0.042 0.000 ***Transportation 9.5 0.0 9.5 * 3.3 7.6 -4.3
(continued)
Evaluation of the CET Replication Sites
Comparison of Effects for Women and for Men in the High-Fidelity Sites
Women Men
Table 3.11
-93-
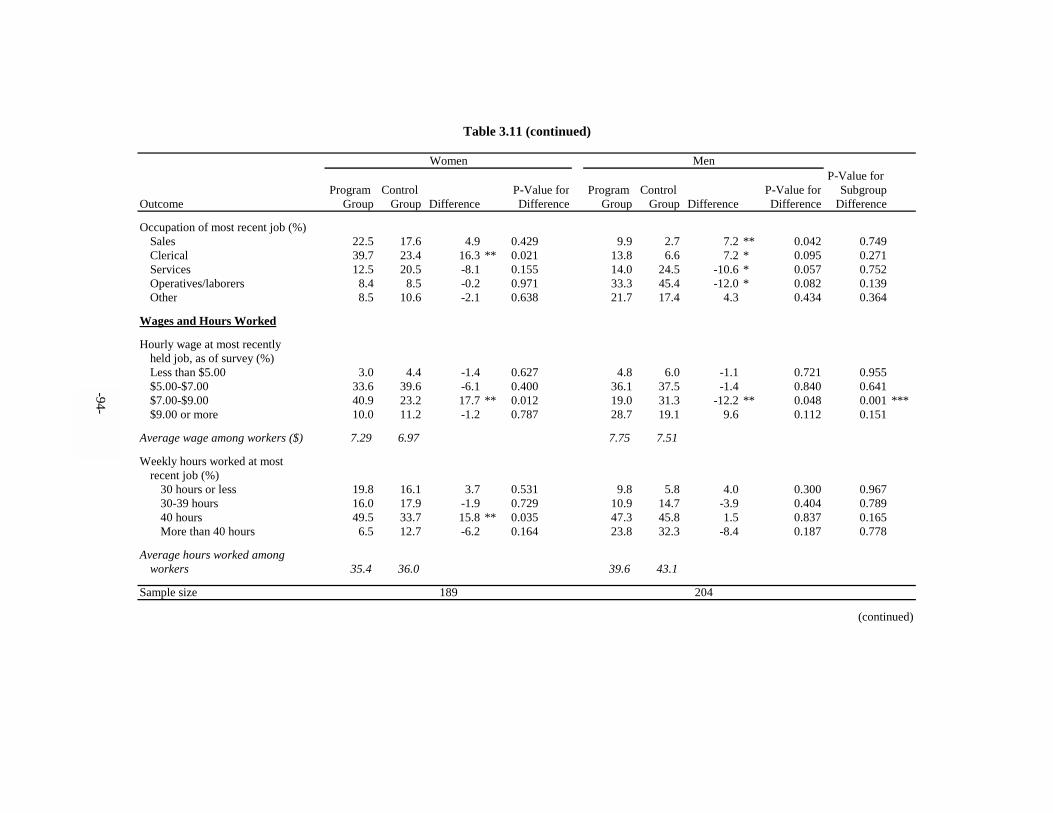
-94-
P-Value for Program Control P-Value for Program Control P-Value for Subgroup
Outcome Group Group Difference Difference Group Group Difference Difference Difference
Occupation of most recent job (%)Sales 22.5 17.6 4.9 0.429 9.9 2.7 7.2 ** 0.042 0.749Clerical 39.7 23.4 16.3 ** 0.021 13.8 6.6 7.2 * 0.095 0.271Services 12.5 20.5 -8.1 0.155 14.0 24.5 -10.6 * 0.057 0.752Operatives/laborers 8.4 8.5 -0.2 0.971 33.3 45.4 -12.0 * 0.082 0.139Other 8.5 10.6 -2.1 0.638 21.7 17.4 4.3 0.434 0.364
Wages and Hours Worked
Hourly wage at most recently held job, as of survey (%)Less than $5.00 3.0 4.4 -1.4 0.627 4.8 6.0 -1.1 0.721 0.955$5.00-$7.00 33.6 39.6 -6.1 0.400 36.1 37.5 -1.4 0.840 0.641$7.00-$9.00 40.9 23.2 17.7 ** 0.012 19.0 31.3 -12.2 ** 0.048 0.001 ***$9.00 or more 10.0 11.2 -1.2 0.787 28.7 19.1 9.6 0.112 0.151
Average wage among workers ($) 7.29 6.97 7.75 7.51
Weekly hours worked at most recent job (%)
30 hours or less 19.8 16.1 3.7 0.531 9.8 5.8 4.0 0.300 0.96730-39 hours 16.0 17.9 -1.9 0.729 10.9 14.7 -3.9 0.404 0.78940 hours 49.5 33.7 15.8 ** 0.035 47.3 45.8 1.5 0.837 0.165More than 40 hours 6.5 12.7 -6.2 0.164 23.8 32.3 -8.4 0.187 0.778
Average hours worked among workers 35.4 36.0 39.6 43.1
Sample size
(continued)
189 204
Table 3.11 (continued)
Women Men

Table 3.11 (continued)
SOURCES: MDRC calculations from CET enrollment form and 30-month follow-up survey data.
NOTES: Calculations used data for all sample members for whom there were follow-up survey data, including those with values of zero for outcomes and those who were assigned to CET but did not participate. Estimates were regression-adjusted using ordinary least squares, controlling for pre-random assignment characteristics of sample members. Rounding may cause slight discrepancies in the calculations of sums and differences. For some outcomes, the sample size may be smaller than the full sample size due to some missing observations. A two-tailed t-test was applied to differences between the program and control groups. Statistical significance levels are indicated as ***= 1 percent; **=5 percent; *=10 percent.
-95-
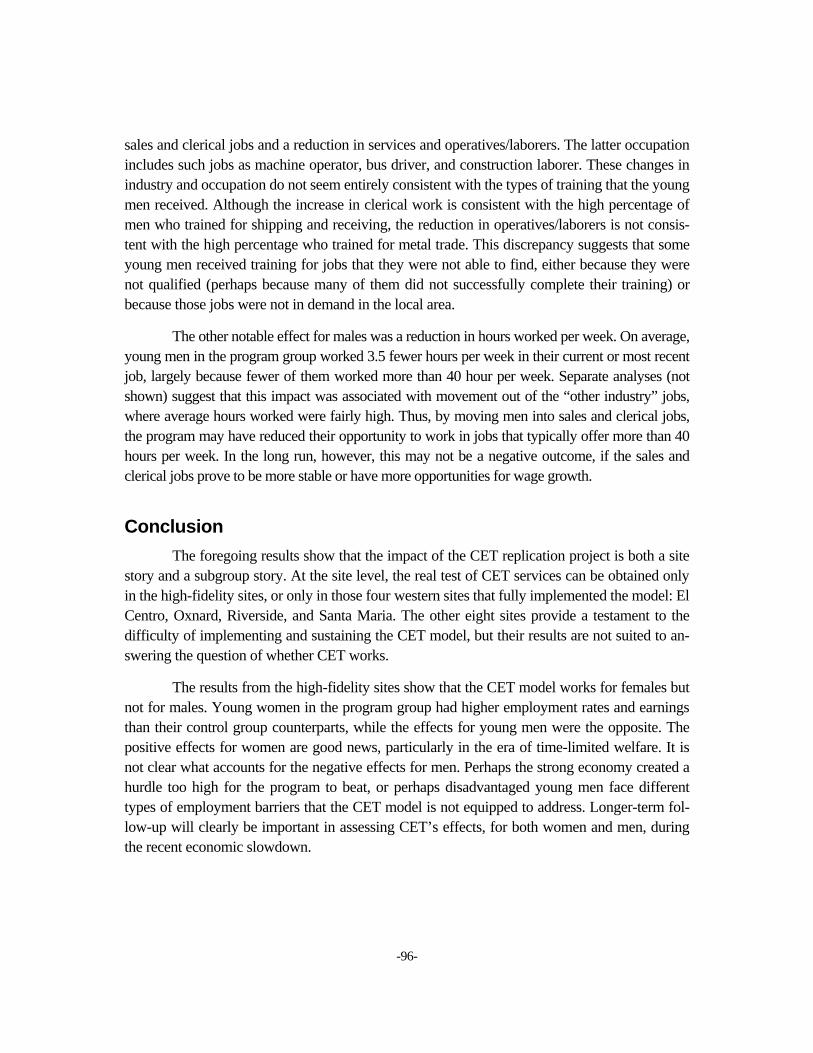
-96-
sales and clerical jobs and a reduction in services and operatives/laborers. The latter occupation includes such jobs as machine operator, bus driver, and construction laborer. These changes in industry and occupation do not seem entirely consistent with the types of training that the young men received. Although the increase in clerical work is consistent with the high percentage of men who trained for shipping and receiving, the reduction in operatives/laborers is not consis-tent with the high percentage who trained for metal trade. This discrepancy suggests that some young men received training for jobs that they were not able to find, either because they were not qualified (perhaps because many of them did not successfully complete their training) or because those jobs were not in demand in the local area.
The other notable effect for males was a reduction in hours worked per week. On average, young men in the program group worked 3.5 fewer hours per week in their current or most recent job, largely because fewer of them worked more than 40 hour per week. Separate analyses (not shown) suggest that this impact was associated with movement out of the “other industry” jobs, where average hours worked were fairly high. Thus, by moving men into sales and clerical jobs, the program may have reduced their opportunity to work in jobs that typically offer more than 40 hours per week. In the long run, however, this may not be a negative outcome, if the sales and clerical jobs prove to be more stable or have more opportunities for wage growth.
Conclusion The foregoing results show that the impact of the CET replication project is both a site
story and a subgroup story. At the site level, the real test of CET services can be obtained only in the high-fidelity sites, or only in those four western sites that fully implemented the model: El Centro, Oxnard, Riverside, and Santa Maria. The other eight sites provide a testament to the difficulty of implementing and sustaining the CET model, but their results are not suited to an-swering the question of whether CET works.
The results from the high-fidelity sites show that the CET model works for females but not for males. Young women in the program group had higher employment rates and earnings than their control group counterparts, while the effects for young men were the opposite. The positive effects for women are good news, particularly in the era of time-limited welfare. It is not clear what accounts for the negative effects for men. Perhaps the strong economy created a hurdle too high for the program to beat, or perhaps disadvantaged young men face different types of employment barriers that the CET model is not equipped to address. Longer-term fol-low-up will clearly be important in assessing CET’s effects, for both women and men, during the recent economic slowdown.

-97-
Chapter 4
The Impacts of the CET Model on Household and Family Structure,
Alcohol and Marijuana Use, and Arrests
The Evaluation of the Center for Employment Training (CET) Replication Sites has been testing whether the training model from the original program in San Jose, California, can produce the same positive results in other places as well. This chapter examines CET’s effects on a range of outcomes related to participants’ household and family structure, alcohol and marijuana use, and arrests. Although the CET training model does not include any unique fea-tures aimed at directly addressing such issues, it is possible that the CET model affected these outcomes through increases in training and employment — even though they were modest and short-lived for the sample as a whole. Also, CET may have influenced participants’ goals, deci-sions, and knowledge of the workplace, thereby producing an impact on a variety of none-conomic outcomes. After a summary of key findings, this chapter discusses CET’s impacts for the full sample and for subgroups.
Summary of Findings • The CET model’s overall effects on household and family structure were
modest. The increases in training and employment that are described in pre-vious chapters did not translate into many significant impacts on participants’ household composition, marital status, or childbearing. Even at high-fidelity sites, the impacts were limited to a few modest effects and seem to have been related to effects on childbearing — particularly for younger women, for whom the program increased childbearing.
• The CET model led to a small increase in alcohol consumption and a small decrease in marijuana use. The program led to a small increase in the number of people who drank any alcohol in the month prior to follow-up; however, most of this increase was in moderate drinking. This increase in drinking may be the result of increased social activities associated with train-ing and jobs. Analyses also revealed a small decline in the use of marijuana, suggesting perhaps that the increased prospect of finding a quality job may have deterred some CET participants from using marijuana.

-98-
• Sites where the CET model was well implemented produced some larger effects for particular subgroups. These effects include some promising findings (such as a decline in arrests for younger men) but also some puz-zling findings (such as an increase in childbearing for younger women).
Impacts on Household and Family Structure, Alcohol and Marijuana Use, and Arrests
Chapter 1 presents some context about the lives of the young adults in this study ap-proximately two and half years after random assignment. At the time, a substantial number of them faced the challenges of young parenthood, of being a single head of household, and of having arrest records. These outcomes indicate some considerable barriers facing the young adults in this study as they work toward acquiring job training and finding and keeping em-ployment. In turn, however, these and other related outcomes may also be influenced by experi-ences in training and employment. Acquiring new skills or finding a new job, for example, may make involvement in illegal activities less attractive, and even the promise of a career may in-fluence young women to delay having children. Moreover, the effects on these personal out-comes may last even after the impacts on training or employment fade. Therefore, the CET model’s success in enhancing the potential of the youth it serves may extend beyond arming them with job skills, even if that is not what the program set out to do. This section examines CET’s impacts on these other outcomes for the full sample.
Impacts on Household and Family Structure
Table 4.1 presents impacts related to sample members’ household structure and housing status. The CET model had little impact on these outcomes. A couple of exceptions include a small decrease in the arrangement of living with a spouse or partner among households with no children and, more notably, a statistically significant increase in living with a spouse or partner among households with children. It may be the case that the prospect of finding a quality job through participation in CET motivated some program group members who had children to commit to their families, or perhaps there was an increase in childbearing that led more partici-pants to move in with partners. Also note that, at the same time, a small but not statistically sig-nificant increase was found in the percentage of participants living with children only, or as sin-gle heads of household.
Table 4.2 explores impacts on family structure and child care. It reveals no significant impacts on marital status, with the exception of a small increase in divorce. It is possible that selection into CET disrupted the lives of participants, which may have led some to make a change in their family life. This finding should not carry much weight, however, because the base is a very small percentage of the sample.

-99-
Table 4.2 also shows that the use of child care and the various types of care utilized were extremely similar between the program and the control groups, indicating no significant impact, except on one category of less utilized options: child care provided by a school, an after-school program, or a Head Start program. The table shows that 10.3 percent of the program group, compared with 7.5 percent of the control group, relied on these options at least some of the time while working at their current or most recent job at follow-up. Further analysis did not reveal an impact on any single option in this category but, rather, on the category as a whole.
Program Control P-Value for Outcome (%) Group Group Difference Difference Impact (%)
Household Structurea
Households without children:Living with parent(s) or other adult relative 28.9 32.9 -4.0 0.104 -12.1Living with spouse or partner 26.9 30.3 -3.4 0.163 -11.1Living alone 9.0 7.1 1.9 0.189 27.6
Households with children:Living with parent(s) or other adult relative 14.8 12.1 2.7 0.155 22.5Living with spouse or partner 14.3 11.2 3.2 * 0.090 28.4Living with children only 12.2 9.9 2.3 0.149 23.2
Household Size
1 to 3 persons 44.0 45.4 -1.4 0.624 -3.04 to 6 persons 45.3 45.1 0.2 0.948 0.47 or more persons 10.7 9.5 1.2 0.483 12.5
Housing Status
Owns home 3.1 4.0 -0.9 0.353 -23.5Rents own home 40.8 43.4 -2.6 0.327 -6.1Pays rent to person in household 24.5 26.2 -1.7 0.479 -6.5Doesn’t pay rent 27.6 23.6 4.0 * 0.096 17.1Lives in nonprivate household 3.4 2.6 0.9 0.343 35.1
Lived in public housing since random assignment 12.8 13.0 -0.2 0.924 -1.3Received housing assistance since random assignment 11.9 9.5 2.3 0.166 24.2
Sample size (total = 1,306) 665 641
Table 4.1
Impacts on Household Structure and Housing Status
Evaluation of the CET Replication Sites
SOURCES: MDRC calculations from CET enrollment form and 30-month follow-up survey data.
NOTES: Estimates were regression-adjusted using ordinary least squares, controlling for pre-random assignment characteristics of sample members. Rounding may cause slight discrepancies in the calculations of sums and differences. For some outcomes, the sample size may be smaller than the full sample size due to some missing observations. A two-tailed t-test was applied to differences between the program and control groups. Statistical significance levels are indicated as ***= 1 percent; **=5 percent; *=10 percent. aCategories may sum to more than 100 percent because they are not mutually exclusive.

-100-
Perhaps the sites where the CET model was replicated also provided information that increased participants’ awareness of these child care options.
Impacts on Alcohol and Marijuana Use and Arrests
Table 4.3 indicates that the CET model had an impact on the young people’s behaviors related to the use of alcohol and marijuana. Although the incidence of both activities was not reported to be high, the analysis shows that program group members were more likely than con-
Program Control P-Value forOutcome (%) Group Group Difference Difference Impact (%)
Family Structure
Marital statusCurrently married and living with spouse 13.6 12.9 0.7 0.699 5.4Separated or living apart from spouse 3.4 3.6 -0.2 0.842 -5.7Divorced 1.4 0.4 0.9 * 0.080 207.5Widowed 0.6 0.2 0.5 0.184 305.1Never married 81.0 82.9 -1.9 0.355 -2.3
Childbearing and childrenHad child since random assignment 31.7 33.1 -1.4 0.584 -4.3Had first child since random assignment 17.5 18.0 -0.5 0.811 -2.8Living with all own children 48.7 46.4 2.3 0.355 4.9Pregnant at follow-up 9.7 7.8 1.9 0.217 24.9
Child Care
Ever used child care for youngest childwhile working at most recent job 45.8 44.3 1.5 0.583 3.4
Care in child’s home 22.6 22.4 0.2 0.938 0.9Care in other home 15.4 15.2 0.3 0.901 1.7Care at daycare center 5.5 6.2 -0.8 0.589 -12.1School, after-school, or Head Start program 10.3 7.5 2.8 * 0.074 37.8
Sample size (total = 1,306) 665 641
Table 4.2
Impacts on Family Structure and Child Care
Evaluation of the CET Replication Sites
SOURCES: MDRC calculations from CET enrollment form and 30-month follow-up survey data.
NOTES: Estimates were regression-adjusted using ordinary least squares, controlling for pre-random assignment characteristics of sample members. Rounding may cause slight discrepancies in the calculations of sums and differences. For some outcomes, the sample size may be smaller than the full sample size due to some missing observations. A two-tailed t-test was applied to differences between the program and control groups. Statistical significance levels are indicated as ***= 1 percent; **=5 percent; *=10 percent.

-101-
trol group members to have had at least one alcoholic drink in the 30 days preceding the follow-up survey: 34.4 percent of the program group reported having had alcohol, compared with 29.6 percent of the control group. Most of this difference seems to have been distributed among those who in the previous month usually had three to five drinks over one to five days. One pos-
Program Control P-Value forOutcome (%) Group Group Difference Difference Impact (%)
Alcohol and Marijuana Use
Reported alcohol consumptionin month before follow-up 34.4 29.6 4.8 * 0.058 16.3
Usually had 1-2 drinks… 1-5 days 11.5 12.2 -0.7 0.695 -5.8
6 days or more 2.1 1.9 0.3 0.740 13.9Usually had 3-5 drinks… 1-5 days 10.3 6.8 3.5 ** 0.027 50.7
6 days or more 3.7 2.3 1.4 0.148 59.0Usually had 6 or more drinks… 1-5 days 3.5 3.3 0.2 0.844 6.0
6-10 days 1.6 1.3 0.3 0.661 22.1
Reported marijuana use in monthbefore follow-up 6.1 9.3 -3.2 ** 0.025 -34.8
1-5 days 2.7 3.9 -1.2 0.240 -30.36 days or more 3.4 5.5 -2.1 * 0.061 -38.3
Reported receiving treatment or counseling for use of alcohol or drugssince random assignment 1.8 2.2 -0.4 0.612 -17.8
Arrests
Arrested since random assignment 12.7 12.5 0.2 0.895 1.8
In jail or prison at follow-up 2.0 1.7 0.2 0.772 12.4
Sample size (total = 1,306) 665 641
Table 4.3
Impacts on Alcohol and Marijuana Use and Arrests
Evaluation of the CET Replication Sites
SOURCES: MDRC calculations from CET enrollment form and 30-month follow-up survey data.
NOTES: Estimates were regression-adjusted using ordinary least squares, controlling for pre-random assignment characteristics of sample members. Rounding may cause slight discrepancies in the calculations of sums and differences. For some outcomes, the sample size may be smaller than the full sample size due to some missing observations. A two-tailed t-test was applied to differences between the program and control groups. Statistical significance levels are indicated as ***= 1 percent; **=5 percent; *=10 percent.

-102-
sible explanation for this finding may be that there was an increase in social activities associated with an increase in job training and labor market participation, which may have continued even when the impacts on training and employment did not.
Conversely, the members of the program group were 3.2 percentage points less likely to have used marijuana in the preceding 30 days, and this difference occurred among those using marijuana for six days or more during that time. The explanation for this finding is also unclear, but perhaps the prospect of finding a quality job deterred some program group members from us-ing marijuana. They may have feared drug testing related to employment or may have wanted to be better prepared for interviews and work. It is also possible that some aspect of the CET model increased the program group’s awareness of marijuana use. Finally, the table shows that the CET model had no significant impact on rates of having an arrest record after random assignment.
Subgroup Impacts This section examines CET’s effects for subgroups defined by site fidelity, age at pro-
gram entry, gender, and education level. The subgroup analyses explore whether the CET model had greater effects on certain segments of the target population. The analyses also explore whether the sites that implemented the model more successfully (and were therefore more successful in producing participation and employment outcomes in the short-run) may have had greater effects on other outcomes. As in previous chapters, all the tables in this section show impacts for each subgroup and whether the differences in impacts among subgroups are statistically significant.
Site Fidelity
Table 4.4 presents impacts for two subgroups defined by site fidelity: those who were randomly assigned to the program group or the control group at the four high-fidelity sites and those who were randomly assigned at the eight medium/low-fidelity sites. Chapters 2 and 3 show that the high-fidelity sites had greater effects on training participation and employment outcomes than the medium/low-fidelity sites did. Therefore, if it is the case that impacts on the non-labor market outcomes that are discussed in this chapter vary by training and employment outcomes, one would expect to see greater effects on these other outcomes in the high-fidelity subgroup.1
Table 4.4 shows that the effects on some outcomes were, indeed, concentrated at high-fidelity sites. However, few of the subgroup impacts are significantly different from one an-other, in part because of the small sample sizes. For example, among sample members in
1Variations in participants’ characteristics across sites could confound some findings analyzed by site.
However, statistical tests revealed that differences in impacts across sites still held when controlling for observ-able characteristics measured at random assignment.
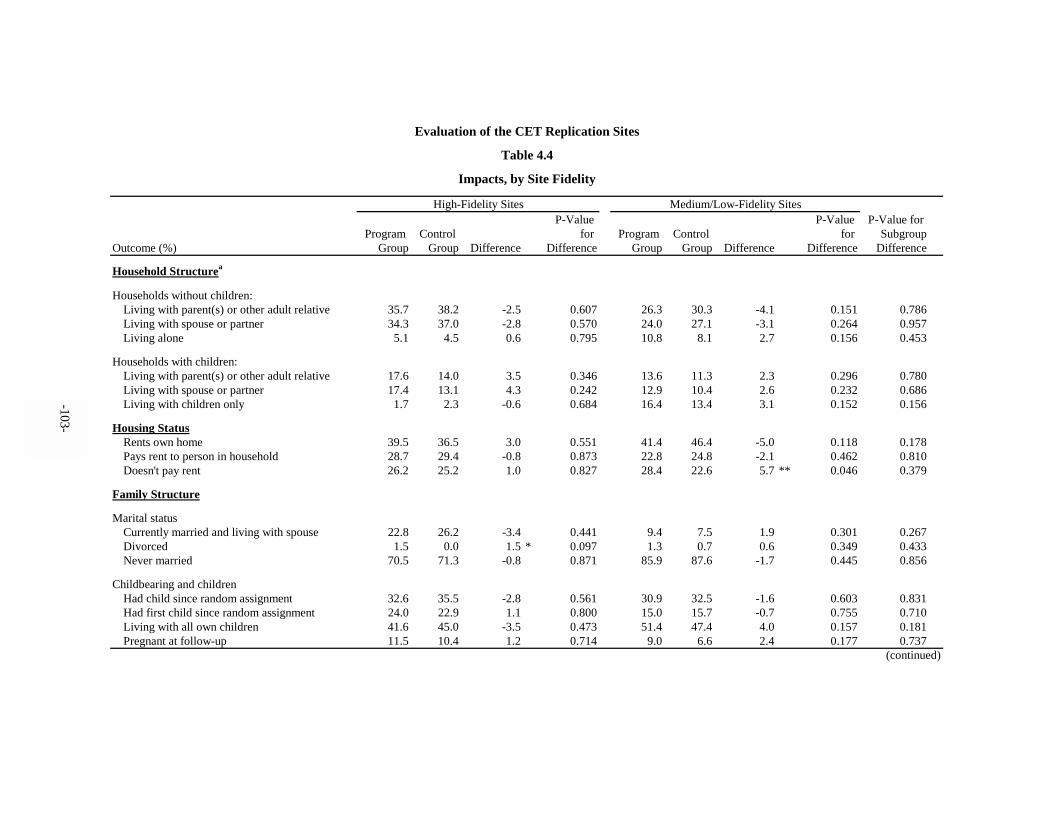
-103-
P-Value P-Value P-Value for Program Control for Program Control for Subgroup
Outcome (%) Group Group Difference Difference Group Group Difference Difference Difference
Household Structurea
Households without children:Living with parent(s) or other adult relative 35.7 38.2 -2.5 0.607 26.3 30.3 -4.1 0.151 0.786Living with spouse or partner 34.3 37.0 -2.8 0.570 24.0 27.1 -3.1 0.264 0.957Living alone 5.1 4.5 0.6 0.795 10.8 8.1 2.7 0.156 0.453
Households with children:Living with parent(s) or other adult relative 17.6 14.0 3.5 0.346 13.6 11.3 2.3 0.296 0.780Living with spouse or partner 17.4 13.1 4.3 0.242 12.9 10.4 2.6 0.232 0.686Living with children only 1.7 2.3 -0.6 0.684 16.4 13.4 3.1 0.152 0.156
Housing StatusRents own home 39.5 36.5 3.0 0.551 41.4 46.4 -5.0 0.118 0.178Pays rent to person in household 28.7 29.4 -0.8 0.873 22.8 24.8 -2.1 0.462 0.810Doesn't pay rent 26.2 25.2 1.0 0.827 28.4 22.6 5.7 ** 0.046 0.379
Family Structure
Marital statusCurrently married and living with spouse 22.8 26.2 -3.4 0.441 9.4 7.5 1.9 0.301 0.267Divorced 1.5 0.0 1.5 * 0.097 1.3 0.7 0.6 0.349 0.433Never married 70.5 71.3 -0.8 0.871 85.9 87.6 -1.7 0.445 0.856
Childbearing and childrenHad child since random assignment 32.6 35.5 -2.8 0.561 30.9 32.5 -1.6 0.603 0.831Had first child since random assignment 24.0 22.9 1.1 0.800 15.0 15.7 -0.7 0.755 0.710Living with all own children 41.6 45.0 -3.5 0.473 51.4 47.4 4.0 0.157 0.181Pregnant at follow-up 11.5 10.4 1.2 0.714 9.0 6.6 2.4 0.177 0.737
(continued)
Table 4.4
Evaluation of the CET Replication Sites
Impacts, by Site Fidelity
High-Fidelity Sites Medium/Low-Fidelity Sites
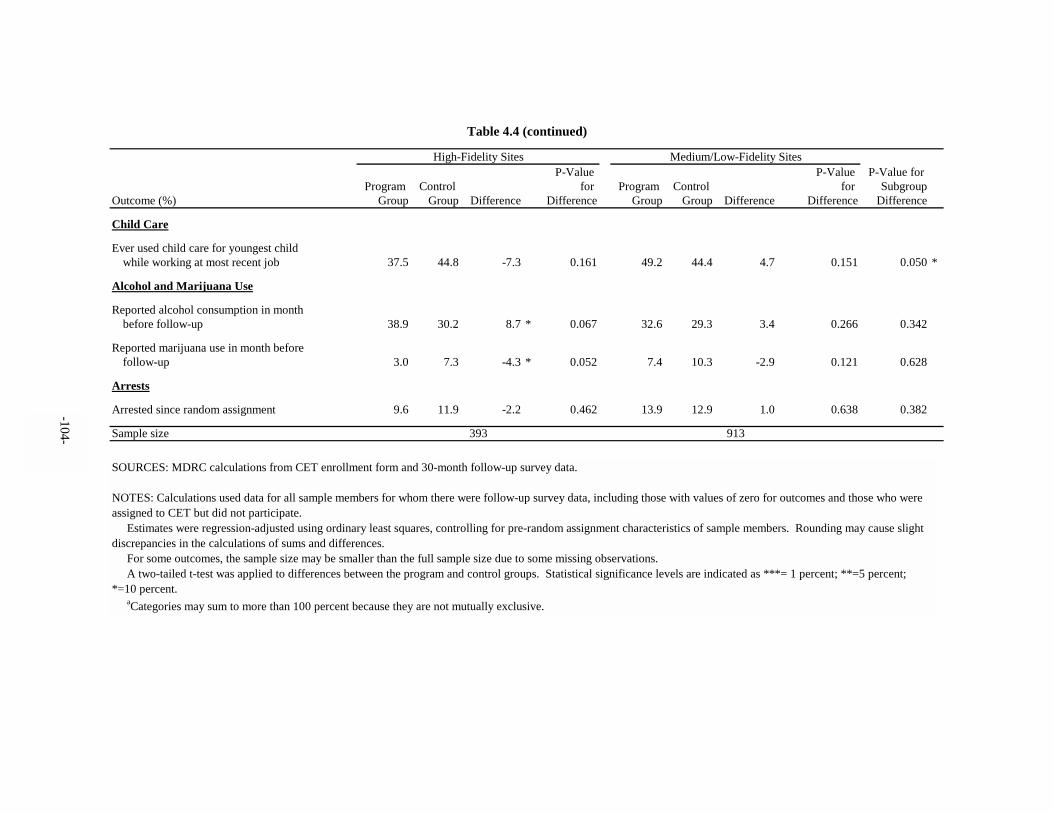
-104-
P-Value P-Value P-Value for Program Control for Program Control for Subgroup
Outcome (%) Group Group Difference Difference Group Group Difference Difference Difference
Child Care
Ever used child care for youngest child while working at most recent job 37.5 44.8 -7.3 0.161 49.2 44.4 4.7 0.151 0.050 *
Alcohol and Marijuana Use
Reported alcohol consumption in month before follow-up 38.9 30.2 8.7 * 0.067 32.6 29.3 3.4 0.266 0.342
Reported marijuana use in month before follow-up 3.0 7.3 -4.3 * 0.052 7.4 10.3 -2.9 0.121 0.628
Arrests
Arrested since random assignment 9.6 11.9 -2.2 0.462 13.9 12.9 1.0 0.638 0.382
Sample size 393 913
Table 4.4 (continued)
High-Fidelity Sites Medium/Low-Fidelity Sites
SOURCES: MDRC calculations from CET enrollment form and 30-month follow-up survey data.
NOTES: Calculations used data for all sample members for whom there were follow-up survey data, including those with values of zero for outcomes and those who were assigned to CET but did not participate. Estimates were regression-adjusted using ordinary least squares, controlling for pre-random assignment characteristics of sample members. Rounding may cause slight discrepancies in the calculations of sums and differences. For some outcomes, the sample size may be smaller than the full sample size due to some missing observations. A two-tailed t-test was applied to differences between the program and control groups. Statistical significance levels are indicated as ***= 1 percent; **=5 percent; *=10 percent. aCategories may sum to more than 100 percent because they are not mutually exclusive.

-105-
households with children, the positive impact on living with a spouse or partner (a significant impact for the full sample) was larger at high-fidelity sites. Table 4.4 also shows that the in-creased incidence of alcohol use in the month before follow-up was driven largely by the effect at high-fidelity sites, where the increase was 8.7 percentage points, compared with a more mod-erate and statistically insignificant increase of 4.7 percentage points at medium/low-fidelity sites. The decline in marijuana use was also somewhat greater at the high-fidelity sites. These observations further suggest that the sample members’ use of alcohol and marijuana may have been influenced by their success in preparing for or entering the workplace.
On the other hand, Table 4.4 also shows that some program effects were more evident at the medium/low-fidelity sites. For example, most of the increase in respondents who were not paying rent at follow-up occurred among those at medium/low-fidelity sites. Also, although not statistically significant, the table shows that the small increase in respondents who were living alone at follow-up resulted from an increase at the lower-fidelity sites — as is the small increase in single-parent households (living with children only). It was also found that the increased use of school and Head Start child care programs was driven by effects at the lower-fidelity sites (not shown). In sum, some of the effects found for the full sample did not depend on high fidel-ity to the CET model, at least as has been defined. However, fewer effects were concentrated in the lower-fidelity sites overall, suggesting that these sites did not affect the lives of their partici-pants as much — either because the lower-fidelity sites were less successful in increasing par-ticipation and employment or because their contact with the youth was less influential.
Age and Gender
For a number of reasons, one might expect impacts on the outcomes analyzed in this chapter to vary by age and gender. First, earlier chapters have shown that males and females had different experiences in training and employment, which may have implications for other out-comes. And because of the different patterns of childbearing, living arrangements, and alcohol and drug use among various demographic subgroups (patterns that are highlighted for the con-trol group in Chapter 1), the effects of the program on these outcomes may also differ. For ex-ample, different age and gender subgroups may have had different expectations, different levels of responsibility, and different levels of support. Because age and gender differences were found to be intertwined — for example, the experiences of females under age 19 were very dif-ferent from those of males under age 19 and from females age 19 and older — age and gender are discussed together in this section. Table 4.5 presents impacts by age group at random as-signment, and Table 4.6 presents impacts by gender.
One of the largest differences between the older and the younger groups was in the im-pacts on household structure (Table 4.5). For the younger group, the CET model increased childbearing, which led to a decrease in the number of people living in households without

P-Value P-Value P-Value for Program Control for Program Control for Subgroup
Outcome (%) Group Group Difference Difference Group Group Difference Difference Difference
Household Structurea
Households without children:Living with parent(s) or other adult
relative 30.8 43.3 -12.5 *** 0.009 30.1 28.9 1.2 0.681 0.015 **Living with spouse or partner 28.6 39.5 -11.0 ** 0.020 28.1 26.8 1.2 0.686 0.029 **Living alone 7.5 8.3 -0.8 0.775 7.8 6.3 1.5 0.391 0.480
Households with children:Living with parent(s) or other adult relative 14.8 9.7 5.1 0.135 14.5 13.3 1.2 0.639 0.347Living with spouse or partner 14.3 9.7 4.6 0.177 13.9 12.1 1.8 0.442 0.509Living with children only 10.1 7.2 2.9 0.287 12.8 11.4 1.5 0.473 0.664
Housing StatusRents own home 38.5 35.8 2.7 0.583 41.8 46.5 -4.8 0.164 0.213Pays rent to person in household 24.9 27.5 -2.6 0.565 24.2 26.0 -1.8 0.564 0.876Doesn't pay rent 29.5 29.0 0.5 0.908 26.9 21.4 5.6 * 0.063 0.365
Family Structure
Marital statusCurrently married and living with spouse 13.7 11.3 2.4 0.458 14.5 14.0 0.5 0.836 0.632Divorced 0.0 0.0 0.0 . 2.0 0.7 1.3 0.114 .Never married 80.3 86.1 -5.8 0.115 80.8 80.9 -0.1 0.960 0.211
Childbearing and childrenHad child since random assignment 35.9 28.0 7.9 * 0.099 30.2 34.8 -4.7 0.160 0.031Had first child since random assignment 24.8 16.6 8.2 * 0.050 14.9 18.1 -3.2 0.220 0.021Living with all own children 46.8 37.5 9.3 ** 0.041 49.2 50.4 -1.2 0.692 0.054Pregnant at follow-up 9.8 8.2 1.6 0.591 10.1 8.3 1.8 0.378 0.954
(continued)
Age 19 and Younger Older Than 19
Table 4.5
Evaluation of the CET Replication Sites
Impacts, by Age at Random Assignment
-106-
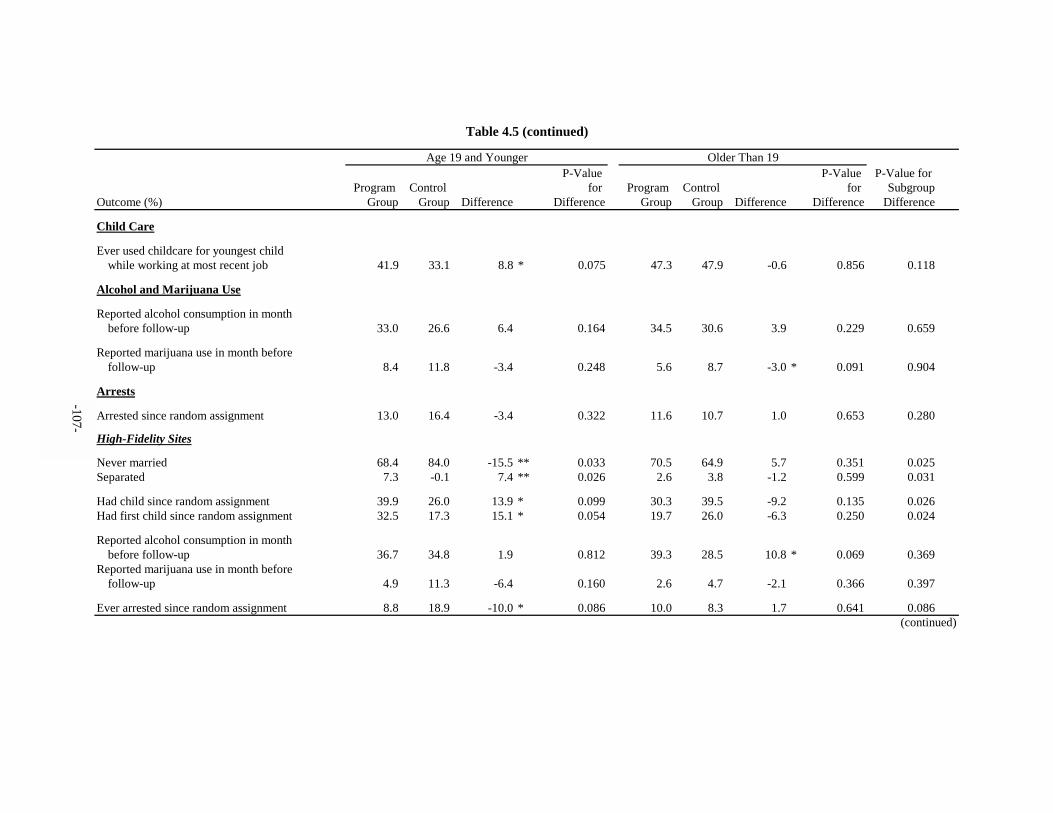
-107-
P-Value P-Value P-Value for Program Control for Program Control for Subgroup
Outcome (%) Group Group Difference Difference Group Group Difference Difference Difference
Child Care
Ever used childcare for youngest child while working at most recent job 41.9 33.1 8.8 * 0.075 47.3 47.9 -0.6 0.856 0.118
Alcohol and Marijuana Use
Reported alcohol consumption in month before follow-up 33.0 26.6 6.4 0.164 34.5 30.6 3.9 0.229 0.659
Reported marijuana use in month before follow-up 8.4 11.8 -3.4 0.248 5.6 8.7 -3.0 * 0.091 0.904
Arrests
Arrested since random assignment 13.0 16.4 -3.4 0.322 11.6 10.7 1.0 0.653 0.280
High-Fidelity Sites
Never married 68.4 84.0 -15.5 ** 0.033 70.5 64.9 5.7 0.351 0.025Separated 7.3 -0.1 7.4 ** 0.026 2.6 3.8 -1.2 0.599 0.031
Had child since random assignment 39.9 26.0 13.9 * 0.099 30.3 39.5 -9.2 0.135 0.026Had first child since random assignment 32.5 17.3 15.1 * 0.054 19.7 26.0 -6.3 0.250 0.024
Reported alcohol consumption in monthbefore follow-up 36.7 34.8 1.9 0.812 39.3 28.5 10.8 * 0.069 0.369
Reported marijuana use in month beforefollow-up 4.9 11.3 -6.4 0.160 2.6 4.7 -2.1 0.366 0.397
Ever arrested since random assignment 8.8 18.9 -10.0 * 0.086 10.0 8.3 1.7 0.641 0.086(continued)
Table 4.5 (continued)
Age 19 and Younger Older Than 19

P-Value P-Value P-Value for Program Control for Program Control for Subgroup
Outcome (%) Group Group Difference Difference Group Group Difference Difference Difference
Medium/Low-Fidelity Sites
Never married 87.0 86.9 0.1 0.988 85.6 87.9 -2.4 0.394 0.623Separated 3.8 3.3 0.6 0.811 2.2 4.7 -2.5 0.106 0.277
Had child since random assignment 33.8 29.1 4.7 0.423 29.4 33.0 -3.5 0.369 0.244Had first child since random assignment 20.9 16.0 4.9 0.329 12.6 14.4 -1.8 0.540 0.248
Reported alcohol consumption in monthbefore follow-up 30.2 22.8 7.4 0.184 32.7 31.2 1.5 0.698 0.387
Reported marijuana use in month beforefollow-up 10.5 12.0 -1.5 0.696 7.1 10.4 -3.3 0.162 0.690
Ever arrested since random assignment 15.0 15.3 -0.4 0.930 12.5 11.6 0.9 0.735 0.802
Sample size 393 811
Table 4.5 (continued)
Age 19 and Younger Older Than 19
SOURCES: MDRC calculations from CET enrollment form and 30-month follow-up survey data.
NOTES: Calculations used data for all sample members for whom there were follow-up survey data, including those with values of zero for outcomes and those who were assigned to CET but did not participate. Estimates were regression-adjusted using ordinary least squares, controlling for pre-random assignment characteristics of sample members. Rounding may cause slight discrepancies in the calculations of sums and differences. For some outcomes, the sample size may be smaller than the full sample size due to some missing observations. A two-tailed t-test was applied to differences between the program and control groups. Statistical significance levels are indicated as ***= 1 percent; **=5 percent; *=10 percent. aCategories may sum to more than 100 percent because they are not mututally exclusive.
-108-

-109-
P-Value P-Value P-Value forProgram Control for Program Control for Subgroup
Outcome (%) Group Group Difference Difference Group Group Difference Difference Difference
Household Structurea
Households without children:Living with parent(s) or other adult relative 18.4 22.2 -3.8 0.193 48.5 49.3 -0.8 0.862 0.586Living with spouse or partner 17.3 20.7 -3.4 0.232 44.7 45.3 -0.6 0.902 0.601Living alone 6.0 4.7 1.3 0.426 12.5 10.5 2.0 0.488 0.842
Households with children:Living with parent(s) or other adult
relative 18.5 17.4 1.1 0.718 8.3 3.7 4.6 0.041 0.334Living with spouse or partner 17.6 16.6 1.0 0.716 8.2 2.8 5.4 0.013 0.224Living with children only 19.6 16.4 3.2 0.229 0.4 0.9 -0.5 0.487 0.179
Housing StatusRents own home 47.4 52.1 -4.7 0.206 29.4 31.5 -2.0 0.631 0.634Pays rent to person in household 19.8 23.0 -3.3 0.291 31.1 30.1 1.1 0.796 0.405Doesn't pay rent 25.5 19.8 5.8 0.065 31.9 29.2 2.7 0.518 0.565
Family Structure
Marital statusCurrently married and living with spouse 15.9 13.8 2.1 0.397 10.6 12.2 -1.6 0.583 0.330Divorced 2.4 0.9 1.5 0.107 0.0 0.0 0.0 0.000 0.000Never married 77.0 80.9 -3.9 0.173 86.5 85.0 1.5 0.633 0.203
Childbearing and childrenHad child since random assignment 36.6 34.9 1.6 0.653 23.6 29.2 -5.6 0.167 0.182Had first child since random assignment 18.3 15.5 2.8 0.315 17.1 20.1 -3.0 0.400 0.200Living with all own children 66.1 64.0 2.1 0.540 19.7 20.2 -0.5 0.894 0.609Pregnant at follow-up 9.3 9.1 0.2 0.926 10.5 7.3 3.2 0.230 0.386
(continued)
Table 4.6
Evaluation of the CET Replication Sites
Impacts, by Gender
Women Men
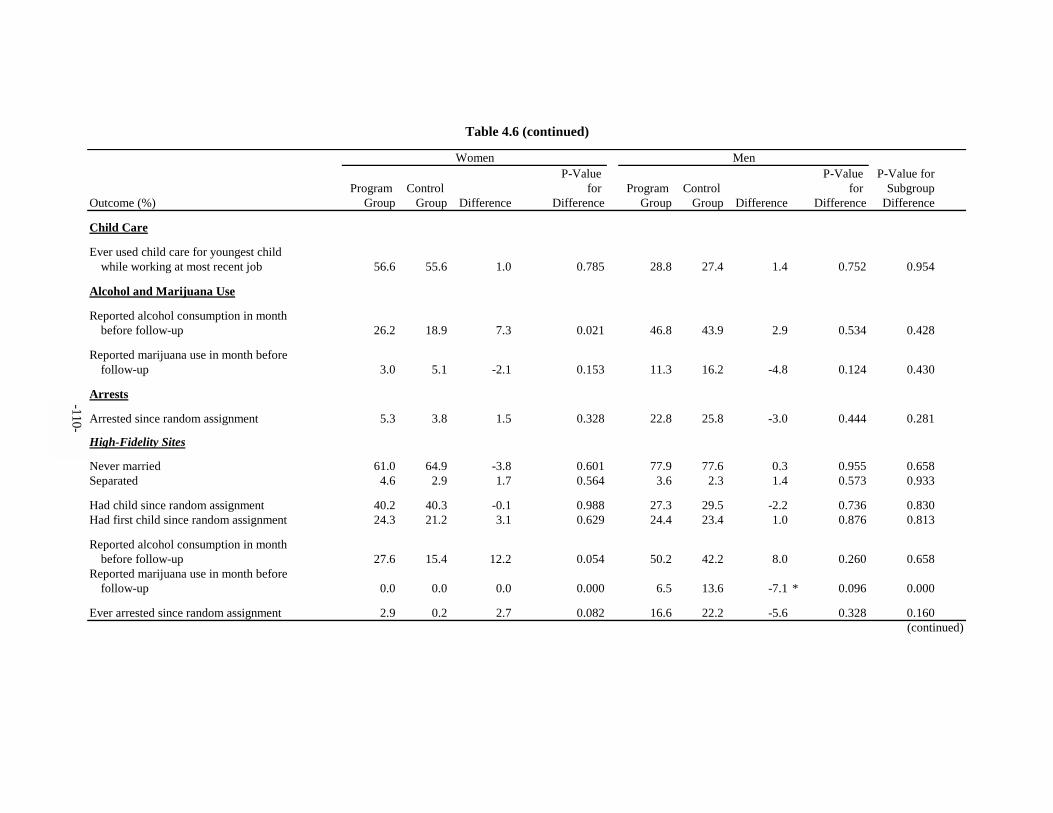
-110-
P-Value P-Value P-Value forProgram Control for Program Control for Subgroup
Outcome (%) Group Group Difference Difference Group Group Difference Difference Difference
Child Care
Ever used child care for youngest child while working at most recent job 56.6 55.6 1.0 0.785 28.8 27.4 1.4 0.752 0.954
Alcohol and Marijuana Use
Reported alcohol consumption in month before follow-up 26.2 18.9 7.3 0.021 46.8 43.9 2.9 0.534 0.428
Reported marijuana use in month before follow-up 3.0 5.1 -2.1 0.153 11.3 16.2 -4.8 0.124 0.430
Arrests
Arrested since random assignment 5.3 3.8 1.5 0.328 22.8 25.8 -3.0 0.444 0.281
High-Fidelity Sites
Never married 61.0 64.9 -3.8 0.601 77.9 77.6 0.3 0.955 0.658Separated 4.6 2.9 1.7 0.564 3.6 2.3 1.4 0.573 0.933
Had child since random assignment 40.2 40.3 -0.1 0.988 27.3 29.5 -2.2 0.736 0.830Had first child since random assignment 24.3 21.2 3.1 0.629 24.4 23.4 1.0 0.876 0.813
Reported alcohol consumption in monthbefore follow-up 27.6 15.4 12.2 0.054 50.2 42.2 8.0 0.260 0.658
Reported marijuana use in month beforefollow-up 0.0 0.0 0.0 0.000 6.5 13.6 -7.1 * 0.096 0.000
Ever arrested since random assignment 2.9 0.2 2.7 0.082 16.6 22.2 -5.6 0.328 0.160(continued)
Table 4.6 (continued)
Women Men

P-Value P-Value P-Value forProgram Control for Program Control for Subgroup
Outcome (%) Group Group Difference Difference Group Group Difference Difference Difference
Medium/Low-Fidelity Sites
Never married 92.3 90.3 2.0 0.567 82.8 86.2 -3.4 0.241 0.230Separated 1.4 2.8 -1.4 0.436 3.8 4.8 -1.1 0.539 0.903
Had child since random assignment 21.2 28.9 -7.7 0.149 34.9 33.6 1.3 0.757 0.183Had first child since random assignment 12.5 17.4 -4.9 0.267 16.1 13.6 2.5 0.414 0.167
Reported alcohol consumption in monthbefore follow-up 44.9 44.6 0.4 0.952 26.3 19.6 6.7 0.069 0.373
Reported marijuana use in month beforefollow-up 14.8 18.0 -3.2 0.482 4.1 6.9 -2.8 0.152 0.943
Ever arrested since random assignment 27.6 27.9 -0.3 0.958 6.0 5.1 1.0 0.622 0.821
Sample size 753 517
Table 4.6 (continued)
Women Men
SOURCES: MDRC calculations from CET enrollment form and 30-month follow-up survey data.
NOTES: Calculations used data for all sample members for whom there were follow-up survey data, including those with values of zero for outcomes and those who were assigned to CET but did not participate. Estimates were regression-adjusted using ordinary least squares, controlling for pre-random assignment characteristics of sample members. Rounding may cause slight discrepancies in the calculations of sums and differences. For some outcomes, the sample size may be smaller than the full sample size due to some missing observations. A two-tailed t-test was applied to differences between the program and control groups. Statistical significance levels are indicated as ***= 1 percent; **=5 percent; *=10 percent. aCategories may sum to more than 100 percent because they are not mutually exclusive.
-111-

-112-
children, as evidenced by the statistically significant decreases shown in the top panel of the table. For the older group, the CET model decreased childbearing, although the impact is not statistically significant and had no effect on household structure.
Further analysis examining gender in addition to age (not shown in tables) reveals that many of these impacts were found to be concentrated among the younger women. Among women who were age 19 or younger at random assignment, CET led to a 17.9 percentage point increase in having a child since random assignment; similarly, it led to an 18.3 percentage point increase in having a first child since random assignment. These findings are statistically signifi-cant at the 10 percent level, as are the subgroup differences. At the same time, for all other age-gender subgroups, there was a smaller, statistically insignificant decrease in childbearing since random assignment. And because the sample size of the younger women is much smaller than that of the older women, these increases in fertility are much offset when looking at impacts for women as a whole.
Why did the CET model increase childbearing for younger women? It is possible that the prospect of getting a job made them feel ready to start a family. Among the younger men, there were very few single heads of household, so it is more fitting to look at possible impacts on whether they were living with partners and spouses and/or with children. However, no such effects were found.
Comparing these subgroup outcomes at high-fidelity sites versus medium/low-fidelity sites strengthens the story. The impact on the younger women’s childbearing — although also found at lower-fidelity sites — was greater at high-fidelity sites. In addition, this analysis based on site fidelity also reveals an interesting finding related to marital status: Among respondents age 19 or younger at random assignment, the CET model led to a statistically significant decline in being single (never married) at follow-up (Table 4.5). As expected, this coincides with sig-nificant increases in households that included children and a spouse or partner (not shown). It appears that CET’s impact on childbearing at high-fidelity sites was linked to an impact on mar-riage and cohabitation. It may be the case, however, that many of these marriages did not last, as indicated by the increase shown in separation from a spouse.
The subgroup analyses by gender and age (Tables 4.5 and 4.6) also reveal only small and insignificant differences in impacts on alcohol and marijuana use. However, further analy-sis, by site fidelity, shows larger impacts among all age and gender subgroups at high-fidelity sites —particularly for the older women, for whom the CET model increased alcohol use by 21 percentage points (not shown in tables). None of the women reported marijuana use. The de-cline in marijuana use among men was also greater at the high-fidelity sites.
Finally, the analyses showed no impact on arrest records for the full sample or for sub-groups overall. However, when looking at age and gender subgroups specifically at high-
-113-
fidelity sites (Tables 4.5 and 4.6), an impact on the younger men was found: a large and statisti-cally significant decline in arrests, of 10 percentage points, for those age 19 or younger at ran-dom assignment. (Because such a small percentage of the younger women reported arrests, these declines can be attributed almost entirely to the younger men.) This impact was not found for the older men, in part because fewer of the control group members in this age group reported arrests. The impact on arrests is an encouraging finding. It is possible that CET impelled the younger men to alter their goals and to focus more on starting a career, thus motivating them to avoid arrests.
Education Level
Chapter 3 reports some differences in employment outcomes for subgroups defined by level of education — mainly, a small decrease in employment for youth who did not have a high school diploma. Therefore, it might be expected that some of the foregoing effects would also differ by education level. However, in terms of other outcomes, there were no statistically significant differences between high school dropouts and high school graduates, although some interesting patterns emerged. For example, Table 4.7 shows that the CET model led to a de-crease in living with family and partners among high school dropouts but that it had the oppo-site effect for high school graduates (although these subgroup differences are not statistically significant). CET also led to a reduction in marijuana use among high school graduates, both overall and especially at the high-fidelity sites. Perhaps the employment impacts were some-what larger for high school graduates, and so they had more reason to change their behavior.
Conclusion Given the limited impacts that the CET model has had on training and employment
outcomes for young people in this study, it is not surprising that the model had limited effects on their personal lives. At high-fidelity sites, where the CET model was well implemented, the programs did appear to have a limited effect on particular subgroups, although not always in terms of reducing employment barriers; for example, it increased childbearing among younger women. But other findings were promising, such as the decline in arrests among younger men. Overall, however, apart from some small effects on family structure and on alcohol and mari-juana use, the increased participation in job training did not translate into significant impacts for these young adults’ activities outside the labor market. The short time that CET spent with most youth — combined with the lack of effects on labor market outcomes — provided little pros-pect for affecting other areas of their lives.

P-Value P-Value P-Value forProgram Control for Program Control for Subgroup
Outcome (%) Group Group Difference Difference Group Group Difference Difference Difference
Household Structurea
Households living children:Living with parent(s) or other adult relative 28.3 35.3 -7.0 0.039 34.2 31.0 3.2 0.440 0.057Living with spouse or partner 26.3 32.1 -5.8 * 0.081 31.8 29.7 2.1 0.612 0.135Living alone 7.7 5.9 1.8 0.357 7.4 7.9 -0.5 0.830 0.457
Households with children:Living with parent(s) or other adult relative 15.5 11.9 3.6 0.176 13.5 12.8 0.7 0.831 0.474Living with spouse or partner 15.2 11.1 4.1 0.118 12.7 12.0 0.7 0.827 0.393Living with children only 12.1 9.9 2.1 0.338 11.8 10.2 1.6 0.548 0.876
Housing StatusOwns home 3.9 2.7 1.2 0.393 2.8 5.4 -2.6 0.153 0.098 *Rents own home 39.3 43.0 -3.7 0.324 40.3 43.9 -3.5 0.429 0.976Pays rent to person in household 25.0 28.0 -3.0 0.383 24.7 23.7 1.0 0.797 0.442Doesn't pay rent 27.9 23.4 4.5 0.179 28.7 24.9 3.8 0.345 0.893
Family Structure
Marital statusCurrently married and living with spouse 14.8 10.8 4.0 0.111 13.2 17.1 -3.9 0.215 0.050 **Divorced 0.8 0.7 0.1 0.831 2.0 0.4 1.6 0.112 0.234Never married 79.9 84.2 -4.3 0.131 81.7 79.2 2.6 0.459 0.125
Childbearing and childrenHad child since random assignment 33.9 32.5 1.5 0.691 29.1 32.6 -3.5 0.406 0.373Had first child since random assignment 20.0 15.7 4.3 0.151 16.0 20.4 -4.3 0.211 0.059 *Living with all own children 47.8 46.0 1.8 0.581 48.7 46.6 2.1 0.614 0.951Pregnant at follow-up 11.2 9.1 2.2 0.361 7.7 7.6 0.1 0.973 0.539
(continued)
Less Than High School High School and Above
Table 4.7
Evaluation of the CET Replication Sites
Impacts, by Education Level
-114-
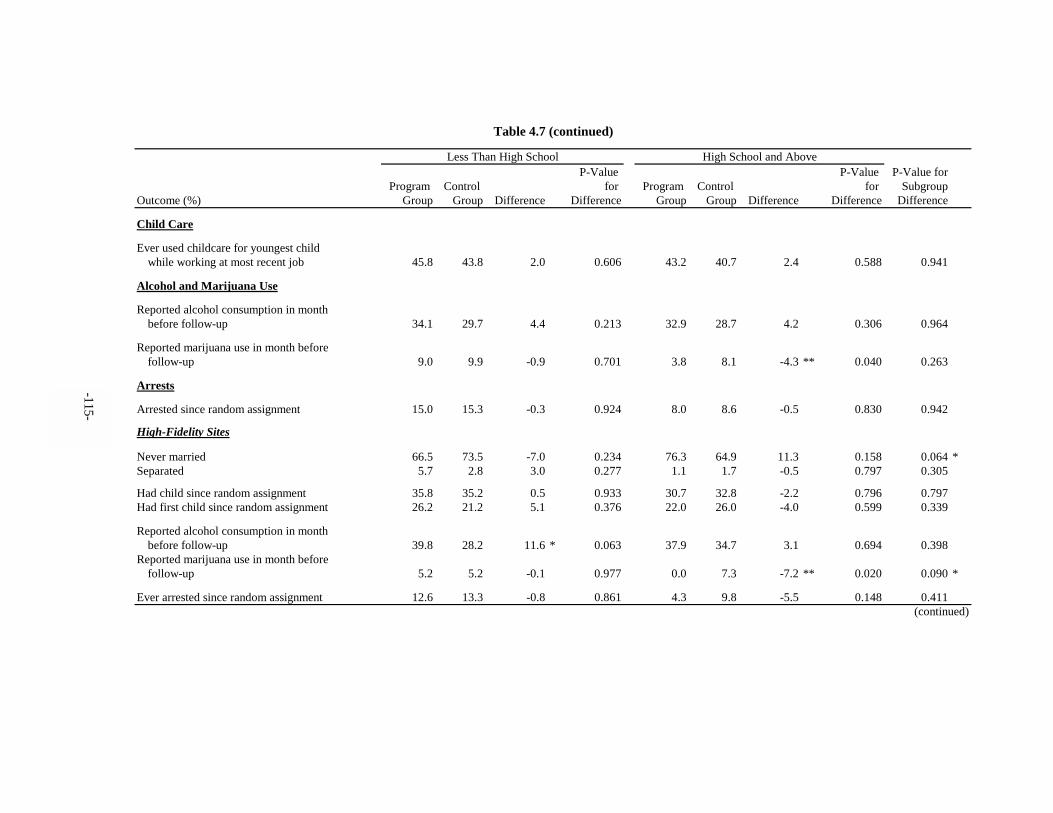
-115-
P-Value P-Value P-Value forProgram Control for Program Control for Subgroup
Outcome (%) Group Group Difference Difference Group Group Difference Difference Difference
Child Care
Ever used childcare for youngest child while working at most recent job 45.8 43.8 2.0 0.606 43.2 40.7 2.4 0.588 0.941
Alcohol and Marijuana Use
Reported alcohol consumption in month before follow-up 34.1 29.7 4.4 0.213 32.9 28.7 4.2 0.306 0.964
Reported marijuana use in month before follow-up 9.0 9.9 -0.9 0.701 3.8 8.1 -4.3 ** 0.040 0.263
Arrests
Arrested since random assignment 15.0 15.3 -0.3 0.924 8.0 8.6 -0.5 0.830 0.942
High-Fidelity Sites
Never married 66.5 73.5 -7.0 0.234 76.3 64.9 11.3 0.158 0.064 *Separated 5.7 2.8 3.0 0.277 1.1 1.7 -0.5 0.797 0.305
Had child since random assignment 35.8 35.2 0.5 0.933 30.7 32.8 -2.2 0.796 0.797Had first child since random assignment 26.2 21.2 5.1 0.376 22.0 26.0 -4.0 0.599 0.339
Reported alcohol consumption in monthbefore follow-up 39.8 28.2 11.6 * 0.063 37.9 34.7 3.1 0.694 0.398
Reported marijuana use in month beforefollow-up 5.2 5.2 -0.1 0.977 0.0 7.3 -7.2 ** 0.020 0.090 *
Ever arrested since random assignment 12.6 13.3 -0.8 0.861 4.3 9.8 -5.5 0.148 0.411(continued)
Table 4.7 (continued)
Less Than High School High School and Above

P-Value P-Value P-Value forProgram Control for Program Control for Subgroup
Outcome (%) Group Group Difference Difference Group Group Difference Difference Difference
Medium/Low-Fidelity Sites
Never married 87.3 89.9 -2.5 0.399 84.1 84.7 -0.6 0.881 0.678Separated 3.3 4.6 -1.3 0.488 2.2 4.1 -1.9 0.313 0.817
Had child since random assignment 32.7 31.0 1.7 0.713 27.6 33.1 -5.5 0.263 0.281Had first child since random assignment 16.6 12.6 4.0 0.243 13.8 17.7 -3.8 0.318 0.127
Reported alcohol consumption in monthbefore follow-up 30.9 30.4 0.5 0.904 31.3 25.7 5.6 0.245 0.435
Reported marijuana use in month beforefollow-up 11.1 12.5 -1.3 0.674 5.3 8.6 -3.3 0.217 0.626
Ever arrested since random assignment 16.2 16.6 -0.4 0.908 9.6 8.1 1.6 0.596 0.662
Sample size 663 499
Table 4.7 (continued)
Less Than High School High School and Above
SOURCES: MDRC calculations from CET enrollment form and 30-month follow-up survey data.
NOTES: Calculations used data for all sample members for whom there were follow-up survey data, including those with values of zero for outcomes and those who were assigned to CET but did not participate. Estimates were regression-adjusted using ordinary least squares, controlling for pre-random assignment characteristics of sample members. Rounding may cause slight discrepancies in the calculations of sums and differences. For some outcomes, the sample size may be smaller than the full sample size due to some missing observations. A two-tailed t-test was applied to differences between the program and control groups. Statistical significance levels are indicated as ***= 1 percent; **=5 percent; *=10 percent. aCategories may sum to more than 100 percent because they are not mutually exclusive.
-116-

Appendix A
Training Participation as Reported in the Follow-Up Survey
and in the Management Information Systems
-118-
This appendix analyzes the discrepancies between training participation as reported by respondents in the 30-month follow-up survey and training participation as recorded by data in the Center for Employment Training Management Information Systems (CET MIS data). The tables in this appendix use merge data from both sources (hereafter called “MIS-survey match sample”). Everyone in the sample was an experimental group member who participated at a CET-operated replication site (Chicago, El Centro, New York, Oxnard, Reno, Riverside, San Francisco, and Santa Maria). Because CET MIS data were available only from CET-operated sites, this sample does not include experimental group members who participated in training at non-CET replication sites (Camden, Newark, Orlando, and Reidsville). Chapter 2 includes a section on service-related impacts that compares the training services received by control group members with the training services received by experimental group members. That section uses data from the 30-month follow-up survey (and not from CET MIS data), making it possible to consistently compare the training services received by the two groups. However, because only survey data were used to measure service-related impacts, it seems important to measure the extent to which program recipients underreported CET training and how they characterized CET training in the survey. Because experimental group members were found to underreport the training that they had received from CET, it is possible that estimated service-related im-pacts were biased downward.
Key Findings In general, because there was substantial underreporting of training by experimental
group members and because training-related survey responses varied across certain subgroups, there does exist the possibility that estimated service-related impacts were biased downward. However, because we do not know the extent to which control group members also underre-ported any training they received, we cannot know to what extent this underreporting biased service-related impacts downward. Other key findings are listed below:
• Figure A.1 illustrates the underreporting problem most clearly; in the early months after random assignment, when CET training actually took place, there was a significant gap between the reporting of training in the survey and CET training from the CET MIS data. In addition, it appears that the re-porting of training participation by month after random assignment was af-fected by telescoping (the tendency to report that an event occurred more re-cently than it actually did).
• Overall, because a significant proportion (34 percent) of the MIS-survey match sample reported that they had not participated in any type of training since random assignment, it seems that a large proportion of the sample could not recall having participated at a CET site.
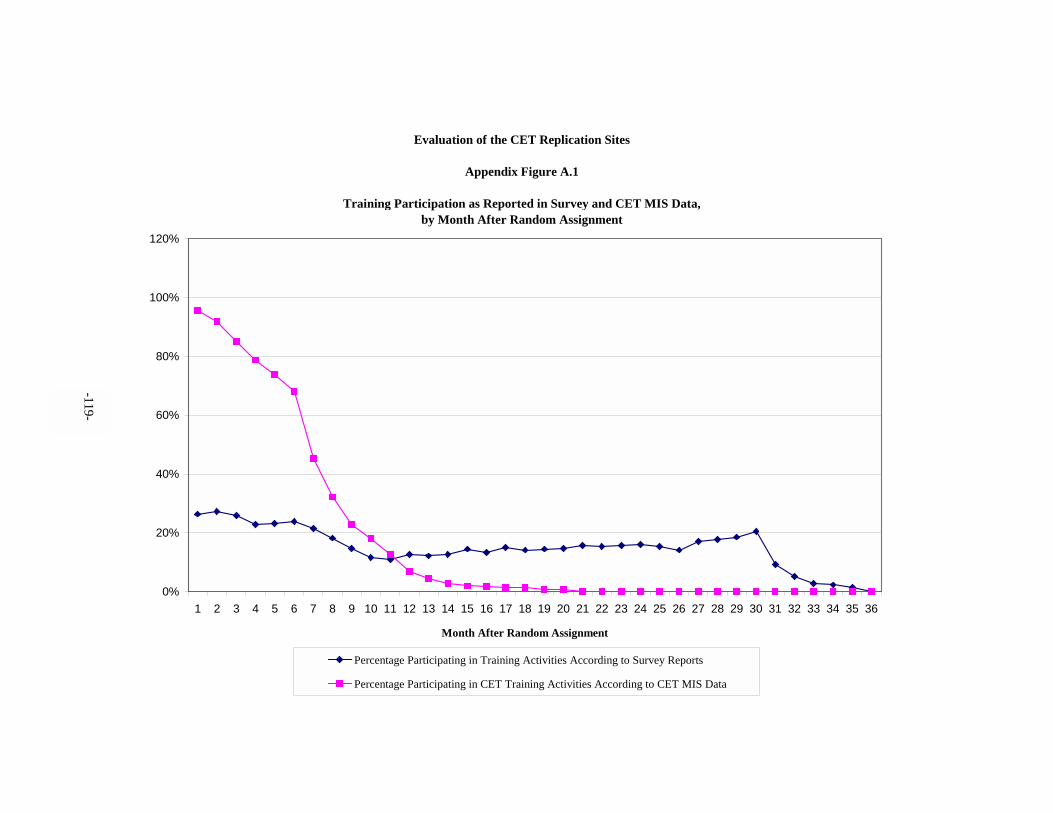
-119-
Evaluation of the CET Replication Sites
Appendix Figure A.1
Training Participation as Reported in Survey and CET MIS Data, by Month After Random Assignment
0%
20%
40%
60%
80%
100%
120%
1 2 3 4 5 6 7 8 9 10 11 12 13 14 15 16 17 18 19 20 21 22 23 24 25 26 27 28 29 30 31 32 33 34 35 36
Month After Random Assignment
Percentage Participating in Training Activities According to Survey Reports
Percentage Participating in CET Training Activities According to CET MIS Data

-120-
• The reporting of training activity in the MIS-survey match sample did not vary significantly by site fidelity rating.
• The percentage of the MIS-survey match sample who reported participating in training activity in the survey did not vary significantly by subgroups de-fined by certain demographic characteristics.
• Slightly more than 50 percent of the participants who reported receiving training since random assignment reported that they had participated in voca-tional training activities; 36 percent of the participants who reported receiv-ing training in the survey reported that they had participated in job club/job search activities.
• The reporting of training activity participation in the survey was somewhat affected by the amount of time that participants spent in training at CET. Those who trained for longer periods were more likely to report that they had participated in training since random assignment than those who trained for shorter periods. However, the reporting of training activity participation in the survey was not significantly affected by the “outcome” of training at CET. That is, participants who withdrew from the CET program without employment were just as likely to report having received training as those who found employment at the end of training.
Data Description and Specific Findings The analysis utilized MIS data from July 1995 through July 2001, data from the base-
line file, and data from the 30-month follow-up survey. There were 410 observations in the MIS data sample and 1,237 observations in the merged survey-baseline data set. A total of 344 par-ticipants matched in both data sets (that is, they received training from a CET-operated site and they responded to the 30-month follow-up survey).
• The reporting of training activities in the survey was low in the first 12 months after random assignment, when most training occurred (Fig-ure A.1).
A comparison of the dates of training as reported in the survey and the training dates as recorded in the CET MIS data shows substantial discrepancies between the two data sources. Fig-ure A.1 displays the percentage of participants in the MIS-survey match sample who reported in the survey that they had participated in training and the percentage of participants in the sample who actually participated in training according to the CET MIS data, by the month after random assignment. The figure shows that, according to the CET MIS data, as one would expect, most

-121-
CET training was completed by the year after random assignment: 96 percent of participants in the sample were engaged in training in the month after random assignment; by Month 12 after random assignment, only 13 percent of the sample were participating in training at CET. By con-trast, the percentage of the sample who reported in the survey that they had participated in training remained steadier throughout the 30 months after random assignment, ranging from 11 percent to 27 percent.1 These discrepancies in dates in the early months after random assignment, along with the fact that the reporting of training picks up slightly in the five months leading up to the survey date, suggest that the training-related data were affected by telescoping. In addition, the overall discrepancy in the early months between reported training and the actual training that took place suggests that the training-related data were also affected by recall bias. Finally, findings discussed below that show that a significant proportion (13 percent) of those who reported training in the survey participated in training that was not even offered by CET indicate that underreporting of CET training was even higher than Figure A.1 indicates.
• Of the MIS-survey match sample, 34 percent reported that they had not participated in any type of training since random assignment (Ta-ble A.1).
1For a large proportion of the sample, Months 31 to 36 after random assignment fell past the survey date.
Evaluation of the CET Replication Sites
Appendix Table A.1
Number and Percentage of MIS-Survey Match Sample Who Reported That They Had Participated in Training Since
Random Assignment
Outcome Number Percentage
Reported that they had received training 227 66.0%
Reported that they had not received any training 117 34.0%
Total 344
SOURCES: BPA calculations from CET MIS data and the 30-month follow-up survey data.
NOTE: There were 344 people in the MIS-survey match sample.

-122-
• Survey-reported training activity in the MIS-survey match sample did not vary significantly by site fidelity rating (Table A.2).
There was not a significant degree of variation in the reporting of training activity by the site fidelity rating of the CET training center at which the participant trained: 37 percent of participants who trained at high-fidelity sites and 32 percent of participants who trained at me-dium-fidelity sites reported never having participated in any training.2
• Survey-reported training activity in the MIS-survey match sample did vary by CET MIS skill codes (Table A.3).
There was a moderate degree of variation in the reporting of training activity by the skills training that participants received at CET. For example, 42 percent of those who engaged in office skills training and 41 percent of those who participated in shipping and receiving train-ing reported that they had not received any training since random assignment, while 18 percent of participants in accounting skills training reported that they received no training since random assignment. The discrepancies in the reporting of training participation by center of training and by MIS skill codes could cause a bias in the estimates of service-related impacts.
• Survey-reported training activity in the MIS-survey match sample was not affected by demographic characteristics (Table A.4).
2As noted in the main report, no CET sites were rated low in fidelity to the CET model.
Evaluation of the CET Replication Sites
Appendix Table A.2
Number and Percentage of MIS-Survey Match Sample Who Reported That They Had Participated in Training Since
Random Assignment, by Site Fidelity Rating
Site Fidelity Rating Number Percentage Number Percentage Total
High 57 37.0% 97 63.0% 154
Medium 60 31.6% 130 68.4% 190
Reported that they had not received training
Reported that they had received training
SOURCES: BPA calculations from CET MIS data and the 30-month follow-up survey data.
NOTE: There were 344 people in the MIS-survey match sample.

-123-
Overall, the reporting of training activity did not vary by subgroups defined by demo-graphic characteristics. For example, 32 percent of female participants in the MIS-survey match sample responded that they had not received training since random assignment, while 37 percent of male participants responded in the survey that they had not received any training since random assignment.3 The percentage of participants who did not report training activity in the survey was also similar across subgroups defined by age and level of education. Therefore, participants who were of a particular gender, age, or education level were no more nor less likely to report training activity than participants who were in other subgroups. This implies that the estimates of service-related impacts will not be biased with respect to gender, age, or education level.
3A difference-in-proportions test was conducted to determine whether the difference in responses between
males and females in the sample was statistically significant. The results show that the difference in responses was not statistically significant at the 1 percent, 5 percent, or 10 percent levels.
CET MIS Skill Code Number Percentage Number Percentage Total
Accounting 3 17.6% 14 82.4% 17
Office skills 37 41.6% 52 58.4% 89
Medical insurance billing 2 18.2% 9 81.8% 11
Medical administrative 27 29.7% 64 70.3% 91
Medical clinical 2 25.0% 6 75.0% 8
Retail 1 33.3% 2 66.7% 3
Electronic mechanic 1 25.0% 3 75.0% 4
Metal trade 10 32.3% 21 67.7% 31
Building maintenance 18 35.3% 33 64.7% 51
Shipping and receiving 16 41.0% 23 59.0% 39
Random Assignment, by CET MIS Skill Code
Evaluation of the CET Replication Sites
Appendix Table A.3
Number and Percentage of MIS-Survey Match Sample Who Reported That They Had Received Training Since
Reported that they had not received training
Reported that they had received training
SOURCES: BPA calculations from CET MIS data and the 30-month follow-up survey data.
NOTES: There were 344 people in the MIS-survey match sample. The skill codes used in this table were collapsed from the original skill codes in the MIS data.

-124-
• There was significant variation in the reporting of training activity in the MIS-survey match sample, by year of random assignment (Table A.5).
There was variation in the reporting of training activity in the MIS-survey match sam-ple as analyzed by the participant’s year of random assignment. For example, 18 percent of the sample who were randomly assigned in 1996 and 28 percent of the sample who were randomly assigned in 1999 reported that they had not participated in any training activity, while 42 per-cent of participants who were randomly assigned in 1997 reported training activity in the sur-vey. However, it is difficult to interpret these results, because there is a strong correlation be-tween the year of random assignment and the centers at which participants trained. For exam-ple, the majority of participants who were randomly assigned before 1998 were assigned to train at CET’s sites in the Mideast and the east (Chicago and New York), while those who were
Subgroup Number Percentage Number Percentage Total
GenderFemale 64 32.2% 135 67.8% 199Male 53 36.6% 92 63.4% 145
Age at Random Assignment16-17 years 5 26.3% 14 73.7% 1918-20 years 80 34.3% 153 65.7% 23321-22 years 32 34.8% 60 65.2% 92
Education LevelHigh school dropout 64 34.0% 124 66.0% 188High school graduate (only) 50 33.8% 98 66.2% 148Post-high school education 3 37.5% 5 62.5% 8
by Subgroups Defined by Demographic Characteristics
Evaluation of the CET Replication Sites
Appendix Table A.4
Number and Percentage of MIS-Survey Match Sample Who Reported That They Had Received Training Since Random Assignment,
Reported that they had not received training
Reported that they had received training
SOURCES: BPA calculations from CET MIS data and the 30-month follow-up survey data.
NOTE: There were 344 people in the MIS-survey match sample.

-125-
randomly assigned in 1999 were all assigned to train at CET’s western sites (El Centro, Ox-nard, Reno, Riverside, San Francisco, and Santa Maria).4
• Vocational training and job club/job search were the activities most widely reported in the survey (Table A.6).
The upper panel of Table A.6 displays the types of training activities reported in the MIS-survey match sample. About half (52 percent) of those in the sample who reported that they had received training reported that they had participated in vocational training; 36 percent reported that they had participated in job club/job search activities; and 30 percent reported that they had participated in GED/basic skills classes. The lower panel of the table shows the per-centages of the sample who participated in training that could have been offered by CET. It was found that 13 percent of those who reported having received training in the survey participated only in training that was not offered at CET (college course credits and high school classes).
4Of participants who were randomly assigned in 1998, 19 percent were assigned to train at eastern sites,
and 81 percent were assigned to train at western sites.
Year of Random Assignment Number Percentage Number Percentage Total
1995 2 40.0% 3 60.0% 51996 6 18.2% 27 81.8% 331997 38 42.2% 52 57.8% 901998 54 34.8% 101 65.2% 1551999 17 27.9% 44 72.1% 61
Total 344
by Year of Random Assignment
Evaluation of the CET Replication Sites
Appendix Table A.5
Number and Percentage of MIS-Survey Match Sample Who Reported That They Had Received Training Since Random Assignment,
Reported that they had not received training
Reported that they had received training
SOURCES: BPA calculations from CET MIS data and the 30-month follow-up survey data.
NOTE: There were 344 people in the MIS-survey match sample.
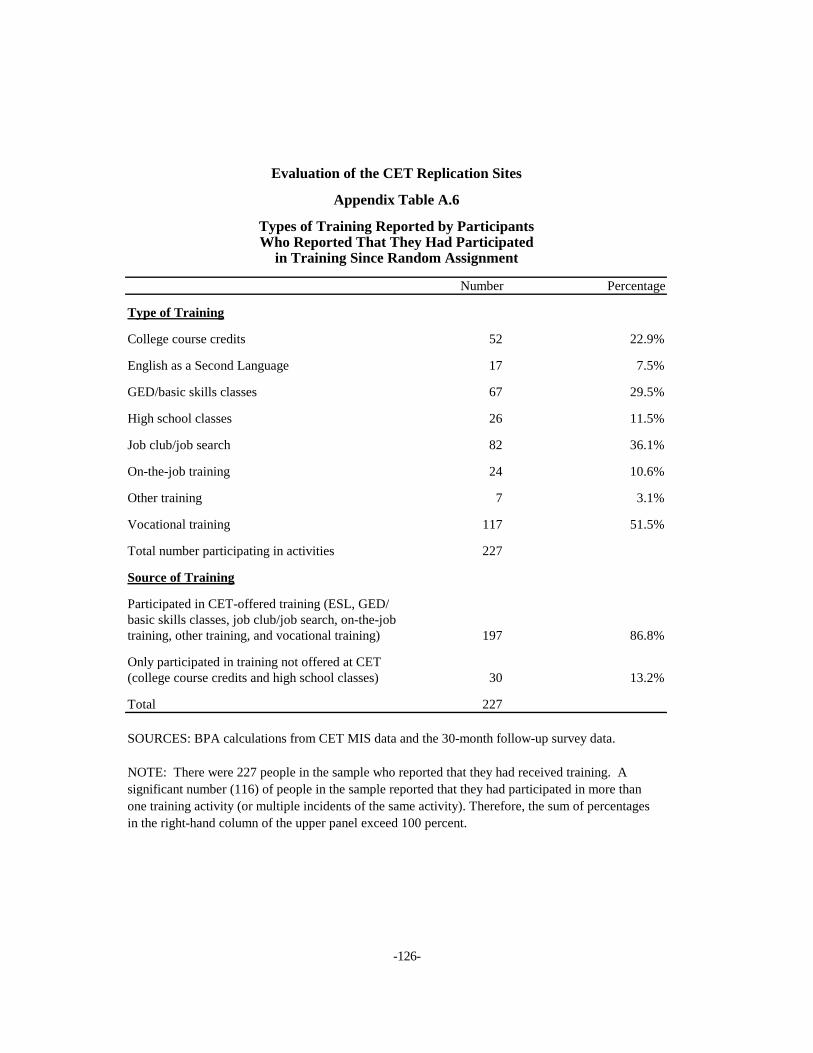
-126-
Evaluation of the CET Replication Sites
Appendix Table A.6
Types of Training Reported by ParticipantsWho Reported That They Had Participated
in Training Since Random Assignment
Number Percentage
Type of Training
College course credits 52 22.9%
English as a Second Language 17 7.5%
GED/basic skills classes 67 29.5%
High school classes 26 11.5%
Job club/job search 82 36.1%
On-the-job training 24 10.6%
Other training 7 3.1%
Vocational training 117 51.5%
Total number participating in activities 227
Source of Training
Participated in CET-offered training (ESL, GED/basic skills classes, job club/job search, on-the-jobtraining, other training, and vocational training) 197 86.8%
Only participated in training not offered at CET (college course credits and high school classes) 30 13.2%
Total 227
SOURCES: BPA calculations from CET MIS data and the 30-month follow-up survey data.
NOTE: There were 227 people in the sample who reported that they had received training. A significant number (116) of people in the sample reported that they had participated in more than one training activity (or multiple incidents of the same activity). Therefore, the sum of percentages in the right-hand column of the upper panel exceed 100 percent.

-127-
This indicates that a significant proportion of the training that was reported in the survey was not CET training.5
• The reporting of training activity in the survey was affected by the length and intensity of CET training (Tables A.7 and A.8).
As one might expect, participants who were engaged in CET training for longer periods or with greater intensity were more likely to report in the survey that they had participated in training, although the effect was not large. The analysis examined two measures of the length of time that participants spent in CET training: the number of months and the number of hours. Table A.7 displays the numbers and percentages of participants in the MIS-survey match sam-ple who reported that they had or had not received training since random assignment, by the
5Note, however, that the 13 percent reported above is a lower bound on the percentage of survey-reported
training that was not CET training. It is highly possible that the activities that respondents in the survey re-ported as being available at CET did not actually take place at a CET site.
Months of CET Training Number Percentage Number Percentage Total
0-1 month 9 36.0% 16 64.0% 25
2 Months 9 39.1% 14 60.9% 23
3 Months 7 35.0% 13 65.0% 20
4 Months 12 52.2% 11 47.8% 23
5-8 Months 62 33.9% 121 66.1% 183
9-12 Months 16 25.4% 47 74.6% 63
13+ Months 2 28.6% 5 71.4% 7
Total 344
Reported that they had not received training
Reported that they had received training
Relationship Between the Number of Months That Respondents Received CET Training and the Reporting of Training Activity in the Survey
Evaluation of the CET Replication Sites
Appendix Table A.7
SOURCES: BPA calculations from CET MIS data and the 30-month follow-up survey data.
NOTE: There were 344 people in the MIS-survey match sample.
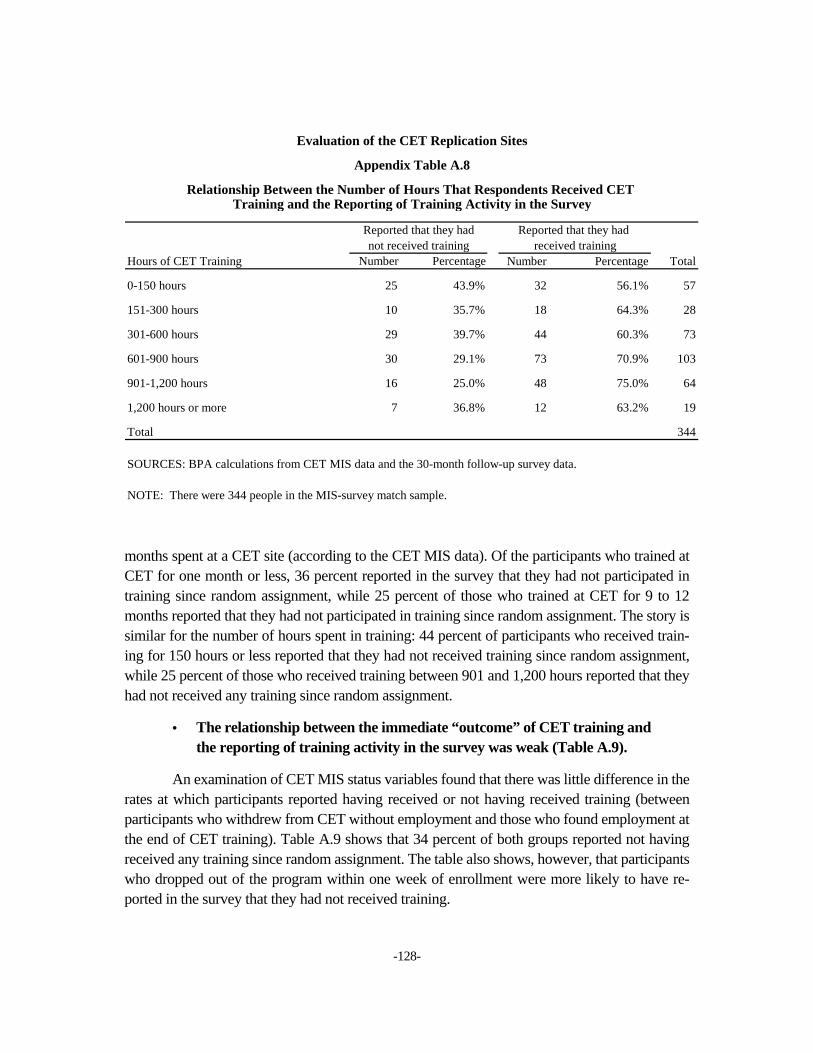
-128-
months spent at a CET site (according to the CET MIS data). Of the participants who trained at CET for one month or less, 36 percent reported in the survey that they had not participated in training since random assignment, while 25 percent of those who trained at CET for 9 to 12 months reported that they had not participated in training since random assignment. The story is similar for the number of hours spent in training: 44 percent of participants who received train-ing for 150 hours or less reported that they had not received training since random assignment, while 25 percent of those who received training between 901 and 1,200 hours reported that they had not received any training since random assignment.
• The relationship between the immediate “outcome” of CET training and the reporting of training activity in the survey was weak (Table A.9).
An examination of CET MIS status variables found that there was little difference in the rates at which participants reported having received or not having received training (between participants who withdrew from CET without employment and those who found employment at the end of CET training). Table A.9 shows that 34 percent of both groups reported not having received any training since random assignment. The table also shows, however, that participants who dropped out of the program within one week of enrollment were more likely to have re-ported in the survey that they had not received training.
Hours of CET Training Number Percentage Number Percentage Total
0-150 hours 25 43.9% 32 56.1% 57
151-300 hours 10 35.7% 18 64.3% 28
301-600 hours 29 39.7% 44 60.3% 73
601-900 hours 30 29.1% 73 70.9% 103
901-1,200 hours 16 25.0% 48 75.0% 64
1,200 hours or more 7 36.8% 12 63.2% 19
Total 344
Evaluation of the CET Replication Sites
Appendix Table A.8
Relationship Between the Number of Hours That Respondents Received CET Training and the Reporting of Training Activity in the Survey
Reported that they had not received training
Reported that they had received training
SOURCES: BPA calculations from CET MIS data and the 30-month follow-up survey data.
NOTE: There were 344 people in the MIS-survey match sample.

-129-
MIS Status Code Number Percentage Number Percentage Total
Dropped out within 1 week 7 41.2% 10 58.8% 17
Withdrew without employment 64 33.5% 127 66.5% 191
Found employment at end of training 46 33.8% 90 66.2% 136
Total 344
Evaluation of the CET Replication Sites
Appendix Table A.9
Relationship Between the MIS Status Codes and theReporting of Training Activity in the Survey
Reported that they had not received training
Reported that they had received training
SOURCES: BPA calculations from CET MIS data and the 30-month follow-up survey data.
NOTE: There were 344 people in the MIS-survey match sample.


Appendix B
Survey Nonresponse and Bias
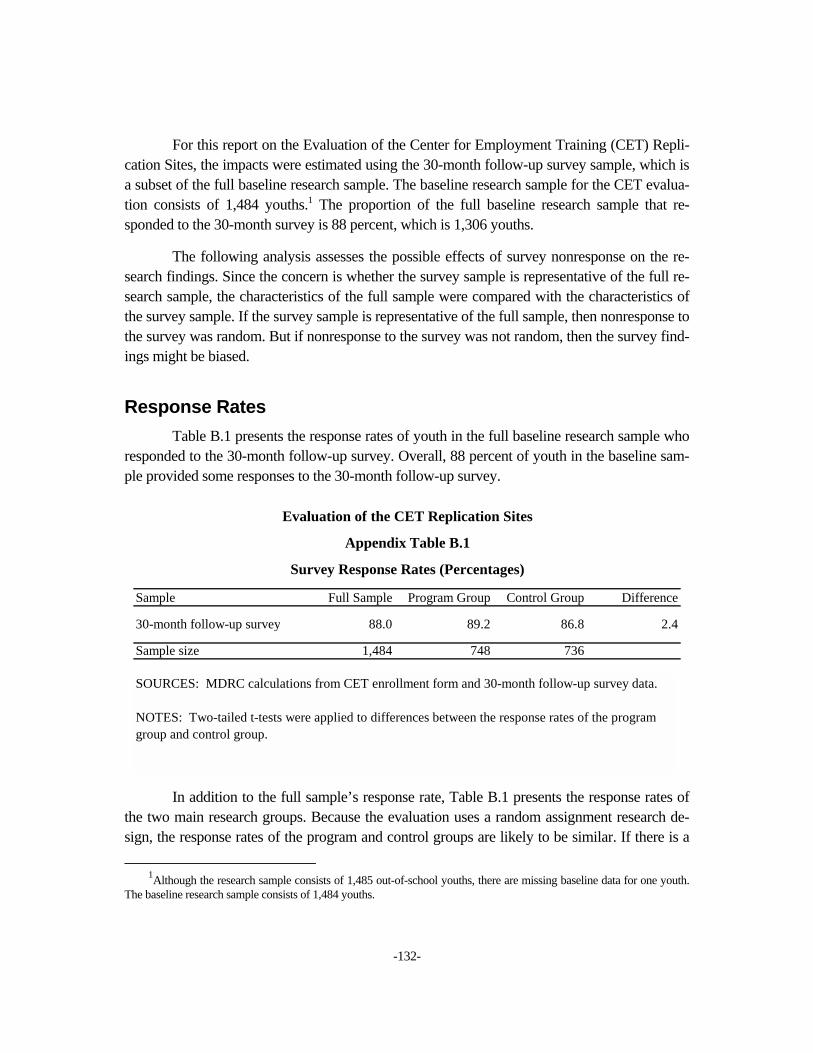
-132-
For this report on the Evaluation of the Center for Employment Training (CET) Repli-cation Sites, the impacts were estimated using the 30-month follow-up survey sample, which is a subset of the full baseline research sample. The baseline research sample for the CET evalua-tion consists of 1,484 youths.1 The proportion of the full baseline research sample that re-sponded to the 30-month survey is 88 percent, which is 1,306 youths.
The following analysis assesses the possible effects of survey nonresponse on the re-search findings. Since the concern is whether the survey sample is representative of the full re-search sample, the characteristics of the full sample were compared with the characteristics of the survey sample. If the survey sample is representative of the full sample, then nonresponse to the survey was random. But if nonresponse to the survey was not random, then the survey find-ings might be biased.
Response Rates Table B.1 presents the response rates of youth in the full baseline research sample who
responded to the 30-month follow-up survey. Overall, 88 percent of youth in the baseline sam-ple provided some responses to the 30-month follow-up survey.
In addition to the full sample’s response rate, Table B.1 presents the response rates of the two main research groups. Because the evaluation uses a random assignment research de-sign, the response rates of the program and control groups are likely to be similar. If there is a
1Although the research sample consists of 1,485 out-of-school youths, there are missing baseline data for one youth.
The baseline research sample consists of 1,484 youths.
Evaluation of the CET Replication Sites
Appendix Table B.1
Survey Response Rates (Percentages)
Sample Full Sample Program Group Control Group Difference
30-month follow-up survey 88.0 89.2 86.8 2.4
Sample size 1,484 748 736
SOURCES: MDRC calculations from CET enrollment form and 30-month follow-up survey data.
NOTES: Two-tailed t-tests were applied to differences between the response rates of the program group and control group.

-133-
significant difference in the response rates of the program and control groups, the two groups might not be similar in terms of background characteristics, which might result in biased impact estimates. Although the response rate is slightly higher for the program group than for the con-trol group, the difference is nominal and not statistically significant.
Effects of Nonresponse on Baseline Characteristics Given the full research sample’s fairly high response rate of 88 percent, the survey
sample is likely to be representative of the full sample. In addition, the response rates of the con-trol group and the program group are comparable, suggesting that the impacts detected for the program group are valid. Moreover, in order to adequately detect the effects of the CET model, it is important that the measured and unmeasured characteristics of both research groups be equivalent.
Table B.2 compares selected baseline characteristics of the full sample and of the sur-vey sample. The most significant differences are seen in regards to gender, education, and race/ethnicity. The percentage of females in the full sample is significantly less than the per-centage of females in the survey sample. Conversely, there are significantly fewer males in the 30-month follow-up survey sample than in the full baseline survey sample. Although these dif-ferences are significant, they are small. Furthermore, the survey sample was less likely to have less than a high school education and more likely to have attained a twelfth-grade education. Although statistically significant, the differences between the full sample and the survey sample are small for the percentages who are Hispanic or African-American.
Overall, the number of significant differences between the full sample and the survey sample are few, and those differences that do exist are nominal and random, which suggests that they occurred by chance. Therefore, the survey sample appears to be an accurate representation of the full sample, which would indicate that the impacts in the report that use the survey sam-ple are unlikely to be biased.

-134-
Characteristic (%) Full Sample Survey Sample Difference
Age (years) 19.1 19.1 0.0
Gender
Female 57.0 59.3 -2.3 ***Male 43.0 40.7 2.3 ***
Ethnicity
Hispanic 41.0 42.3 -1.3 ***African-American 50.8 49.7 1.1 **White 5.9 5.9 0.1Other 2.3 2.2 0.1
Education
Less than high school education 58.2 57.1 1.2 **
High school graduate/GED 41.8 42.9 -1.2 **
Highest Grade Level Attained
10th grade or less 35.2 35.2 0.011th grade 34.3 33.2 1.1 **12th grade 29.3 30.3 -1.0 **More than 12 years of
schooling 1.3 1.3 0.0
English Language Proficiency
No limited English proficiency 87.5 88.1 -0.6
Limited English proficiency 12.5 11.9 0.6
Citizenship
U.S. citizen 88.0 88.1 -0.1Eligible noncitizen 12.0 11.9 0.1
Labor Force Status
Employed 12.2 12.4 -0.2Unemployed 68.7 68.6 0.2Not in the labor force 16.9 17.1 -0.2Underemployed 2.2 2.0 0.2
(continued)
Evaluation of the CET Replication Sites
Appendix Table B.2
Comparison of the Characteristics of the Baseline Survey Sample
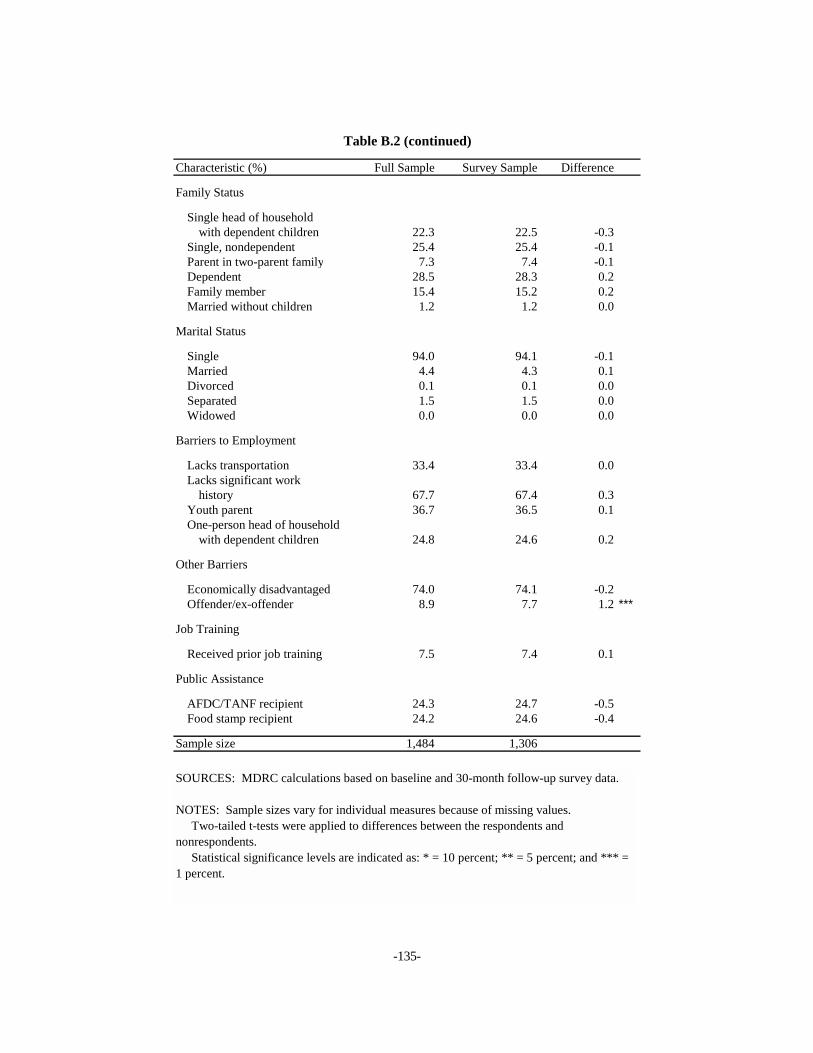
-135-
Characteristic (%) Full Sample Survey Sample Difference
Family Status
Single head of household with dependent children 22.3 22.5 -0.3
Single, nondependent 25.4 25.4 -0.1Parent in two-parent family 7.3 7.4 -0.1Dependent 28.5 28.3 0.2Family member 15.4 15.2 0.2Married without children 1.2 1.2 0.0
Marital Status
Single 94.0 94.1 -0.1Married 4.4 4.3 0.1Divorced 0.1 0.1 0.0Separated 1.5 1.5 0.0Widowed 0.0 0.0 0.0
Barriers to Employment
Lacks transportation 33.4 33.4 0.0Lacks significant work
history 67.7 67.4 0.3Youth parent 36.7 36.5 0.1One-person head of household
with dependent children 24.8 24.6 0.2
Other Barriers
Economically disadvantaged 74.0 74.1 -0.2Offender/ex-offender 8.9 7.7 1.2 ***
Job Training
Received prior job training 7.5 7.4 0.1
Public Assistance
AFDC/TANF recipient 24.3 24.7 -0.5Food stamp recipient 24.2 24.6 -0.4
Sample size 1,484 1,306
Table B.2 (continued)
SOURCES: MDRC calculations based on baseline and 30-month follow-up survey data.
NOTES: Sample sizes vary for individual measures because of missing values. Two-tailed t-tests were applied to differences between the respondents and nonrespondents. Statistical significance levels are indicated as: * = 10 percent; ** = 5 percent; and *** = 1 percent.


Appendix C
Selected Impacts, by Site
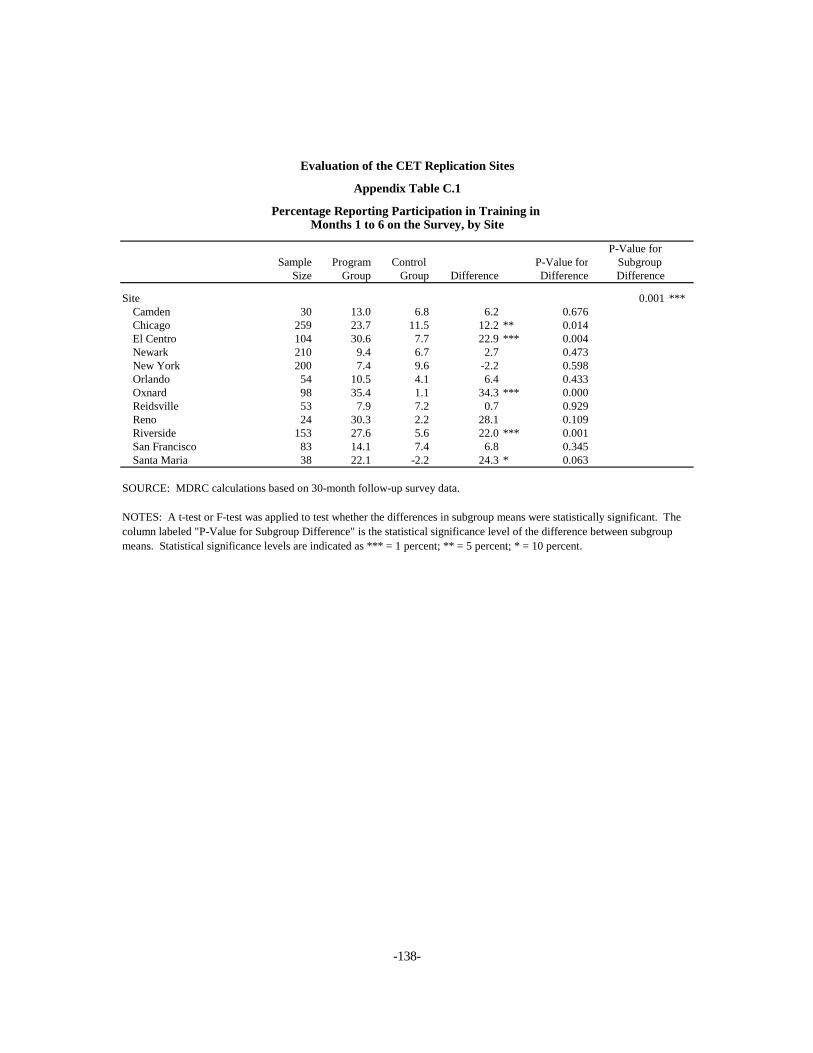
-138-
P-Value for Sample Program Control P-Value for Subgroup
Size Group Group Difference Difference Difference
Site 0.001 ***Camden 30 13.0 6.8 6.2 0.676Chicago 259 23.7 11.5 12.2 ** 0.014El Centro 104 30.6 7.7 22.9 *** 0.004Newark 210 9.4 6.7 2.7 0.473New York 200 7.4 9.6 -2.2 0.598Orlando 54 10.5 4.1 6.4 0.433Oxnard 98 35.4 1.1 34.3 *** 0.000Reidsville 53 7.9 7.2 0.7 0.929Reno 24 30.3 2.2 28.1 0.109Riverside 153 27.6 5.6 22.0 *** 0.001San Francisco 83 14.1 7.4 6.8 0.345Santa Maria 38 22.1 -2.2 24.3 * 0.063
Appendix Table C.1
Percentage Reporting Participation in Training in Months 1 to 6 on the Survey, by Site
Evaluation of the CET Replication Sites
SOURCE: MDRC calculations based on 30-month follow-up survey data.
NOTES: A t-test or F-test was applied to test whether the differences in subgroup means were statistically significant. The column labeled "P-Value for Subgroup Difference" is the statistical significance level of the difference between subgroup means. Statistical significance levels are indicated as *** = 1 percent; ** = 5 percent; * = 10 percent.

-139-
P-Value for Sample Program Control P-Value for Subgroup
Size Group Group Difference Difference Difference
Site 0.000 ***Camden 30 60.3 37.2 23.0 0.769Chicago 259 146.2 47.1 99.1 *** 0.006El Centro 104 246.1 50.1 196.0 *** 0.004Newark 210 47.5 18.9 28.6 0.222New York 200 47.1 42.0 5.1 0.872Orlando 54 98.3 6.6 91.8 0.161Oxnard 98 276.8 -0.7 277.5 *** 0.000Reidsville 53 22.2 21.6 0.5 0.984Reno 24 261.5 -3.6 265.2 * 0.082Riverside 153 183.9 48.0 135.9 *** 0.005San Francisco 83 88.5 35.9 52.7 0.289Santa Maria 38 185.1 -10.6 195.7 0.101
Appendix Table C.2
Evaluation of the CET Replication Sites
Reported Hours of Participation in Training in Months 1 to 6 on the Survey, by Site
SOURCE: MDRC calculations based on 30-month follow-up survey data.
NOTES: A t-test or F-test was applied to test whether the differences in subgroup means were statistically significant. The column labeled "P-Value for Subgroup Difference" is the statistical significance level of the difference between subgroup means. Statistical significance levels are indicated as *** = 1 percent; ** = 5 percent; * = 10 percent.

-140-
P-Value for Sample Program Control P-Value for Subgroup
Size Group Group Difference Difference Difference
Site 0.040 **Camden 30 18.0 42.7 -24.6 0.198Chicago 259 38.3 22.7 15.6 *** 0.009El Centro 104 44.3 17.0 27.3 *** 0.004Newark 210 38.2 36.8 1.4 0.836New York 200 42.6 30.9 11.8 * 0.095Orlando 54 41.9 16.6 25.3 * 0.073Oxnard 98 35.8 22.8 13.1 0.202Reidsville 53 32.0 24.4 7.6 0.571Reno 24 9.9 15.3 -5.4 0.698Riverside 153 51.3 17.6 33.6 *** 0.000San Francisco 83 32.0 20.2 11.8 0.264Santa Maria 38 36.4 14.2 22.2 0.281
Appendix Table C.3
Evaluation of the CET Replication Sites
Reported Receipt of a Training Certificate, by Site
SOURCE: MDRC calculations based on 30-month follow-up survey data.
NOTES: A t-test or F-test was applied to test whether the differences in subgroup means were statistically significant. The column labeled "P-Value for Subgroup Difference" is the statistical significance level of the difference between subgroup means. Statistical significance levels are indicated as *** = 1 percent; ** = 5 percent; * = 10 percent.
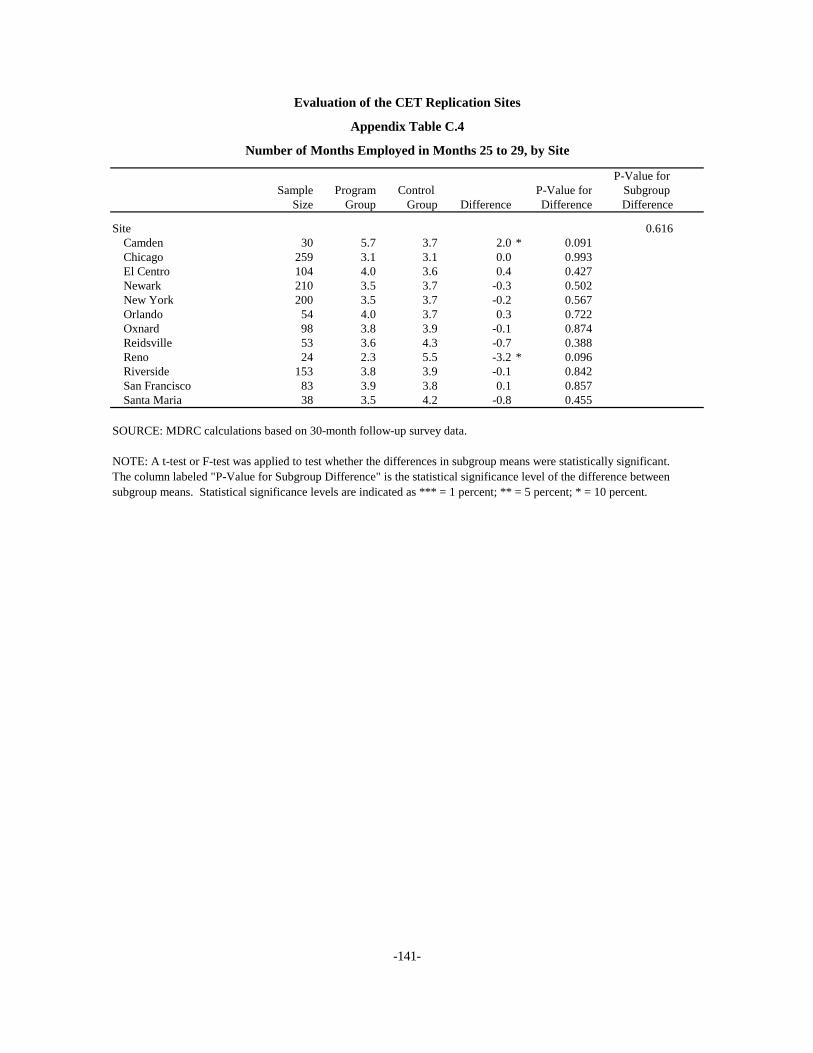
-141-
P-Value for Sample Program Control P-Value for Subgroup
Size Group Group Difference Difference Difference
Site 0.616Camden 30 5.7 3.7 2.0 * 0.091Chicago 259 3.1 3.1 0.0 0.993El Centro 104 4.0 3.6 0.4 0.427Newark 210 3.5 3.7 -0.3 0.502New York 200 3.5 3.7 -0.2 0.567Orlando 54 4.0 3.7 0.3 0.722Oxnard 98 3.8 3.9 -0.1 0.874Reidsville 53 3.6 4.3 -0.7 0.388Reno 24 2.3 5.5 -3.2 * 0.096Riverside 153 3.8 3.9 -0.1 0.842San Francisco 83 3.9 3.8 0.1 0.857Santa Maria 38 3.5 4.2 -0.8 0.455
Appendix Table C.4
Number of Months Employed in Months 25 to 29, by Site
Evaluation of the CET Replication Sites
SOURCE: MDRC calculations based on 30-month follow-up survey data.
NOTE: A t-test or F-test was applied to test whether the differences in subgroup means were statistically significant. The column labeled "P-Value for Subgroup Difference" is the statistical significance level of the difference between subgroup means. Statistical significance levels are indicated as *** = 1 percent; ** = 5 percent; * = 10 percent.

-142-
P-Value for Sample Program Control P-Value for Subgroup
Size Group Group Difference Difference Difference
Site 0.538Camden 30 7,143 5,431 1,712 0.266Chicago 259 3,543 3,072 472 0.358El Centro 104 4,043 4,300 -257 0.701Newark 210 3,757 4,619 -862 0.149New York 200 2,868 3,086 -218 0.715Orlando 54 4,502 3,824 679 0.627Oxnard 98 3,550 4,811 -1,261 0.270Reidsville 53 4,615 5,345 -730 0.543Reno 24 1,612 6,822 -5,210 0.385Riverside 153 4,024 4,320 -295 0.699San Francisco 83 4,546 3,778 768 0.492Santa Maria 38 3,724 4,631 -906 0.564
Appendix Table C.5
Total Earnings in Months 25 to 29, by Site
Evaluation of the CET Replication Sites
SOURCE: MDRC calculations based on 30-month follow-up survey data.
NOTE: A t-test or F-test was applied to test whether the differences in subgroup means were statistically significant. The column labeled "P-Value for Subgroup Difference" is the statistical significance level of the difference between subgroup means. Statistical significance levels are indicated as *** = 1 percent; ** = 5 percent; * = 10 percent.

-143-
P-Value for Sample Program Control P-Value for Subgroup
Size Group Group Difference Difference Difference
Site 0.800Camden 30 40.6 21.1 19.4 0.407Chicago 259 36.0 34.8 1.3 0.836El Centro 104 44.5 37.0 7.5 0.437Newark 210 36.3 27.3 8.9 0.155New York 200 28.2 16.8 11.4 * 0.058Orlando 54 28.2 27.4 0.8 0.947Oxnard 98 38.9 32.4 6.5 0.506Reidsville 53 32.3 29.2 3.0 0.818Reno 24 26.5 40.4 -13.9 0.577Riverside 153 33.8 27.0 6.7 0.390San Francisco 83 29.5 43.9 -14.4 0.208Santa Maria 38 42.3 20.4 21.9 0.224
Appendix Table C.6
Reported Alcohol Consumption in the Month Before Follow-Up, by Site
Evaluation of the CET Replication Sites
SOURCE: MDRC calculations based on 30-month follow-up survey data.
NOTE: A t-test or F-test was applied to test whether the differences in subgroup means were statistically significant. The column labeled "P-Value for Subgroup Difference" is the statistical significance level of the difference between subgroup means. Statistical significance levels are indicated as *** = 1 percent; ** = 5 percent; * = 10 percent.

-144-
P-Value for Sample Program Control P-Value for Subgroup
Size Group Group Difference Difference Difference
Site 0.865Camden 30 28.5 38.4 -9.9 0.620Chicago 259 34.5 44.0 -9.5 0.126El Centro 104 27.4 30.4 -3.0 0.745Newark 210 32.9 31.2 1.6 0.805New York 200 26.2 25.3 1.0 0.879Orlando 54 27.6 35.5 -8.0 0.575Oxnard 98 30.6 41.0 -10.3 0.318Reidsville 53 40.3 27.4 12.9 0.362Reno 24 9.9 6.7 3.3 0.773Riverside 153 39.2 30.5 8.7 0.287San Francisco 83 26.2 25.0 1.2 0.904Santa Maria 38 36.5 42.5 -6.0 0.768
Appendix Table C.7
Reported Having Had a Child Since Random Assignment, by Site
Evaluation of the CET Replication Sites
SOURCE: MDRC calculations based on 30-month follow-up survey data.
NOTE: A t-test or F-test was applied to test whether the differences in subgroup means were statistically significant. The column labeled "P-Value for Subgroup Difference" is the statistical significance level of the difference between subgroup means. Statistical significance levels are indicated as *** = 1 percent; ** = 5 percent; * = 10 percent.

-145-
References
Bloom, Howard, Larry Orr, George Cave, Stephen Bell, and Fred Doolittle. 1993. The National JTPA Study: Title II-A Impacts on Earnings and Employment at 18 Months. Bethesda, MD: Abt Associates Inc.
Bloom, Howard, Larry Orr, George Cave, Stephen Bell, Fred Doolittle, and Winston Lin. 1994. The National JTPA Study. Overview: Impacts, Benefits, and Costs of Title II-A. Bethesda, MD: Abt Associates Inc.
Bloom, Howard, Larry Orr, Stephen Bell, George Cave, Fred Doolittle, Winston Lin, and Johannes Bos. 1997. “The Benefits and Costs of JTPA Title II-A Programs: Key Findings from the Na-tional Job Training Partnership Act Study.” Journal of Human Resources 32 (3): 549-576.
Brown, David E. 2002. Testimony of the Executive Director, National Youth Employment Coali-tion, before the House Labor-HHS-Education Subcommittee of the House Appropriations Committee, Washington, DC, May 7.
Burghardt, John, Anu Rangarajan, Anne Gordon, and Ellen Kisker. 1992. Evaluation of the Minority Female Single Parent Demonstration, Vol. I, Summary Report. Princeton, NJ: Mathematica Policy Research, Inc.
Cave, George, Johannes Bos, Fred Doolittle, and Cyril Toussaint. 1993. JOBSTART: Final Report on a Program for School Dropouts. New York: MDRC.
Ferguson, Ronald, Phillip Clay, Jason Snipes, and Phoebe Roaf. 1996. Youthbuild in Development Perspective: A Formative Evaluation of the Youthbuild Demonstration Project. Cambridge, MA: Harvard University, John F. Kennedy School of Government.
Gordon, Anne, and John Burghardt. 1990. More Jobs and Higher Pay: How an Integrated Program Compares with Traditional Programs. New York: The Rockefeller Foundation.
Holzer, Harry. 1996. What Employers Want: Job Prospects for Less-Educated Workers. New York: Russell Sage Foundation.
Ihlanfeldt, Keith. 1997. “Information on the Spatial Distribution of Job Opportunities.” Journal of Urban Economics 41 (2): 218-242.
Orr, Larry L., Howard S. Bloom, Fred Doolittle, Winston Lin, and George Cave. 1996. Does Train-ing for the Disadvantaged Work? Evidence from the National JTPA Study. Washington, DC: Urban Institute Press.
Pauley, Edward. 1991. The Classroom Crucible: What Really Works, What Doesn’t and Why. New York: Basic Books.
Smith, Thomas J. 1997. “Introduction.” In Donna Walker James, Some Things DO Make a Differ-ence for Youth. Washington, DC: American Youth Policy Forum.

-146-
Sum, Andrew, Joe McLaughlin, Jacqui Motroni, and Sheila Palma. 2002. The National Economic Recession and Its Impacts on Employment Among the Nation’s Young Adults (16-24 Years Old): The Untold Story of Rising Youth Joblessness. Boston: Northeastern University, Center for Labor Market Studies, March.
Sum, Andrew, and Marion Pines. 1997. What’s Really Happening with America’s Out of School Youth? Washington, DC: American Youth Policy Forum, April 18.
Tershy, Russell. 1995. Testimony of Russell Tershy, President of the Center for Employment Train-ing, Committee on Economic and Educational Opportunities, Subcommittee on Postsecondary Education, Training, and Life-Long Learning. Washington, DC.
U.S. Department of Health and Human Services. 2001. National Household Survey on Drug Abuse (NHSDA). Washington, DC: U.S. Department of Health and Human Services, Substance Abuse and Mental Health Services Administration.
U.S. Department of Labor. 1992. Federal Register. Washington, DC: U.S. Department of Labor.
U.S. Department of Labor. 1995. Conduct of Random Assignment Evaluation of the Center for Em-ployment Training Replication Sites. Solicitation No. RFP-DAA-95-17. Washington, DC: U.S. Department of Labor.
U.S. Department of Labor/ETA. 2002. Training and Employment Guidance Letter No. 28-01. Washington, DC: U.S. Department of Labor, May 20.
Walsh, Stephen, Deana Goldsmith, Yasuyo Abe, and Andrea Cann. 2000. Evaluation of the Center for Employment Training Replication Sites. Oakland, CA: Berkeley Policy Associates.
Wilson, William. 1987. The Truly Disadvantaged. Chicago: University of Chicago Press.
Zambrowski, Amy, Anne Gordon, and Laura Berenson. 1993. Evaluation of the Minority Female Single Parent Demonstration: Fifth-Year Impacts at CET. Princeton, NJ: Mathematica Policy Research, Inc.

-147-
Recent Publications on MDRC Projects
Note: For works not published by MDRC, the publisher�s name is shown in parentheses. With a few exceptions, this list includes reports published by MDRC since 1999. A complete publications list is available from MDRC and on its Web site (www.mdrc.org), from which copies of MDRC�s publications can also be downloaded.
Reforming Welfare and Making Work Pay Next Generation Project A collaboration among researchers at MDRC and several other leading research institutions focused on studying the effects of welfare, antipoverty, and employment policies on children and families. How Welfare and Work Policies Affect Children: A
Synthesis of Research. 2001. Pamela Morris, Aletha Huston, Greg Duncan, Danielle Crosby, Johannes Bos.
How Welfare and Work Policies Affect Employment and Income: A Synthesis of Research. 2001. Dan Bloom, Charles Michalopoulos.
How Welfare and Work Policies for Parents Affect Adolescents: A Synthesis of Research. 2002. Lisa Gennetian, Greg Duncan, Virginia Knox, Wanda Vargas, Elizabeth Clark-Kauffman, Andrew London.
ReWORKing Welfare: Technical Assistance for States and Localities A multifaceted effort to assist states and localities in designing and implementing their welfare reform programs. The project includes a series of �how-to� guides, conferences, briefings, and customized, in-depth technical assistance. After AFDC: Welfare-to-Work Choices and
Challenges for States. 1997. Dan Bloom. Work First: How to Implement an Employment-
Focused Approach to Welfare Reform. 1997. Amy Brown.
Business Partnerships: How to Involve Employers in Welfare Reform. 1998. Amy Brown, Maria Buck, Erik Skinner.
Promoting Participation: How to Increase Involvement in Welfare-to-Work Activities. 1999. Gayle Hamilton, Susan Scrivener.
Encouraging Work, Reducing Poverty: The Impact of Work Incentive Programs. 2000. Gordon Berlin.
Steady Work and Better Jobs: How to Help Low-Income Parents Sustain Employment and Advance in the Workforce. 2000. Julie Strawn, Karin Martinson.
Beyond Work First: How to Help Hard-to-Employ Individuals Get Jobs and Succeed in the Workforce. 2001. Amy Brown.
Project on Devolution and Urban Change A multiyear study in four major urban counties � Cuyahoga County, Ohio (which includes the city of Cleveland), Los Angeles, Miami-Dade, and Philadelphia � that examines how welfare reforms are being implemented and affect poor people, their neighborhoods, and the institutions that serve them. Big Cities and Welfare Reform: Early
Implementation and Ethnographic Findings from the Project on Devolution and Urban Change. 1999. Janet Quint, Kathryn Edin, Maria Buck, Barbara Fink, Yolanda Padilla, Olis Simmons-Hewitt, Mary Valmont.
Food Security and Hunger in Poor, Mother-Headed Families in Four U.S. Cities. 2000. Denise Polit, Andrew London, John Martinez.
Assessing the Impact of Welfare Reform on Urban Communities: The Urban Change Project and Methodological Considerations. 2000. Charles Michalopoulos, Johannes Bos, Robert Lalonde, Nandita Verma.
Post-TANF Food Stamp and Medicaid Benefits: Factors That Aid or Impede Their Receipt. 2001. Janet Quint, Rebecca Widom.
Social Service Organizations and Welfare Reform. 2001. Barbara Fink, Rebecca Widom.
Monitoring Outcomes for Cuyahoga County’s Welfare Leavers: How Are They Faring? 2001. Nandita Verma, Claudia Coulton.
The Health of Poor Urban Women: Findings from the Project on Devolution and Urban Change. 2001. Denise Polit, Andrew London, John Martinez.
Is Work Enough? The Experiences of Current and Former Welfare Mothers Who Work. 2001. Denise Polit, Rebecca Widom, Kathryn Edin, Stan Bowie, Andrew London, Ellen Scott, Abel Valenzuela.
Readying Welfare Recipients for Work: Lessons from Four Big Cities as They Implement Welfare Reform. 2002. Thomas Brock, Laura Nelson, Megan Reiter.
Welfare Reform in Cleveland: Implementation, Effects, and Experiences of Poor Families and Neighborhoods. 2002. Thomas Brock, Claudia Coulton, Andrew London, Denise Polit, Lashawn Richburg-Hayes, Ellen Scott, Nandita Verma.

-148-
Comparing Outcomes for Los Angeles County’s HUD-Assisted and Unassisted CalWORKs Leavers. 2003. Nandita Verma, Richard Hendra.
Monitoring Outcomes for Los Angeles County’s Pre- and Post-CalWORKs Leavers: How Are They Faring? 2003. Nandita Verma, Richard Hendra.
Wisconsin Works This study examines how Wisconsin�s welfare-to-work program, one of the first to end welfare as an entitlement, is administered in Milwaukee. Complaint Resolution in the Context of Welfare
Reform: How W-2 Settles Disputes. 2001. Suzanne Lynn.
Exceptions to the Rule: The Implementation of 24-Month Time-Limit Extensions in W-2. 2001. Susan Gooden, Fred Doolittle.
Matching Applicants with Services: Initial Assessments in the Milwaukee County W-2 Program. 2001. Susan Gooden, Fred Doolittle, Ben Glispie.
Employment Retention and Advancement Project Conceived and funded by the U.S. Department of Health and Human Services (HHS), this demon- stration project is aimed at testing various ways to help low-income people find, keep, and advance in jobs.
New Strategies to Promote Stable Employment and Career Progression: An Introduction to the Employment Retention and Advancement Project (HHS). 2002. Dan Bloom, Jacquelyn Anderson, Melissa Wavelet, Karen Gardiner, Michael Fishman.
Time Limits Welfare Time Limits: State Policies, Implementation,
and Effects on Families. 2002. Dan Bloom, Mary Farrell, Barbara Fink.
Leavers, Stayers, and Cyclers: An Analysis of the Welfare Caseload. 2002. Cynthia Miller.
Florida’s Family Transition Program An evaluation of Florida�s initial time-limited welfare program, which includes services, requirements, and financial work incentives intended to reduce long-term welfare receipt and help welfare recipients find and keep jobs. The Family Transition Program: Implementation and
Three-Year Impacts of Florida’s Initial Time-Limited Welfare Program. 1999. Dan Bloom, Mary Farrell, James Kemple, Nandita Verma.
The Family Transition Program: Final Report on Florida’s Initial Time-Limited Welfare Program. 2000. Dan Bloom, James Kemple, Pamela Morris, Susan Scrivener, Nandita Verma, Richard Hendra.
Cross-State Study of Time-Limited Welfare An examination of the implementation of some of the first state-initiated time-limited welfare programs. Welfare Time Limits: An Interim Report Card. 1999.
Dan Bloom.
Connecticut’s Jobs First Program An evaluation of Connecticut�s statewide time-limited welfare program, which includes financial work incentives and requirements to participate in employment-related services aimed at rapid job placement. This study provides some of the earliest information on the effects of time limits in major urban areas.
Connecticut Post-Time Limit Tracking Study: Six-Month Survey Results. 1999. Jo Anna Hunter-Manns, Dan Bloom.
Jobs First: Implementation and Early Impacts of Connecticut’s Welfare Reform Initiative. 2000. Dan Bloom, Laura Melton, Charles Michalopoulos, Susan Scrivener, Johanna Walter.
Connecticut’s Jobs First Program: An Analysis of Welfare Leavers. 2000. Laura Melton, Dan Bloom.
Final Report on Connecticut’s Welfare Reform Initiative. 2002. Dan Bloom, Susan Scrivener, Charles Michalopoulos, Pamela Morris, Richard Hendra, Diana Adams-Ciardullo, Johanna Walter.
Vermont’s Welfare Restructuring Project An evaluation of Vermont�s statewide welfare reform program, which includes a work requirement after a certain period of welfare receipt, and financial work incentives. Forty-Two-Month Impacts of Vermont’s Welfare
Restructuring Project. 1999. Richard Hendra, Charles Michalopoulos.
WRP: Key Findings from the Forty-Two-Month Client Survey. 2000. Dan Bloom, Richard Hendra, Charles Michalopoulos.
WRP: Final Report on Vermont’s Welfare Restructuring Project. 2002. Susan Scrivener, Richard Hendra, Cindy Redcross, Dan Bloom, Charles Michalopoulos, Johanna Walter.
Financial Incentives Encouraging Work, Reducing Poverty: The Impact of
Work Incentive Programs. 2000. Gordon Berlin.
Minnesota Family Investment Program An evaluation of Minnesota�s pilot welfare reform initiative, which aims to encourage work, alleviate poverty, and reduce welfare dependence. Reforming Welfare and Rewarding Work: Final
Report on the Minnesota Family Investment Program. 2000:

-149-
Volume 1: Effects on Adults. Cynthia Miller, Virginia Knox, Lisa Gennetian, Martey Dodoo, Jo Anna Hunter, Cindy Redcross. Volume 2: Effects on Children. Lisa Gennetian, Cynthia Miller.
Reforming Welfare and Rewarding Work: A Summary of the Final Report on the Minnesota Family Investment Program. 2000. Virginia Knox, Cynthia Miller, Lisa Gennetian.
Final Report on the Implementation and Impacts of the Minnesota Family Investment Program in Ramsey County. 2000. Patricia Auspos, Cynthia Miller, Jo Anna Hunter.
New Hope Project A test of a community-based, work-focused antipoverty program and welfare alternative operating in Milwaukee. New Hope for People with Low Incomes: Two-Year
Results of a Program to Reduce Poverty and Reform Welfare. 1999. Johannes Bos, Aletha Huston, Robert Granger, Greg Duncan, Thomas Brock, Vonnie McLoyd.
Canada�s Self-Sufficiency Project A test of the effectiveness of a temporary earnings supplement on the employment and welfare receipt of public assistance recipients. Reports on the Self-Sufficiency Project are available from: Social Research and Demonstration Corporation (SRDC), 275 Slater St., Suite 900, Ottawa, Ontario K1P 5H9, Canada. Tel.: 613-237-4311; Fax: 613-237-5045. In the United States, the reports are also available from MDRC. Does SSP Plus Increase Employment? The Effect of
Adding Services to the Self-Sufficiency Project’s Financial Incentives (SRDC). 1999. Gail Quets, Philip Robins, Elsie Pan, Charles Michalopoulos, David Card.
When Financial Work Incentives Pay for Themselves: Early Findings from the Self-Sufficiency Project’s Applicant Study (SRDC). 1999. Charles Michalopoulos, Philip Robins, David Card.
The Self-Sufficiency Project at 36 Months: Effects of a Financial Work Incentive on Employment and Income (SRDC). 2000. Charles Michalopoulos, David Card, Lisa Gennetian, Kristen Harknett, Philip K. Robins.
The Self-Sufficiency Project at 36 Months: Effects on Children of a Program That Increased Parental Employment and Income (SRDC). 2000. Pamela Morris, Charles Michalopoulos.
When Financial Incentives Pay for Themselves: Interim Findings from the Self-Sufficiency Project’s Applicant Study (SRDC). 2001. Charles Michalopoulos, Tracey Hoy.
SSP Plus at 36 Months: Effects of Adding Employment Services to Financial Work Incentives (SRDC). 2001. Ying Lei, Charles Michalopoulos.
Making Work Pay: Final Report on the Self-Sufficiency Project for Long-Term Welfare Recipients (SRDC). 2002. Charles Michalopoulos, Doug Tattrie, Cynthia Miller, Philip Robins, Pamela Morris, David Gyarmati, Cindy Redcross, Kelly Foley, Reuben Ford.
Mandatory Welfare Employment Programs National Evaluation of Welfare-to-Work Strategies Conceived and sponsored by the U.S. Department of Health and Human Services (HHS), with support from the U.S. Department of Education (ED), this is the largest-scale evaluation ever conducted of different strategies for moving people from welfare to employment. Do Mandatory Welfare-to-Work Programs Affect the
Well-Being of Children? A Synthesis of Child Research Conducted as Part of the National Evaluation of Welfare-to-Work Strategies (HHS/ED). 2000. Gayle Hamilton.
Evaluating Alternative Welfare-to-Work Approaches: Two-Year Impacts for Eleven Programs (HHS/ED). 2000. Stephen Freedman, Daniel Friedlander, Gayle Hamilton, JoAnn Rock, Marisa Mitchell, Jodi Nudelman, Amanda Schweder, Laura Storto.
Impacts on Young Children and Their Families Two Years After Enrollment: Findings from the Child Outcomes Study (HHS/ED). 2000. Sharon McGroder, Martha Zaslow, Kristin Moore, Suzanne LeMenestrel.
What Works Best for Whom: Impacts of 20 Welfare-to-Work Programs by Subgroup (HHS/ED). 2000. Charles Michalopoulos, Christine Schwartz.
Evaluating Two Approaches to Case Management: Implementation, Participation Patterns, Costs, and Three-Year Impacts of the Columbus Welfare-to-Work Program (HHS/ED). 2001. Susan Scrivener, Johanna Walter.
How Effective Are Different Welfare-to-Work Approaches? Five-Year Adult and Child Impacts for Eleven Programs – Executive Summary (HHS/ED). 2001. Gayle Hamilton, Stephen Freedman, Lisa Gennetian, Charles Michalopoulos, Johanna Walter, Diana Adams-Ciardullo, Anna Gassman-Pines, Sharon McGroder, Martha Zaslow, Surjeet Ahluwalia, Jennifer Brooks.
Moving People from Welfare to Work: Lessons from the National Evaluation of Welfare-to-Work Strategies (HHS/ED). 2002. Gayle Hamilton.

-150-
Los Angeles�s Jobs-First GAIN Program An evaluation of Los Angeles�s refocused GAIN (welfare-to-work) program, which emphasizes rapid employment. This is the first in-depth study of a full-scale �work first� program in one of the nation�s largest urban areas. The Los Angeles Jobs-First GAIN Evaluation: First-
Year Findings on Participation Patterns and Impacts. 1999. Stephen Freedman, Marisa Mitchell, David Navarro.
The Los Angeles Jobs-First GAIN Evaluation: Final Report on a Work First Program in a Major Urban Center. 2000. Stephen Freedman, Jean Knab, Lisa Gennetian, David Navarro.
Teen Parents on Welfare Teenage Parent Programs: A Synthesis of the Long-
Term Effects of the New Chance Demonstration, Ohio’s Learning, Earning, and Parenting (LEAP) Program, and the Teenage Parent Demonstration (TPD). 1998. Robert Granger, Rachel Cytron.
Ohio�s LEAP Program An evaluation of Ohio�s Learning, Earning, and Parenting (LEAP) Program, which uses financial incentives to encourage teenage parents on welfare to stay in or return to school.
LEAP: Final Report on Ohio’s Welfare Initiative to Improve School Attendance Among Teenage Parents. 1997. Johannes Bos, Veronica Fellerath.
New Chance Demonstration A test of a comprehensive program of services that seeks to improve the economic status and general well-being of a group of highly disadvantaged young women and their children.
New Chance: Final Report on a Comprehensive Program for Young Mothers in Poverty and Their Children. 1997. Janet Quint, Johannes Bos, Denise Polit.
Parenting Behavior in a Sample of Young Mothers in Poverty: Results of the New Chance Observational Study. 1998. Martha Zaslow, Carolyn Eldred, editors.
Center for Employment Training Replication, This study is testing whether the successful results for youth of a training program developed in San Jose can be replicated in 12 other sites around the country.
Focusing on Fathers Parents’ Fair Share Demonstration A demonstration for unemployed noncustodial parents (usually fathers) of children on welfare. PFS aims to improve the men�s employment and earnings, reduce child poverty by increasing child support payments, and assist the fathers in playing a broader constructive role in their children�s lives.
Fathers’ Fair Share: Helping Poor Men Manage Child Support and Fatherhood (Russell Sage Foundation). 1999. Earl Johnson, Ann Levine, Fred Doolittle.
Parenting and Providing: The Impact of Parents’ Fair Share on Paternal Involvement. 2000. Virginia Knox, Cindy Redcross.
Working and Earning: The Impact of Parents’ Fair Share on Low-Income Fathers’ Employment. 2000. John M. Martinez, Cynthia Miller.
The Responsible Fatherhood Curriculum. 2000. Eileen Hayes, with Kay Sherwood.
The Challenge of Helping Low-Income Fathers Support Their Children: Final Lessons from Parents’ Fair Share. 2001. Cynthia Miller, Virginia Knox
Career Advancement and Wage Progression Opening Doors to Earning Credentials An exploration of strategies for increasing low-wage workers� access to and completion of community college programs. Opening Doors: Expanding Educational Oppor-
tunities for Low-Income Workers. 2001. Susan Golonka, Lisa Matus-Grossman.
Welfare Reform and Community Colleges: A Policy and Research Context. 2002. Thomas Brock, Lisa Matus-Grossman, Gayle Hamilton.
Opening Doors: Students’ Perspectives on Juggling Work, Family, and College. 2002. Lisa Matus-Grossman, Susan Gooden.
Opening Doors: Supporting CalWORKs Students at California Community Colleges: An Exploratory Focus Group Study. 2002. Laura Nelson, Rogéair Purnell.

-151-
Education Reform Career Academies The largest and most comprehensive evaluation of a school-to-work initiative, this study examines a promising approach to high school restructuring and the school-to-work transition. Career Academies: Building Career Awareness and
Work-Based Learning Activities Through Employer Partnerships. 1999. James Kemple, Susan Poglinco, Jason Snipes.
Career Academies: Impacts on Students’ Engagement and Performance in High School. 2000. James Kemple, Jason Snipes.
Career Academies: Impacts on Students’ Initial Transitions to Post-Secondary Education and Employment. 2001. James Kemple.
First Things First This demonstration and research project looks at First Things First, a whole-school reform that combines a variety of best practices aimed at raising achievement and graduation rates in both urban and rural settings. Scaling Up First Things First: Site Selection and the
Planning Year. 2002. Janet Quint.
Closing Achievement Gaps Conducted for the Council of the Great City Schools, this study identifies districtwide approaches to urban school reform that appear to raise overall student performance while reducing achievement gaps among racial groups. Foundations for Success: Case Studies of How
Urban School Systems Improve Student Achievement. 2002. Jason Snipes, Fred Doolittle, Corinne Herlihy.
Project GRAD This evaluation examines Project GRAD, an education initiative targeted at urban schools and combining a number of proven or promising reforms.
Building the Foundation for Improved Student Performance: The Pre-Curricular Phase of Project GRAD Newark. 2000. Sandra Ham, Fred Doolittle, Glee Ivory Holton.
Accelerated Schools This study examines the implementation and impacts on achievement of the Accelerated Schools model, a whole-school reform targeted at at-risk students.
Evaluating the Accelerated Schools Approach: A Look at Early Implementation and Impacts on Student Achievement in Eight Elementary Schools. 2001. Howard Bloom, Sandra Ham, Laura Melton, Julienne O�Brien.
Extended-Service Schools Initiative Conducted in partnership with Public/Private Ventures (P/PV), this evaluation of after-school programs operated as part of the Extended-Service Schools Initiative examines the programs� implemen-tation, quality, cost, and effects on students.
Multiple Choices After School: Findings from the Extended-Service Schools Initiative (P/PV). 2002. Jean Baldwin Grossman, Marilyn Price, Veronica Fellerath, Linda Jucovy, Lauren Kotloff, Rebecca Raley, Karen Walker.
School-to-Work Project A study of innovative programs that help students make the transition from school to work or careers. Home-Grown Lessons: Innovative Programs Linking
School and Work (Jossey-Bass Publishers). 1995. Edward Pauly, Hilary Kopp, Joshua Haimson.
Home-Grown Progress: The Evolution of Innovative School-to-Work Programs. 1997. Rachel Pedraza, Edward Pauly, Hilary Kopp.
Project Transition A demonstration program that tested a combination of school-based strategies to facilitate students� transition from middle school to high school. Project Transition: Testing an Intervention to Help
High School Freshmen Succeed. 1999. Janet Quint, Cynthia Miller, Jennifer Pastor, Rachel Cytron.
Equity 2000 Equity 2000 is a nationwide initiative sponsored by the College Board to improve low-income students� access to college. The MDRC paper examines the implementation of Equity 2000 in Milwaukee Public Schools. Getting to the Right Algebra: The Equity 2000
Initiative in Milwaukee Public Schools. 1999. Sandra Ham, Erica Walker.
Employment and Community Initiatives Jobs-Plus Initiative A multisite effort to greatly increase employment among public housing residents.
Mobilizing Public Housing Communities for Work: Origins and Early Accomplishments of the Jobs-Plus Demonstration. 1999. James Riccio.
Building a Convincing Test of a Public Housing Employment Program Using Non-Experimental Methods: Planning for the Jobs-Plus Demonstration. 1999. Howard Bloom.

-152-
Jobs-Plus Site-by-Site: An Early Look at Program Implementation. 2000. Edited by Susan Philipson Bloom with Susan Blank.
Building New Partnerships for Employment: Collaboration Among Agencies and Public Housing Residents in the Jobs-Plus Demonstration. 2001. Linda Kato, James Riccio.
Making Work Pay for Public Housing Residents: Financial-Incentive Designs at Six Jobs-Plus Demonstration Sites. 2002. Cynthia Miller, James Riccio.
The Special Challenges of Offering Employment Programs in Culturally Diverse Communities: The Jobs-Plus Experience in Public Housing Developments. 2002. Linda Kato.
The Employment Experiences of Public Housing Residents: Findings from the Jobs-Plus Baseline Survey. 2002. John Martinez.
Children in Public Housing Developments: An Examination of the Children at the Beginning of the Jobs-Plus Demonstration. 2002. Pamela Morris, Stephanie Jones.
Jobs-Plus Site-by-Site: Key Features of Mature Employment Programs in Seven Public Housing Communities. 2003. Linda Kato.
Neighborhood Jobs Initiative An initiative to increase employment in a number of low-income communities. The Neighborhood Jobs Initiative: An Early Report
on the Vision and Challenges of Bringing an Employment Focus to a Community-Building Initiative. 2001. Frieda Molina, Laura Nelson.
Structures of Opportunity: Developing the Neighborhood Jobs Initiative in Fort Worth, Texas. 2002. Tony Proscio.
Connections to Work Project A study of local efforts to increase competition in the choice of providers of employment services for welfare recipients and other low-income populations. The project also provides assistance to cutting-edge local initiatives aimed at helping such people access and secure jobs. Designing and Administering a Wage-Paying
Community Service Employment Program Under TANF: Some Considerations and Choices. 1999. Kay Sherwood.
San Francisco Works: Toward an Employer-Led Approach to Welfare Reform and Workforce Development. 2000. Steven Bliss.
Canada’s Earnings Supplement Project A test of an innovative financial incentive intended to expedite the reemployment of displaced workers and encourage full-year work by seasonal or part-year workers, thereby also reducing receipt of unemployment insurance. Testing a Re-Employment Incentive for Displaced
Workers: The Earnings Supplement Project. 1999. Howard Bloom, Saul Schwartz, Susanna Lui-Gurr, Suk-Won Lee.
MDRC Working Papers on Research Methodology A new series of papers that explore alternative methods of examining the implementation and impacts of programs and policies. Building a Convincing Test of a Public Housing
Employment Program Using Non-Experimental Methods: Planning for the Jobs-Plus Demonstration. 1999. Howard Bloom.
Estimating Program Impacts on Student Achievement Using “Short” Interrupted Time Series. 1999. Howard Bloom.
Using Cluster Random Assignment to Measure Program Impacts: Statistical Implications for the Evaluation of Education Programs. 1999. Howard Bloom, Johannes Bos, Suk-Won Lee.
The Politics of Random Assignment: Implementing Studies and Impacting Policy. 2000. Judith Gueron.
Assessing the Impact of Welfare Reform on Urban Communities: The Urban Change Project and Methodological Considerations. 2000. Charles Michalopoulos, Joannes Bos, Robert Lalonde, Nandita Verma.
Measuring the Impacts of Whole School Reforms: Methodological Lessons from an Evaluation of Accelerated Schools. 2001. Howard Bloom.
A Meta-Analysis of Government Sponsored Training Programs. 2001. David Greenberg, Charles Michalopoulos, Philip Robins.
Modeling the Performance of Welfare-to-Work Programs: The Effects of Program Management and Services, Economic Environment, and Client Characteristics. 2001. Howard Bloom, Carolyn Hill, James Riccio.
A Regression-Based Strategy for Defining Subgroups in a Social Experiment. 2001. James Kemple, Jason Snipes.

-153-
Explaining Variation in the Effects of Welfare-to-Work Programs. 2001. David Greenberg, Robert Meyer, Charles Michalopoulos, Michael Wiseman.
Extending the Reach of Randomized Social Experiments: New Directions in Evaluations of American Welfare-to-Work and Employment Initiatives. 2001. James Riccio, Howard Bloom.
Can Nonexperimental Comparison Group Methods Match the Findings from a Random Assignment Evaluation of Mandatory Welfare-to-Work Programs? 2002. Howard Bloom, Charles Michalopoulos, Carolyn Hill, Ying Lei.
Using Instrumental Variables Analysis to Learn More from Social Policy Experiments. 2002. Lisa Gennetian, Johannes Bos, Pamela Morris.
Using Place-Based Random Assignment and Comparative Interrupted Time-Series Analysis to Evaluate the Jobs-Plus Employment Program for Public Housing Residents. 2002. Howard Bloom, James Riccio.

About MDRC
MDRC is a nonprofit, nonpartisan social policy research organization. We are dedicated to learning what works to improve the well-being of low-income people. Through our research and the active communication of our findings, we seek to enhance the effectiveness of social policies and programs. MDRC was founded in 1974 and is located in New York City and Oakland, California.
MDRC�s current projects focus on welfare and economic security, education, and employment and community initiatives. Complementing our evaluations of a wide range of welfare reforms are new studies of supports for the working poor and emerging analyses of how programs affect children�s development and their families� well-being. In the field of education, we are testing reforms aimed at improving the performance of public schools, especially in urban areas. Finally, our community projects are using innovative approaches to increase employment in low-income neighborhoods.
Our projects are a mix of demonstrations ― field tests of promising program models ― and evaluations of government and community initiatives, and we employ a wide range of methods to determine a program�s effects, including large-scale studies, surveys, case studies, and ethnographies of individuals and families. We share the findings and lessons from our work ― including best practices for program operators ― with a broad audience within the policy and practitioner community, as well as the general public and the media.
Over the past quarter century, MDRC has worked in almost every state, all of the nation�s largest cities, and Canada. We conduct our projects in partnership with state and local governments, the federal government, public school systems, community organizations, and numerous private philanthropies.