workings of the johannesburg stock exchange - jse · nse (kenya) sem casablanca bourse (morocco)...
TRANSCRIPT

Workings of the Johannesburg Stock Exchange Waldemar Budeli

From small beginnings…
200920062004200320022001199619631887
JSE established
Member of World Federation of Exchanges
SAFEX acquired by the exchange
JSE adopts London Stock Exchange's trading technology
AltX launched with DTI
SRI Index launched
JSE Ltd lists on the Main Board
Bond market incorporated into the exchange
The World Federation of Exchanges is an association of 58 publicly regulated exchanges
Open outcry floor replaced with automated trading system
19782001
2014

The exchange value chain
LISTING
TRADING
CLEARING
SETTLEMENT
Interest Rate Products
Commodity DerivativesEquitiesEquity
Derivatives
Market SurveillanceInformation Products

Regulatory Framework
• SARB: Banking Financial Services SectorBanksBuilding Societies
• FSB: Non Banking Financial Services Sectors ‐Capital MarketsInsurance HousesRetirement FundsCollective Investment SchemesFriendly Societies

www.jse.co.za
JSE in the global context – August 2014
0
50
100
150
200
250
300
350
0 1000 2000 3000 4000 5000 6000
Liqu
idity
%
Number of listed companies
Istanbul SE
Shenzhen SE
NYSE Group
Tokyo SE Group
Bombay SE
TMX Group
London SE Group
Hong Kong Exchanges
ASX
NSE India
Shanghai SE
DeutscheBörse
Egypt SEJSE
BM&FBOVESPA
OMX Nordic

JSE in the African context
• JSE dominates in terms of size, depth and liquidity (Mcap = $1.03 trillion)
• Nigerian Exchange MCap = $81.2bn
• Egyptian Exchange MCap= $73.4bn
• Casablanca MCap= $55.4bn
*African Alliance & WFE stats
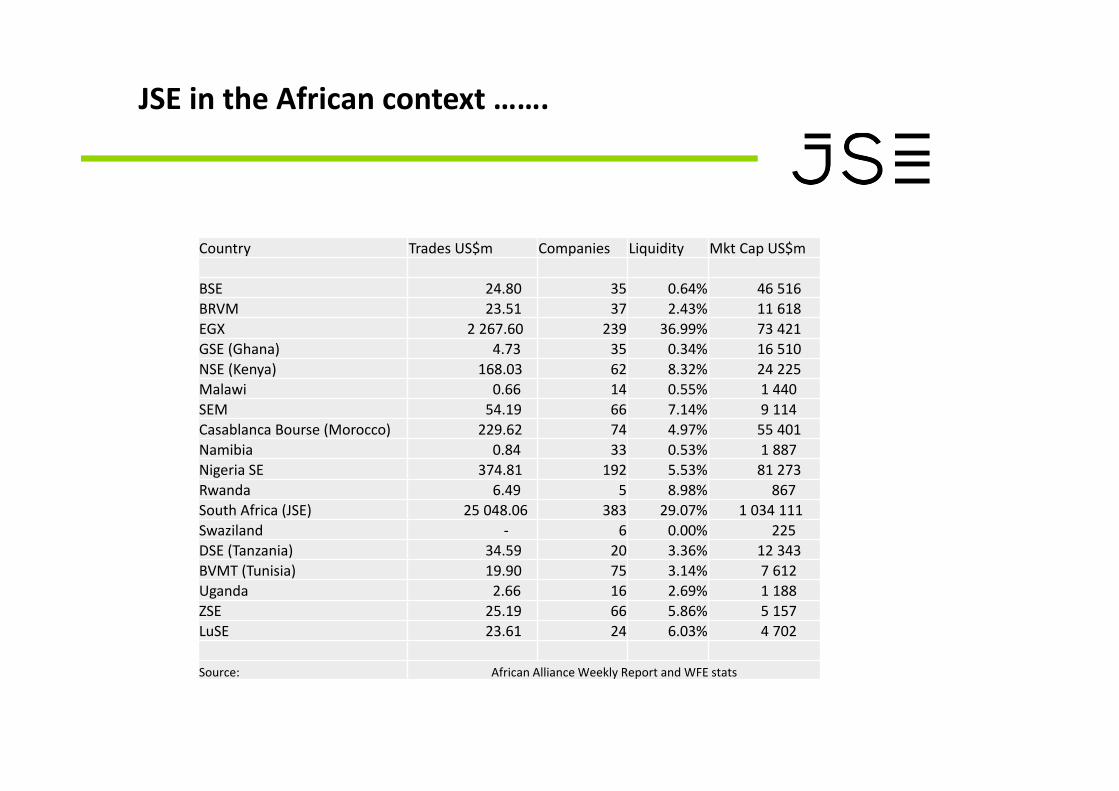
JSE in the African context …….
Country Trades US$m Companies Liquidity Mkt Cap US$m
BSE 24.80 35 0.64% 46 516 BRVM 23.51 37 2.43% 11 618 EGX 2 267.60 239 36.99% 73 421 GSE (Ghana) 4.73 35 0.34% 16 510 NSE (Kenya) 168.03 62 8.32% 24 225 Malawi 0.66 14 0.55% 1 440 SEM 54.19 66 7.14% 9 114 Casablanca Bourse (Morocco) 229.62 74 4.97% 55 401 Namibia 0.84 33 0.53% 1 887 Nigeria SE 374.81 192 5.53% 81 273 Rwanda 6.49 5 8.98% 867 South Africa (JSE) 25 048.06 383 29.07% 1 034 111 Swaziland ‐ 6 0.00% 225 DSE (Tanzania) 34.59 20 3.36% 12 343 BVMT (Tunisia) 19.90 75 3.14% 7 612 Uganda 2.66 16 2.69% 1 188 ZSE 25.19 66 5.86% 5 157 LuSE 23.61 24 6.03% 4 702
Source: African Alliance Weekly Report and WFE stats

% of African MCap: Aug 2014
3.4%0.8%
5.3%
1.2%1.7%
0.7%
4.0%
5.9%
74.7%
0.9% 0.5% 0.4% 0.3% 0.1% 0.1%BSE
BRVM
EGX
GSE (Ghana)
NSE (Kenya)
SEM
Casablanca Bourse(Morocco)Nigeria SE
JSE (South Africa)
DSE (Tanzania)
BVMT (Tunisia)
ZSE
% of A
frican
MCa
p (US$)
Source: African Alliance & WFE
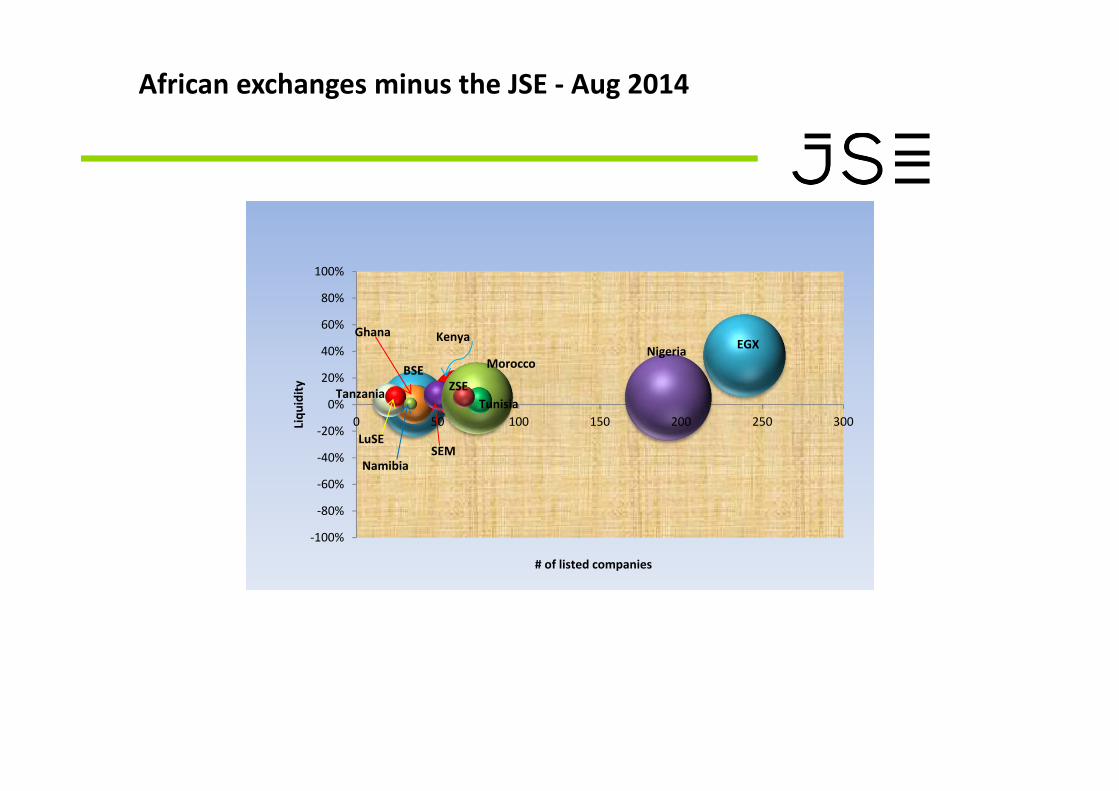
African exchanges minus the JSE ‐ Aug 2014
‐100%
‐80%
‐60%
‐40%
‐20%
0%
20%
40%
60%
80%
100%
0 50 100 150 200 250 300Liqu
idity
# of listed companies
EGXNigeriaGhana Kenya
SEM
BSE
Namibia
TunisiaTanzania
LuSE
Morocco
ZSE

JSE in global context ‐ Aug 2014
0%
50%
100%
150%
200%
250%
300%
350%
400%
450%
0 1 000 2 000 3 000 4 000 5 000 6 000 7 000
Liqu
idity
# of Listed Companies
TMX Group
NYSE Euronext
NASDAQ
LSE
Japan Exchange Group
ASX
Shenzhen SE
NSE India
HKEX
Shanghai SE
D‐Borse
SGX
BM&F Bov
JSEBombay SEBME ‐
Spanish Exc
Korea ExcTaiwan
SIX Swiss
Moscow

Companies & Securities
Companies Listed – 384 Foreign Listings – 59 Domestic ‐ 325 New Listings – 15 Delistings ‐ 20 Alternative Exchange Companies – 62 Number of Securities Listed – 876 Market Cap – 11 108 911 (Rm)

Why do companies issue stock
• Transition from private‐to‐public company• Initial Public Offering (IPO)• Primary & Secondary markets• Capital is raised to expand business interests

The Role of the Stock Market
Benefits for Corporations• Raising Capital
Benefits for investors• Improved returns
Benefits for the economy• Channelling people’ savings to work• Measure of the economy’ performance• Corporate Governance• Access to funds for Governments

Top40 Companies
British American 1 237 026 664 233.18
SABMiller plc 983 379 214 764.97
BHP Billiton plc 613 127 949 007.08
Naspers Ltd ‐N‐ 496 211 863 210.00
Richemont 461 709 000 000.00
MTN Group Ltd 436 008 670 656.21
Sasol Limited 357 763 248 623.82
Anglo American plc 329 638 427 193.60
Firstrand Ltd 230 028 020 911.20
Standard Bank Group Ltd 206 323 620 435.00
Vodacom Group Ltd 187 199 492 740.00
Aspen Pharmacare 154 880 129 972.43
Old Mutual plc 149 447 176 049.61
Sanlam Limited 133 021 368 888.40
Barclays Africa Grp 130 977 479 905.50
Steinhoff Int Hldgs 129 758 706 503.00
Remgro Ltd 108 268 177 504.80
Nedbank Group Ltd 107 190 651 162.90
Anglo American Plat 95 871 910 473.00
21) Bidvest Ltd 92 902 415 585.05 22) Kumba Iron 85 945 421 302.16 23) Shoprite 77 687 166 495.60 24) Mediclinic 76 250 051 001.25 25) RMB Holdings 75 963 750 160.58 26) Intu Properties 73 385 014 840.16 27) Woolworths 69 899 766 678.00 28) Mondi plc 62 743 091 534.25 29) Tiger Brands 59 897 457 029.40 30) Investec plc 55 802 285 107.12 31) Growthpoint 55 709 028 343.20 32) Discovery Ltd 54 274 698 163.00 33) Impala Platinum 53 358 884 894.40 34) Mr Price Group 50 578 383 459.12 35) Anglogold 48 709 149 091.40 36)Capital&Counties 47 900 098 992.60 37) Reinet Inv 46 927 937 997.00 38) Life Healthc Grp 44 721 220 372.50 39) Exxaro 44 356 186 449.30 40) Imperial 35 879 389 755.45 41) Assore Ltd 31 538 617 370.00 42) Investec Ltd 26 151 713 976.96 43 Mondi Ltd 20 251 631 930.75

Top 40 Constituents
15

Some of the Mid caps Constituents
16

Some of the Small caps Constituents
17

www.jse.co.za
What influences the market?
The Market
Local Economy
Politics
Company related
happenings
Commodity Prices
InternationalMarkets
International Economies

www.jse.co.za
How does a person trade on the JSE?
SellerBuyerStockbroker
Stockbrokers are members of the stock exchange who act on behalf of clients to buy or
sell their shares.
To get a list of the stockbrokers visit our websitewww.jse.co.za

Investing/trading on the JSE
Buyer Stockbroker
Stockbrokers are members of the stock exchange who act on behalf of clients to buy or
sell their shares.
To get a list of the stockbrokers visit our websitewww.jse.co.za
JSE

How do I gain access to the Stock Market?

How do I gain access to the Stock Market?
www.jse.co.za

How do I gain access to the Stock Market?www.jse.co.za

JSE FREE 30 day Simulator
www.jse.co.za/jsevirtualtrader24

Marketing & Corporate ServicesRetail Development
(011) 520 7125(011) 520 7127(011) 520 7128(011) 520 7129
email: [email protected]@jse.co.za
www.jse.co.zaFacebook & Twitter