workplace flexibility among professional employees - families and
TRANSCRIPT
ACKNOWLEDGMENTS
First, we give special thanks to the Alfred P. Sloan Foundation and the Ford Foundation for supporting this report. We are deeply grateful to Kathleen Christensen from the Sloan Foun-dation and to Helen Neuborne and Anna Wadia from the Ford Foundation for their deep commitment to the issues of workplace flexibility and to employees, especially those who are least advantaged. Their wise counsel has affected our work and this report in countless and invaluable ways.
Heartfelt thanks to the incomparable Sara Manzano-Diaz, Director of the Women’s Bureau, and to her talented and committed staff for offering us the opportunity to share this research at the National Dialogue on Workplace Flexibility.
Next, we thank the many researchers who have used previous National Study of the Chang-ing Workforce public-use files (1992, 1997 and 2002) in their own research for providing helpful feedback and creative suggestions for improving this study. A special thanks to Marcie Pitt- Cat-souphes of Boston College, Shelley MacDermid Wadsworth of Purdue University, Chiung Ya Tang of Penn State Shenango, Chai Feldblum of the Equal Employment Opportunity Commis-sion and Katie Corrigan of Workplace Flexibility 2010 at Georgetown Law for their very helpful feedback on the questions we asked about flexibility. In addition, we thank the many employers involved in When Work Works for their feedback on the National Study of Employers.
We also want to thank the management and staff of Harris Interactive Inc. for their extraordi-nary efforts in carrying out the interviews for the National Study of the Changing Workforce. Year by year, telephone research becomes increasingly challenging for those requiring sci-entifically valid samples. To ensure high quality data, the Harris staff went above and beyond the call of duty and their contract terms. In particular, we want to acknowledge the outstand-ing efforts of David Krane, Vice President, Public Affairs and Policy Research; Kaylan Orkis, Senior Project Researcher; and Humphrey Taylor, Chairman of The Harris Poll.
We also thank Harris Interactive Inc. for conducting the interviews for the National Study of Employers, especially Linda Crane, Research Manager, who directed this very complex project with expertise. And as always, our thanks to Dana Markow, Vice President.
Finally, our thanks to the staff members of Families and Work Institute (FWI) who have sup-ported this work in so many ways. We thank Lois Backon, Senior Vice President, for her lead-ership at FWI; Kenneth Matos, Senior Research Associate, Kerstin Aumann, Senior Research Associate, Tyler Wigton, Program Manager and Kelly Sakai, Program Manager, for their bril-liant guidance; John Boose for his stunning design of the report and Barbara Norcia-Broms for her exemplary proof reading. We also thank Carol Bryce-Buchanan and Marline Griffith for their support throughout the entire process and guidance for the dissemination of the find-ings. Special thanks as well to Morra Aarons-Mele of Women Online for working with us on the dissemination of our research with such great knowledge and skill.
Workplace Flexibility Among Professional Employees Copyright © 2011, Families and Work Institute www.familiesandwork.org
i
TABLE OF CONTENTS PAGE
Introduction 1
The Need for Workplace Flexibility 1
How do the Demographic Backgrounds of Professional and Non-Professional Employees Differ? 2
How do Professional Employees Compare with Non-Professional Employees in Their Access to Workplace Flexibility? 4
How do Professionals View Their Work Arrangements? 6
The Culture of Flexibility 7
Views of Job and Career Outcomes 8
Do Employers Benefit from Offering More Effective and Flexible Workplaces? 10
Case Studies of Professionals Working Flexibly 13
Conclusion 15
Endnotes 16
ii
LIST OF TABLES PAGE
Table 1 Basic Demographic Characteristics of Professional and Non-Professional Employees 3
Table 2 Access to Workplace Flexibility 5
Table 3 Views of Workplace Flexibility 6
Table 4 Culture of Flexibility 8
Table 5 Views of Job and Career Outcomes 10
Table 6 Effects of Offering Flexible Work Options 12

1
IntroductIon
Workplace flexibility allows employees to influence when, where and how much they work over the course of their careers so they can better accomplish their professional and personal goals. In addition, flexibility helps employers recruit, develop, engage and retain talent so that their businesses can thrive.
It is clear from our thirty-year history in conducting research on the changing workforce and workplace that professional employees have historically had greater access to workplace flexibility than non-professional employees.1 However, an in-depth exploration of flexibility among a nationally representative group of professional employees has not been conducted to date.
In this report, we compare the workplace flexibility options available to professional em-ployees with those available to all other employees in the U.S. workforce. We examine how professionals view working flexibly and highlight differences in demographics and job struc-tures that may account for the ways in which professionals see and use workplace flexibility options. In addition, we explore significant differences in the flexible work experiences of professional employees by generation.
The research findings presented here are drawn from the 2008 National Study of the Chang-ing Workforce (NSCW)2 conducted by the Families and Work Institute. The survey sample is representative of the entire workforce in the United States.3 This report looks only at wage and salaried employees (N=2,311); 540 of whom we classify as “professional” employees4 be-cause their primary work responsibilities include the provision of financial, legal or other tech-nical or scientific advice or services. The responsibilities associated with professional occupa-tions generally require a degree of expertise attained through post-secondary school training/education and/or extensive experience in the relevant field. The remaining 1771 respondents are employed in “non-professional” positions. In this report, we compare professionals with non-professionals in the wage and salaried workforce. When discussing the generations, we divide employees into four groups: Millennials (less than 28 years old), Gen X (28-42 years old), Boomers (43-61 years old) and Matures (62 years and older).
The questionnaire used to collect data is the National Study of the Changing Workforce, the ongoing nationally representative study conducted by the Families and Work Institute. Among other data on the workforce, this study is designed to capture information about the practices of employees around access to, use of, and demand for numerous types of workplace flex-ibility, whether these options are formalized in policy or not. These practices determine what flexibility is actually available to employees and whether there is any jeopardy associated with utilizing it. In addition, we provide promising practices of flexibility for professional employ-ees drawn from winners of the Sloan Awards for Business Excellence in Workplace Flexibility from When Work Works, a project of the Families and Work Institute (FWI) and Society for Human Resource Management (SHRM).
the need for Workplace flexIbIlIty
We find that the majority of American employees feel deprived of time for themselves and for the important people in their lives. For example, the majority (75%) of employed parents—professionals and non-professionals alike—feel they don’t have enough time to spend with their children. Yet professionals may experience greater pressure on their personal and rela-tionship time than other employees, as revealed by the following findings:
2
• Professionalsincouplerelationshipsaremorelikely(68%)tofeeltheydon’thaveenoughtime with their husbands, wives or partners than non-professional employees (61%).
• Likewiseprofessionalsaremorelikely(65%)toreportnothavingenoughtimeforthemselves than non-professional employees (58%).
This sense of time deprivation is especially pronounced among younger professionals (Gen X and Millennials) who are consistently more likely to report insufficient time to spend with their loved ones.
• Amongprofessionalswithchildrenunder6athome,youngeremployeesaremorelikelyto report they don’t have enough time to spend with their children than older professionals (Millennials 89%; Gen X 81%; Boomers 63%).5
• Amongprofessionalsincouplerelationships,Millennials(86%)andGenX(72%)employees are more likely to feel they don’t have enough time with their husbands, wives or partners than Boomers (62%) and Mature professionals (44%).
• LikewiseMillennials(67%)andGenX(71%)professionalsaremorelikelytoreportnothaving enough time for themselves than Boomers (60%) and Mature professionals (44%).
If, as it appears, the majority of professionals, especially younger ones, are experiencing what we term a “time famine,” the desire for workplace flexibility must be widespread. And indeed, a large majority of employees—87% of professional and non-professional employees alike—report that having the flexibility they need to manage work and personal or family life would be “extremely” or “very” important if they were looking for a new job. When considering generational differences we find that professionals in the Gen X (86%), Boomer (85%) and Ma-ture (84%) generations are very similar to the average. Millennials, however, stand out with 93% reporting that having such flexibility would be “extremely” or “very” important if they were looking for a new job.
hoW do the demographIc backgrounds of professIonal and non-professIonal employees dIffer?
The demographic backgrounds of professionals and non-professionals differ in several ways as shown in Table 1.
Professionals are more likely than other non-professional employees to:
• befemale(54%versus45%);
• beWhite(75%versus65%);
• haveafouryeardegreeormore(72%versus14%);
• bemarried(77%versus61%);
• beparentswithchildrenunder18athome(67%versus61%);
• havearegulardaytimeshift(83%versus69%);and
• havehighermedian6 full-time wages ($25.00 per hour) than non-professionals ($15.00 per hour).

3
In fact, the overall median value for the hourly wages of professional employees ($24.31) is significantly higher than the median value for non-professional employees ($13.58). This holds true for both full and part-time employees.
Professional employees also tend to have longer tenures with 53% having been with their cur-rent employer for 5 years or more compared with 40% of non-professional employees.
On the other hand professionals are less likely than non-professional employees to:
• beunder30yearsold(15%versus29%);
• havehourlyjobs(15%versus21%);and
• havepart-timejobs(45%versus83%).
Table 1: Basic Demographic Characteristics of Professional and Non-Professional Employees7
Basic Demographics Occupational Group Sig.
Professional Employees
(n=540)
Non-Professional Employees
(n=1771)
GenderMaleFemale
46%54%
55%45%
***
Race/ethnicity:White, non-HispanicBlack, non-HispanicHispanicOther
75% 8% 13% 4%
65% 13% 15%
7%
***
Age:Under 30 years old30-39 years old40-49 years old50 or more years old
15%28%26%32%
29%22%23%27%
***
Highest level of education completed:High school or lessSome post-secondary4-year college degree or more
9%19%72%
53%33%14%
***
% married or living with someone as a couple 77% 61% ***
% with any children under 18 at home 67% 61% *
% with regular daytime schedule/shift 83% 69% ***
% with part-time jobs 15% 21% **
% paid by the hour 45% 83% ***
Median hourly wageOverallFull-timePart-time
$24.31$25.00$19.32
$13.58$15.00$9.00
*********
TenureLess than a year1-5 yearsMore than 5 years
7%40%53%
16%44%40%
**
Statistical significance: * = p < .05; ** = p<.01; *** = p < .001; ns = not statistically significant. SOURCE: 2008 National Study of the Changing Workforce, Families and Work Institute
4
hoW do professIonal employees compare WIth non-professIonal employees In theIr access to Workplace flexIbIlIty?
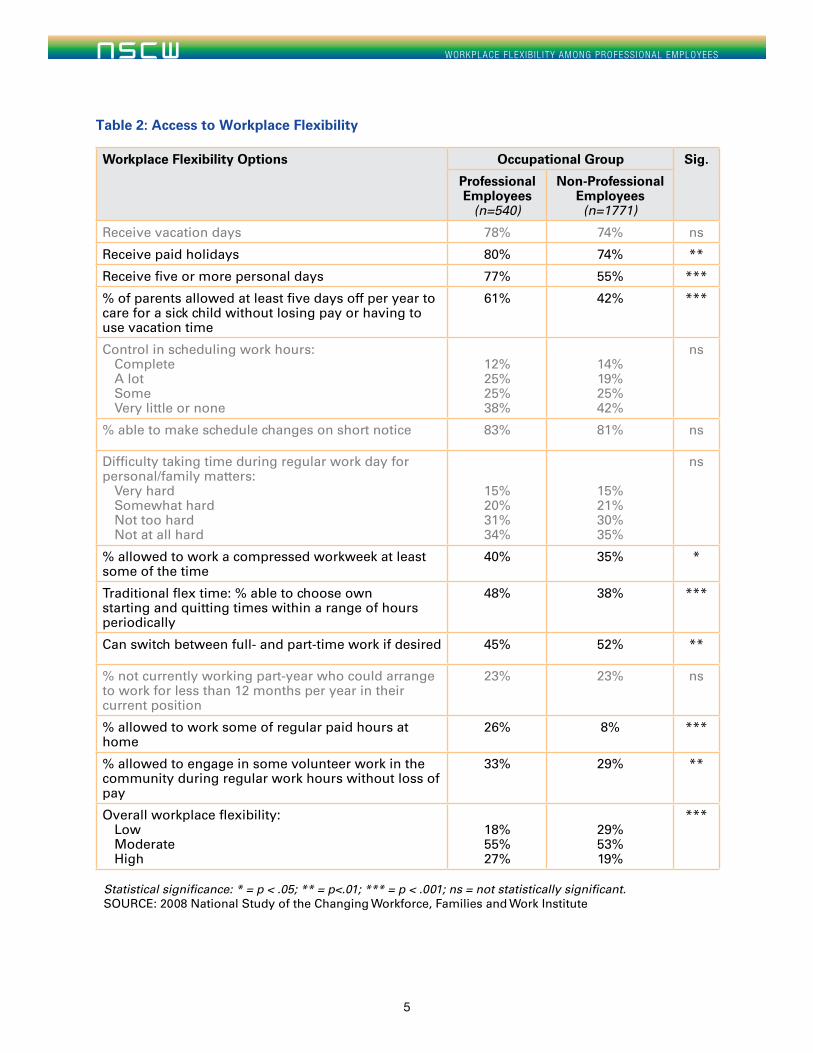
Overall, professional employees have greater access to workplace flexibility than other em-ployees. For example, 27% of professionals have a high level of overall flexibility compared with 19% of non-professionals, as shown in Table 2.
Professional employees are more likely than non-professional employees to have access to:
• paidholidays(80%versus74%);
• 5ormorepersonaldays(77%versus55%);
• 5ormoredaystocareforasickchild(61%versus42%);
• theabilitytoworkacompressedworkweek(40%versus35%);
• traditionalflex-time(48%versus38%);
• theabilitytoworksomeregularpaidhoursathome(26%versus8%);and
• theabilitytoengageinvolunteerworkduringregularworkhourswithoutlossofpay(33%versus 29%).
Professionals are less likely than non-professionals to indicate they can move between full and part-time work (45% versus 52%).
Access to flexibility options does not differ between professionals in different generations.
Perhaps surprisingly, professionals are not more likely to indicate that they have more control over their schedules or less difficulty taking time for personal matters than non-professionals, despite a general consensus that professionals have more freedom to do as they wish than non-professional employees. This may be due to the constraints and demands of their jobs and/or the various industries in which the professionals work. For example, professionals who work in professional services organizations8 have more control over their schedules and less difficulty taking time for personal matters than professionals in other industries.9 So while professional level employees on the whole have greater access to flexibility options than non-professionals, the extent of this difference depends on other factors as well.
5
Table 2: Access to Workplace Flexibility
Workplace Flexibility Options Occupational Group Sig.
Professional Employees
(n=540)
Non-Professional Employees
(n=1771)
Receive vacation days 78% 74% ns
Receive paid holidays 80% 74% **
Receive five or more personal days 77% 55% ***
% of parents allowed at least five days off per year to care for a sick child without losing pay or having to use vacation time
61% 42% ***
Control in scheduling work hours:CompleteA lotSomeVery little or none
12%25%25%38%
14%19%25%42%
ns
% able to make schedule changes on short notice 83% 81% ns
Difficulty taking time during regular work day for personal/family matters:
Very hardSomewhat hardNot too hardNot at all hard
15%20%31%34%
15%21%30%35%
ns
% allowed to work a compressed workweek at least some of the time
40% 35% *
Traditionalflextime:%abletochooseownstarting and quitting times within a range of hours periodically
48% 38% ***
Can switch between full- and part-time work if desired 45% 52% **
% not currently working part-year who could arrange to work for less than 12 months per year in their current position
23% 23% ns
% allowed to work some of regular paid hours at home
26% 8% ***
% allowed to engage in some volunteer work in the community during regular work hours without loss of pay
33% 29% **
Overallworkplaceflexibility:LowModerateHigh
18%55%27%
29%53%19%
***
Statistical significance: * = p < .05; ** = p<.01; *** = p < .001; ns = not statistically significant. SOURCE: 2008 National Study of the Changing Workforce, Families and Work Institute
6
hoW do professIonals VIeW theIr Work arrangements?
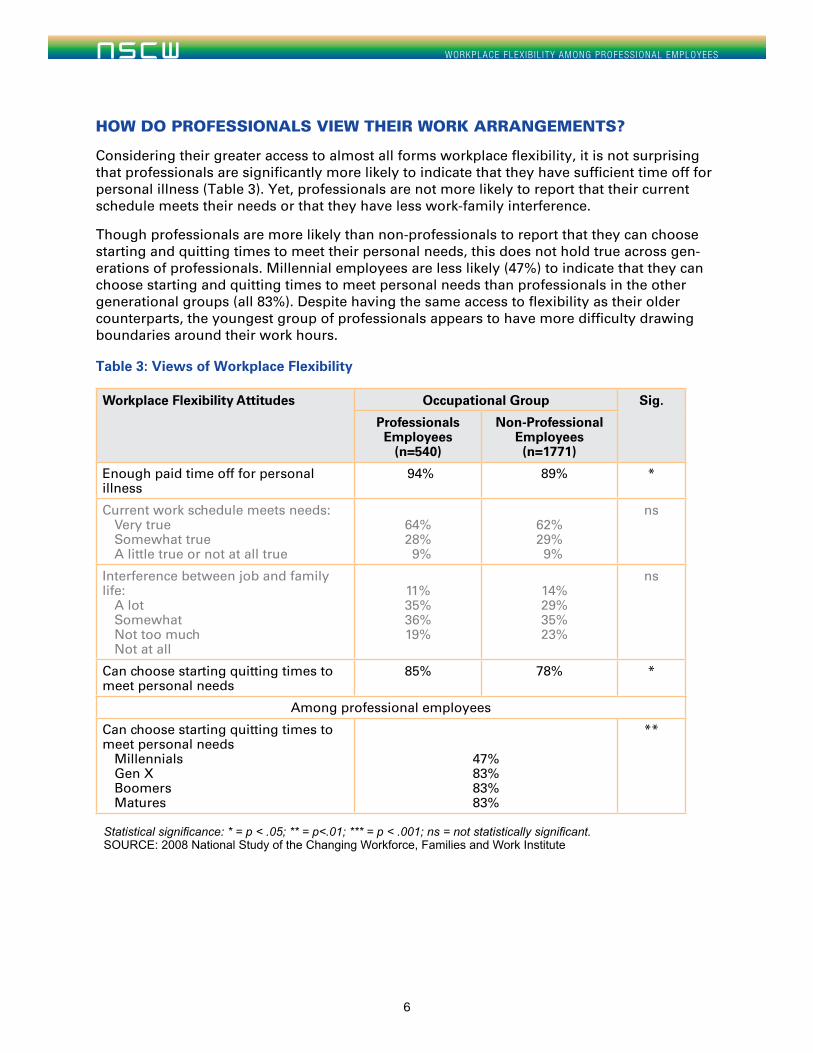
Considering their greater access to almost all forms workplace flexibility, it is not surprising that professionals are significantly more likely to indicate that they have sufficient time off for personal illness (Table 3). Yet, professionals are not more likely to report that their current schedule meets their needs or that they have less work-family interference.
Though professionals are more likely than non-professionals to report that they can choose starting and quitting times to meet their personal needs, this does not hold true across gen-erations of professionals. Millennial employees are less likely (47%) to indicate that they can choose starting and quitting times to meet personal needs than professionals in the other generational groups (all 83%). Despite having the same access to flexibility as their older counterparts, the youngest group of professionals appears to have more difficulty drawing boundaries around their work hours.
Table 3: Views of Workplace Flexibility
Workplace Flexibility Attitudes Occupational Group Sig.
Professionals Employees
(n=540)
Non-Professional Employees
(n=1771)
Enough paid time off for personal illness
94% 89% *
Current work schedule meets needs:Very trueSomewhat trueA little true or not at all true
64%28% 9%
62%29% 9%
ns
Interference between job and family life:
A lotSomewhatNot too muchNot at all
11%35%36%19%
14%29%35%23%
ns
Can choose starting quitting times to meet personal needs
85% 78% *
Among professional employees
Can choose starting quitting times to meet personal needs
MillennialsGen XBoomersMatures
47%83%83%83%
**
Statistical significance: * = p < .05; ** = p<.01; *** = p < .001; ns = not statistically significant. SOURCE: 2008 National Study of the Changing Workforce, Families and Work Institute
7
the culture of flexIbIlIty
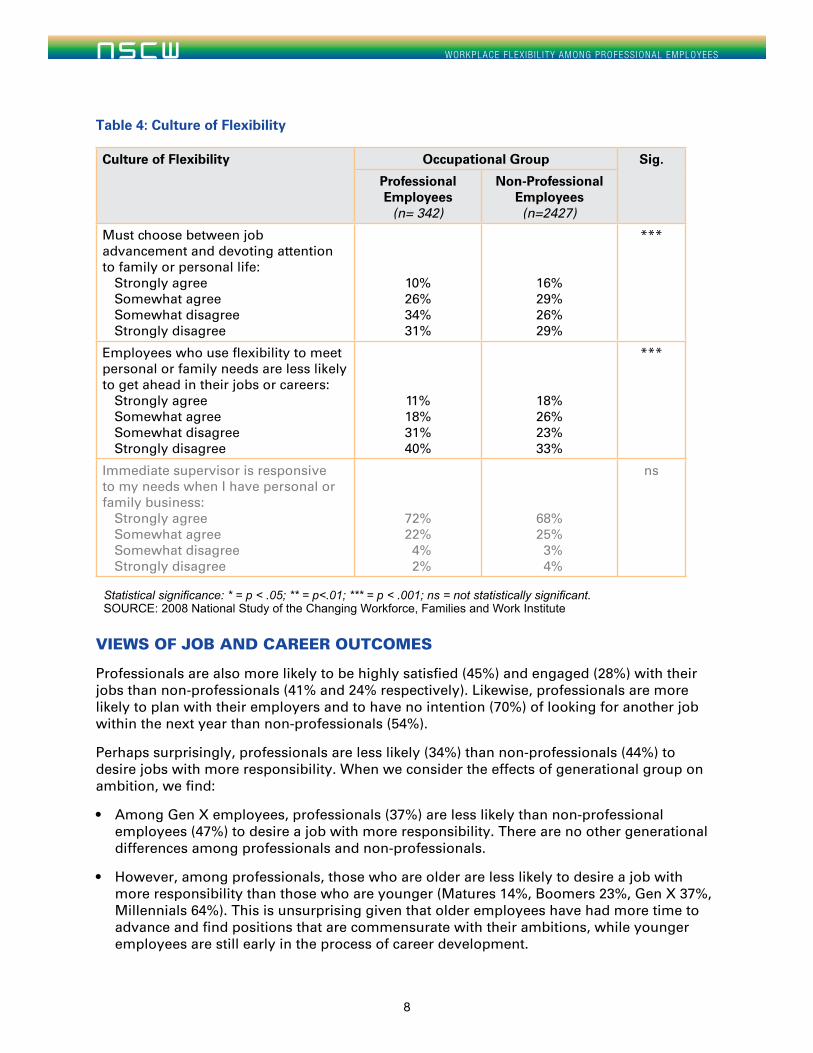
Employees will not reap many benefits from workplace flexibility if they feel they live in a non-supportive culture where they will be penalized for making use of these options. Not surprisingly, professional employees report being in a more supportive culture and are more likely than non-professional employees to disagree with the following statements than non-professionals (Table 4):
• Employeesmustchoosebetweenjobadvancementanddevotingattentiontofamilyorpersonal life (65% versus 55%)
• Employeeswhouseflexibilitytomeetpersonalorfamilyneedsarelesslikelytogetaheadin their jobs or careers (71% versus 56%)
On the other hand, professional employees are not more or less likely than non-professional employees to agree that their immediate supervisor is responsive to their needs when they have personal or family business.
It appears that professional employees feel less concern over their ability to be seen as valued employees while taking advantage of the flexibility opportunities afforded them. The lack of difference in supervisor support between the two groups may indicate that the greater jeopar-dy fears of non-professional employees are associated with other organizational factors than their immediate supervisors (e.g., support from more senior leaders, inflexible advancement or reward systems or job constraints that make using flexibility more difficult).
No differences were found among professional employees by generational group.
8
Table 4: Culture of Flexibility
Culture of Flexibility Occupational Group Sig.
Professional Employees
(n= 342)
Non-Professional Employees(n=2427)
Must choose between job advancement and devoting attention to family or personal life:
Strongly agreeSomewhat agreeSomewhat disagreeStrongly disagree
10%26%34%31%
16%29%26%29%
***
Employeeswhouseflexibilitytomeetpersonal or family needs are less likely to get ahead in their jobs or careers:
Strongly agreeSomewhat agreeSomewhat disagreeStrongly disagree
11%18%31%40%
18%26%23%33%
***
Immediate supervisor is responsive to my needs when I have personal or family business:
Strongly agreeSomewhat agreeSomewhat disagreeStrongly disagree
72%22% 4% 2%
68%25% 3% 4%
ns
Statistical significance: * = p < .05; ** = p<.01; *** = p < .001; ns = not statistically significant. SOURCE: 2008 National Study of the Changing Workforce, Families and Work Institute
VIeWs of Job and career outcomes
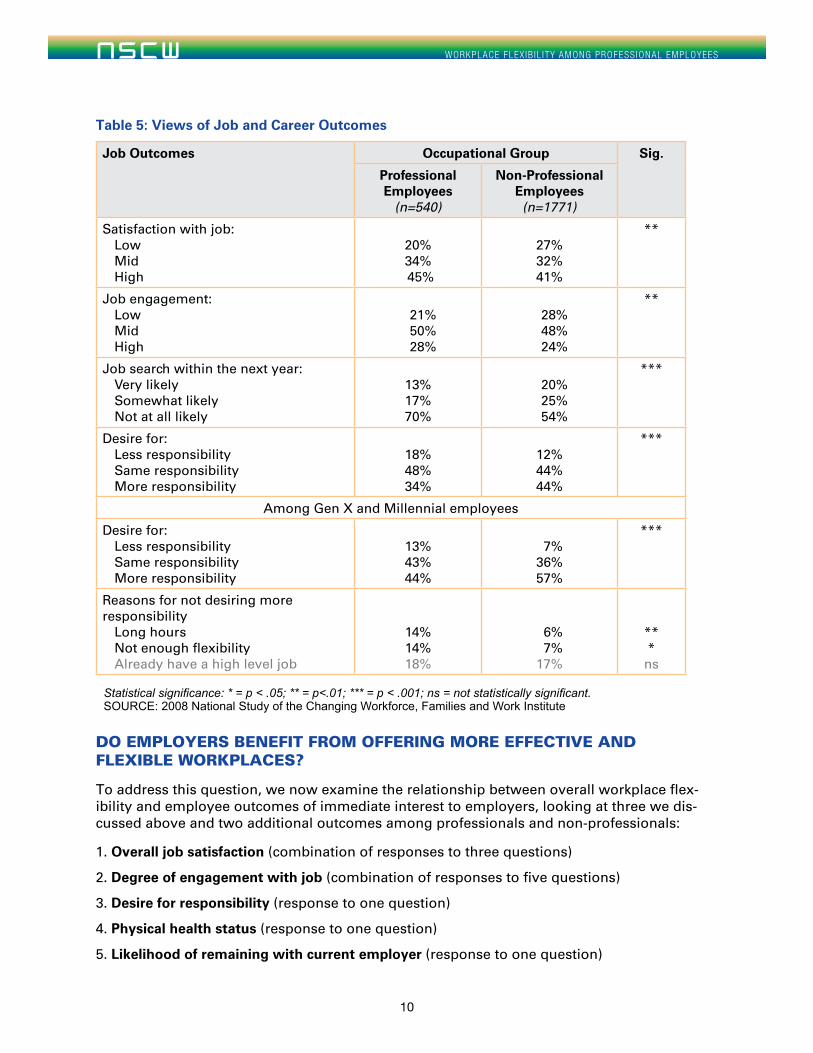
Professionals are also more likely to be highly satisfied (45%) and engaged (28%) with their jobs than non-professionals (41% and 24% respectively). Likewise, professionals are more likely to plan with their employers and to have no intention (70%) of looking for another job within the next year than non-professionals (54%).
Perhaps surprisingly, professionals are less likely (34%) than non-professionals (44%) to desire jobs with more responsibility. When we consider the effects of generational group on ambition, we find:
• AmongGenXemployees,professionals(37%)arelesslikelythannon-professionalemployees (47%) to desire a job with more responsibility. There are no other generational differences among professionals and non-professionals.
• However,amongprofessionals,thosewhoareolderarelesslikelytodesireajobwithmore responsibility than those who are younger (Matures 14%, Boomers 23%, Gen X 37%, Millennials 64%). This is unsurprising given that older employees have had more time to advance and find positions that are commensurate with their ambitions, while younger employees are still early in the process of career development.
9
The fact that only 37% of Gen X employees want positions with more responsibility is a dis-tressing finding given that professional employees are often looked to as a good pool from which to recruit future leaders and the Gen X employees are the next generation in line to assume many leadership roles as the Boomers begin to retire.
In order to identify some of the reasons why employees may be less likely to want to advance, the NSCW asked respondents who did not desire jobs with more responsibility why not. At first glance there appears to be no discernable reason for this difference in ambitions among generational groups and among professionals and non-professionals. Yet when we restrict our analysis to employees 42 years old and younger, we do find some important differences. Among Gen X and Millennial employees who don’t desire more responsibility, professionals are more likely to cite long hours and insufficient flexibility to manage work and personal lives (both 14%) than non-professionals (6% and 7% respectively).
Given our data at this point in time, it is impossible to determine whether Gen X employees represent an anomaly or the beginning of a new perspective on job responsibility. Since Millennial employees have the least tenure of any generational group, they may retain high ambitions as a result of being at the bottom of most organizational hierarchies. It is possible that as they gain experience in the workforce they, too, will begin to lose interest in acquiring more responsibility in their jobs. It will be important to watch the progress of both Gen X and Millennial professionals to understand the meaning of this potential new trend.
10
Table 5: Views of Job and Career Outcomes
Job Outcomes Occupational Group Sig.
ProfessionalEmployees
(n=540)
Non-Professional Employees
(n=1771)
Satisfaction with job:LowMidHigh
20%34%45%
27%32%41%
**
Job engagement:Low MidHigh
21%50%28%
28%48%24%
**
Job search within the next year:Very likelySomewhat likelyNot at all likely
13%17%70%
20%25%54%
***
Desire for:Less responsibility Same responsibilityMore responsibility
18%48%34%
12%44%44%
***
Among Gen X and Millennial employees
Desire for:Less responsibility Same responsibilityMore responsibility
13%43%44%
7%36%57%
***
Reasons for not desiring more responsibility
Long hoursNotenoughflexibilityAlready have a high level job
14%14%18%
6% 7%17%
***ns
Statistical significance: * = p < .05; ** = p<.01; *** = p < .001; ns = not statistically significant. SOURCE: 2008 National Study of the Changing Workforce, Families and Work Institute
do employers benefIt from offerIng more effectIVe and flexIble Workplaces?
To address this question, we now examine the relationship between overall workplace flex-ibility and employee outcomes of immediate interest to employers, looking at three we dis-cussed above and two additional outcomes among professionals and non-professionals:
1. Overall job satisfaction (combination of responses to three questions)
2. Degree of engagement with job (combination of responses to five questions)
3. Desire for responsibility (response to one question)
4. Physical health status (response to one question)
5. Likelihood of remaining with current employer (response to one question)
11
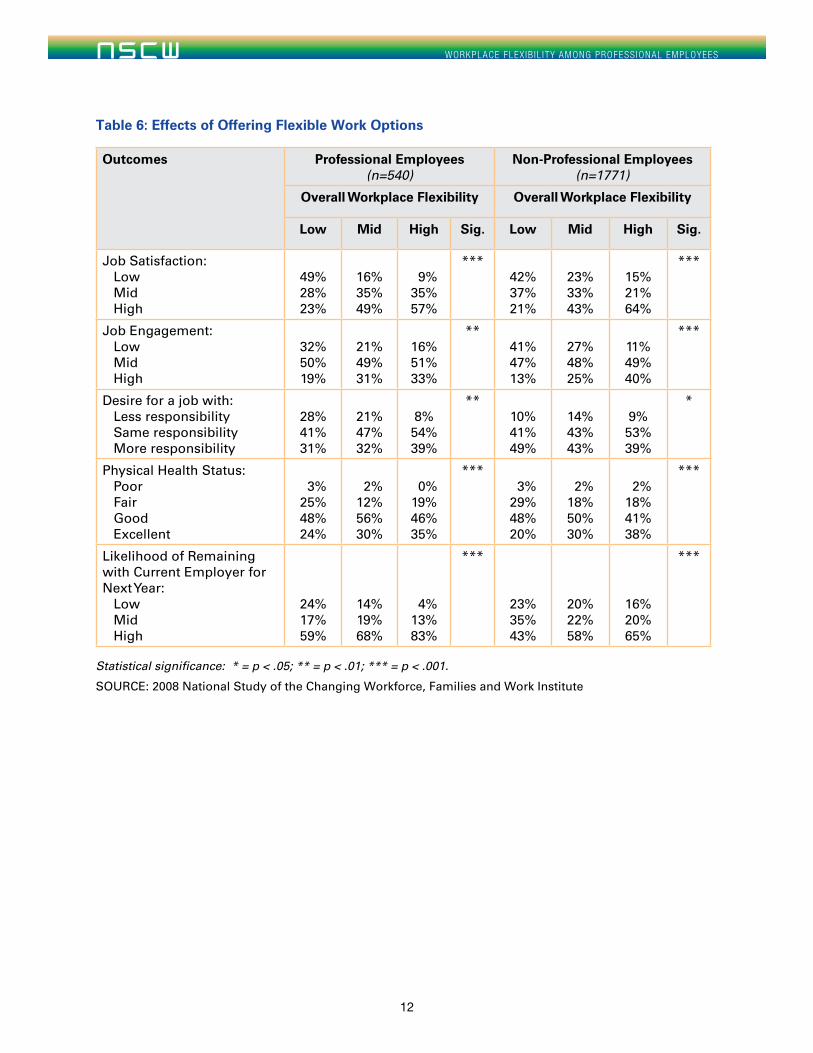
Measurement of all five outcomes is based on employees’ self-reports. Physical health sta-tus is included among outcomes of importance to employers because poor health increases health care costs for employers and reduces productivity on the job.
Professionals and non-professionals both show significantly greater job satisfaction and engagement, physical health, and likelihood of remaining with their employer when afforded more workplace flexibility (Table 7). It is especially interesting to note that even though pro-fessional employees start off with a lower likelihood of leaving their employers, an increase in flexibility still provides a significant improvement in professional employees’ intentions to remain.
It is important to note that overall flexibility is also associated with improvements in the desire for responsibility among professionals. Professionals with high levels of overall flex-ibility are less likely to desire jobs with lower responsibility and more likely to desire jobs with the same or more responsibility. Employers attempting to encourage their professional staff to seek greater job responsibilities may find that providing more flexibility can help them to achieve a better work-life fit and consider jobs with more responsibility.
12
Table 6: Effects of Offering Flexible Work Options
Outcomes Professional Employees (n=540)
Non-Professional Employees (n=1771)
Overall Workplace Flexibility Overall Workplace Flexibility
Low Mid High Sig. Low Mid High Sig.
Job Satisfaction: Low Mid High
49%28%23%
16%35%49%
9%35%57%
***42%37%21%
23%33%43%
15%21%64%
***
Job Engagement: Low Mid High
32%50%19%
21%49%31%
16%51%33%
**41%47%13%
27%48%25%
11%49%40%
***
Desire for a job with: Less responsibility Same responsibility More responsibility
28%41%31%
21%47%32%
8%54%39%
**10%41%49%
14%43%43%
9%53%39%
*
Physical Health Status: Poor Fair Good Excellent
3%25%48%24%
2%12%56%30%
0%19%46%35%
*** 3%29%48%20%
2%18%50%30%
2%18%41%38%
***
Likelihood of Remainingwith Current Employer for Next Year: Low Mid High
24%17%59%
14%19%68%
4%13%83%
***
23%35%43%
20%22%58%
16%20%65%
***
Statistical significance: * = p < .05; ** = p < .01; *** = p < .001.
SOURCE: 2008 National Study of the Changing Workforce, Families and Work Institute
13
case studIes of professIonals WorkIng flexIbly
A number of firms with large proportions of professionals are winners of the Sloan Awards. Some of these award winners have innovative ideas about how they provide flexibility to their employees—for example:
BDO USA, LLPProfessional services, Accounting, ConsultingWinning site: Multiple2,500 Employees in the U.S.
According to BDO, flexibility is a management strategy critical to their firm’s success in a global marketplace and a tool to work smarter in a competitive business environment. The firm’s official strategy, BDO Flex, aims to help everyone in the firm achieve the optimal work life fit, using a combination of formal arrangements, informal day-to-day flexibility, and a Paid Time Off program. BDO offers a strong family leave policy that includes nine weeks of fully paid leave for new biological and adoptive parents, a return-to-work program to give new parents the resources and support that they need, and has recently launched a New Parent Network that provides virtual forums connecting new parents to BDO mentors who can guide them through the process of raising a child while maintaining their career. BDO has used workplace flexibility to adapt to changing business and economic cycles; examples include professionals who work 60-hour weeks during tax season and only 20-hour weeks in slower times. Some staff regularly telecommute, easing the pain at the pump and cutting back on long commutes.
Deloitte LLP Audit, Consulting, Financial Advisory and Tax Services Winning site: Multiple 37,000 Employees in the U.S.
At Deloitte, employees have access to both informal day-to-day flexibility as well as opportu-nities for more formal, longer-term flexible work arrangements such as schedule adjustments, telecommuting and reduced workload. What the firm is particularly proud of, however, is its Mass Career Customization (MCC) program, which provides a transparent process for em-ployees to chart their individual career paths in ways that align with their personal and profes-sional priorities. With MCC, employees make choices around four major dimensions of career progression—role, pace, location/schedule and workload—calibrating each based on their current aspirations and life circumstances. The firm also introduced two voluntary sabbati-cal programs in 2009: a partially paid sabbatical of 3 to 6 months for those pursuing external career development opportunities or volunteer experiences (paid at 40% of base salary with continued benefits); and an unpaid sabbatical for those pursuing activities not covered by an-other formal leave program that allows individuals to maintain their benefits for four weeks. For employees requiring more time, Deloitte’s Personal Pursuits program grants up to five years of leave, with the intent to return, for the pursuit of outside personal goals.
Foley & Lardner LLP Law Firm Winning Site: Milwaukee, Wisconsin 656 Employees
All employees at the Milwaukee branch of this nationwide law firm are given not only the means but also the support to find the best fit for their professional and personal lives: includ-ing the ability to negotiate flexible work time, family or personal leave—and even pay, when
14
necessary. To remove any sense of intimidation, managers have streamlined the request process so that employees can adjust their schedules within a few days or even hours. Foley also strives to ensure that people who step onto a more flexible track, for whatever reason, aren’t marginalized. The company promotes its flexible schedule policy, established in 1997, as a vital tool for attracting and retaining talented people—and managers are trained to give career-advancing assignments to employees regardless of their arrangements. People who are considering a flexible schedule can tap into a network of colleagues throughout the firm who offer guidance and mentoring.
Ryan, LLC Tax services Winning site: Multiple 750 Employees
Voluntary turnover went from 18.5% to 8.5% after this company—which had previously been very conservative regarding employee schedules—became entirely indifferent as to where or when its people work. The arrangement, called myRyan, asks everyone to work with his or her manager in establishing specific, measurable goals. The hours and locations they choose to meet those goals are a matter of each employee’s choice; even the company’s five reception-ists authored their own scheduling plan, which allows each of them to have one half-day off each week. Employees are described as more than willing to take on significant responsibility in exchange for what they see as an incredible amount of freedom. Ryan, LLC dramatically in-creased its paid leave benefits for maternity, adoption, family illness and bereavement when it introduced myRyan, basically giving employees almost unlimited boundaries as long as they reach the goals they’ve set with their managers. The firm also added a community outreach program to respond to employees’ interests, bringing money and hands-on help to a number of organizations that benefit the community.
Fenwick & West, LLP Law Firm Winning site: San Francisco, California 245 Employees
Fenwick & West, LLP is committed to workplace flexibility and to the advancement of women. The firm has retained many women attorneys and staff who wanted to return to work on a reduced schedule after taking maternity leave and has kept other attorneys through cre-ative telecommuting arrangements. The firm’s other best practices include job sharing and reduced-hour schedules made available to all attorneys, for any reason, with salary, bonuses and benefits pro-rated proportionally for part-timers. The firm’s workflow coordinators and two balanced hours advisors review attorney hours regularly to ensure that those on reduced schedules are not subject to schedule creep or overlooked for plum assignments. Partners are rewarded for effective mentoring, and coaching and support are provided where improve-ment is needed.
These and other creative ideas can help make flexibility efforts meet the needs of both businesses and their employees in the professional occupations as well as the remainder of the workforce.
15
conclusIon
Although professional employees tend to have more access to flexibility than non-profession-al employees, there are still several areas where employers should focus their attention when addressing the needs of professionals.
First, the major red flag in our report is that professional employees have less desire for more responsibility in the near future. This effect seems to be concentrated among younger em-ployees, especially those in Gen X who cite long hours and insufficient flexibility as reasons for not wanting jobs with more responsibility. This is consistent with the finding that fewer professionals want a job with less responsibility when afforded high levels of flexibility.
Simply offering younger professionals more flexibility may not be as easy as it sounds. Since younger professionals do not report less access to flexibility options than older professionals nor more jeopardy for using them, the problem goes beyond access to and use of flexibility and involves at its core the way that jobs are constructed. Employers will need to address the nature of overwhelming and demanding jobs. The examples above represent some promising ways to address these issues.
Second, our results do show that younger professionals are less likely to feel that they can set their starting and quitting times to meet their own needs. Organizations should consult with their younger professional employees to clarify what the schedule needs of young profession-als are and whether the current systems can be adjusted in ways that work for the employer and employee. It is often said that new entrants to the workforce have grown up in a high-tech world where they are used to working anytime and anyplace. As employers address this issue, they will also need to consider how the future of flexible work can be calibrated to the needs and perspectives of all employees, including older professionals as they near retire-ment age.
Third, professionals are not a monolithic group. Professionals work in a variety of organiza-tions with varying policies and cultures. While professional services organizations, especially those in accounting, seem to be leading the way in flexibility, there is room for other firms that employ professionals to take a lead here too.
Fourth, jeopardy concerns, while lower for professionals, remain sizable. The fact that so many employees, professionals and non-professionals alike, see their immediate supervi-sors as supportive suggests that there are other ways in which using flexibility can negatively impact a career. Employers should examine work issues like access to developmental assign-ments, reward and promotion criteria or job constraints, and the way in which senior leaders respond to flexibility issues to ensure that anti-flexibility messages are not being communi-cated through another medium.
Providing flexibility for professional employees represents both an opportunity to improve the lives of current employees and prepare the next generation of leaders to be creative in the development of new, effective ways of working flexibly. By doing so, employers and em-ployees will benefit alike.
16
endnotes
1 Quinn, R. P. & Staines, G. L. (1979). The 1977 Quality of Employment Survey. Ann Arbor, MI: Institute for Social Research, University of Michigan.
Galinsky, E, Bond, J.T., and Friedman, D.E. (1993). Highlights of the National Study of the Changing Workforce. New York, NY: Families and Work Institute.
Bond, J.T., Galinsky, E. and Swanberg, J.E. (1998). Highlights of the National Study of the Changing Workforce. New York, NY: Families and Work Institute.
Bond, J.T., Thompson, C., Galinsky, E. and Prottas, D. (2003). Highlights of the National Study of the Changing Workforce. New York, NY: Families and Work Institute.
Galinsky, E., Sakai, K. & Wigton, T. (in press). From research to action in workplace flexibility: Lessons in bringing about workplace change. In S. McLanahan & J. Waldfogel (Eds.) Work and Family Balance. Princeton University and the Brookings Institute.
2 The 2008 National Study of the Changing Workforce (NSCW) survey was conducted by Harris Interactive, Inc. (formerly Louis Harris and Associates) using a questionnaire developed by the Families and Work Institute. Coding of open-ended responses was done by interviewers, with the exception of occupation and industry, which were coded by the U.S. Bureau of the Census using 1990 three-digit occupation (SOC) and industry (SIC) classifications. Although interviewing began in 2007, 88% of interviews were completed in 2008. Thus, we refer to this survey as the 2008 NSCW. A total of 3,502 interviews were completed with a nationwide cross-section of employed adults between November 12, 2007 and April 20, 2008. Interviews, which averaged 50 minutes in length (47 minutes for substantive questions and 3 minutes for eligibility screening), were conducted by telephone using a computer-assisted telephone interviewing (CATI) system. Calls were made to a regionally stratified unclustered random probability sample generated by random-digit-dial methods.
Up to 60 calls were made to each telephone number that appeared to represent a potentially eligible household—busy signal, answer by non-eligible with some indication of a potential eligible in household, or answer by a potential eligible who wanted a callback. When eligibles were identified and requested callbacks, additional calls were made. If 25 consecutive calls were made to numbers where there were no answers and no busy signals (and no other dialing outcome), these numbers were considered non-residential, non-working numbers or non-voice communication numbers. Three to five attempts were made to convert each initial refusal. Despite the fact that the level of effort of 2008 interviewers went substantially beyond the efforts made in 2002, 1997 and 1992, the overall response rate was only slightly higher, indicating that it has become significantly more difficult to complete telephone interviews in recent years.
Sample eligibility was limited to people who 1) worked at a paid job or operated an income-producing business, 2) were 18 years or older, 3) were in the civilian labor force, 4) resided in the contiguous 48 states and 5) lived in a non-institutional residence—i.e., household—with a telephone. In households with more than one eligible person, one was randomly selected to be interviewed. Interviewers initially offered cash honoraria of $25 as incentives. In order to convert refusals, a higher amount ($50) was offered.
Of the total 42,000 telephone numbers called, 24,115 were found to be non-residential or non-working numbers and 6,970 were determined to be ineligible residences (1,389 because no one spoke English or Spanish well enough to be interviewed). Of the remaining telephone numbers, 3,547 were determined to represent eligible households, and interviews were completed for 3,502 of these—a completion rate of 99 percent. Eligibility or ineligibility, however, could not be determined in the remaining 7,368 cases. Among those contacts for which eligibility could be determined, the eligibility ratio was 0.3886 [3547/(3547+5,581)]. Thus, we estimate that potentially 38.86 percent of the 7,368 cases for which eligibility could not be determined—2,863 cases in all—might have been eligible households. Dividing the number of completed interviews (3,502) by the number of known eligibles (3,547) plus the number of estimated eligibles (2,863) yields an overall response rate of 54.6 percent for potentially eligible households. [This method of response rate calculation follows the conservative CASRO and AAPOR recommendations.]
All sample weighting was done in relation to the U.S. population using data from the March 2007 Current Population Survey. The sample was first weighted by the number of eligibles in the respondentsí households
17
in relation to the percentage of households in the U.S. population with the same number of eligibles (i.e., number of employed persons 18 and older per household with any employed person 18 or older), eligible men and women in the U.S. population and eligibles with different educational levels in the U.S. population. [Other weights were also calculated and can be found in the public-use data files.] The average design effect for the weighted sample is estimated to be 1.359. Applying this Design Effect, the average sampling error for wage and salaried sample statistics (n=2,769) is approximately +/- 1.1 percent versus +/- 1 percent for the unweighted sample.
Of the total sample of 3,502 interviewed, 2,769 are wage and salaried employees who work for someone else, while 733 respondents work for themselves—255 business owners who employ others and 478 independent self-employed employees who do not employ anyone else. In this report, we restrict analyses to those who are wage and salaried employees.
3 The sample is weighted on various demographic factors to the 2007 Current Population Survey conducted by the U.S. Bureau of the Census to correct for any biases that might be present. The response rate for the random-digit dial telephone survey is 54.6%. The maximum sampling error for the wage and salaried sample (n=2,769) is approximately +/- 1.6 percent after adjusting for the surveyís design effect.
4 Employees with management responsibilities were excluded from the sample. Managers, while often classified as professionals, are distinct in that their position affords them a greater degree of power in determining work schedules and delegating assignments to other employees. This power advantage is unique to managers and does not reflect the experience of professional employees without such options.
5 Mature professionals were excluded from this analysis due there being only 1 mature professional employee with a child under the age of 18 at home who answered the question.
6 Median (the numeric value separating the higher half of a sample from the lower half) hourly wages is used in place of mean (average of all values in a sample) hourly wages because mean values are highly influenced by the presence of a few extreme values.
FWI follows the standard practice of economics researchers of using a log transformation of hourly wages to compensate for the existence of extreme values in wage data when conducting significance tests.
7 In Table 1 and elsewhere, column percentages do not always add to 100% because of rounding error.
8 Professional services organizations consist of organizations where the primary focus of the business is the provision of financial, legal or other technical or scientific advice or services. The professional services industry is distinguished from other industries in that they do not primarily manufacture or sell physical goods (commercial or industrial) and the employees that perform the primary revenue generating positions require a degree of expertise attained either through post-secondary school training/education or extensive experience in the relevant field.
9 Employees at professional services organizations are more likely to indicate they had at least some control over their schedules (74%) than employees at other organizations (60%). Likewise, 42% of employees at professional services organizations found it not at all hard to take time for personal matters during the workday compared with 36% of employees at other organizations.
Corporate Benefactors($15,000 or more)Cardinal Health, Inc.IBM Corporation Johnson & Johnson
Merck Verizon
Families and Work Institute’s
Corporate Patrons($10,000 - $14,999)Bloomberg LPChevron CorporationCiti
Deloitte & ToucheNorthrop Grumman Corporation
Corporate Sponsors($5,000 - $9,999)Alcoa Inc.Allstate Insurance CompanyBaxter Healthcare CorporationBright Horizons Family SolutionsBristol-Myers Squibb CompanyCredit SuisseDeutsche Bank AGDuPontErnst & Young LLPGlaxoSmithKlineGoldman, Sachs & Co.
JPMorgan Chase & Co.KPMG LLPLifeCare, Inc.Marriott InternationalMetLifePearson EducationPricewaterhouseCoopersPrudential FinancialSaks IncorporatedSara Lee CorporationUnited Technologies Corporation
Corporate Friends($3,000 - $4,999)CeridianColumbia UniversityDiscovery Communications, Inc.Eileen Fisher, Inc.Eli Lilly and CompanyFirst Horizon National CorporationHealthpoint/DFB Pharmaceuticals
The McGraw-Hill CompaniesSolix Inc.Southern California EdisonTexas InstrumentsViacom Inc.Xerox Corporation
American Express CompanyBon Secours Health System, Inc.Campbell Soup CompanyCCLCFinancial Industry Regulatory Authority (FINRA)Delhaize AmericaInterpublic Group
Kraft Foods, Inc.Novartis Pharmaceuticals CorporationPepsiCoSociety for the Human Resource Management (SHRM)Time Warner CableUBS AG
Introductory Corporate Leadership Circle Companies