workshop on ‘implications of ‘brexit’ for the eu agri … trade_en.pdfpart 1. 19 agri-food...
TRANSCRIPT
Workshop on ‘Implications of ‘Brexit’for the EU agri-food sector and the
CAP’
EU – UK agricultural trade:State of play and possible impacts
of Brexit
Cecilia BELLORA, Jean FOURÉCo-authors: Charlotte EMLINGER, Houssein GUIMBARD
CEPII
9/11/2017 Presentation for the Committee on Agriculture and Rural Development 1
Structure of the Presentation
1. State of play: current EU27 – UK agri-food trade
2. Impact of a WTO scenario on EU27Agri-food sectors
3. Key-findings and recommendations
9/11/2017 Presentation for the Committee on Agriculture and Rural Development 2

State of play – General picture Dissimetry:
Relative market sizes Trade relationship: the UK is the 2°
export destination of the EU27, farbehind the EU itself (intra EU27 : USD2,789 bn / UK : USD 353 bn)
... But, important trade relation forsome sectors, in some countries
Agri-food: Small share of total bilateral EU27 -
UK trade flows: 11% Larger relative UK’s share in EU27
exports: 9% (vs 7% for manufacture) Positive trade balance for the EU27
9/11/2017 Presentation for the Committee on Agriculture and Rural Development 3
Country GDP(USD bn)
GDP percapita (USD)
Pop.(mn pers.)
UK 2,619 39,899 65.6
EU27 13,779 30,905 445.9
Germany 3,467 41,936 82.7
France 2,465 36,855 66.9
Italy 1,850 30,527 60.6
Spain 1,232 26,528 46.4
Netherlands 771 45,295 17
Trade flows
Value(USD million)
% of EUtrade
EU27 exports
Non Agric. Goods 305,864 6.67
Agric. Goods 47,306 8.81
Total 353,170 6.90
EU27 imports
Non Agric. Goods 196,122 4.35
Agric. Goods 17,954 3.79
Total 214,076 4.29Sources: World Development Indicators, World Bank (2016) and BACI (2013 – 2015)

Main exported agri-food sectors (2013 – 2015)
9/11/2017 Presentation for the Committee on Agriculture and Rural Development 4
SECTOR GTAPCode
TRADE
MAINEXPORTER
TRADEVALUE
(USD mn)
% of EUTRADE
Food products nec ofd 16,917 9.76 Germany
Beverages and tobacco products b_t 7,186 9.18 France
Meat products nec omt 5,849 12.92 Netherlands
Vegetables fruit nuts v_f 5,147 11.03 Spain
Dairy products mil 4,095 7.59 Ireland
Crops nec ocr 1,933 8.41 Netherlands
Vegetable oils and fats vol 1,688 5.85 Netherlands
Bovine meat products cmt 1,520 8.64 Ireland
Food products (Animal feed preparations, Communion wafers...),Meat and milk related products,Beverages and tobacco (grape wines, non alcoholic beverages, undenatured alcohol)
Source: BACI (2013 – 2015), Authors’ calculations
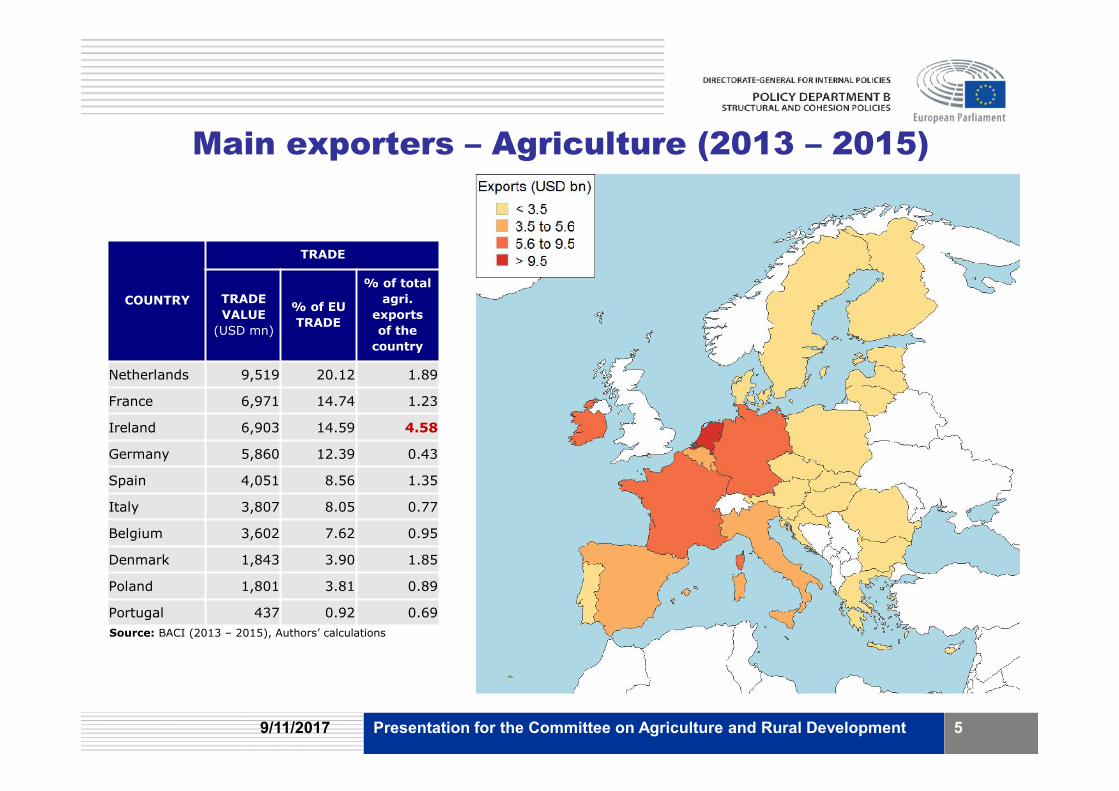
Main exporters – Agriculture (2013 – 2015)
9/11/2017 Presentation for the Committee on Agriculture and Rural Development 5
COUNTRY
TRADE
TRADEVALUE
(USD mn)
% of EUTRADE
% of totalagri.
exportsof the
country
Netherlands 9,519 20.12 1.89
France 6,971 14.74 1.23
Ireland 6,903 14.59 4.58
Germany 5,860 12.39 0.43
Spain 4,051 8.56 1.35
Italy 3,807 8.05 0.77
Belgium 3,602 7.62 0.95
Denmark 1,843 3.90 1.85
Poland 1,801 3.81 0.89
Portugal 437 0.92 0.69Source: BACI (2013 – 2015), Authors’ calculations

Protection faced by EU27 exports – WTO scenario
9/11/2017 Presentation for the Committee on Agriculture and Rural Development 6
Sources: MAcMap-HS6 and Kee et al. (2009)

Potential impacts – A simple indicator
9/11/2017 Presentation for the Committee on Agriculture and Rural Development 7
SECTOR (GTAP) GTAPcode
TRADE PROTECTION
TRADEVALUE
(USD mn)
% ofEU
TRADE
NTMs(%, preBrexit)
MFN(%)
NTMs(%,post
Brexit)
PROT.REV.(USDmn)
Food products nec ofd 16,917 9.76 35.32 13.64 61.87 12,773
Dairy products mil 4,095 7.59 42.32 41.05 74.14 4,717
Meat products nec omt 5,849 12.92 24.61 22 43.1 3,808
Beverages and tobacco products b_t 7,186 9.18 14.28 13.24 25.02 2,749
Vegetables fruit nuts v_f 5,147 11.03 18.13 11.81 31.76 2,243
Bovine meat products cmt 1,520 8.64 24.09 55.76 42.2 1,489
Vegetable oils and fats vol 1,688 5.85 21.68 15.23 37.98 898
Crops nec ocr 1,933 8.41 16.58 6 29.05 678
A simple indicator for trade impacts: trade flows (exports) weighted byfaced protection
Countries potentially most impacted: Netherlands, Ireland(i.e. main exporters of most impacted sectors)
Sources: BACI (2013 – 2015), MAcMap-HS6 and Kee et al. (2009), Authors’ calculations

2. Impact of a WTO scenario on the Agri-foodsectors
Model: We use the MIRAGE model to propose a quantification of a WTO scenario This model uses the GTAP 9.2 database, and the same protection data as in
part 1. 19 agri-food sectors (+ 14 manufacturing and 8 services) UK, 11 countries or groups in the EU27, and the rest is aggregated on a
geographical basis
Business as Usual (BAU): Intra-EU preferential access remain constant (calibrated from Berden et al.,
2009) Tariffs are updated in 2013 (MAcMap data)
WTO Scenario: Tariff rates between the UK and EU (and UK-Turkey) are set to MFN values Trade restrictiveness of NTMs increases (UK loses 2/3 of its preferential
access to the EU27, and reciprocally)9/11/2017 Presentation for the Committee on Agriculture and Rural Development 8

EU27 agri-food exports: most impacted sectors
9/11/2017 Presentation for the Committee on Agriculture and Rural Development 9
Large reduction in trade (-62% on average) Largest reduction in Other food (processed
food n.e.c) Near complete collapse in trade for White
meat, dairy, red meat
Source: Authors’ calculations using MIRAGE-e

EU27 agri-food exports: most impacted regions
9/11/2017 Presentation for the Committee on Agriculture and Rural Development 10
In volume, Most affected countries are the Netherlands, Ireland and
France Least affected are Portugal and Sweden
In relative terms, however Ireland, Rest of EU27 and Poland are the most impacted Sweden, France and Spain are less affected
Source: Authors’ calculations using MIRAGE-e

Agri-food value-added: driving forces
9/11/2017 Presentation for the Committee on Agriculture and Rural Development 11
Trade lossespartiallycompensated by Exports to otherEU27 countries Domestic demand
Exceptions: Irelandand the Netherlands Dependancy onUK intermediatespreventscompetitivity gains
Source: Authors’ calculations using MIRAGE-e

Value-added: most impacted agri-food sectors
9/11/2017 Presentation for the Committee on Agriculture and Rural Development 12
Value-added decreasesin almost every countryand sector, especially inthe processed foodsector
Brexit could represent anopportunity for a fewsectors in few countries: Red meat and cattle
in France Wheat in Spain
Source: Authors’ calculations using MIRAGE-e

Value-added: most impacted countries
9/11/2017 Presentation for the Committee on Agriculture and Rural Development 13
Ireland is the most impactedcountry
Belgium-Luxembourg andthe Netherlands agri-food VAdecrease significantly
Otherwise, impacts remainsmall in relative terms
The UK experiences anincrease in agri-food VA
Source: Authors’ calculations using MIRAGE-e
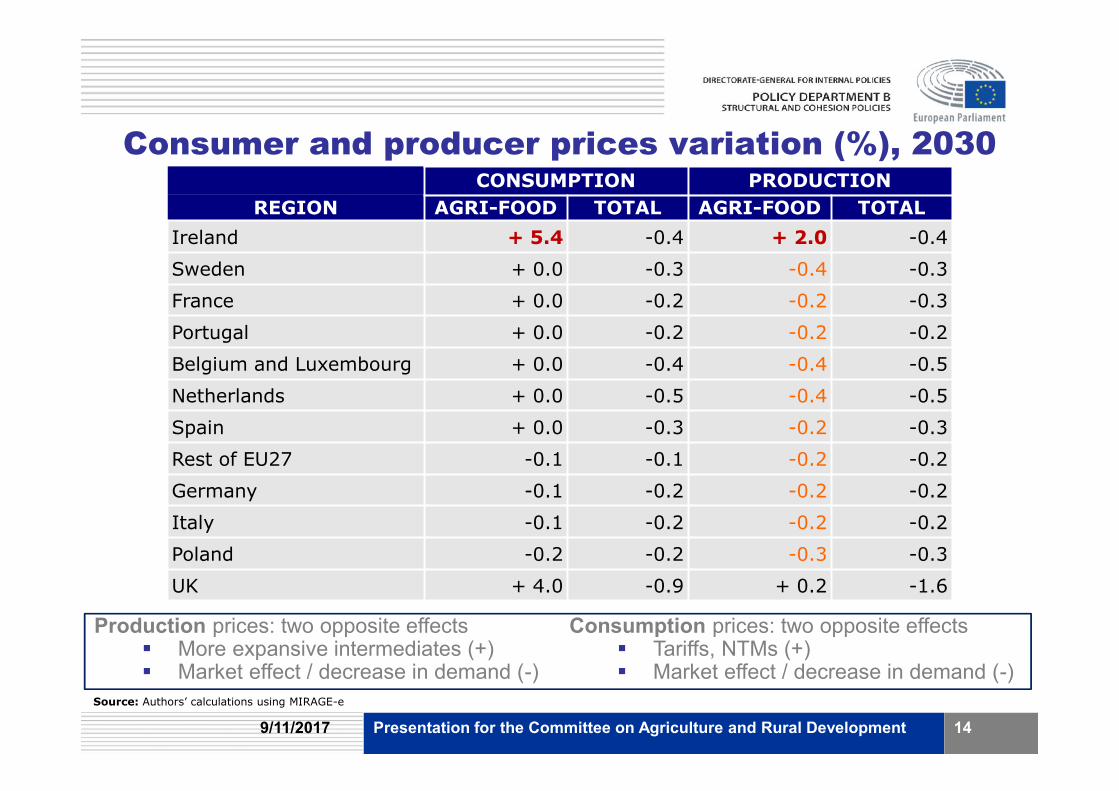
Consumer and producer prices variation (%), 2030CONSUMPTION PRODUCTION
REGION AGRI-FOOD TOTAL AGRI-FOOD TOTALIreland + 5.4 -0.4 + 2.0 -0.4
Sweden + 0.0 -0.3 -0.4 -0.3
France + 0.0 -0.2 -0.2 -0.3
Portugal + 0.0 -0.2 -0.2 -0.2
Belgium and Luxembourg + 0.0 -0.4 -0.4 -0.5
Netherlands + 0.0 -0.5 -0.4 -0.5
Spain + 0.0 -0.3 -0.2 -0.3
Rest of EU27 -0.1 -0.1 -0.2 -0.2
Germany -0.1 -0.2 -0.2 -0.2
Italy -0.1 -0.2 -0.2 -0.2
Poland -0.2 -0.2 -0.3 -0.3
UK + 4.0 -0.9 + 0.2 -1.6
9/11/2017 Presentation for the Committee on Agriculture and Rural Development 14
Production prices: two opposite effects More expansive intermediates (+) Market effect / decrease in demand (-)
Consumption prices: two opposite effects Tariffs, NTMs (+) Market effect / decrease in demand (-)
Source: Authors’ calculations using MIRAGE-e

Key findings – WTO scenario A return to WTO rules would imply significantly less agri-food
trade between the EU27 and the UK in both directions (around -62%). Some EU exports almost completely collapse, like those of Rice, White
meat, Sugar, Dairy and Red meat (more than -90%). Ireland, the Netherlands and France loose the most in terms of bilateral
trade. Brexit also implies more room for EU27 products on their
domestic markets and other EU27 markets – replacing UK products. This effect fails to compensate the incurred losses in value-added. Exception: a few sectors, such as Red meat and Cattle in France, or
Sugar and Wheat in Spain, in which value-added increases. Brexit could be an opportunity for the UK’s agri-food sectors as a
whole. Excepted in Ireland, consumers are hardly affected by changes in
overall consumption prices or economic activity.
9/11/2017 Presentation for the Committee on Agriculture and Rural Development 15

Additional material
9/11/2017 Presentation for the Committee on Agriculture and Rural Development 16

List of regions EU27 Belgium and Luxembourg, France, Germany, Ireland, Italy,
Netherlands, Poland, Portugal, Spain, Sweden, Rest of EU27 UK Rest of the world Middle East, North Africa, SACU, Sub-Saharan Africa, Turkey ASEAN, China and Hong-Kong, India, Japan, Korea, Rest of
Asia Canada, Mexico, USA Australia and New Zealand, Rest of Oceania CIS countries, EFTA, Russia Brazil, Rest of MERCOSUR, Rest of Latin America Rest of the World
9/11/2017 Presentation for the Committee on Agriculture and Rural Development 17
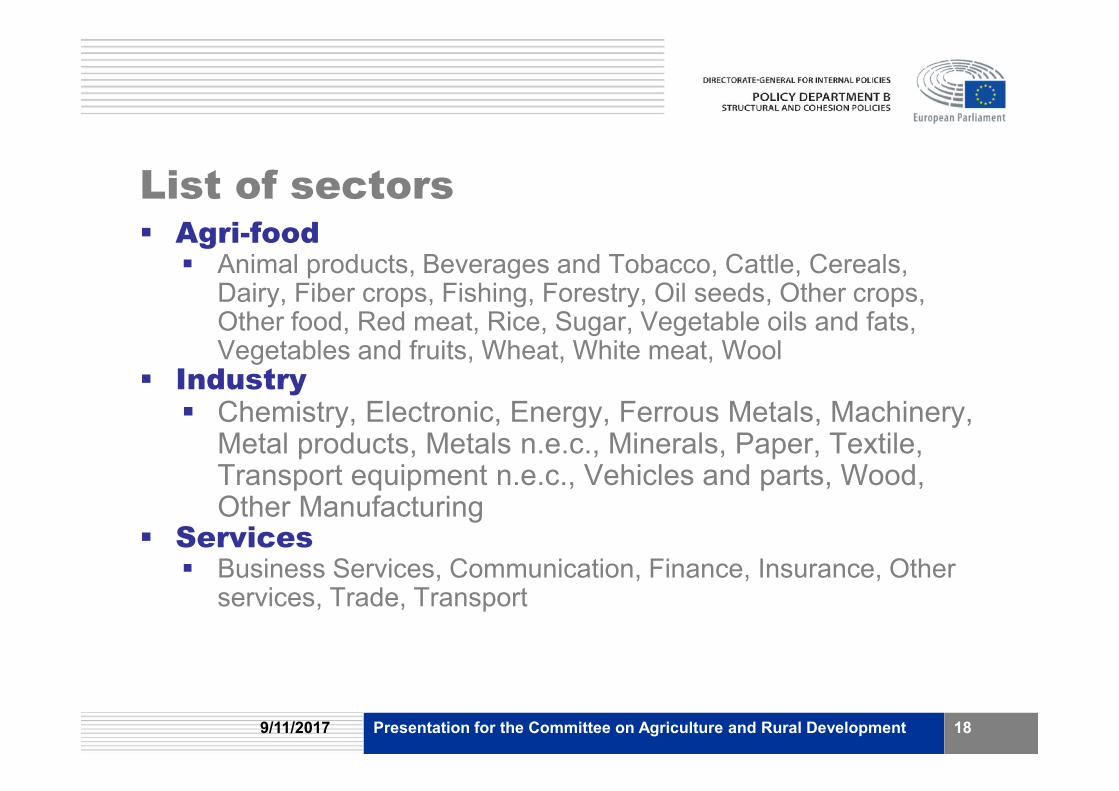
List of sectors Agri-food Animal products, Beverages and Tobacco, Cattle, Cereals,
Dairy, Fiber crops, Fishing, Forestry, Oil seeds, Other crops,Other food, Red meat, Rice, Sugar, Vegetable oils and fats,Vegetables and fruits, Wheat, White meat, Wool
Industry Chemistry, Electronic, Energy, Ferrous Metals, Machinery,
Metal products, Metals n.e.c., Minerals, Paper, Textile,Transport equipment n.e.c., Vehicles and parts, Wood,Other Manufacturing
Services Business Services, Communication, Finance, Insurance, Other
services, Trade, Transport
9/11/2017 Presentation for the Committee on Agriculture and Rural Development 18

Main imported agri-food sectors (2013 – 2015)
9/11/2017 Presentation for the Committee on Agriculture and Rural Development 19
SECTOR
TRADE
MAINEXPORTER
TRADEVALUE
(USD mn)
% of EUTRADE
Food products nec 6,806 4.37 Ireland
Beverages and tobacco products 4,176 8.86 France
Dairy products 1,564 4.08 Ireland
Meat products nec 1,234 3.63 Ireland
Bovine meat products 1,165 6.86 France
Fishing 848 7.53 France
Vegetables fruit nuts 600 1.09 Ireland
Animal products nec 503 3.00 NetherlandsSource: BACI (2013 – 2015), Authors’ calculations
Food products (Animal feed preparations, Cereal foods),Meat and milk related products,Beverages and tobacco (tobacco, undenatured alcohol, non alcoholic beverages)
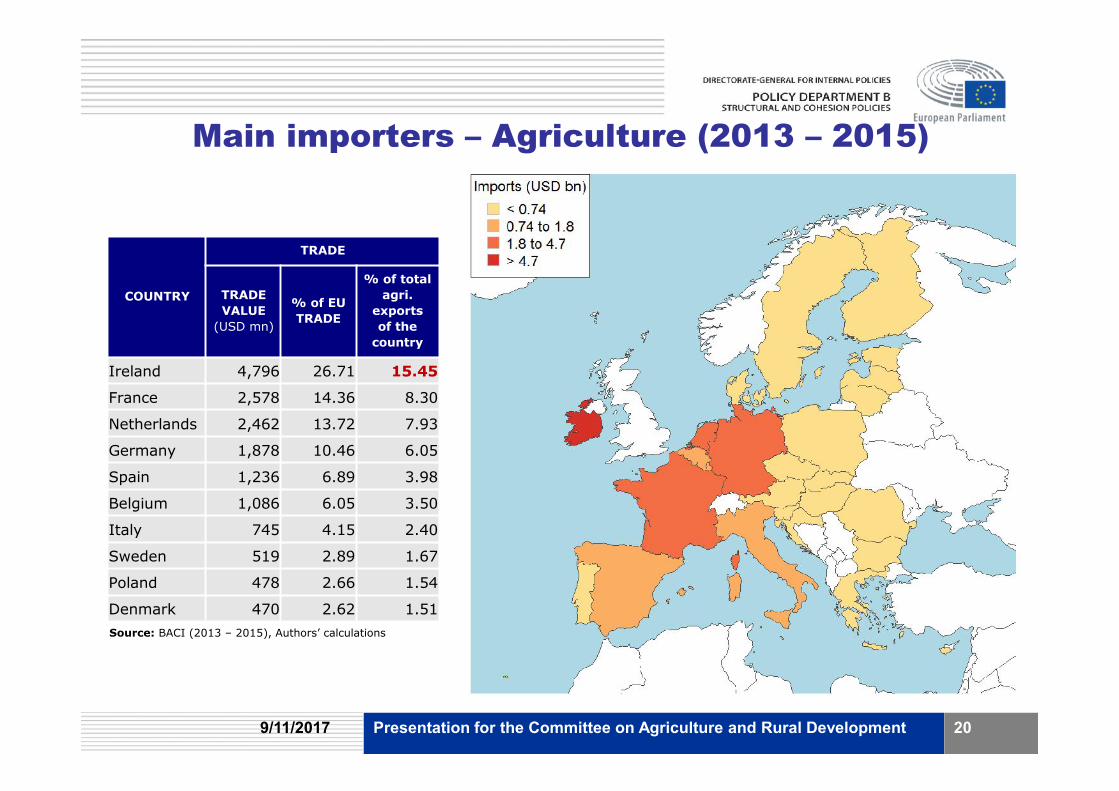
Main importers – Agriculture (2013 – 2015)
9/11/2017 Presentation for the Committee on Agriculture and Rural Development 20
Source: BACI (2013 – 2015), Authors’ calculations
COUNTRY
TRADE
TRADEVALUE
(USD mn)
% of EUTRADE
% of totalagri.
exportsof the
country
Ireland 4,796 26.71 15.45
France 2,578 14.36 8.30
Netherlands 2,462 13.72 7.93
Germany 1,878 10.46 6.05
Spain 1,236 6.89 3.98
Belgium 1,086 6.05 3.50
Italy 745 4.15 2.40
Sweden 519 2.89 1.67
Poland 478 2.66 1.54
Denmark 470 2.62 1.51

Protection faced by UK exports – WTO scenario
9/11/2017 Presentation for the Committee on Agriculture and Rural Development 21
Sources: MAcMap-HS6 and Kee et al. (2009)

Potential impacts - A simple indicator
9/11/2017 Presentation for the Committee on Agriculture and Rural Development 22
A simple indicator for trade impacts: trade flows (imports) weighted byfaced protection
Countries potentially most impacted: France, Ireland(i.e. main importers of most impacted sectors)
Sources: BACI (2013 – 2015), MAcMap-HS6 and Kee et al. (2009), Authors’ calculations
SECTOR
TRADE PROTECTION
TRADEVALUE
% of EUTRADE
NTMs(%, preBrexit)
MFN(%)
NTMs(%, postBrexit)
PROT.REV.
Food products nec 6,806 4.37 34.73 11.8 60.84 4,944
Dairy products 1,564 4.08 47.78 42.53 83.7 1,974
Bovine meat products 1,165 6.86 26.41 50.54 46.27 1,127
Meat products nec 1,234 3.63 32.94 21.09 57.7 972
Beverages and tobacco 4,176 8.86 9.2 4.22 16.12 849
Sugar 303 4.69 28.88 66.88 50.58 355
Vegetable oils and fats 487 1.18 27.89 7.8 48.86 276
Vegetables fruit nuts 600 1.09 16.48 8.44 28.88 224
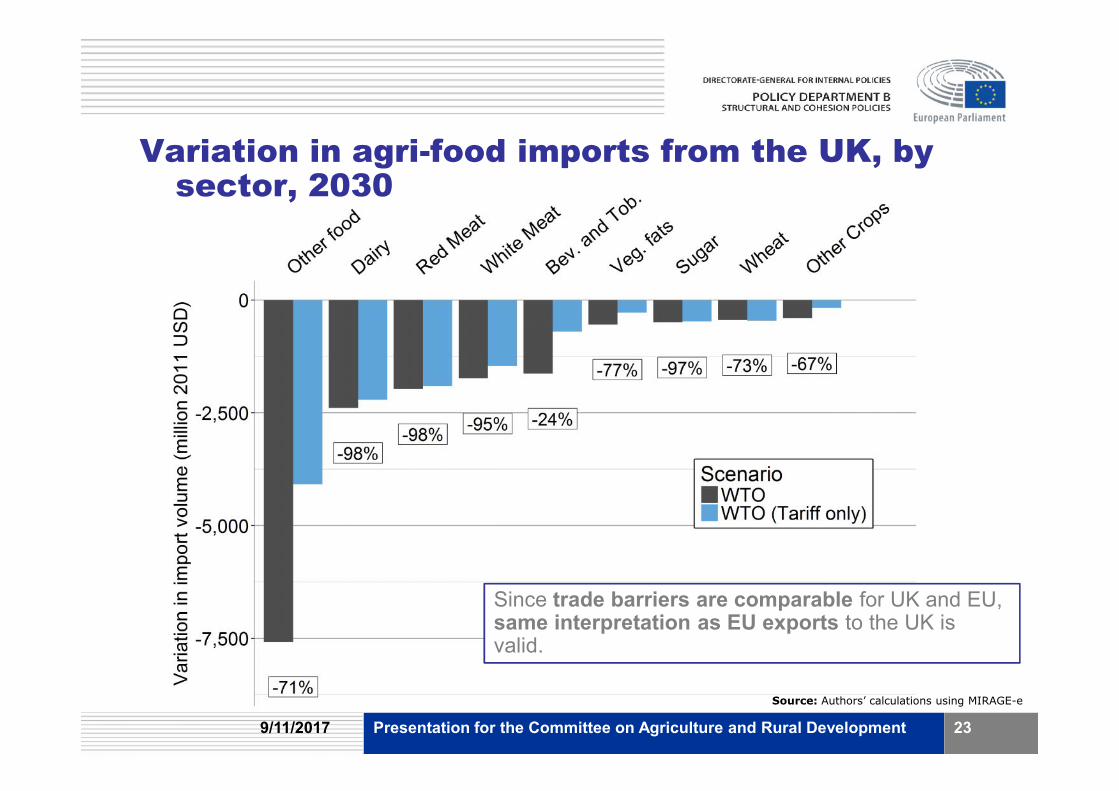
Variation in agri-food imports from the UK, bysector, 2030
9/11/2017 Presentation for the Committee on Agriculture and Rural Development 23
Since trade barriers are comparable for UK and EU,same interpretation as EU exports to the UK isvalid.
Source: Authors’ calculations using MIRAGE-e

Gross Domestic Product - Variation in 2030(scenario vs BAU)
9/11/2017 Presentation for the Committee on Agriculture and Rural Development 24
At the macroeconomic level, the WTO scenario is likelyto have moderate impacts in the long run (-0.3% ofGDP for EU27)
Only Ireland can be significantly concerned
Source: Authors’ calculations using MIRAGE-e