workshop on “the effectiveness of bilingual school ... · christine h. rossell and julia kuder...
TRANSCRIPT

Arbeitsstelle Interkulturelle Konflikte und gesellschaftliche Integration (AKI) (ed.)
The Effectiveness of Bilingual School Programs for Immigrant Children
Bearbeitung: Janina Söhn
Best.-Nr./Order No.: SP IV 2005-601 Wissenschaftszentrum Berlin für Sozialforschung (WZB) Veröffentlichung der Arbeitsstelle Interkulturelle Konflikte und gesellschaftliche Integration (AKI) – Programme on Intercultural Conflicts and Societal Integration (AKI)
Juni 2005

Contents
Introduction 1
A Synthesis of Research on Language of Reading Instruction for English Language Learners 5 Robert E. Slavin and Alan Cheung
Meta-Murky: A Rebuttal to Recent Meta-Analyses of Bilingual Education 43 Christine H. Rossell and Julia Kuder
From Cure to Curse: The Rise and Fall of Bilingual Education Programs in the Netherlands 77 Geert Driessen
Mother Tongue Teaching and Programs for Bilingual Children in Sweden 108 Monica Axelsson
Bilingual Development in Primary School Age 123 Hans H. Reich
Bilingual Education – the German Experience and Debate 133 Ingrid Gogolin
List of Contributors 146

43
Meta-Murky: A Rebuttal to Recent Meta-Analyses of Bilingual Education1
Christine H. Rossell and Julia Kuder
Bilingual education, learning to read and write in the native tongue and learning subject matter in the native tongue, is one of the most controversial educational programs in exis-tence in the U.S., perhaps because it flies in the face of what most people think of as com-mon sense, and because it seems contradictory to the American assimilationist imperative. Nevertheless, in the U.S., all but a handful of bilingual education programs are assimilation-ist and have as their goal the highest level of English language achievement that a child can achieve. In other words, bilingual education in the U.S. is different from that in much of the rest of the world in that the native tongue is typically a bridge to English not an end in and of itself. Thus, what most Americans think of as an insane idea is really not that insane as it is practiced here.
Although my reading of the tea leaves is that bilingual education is the least effective ap-proach to educating immigrant children, the differences are not so large that an intelligent and honest person could not believe in it as the best approach to educating second lan-guage learners if they wanted to. Moreover, because it is true that it is easier to learn to read and write in your native tongue (if the native tongue is a phonetic language), there are some common sense reasons why an intelligent person would support bilingual education.
The first author has conducted several reviews of the literature to determine whether bilin-gual education was effective and if not, what was. The first was a limited, unsystematic re-view conducted in the late 1970s for the American Educational Research Association an-nual Review of Research in Education (Rossell 1980) for the purpose of assessing the qual-ity of social science research introduced into educational equity court cases. Rossell (1980) concluded the research cited in court testimony in support of bilingual education was low in quantity and quality and did not demonstrate what it asserted it demonstrated. Neverthe-less, the efficacy of bilingual education was still an open question.
Baker and deKanter (1981, 1983) conducted the first systematic review of the research for the Carter administration which was being sued by a school district that had been required by the federal government to create a written language for a native American tribe in Alaska so that they could be taught to read and write in their native tongue. The Carter
1 Much of the initial work of attempting to replicate Greene’s results and to determine what formulas are used when important information is missing was conducted by Bonnie Lam, a Boston University graduate in statistics and mathematics. Arun Thomas, a graduate student in mathematics, also assisted in later work.

44
administration’s position was that bilingual education had to be provided even if the group in question did not have a written language. Someone noticed, however, that there had never been a regulatory review of the federal law funding bilingual education. Keith Baker and Adriana deKanter, social scientists working in the Department of Education, were given the task of summarizing the research as a first step in the regulatory review process. Baker and deKanter conducted an exhaustive search of the literature and concluded in 1981 that there was no evidence for the superiority of bilingual education in English lan-guage reading and math achievement compared to English language approaches to educat-ing English language learners (ELLs). These English language approaches were sink or swim (mainstream classroom), ESL pullout (small group instruction in a pullout setting), and structured immersion (instruction in the second language in a self-contained classroom of second language learners taught at a pace the child can understand). Therefore, there was no empirical basis for the federal funding requirement for native tongue instruction.
Their comprehensive review, the largest and most systematic that had been conducted up to that point, utilized the vote count method as well as considerable narration on the qual-ity of each study. The vote count method generally has the following steps: 1) decide which studies are scientific or reliable, 2) determine what the findings are for each scientific study both in terms of direction and statistical significance, and 3) summarize the percentage of studies finding a positive significant effect, no significant effect, or a negative significant effect for the treatments and outcomes of interest. A valid criticism of the vote count method is that each study is weighted equally. Of course, all but a handful of the reviews of the research published in refereed journals are narrative reviews that are not even as sys-tematic as a vote count. In a narrative review, the writer has total control over which stud-ies to summarize and the value attached to any particular study is quite idiosyncratic.
The Baker and deKanter (1981, 1983) review went against the politically correct position of that time and it was inevitable that there would be critics. One of these was Willig (1985) who conducted a meta-analysis of a sub-sample of the Baker and deKanter studies. Meta-analysis seems deceptively simple to the unitiated. An effect size is calculated from the mean outcome of the treatment group minus the mean outcome of the control group di-vided by some standard deviation. For all but the simplest studies with complete informa-tion, however, this turns out to be fiendishly difficult. There are many different formulas for calculating effect sizes when all the information is available and even more when all the information needed for the meta-analysis is not found in the study. In addition, in the large studies with many outcomes trying to ascertain which of these outcomes one is supposed to use to conduct an effect size is not easy. We are of the opinion that many meta-analyses drop studies because it is just not possible to compute an effect size from them, either be-cause there is too much data and it is not clear which of the many tables and numbers should be used or there is too little data, for example, missing standard deviations, F ratios, or p values.
Thus an advantage of the vote count method is that one can often determine the outcome of a scientific study even when it is impossible to construct an effect size. Although meta-

45
analysis is all the rage now and anyone with enough information and energy to conduct a vote count review would probably just do a meta-analysis today, we are not sure that it is always better than the vote count method. Moreover, in complex studies with many out-comes and/or studies with insufficient data, it may be worse than the vote count method because mathematical errors in the original study and those produced in selecting certain outcomes and not others are incorporated into the effect sizes and given an importance they would not have in a vote count. Although this problem can be found in all statistical analyses, it may be worse with meta-analysis.
Analyses done with original data using multiple regression or other statistical procedures can be easily replicated from the data itself because there are statistical packages, such as SAS, SPSS and Stata, that are widely available and easily obtained that enable one to exactly replicate an analysis from the same data set. Meta-analysis, however, cannot be conducted by any of the major statistical packages and the raw data used in the studies one is analyzing is not available to the person doing the meta-analysis.
The published and unpublished meta-analyses themselves rarely give enough information for another researcher to replicate the numbers that appear in the meta-analysis. Virtually all provide only the most basic information that would be of interest to the general reader and there is little there for those who might want to replicate the meta-analysis. Finally, there is little consensus or agreement on what criteria to use in assessing which studies to include in a review (with some people arguing that all studies, scientific and unscientific be included). In short, meta-analysis is a promising and important form of research review, but it is no panacea. It is subject to the same selection biases as narrative and vote count reviews and it has additional problems.
The first meta-analysis on bilingual education was Willig’s 1985 meta-analysis rebutting Baker and deKanter. This meta-analysis included only 15 of the 39 studies in Baker and deKanter 1981, but added one study (Olesini 1971) that Baker and deKanter had rejected because of the use of grade equivalents. Willig concluded that bilingual education was supe-rior to other approaches, although Baker (1987) in turn critiqued her study and concluded that her different findings were a function of the different studies she analyzed. In particu-lar, she excluded all the Canadian immersion programs, a common practice among sup-porters of bilingual education since the fact that structured immersion is always superior to programs that include the native tongue (in the Canadian programs the native tongue is generally English) is not a finding they like. The justification for excluding these studies are, of course, made on other grounds, some with merit (depending on the study), but others without. The Canadian studies are of high quality and the impressive volume of consistent results analyzing every variation in structured immersion and bilingual education that one could think of gives us confidence in the overall findings even if some individual studies must be rejected because of a lack of information or because there are no comparisons that are relevant for the issue of bilingual education in the U.S.

46
The next large-scale, systematic review, Rossell and Ross (1986), was funded by the Denver School District, which wanted to know whether Hispanic students should be educated separately in their native tongue. We reviewed all the different approaches to educating English language learners and, using the vote count method, concluded that there was no evidence for the superiority of bilingual education over any other technique.
In the early 1990s, Keith Baker and Christine Rossell began another systematic review of the literature. The strategy of Rossell and Baker was to begin with the studies reviewed in Baker and deKanter (1983) and Rossell and Ross (1986) and to add to them. The total number of studies and books read as of 1993 numbered above 500 of which 300 were pro-gram evaluations, in the sense that their purpose was to evaluate the effectiveness of TBE or some other second language acquisition technique. This is a fugitive literature, most of it unpublished and some of it available only by writing directly to school districts, and it con-sists in large part of local evaluations that do not even come close to meeting scientific standards. Unfortunately, the fact that an article is published in a peer reviewed, academic journal does not guarantee it is scientific either. Approximately 11 percent of the method-ologically unacceptable studies were published in peer reviewed, academic journals.
Since the Rossell and Baker review published in 1986, there have been two meta-analyses claiming to find the opposite of that review. The first is Greene (1998) and the second is Slavin and Cheung (2004). Greene (1998) also looked at Spanish reading achievement as an outcome. We, however, are not interested in that outcome. It is indisputable and uncontro-versial that a Spanish speaking child taught to read and write in Spanish will do better in Spanish reading and writing than will a Spanish speaking child taught to read and write in English. What is controversial is the notion that a Spanish speaking child taught to read and write in Spanish will do better in English than one taught to read and write in English and so that is the only outcome we examine or have ever examined.
The reviews criticizing Baker and deKanter (1981) and Rossell and Baker (1996a, 1996b) are not systematic surveys of all the literature on second language learning programs. Willig began with Baker and deKanter’s sample and analyzed those that met her criteria or those that she thought had sufficient data for a meta-analysis. Greene (1998) began with the Rossell and Baker sample and rejected all but 11 of them.
Although Slavin and Cheung (2004) assert their research assistants searched all available databases for studies of second language learning, this was not an exhaustive search since they identified only four new studies since the 1996 Rossell and Baker review. In addition, the first author is in possession of all but two of the seven studies Slavin and Cheung assert are not available and no one ever contacted us to see if we had them. In short, Slavin and Cheung (2004) appear to have started with the Rossell and Baker studies and added a few additional studies of second language learning programs that their research assistants came across in researching the issue of reading for at risk elementary children.

47
The Rossell and Baker Methodological Approach
Each of the 300 program evaluations,2 Rossell and Baker were able to find was assessed to determine if it addressed the relevant questions with a methodologically sound research design. Methodologically acceptable studies generally had the following characteristics:
1. they were true experiments in which students were randomly assigned to treatment and control groups;
2. they had non-random assignment that either matched students in the treatment and comparison groups on factors that influence achievement or statistically controlled for them;
3. they included a comparison group of LEP students of the same ethnicity and similar language background or a statistical control for ethnicity and language background;
4. outcome measures were in English using NCEs, raw scores, scale scores, percentiles, etc., but not grade equivalents;
5. additional educational treatments were either nonexistent or controlled for. Analysis of covariance was by far the most common statistical method used to control for preexisting differences in nonexperimental studies. Many statisticians have serious reserva-tions about whether this method succeeds in properly adjusting preexisting differences. Similarly there are doubts that matching students on important characteristics that influ-ence achievement is entirely successful. Nevertheless, as do most statisticians, Rossell and Baker generally accepted these methods unless there were serious defects in their applica-tion. Rossell and Baker also accepted multiple regression where the differences between the treatment and control group were statistically controlled for. Although the treatment and control group might not be similar initially in these studies, they become similar by the in-clusion of variables that put the groups on a level playing field. Again, virtually all statisti-cians accept this approach, although they may have reservations about how well it puts the groups on a level playing field. Indeed, multiple regression is the workhorse of the social science research and it would have been unthinkable for us to exclude studies where groups were not comparable, if the regression equation included variables that controlled for those differences. Rossell and Baker did not specifically include that in the formal list of criterion, but it was implicit in their discussion as well as the studies included. It is now added to
2 The initial list of studies on bilingual education was obtained from a search of the Educational Research Infor-mation Clearinghouse (ERIC) documents, the Boston University, MIT, Boston College, and the Boston Public Library card catalogues, Language and Language Behavior Abstracts, and the bibliographies of other reviews of the literature. The studies actually reviewed were those that could be obtained from 1) ERIC; 2) University Micro-films International; 3) the journal and book holdings of Boston University, MIT, Boston College, and the Boston Public Library; 4) the National Clearinghouse on Bilingual Education; 5) the Center for Applied Linguistics; 6) the Department of Education, 7) the authors themselves; 8) inter-library loan; and 9) program evaluations for 1991-93 obtained by writing to school districts in the U.S. This is a fugitive literature, and not all studies are documented, nor could all documented studies be obtained.

48
point 3 in the list above in underlined italics to indicate this criterion was used even if it was not explicitly specified.
Since the Rossell and Baker review, we would add three additional criterion for this particu-lar policy area that Rossell and Baker did not have at the time: 1) the studies have to be at least one school year in duration (both Greene and Slavin and Cheung have this new crite-rion and we agree with them); 2) if a U.S. program was called bilingual education, it has to be for Spanish-speakers (a criterion that neither Greene nor Slavin and Cheung have); and 3) the U.S. studies should be of elementary students (another criterion that Greene and Slavin and Cheung do not have) if bilingual education is one of the treatments. The addi-tional criteria that we have added since Rossell and Baker (1996a, 1996b) are necessary be-cause classroom observations and teacher interviews conducted by the first author indicate that in the U.S. only Spanish speakers get true bilingual education – that is, learning to read and write in their native tongue and getting subject matter in their native tongue. These classroom observations and interviews also reveal that there is very little bilingual education at the secondary level in the U.S., and what is called bilingual education rarely includes any native tongue instruction at all. In addition, since almost all secondary students already know how to read in their native tongue, the purpose of bilingual education at the secon-dary level is quite different from that at the elementary level. It is generally a drop-out pre-vention program rather than a way to achieve the highest level of English language compe-tency.
Rossell and Baker were interested in all programs for second language learners that were scientific and they did not restrict their review just to bilingual education (as Greene, for example, did) nor did we restrict ourselves only to studies that examined reading (as Slavin and Cheung, for example, did). Table 1a shows the findings of Rossell and Baker (1996a) using the original criteria comparing transitional bilingual education to 1) "submersion," i.e. doing nothing, 2) ESL, 3) structured immersion, and 4) maintenance bilingual education--on second language (usually English) reading, language, and mathematics as demonstrated by 70 methodologically acceptable3 studies using the original five criteria. Table 1a also shows the effect of structured immersion compared to ESL pullout. All of the studies in Table 1a are listed in Appendix 1a4 in abbreviated citation form in the same categories as in Table 1a. They are also listed in alphabetical order in complete citation form in Appendix 2.
3 There were two errors in the original Rossell and Baker “acceptable studies” bibliographic count which stated the N was 72 when in fact it was 70. These bibliographic errors do not affect their findings. McConnell was counted twice in the bibliographic count, but only once in the acceptable studies results table since it is the same exact same study. De la Garza and Medina was listed in the acceptable studies bibliography, but was supposed to be in the rejected studies bibliography. The study was not in the acceptable studies results table. 4 All appendices (1a, 1b, 2, 3, 4, 5, 6, 7) are published separately online: http://www.wz-berlin.de/zkd/aki/files/appendices_rossell-kuder.pdf

49
Table 1a: % of Methodologically Acceptable Studies* Demonstrating Program Superiority, Equality, or Inferiority by Achievement Test Outcome
READING** LANGUAGE MATH
TBE v. Submersion (Mainstream) TBE Better 22% 7% 9% No Difference 45% 29% 56% TBE Worse 33% 64% 35%
Total N 60 14 34
TBE v. ESL Pullout TBE Better 0% 0% 25% No Difference 71% 67% 50% TBE Worse 29% 33% 25%
Total N 7 3 4
TBE v. Mainstream/ESL TBE Better 19% 6% 11% No Difference 48% 35% 55% TBE Worse 33% 59% 34%
Total N 67 17 38
TBE v. Structured Immersion TBE Better 0% 0% 0% No Difference 17% 100% 63% TBE Worse 83% 0% 38%
Total N 12 1 8
Structured Immersion v. ESL Immersion Better 100% 0% 0% No Difference 0% 0% 0%
Total N 4 0 1
TBE v. Maint. BE TBE Better 100% 0% 0%
Total N 1 0 0
* Studies are listed in more than one category if there were different effects for different grades or cohorts. ** Oral English achievement for preschool programs. SOURCE: C. Rossell and K. Baker, "The Educational Effectiveness of Bilingual Education," Research in theTeaching of English, 30 (1), February 1996: 1-74.

50
Studies are repeated in more than one category of outcome if they had different outcomes at different grade levels or for different cohorts.5 Those not in the table are excluded be-cause they did not assess alternative second language learning programs or they did not meet the five original methodological criteria shown above.
The percentages in Table 1a indicate the percentage of studies showing a program to be better than the alternative it is compared to, the percentage showing no difference, and the percentage showing the program to be worse than the alternative it is compared to. This is repeated for each achievement outcome--reading, language, and math. The total number of studies assessing the particular achievement outcome for each category of comparisons are shown below the percentages.
Looking at the original sample of studies, the rank order in terms of effectiveness would be structured immersion, mainstream classroom with ESL pullout, mainstream classroom with no special help, and bilingual education. However, there is no evidence to suggest that bi-lingual education is a disaster and this analysis shows that transitional bilingual education is better in reading than doing nothing (that is, a mainstream classroom) 22 percent of the time and no different 45 percent of the time. Thus, if a review of the literature pulled out the right sub-sample of studies from our review, it could easily conclude that bilingual edu-cation was superior to a mainstream classroom and we might have to agree that for that sample it is.
The recent meta-analyses of bilingual education research conducted by Greene (1998) and Slavin and Cheung (2004), which claim to have refuted Rossell and Baker, both added addi-tional conditions. Not only do we disagree with most of the additional conditions they have added and the standards that they used to decide which studies were to be analyzed, but the two meta-analyses do not agree with each other on criteria or effect sizes.
The Criteria for Inclusion
Greene (1997) summarized the Rossell and Baker criteria as follows: “Studies that were determined to be methodologically acceptable had to: (a) compare students in a bilingual program to a control group of similar students; (b) statistically control for differences be-tween the treatment and control groups or assignment to treatment and control groups had be to done at random; (c) base results on standardized test scores in English; and (d) de-termine differences between the scores of treatment and control groups by applying ap-propriate statistical tests.” He omitted our argument that grade equivalent scores should not be used, but otherwise this seems a fair summary. He then added to our criteria several more criteria, some of which we now agree with or used at the time without enunciating,
5 A cohort is a group of students that are followed across grades in their progression through school. Thus, a group of students who started kindergarten in 1960 and graduated from high school in 1974 would be one co-hort. A second cohort might be a group of students who started kindergarten in 1961 and graduated from high school in 1975.

51
but most of which we do not agree with. Greene argued that the bilingual programs studied had to use the native tongue at least some of the time. We agree that to call a program “bi-lingual” should mean that it uses the native tongue at least some of the time. However, he is simply wrong when he concludes that only 11 of the 72 Rossell and Baker studies meet their own criteria. In fact, only 11 of the 72 studies meet their criteria plus his criteria. The same criticism can be levelled at Slavin and Cheung (2004). They introduced new criteria, most of which Rossell and Baker would not agree with, and then claimed that Rossell and Baker did not follow their own criteria.
Only Bilingual Education?
Greene excluded three studies (Becker and Gersten 1982; Campeau et al 1975; and Webb, Clerc, and Gavito 1987) on the grounds that the students were not in bilingual education. Rossell and Baker, however, were interested in the whole panoply of second language learning programs and so they also compared structured immersion to ESL and compared transitional bilingual education (also called early exit bilingual education) to maintenance bilingual education (also called late exit bilingual education).
Greene rejected Campeau, et al, (1975) as a study of bilingual education, but we disagree and so do Slavin and Cheung. Campeau et al. is clearly a study of bilingual education pro-grams across the U.S. as noted in its title, “The Identification and Description of Exem-plary Bilingual Education Programs.” Campeau et al. found bilingual education to be better than a mainstream classroom as was noted in the Rossell and Baker (1996a) review, al-though only the Corpus Christi study was accepted as scientific. Greene’s dismissal of Webb, Clerc, and Gavito (1987) as a study that is not of bilingual education is equally inex-plicable. The title of that paper is “Comparison of Bilingual and Immersion Programs.” The study is of Spanish speakers in Houston. Slavin and Cheung just ignore the study – neither including it nor specifically excluding it.
English Only Comparison?
Greene also claimed to exclude studies where the comparison (non-bilingual education) students were not taught completely in English. Again, we were interested in the whole panoply of second language acquisition studies, not just bilingual education compared to nothing. Requiring that the comparison group could have no native tongue instruction has the effect of eliminating the structured immersion programs since most use at least some native tongue and all of the Canadian ones do beginning around second grade. He justifies this on the grounds that the purpose of his review is to assess the potential benefit of Proposition 227, which makes the default assignment for English Learners a structured immersion classroom and he argues prohibits all native tongue instruction. Proposition 227, however, states only that the language of the structured immersion classroom is

52
“overwhelmingly” English. Overwhelmingly means not entirely and California school dis-tricts have interpreted this to mean up to 30 percent native tongue instruction is allowed.
But Greene did not consistently exclude studies where the students were not taught com-pletely in English. He included the Ramirez study, for example, despite the fact that all the teachers in the structured immersion programs were bilingual and used at least some native tongue. Indeed, the Ramirez study notes that many of the structured immersion programs used more native tongue than the transitional bilingual education programs.
Canadian Studies of French Immersion
Almost every supporter of bilingual education wants to get rid of the Canadian studies of French immersion. They are of very high quality and the many studies assess virtually every variation one can think of in structured immersion and bilingual education. The findings are troubling to supporters of bilingual education because they show that structured im-mersion is always better than any second language learning program that includes the na-tive tongue if one’s goal is the highest level of achievement in the second language that a child is capable of.
Initially, Greene wanted to get rid of the Canadian studies because they were in foreign countries. After numerous email exchanges in which the first author argued that to elimi-nate foreign country studies made no sense since brains don’t differ from country to coun-try, he apparently decided to eliminate them individually on other grounds.
Slavin and Cheung (2003) eliminated the Canadian studies on the grounds that they did not have the appropriate comparison group and thus were not studies of bilingual education. Slavin and Cheung (2004) changed their reason for eliminating the Canadian studies. The new reason was that the students were not learning the dominant language of the country and the programs were interested in how well the students were doing in English. The lat-ter problem is true of some of the French immersion studies. This is why of the dozens of Canadian immersion studies we reviewed, only six made it into our review. For a Canadian immersion study to be included in our review, it had to compare the achievement of sec-ond language learning students while they were in the French immersion program or the bilingual portion of the program and to make a comparison that could be translated into American program terms. Many of the so-called French immersion programs were in fact bilingual education, although in Canada they would call it delayed immersion or partial im-mersion.
Although Rossell and Baker were unable to use many of the studies of French immersion programs because they couldn’t figure out how to translate them into American programs or terms or because they seemed redundant or had inadequate information or controls, the entire body of work presents consistent and clear evidence that there is a strong positive relationship between the amount of instruction in a second language and achievement in that second language.

53
Interestingly, although Slavin and Cheung (2003) criticize the French immersion studies in the Rossell and Baker review as not being of bilingual education, others have criticized Rossell and Baker because all of the French immersion programs became bilingual after second grade. Although this is true, it does not necessarily invalidate our use of them since we only used findings for structured immersion when the outcome for one group was from the time period when they had total French immersion (structured immersion). It is irrele-vant what was going to happen to them in the future if the outcome was from the past. Others have criticized the Canadian French immersion programs because the second lan-guage learners were middle class. However, when the treatment group was middle class so was the control group. Furthermore, when the experiments were conducted with working class children, they produced the same or better results (Tucker, Lambert and d'Anglejean 1973; Bruck, Jakimak, and Tucker 1971; Cziko 1975; Genesee 1976).
Slavin and Cheung’s (2004) rejection of the Canadian immersion studies because the stu-dents were not learning the dominant language of the country makes no sense at all to us. As far as we are concerned, it makes the Canadian Immersion studies stronger, not weaker, since the program outcomes are less likely to be contaminated by language being learned outside the school. In short, the Canadian studies are closer to a controlled experiment than any studies conducted in the U.S. since in the U.S. there is no way to tell how much English the children in bilingual education are getting outside the school. In addition, the Canadian researchers kept meticulous records of exactly how much of each language was being used in the programs, something that is rarely found in the American studies.
It would, however, be difficult to conduct a meta-analysis of many of the Canadian Immer-sion studies. Several might have to be dropped because of a lack of statistical information that could be used to construct an effect size. We have yet to attempt a meta-analysis of them, but just reviewing the studies again for this paper has given us an upset stomach. We do not look forward to trying to construct an effect size from the hundreds of outcomes reported in the six books and articles Rossell and Baker included in their review.
One Year Criterion
Greene only included studies that measured the effects of bilingual programs after at least one school year. Slavin and Cheung (2004) appear to use a similar standard. With the bene-fit of hindsight, we agree that the additional criterion of one school year in length is a good one. Rossell and Baker should not have accepted the authors’ claim that effects would be immediate in these short-term programs. Imposing this criteria excludes five studies with different findings. They are listed in Appendix 2 with (3) after them. These studies are Bar-clay which found a positive effect for bilingual education in reading; Layden which found a negative effect for bilingual education in reading, but no difference in math; Balasubramo-nian et al. which found no difference between bilingual education and ESL; Bates which

54
found no difference for math, but TBE was worse in reading; and de Weffer6 which found no difference in both reading and math. In other words, this additional criterion should have no effect on Rossell and Baker’s conclusions.
Other Controls Besides Pretest
Greene only included studies that not only controlled for prior test scores, but also had an additional control for individual demographic factors that influence test scores such as family income, parental education, etc. This group of studies is labeled in Appendix 3 “Studies Excluded Because They Inadequately Control Differences Between Bilingual and English-Only Students.” The requirement to have a control variable other than a pre-test is a preposterous requirement, particularly for ELL students. There is no variable more im-portant than the pretest test score. In general, if you have a pretest, you do not need addi-tional individual demographic controls since those variables will add little to the explained variation. Indeed, the requirement that additional demographic controls be included would eliminate most educational studies in refereed journals. Moreover, family income or paren-tal education is not an important variable for new immigrants to a country since immigra-tion usually means at least a temporary decline in socioeconomic status. I have asked many social scientists whether they would reject a study solely because its only control variable was the pretest score and I have found no one who would. Furthermore, Slavin and Cheung (2003; 2004) do not agree with this standard since they have numerous studies in their review that have only a pretest as a control variable.
No Appropriate Comparison Group and No Evidence of Initial Equality
As shown in Appendix 4, Slavin and Cheung (2004) reject eight of the Rossell and Baker studies for not having an “an appropriate control group.”7 However, all but one of these studies had a comparison group that was either similar or made similar by statistical analy-sis. The exception is the Medina and Escamilla study. It should be rejected because it com-pared Hispanic students to Asian students in different programs, but did not control for the ethnic difference. This is particularly a problem because we now know that the ethnic difference means the program label “bilingual” cannot be trusted.
6 This author’s complete name is Rafaela del Carmen Elizondo de Weffer and there is no agreement in the literature on exactly what her last name is. Dissertation abstracts shows her last name as Weffer. We believe it is de Weffer. Greene opts for de Weffer in one citation, but then changes it to Elizondo de Weffer when she is co-author of the Balasubramonian study. Slavin and Cheung have also opted for Elizondo de Weffer. 7 Although nine studies are listed as RB, the de la Garza study is an error caused by an error in the Rossell and Baker bibliography of acceptable studies, compounded by the Slavin and Cheung failure to check the study with the results tables.

55
Slavin and Cheung also rejected 13 studies because there was no evidence of initial equality. However, Rossell and Baker did not have this criterion nor do most social scientists. Al-though it is a stronger study if the groups are initially equal, the standards of social science allow for somewhat unequal groups before the treatment if their inequality is statistically controlled for. This is not a perfect solution, but it is generally considered a reasonable one by social scientists. Indeed, the number of articles and books that would be published if this standard were applied would decline dramatically.
Slavin and Cheung’s characterization of Gersten 1985 as not having an appropriate control group is incorrect and mystifying. Table II of Gersten (1985) clearly shows the experimen-tal group (Asian students in structured immersion) and the control group (Asian students in bilingual education.) Although we now believe there is an error in the study’s program labels and that the so-called bilingual education students are actually ESL pullout students,8 there are still two appropriate comparison groups—Asians in structured immersion (a pro-gram for second language learners) versus Asians in ESL pullout (another program for second language learners). We believe this is an appropriate comparison.
Slavin and Cheung’s characterization of Burkheimer et al. is equally mystifying, although Greene similarly characterizes it as not having an appropriate control group. Burkheimer et al. is a very sophisticated multiple regression analysis controlling for many instructional variables including the amount of instruction in Spanish. The only students studied were limited English proficient Spanish speakers. This is one of the highest quality and most sophisticated studies we examined. Slavin and Cheung appear to rely on Greene’s evalua-tion and on that of Meyer and Feinberg (1992) editors of a National Academy of Science book. The latter book assesses both the Burkheimer, et al. and Ramirez, et al. studies and is critical of both. Indeed, they are only slightly more critical of the Burkheimer study than of the Ramirez study and yet both Greene and Slavin and Cheung accepted the latter. In Rossell and Baker, Burkheimer’s findings appear in both the TBE worse and TBE better category as some outcomes favored bilingual and some did not. This is often cited as an advantage of meta-analysis—that is, that the effects would be averaged in a meta-analysis—but it can also be thought of as a disadvantage since it would obscure some important in-formation.
Slavin and Cheung (2004) also allege that we relied on 14 studies that lacked any informa-tion about the initial comparability of children who experienced bilingual or English-only and they cite Matthews (1979) as the one example. The students in Matthews (1979) were matched on a great number of important variables. The problem with the Matthews study, however, is that there are no numbers in the study. It appears to have been a well designed, well thought out study, but the design and effects are described verbally so an effect size cannot be constructed from this study. That did not stop Rossell and Baker from using it in
8 Russell Gersten now agrees that the district undoubtedly mislabeled their ESL program as a bilingual pro-gram, a fairly common occurrence for the non-Hispanic second language learning programs. Personal com-munication with first author 11/12/2004.

56
their vote count, but it would certainly stop someone from using it in a meta-analysis. In-deed, many studies were probably rejected by Greene (1998) and Slavin and Cheung (2004) because of a lack of quantitative information, but they prefer to claim something more odious about the studies. We say this because there is no category in either paper for “lack of quantitative data.” Yet there are at least several studies we included in our review whose research design and findings are only described verbally and who would have to be rejected for lack of quantitative data.
There is another reason, however, why we would no longer include the Matthews study in a review, even if it had sufficient quantitative data. This study compares Asian students in bilingual education to Asian students in ESL and we no longer believe Asian students re-ceive true bilingual education. Nor is it clear from the study exactly what treatment the Asian students are getting.
Slavin and Cheung (2004) also allege that Legaretta compared Spanish-dominant children in bilingual instruction to mainly English-dominant children taught in English. We do not understand this characterization. According to the study, 95 percent of the students in the study spoke Spanish outside the home. They also rejected Legaretta because there were no reading outcomes. This is, of course, because they were interested in the effect of bilingual education on reading, not on any other skill tested in English. Greene and Rossell and Baker, however, were interested in all outcomes.
Studies in Which the Target Language Was Not the Societal Language
Slavin and Cheung (2004) offer this criterion for rejecting studies. We see no reason to exclude these studies, although it would be another way to get rid of the Canadian French immersion studies. As noted above, we believe the effect of second language learning pro-grams is clearer when the target language is not the societal language since what goes on in school is not confounded by what goes on outside.
Studies of Outcomes Other Than Reading
This is a criterion of Slavin and Cheung, but not of Greene nor of Rossell and Baker. We obviously had a broader goal—to evaluate all the quantitatively measured educational out-comes of second language learning programs. We had no reason to restrict ourselves only to reading.
Studies in Which Pretesting Took Place After Treatments Were Underway
Slavin and Cheung (2004) offer this criterion for rejecting studies, but we do not agree nor does Greene. Very few studies have measures of achievement before the treatment since

57
for programs that start in kindergarten or first grade such a measure would have to be oral or some sort of nonverbal intelligence test that is difficult to administer and that might not be comparable to the post-test. The standards of social science research only require that there be a pretest at some point and that progress after that point be tracked controlling for the pretest.
In other words, the evaluation is of change over time while in a treatment rather than just before and after a treatment.
If Slavin and Cheung had consistently applied this criterion, they would have had to limit their analyses to the following programs: 1) English reading is taught simultaneously with Spanish reading, 2) students were already proficient in English, 3) a Spanish test of achievement is the pretest and thus not comparable to the post-test, 4) a nonverbal IQ test is the pretest and thus not comparable to the post-test, or 5) the students began the bilin-gual education program in later grades. As shown in Appendix 4, however, most of the studies they found methodologically acceptable did in fact have pretests given after the treatment was underway. In short, they were inconsistent.
Slavin and Cheung (2003) disagree with Greene (1998) on the Rossell (1990) study. Rossell (1990) found that bilingual education was no different from ESL in the first year and infe-rior in the second year. Greene thinks it is an acceptable study. Slavin and Cheung (2003) argued that it did not have an appropriate comparison group because 48 percent of the English language learners were Asian. Greene (1998) and Rossell and Baker (1996a) ac-cepted Rossell (1990), despite the fact that 48 percent of the ELLs were Asian, because Asian ethnicity was a control variable in the multiple regression equations, thus explicitly controlling for that difference.
Slavin and Cheung (2004) changed the reason for rejecting Rossell (1990). The latest reason for rejecting this study is that pretests were given after treatments were under way. Again, we think it is perfectly acceptable to measure progress over time while in the treatment and so do most social scientists, including Greene (1998). Moreover, as noted above, Slavin and Cheung inconsistently apply this standard.
Missing Studies
Greene states he could not find five studies. The first author however, has three of the missing five studies and had been providing Greene with all of the studies that he had asked for. He either neglected to ask for these or he lost them. As noted above, Slavin and Cheung’s research assistants were able to find the studies Greene could not find, but failed to contact the first author of this paper for copies of the five studies they state are unavail-able, but which we have (Ciriza 1990; Educational Operations Concept 1991a, 1991b; Peña-Hughes and Solis 1980; and Teschner 1990).

58
Redundant Studies
There are 15 studies in the Rossell and Baker review that Greene says are redundant and 10 that Slavin and Cheung (2004) say are redundant.9 Most of the supposedly redundant stud-ies found no difference between submersion (mainstream classroom) and TBE, but I dis-agree that all of these studies are redundant.
Neither Greene (1998) nor Slavin and Cheung (2003, 2004) specified why they thought the studies were redundant. We can only surmise that they believe a study is redundant if the study is another evaluation of the same school district even if it is different students, differ-ent schools, and different years. We disagree with this. Most of the studies in Greene and Slavin and Cheung’s (2003) meta-analyses had multiple outcomes for different grades and sometimes different years. Averaging multiple outcomes for different grades within a single school or district is the same thing as averaging studies of different years or grades in the same school or district. There really is no important difference.
We believe that a study is only redundant if it is of the exact same students in the same year with the exact same tests. Using that standard, Rossell and Baker made two errors. Ariza is redundant with Rothfarb et al. (1989) and Curiel (1979) is redundant with Curiel et al., (1980) because both are of the exact same students in the same year, although the authors are different and the data is presented differently. Here is where a meta-analysis would have helped prevent these two errors since we would have obtained the same effect size and thus might have been alerted to our error.
It should be noted that Greene too made errors in counting three studies (McConnell 1980a, 1980b; Danoff et al. 1977a, 1977b; Danoff et al. 1978a, 1978b) as redundant that in fact were not counted twice. This can be seen by comparing Appendix 3 (Greene’s list of Studies and Reasons for Rejection) to Table 1a, the original table from Rossell and Baker (1996a) which show the studies are only counted once.
Reanalyzing Greene’s Sample
Let us assume for the moment that Greene’s standards and their application to the Rossell and Baker sample are correct and that Rossell and Baker are wrong. We still cannot con-clude from his sample that bilingual education is superior to a mainstream classroom or to structured immersion. For one thing, only one of the studies in the Greene sample and in the Slavin and Cheung sample includes structured immersion. That study, Ramirez, et al. found no significant difference between bilingual education and structured immersion, but it also has some biases that favor bilingual education which we discuss below in the section on testing rates.
9 Slavin and Cheung (2003) assert that “It is important to note that all of these duplicate citation studies found results claimed by Rossell and Baker to favor immersion over bilingual education.” This is not true as one can see by looking at Appendix 3.

59
(the mean of the experimental group minus the mean of the control group divided by the pooled standard deviation) which seems like a simple formula except for the fact that none of the studies actually had a pooled standard deviation and most lacked a standard devia-tion of any kind. This is in fact why Rossell and Baker (1996a) decided not to do a meta-analysis—there was too much missing data in too many studies. Since then we have learned that this is no longer considered an obstacle and there are many “estimation” techniques that are apparently acceptable, although some seem questionable to us.
• how to compute an effect size from a multiple regression equation that has b coeffi-cients, not adjusted means.
• how the pooled standard deviation is calculated when standard deviations are missing from the study
• how the pooled standard deviation is calculated
• how a Z score is calculated for each individual study, particularly when important in-formation is missing
• how Hedge’s g is calculated from the many means that appear in each study
In addition, Greene made an important error in summarizing his effect sizes. He did not weight the effect sizes nor the Z scores as Rosenthal (1991) and others recommend. There may be other errors. We have tried to replicate his effect sizes and Z scores and it was sel-dom possible to do so exactly and there were large differences in the Z scores. The formula for Hedge’s g is:
Although Greene asserts he used all the data in a study, a benefit he claims for meta-analysis, he inconsistently applied this standard. In Rossell, 1990, for example, he only used the outcomes in the year there was no significant difference, 1986-87. He ignored the out-comes in the next year when bilingual education did worse than a mainstream classroom. Similar omissions were found in a few other studies.
The reader is merely referred to Rosenthal (1991), which answers only the first question and even that not completely since Rosenthal does not give the formula for the pooled standard deviation or Z score nor does he specify what to do when important information is missing. After seven years, Greene understandably does not remember how he calculated the effect sizes, pooled standard deviations, Z scores, or what formulas he used when im-portant data was missing other than to state he used Rosenthal. He apparently kept no notes or didn’t want to take the time to look for them when contacted.
Most studies had several outcomes or means for different grades or years and a number of studies had hundreds of outcomes. Greene gives no information on the following:
)Spooled
XcXe −(
60
Greene’s Original Table 2 with Reading Z Score Corrected
Greene’s Table 2 English Results Weighted Greene’s Table 2 English Results Weighted – Elementary Spanish Speeakers
All Tests in English
Reading (in English)
Math (in English)
All Tests in English
Reading (in English)
Math (in English)
All Tests in English
Reading (in English)
Math (in English)
Benefit of Bilingual Pro-grams in Standard Devia-tions (Hedge’s g) 0.18 0.21 0.12 0.03 0.00
cannot calc. from Greene 0.00 -0.06
cannot calc. from Greene
z - score 2.14 2.46 1.65 0.12 0.74 cannot calc. from Greene -0.29 -1.28
cannot calc. from Greene
p – value < 0.05 0.05 0.1 0.45 0.23 cannot calc. from Greene 0.39 0.10
cannot calc. from Greene
95% Confi-dence Interval lower 0.14 0.17
cannot calc. from Greene -0.04 -0.07
cannot calc. from Greene -0.09 -0.14
cannot calc. from Greene
upper 0.22 0.24 0.11 0.08 0.08 0.03
Significance Statistically signif.
Statistically signif.
Not signifi-cant
Not signifi-cant
Not significant
cannot calc. from Greene
Not significant
Not significant
cannot calc. from Greene
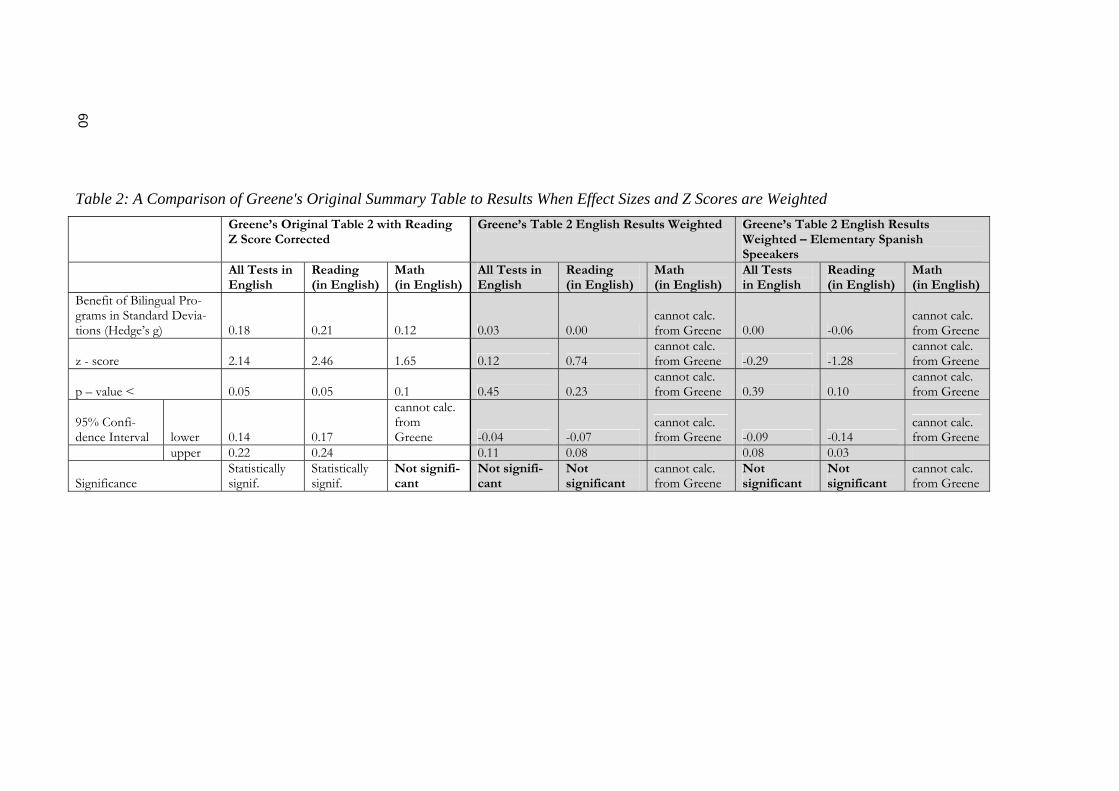
Table 2: A Comparison of Greene's Original Summary Table to Results When Effect Sizes and Z Scores are Weighted

61
Table 2 compares Greene’s aggregate effect sizes and Z scores (a Z score at or above 1.96 is significant at the .05 level) from Greene’s original table to the same aggregate effect sizes and Z scores weighted by sample size. We were inspired by Gersten, Baker, and Otterstedt (1998) who first pointed out that Greene had not weighted the effect sizes or Z scores. Gersten, Baker, and Otterstedt (1998) weighted Greene’s individual effect sizes and com-puted 95% confidence intervals for English and reading (not possible for math since Greene gives us no individual study math scores) and found no significant effect for 1) elementary studies only, 2) elementary studies with random assignment, 3) all grade levels of Spanish bilingual program. In other words, all the confidence intervals included zero.
We have done some additional analyses in Table 2 that Gersten, Baker, and Otterstedt (1998) did not do. We calculated the weighted effect size,11 the weighted Z score using the formula from Rosenthal,12 and the 95% confidence intervals for outcomes in English (i.e. ignoring Spanish outcomes) for all of Greene’s original sample, and for elementary Spanish bilingual education programs.13
The first column in Greene’s table took us a long time to figure out. It is not explained in his paper. It is simply labeled “All tests in English,” but it is neither an average nor a sum of all reading and language tests administered in English. After months of assuming some error had been made, we now realize that it is the average of all tests in English including math. We have never seen this before. The first author has been reading studies of bilingual education for about 30 years and has never seen anyone combine math, reading, oral, and language (English) scores before. It is a level of aggregation that we believe is simply inap-propriate.
We have corrected a small error in the reporting of the Plante study. Greene has a positive effect size, but a negative Z score when in fact the two are supposed to agree with each other in direction. If we change the sign of the Z score for that study to a positive sign to agree with the effect size, his summary Z scores in Table 2 for reading are correct (other-wise the Z score would be 1.62).
What is amazing about Greene’s report, is not just its brevity and lack of information which probably sets a new record, but the fact that individual Spanish achievement scores are reported for each study, but math scores are not. To repeat, this is amazing because no one disputes that learning in Spanish produces higher achievement in Spanish, but there is quite a bit of controversy over whether it is better to learn math in English or in the native tongue. As a result of his failure to show the math effect sizes and Z scores for individual
11 The formula for the weighted mean effect size is ∑W(ES)/∑W where W is the weight and ES is the effect size. The formula for the weights is W = (2(NE + Nc) x NE Nc)/(2(NE + Nc)2 + NENc(ES)2) from Cooper, 1989 where E=the experimental group, C=the control group. 12 The weighting of the Z scores is the sample size times the Z score, summed, and divided by the square root of the sum of the squared sample sizes (see p. 69 of Rosenthal, 1991). Some formulas use degrees of freedom instead of the sample size, which would give similar results. 13 The formula for the confidence interval is = ∑ W(ES) / ∑(W) ± 1.96(√V) where V = 1/ ∑W from Shadish and Haddock (1994): 268.

62
For studies that used multiple regression, the numerator for the effect size is the b coeffi-cient for the treatment group (see Equation 13 from Table B10 of Lipsey and Wilson, 2001, in Appendix 7). The effect size is 2t/
Our Hedge’s g effect sizes, shown in the columns labeled Rossell/Kuder used formula 1 in Appendix 7 from Table B10 in Lipsey and Wilson (2001) to calculate a pooled standard deviation when the standard deviation for each group was given in the study. If the stan-dard deviation for each group was missing, but the standard deviation for the whole sample was included in the study, formula 14 in Appendix 7 was generally used. In some cases, such as Powers, we were only given an ANOVA table with sums of squares instead of standard deviations. From this output, we computed the pooled standard deviation as the square root of the residual mean squares. When there were outcomes for different tests, grades, or groups of experimental students in different years, the effect sizes for each group or grade were weighted and combined to create an overall effect size for the study.
Table 3 compares each of Greene’s effect sizes to our effect sizes, also using Hedge’s g. Greene’s sample sizes generally do not match the sample sizes we found in these studies and so our weights are based on different sample sizes. The numbers on the left in the treatment and control columns are Greene’s sample sizes and the numbers in the right are the ones we found in these studies. In some cases, there are large disparities.
The three columns on the far right show the weighted effect sizes for the programs where the bilingual education subjects were elementary Spanish speakers. Again, no outcomes are statistically significant.
The middle three columns in Table 2 show our recalculation of Greene’s effect sizes ac-cepting his data with the only correction being the sign change for the Z score for Plante. After weighting his effect sizes and Z scores, no outcomes are statistically significant.
The three columns on the left of Table 2 show “all tests in English” and reading to be sta-tistically significant. However, as noted above all tests in English includes language tests, reading tests, oral tests, and math tests. Although this inappropriately aggregated outcomes is statistically significant by his standards, an effect size of .18 is not important. Nor is the reading effect size of .21 which is also statistically significant. A generally accepted rule of thumb is that .8 is a large effect, .5 is a medium effect, and .2 or smaller is a small effect (Cohen 1988, Lipsey and Wilson, 2001: 147).
studies, we cannot weight his math effect sizes and Z scores since his individual study data is needed to do that.
N where t is the b coefficient divided by the standard error of the b.

Table 3: A Comparison of Greene's Effect Sizes for Individual Studies to Rossell & Kuder's Effect Sizes Greene "All Tests in English"
Rossell/Kuder English or Language
Greene Reading
Rossell/Kuder Reading (includes oral)
Rossell/Kuder Math
Treat-ment
Control Std. Dev. Re-ported?
Random Assignment
Elem. Spanish
Study ES Z ES Z ES Z ES Z ES Z N (G/RK)
N (G/RK) Yes Yes Yes
Bacon et al.,1982 0,79 2,39 No data in study 0,68 2,07 0,70 3,29 0,91 4,40 18 / 35 18 / 18
Covey, 1973 0,34 2,94 0,37 2,37 0,74 4,87 0,66 4,69 0,28 1,56 86 / 90 86 / 89 Yes YesHuzar, 1973 0,18 0,83 No data in study 0,18 0,83 0,16 1,00 No data in study 43 / 84 43 / 76 Yes Yes YESPowers, 1978 0,00 0,01 No data in study -0,33 -1,53 -0,35 -2,13 -0,06 -0,63 44 / 84 43 / 84 Danoff et al., 1977a -0,03 -0,39 -0,04 -1,20 -0,12 -1,50 -0,10 -2,82 0,12 3,73 955 / 1481 523 / 3687 YES Kaufman, 1968 0,20 0,72 No data in study 0,20 0,72 0,23 1,10 No data in study 43 / 51 31 / 44 Yes Plante, 1976 0,52 1,34 No data in study 0,52 1,34 0,51 1,76 No data in study 16 / 31 12 / 22 Yes Yes YES
Ramirez et al., 1991 0,01 0,08 -0,08 -0,37 0,12 0,73 -0,15 -0,67 0,17 0,77 88 / 197 160 / 191 Standard Error YES
Rossell, 1990 -0,01 -0,03 -0,24 -2,20 -0,05 -0,20 -0,25 -2,30 -0,18 -2,28 174 / 92 173 / 220 Standard Error YES
Rothfarb et al., 1987 0,05 0,24 -0,30 -2,19 NA NA No data in study 0,22 2,08 70 / 142 49 / 126 YES Skoczylas, 1972 -0,05 -0,18 No data in study 0,13 0,46 0,26 1,24 -0,68 -2,21 25 / 25 25 / 22 YES Summary (weighted) 0,03 0,12 -0,05 -1,33 0,00 0,74 -0,07 -2,73 0,11 3,81 Summary Elem. Spanish (weighted) 0,00 -0,29 -0,06 -1,41 -0,06 -1,28 -0,09 -2,93 0,11 3,74 # Elem. Span. 7 4 6 6 5
Note: Shaded cells in summary data are statistically significant.
63

64
The Z score is not calculated from the effect size or any of the statistics that go into the effect size. The Z score is calculated from the probability of the F ratio or the t statistic or other tests of significance. It can be calculated in Excel1 or obtained from a number of web sites. It is usually easier to calculate a confidence interval than a Z score, using the formula described above, and were it not for our desire to attempt to replicate Greene that is, in fact, what we would do.
Rather than replicating his inappropriate “All tests in English” column, we have inserted a column that consists of just the English language tests in these studies. Our summary effect sizes in Table 3 are an insignificant effect size of -.05 for English/language, a statistically significant negative effect size for reading of -.07, and a statistically significant positive effect size for math of .11. These are all small effects whether statistically significant or not. The same general results hold when only Spanish elementary programs are examined.
Random Assignment. Greene argues that random assignment studies are the best studies and so should be given more weight. With respect to internal validity that is, of course, true. One can be certain that the relationship between the independent variable and the dependent variable is not confounded by the assignment rule since it is random. If there is no random assignment, that is, if students are allowed to select themselves for a treatment or if someone else selects students for a treatment on the basis of characteristics that are correlated with the outcome, one must statistically control for those characteristics in order to isolate the effect of the treatment and one can never be certain the controls are suffi-cient.
Greene denotes six studies as having random assignment, but one of these is an error. The Rothfarb, et al. study is characterized by random assignment of schools, not students, to treatment and control groups. Indeed, Rothfarb et al. acknowledge this in conducting mul-tiple regression analysis to control for the differences in student characteristics between schools. Excluding Rothfarb et al. leaves only four studies with random assignment. Of the four studies with random assignment, only two were of Spanish elementary programs.
1 To calculate the two tailed probability of the F ratio in Excel: click on function, statistical, Fdist. In the popup table, X=f ratio, deg_freedom1=numerator df (between df of k-1), deg_freedom2=denominator df (within df of n-k) where n =total sample, and k=number of groups. The summary formula is FDIST(fratio,numdk,dendk). The convention in meta-analysis is that the Z score is calculated from a one-tailed probability since the Z score calculates the number of standard deviations from the mean, not condi-tioned on the direction, as if one knows which group will come out ahead. This is a questionable assumption, but we bow to convention on this issue. In order to obtain a one-tailed probability, the two-tailed probability is divided by 2. This means that a one-tailed probability will be smaller and since the probability is the prob-ability that the relationship might have happened by chance, it is more likely that the difference between groups will be found to be statistically significant. To calculate the Z score from the one tailed probability in Excel: click on function, statistical, NORMSINV--in the popup window, insert the one-tailed probability if the experimental group is worse or 1 minus the one tailed probability if the experimental group is better. If the two-tailed probability has more than 5 zeros to the right of the decimal point, a .000001 will have to be added to the formula for the FDIST as in (FDIST(fratio,numdk,dendk))+.000001) or you can go to the web and find sites that will allow more than 5 zeros.

65
These two studies, Huzar and Plante, illustrate the problem with random assignment ex-periments—they all too often lack external validity or generalizability. The treatment pro-grams in these two studies seem to have had the same amount of English instruction as the mainstream classroom and the students learned to read in English at the same time or be-fore they learned to read in Spanish which is probably why the researchers or administra-tors could get away with random assignment without having a lawsuit on their hands. In short, these are not your typical Spanish bilingual education programs as Slavin and Cheung admit in the conclusion of their paper, but Greene ignores.
The secondary programs with random assignment (Covey and Kaufman), in particular, seem to have had little Spanish language instruction and may have consisted only of after-school tutoring by Spanish speaking aides. Since we no longer accept secondary bilingual education programs, the lack of external validity of these two studies is a moot point for us.
Reanalyzing Slavin and Cheung’s 2004 Sample and 2005 Table
There are many formulas for computing an effect size although the two most common seem to be Cohen’s d and Hedge’s g. Slavin and Cohen used Cohen’s d for their effect sizes in the July 2004 paper. This effect size has the control group’s standard deviation in the denominator rather than the pooled standard deviation as is the case with Hedge’s g. Since the treatment and control groups in these studies occasionally had very different Ns, we would recommend Hedge’s g over Cohen’s d. In fact, Slavin and Cheung have now come to this conclusion and Cheung has sent us a revised table which now has Slavin’s g.
Appendix 4 shows the studies that Slavin and Cheung (2004) included and rejected in their meta-analysis which is adapted from their Appendix 1 with columns added by the first au-thor of this paper, noted as CR. The first column added labeled “CR Comments on Source” shows the studies that Greene accepted as well as errors that Slavin and Cheung made in attributing the citation for a study. As noted above, there is disagreement between Greene and Slavin and Cheung with regard to criteria. Whereas Greene accepted studies where the pretest occurred after treatment was underway (as did Rossell and Baker), Slavin and Cheung did not. Greene, on the other hand, rejected studies where the only control variable for the differences between groups was a pretest, but Slavin and Cheung accepted those studies (as did Rossell and Baker).
As a result of these differences in criteria and other issues, Slavin and Cheung accepted Alvarez (1975), but Greene rejected it because he believed it inadequately controlled for differences between bilingual and English-only students (i.e. the only control was a pretest). As shown in the final column, however, the Alvarez study violates Slavin and Cheung’s criterion that the pretest had to be given before the treatment was under way. Indeed, of the 16 elementary reading programs that Slavin and Cheung accepted, five violated their criterion that pretests had to be administered before treatments were underway. In short,

66
Slavin and Cheung were inconsistent, although in our opinion it is probably not possible to be entirely consistent with these messy, complicated studies.
Appendix 5 shows our replication of Slavin and Cheung’s Cohen’s d. It is an adaptation of their Table 1 from their July 2004 paper. Appendix 6 shows our replication of their revised Table 1 now using Hedge’s g as the effect size, emailed to the second author on February 5, 2005. Slavin and Cheung did not report summary results or even sub-category results in their tables, although that is presumably a major advantage of meta-analysis over the vote count method. They also did not report significance levels or confidence intervals for any of their studies.
The sample sizes that Slavin and Cheung report match those that we found for most of the studies. The only real discrepancy was with the Campeau study of Houston in which Slavin and Cheung reported the sample size for one of the grades for one of the years, while we report the sample size for the last year for all groups. Slavin and Cheung also report only two cohorts for Cohen (1975) when in fact there are three. Their numbers for Kaufman come from the initial sample. The sample of students who actually took the post-test is the number we believe should be reported. We have no idea where the sample N for Covey comes from.
We object to including the Maldonado (1994) study. The effect size of 2.21 with Cohen’s d and 1.66 with Hedge’s g (we got 1.73), are unbelievable. Effects this large are just not ob-tained from educational treatments so there is something else going on. As described in the study, the educational treatment is not only a double dose of reading which the control group did not get, but other treatments not received by the control group. One of the more important of these other treatments is that the teacher assigned to the treatment group had experience working with “integrated bilingual special education” and teaching bilingual students with learning disabilities. The control group teacher apparently had no experience working with bilingual students with learning disabilities. The teaching strategies used by the experimental group teacher include a wide range of strategies beyond the language of instruction. The control group program is hardly described at all except to say that some of the strategies were the same for both groups. Because this study had random assignment (of students, not teachers), there were no statistical controls for any of the other character-istics of these two programs or students.
Indeed, the results are so unbelievable as to make one wonder if the problem extends be-yond the fact that the experimental group had an experienced teacher who used a wide range of strategies in addition to changing the language. Not only did the treatment group have an astonishing 29 point gain in their CTBS reading scores, but the control group actu-ally had a nine point decline in achievement. Neither effect is credible even if the treatment group received significantly better instruction and one can only wonder if the researcher made a mathematical or other kind of error. For all of these reasons, including the fact that this is a study of special education students, we exclude this study. Even if the data were believable, the study has limited generalizability.

67
In addition, we exclude all but the Corpus Christi study of Campeau (per Rossell and Baker), the only one that seems to have a treatment and a control group and some statisti-cal control for pretreatment differences. The effect sizes that Slavin and Cheung report for the Campeau et al. study of Santa Fe are problematic as there is not enough information in that study to create an effect size. Cheung is still struggling with the issue of exactly how to estimate an effect size for this study since there is no data.2 We think no effect size can be created from this study without literally making up data and so we have left the cells empty.
It is curious that the Slavin and Cheung review left the following studies (J. R. Maldonado 1977; Cohen 1975; Alvarez 1975; Ramirez, et al. 1991; and Kaufman 1968) non-quantified in the Cohen’s d analyses or arbitrarily assigned them an effect size of zero in the Hedge’s g analyses (J. R. Maldonado 1977; Cohen 1975; Ramirez, et al. 1991) when in fact they do have enough data to compute an effect size. Greene also computed effect sizes for Ramirez and Kaufman (but not the others as they were rejected or not considered).
We calculated our own Cohen’s d and Hedge’s g effect sizes for these studies and meas-ured the significance of the effects using the 95% confidence interval. If the interval does not include 0, the effect size is statistically significant. Of the 12 Cohen’s d effect sizes Slavin and Cheung calculated, seven were significant and five were not. Of the 14 Cohen’s d effect sizes we calculated, five were significant and nine were not. Of the 18 Hedge’s g effect size Slavin and Cheung calculated or arbitrarily assigned a zero to, seven were signifi-cant and 11 were not. Of the 14 Hedge’s g effect sizes we calculated, four were significant and 10 were not.
Table 4 contains the summary statistics from Appendix 5 and 6. The average weighted Cohen’s d effect size across all of Slavin and Cheung’s studies, using our effect size where they had none, and their effect sizes for the other studies is .34, small but statistically sig-nificant. Only 44 percent of the studies had a significant effect size. Across just the studies where they calculated an effect size, it is .57, medium and statistically significant. Only 58 percent of the studies had a significant effect size. Our Cohen’s d effect size for the Span-ish elementary bilingual education programs, excluding the Campeau and Maldonado stud-ies, is .14, but still (barely) statistically significant. Across all Spanish elementary bilingual education programs, only 36 percent of the studies had significant effect sizes.
2 Email communication with second author, 12/8/04 and 2/12/05.

68
Table 4: A Comparison of Summary Effect Sizes by Slavin & Cheung and Rossell & Kuder
Slavin & Cheung Rossell & Kuder
All Studies*
All Stud- ies with S&C ES** Stat. Sig.
Spanish Elementary Stat. Sig.
COHEN'S d
Effect Size 0,34 0,57 Yes 0,14 Yes
Lower C.I. 0,26 0,45 0,03
Upper C.I. 0,43 0,73 0,26 % studies statisti-cally significant 44% 58% 36%
N in Analysis 18 12 14
HEDGE'S g
Effect Size 0,25 Yes 0,10 No
Lower C.I. 0,17 -0,01
Upper C.I. 0,34 0,22 % studies statisti-cally significant 39% 29%
N in Analysis 18 14
* Includes Cohen's d effect sizes calculated by Rossell & Kuder if Slavin and Cheung did not report them. ** Only includes studies that Slavin & Cheung computed an ES for.
The average weighted Hedge’s g effect size for Slavin and Cheung across all studies, includ-ing the arbitrary zero effect sizes assigned to some studies, is .25, small but statistically sig-nificant. Only 39 percent of the students had significant effect sizes. Our Hedge’s g effect size for the Spanish elementary bilingual education programs, excluding the Campeau and Maldonado studies, is .10, not statistically significant. However, 29 percent of the studies had significant effect sizes.
But it must be emphasized that most of these studies were not of conventional bilingual education programs as Slavin and Cheung admit at the end of their paper. As noted above, the students received a double dose of reading (hence the term paired bilingual), one period in Spanish and one period in English and in several programs had no less English instruc-tion than students in the mainstream classroom. The theory underlying bilingual education in the U.S. is that one must learn to read and write first in the native tongue and receive

69
subject matter in the native tongue before transitioning to English. These programs violate that theory.
What Slavin and Cheung do not consider in their paper, although Slavin admitted this in personal communication to the first author in Berlin, is the possibility that the effect on English language achievement is of the double period of reading, not the language of in-struction. Indeed, it is very possible that if the double period of reading had been in English, the effect might be even more positive than they found in their sample and might be posi-tive rather than the no effect we found. At this point, we can say that our reanalyses of both Greene (1998) and Slavin and Cheung (2004, 2005) do not support the conclusions they draw regarding the superiority of bilingual education over a mainstream classroom.
Reanalyzing Rossell and Baker
Table 1b and Appendix 1b show a revised vote count tally based on our new criterion—no programs of less than a school year, no secondary programs, and no non-Spanish speaking bilingual education programs. The two studies that are actually redundant (Ariza 1988 and Curiel, Stenning, and Cooper 1980) have also been removed. We also recategorized two studies. The El Paso studies have been moved from the category of TBE versus main-stream classroom to TBE versus structured immersion. Gersten (1985) has been moved from TBE versus structured immersion to structured immersion versus ESL (the program that had been called bilingual education). The studies that have been removed or relocated are crossed out and those that were inserted in a new place are bolded and underlined.
As can be seen, this does not change our findings in any important way. The percentages vary only slightly. On average, the best program is structured immersion and the more na-tive tongue instruction, the lower one’s achievement in the second language. Nevertheless, there are enough exceptions to this overall finding that it is possible to also say that a little bit of native tongue instruction does not hurt and might help if the native tongue is Span-ish. We maintain, however, that this is more consistent with programs that we call struc-tured immersion, or sheltered English immersion in the U.S., than it is with transitional bilingual education as described in the literature—a program where children must learn to read and write in their native tongue initially and must reach literacy in the native tongue before being transitioned to English.

70
Table 1b: Revised % of Methodologically Acceptable Studies* With Program Superiority, Equality, or Inferiority by Achieve ment Test Outcome
READING** LANGUAGE MATH
TBE v. Submersion (Mainstream) TBE Better 20% 14% 10% No Difference 51% 29% 55% TBE Worse 29% 57% 35%
Total N 35 7 20
TBE v. ESL Pullout TBE Better 0% 0% 20% No Difference 50% 50% 40% TBE Worse 50% 50% 40%
Total N 4 4 5
TBE v. Mainstream/ESL TBE Better 18% 9% 12% No Difference 51% 36% 52% TBE Worse 31% 55% 36%
Total N 39 11 25
TBE v. Structured Immersion TBE Better 0% 0% 0% No Difference 14% 25% 50% TBE Worse 86% 75% 50%
Total N 14 4 10
Structured Immersion v. ESL Immersion Better 100% 0% 100% No Difference 0% 0% 0%
Total N 4 0 1
TBE v. Maint. BE TBE Better 0% 0% 0%
Total N 0 0 0
* Studies are listed in more than one category if there were different effects for different grades or chorts.
** Oral English achievement for preschool programs.
Original Source: C. Rossell and K. Baker, "The Educational Effectiveness of Bilingual Education,"
Research in theTeaching of English, 30 (1), February 1996: 1-74.

71
Testing Rates
None of the reviews, including Rossell and Baker, controlled for the considerable differ-ence in testing rates between Spanish speakers in bilingual education and those in all-English classrooms. There is a consistent bias in virtually all evaluations that compare Spanish bilingual education programs in the U.S. to an alternative program. Teachers can decide when their English Learners are ready to take standardized achievement tests. Teachers in bilingual education program test their English Learners at lower rates than do teachers in all-English programs because they believe that it is unreasonable to administer English language tests to students who are learning literacy in their native tongue. How-ever, this gives the bilingual education programs an unfair advantage over all-English pro-grams because a much larger number of low achieving students will not be included in the evaluation of the bilingual education program than is the case with the all-English program. It is the lowest scoring students who are deemed not ready to be tested.
Individual student data from California and the U.S. show even more striking disparities in testing rates. Bali (2000) has obtained individual student data and program testing rates pre and post Proposition 227 for Pasadena Unified in southern California. She found a 50 per-cent testing rate for the English Learners in bilingual education in Pasadena in 1997-98, but an 89 percent testing rate for the English Learners in ESL in the same district.
Similar disparities in testing rates were found in the Los Angeles Unified School District in 1996-97. The school district’s report showed English Learners who were in bilingual educa-tion for five years outscored English Learners in all-English classes on the Stanford 9. However, only 61 percent of the students in the bilingual program were thought to know enough English after five years to be able to take the test, but 97 percent of the students in the English language program took the test (Los Angeles Unified 1998). This 37 point dif-ferential is very close to the 39 point differential Bali found in Pasadena.
Similar disparities can be found in the Ramirez et al. (1991) nationwide study of more than 1,000 children in 9 school districts, 46 schools, and 136 classrooms across 5 grades. Eighty-nine percent of the structured immersion students were tested in K-1, but only 61 percent of the early exit bilingual education students were tested. In grades 1-3, 42 percent of the structured immersion students were tested, but only 29 percent of the early exit bilingual education students were tested. The Ramirez study found no difference between the two programs, but this underestimates the benefit of immersion and overestimates the benefit of bilingual education since far fewer students were tested in the bilingual program.
The first author has done similar analyses of testing rates in California (Rossell, 2002; 2003). The higher the percentage enrolled in bilingual education, the lower the testing rate. Thus, the evaluations of Spanish bilingual education in the U.S. are biased by the fact that only the best students are tested in Spanish bilingual education programs, but almost all English language learners are tested who are in a mainstream classroom. In addition, these testing rates can be thought of as outcomes. If there are more ELLs in bilingual education deemed not ready to be tested than in the mainstream classroom or structured immersion,

72
even after several years in the program, then the bilingual education program is less effec-tive than the alternative in teaching the language that will appear on the test.
Evaluating Bilingual Education in California
In June 1998, California voters voted to make the default assignment for English language learners a structured immersion classroom. Before that it had been bilingual education.
Table 5.1 of Rossell (2002) is a regression equation predicting the effect of the percentage of English language learners enrolled in bilingual education on an elementary school’s 2001 reading and math test scores3 controlling for their 1998 test score and their percentage poor in 2001 (enrolled in Calworks, the state poverty program).4 The 1998 test score is basically a control for the characteristics of the school that are not captured in the poverty rate.5 The test scores for ELLs are low (on a scale from 0 to 100), but that is because they are supposed to be low - an English language learner is a student who scores low in Eng-lish. This also means there is a ceiling on how much progress can be made in ELL test scores. This is because when ELL scores get above a certain level (around the 36th to 50th percentile depending on the district), they no longer appear in the English language learner category. That category is only of low scorers.
The regression analysis indicates that the percentage enrolled in bilingual education is sig-nificantly and negatively related to a school’s test score in both reading and math even after controlling for poverty rates and initial test scores. If we solve the equation for 100, 50, and 0 percent of a school’s English Learners in bilingual education in 2001, an elementary school’s reading score is increased by six points in reading and three points in math if they have no bilingual education enrollment compared to a school that has all its English Learn-ers enrolled in bilingual education.
This analysis may not show the true effect of bilingual education, or its inverse, English language instruction, on school achievement since it appears that bilingual education in California has been changed by Proposition 227 - more English is being used - and because all but a handful of schools reduced their bilingual education enrollment even if they did not eliminate it entirely. Trying to isolate the true effect of a program that is no longer the same or the true effect of sheltered English immersion when it also had an effect on other
3 This is the school’s average NCE converted to a national percentile rank. The state does this conversion. 4 The percentage of English Learners tested in reading or math was not significant at the school level and is not shown. It may be that in a statistical analysis at the school level, the problem of countervailing tendencies - low test rates occur in schools with low achievement - muddles the advantage of not testing the very lowest scoring students. Because the higher scoring schools test more of their students, the sign for the testing rate variable is positive, although insignificant. 5 The state data also include the achievement of all students in a school, but that is not a good control vari-able since the English Learners comprise a large percentage of all students in the schools that formerly had bilingual education programs. In addition, most of the fluent English proficient (FEP) students were once English Learners and so controlling for the achievement gains of fluent English proficient students wipes out part of the treatment effect for English Learners.

73
programs is a difficult task even at the individual level and it is even more difficult at the school level.
Moreover, as noted above there is a ceiling effect that is present in the state data since it is not possible to examine the achievement of redesignated English language learners. In or-der to know the true effect of Proposition 227 or the remaining bilingual education pro-grams, one must be able to follow English Learners after they are redesignated fluent Eng-lish proficient and unfortunately, at this point in time that is not be possible with school level data.
Individual student data still suffers from the testing rate bias favoring bilingual education, but at least it is possible to determine the program the student is enrolled in. Bali (2000) has analyzed the achievement of individual English Learners in the Pasadena Unified School District using data provided by them. In 1998, 53 percent of Pasadena's English Learners were enrolled in bilingual education. After Proposition 227, less than two percent of Eng-lish Learners were enrolled in bilingual education. Bali used the Heckman (1979) selection model to control for the selection bias introduced by the lower testing rate for the bilingual education program in 1997-98.
The effect of being in a bilingual education program in 1998 is negative and statistically significant, but the magnitude was only 2.4 points in reading and a half point in math. The effect of putting these same English Learners in a structured immersion classroom the next year was to eliminate the small gap between English Learners who had been in bilingual education and those not in bilingual education.
These findings are not that different from what I obtained in a school achievement analy-sis. School achievement in reading increases by six points if all children are enrolled in bilin-gual education compared to a school where none are. School achievement only increases by three points in math if all children are enrolled in bilingual education compared to a school where none are.
Conclusion
The best approach to educating second language learners is not an issue that can be solved by meta analysis and probably not by any other statistical approach. There is too much disagreement over what constitutes scientific research and too little scientific research. None of the research is perfect and much of it is extraordinarily complicated with many, many analyses and outcomes. Honest and competent professionals can legitimately disagree as to whether a study is good enough to be relied upon.
Nevertheless, we are confident that structured immersion is the best approach to educating second language learners and that most second language learners should not be in that pro-tected environment for longer than a year or two. Virtually all of the comparisons that Greene (1998) and Slavin and Cheung (2003) made were of bilingual education and a main-stream classroom. Much of what is valuable about bilingual education (the sheltered envi-

74
ronment, the caring and trained teacher, the engagement of students in instruction they can understand, and the use of the native tongue to clarify when necessary or possible) can be obtained in a structured immersion classroom without the reduction in the second language that can have negative consequences on a child’s achievement in the second language.
On the other hand, Spanish bilingual education in the U.S. is not a disaster and children do learn English. Rossell and Baker (1996b) hypothesized that if Spanish reading was taught briefly when a child literally knows no English, it might be a superior approach for teaching reading and simple math to Spanish speakers. The problem was the theory that Spanish must be mastered before English. That all too often keeps children in Spanish too long and reduces their English language achievement. But we believe that programs that use only some native tongue in the beginning are closer to structured immersion than they are to the bilingual education that is described and supported in the literature.

75
References Baker, Keith and deKanter, Adriana. 1981. The effectiveness of bilingual education programs: A
review of the literature. Final draft report. Washington, DC: U.S. Department of Educa-tion.
Baker, Keith and deKanter, Adriana. 1983. "Federal Policy and the Effectiveness of Bilingual Edu-cation." In Keith A. Baker, Adriana A. deKanter, eds., Bilingual Education. Lexington, MA: D.C. Heath and Company.
Baker, Keith. 1987. "Comment on Willig's `A Meta-Analysis of Selected Studies in the Effective-ness of Bilingual Education'." Review of Educational Research. 57(3):351-362.
Bali, Valentina. 2000. "'Sink or Swim': What Happened to California's Bilingual Students After Proposition 227?" Unpublished paper, Pasadena, CA: California Institute of Technology.
Bali, Valentina. 2001. "'Sink or Swim': What Happened to California's Bilingual Students After Proposition 227?" State Politics and Policy Quarterly, 1(3): 295-317.
Bruck, Margaret, Jola Jakimik, and G. Richard Tucker. 1971. "Are French Immersion Programs Suitable for Working-Class Children? A Follow-up Investigation." Word 27:311-341.
Cohen, Jacob. 1988. Statistical Power Analysis for the Behavioral Sciences. New York: Academic Press.
Cooper, H.M. 1989. Integrating Research: a Guide for Literature Reviews. (2nd ed)., Newbury Park, Calif.: Sage Publications.
Cziko, Gary A. 1975. "The Effects of Different French Immersion Programs on the Language and Academic Skills of Children from Various Socioeconomic Backgrounds". M.A. thesis, McGill University.
Genesee, Fred. 1976. "The Suitability of Immersion Programs for all Children." Canadian Modern Language Review 32:494-515.
Gersten, Russell, Baker, Scott and Otterstedt, Janet. 1998. “Further Analysis of: A meta-analysis of the effectiveness of bilingual education, by J.P. Greene (1998),” Eugene, OR: Eugene Re-search Institute.
Greene, Jay P. 1998. “A Meta-Analysis of the Effectiveness of Bilingual Education,” Unpublished paper of the Tomas Rivera Policy Institute, Claremont Graduate School.
Greene, Jay P. 1997. “A Meta-Analysis of The Rossell And Baker Review Of Bilingual Education Research, 21 (2 and 3), Bilingual Research Journal, Spring and Summer.
Heckman, J.J. 1979. Sample Selection Bias as a Specification Error, Econometrica, 47, January, 153-161.
Lipsey, Mark W. and Wilson, David B. 2001. Practical Meta-Analysis. Newbury Park, Calif.: Sage Publications.
Los Angeles Unified School District. 1998. “Clarification of English Academic Testing Results for Spanish-Speaking LEP Fifth Graders.”
Meyer, Michael M. and Feinberg, Stephen E. (Eds.) 1992. Assessing Evaluation Studies: the Case of Bilingual Education Strategies. Washington, D.C.: National Academy Press.
Rosenthal, R. 1991. Meta-analytic procedures for social research. Newbury Park, Calif.: Sage Publi-cations.
Rossell, Christine. 2003. “The Near End of Bilingual Education,” Education Next, vol. 3 (4), Fall 2003: 44-52.
Rossell, Christine. 2002. “Dismantling Bilingual Education, Implementing English Immersion: the California Initiative,” February 20.

76
Rossell, Christine. 1980. "Social Science Research in Educational Equity Cases: a Critical Review," Review of Research in Education, 8, 237-295.
Rossell, Christine and Ross, J. Michael. 1986. "The social science evidence on bilingual education." Journal of Law and Education 15:385-419.
Rossell, Christine and Keith Baker. 1996a. "The Educational Effectiveness of Bilingual Education," Research in the Teaching of English, February, 30 (1): 7-74.
Rossell, Christine and Keith Baker. 1996b. Bilingual Education in Massachusetts: the Emperor Has No Clothes. Boston, MA: Pioneer Institute.
Shadish, William R. and Haddock, C. Keith. 1994. “Combining Estimates of Effect Sizes.” In Har-ris Cooper and Larry V. Hedges, Eds. The Handbook of Research Synthesis. New York: Russell Sage Foundation.
Slavin, Robert E. and Alan Cheung. 2003 (December). “Effective Reading Programs for English Language Learners: A Best Evidence Synthesis.” Report 66. Washington, D.C.: Center for Research on the Education of Students Placed At Risk. Available at http://www.csos.jhu.edu/crespar/reports.htm.
Slavin, Robert E. and Alan Cheung. 2004 (July). “Synthesis of Research on Language of Reading Instruction for English Language Learners.” Paper presented at the Workshop on “The Effectiveness of Bilingual School Programs for Immigrant Children” at the Social Science Research Center Berlin (WZB), Programme on Intercultural Conflicts and Societal Integra-tion (AKI),Nov. 18-19, 2004.
Tucker, G. Richard., Wallace E. Lambert, and Alix d'Anglejan. 1973. "French Immersion Programs: A Pilot Investigation." Language Sciences 25:19-26.
Willig, Ann C. 1985. "A Meta-Analysis of Selected Studies on the Effectiveness of Bilingual Educa-tion." Review of Educational Research. 55(3):269-317.
Wolf, Fredric M. 1986. Meta-Analysis: Quantitative Methods for Research Synthesis. Newbury Park, CA: Sage Publications.

146
List of Contributors
Monica Axelsson is senior researcher at the Centre for Bilingual Research, University of Stockholm, Sweden. ([email protected])
Alan Cheung is a researcher at the Success for All Foundation, USA. ([email protected])
Geert Driessen is senior researcher at the Institute for Applied Social Sciences (ITS), Rad-boud University Nijmegen, The Netherlands. ([email protected])
Ingrid Gogolin is Professor of Education at the Institute for Comparative and Multicul-tural Studies, University of Hamburg, Germany. ([email protected]
Julia Kuder is a candidate for a Master's degree in Mathematics in the Department of Mathematics and Statistics, Boston University, USA. ([email protected])
Hans H. Reich is Professor of German as a Second Language and Intercultural Pedagogy at the Institute for Intercultural Education, University of Landau-Koblenz, Germany. ([email protected])
Christine Rossell is Professor of Political Science in the Political Science Department, University of Boston (USA). ([email protected])
Robert Slavin is Co-Director of the Center for Research on the Education of Students Placed at Risk, Johns Hopkins University, USA, and Chairman of the Success for All Foundation. ([email protected] )

Programme on Intercultural Conflicts and Societal Integration
The Programme (AKI) at the Social Science Research Center Berlin (WZB) focuses on the synthesis of research results from different disciplines in the thematic field of immigrant integration and intercultural conflicts. It thus aims to contribute to discussions about future directions of academic research and to provide accessible and sound evaluations of existing knowledge and policy options.
The underlying assumption of the Programme is that a wealth of models and findings are available in academic scholarship that could help German society deal with challenges arising from migration and ethnic plurality. However, this potential is often not fully exploited. The Programme aims to address this deficit by helping to promote co-operation and communication between academics, policy-makers and the wider public. It also aims to encourage interdisciplinary dialogue and to contribute to a higher profile within academia and German society of research into migration and intercultural conflicts.
The Programme began in 2003 and is funded by the Federal Ministry of Education and Research and affiliated with the research area Civil Society, Conflict and Democracy. AKI has a steering group as well as its own advisory committee comprising experts with a policy or media background and scholars from Germany and abroad.
Topics include
• migration and illegality
• language acquisition, educational participation and intergenerational processes of integration
• cultural differences, social identities and educational achievements: research on stereotypes and discrimination
• urban segregation and interethnic conflicts
• official data on the integration of individuals with an immigrant background and of members of ethnic minorities
Publications include a newsletter which is available in an electronic and a printed version.
AKI: Dr. habil. Karen Schönwälder (head), Dipl.-Soz. Janina Söhn (researcher), Manuela Ludwig (secretariat) Members of the steering group: Prof. Dr. Klaus J. Bade, Osnabrück, Prof. Dr. Hartmut Esser, Mannheim, Prof. Dr. Wilhelm Heitmeyer, Bielefeld, Prof. Dr. Amélie Mummendey, Jena, Prof. Dr. Friedhelm Neidhardt, Berlin. Arbeitsstelle Interkulturelle Konflikte und gesellschaftliche Integration (AKI) Wissenschaftszentrum Berlin für Sozialforschung (WZB) Reichpietschufer 50 10785 Berlin Tel.: 030-25491-352 [email protected] www.aki.wz-berlin.de

Rossell, Christine H. und Julia Kuder (2005): Meta-Murky: A Rebuttal to Recent Meta-Analyses of Bilingual Education.
In: Arbeitsstelle Interkulturelle Konflikte und gesellschaftliche Integration (AKI) (ed.). The Effectiveness of Bilingual School Programs for Immigrant Children.
Berlin: Wissenschaftszentrum Berlin für Sozialforschung, Discussion Paper SP IV 2005-601: 43-76.
Online-Publication of Appendices 1a, 1b, 2, 3, 4, 5, 6, 7

Appendix 1a
Effects* of TBE on Second Language Reading, Language, and Math Compared to Other Instructional Techniques as Found in Methodologically Acceptable Studies READING (or ORAL**) LANGUAGE MATH TBE v. Submersion TBE Better AIR (Corpus Christi), Burkheimer et al., Cohen, 1975a; Bacon, 1975b; Bacon, Kidd & 1989 Kidd & Seaberg, 1982; Seaberg, 1982; Burkheimer Burkheimer et al., 1989 et al., 1989; Campeau et al., 1975; Carsrud & Curtis, 1980; Covey, 1973; Kaufman, 1968; Legaretta, 1979; McConnell, 1980; Morgan, 1971; Olesini, 1971; Plante, 1976; Zirkel, 1972 (N=13) (N=1) (N=3) No Difference AIR (Corpus Christi), Ariza, 1988; Ed. Alvarez, 1975; Ariza, 1988; 1975b; Alvarez, 1975; Op. Concepts, Bates, 1970; Carsrud & Ariza, 1988; Barclay, 1991b; Maldonado, Curtis, 1980; Cohen, 1969**; Campeau, et al., 1977; Rothfarb, 1975a; Covey, 1973; 1975; Carsrud & Curtis, Ariza & Urrutia, Danoff et al., 1977; 1978 1980; Ciriza, 1990a**; 1989 Ed. Op. Concepts, 1991b; Cohen, 1975a; Cottrell, Layden, 1972; Maldonado, 1971; Huzar, 1973; 1977; McSpadden, 1979; Kaufman, 1968; Lampman, 1980; Moore & Parr, 1978; 1973; Legaretta, 1979; Powers, 1978; Rothfarb, Maldonaldo, 1977; Ariza, & Urrutia, 1989; Matthews, 1979; McSpadden, Stebbins, et al., 1977; 1979; 1980; Morgan, 1971; Vasquez, 1990; de Weffer, Plante, 1976; Powers, 1972 1978; Prewitt-Diaz, 1979; Rothfarb, Ariza, & Urrutia, 1989; Stebbens et al., 1977; Skoczylas, 1972; Vasquez, 1990; de Weffer, 1972; Zirkel, 1972 (N=27) (N=4) (N=19)

TBE Worse Bates, 1970; Burkheimer Burkheimer et al., Burkheimer et al., 1989; et al., 1989; Cohen, Fathman, 1989; Curiel, 1979; Cohen, Fathman, & & Merino, 1976; Curiel, 1979; Curiel, Stenning, & McSpadden, 1980; Ed. Op. Curiel, Stenning, & Cooper, Cooper, 1980; Ed. Concepts, 1991a; El Paso, 1980; Danoff et al., 1977; Op. Concepts, 1987; 1990; 1992; 1978; Ed. Op. Concepts, 1991a; El Paso, Maldonado, 1977; Merino, 1991a; 1991b; El Paso, 1987; 1990; 1992; 1976; Skoczylas, 1972; 1987; 1990; 1992; Layden, Teschner, 1990; Stern, 1975; Teschner, 1972; McSpadden, 1980; Valladolid, 1991 1990; Valladolid, 1991 Melendez, 1980; Moore and Parr, 1978; Stern, 1975; Teschner, 1990; Valladolid, 1991; Webb, Clerc & Gavito, 1987 (N=20) (N=9) (N=12) TBE v. ESL TBE Better Ames & Bicks, 1978 (N=0) (N=0) (N=1) No Difference Ames & Bicks, 1978; Rossell, 1990; Rossell, 1990; Yap, Balasubramonium et al., Yap, Enoki & Enoki, & Ishitani, 1973; Lum, 1971; Rossell, Ishitani, 1988 1988 1990; Yap, Enoki & Ishitani, 1988 (N=5) (N=2) (N=2) TBE Worse Lum, 1971; Rossell, 1990 Rossell, 1990 Rossell, 1990 (N=2) (N=1) (N=1) TBE v. Structured Immersion No Difference Ramirez et al., 1991; Ramos Ramiriz et al., 1991 Barik, Swain, & et al., 1967 Nwanunobi, 1977; Barik & Swain, 1975; Lambert & Tucker, 1972; Ramiriz et al., 1991; Ramos et al., 1967 (N=2) (N=1) (N=5) TBE Worse Barik, Swain, & Nwanunobi, Genessee & Lambert, 1977; Barik & Swain, 1978; 1983; Genessee et al., Bruck, Lambert, & Tucker, 1989; Gersten, 1985 1977; Day & Shapson, 1988;

Genessee & Lambert, 1983; Genessee, Lambert & Tucker, 1977; Genessee et al., 1989; Gersten, 1985; Malherbe, 1946; Pena-Hughes & Solis, 1980 (N=10) (N=0) (N=3) Immersion v. ESL Immersion Better Barik & Swain, 1975; Becker and Gersten, 1982 Lambert & Tucker, 1972 (N=3) (N=0) (N=0) TBE v. Maint. BE TBE Better Medina & Escamilla, 1992** (N=1) (N=0) (N=0) *Studies are listed in more than one category if there were different effects for different grades or cohorts. **Oral English achievement gains for preschool programs.

Appendix 1b
Revised Effects* of TBE on Second Language Reading, Language, and Math Compared to Other Instructional Techniques as Found in Methodologically Acceptable Studies READING (or ORAL**) LANGUAGE MATH
TBE v. SubmersionTBE Better AIR (Campeau, Corpus Christi), Burkheimer et al., Cohen, 1975a; Bacon,
1975b; Bacon, Kidd & 1989 Kidd & Seaberg, 1982; Seaberg, 1982; Burkheimer Burkheimer et al., 1989 et al., 1989; Campeau et al., 1975; Carsrud & Curtis, 1980; Covey, 1973; Kaufman, 1968; Legaretta, 1979; McConnell, 1980; Morgan, 1971; Olesini, 1971;1 Plante, 1976; Zirkel,
1972 (N=7) (N=1) (N=2)
No Difference AIR (Campeau, Corpus Christi), Ariza, 1988; Ed. Alvarez, 1975; Ariza, 1988; 1975b; Alvarez, 1975; Op. Concepts, Bates, 1970; Carsrud & Ariza, 1988; Barclay, 1991b; Maldonado, Curtis, 1980; Cohen, 1969**; Campeau, et al., 1977; Rothfarb, 1975a; D25 1975; Carsrud & Curtis, Ariza & Urrutia, Danoff et al., 1977; 1978 1980; Ciriza, 1990a**; 1989 Ed. Op. Concepts, 1991b; Cohen, 1975a; Cottrell, Layden, 1972; Maldonado, 1971; Huzar, 1973; 1977; McSpadden, 1979; Kaufman, 1968; Lampman, 1980; Moore & Parr, 1978; 1973; Legaretta, 1979; Powers, 1978;
Rothfarb, Maldonaldo, 1977; Ariza, & Urrutia, 1989; Matthews, 1979; McSpadden, Stebbins, et al., 1977; 1979; 1980; Morgan, 1971; Vasquez, 1990; de Weffer, Plante, 1976; Powers, 1972 1978; Prewitt-Diaz, 1979; Rothfarb, Ariza, & Urrutia, 1989; Stebbens et al., 1977; Skoczylas, 1972; Vasquez, 1990; de Weffer, 1972; Zirkel, 1972 (N=18) (N=2) (N=11)
1 Olesini, 1971 was accidentally inserted into Table 1 and Appendix 1 in Rossell and Baker. It was considered methodologically unacceptable in Baker and deKanter 1983b.

TBE Worse Bates, 1970; Burkheimer Burkheimer et al., Burkheimer et al., 1989;
et al., 1989; Cohen, Fathman, 1989; Curiel, 1979; Cohen, Fathman, & Merino, 1976;
& Merino, 1976; Curiel, 1979; Curiel, Stenning, & McSpadden, 1980; Ed. Op. Curiel, Stenning, & Cooper, Cooper, 1980; Ed. Concepts, 1991a; El Paso, 1980; Danoff et al., 1977; Op. Concepts, 1987; 1990; 1992; 1978; Ed. Op. Concepts, 1991a; El Paso, Maldonado, 1977; Merino, 1991a; 1991b; El Paso, 1987; 1990; 1992; 1976; Skoczylas, 1972; 1987; 1990; 1992; Layden, Teschner, 1990; Stern, 1975; Teschner, 1972; McSpadden, 1980; Valladolid, 1991 1990; Valladolid, 1991 Melendez, 1980; Moore Moore & Parr. 1978 & Parr, 1978; Stern, 1975; Teschner, 1990; Valladolid, 1991; Webb, Clerc & Gavito, 1987 (N=10) (N=4) (N=7)
TBE v. ESLTBE Better Ames & Bicks, 1978
(N=0) (N=0) (N=1) No Difference Ames & Bicks, 1978; Rossell, 1990; Rossell, 1990; Yap,
Balasubramonium et al., Yap, Enoki & Enoki, & Ishitani, 1973; Lum, 1971; Rossell, Ishitani, 1988 1988 1990; Yap, Enoki & Ishitani, 1988 (N=2) (N=1) (N=1)
TBE Worse Lum, 1971; Rossell, 1990 Rossell, 1990 Rossell, 1990 Valladolid, 1991 Valladolid, 1991 Valladolid, 1991 (N=2) (N=2) (N=2)
TBE v. Structured ImmersionNo Difference Ramirez et al., 1991; Ramos Ramiriz et al., 1991 Barik, Swain, &
et al., 1967 Nwanunobi, 1977; Barik & Swain, 1975; Lambert & Tucker, 1972; Ramiriz et al., 1991; Ramos et al., 1967 (N=2) (N=1) (N=5)
TBE Worse Barik, Swain, & Nwanunobi, Genessee & Lambert, 1977; Barik & Swain, 1978; 1983; Genessee et al., Bruck, Lambert, & Tucker, 1989; Gersten, 1985 1977; Day & Shapson, 1988;

Genessee & Lambert, 1983; Genessee, Lambert & Tucker, 1977; Genessee et al., 1989; Gersten, 1985; Malherbe, 1946; Pena-Hughes & Solis, 1980 El Paso 1987; 1990,1992 El Paso 1987; 1990,1992 El Paso 1987; 1990,1992 (N=12) (N=3) (N=5)
Immersion v. ESLImmersion Better Barik & Swain, 1975;
Becker and Gersten, 1982 Lambert & Tucker, 1972 Gersten, 1985 Gersten, 1985 (N=4) (N=0) (N=1)
TBE v. Maint. BETBE Better Medina & Escamilla, 1992**
(N=0) (N=0) (N=0)
*Studies are listed in more than one category if there were different effects for different grades or cohorts. **Oral English achievement gains for preschool programs.

Appendix 2
METHODOLOGICALLY ACCEPTABLE STUDIES FROM ROSSELL & BAKER WITH NEW REJECTION CRITERIA: 1) U.S. SECONDARY TBE PROGRAM,
2) NON-HISPANIC U.S. TBE PROGRAM, 3) PROGRAM LESS THAN AN ACADEMIC YEAR,
4) REDUNDANT STUDY (errors, not new criteria) (Original N = 70; New N=50)
Alvarez, Juan M. (1975). "Comparison of Academic Aspirations and Achievement in Bilingual versus
Monolingual Classrooms." Ph.D. dissertation, University of Texas.** American Institutes for Research. (Campeau, et al.,1975b). "Bilingual Education Program
(Aprendemos En Dos Idiomas), Corpus Christi, Texas." Identification and Description of Exemplary Bilingual Education Programs. Palo Alto, California.** [CITED AS CAMPEAU, ET AL IN SLAVIN AND CHEUNG (2004).]
Ames, J.S., and Bicks, Pat. 1978. An Evaluation of Title VII Bilingual/ Bicultural Program, 1977-78
School Year, Final Report, Community School District 22. Brooklyn, New York: School District of New York.*,**
Ariza, Maria 1988. "Evaluating Limited English Proficient Students' Achievement: Does Curriculum
Content in the Home Language Make a Difference?" Paper presented at the annual meeting of the American Educational Research Association, New Orleans. (4)
Bacon, Herbert L. and Gerald D. Kidd, et al. 1982. "The Effectiveness of Bilingual Instruction with
Cherokee Indian Students." Journal of American Indian Education :34-43. (2) Balasubramonian, K., H.N. Seelye, & C.R.E. de Weffer. 1973. "Do Bilingual Education Programs
Inhibit English Language Achievement: A Report on an Illinois Experiment." Paper presented at the Seventh Annual Convention of Teachers of English to Speakers of Other Languages, San Juan, Puerto Rico.*,** (3)
Barclay, Lisa. 1969. "The Comparative Efficacies of Spanish, English and Bilingual Cognitive Verbal
Instruction with Mexican American Head Start Children." Ph.D. dissertation, Stanford University. (3)
Barik, Henri, and Swain, Merrill. 1975. "Three Year Evaluation of a Large Scale Early Grade French
Immersion Program: The Ottawa Study." Language Learning 25(1):1-30.*,** Barik, Henri C., and Merrill Swain. 1978. Evaluation of a Bilingual Education Program in Canada:
The Elgin Study Through Grade Six. Switzerland: Commission Interuniversitaire Suisse de Linguistique Appliquee.*
Barik, Henry C., Merrill Swain, and E.A. Nwanunobi. 1977. "English-French Bilingual Education:
The Elgin Study Through Grade Five." Canadian Modern Language Review 33:459-475.*,** Bates, Enid May Buswell. 1970. "The Effects of One Experimental Bilingual Program on Verbal
Ability and Vocabulary of First Grade Pupils." Ph.D. dissertation, Texas Tech University.** (3)
Becker, Wesley C., and Russell Gersten. 1982. "A Follow-up of Follow Through: The Later Effects of
the Direct Instruction Model on Children in Fifth and Sixth Grades." American Educational Research Journal 19:75-92.*

Bruck, Margaret, Wallace E. Lambert, and G. Richard Tucker. 1977. "Cognitive Consequences of Bilingual Schooling: The St. Lambert Project Through Grade Six." Linguistics 24:13-33, January.*
Burkheimer, Graham J., Conger, A.J., Dunteman, G.H., Elliott, B.G., Mowbray, K.A. 1989.
Effectiveness of Services for Language-Minority Limited-English-Proficient Students. Report to the U.S. Department of Education.
Campeau, Peggie L., A. Oscar H. Roberts, John E. Bowers, Melanie Austin, and Sarah J. Roberts.
1975. The Identification and Description of Exemplary Bilingual Education Programs. Palo Alto, CA: American Institutes for Research.* (4)
Carsrud, Karen, and Curtis, John. 1980. ESEA Title VII Bilingual Program: Final Report. Austin,
Texas: Austin Independent School District.*,** Ciriza, Frank. 1990a. Evaluation Report of the Preschool Project for Spanish-Speaking Children,
1989-90. San Diego City Schools, Planning, Research and Evaluation Division. Cohen, Andrew D. 1975a. A Sociolinguistic Approach to Bilingual Education. Rowley, MA:
Newbury House Press, Publishers, Inc. *,** Cohen, Andrew D., Ann K. Fathman, and Barbara Merino. 1976. The Redwood City Bilingual
Education Project, 1971-74: Spanish and English Proficiency, Mathematics and Language Use Over Time. Toronto: Ontario Institute for Studies in Education. *
Cottrell, Milford C. 1971. "Bilingual Education in San Juan County, Utah: A Cross Cultural
Emphasis". Paper presented at the annual meeting of the American Educational Research Association, New York.*,**
Covey, D.D. 1973. "An Analytical Study of Secondary Freshman Bilingual Education and its Effect
on Academic Achievement and Attitudes of Mexican American Students". Ph.D. dissertation, Arizona State University.*,** (1)
Curiel, Herman, Stenning, Walter & Cooper-Stenning, Peggy. 1980. "Achieved Reading Level, Self-
Esteem, and Grades as Related to Length of Exposure to Bilingual Education." Hispanic Journal of Behavioral Sciences 2(4):389-400. (4)
Curiel, Herman. 1979. "A Comparative Study Investigating Achieved Reading Level, Self-Esteem,
and Achieved Grade Point Average Given Varying Participation." Ph.D. dissertation, Texas A. & M. University.
Danoff, Malcolm N.; Arias, Beatriz M.; Coles; Gary J.; McLaughlin, Donald H.; and Reynolds,
Dorothy J. 1977. Evaluation of the Impact of ESEA Title VII Spanish/English Bilingual Education Programs, Volume I and II. Palo Alto, Calif.: American Institutes for Research.*,**
1978. Evaluation of the Impact of ESEA Title VII Spanish/English Bilingual Education
Program, Vol III and IV. Palo Alto: American Institutes for Research.*,** Day, Elaine M. and Shapson, Stan M. 1988. "Provincial Assessment of Early and Late French
Immersion Programs in British Columbia, Canada." Paper presented at the annual meeting of the American Educational Research Association, New Orleans, April.
de Weffer, Rafaela de Carmen Elizondo. 1972. "Effects of First Language Instruction in Academic
and Psychological Development of Bilingual Children." Ph.D. dissertation, Illinois Institute of Technology.** (3)

de la Garza, Jesus Valenzuela and Medina, Marcello. 1985. "Academic Achievement as Influenced by Bilingual Instruction for Spanish-Dominant Mexican American Children." Hispanic Journal of Behavioral Sciences 7(3):247-259. [ERROR—WAS SUPPOSED TO BE IN REJECTION BIBLIOGRAPHY.]
Educational Operations Concepts, Inc. 1991a. An Evaluation of the Title VII ESEA Bilingual
Education Program for Hmong and Cambodian Students in Junior and Senior High School. St. Paul, MN. (2)
Educational Operations Concepts, Inc. 1991b. An Evaluation of the Title VII ESEA Bilingual
Education Program for Hmong and Cambodian Students in Kindergarten and First Grade. St. Paul, MN. (2)
El Paso Independent School District. 1987. Interim Report of the Five-Year Bilingual Education Pilot
1986-87 School Year. El Paso, TX: Office for Research and Evaluation. El Paso Independent School District. 1990. Bilingual Education Evaluation: the Sixth Year in a
Longitudinal Study. El Paso, TX: Office for Research and Evaluation, September. El Paso Independent School District. 1992. Bilingual Education Evaluation. El Paso, TX: Office for
Research and Evaluation, November. Genesee, Fred and W.E. Lambert. 1983. "Trilingual Education for Majority-Language Children."
Child Development 54:105-114. Genesee, Fred; Holobow, Naomi E., Lambert, Wallace E., and Chartrand, Louise. 1989. "Three
Elementary School Alternatives for Learning through a Second Language." The Modern Language Journal 73:250-263.
Genesee, Fred., Wallace E. Lambert, and G.E. Tucker. 1977. An Experiment in Trilingual Education.
Montreal: McGill University.* Gersten, Russell. 1985. "Structured Immersion for Language Minority Students Results of a
Longitudinal Evaluation." Educational Evaluation and Policy Analysis 7:187-196.* Huzar, Helen. 1973. "The Effects of an English-Spanish Primary Grade Reading Program on Second
and Third Grade Students." M.Ed. thesis, Rutgers University.*,** Kaufman, Maurice. 1968. "Will Instruction in Reading Spanish Affect Ability in Reading English?
Journal of Reading 11:521-27.*,** (1) Lambert, W.E., and Tucker, G.R. 1972. Bilingual Education of Children: The St. Lambert Experience.
Rowley, Mass.: Newbury House Press.*,** Lampman, Henry P. 1973. "Southeastern New Mexico Bilingual Program. Final Report." Artesia,
N.M.: Artesia Public Schools.** Layden, Russell Glenn. 1972. "The Relationship between the Language of Instruction and the
Development of Self-Concept, Classroom Climate and Achievement of Spanish Speaking Puerto Rican Children." Ph.D. dissertation, University of Maryland.** (3)
Legarreta, Dorothy. 1979. "The Effects of Program models on Language Acquisition by Spanish
Speaking Children." TESOL Quarterly 13(4):521-34.*,**

Lum, John Bernard. 1971. "An Effectiveness Study of English as a Second Language (ESL) and Chinese Bilingual Methods." Ph.D. dissertation, University of California at Berkeley.*,** (2)
Maldonado, Jesus Ruben. 1977. "The Effect of the ESEA Title VII Program on the Cognitive
Development of Mexican American students." Ph.D. dissertation, University of Houston. Malherbe, E.C. 1946. The Bilingual School. London: Longmans Green.** Matthews, T. 1979. An Investigation of the Effects of Background Characteristics and Special
Language Services on the Reading Achievement and English Fluency of Bilingual Students. Seattle, Wash: Seattle Public School, Department of Planning Research and Evaluation.*,** (2)
McConnell, Beverly Brown. 1980a. "Effectiveness of Individualized Bilingual Instruction for Migrant
Students." Ph.D. dissertation, Washington State University.*,** 1980b. Individualized Bilingual Instruction. Final Evaluation, 1978-79 Program.
Pullman, Wash.** [NEVER COUNTED AS ADDITIONAL STUDY/] McSpadden, J.R. 1979. Acadiana Bilingual Bicultural Education Program: Interim Evaluation Report,
1978-79. Lafayette Parish, LA.*,** (2) 1980. Acadiana Bilingual Bicultural Education Program. Interim Evaluation Report
1979-80. Lafayette Parish, La.*,** (2) Medina, Marcello and Escamilla, Kathy. 1992. "Evaluation of Transitional and Maintenance Bilingual
Programs." Urban Education 27(3):263-290. (2) Melendez, William Anselmo. 1980. "The Effect of the Language of Instruction on the Reading
Achievement of Limited English Speakers in Secondary Schools." Ph.D. dissertation, Loyola University of Chicago.**
Moore, Fernie.B., and Gerald D. Parr. 1978. "Models of Bilingual Education: Comparisons of
Effectiveness." The Elementary School Journal 79:93-97. *,** Morgan, Judith Claire. 1971. "The Effects of Bilingual Instruction on the English Language Arts
Achievement of First Grade Children." Ph.D. dissertation, Northwestern State University of Louisiana.** (2)
Pena-Hughes, Eva, and Juan Solis. 1980. ABCs. McAllen, Texas: McAllen Independent School
District.*,** Plante, Alexander, J. 1976. A Study of the Effectiveness of the Connecticut "Pairing" Model of
Bilingual-Bicultural Education. Hamden, Conn.: Connecticut Staff Development Cooperative.*,**
Powers, Stephen. 1978. "The Influence of Bilingual Instruction on Academic Achievement and Self-
Esteem of Selected Mexican-American Junior High School Students." Ph.D. dissertation, University of Arizona.**
Prewitt Diaz, Joseph O. 1979. "An Analysis of the Effects of a Bilingual Curriculum on Monolingual
Spanish Ninth Graders as Compared with Monolingual English and bilingual Ninth Graders with Regard to Language Development, Attitude toward School and Self-Concept." Ph.D. dissertation, University of Connecticut.**

Ramirez, J. David, Pasta, David J., Yuen, Sandra D., Billings, David K., Ramey, Dena R. 1991. Final Report: Longitudinal Study of Structured Immersion Strategy, Early-Exit and Late-Exit Transitional Bilingual Education Programs for Language-Minority Children. San Mateo, CA: Aguirre International, report to the U.S. Department of Education, Washington, D.C.
Ramos, M.; Aguilar, J.V., and Sibayan, B.F. 1967. The Determination and Implementation of
Language Policy. Philippine Center for Language Study Monograph Series 2. Quezon City, The Philippines: Alemor/Phoenix.*,**
Rossell, Christine H. 1990. "The Effectiveness of Educational Alternatives for Limited-English-
Proficient Children." In Learning in Two Languages. Ed. Gary Imhoff. New Brunswick, N.J.: Transaction Publishers.
Rothfarb, Sylvia H., Ariza, Maria J. and Urrutia, Rafael. 1987. Evaluation of the Bilingual Curriculum
Content (BCC) Project: A three-Year Study Final Report. Dade County: Office of Educational Accountability.
Skoczylas, Rudolph V. 1972. "An Evaluation of Some Cognitive and Affective Aspects of a Spanish-
English Bilingual Education Program." Ph.D. dissertation, University of New Mexico.*,** Stebbins, Linda B.; St. Pierre, Robert G.: Proper, Elizabeth C.; Anderson, Richard B.; and Carva,
Thomas R. 1977. Education as Experimentation: A Planned Variation Model Volume IV-A An Evaluation of Follow Through. Cambridge, Mass.: ABT Associates.*,**
Stern, Carolyn. 1975. Final Report of the Compton Unified School District's Title VII Bilingual-
Bicultural Project: September 1969 through June 1975. Compton City, Calif.: Compton City Schools.*,**
Teschner, Richard V. 1990. "Adequate Motivation and Bilingual Education." Southwest Journal of
Instruction 9:1-42. Valladolid, Lupe A. 1991. "The Effect of Bilingual Education on Students' Academic Achievement as
They Progress Through a Bilingual Program." Ph.D. dissertation, San Diego, CA: United States International University.
Vasquez, Miriam. 1990. "A Longitudinal Study of Cohort Academic Success and Bilingual
Education." Ph.D. dissertation, University of Rochester. Yap, Kim O. and Enoki, Donald Y. and Ishitani, Patricia. 1988. "SLEP Student Achievement: Some
Pertinent Variables and Policy Implications." A paper presented at the annual meeting of the American Educational Research Association, New Orleans, April 5-9. (2)
Webb, John A. Clerc, R. J., and Gavito, Alfredo. 1987. Houston Independent School District:
Comparison of Bilingual and Immersion Programs Using Structural Modeling. Houston Independent School District.
Zirkel, Perry A. 1972. "An Evaluation of the Effectiveness of Selected Experimental Bilingual
Education Programs in Connecticut". Ph.D. dissertation, University of Connecticut.*,** * From Rossell and Ross, 1986. **From Baker and de Kanter, 1983b. 1
1 Olesini, 1971 was accidentally inserted into Table 1 and Appendix 1. It had been considered methodologically acceptable in Baker and deKanter 1991, but not in Baker and deKanter, 1983b. The merger of the earlier Baker and deKanter review with the Rossell and Ross review was supposed to be based on Baker and deKanter, 1993b, not Baker and deKanter, 1991.

Appendix 3
Greene List of Unacceptable Studies with Rossell Comments
Studies Excluded Because They Are Redundant
Ariza, M. (1988). Evaluating limited English proficient students' achievement: Does curriculum content in the home language make a difference? Paper presented at the April meetings of the American Educational Research Association, New Orleans. Redundant with Rothfarb et al., 1987.
• I agree. • R & B Finding: No difference between transitional bilingual education (TBE) and
mainstream.
Barik, H., and Swain, M. (1978). Evaluation of a bilingual education program in Canada: The Elgin Study through grade six. Switzerland: Commission Interuniversitaire Suisse de Linguistique Appliquee. Redundant with Barik et al. 1977.
• I disagree. This evaluation by Barik and Swain analyzed the 1975-76 school year and the evaluation by Barik, Swain, and Nwanumobi analyzed the 1974-75 school year.
• R & B finding: TBE worse than structured immersion.
Cohen, A. D., Fathman, A. K., & Merino, B. (1976). The Redwood City bilingual education report, 1971-1974: Spanish and English proficiency, mathematics, and language-use over time. Toronto: Ontario Institute for Studies in Education. Redundant with Cohen 1975.
• I disagree. Cohen, 1975 evaluated bilingual education for grades 1-3 from 1969-1972 whereas Cohen, Fathman, and Merino evaluated it for grades 3-5 from 1972-1975.
• R & B finding: TBE worse than mainstream in Cohen, Fathman, and Merino; No difference in Cohen.
Curiel, H., Stenning, W., & Cooper-Stenning, P. (1980). Achieved reading level, self-esteem, and grades as related to length of exposure to bilingual education. Hispanic Journal of Behavioral Sciences, 2, 389-400. Redundant with Curiel, 1979.
• I agree. • R & B finding: TBE worse than mainstream.
Danoff, M. N., Coles, G. J., McLaughlin, D. H., & Reynolds, D. J. (1977b). Evaluation of the impact of ESEA Title VII Spanish/English bilingual education programs, Vol. I: Study design and interim findings. Palo Alto: American Institutes for Research. Redundant with Danoff et al. 1977a.
• Greene is wrong. We did not count 1977a and 1977b as two separate studies (see Appendix 1a).
• R & B finding: TBE worse than mainstream.
(1978a). Evaluation of the impact of ESEA Title VII Spanish/English bilingual education programs, Vol. III: Year two impact designs. Palo Alto: American Institutes for Research.
• I disagree. The 1977 study is of 37 school districts during the 1975-76 school year; the 1978 study is an analysis of data collected after the 1977 study in a smaller sample of schools.
• R & B finding: TBE worse than mainstream.

(1978b). Evaluation of the impact of ESEA Title VII Spanish/English bilingual education programs, Vol. IV: Overview of the study and findings. Palo Alto: American Institutes for Research.
• Greene is wrong. We did not count this as a separate study (see Appendix 1a). .
Educational Operations Concepts, Inc. (1991b). An evaluation of the Title VII ESEA bilingual education program for Hmong and Cambodian students in kindergarten and first grade. St. Paul. Redundant with Educational Operations Concepts, Inc. 1991a.
• I disagree. Educational Operations Concepts 1991a is of junior and senior high school students and 1991b is of kindergarten and first grade students.
• R & B finding: No difference between TBE and mainstream for K-1 students in language and math; TBE worse than mainstream for K-1 students in reading and junior/senior high students in reading, language, and math.
El Paso Independent School District. (1990). Bilingual education evaluation: The sixth year in a longitudinal study. El Paso: Office for Research and Evaluation. Redundant with El Paso 1987.
• I disagree. El Paso 1987 analyzed grades 1-3 in 1986-87; El Paso 1990 analyzed grades PK-6 in 1989-90.
• R & B finding: TBE worse than mainstream. R & B made an error in constructing the table, it should be TBE worse than structured immersion.
El Paso Independent School District. (1992). Bilingual education evaluation. El Paso: Office for Research and Evaluation. Redundant with El Paso 1987.
• I disagree. El Paso 1987 analyzed grades 1-3 in 1986-87; El Paso 1990 analyzed grades PK-6 in 1989-90; and El Paso 1992 analyzed grades 3-11 in the 1990-91 and 1991-92 school years.
• R & B finding: TBE worse than mainstream. R & B made an error in constructing the table, it should be TBE worse than structured immersion.
Genesee, F., Lambert, W. E., & Tucker, G. E. (1977). An experiment in trilingual education. Montreal: McGill University. Redundant with Genesee et al 1983.
• I disagree. Genesee, Lambert, and Tucker 1977 analyzed students in grades 3-5 in two immersion schools in 1976-77; Genesee and Lambert, 1983 analyzed only fifth graders who had been in the program for five years. Although there is no information on when the data was collected in the latter study, it is obviously a different sample from the earlier study.
• R & B Finding: TBE worse than structured immersion.
McConnell, B. B. (1980b). Individualized bilingual instruction, final evaluation, 1978-1979 program. Pullman. Redundant with McConnell 1980a.
• Greene is wrong. We did not count the various versions of McConnell’s study of the Pullman bilingual education program as separate studies (see Appendix 1a).
• R & B Finding: TBE better than submersion (a mainstream classroom) in reading.
(1980c). Individualized bilingual instruction for migrants. Paper presented at the October meeting of the International Congress for Individualized Instruction, Windsor.
• Greene is wrong. We did not count the various versions of McConnell’s study of the Pullman bilingual education program as separate studies (see Appendix 1a).
• R & B Finding: TBE better than submersion (mainstream classroom) in reading.

McSpadden, J. R. (1980). Arcadia bilingual bicultural education program: Interim evaluation report, 1979-80. Lafayette Parish. Redundant with McSpadden 1979.
• I disagree. Neither of these studies is available any longer (thrown out when Keith Baker retired from the Department of Education in 1997) so Greene must have just guessed they were redundant.
• If you look at Appendix 1a, you can see that McSpadden 1979 shows no difference between TBE and a mainstream classroom and McSpadden 1980 shows TBE to be worse so clearly they have different samples.
Teschner, R. V. (1990). Adequate motivation and bilingual education. Southwest Journal of Instruction, 9, 1-42. Redundant with El Paso, 1990.
• I disagree. Teschner analyzes third graders from spring 1987 through spring 1989; El Paso 1990 analyzed grades PK-6 in 1989-90.
• R & B finding: TBE worse in reading, language, and math.
Studies Excluded Because They Are Unavailable
American Institutes for Research. (1975b). Bilingual education program (Aprendemos En Dos Idiomas). Corpus Christi. Palo Alto: Identification and Description of Exemplary Bilingual Education Programs.
• Greene is wrong. The study is available and both Slavin and Cheung (2004) and I have copies. It is cited in Slavin and Cheung as Campeau, et al. (1975).
• R & B finding: TBE better in reading in some grades and no different in others.
Lambert, W. E., & Tucker, G. R. (1972). Bilingual education of children: The St. Lambert experience. Rowley, MA: Newbury House.
• Greene is wrong. It is available at many libraries. I have a copy of it that I would have provided to him had he asked.
• R & B finding: No difference between TBE and structured immersion in math; structured immersion better than ESL in reading.
McSpadden, J. R. (1979). Arcadia bilingual bicultural education program: Interim evaluation report, 1978-79. Lafayette Parish.
• Greene is correct, but the 1980 report has also disappeared. • I would now exclude this study as it is U.S., but not of Spanish speakers. • R & B finding: TBE worse (1980); TBE no different (1979)
Morgan, J. C. (1971). The effects of bilingual instruction of the English language arts achievement of first grade children. Doctoral dissertation, Northwestern State University of Louisiana.
• Greene is wrong. This is available through Dissertation Abstracts at the University of Michigan. I have a copy of it that I would have provided to him had he asked.
• I would, however, now exclude this study as it is U.S. but not Spanish speakers. • R & B finding: TBE better than mainstream.

Ramos, M., Aguilar, J. V., & Sibayan, B. F. (1967). The determination and implementation of language policy (Monograph Series 2). Quezon City: Philippine Center for Language Study.
• Greene is wrong. It is available at many libraries. I have a copy of it that I would have provided to him had he asked.
• R & B finding: No difference between TBE and structured immersion
Studies Excluded Because They Are Not Evaluations Of Bilingual Programs
Becker, W. C. & Gersten, R. (1982). A follow-up of follow through: The latter effects of the Direct Instruction Model on children in fifth and sixth grades. American Educational Research Journal, 19, 75-92.
• I agree with the point, but R & B did not need to exclude---our goal was broader. • R & B finding: structured immersion better than ESL
Campeau, P. L., Roberts, A., Oscar H., Bowers, J. E., Austin, M., & Roberts, S. J. (1975). The identification and description of exemplary bilingual education programs. Palo Alto: American Institutes for Research.
• I disagree. This is an evaluation of bilingual education programs as the title indicates. However, I have now decided to exclude on the grounds that there is insufficient information to justify inclusion.
• R & B finding: TBE better than mainstream.
Webb, J. A., Clerc, R. J., & Gavito, A. (1987). Houston Independent School District: Comparison of bilingual and immersion programs using structural modeling. Houston Independent School District.
• I disagree. This is an evaluation of bilingual education programs as the title indicates and the outcome is achievement as well as other outcomes.
• R & B finding: TBE worse than mainstream.
Studies Excluded Because There Is Not An Appropriate Control Group
Barik, H., Swain, M. & Nwanunobi, E. A. (1977). English-French bilingual education: The Elgin Study through grade five. Canadian Modern Language Review, 33, 459-475.
• I disagree. There were two comparisons in this study. The treatment group is native English speakers in Partial French Immersion (i.e. bilingual education). In the first comparison for English language outcomes, the control group was native English speakers in English education (immersion). The PFI (i.e. TBE) students did worse in English reading and math than the students educated completely in English. In the second comparison for French language outcomes, the control group was Native English speakers enrolled in TFI (total French Immersion). The PFI (i.e. TBE) students did worse in French reading, but there was no difference in math. We only used the findings for French outcomes, but we could have justified using the first findings as well.
• R & B finding: TBE worse than structured immersion in reading, no different in math.
Bruck, M., Lambert, W. E., & Tucker, G. R. (1977). Cognitive consequences of bilingual schooling: The St. Lambert project through grade six. Linguistics, 24, 13-33.
• I disagree. There were two control groups: native English speakers receiving some French instruction and native French speakers receiving all French instruction. The groups were

carefully compared for equivalence using socioeconomic status, IQ, language achievement, and home background factors based on home interviews.
• R & B finding: TBE worse than structured immersion in reading.
Burkheimer, G. J., Conger, A.J., Dunteman, G.H., Elliott, B.G., & Mowbray, K.A. (1989). Effectiveness of services for language-minority limited- English-proficient students. Report to the U.S. Department of Education.
• I disagree. Burkheimer et al. is a very sophisticated multiple regression analysis controlling for many instructional variables including the amount of instruction in Spanish. The only students studied were limited English proficient Spanish speakers.
• R & B finding: TBE better than mainstream in reading, language, and math.
Day, E. M., & Shapson, S. M. (1988). Provincial assessment of early and late French immersion programs in British Columbia, Canada. Paper presented at the April meetings of the American Educational Research Associates, New Orleans. No background controls or individual level data reported.
• I disagree. Randomly selected native English speakers in early and late French immersion were compared to each other and to both native English speakers in English education and Francophone students matched on the basis of socioeconomic status and academic ability. Analysis of variance was used. Early immersion students did better than late immersion (i.e. TBE) students.
• R & B finding: TBE worse than structured immersion.
El Paso Independent School District. (1987). Interim report of the five-year bilingual education pilot 1986-1987 school year. El Paso: Office for Research and Evaluation. No background or pretest controls.
• I disagree. The students were all Spanish speaking ELLs matched on important demographic variables. However, I now believe this study compared TBE to structured immersion. Therefore, the new finding is that TBE is worse than structured immersion.
• R & B finding: TBE worse than mainstream classroom.
Genesee, F., & Lambert, W. E. (1983). Trilingual education for majority-language children. Child Development, 54, 105-114. No background controls.
• I disagree; pre-test controls were used and similar groups were compared. • R & B finding: TBE worse than structured immersion in reading and math.
Genesee, F., Holobow, N. E., Lambert, W. E, & Chartrand, L. (1989). Three elementary school alternatives for learning through a second language. The Modern Language Journal, 73, 250-263. No background controls.
• I disagree; pre-test controls were used and similar groups were compared. • R & B finding: TBE worse than structured immersion in reading and math.
Gersten, R. (1985). Structured immersion for language-minority students: Results of a longitudinal evaluation. Educational Evaluation and Policy Analysis, 7, 187-196. No background controls.
• I disagree. The pre-test is sufficient. However, I now believe that because the students were Asian and of different languages, the program the district called bilingual education was in fact ESL pullout. Only the primary (first & second grade) results are used since the

intermediate elementary group does not have an appropriate control group. The comparison should be structured immersion v. ESL (incorrectly called bilingual).
• R & B finding: Structured immersion superior to TBE (should have been structured immersion superior to ESL).
Malherbe, E. C. (1946). The bilingual school. London: Longmans Green. No background or pretest controls.
• I disagree. This was a random sample of Afrikaans and English speaking students taught in various language environments, Afrikaans, English, bilingual. Despite the fact that there was no significant difference in intelligence between the students in the different school language environments, the more language exposure a student received in school the better the student did in that language compared to similar home language background students, even if the language of the school was not their native tongue.
• R & B finding: TBE worse than structured immersion.
McConnell, B. B. (1980a). Effectiveness of individualized bilingual instruction for migrant students. Doctoral dissertation, Washington State University.
• I disagree. The control group at each grade is the pretest scores of all the students who are in the treatment as they enter at each grade level. So the control group for a student who entered in kindergarten and exits at 4th grade is the pretest scores for students who entered in 4th grade.
• R & B finding: TBE is better than submersion in reading and math.
Medina, M., & Escamilla, K. (1992). Evaluation of transitional and maintenance bilingual programs. Urban Education, 27, 263-290.
• I agree. The TBE group was Vietnamese students which I now know means they were was not in a real bilingual education program. In addition, the maintenance bilingual education (MBE) was Hispanic and the comparisons and statistical analyses did not take into account the differences in ethnicity.
• R & B finding: TBE superior to MBE.
Melendez, W. A. (1980). The effect of the language of instruction on the reading achievement of limited English speakers in secondary schools. Doctoral dissertation, Loyola University of Chicago. No background controls.
• I disagree. A pretest is a sufficient background control. • R & B finding: TBE worse than submersion in reading.
Stern, C. (1975). Final report to the Compton Unified School District's Title VII Bilingual/Bicultural Project: September 1969 through June 1975. Compton: Compton City Schools.
• I disagree. A pretest is a sufficient control. • R & B finding: TBE worse than submersion in reading and math.
Vasquez, M. (1990). A longitudinal study of cohort academic success and bilingual education. Doctoral dissertation, University of Rochester. No background controls.
• I disagree. This is a two-way Spanish immersion program which R & B classified as TBE for the Spanish speakers. Parents chose the program for their children. Multiple regression analysis was used to test the effect of staying longer in the program. Control variables were previous years achievement, years in program, kindergarten English proficiency, and school attended.

• R & B finding: No difference in reading and math between TBE and submersion.
Studies Excluded Because The Effects Are Measured after An Unreasonably Short Period
Barclay, L. (1969). The comparative efficacies of Spanish, English, and Bilingual Cognitive Verbal Instruction with Mexican American Head Start children. Doctoral dissertation, Stanford University. Positive Average Effect.
• I agree.
Layden, R. G. (1972). The relationship between the language of instruction and the development of self-concept, classroom climate, and achievement of Spanish speaking Puerto Rican children. Doctoral dissertation, University of Maryland. Negative Average Effect.
• I agree.
Studies Excluded Because They Inadequately Control Differences Between Bilingual And English-Only Students
Alvarez, J. (1975). Comparison of academic aspirations and achievement in bilingual versus monolingual classrooms. Doctoral dissertation, University of Texas at Austin. Negative Average Effect.
• I disagree and so do Slavin and Cheung (2004). • R & B finding: No difference.
Ames, J., & Bicks, P. (1978). An evaluation of Title VII Bilingual/Bicultural Program, 1977-1978 school year, final report. Community School District 22. Brooklyn. School District of New York.
• I disagree. The students in the ESL pullout were students who were eligible for bilingual education, but for one reason or another were not enrolled. In other words, they were initially equal. In addition, the analysis controlled for pretest scores of the treatment and control groups.
• R & B finding: Positive effect on math; no effect on reading.
Balasubramonian, K., Seelye, H., & de Weffer, R.C.E.(1973). Do bilingual education programs inhibit English language achievement: A report on an Illinois experiment. Paper presented at the 7th Annual Convention of Teachers of English to Speakers of Other Languages, San Juan. Positive Average Effect.
• I disagree, but will exclude on grounds that it is of too short a duration. • R & B finding: No effect on reading.
Barik, H, & Swain, M. (1975). Three year evaluation of a large-scale early grade French immersion program: The Ottawa-Study. Language Learning, 25, 1-30. Negative Average Effect.
• I disagree. The analysis controlled for pretest scores of the treatment and control groups. • R & B finding: Structured immersion better than TBE in reading.

Bates, E. M. B. (1970). The effects of one experimental bilingual program on verbal ability and vocabulary of first grade pupils. Doctoral dissertation, Texas Tech University. Negative Average Effect.
• I disagree, but will exclude on grounds that the program is of too short a duration. • R & B finding: TBE no different in math, but inferior in reading.
Carsrud, K, & Curtis, J. (1980). ESEA Title VII Bilingual Program: Final report. Austin: Austin Independent School District. No statistical tests reported. Positive Average Effect.
• I disagree. Analysis of covariance used to statistically control for differences between treatment and control group. Like groups compared.
• R & B finding: no difference in reading or math.
Ciriza, F. (1990a). Evaluation report of the Preschool Project for Spanish- speaking children, 1989-1990. San Diego: Planning, Research and Evaluation Division. San Diego City Schools. Positive Average Effect.
• I disagree. Since the treatment and the control group had identical LAS scores in English before the treatment and virtually identical scores in Spanish, we considered analysis of variance to be adequate.
• R & B finding: no difference in reading.
Cohen, A. D. (1975). A sociolinguistic approach to bilingual education. Rowley, MA: Newbury House Press. Negative Average Effect.
• I disagree. So do Slavin and Cheung (2004). • R & B finding: TBE better in math and no different in reading.
Cottrell, M. C. (1971). Bilingual education in San Juan Co., Utah: A cross- cultural emphasis. Paper presented at the April meetings of the American Educational Research Association, New York City. Negative Average Effect.
• I disagree, but would exclude it now because it is in the U.S., but not Spanish speakers. • R & B Finding: No difference.
Curiel, H. (1979). A comparative study investigating achieved reading level, self-esteem, and achieved grade point average given varying participation. Doctoral dissertation, Texas A&M. Negative Average Effect.
• I disagree. The students were Hispanic 6th graders and the same students in 7th grade. The control group was randomly selected from among Hispanic students who had not been in bilingual education in elementary school. Analyses of family background indicated that the two groups of students were virtually identical in socioeconomic status and home language. Analysis of variance was used to analyze the differences in academic achievement between the two groups.
• R & B finding: TBE worse than submersion in reading and language.

de la Garza, J. V., & Marcella, M. (1985). Academic achievement as influenced by bilingual instruction for Spanish-dominant Mexican American children. Hispanic Journal of Behavioral Sciences, 7, 247-259. Positive Average Effect.
• I agree, but this study was not analyzed as methodologically acceptable (see Appendix 1aa). This was a bibliographical error in Rossell and Baker. The study should have been in the bibliographic listing in Appendix B, Methodologically Unacceptable Studies.
de Weffer, R. C. Elizondo (1972). Effects of first language instruction in academic and psychological development of bilingual children. Doctoral dissertation, Illinois Institute of Technology. Positive Average Effect.
• I disagree, but would exclude on grounds of too short a time period. • R & B finding: No difference in reading (oral) and math.
Educational Operations Concepts, Inc. (1991a). St. Paul: An evaluation of the Title VII ESEA Bilingual Education Program for Hmong and Cambodian students in junior and senior high school. Positive Average Effect.
• I disagree, but would exclude on the grounds this is a U.S. program and Asian students not in a real bilingual education program.
• R & B finding: TBE worse in reading, language, and math than submersion.
Lampman, H. P. (1973). Southeastern New Mexico bilingual program: Final report. Artesia: Artesia Public Schools. Positive Average Effect.
• I disagree. The students are very carefully matched on age, non-verbal IQ, verbal IQ, family poverty status, family income, family structure, number of children, parents’ occupation, parents’ education, and home language. We probably will not be able to construct an effect size for this study, however, as there is no standard deviation or other information that could be used to estimate a standard deviation.
• R & B finding: TBE no different in reading than submersion.
Legarreta, D. (1979). The effects of program models on language acquisition by Spanish-speaking children. TESOL Quarterly, 13, 521-534. Positive Average Effect.
• I disagree. The author uses a sophisticated multivariate analysis with pre-test information to compare different kinds of bilingual programs and all-English programs.
• R & B finding: TBE superior to submersion in oral comprehension and communication (classified as reading) in one comparison; TBE no different in same areas in another comparison.
Lum, J. B. (1971). An effectiveness study of English as a second language (ESL) and Chinese bilingual methods. Doctoral dissertation, University of California, Berkeley. Negative Average Effect.
• I disagree, but would exclude it now because it is U.S., but not Spanish speakers. • R & B finding: TBE worse in some grades, but no different in others in reading.
Maldonado, J. R. (1974). The effect of the ESEA Title VII Program on the cognitive development of Mexican American students. Doctoral dissertation, University of Houston. Negative Average Effect.
• I disagree and so do Slavin and Cheung (2004). • R & B finding: No difference in reading, language, and math.

Matthews, T. (1979). An investigation of the effects of background characteristics and special language services on the reading achievement and English fluency of bilingual students. Seattle: Seattle Public Schools: Department of Planning, Research and Evaluation. Negative Average Effect.
• I would exclude on the grounds this is a U.S. program and Asian students not in a real bilingual education program. The author implied he conducted a multiple regression analysis controlling for many variables, but there is no quantitative data.
• R & B finding: TBE no different in reading than submersion.
Moore, F. B. & Parr, G. D. (1978). Models of bilingual education: Comparisons of effectiveness. The Elementary School Journal, 79, 93-97. Negative Average Effect.
• I disagree. Analysis of covariance used to control for pretreatment differences. • R & B finding: TBE worse in reading and no different in math from submersion; we
neglected to add TBE worse in language to our summary table (see Appendix 1aa).
Peña-Hughes, E., & Solis, J. (1980). ABC's. McAllen: McAllen Independent School, District. Positive Average Effect.
• I disagree. Although we no longer have most of the text of the study, Baker and deKanter have a two page description of the study. It is a randomized experiment which also used analysis of covariance. All students were Hispanic limited English proficient.
• R & B finding: Structured immersion superior to TBE in reading.
Prewitt Diaz, J. O. (1979). An analysis of the effects of a bicultural curriculum on monolingual Spanish ninth graders as compared with monolingual English and bilingual ninth graders with regard to language development, attitude toward school, and self-concept. Doctoral dissertation, University of Connecticut. Positive Average Effect.
• I would now exclude because it is a high school program and high school programs are not real bilingual education programs.
• R & B finding: No difference between TBE and mainstream classroom in reading.
Stebbins, L. B., St. Pierre, R. G., Proper, E. C., Anderson, R. B., & Carva, T. (1977). Education as experimentation: A Planned Variation Model, Vol. IV-A. An evaluation of follow through. Cambridge: ABT Associates. Positive Average Effect.
• I disagree. This is a very sophisticated study with pretest and many other control variables. • R & B finding: No difference between TBE and submersion in reading and math.
Valladolid, L. A. (1991). The effects of bilingual education of students' academic achievement as they progress through a bilingual program. Doctoral dissertation, United States International University. No background or pretest controls. Negative Average Effect.
• I disagree. Hispanic students were matched on important variables: they were required to have entered school limited-English speaking, been in the bilingual or mainstream program for three years, and to be in grade five. A split-plot factorial ANOVA was used to remove initial differences between students.
• R & B finding: TBE worse than submersion in reading, language, and math. Upon rereading, we should have classified this as TBE worse than ESL in reading, language, and math. I have moved this study in the revised tables.

Zirkel, P. A. (1972). An evaluation of the effectiveness of selected experimental bilingual education programs in Connecticut. Doctoral dissertation, University of Connecticut. Positive Average Effect.
Yap, K. O., Enoki, D. Y., & Ishitani, P. (1988). SLEP student achievement: Some pertinent variables and policy implications. Paper presented at the April meetings of the American Educational Research Association, New Orleans. No background or pretest controls. Negative Average Effect.
• I disagree. Hispanic students in bilingual and mainstream classrooms were matched on grade level, number, school attended, age, socioeconomic status, sex, and language dominance and many other home characteristics. The researcher also personally observed all programs and changed their label to fit the facts of what was observed. Analysis of covariance was used to control for pretreatment characteristics. R & B only analyzed the true bilingual-mainstream comparison, not the quasi-bilingual comparisons.
• R & B finding: TBE superior to submersion in reading for later grades; no difference in grade 1.
• I agree. This particular paper has insufficient information on the programs, the analyses, and the students. (I believe that when we were reviewing this study we also had a longer school district report with more data that is now lost). If the lack of information didn’t disqualify it, the fact that Asian students are in the bilingual program should.
• R & B finding: TBE no different in reading, language, and math than ESL.

Appendix 4
Slavin & Cheung (SC) Studies with Rossell (CR) Comments
Cited by*
CR Comments Authors
Slavin & Cheung Remarks
CR on Problems w/ ELLGroup
CR on Problems
with Treatment
Rossell Remarks on Other Problems (See also Appendix 3 Comments)
Methodologically Adequate--Elementary Reading
RB
Alvarez (1975)
English and
Spanish Reading
INCONSISTENT: 2nd grade students; pretest given in 1st grade AFTER treatment began, students probably fluent in English
RB Greene Bacon et al (1982)
U.S.-Not Spanish
INCONSISTENT: 8th grade students; pretest given 8 years AFTER treatment began
RB RB accepted only Corpus Christi study
Campeau et al (1975)
5 separate studies met criteria
English and
Spanish Reading
INCONSISTENT: Santa Fe: tests apparently given at the end of first grade to children already fluent in English; SC ERROR: R & B only considered the Corpus Christi evaluation scientific (listed under AIR author)
RB & W Cohen (1975)
English and
Spanish Reading
INCONSISTENT: Not clear when pretest given
Doebler & Mardis (1980)
U.S.:-Not Spanish
PROBLEM: 2nd grade students already fluent in English

RB & W Greene Huzar (1973)
English and
Spanish Reading
J. A. Maldonado (1994) Problem: Special Education students.
RB J.R. Maldonado (1977)
English and
Spanish Reading
RB Morgan (1971)
U.S.:-Not Spanish
English and
French Reading
RB Greene Plante (1976)
English and
Spanish Reading
RB Greene Ramirez et al (1991)
Saldate et al (1985)
INCONSISTENT: Prestest given after treatment began
Methodologically Adequate--Secondary Reading
RB & W Greene Covey (1973)
Not Elementary
Reject because secondary--not real bilingual.
RB & W Greene Kaufman (1968)
Not Elementary
Reject because secondary--not real bilingual.
Canadian Studies of French Immersion A62 RB Barik & Swain (1975) RB Barik et al (1977) RB Bruck et al (1977)
Disagree--see discussion in text and in Appendix 3.

RB Day & Shapson (1988)
RB Genesee & Lambert (1983)
RB Genesse et al (1989) RB & W W is error Lambert & Tucker (1972)
Disagree--see discussion in text and in Appendix 3.
Students Were Not Learning the Societal Language RB Ramos et al (1967) Learning English in the
Phillipines Disagree--see discussion in text and in Appendix 3.
No Reading Outcomes (Oral Language Only)
RB & W Lum (1971)
U.S.:-Not Spanish
RB Author error > Bates & May (1970) 6 months; no pretest data provided
RB Elizondo de Weffer (1972)4 months; no reading outcomes; also preference for English language usage C>E
RB & W Legarreta (1979) RB Greene Rothfarb et al (1987)
Rossell and Baker had a different goal, one that included oral outcomes. Reject Lum because of ELL
group.
Pretests Were Given After Treatments Were Under Way Both Greene (1997) and Rossell & Baker (1996) disagree
that this is a problem that disqualifies a study. RB & W Greene Danoff, Arias & Coles
(1977a) Disagree this is a problem. See rebuttal in text. RB Melendez (1980) Disagree this is a problem. See rebuttal in text and Appendix 3.

RB RB is error, should be W Olesini (1971)
SC Error-Rossell and Baker did not consider this scientific.
Rosier & Holm (1980) Rossell & Baker did not consider this scientific. RB Greene Rossell (1990) Disagree--see discussion in text. Greene disagrees also.
RB & W Greene Skoczylas (1972)
Large pretest differences; No separate analysis for Spanish dominant students; more English dominant children in the control group Disagree--see discussion in text. Greene disagrees also.
RB & W Stern (1975) Only one month delay.
Thomas & Collier (2002) Separate studies in Maine & Houston
RB Valladolid (1991) Disagree--see Appendix 3.
RB Yap, Enoki, & Ishitani (1988)
U.S.:-Not Spanish Reject because of ELL group.
Redundant
RB Ariza (1988) Redundant with Rothfarb (1987)
RB Barik & Swain (1978) Redundant with Barik et al (1977)
RB Cohen et al (1976) Redundant with Cohen (1975)
RB Curiel et al (1980) Redundant with Curiel (1979)
RB & W Danoff et al (1977b & 1978) Redundant with Danoff
(1977a)
RB El Paso ISD (1987 & 1990)
Redundant with El Paso ISD (1992)
RB Genesee, Lambert and Tucker (1977) Redundant with Genesee et al
(1983)
RB McConnell (1980a) Redundant with McConnell (1980b)
See rebuttal in Appendix 3. Only Ariza and Curiel are actually redundant by our standards.

No Evidence of Initial Equality
RB Ames & Bicks (1978)
Large pretest difference; mixed grades and mixed languages
Disagree. R & B accepted studies that were methodologically sound, even if
they did not report all data since we did not need all data for the vote count method. These studies matched
students or otherwise controlled for pretreatment differences. See
comments in text and Appendix 3.
RB Barclay (1969) Large pretest differences; 7 months Reject because of short duration.
RB & W Carsrud & Curtis (1979 & 1980)
Mixed Spanish and English dominant children in the analaysis
Disagree (see above and Appendix 3)
RB Cottrell (1971) Poorly matched on SES. ANCOVA was used but no pretest data provided
Disagree (see above and Appendix 3)
RB Curiel (1979) No measure of early academic ability Disagree (see above and Appendix 3)
RB El Paso ISD (1992) No measure of early academic ability Disagree (see above and Appendix 3)
RB
Layden (1972)Large pretest difference in both Spanish and English; 10 weeks
Reject because of short duration.
RB Malherbe (1946) Lacked information about initial comparability Disagree (see above and Appendix 3)
RB Matthews (1979) Lacked information about initial comparability
U.S.:-Not Spanish
Reject because of ELL group.
RB Greene Powers (1978) No measure of early academic ability Disagree (see above and Appendix 3)
RB & W Stebbins et al (1977) No measure of early academic ability Disagree (see above and Appendix 3)
RB Vasquez (1990) No measure of early academic ability Disagree (see above and Appendix 3)
RB&W Zirkel (1972) Large pretest differences in Hartford and Bridgeport. No bilingual instruction in New Britain, New London.
Disagree (see above and Appendix 3)

No Appropriate Comparison Group
RB Becker et al (1982) Not an evaluation of bilingual programs
RB Burkheimer et al (1989) Compared actual performance to expected performance, no real control group
Disagree. See comments in text and Appendix 3
Carlisle & Beeman (2000) Both groups were bilingual (80-20 vs. 20-80)
RB RB is error de la Garza & Marcella (1985)
Compared Spanish dominant to English dominant; no pretest data SC Error: Not in our review.
RB Gersten (1985) Study of Direct Instruction; No bilingual comparison group
RB Lampman (1973) Mixed Spanish and English dominant children in the pretest analysis; only separate analysis for mean gains
RB McConnell (1980b) Compared to a baseline group; No measure of initial comparability
See comments in text and Appendix 3
RB Medina & Escamilla (1992)
Compared Vietnamese TBE to Hispanic Maintenance Bilingual; no reading outcomes
Agree. See comments in text and Appendix 3
RB Moore & Parr (1978) Mixed Spanish and English dominant children; also late pretests for grade 1 and 2
RB Prewitt-Diaz (1979) 17 weeks; initial group difference (control group had been in the US for 3 yrs; exp group just arrived from Puerto Rico); large pretest difference
Rejected because of short duration.
Thomas & Collier (1997) No control groups
Thomas & Collier (2002) Separate studies in Oregon and Florida lacked control groups
Brief Studies
RB Balasubramonian et al (1973)
4 months Agree

Unavailable RB Ciriza (1990) SC error: is available
RB Educational Operations Concepts (1991a & b)
U.S.:-Not Spanish
SC error: is available. Reject because of ELL group.
RB & W McSpadden (1979, 1980)
U.S.:-Not Spanish Reject because of ELL group.
RB & W Pena-Hughes & Solis (1980)
Compared paired bilingual and transitional bilingual programs Data tables are available; text is not.
RB Teschner (1990) SC error: is available Slavin and Cheung Overlooked
Slavin and Cheung overlooked Webb, Clerc, and Gavito which is in Rossell and Baker.
SC Error: Overlooked study
* RB=Rossell & Baker, 1996 W=Willig, 1985

Appendix 5
A Cohen's d Comparison of Slavin and Cheung's Effect Sizes to Rossell and Kuder's Effect Sizes for Reading
S&C 95% C. I. R&K 95% C.I.
Study
Intervention description and Design
Dur-ation
S&C N
R&K N
exp
R&K N
con-trol Grade
Sample Characteristics
Evidence of Initial Equality Posttest
S&C Effect Size
S&C Mean
ES lower limit
upper limit
R&K ES
R&K Mean
ES lower limit
upper limit
R&K Stat Sig
S&C Cohen's d: using R&K mean ES where S&C give none 0.34 0.26 0.43 Y S&C Cohen's d: excluding the studies where S&C give no ES (shaded cells) 0.57 0.45 0.73 Y R&K Spanish Elementary 0.14 0.03 0.26 Y
Studies of Paired Bilingual Education English Inter-American Series
2nd grade +0.62 0.62
Plante (1976)
-Paired bilingual -Random
assignment
2 yrs 55 31 22 1-2, 2-3
Spanish-dominant
Puerto Rican students in New
Haven, CT
Well matched on Spanish oral
vocabulary but C>E in English
pretest 3rd grade +0.24
+0.43 -0.12 0.980.24
0.43 -0.12 0.98 N
English Inter-American Series
2nd grade +0.01 0.01
Huzar (1973)
-Paired bilingual -Random
assignment
2 & 3 yrs 160
84 76 1-2, 1-3
Disadvantaged Puerto Rican students in
Perth Amboy, NJ
Well matched on IQ, SES, and initial
achievement
3rd grade +0.68 +0.35 0.04 0.66
0.680.35 0.04 0.66 Y
Campeau et al.
(1975)- Corpus Christi
-Paired bilingual -Matched
control
2 yrs 171 125 46 K-1
Spanish dominant
students in Corpus Christi,
Texas
Matched on English and
Spanish pretests
English Inter-American Series
+0.45 +0.45 0.11 0.79 0.45 0.45 0.11 0.79 Y
Campeau et al
(1975)-- Houston
-Paired bilingual -Matched
control
3 yrs 206 461 151 K-2
Spanish dominant
students in Houston, TX
Matched on language, SES, and academic achievement
English Inter-American Series
+1.00 +1.00 0.68 1.32 not scientific and/or insufficient info.

English (SRAAS)
2ndE=C 0.15
3rd E=C 0.234th E=C 0.08
J. R. Maldonado
(1977)
-Paired bilingual -Matched
control
5 yrs 126 47 79 1-5
Spanish dominant students in six
elementary school in Corpus Christi,
TX
Matched on SES and
number of years in schools
5th E=C
0.12 -0.24 0.48
0.04
0.12 -0.24 0.48 N
CA Achieve-ment Tests
vocab E=C 0.12
Alvarez (1975)
-Paired bilingual -Matched
control
2 yrs 147 90 57 2
Spanish dominant children in two
schools in Austin Texas
Matched on SES and initial
language proficiency
comp E=C -0.05 -0.38 0.28 -
0.22-0.05 -0.38 0.28 N
English Inter-American Series
Cohort 1 E=C -0.21
Cohort 2 E=C 0.08
Cohen (1975)
-Paired bilingual -Matched
control
2-3 yrs 90 45 45
K-1, 1-2, 1-
3
Spanish dominant students in
Redwood city, CA
Matched on SES and initial
language proficiency
Cohort 3 none
-0.14 -0.55 0.27-
0.28
-0.14 -0.55 0.27 N
Campeau et al
(1975)-- Kingsville,
TX
-Paired bilingual -Matched
control
1 yr 89 48 41 K Spanish dominant
students in Kingsville, TX
Matched on SES and ethnic
mix
English Inter-American Series
E>C 0.42 0.00 0.84 not scientific and/or insufficient info.
Campeau et al
(1975)-- Santa Fe
-Paired bilingual -Matched
control
1 yr 77 53 24 1 Hispanic students in Sante Fe, New
Mexico Pretests, E>C English
MAT +0.28 +0.28 -0.20 0.76 not scientific and/or insufficient info.
Studies of One-Year Transitional Bilingual Education
J. A. Maldonado
(1994)
-Bilingual-1-year
transition -Random
assignment
3 yrs 20 10 10 2-4, 3-5
Spanish dominant special
education students in Houston TX
Well matched on disability, language
proficiency, & family background
English CTBS +2.21 +2.21 1.10 3.32 2.22 2.22 0.64 3.79 Y

Campeau et al
(1975)-- Alice, TX
-Bilingual-1-year
transition -Matched
control
2 yrs 125 106 19 K-1
Spanish dominant
students in Alice ISD,
Texas
Similar on English pretests but E>C
on Spanish pretest
English Inter-American Series
+1.06 +1.06 0.55 1.57 not scientific and/or insufficient info.
Studies of Two-Year Transitional Bilingual Education English CTBS
Ramirez et al (1991)
-Bilingual-1-year
transition -Matched
control
4 yrs varies 197 191 K-3 Spanish
dominant LEP students
Fairly well matched on SES
and home backgrounds. 3rd grade Early=
Imm 0.02 -0.18 0.22 0.02 0.02 -0.18 0.22 N
Studies of Bilingual Education (Unspecified) English tests
MAT (2nd grade) -0.29 -
0.29Saldate et al (1985)
-Unspecified -Matched
control 3 yrs 38 19 19 1-3
Spanish dominant
students in Douglas, AZ
Well matched on pretests
WRAT (3rd grade) +1.47
+0.59 -0.06 1.241.47
0.59 -0.06 1.24 N
Studies Involving Languages Other Than Spanish English Stanford
Word Reading +0.38 0.38
Paragraph meaning +0.28 0.28
Vocab. +0.19 0.19
Morgan (1971)
-Paired bilingual -Matched
control
1 yr 193 93 100 1
French dominant
students in Lafayette Diocese Catholic
Schools of Lousiana
Well matched on initial mental abiity and MRT pretests
Word Study Skills +0.23
+0.26 -0.02 0.54
0.23
0.27 -0.14 0.68 N
English SRA Reading
Cohort 1 (5 yrs) +0.73 0.73Bacon et
al (1982)
-Paired bilingual -Matched
control
4 & 5 yrs 53
35 18 1-5Cherokee
Indian students in Oklahoma
Well matched on control variables such as IQ and first language
except for GPA & father's education,
C>E Cohort 2 (4 yrs) +0.67
+0.70 0.12 1.280.67
0.70 0.01 1.38 Y

Doebler & Mardis (1980)
-Paired bilingual -Matched
control
1 yr 63 26 37 2 Choctaw students in MS
Well matched on their initial English
proficiency
English MAT +0.15 +0.15 -0.35 0.65 0.15 0.15 -0.62 0.92 N
Secondary Studies
Covey (1973)
-Paired bilingual -Random
assignment
1 yr 200 86 87 9Spanish dominant students
Well matched on pretests
English Stanford Diagnostic Reading
+0.82 +0.82 0.51 1.13 0.82 0.82 0.38 1.26 Y
2-yr school Word
Meaning E=C 0.30
Paragraph Meaning E=C 0.11
1 yr school
Word Meaning E>C 0.04
Kaufman (1968)
-Paired bilingual -Random
assignment
1& 2 yrs 139 51 44 7
Spanish dominant
students in New York City
Initial CIA vocab and
comprehension scores, language and non-language
IQ, age, and Hoffman bilingual schedule scores
were used as covariates Paragraph
Meaning E>C
0.23 -0.10 0.57
0.48
0.23 -0.32 0.78 N
* Shaded cells in N column denote large discrepancies in Ns. ** Shaded cells in Effect Size column denotes Rossell & Kuder effect size inserted.

Appendix 6
A Hedge's g Comparison of Slavin and Cheung's Effect Sizes to Rossell and Kuder's Effect Sizes for Reading
S&C 95% C. I. R&K 95% C.I.
Study
Intervention description and Design
Dur-ation
S&C N*
R&K N
exp
R&K N
con-trol Grade
Sample Characteristics
Evidence of Initial Equality Posttest
S&C Effect Size
S&C Mean
ES lower limit
upper limit
R&K ES
R&K Mean
ES lower limit
upper limit
R&K Stat Sig.
S&C Hedge's g (including arbitrary zeros) 0.25 0.17 0.34 Y R&K Spanish Elementary 0.10 -0.01 0.22 N
Studies of Paired Bilingual Education English Inter-American Series
2nd grade 0.78 0.80
Plante (1976)
-Paired bilingual -Random
assignment 2 yrs 55 31 22 1-2, 2-3
Spanish-dominant
Puerto Rican students in New
Haven, CT
Well matched on Spanish oral
vocabulary but C>E in English pretest
3rd grade 0.26 0.5 -0.05 1.05
0.270.51 -0.04 1.06 N
English Inter-American Series
2nd grade +0.01 0.01
Huzar (1973)
-Paired bilingual -Random
assignment
2 & 3 yrs 160
84 76 1-2, 1-3
Disadvantaged Puerto Rican students in
Perth Amboy, NJ
Well matched on IQ, SES, and initial
achievement
3rd grade 0.31 0.16 -0.15 0.47
0.310.16 -0.15 0.47 N
Campeau et al.
(1975)- Corpus Christi
-Paired bilingual -Matched
control
2 yrs 171 125 46 K-1
Spanish dominant
students in Corpus Christi,
Texas
Matched on English and Spanish
pretests
English Inter-American Series
+0.45 +0.45 0.11 0.79 0.45 0.45 0.11 0.79 Y
Campeau et al
(1975)-- Houston
-Paired bilingual -Matched
control
3 yrs 206 461 151 K-2
Spanish dominant
students in Houston, TX
Matched on language, SES, and
academic achievement
English Inter-American Series
0.54 0.54 0.23 0.85 not scientific and/or insufficient info.

English (SRAAS)
2nd 0 0.15
3rd 0 0.234th 0 0.08
J. R.
Maldonado
(1977)
-Paired bilingual -Matched
control
5 yrs 126 47 79 1-5
Spanish dominant
students in six elementary school in
Corpus Christi, TX
Matched on SES and number of years
in schools
5th 0
0.00 -0.36 0.36
0.04
0.12 -0.24 0.49 N
CA Achieve-ment Tests
vocab 0.12 0.12
Alvarez (1975)
-Paired bilingual -Matched
control
2 yrs 147 90 57 2
Spanish dominant
children in two schools in
Austin Texas
Matched on SES and initial language
proficiency
comp -0.23 -0.05 -0.38 0.28 -
0.22-0.05 -0.38 0.28 N
English Inter-American Series
Cohort 1 0 -0.21
Cohort 2 0 0.08
Cohen (1975)
-Paired bilingual -Matched
control
2-3 yrs 90 45 45
K-1, 1-2, 1-
3
Spanish dominant
students in Redwood city,
CA
Matched on SES and initial language
proficiency
Cohort 3 none
0.00 -0.41 0.41-
0.28
-0.14 -0.55 0.27 N
Campeau et al
(1975)-- Kingsville,
TX
-Paired bilingual -Matched
control
1 yr 89 48 41 K
Spanish dominant
students in Kingsville, TX
Matched on SES and ethnic mix
English Inter-American Series
0.42 0.42 0.00 0.84 not scientific and/or insufficient info.
Campeau et al
(1975)-- Santa Fe
-Paired bilingual -Matched
control
1 yr 77 53 24 1
Hispanic students in
Sante Fe, New Mexico
Pretests, E>C English MAT 0.03 0.03 -0.45 0.51 not scientific and/or insufficient
info.
Studies of One-Year Transitional Bilingual Education
J. A. Maldonado
(1994)
-Bilingual-1-year
transition -Random
assignment
3 yrs 20 10 10 2-4, 3-5
Spanish dominant special
education students in Houston TX
Well matched on disability, language proficiency, & family
background
English CTBS 1.66 1.66 0.64 2.68 1.73 1.73 0.28 3.18 Y

Campeau et al
(1975)-- Alice, TX
-Bilingual-1-year
transition -Matched
control
2 yrs 125 106 19 K-1
Spanish dominant
students in Alice ISD, Texas
Similar on English pretests but E>C on
Spanish pretest
English Inter-American Series
0.49 0.49 0.00 0.98 not scientific and/or insufficient info.
Studies of Two-Year Transitional Bilingual Education English CTBS
Ramirez et al (1991)
-Bilingual-1-year
transition -Matched
control
4 yrs varies 197 191 K-3 Spanish
dominant LEP students
Fairly well matched on SES and home
backgrounds. 3rd grade 0 0.00 -0.20 0.20 0.02 0.02 -0.18 0.22 N
Studies of Bilingual Education (Unspecified) English tests
MAT (2nd grade) -0.28 -
0.29Saldate et al (1985)
-Unspecified -Matched
control 3 yrs 38 19 19 1-3
Spanish dominant
students in Douglas, AZ
Well matched on pretests
WRAT (3rd grade) 0.89
0.14 -0.50 0.780.91
0.14 -0.49 0.78 N
Studies Involving Languages Other Than Spanish English Stanford
Word Reading +0.38 0.38
Paragraph meaning 0.26 0.28
Vocab. +0.19 0.19
Morgan (1971)
-Paired bilingual -Matched
control
1 yr 193 93 100 1
French dominant
students in Lafayette Diocese Catholic
Schools of Lousiana
Well matched on initial mental abiity and MRT pretests
Word Study Skills +0.23
+0.26 -0.02 0.54
0.23
0.26 -0.15 0.67 N
English SRA Reading
Cohort 1 (5 yrs) +0.73 0.73Bacon et al
(1982)
-Paired bilingual -Matched
control
4 & 5 yrs 53
35 18 1-5Cherokee
Indian students in Oklahoma
Well matched on control variables
such as IQ and first language except for
GPA & father's education, C>E Cohort 2
(4 yrs) 0.68 0.69 0.11 1.27
0.670.70 0.01 1.38 Y

Doebler & Mardis (1980)
-Paired bilingual -Matched
control
1 yr 63 26 37 2 Choctaw students in MS
Well matched on their initial English
proficiency
English MAT +0.15 +0.15 -0.35 0.65 0.15 0.15 -0.62 0.92 N
Secondary Studies
Covey (1973)
-Paired bilingual -Random
assignment
1 yr 200 86 87 9Spanish dominant students
Well matched on pretests
English Stanford Diagnostic Reading
0.72 0.72 0.41 1.03 0.73 0.73 0.29 1.16 Y
2-yr school Word
Meaning
Paragraph Meaning
0.23 0.23
1 yr school
Word Meaning
Kaufman (1968)
-Paired bilingual -Random
assignment
1& 2 yrs 139
51 44 7
Spanish dominant
students in New York City
Initial CIA vocab and comprehension
scores, language and non-language
IQ, age, and Hoffman bilingual schedule scores
were used as covariates
Paragraph Meaning
0.23
0.23 -0.10 0.56
0.23
0.23 -0.32 0.78 N
* Shaded cells in N column denote large discrepancies in Ns. ** Shaded cells in Effect Size column denotes arbitary assignment of 0 to effect size.

Appendix 7
Appendix B from Lipsey, Mark W. and Wilson, David B. 2001.
Practical Meta-Analysis. Newbury Park, Calif.: Sage Publications.


