workshops analysis of the impact of water ...swat.tamu.edu/media/56508/b1-1-dutta.pdfpreventing land...
TRANSCRIPT
July, 2012 2012 International SWAT Conference & Workshops
Arpit Chouksey, Pori Das and Subashisa Dutta INDIAN INSTITUTE OF TECHNOLOGY GUWAHATI GUWAHATI-781039 ASSAM, INDIA
ANALYSIS OF THE IMPACT OF WATER CONSERVATION MEASURES ON THE HYDROLOGICAL RESPONSE OF A
MEDIUM-SIZED WATERSHED
Analysis of the impact of water conservation measures on the hydrological response of a medium-sized watershed

INTRODUCTION
1. North East, India receives on average 200-400 cm rainfall from which 80-90% of the rainfall occurs during monsoon months ( May 15 – Sept 30)
2. Flash floods occur during rainy season and acute shortage of water for domestic and agricultural uses during winter. Rural areas are situated usually at upstream receives adequate rain, with no facilities to conserve the water for winter.
3. Average annual surface water potential of 585.6 km3 has been assessed in this region, which is highest among all the river systems in India and fifth in the world. Out of this, 24.0 km3 is utilizable water and is merely 4.1% of annual surface water potential.
4. People living in hills and mountains of North-eastern India have developed a number of novel practices of farming, checking soil erosion, preventing landslides and of conserving water, beneficial in retaining fertility of soil; preventing land slides and checking soil erosion and in retaining the moisture of soil and conserving water.
5. Common Structures: Check Dams, Percolation Pond, Irrigation Tanks
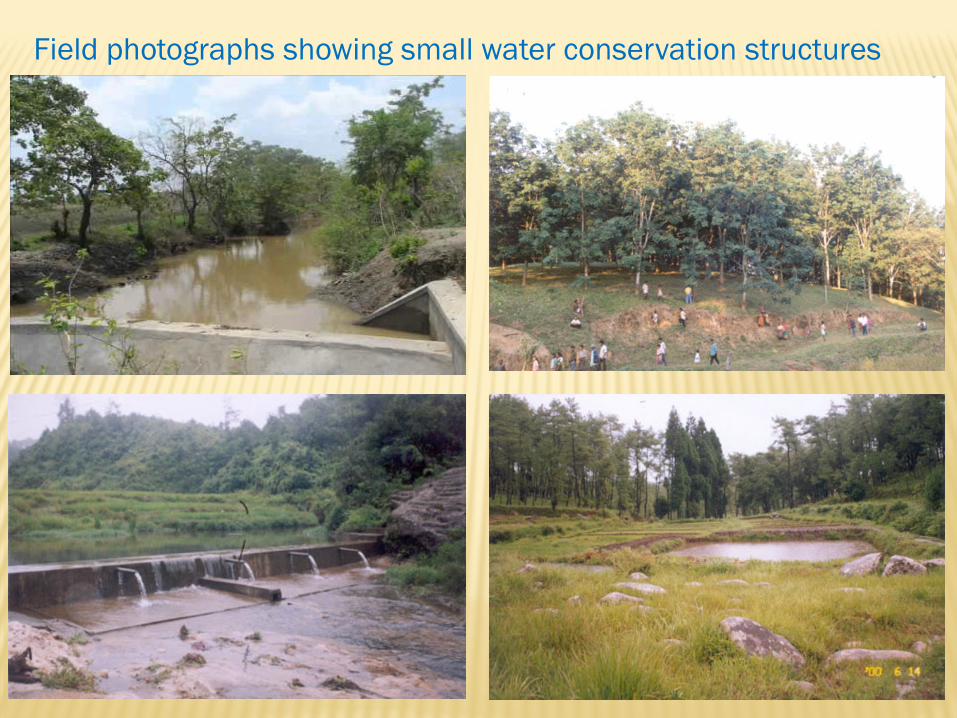
Field photographs showing small water conservation structures

Small water Conservation Measures in hilly watersheds
Hydrological impact of Small Water Harvesting Structures 1. Store first-order stream
flow during early monsoon period
2. Recharge the shallow ground water
3. Release the stored water during non-monsoon period
4. Increase the flashiness due to wetness area

OBJECTIVES To calibrate and validate a semi-distributed hydrological model for
an agro-forestry dominated watershed to obtain its hydrological response for pre-conservation period
To obtain the hydrological response of the watershed without water harvesting structures for post-conservation period by model simulation
To quantify the change in hydrological response due to water harvesting structures by conducting mass curve analysis and peak flow analysis for post-conservation period
To quantify the change in hydrological response of the watershed under best-guess land use change conditions

METHODOLOGY
Geo-Spatial Database
Semi-Distributed Hydrological Model
Rainfall
Discharge Hydrograph
Comparison with Observed Hydrograph
Geo-Spatial Database
Calibrated Hydrological Model
Rainfall
Discharge Hydrograph
analysis
Effect on Flash Floods
Mass Curve Analysis lumped Surface
Storage
Pre-
Cons
erva
tion
Perio
d (B
efor
e 19
85)
Post
-Con
serv
atio
n Pe
riod
(199
9, 2
001)
Hydrological Impact of Small Water Conservation Structures
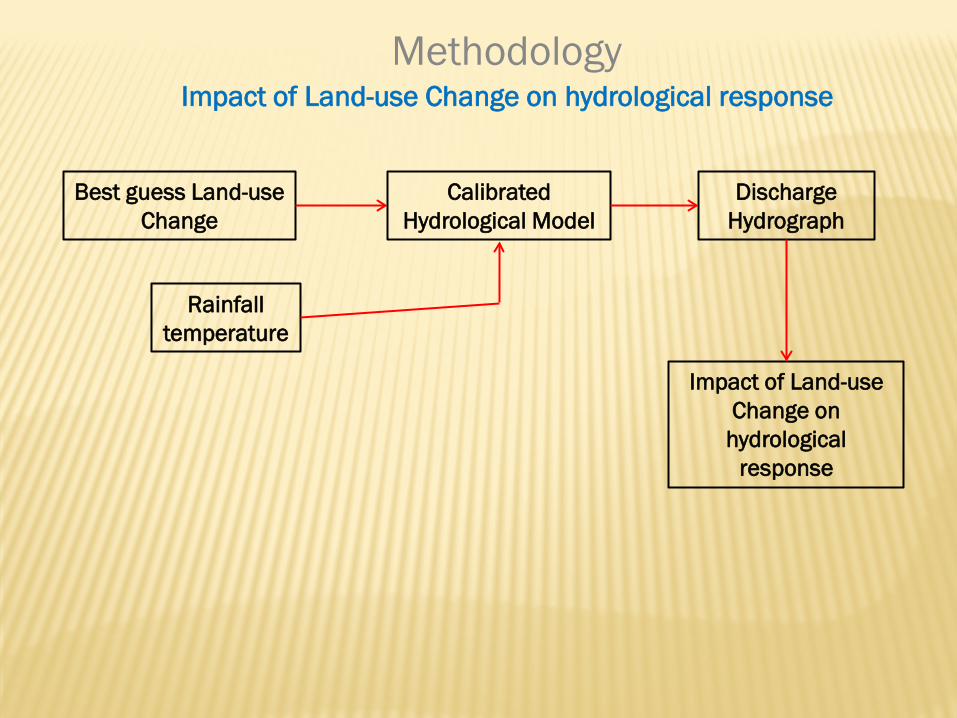
Methodology Impact of Land-use Change on hydrological response
Best guess Land-use Change
Calibrated Hydrological Model
Rainfall temperature
Discharge Hydrograph
Impact of Land-use Change on
hydrological response
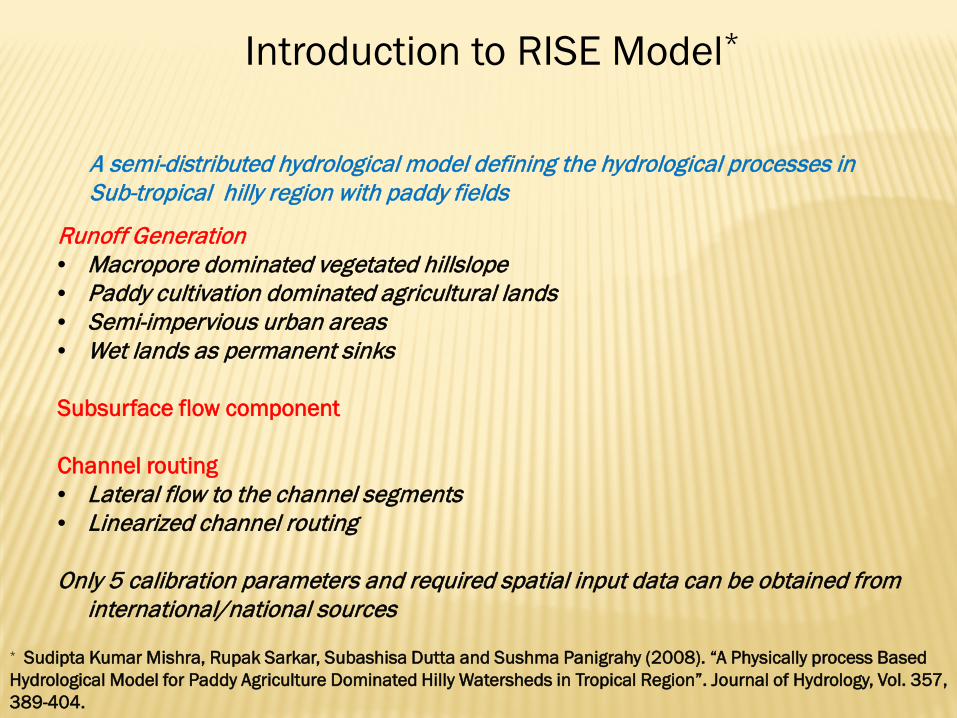
Runoff Generation • Macropore dominated vegetated hillslope • Paddy cultivation dominated agricultural lands • Semi-impervious urban areas • Wet lands as permanent sinks Subsurface flow component Channel routing • Lateral flow to the channel segments • Linearized channel routing Only 5 calibration parameters and required spatial input data can be obtained from
international/national sources
Introduction to RISE Model*
* Sudipta Kumar Mishra, Rupak Sarkar, Subashisa Dutta and Sushma Panigrahy (2008). “A Physically process Based Hydrological Model for Paddy Agriculture Dominated Hilly Watersheds in Tropical Region”. Journal of Hydrology, Vol. 357, 389-404.
A semi-distributed hydrological model defining the hydrological processes in Sub-tropical hilly region with paddy fields

Conceptual diagram of the model

Rice Irrigation System Evaluation (RISE) model (Dutta and Zade 2003): Semi-Distributed physically based hydrological model • Dominant hydrological processes based on different distinct hydrological similarity classes
(HSC).: Infiltration Process
• Macropore dominated vegetated hill-slopes 𝑅 = 0, 𝑤𝑤𝑤𝑤 𝑖 ≤ 𝑓𝑚𝑚𝑚 (1-a) 𝑅 = 𝑖 − 𝑓𝑚𝑚𝑚 , 𝑤𝑤𝑤𝑤 𝑖 ≥ 𝑓𝑚𝑚𝑚 (1-b) where i is the rainfall intensity.
• Paddy cultivation dominated agricultural lands
𝑓 =𝑘1𝑘2 𝑤1 + 𝑤2 + 𝑤 + 𝛹1
𝑤1𝑘2 + 𝑤2𝑘1 (2)
where 𝛹1 is the suction pressure of the saturated plow layer; k1 and k2 are saturated hydraulic conductivities of plow layer and hard pan formations respectively. Value of k2 can be obtained from the relation: k2 = (k1/r)where r is the degree of soil impermeability (dimensionless) due to the formation of hard pan layer
• Semi-impervious urban area 𝑓𝑐 𝑡 = 0.5𝑆𝑡−0.5 + 𝐴0 (3) where 𝑓𝑐 𝑡 is the potential infiltration rate (mm/h), S is the sorptivity, and A0 is the gravitational infiltration rate (mm/ h
Model Components
11
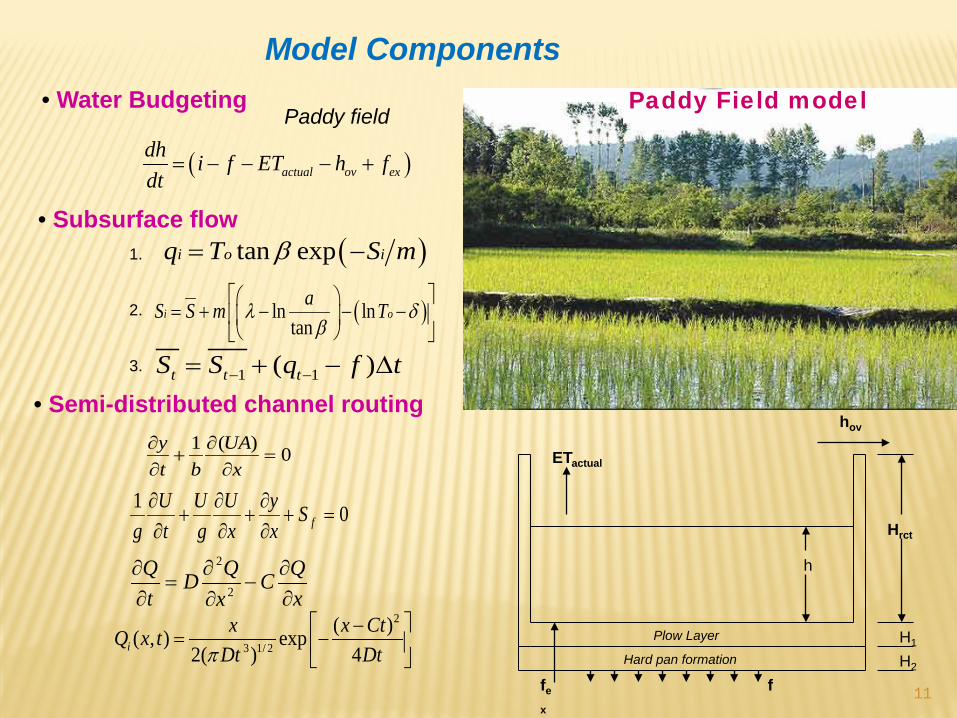
• Water Budgeting Paddy field
( )actual ov exdh i f ET h fdt
= − − − +
• Subsurface flow ( )tan expi o iq T S mβ= −
( )ln lntan
i oaS S m Tλ δβ
= + − − −
1.
2.
1 1( )t t tS S q f t− −= + − ∆3.
0)(1=
∂∂
+∂∂
xUA
bty
01=+
∂∂
+∂∂
+∂∂
fSxy
xU
gU
tU
g
xQC
xQD
tQ
∂∂
−∂∂
=∂∂
2
2
2
3 1/ 2
( )( , ) exp2( ) 4i
x x CtQ x tDt Dtπ
−= −
Plow Layer
Hard pan formation H1
H2
h
f fe
x
Hrct
ETactual
hov
Model Components Paddy Field model
• Semi-distributed channel routing

12
Two gauging stations - Tezpur, Guwahati 25 years period from 1978 to 2003 Eight wet years of highest flood lift (Karmaker and Dutta, 2010).
Sim
ulat
ed d
isch
arge
Qs
(103
m3 /s
ec)
Obs
erve
d St
age
leve
l (m
)
1 Mar 20 Apr 9 Jun 29 Jul 17 Sep 6 Nov 26 Dec
Index map showing gauging stations
Performance of the Model for Predicting Flow variation in Brahmaputra*
* Shyamal Ghosh, Subashisa Dutta (2012). “Impact of climate change on flood characteristics in Brahmaputra basin using a macro-scale distributed hydrological model”. Journal of Earth System Science, Vol. 121, No. 3, 637.
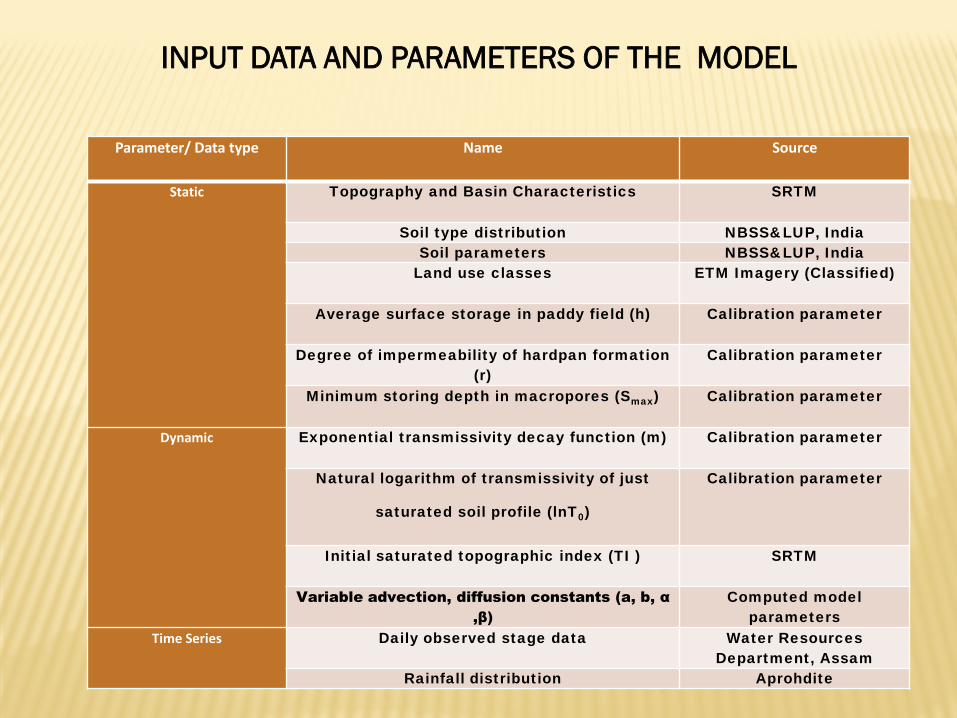
INPUT DATA AND PARAMETERS OF THE MODEL
Parameter/ Data type Name Source
Static Topography and Basin Characteristics SRTM
Soil type distribution NBSS&LUP, India Soil parameters NBSS&LUP, India
Land use classes ETM Imagery (Classified)
Average surface storage in paddy field (h) Calibration parameter
Degree of impermeability of hardpan formation (r)
Calibration parameter
Minimum storing depth in macropores (Smax) Calibration parameter
Dynamic Exponential transmissivity decay function (m) Calibration parameter
Natural logarithm of transmissivity of just
saturated soil profile (lnT0)
Calibration parameter
Initial saturated topographic index (TI ) SRTM
Variable advection, diffusion constants (a, b, α ,β)
Computed model parameters
Time Series Daily observed stage data Water Resources Department, Assam
Rainfall distribution Aprohdite
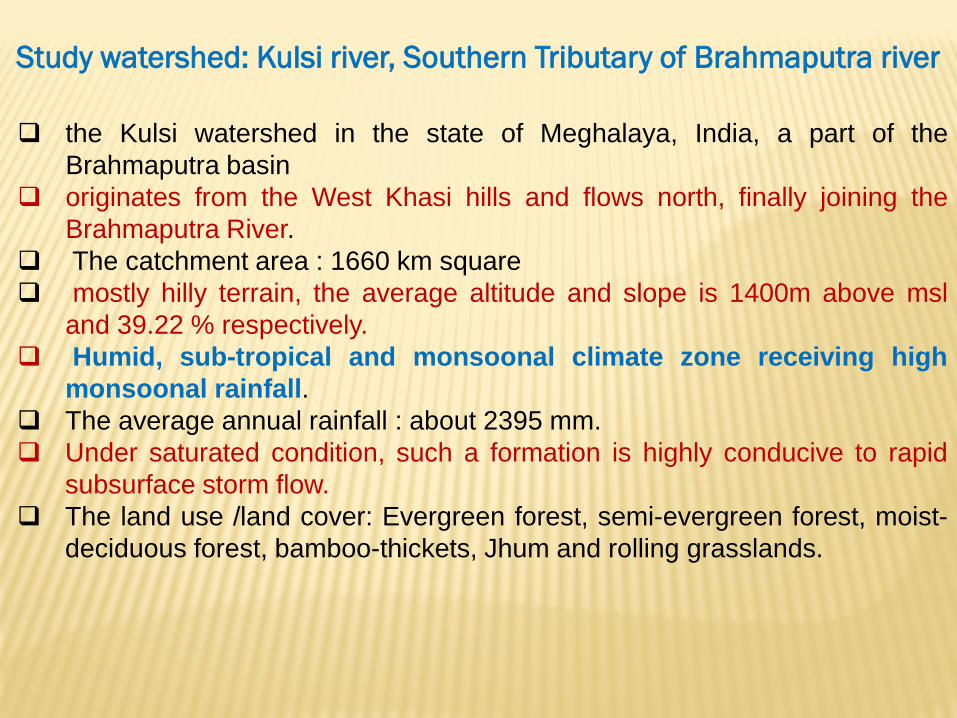
the Kulsi watershed in the state of Meghalaya, India, a part of the Brahmaputra basin
originates from the West Khasi hills and flows north, finally joining the Brahmaputra River.
The catchment area : 1660 km square mostly hilly terrain, the average altitude and slope is 1400m above msl
and 39.22 % respectively. Humid, sub-tropical and monsoonal climate zone receiving high
monsoonal rainfall. The average annual rainfall : about 2395 mm. Under saturated condition, such a formation is highly conducive to rapid
subsurface storm flow. The land use /land cover: Evergreen forest, semi-evergreen forest, moist-
deciduous forest, bamboo-thickets, Jhum and rolling grasslands.
Study watershed: Kulsi river, Southern Tributary of Brahmaputra river

Geospatial dataset : Kulsi Catchment
Soil distribution
Land-Use Map
Drainage Map
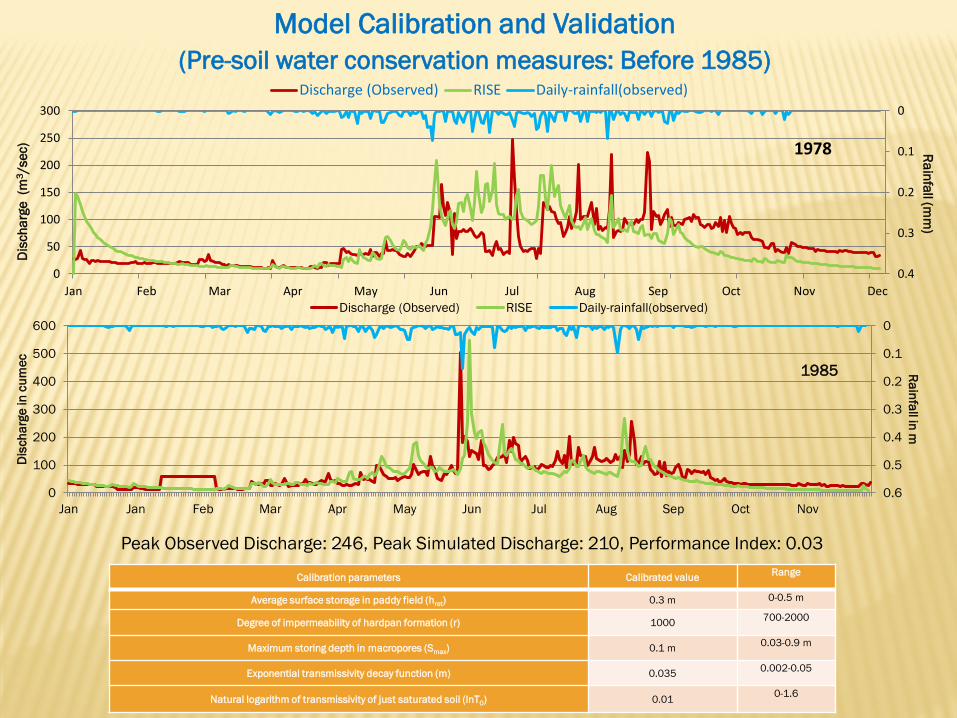
Model Calibration and Validation (Pre-soil water conservation measures: Before 1985)
Calibration parameters Calibrated value Range
Average surface storage in paddy field (hret) 0.3 m 0-0.5 m
Degree of impermeability of hardpan formation (r) 1000 700-2000
Maximum storing depth in macropores (Smax) 0.1 m 0.03-0.9 m
Exponential transmissivity decay function (m) 0.035 0.002-0.05
Natural logarithm of transmissivity of just saturated soil (lnT0) 0.01 0-1.6
0
0.1
0.2
0.3
0.40
50
100
150
200
250
300
Jan Feb Mar Apr May Jun Jul Aug Sep Oct Nov Dec
Rainfall (mm
) D
isch
arge
(m
3 /se
c) 1978
Discharge (Observed) RISE Daily-rainfall(observed)
Peak Observed Discharge: 246, Peak Simulated Discharge: 210, Performance Index: 0.03
0
0.1
0.2
0.3
0.4
0.5
0.60
100
200
300
400
500
600
Jan Jan Feb Mar Apr May Jun Jul Aug Sep Oct Nov
Rainfall in m
Dis
char
ge in
cum
ec
1985
Discharge (Observed) RISE Daily-rainfall(observed)
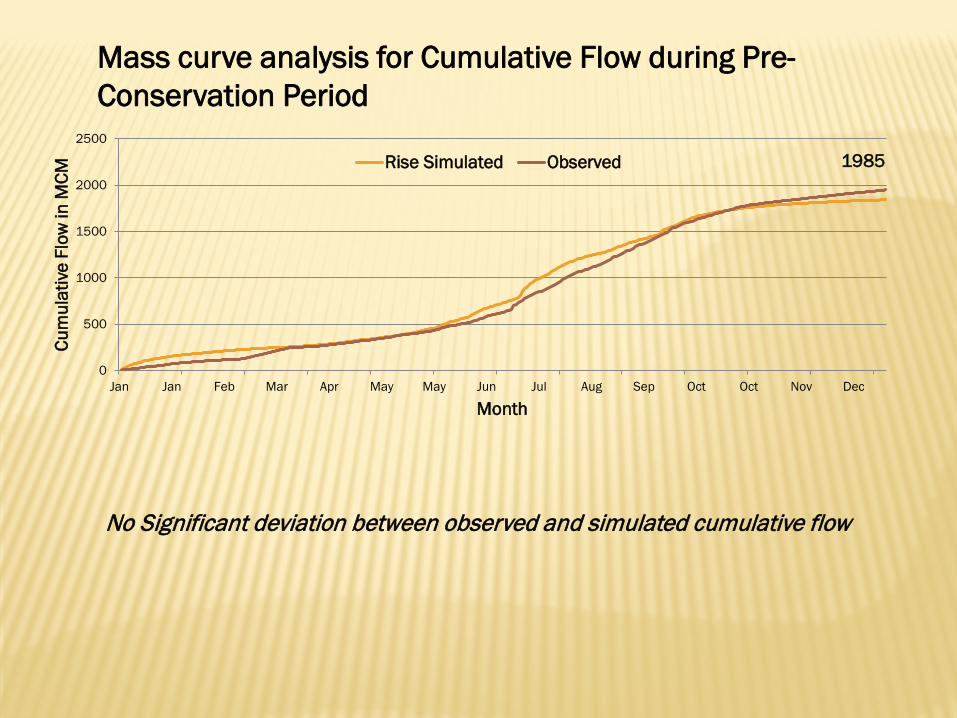
Mass curve analysis for Cumulative Flow during Pre-Conservation Period
0
500
1000
1500
2000
2500
Jan Jan Feb Mar Apr May May Jun Jul Aug Sep Oct Oct Nov Dec
Cum
ulat
ive
Flow
in M
CM
Month
1985 Rise Simulated Observed
No Significant deviation between observed and simulated cumulative flow

Effect on Flashiness Behavior due to Conservation Structures
Period Year Peak Discharge
Peak Discharge
Pre-Conservation Period
1978 250 225
1985 425 550
0
0.1
0.2
0.3
0.40
50
100
150
200
250
300
Jan Jan Feb Mar Apr May Jun Jul Aug Sep Oct Nov Dec
Dis
char
ge in
Cum
ec
Month
1978 With Conservation
Without Conservation
Daily-rainfall(observed)
0
0.1
0.2
0.3
0.4
0.5
0.60
100
200
300
400
500
600
Jan Jan Feb Mar Apr May Jun Jul Aug Sep Oct Nov
Rainfall in m
Month
1985 With Conservation
Without Conservation
Daily-rainfall(observed)
Period Year Peak Discharge Without
Conservation
Peak Discharge With
Conservation
Post-Conservation Period
1999 450` 850
2001 400 600
0
0.1
0.2
0.3
0.40100200300400500600700800900
1000
Jan Jan Feb Mar Apr May Jun Jul Aug Sep Oct Nov Dec
Dis
char
ge in
Cum
ec
Month
1999 With ConservationWithout ConservationDaily-rainfall(observed)
0
0.1
0.2
0.3
0.40
100
200
300
400
500
600
700
Jan Jan Feb Mar Apr May Jun Jul Aug Sep Oct Nov Dec
Rainfall in mm
Month
2001 With ConservationWithout ConservationDaily-rainfall(observed)

0
500
1000
1500
2000
2500
3000
Jan Jan Feb Mar Apr May May Jun Jul Aug Sep Oct Oct Nov
Cum
ulat
ive
Dis
char
ge in
M
CM
Month
1999 Without ConservationWith Conservation
-1000
-800
-600
-400
-200
0
200
400
Jan Jan Feb Mar Apr May May Jun Jul Aug Sep Oct Oct Nov
Stor
age
in M
CM
Month
Surface Storage due to Conservation
Structures
Groundwater Contribution
Lumped Storage by Conservation Structures: 156 MCM (about 5% of Total Flow) Groundwater Recharge : 913 MCM (about 30% of Total Flow)
Total Rainfall: 2100 mm
Mass curve analysis :Cumulative Flow during Post-Conservation Period

0
500
1000
1500
2000
2500
Jan Jan Feb Mar Apr May May Jun Jul Aug Sep Oct Oct Nov
Cum
ulat
ive
Dis
char
ge in
M
CM
Month
2001 Without Conservation
With Conservation
Mass curve analysis :Cumulative Flow during Post-Conservation Period
-600
-400
-200
0
200
400
600
Jan Jan Feb Mar Apr May May Jun Jul Aug Sep Oct Oct Nov
Stor
age
in M
CM
Month
Surface Storage due to Conservation Structures
Groundwater Contribution
Lumped Storage by Conservation Structures: 265 MCM (about 10% of Total Flow) Groundwater Recharge : 509 MCM (about 20% of Total Flow)
Total Rainfall: 2000 mm

Evaluation of Land-use Change ( Forest to Horticulture )
0
200
400
600
800
1000
1200
2.50% 5% 10%
Dai
ly Pe
ak D
isch
arge
in
Cum
ec
Percentage change of Landuse (Forest to Horticulture)
198519992001
0
5000
10000
15000
20000
25000
Jan Feb Mar Apr May Jun Jul Aug Sep Oct Nov Dec
Dis
char
ge in
Cum
ec
Month
1985
0
5000
10000
15000
20000
25000
30000
Jan Feb Mar Apr May Jun Jul Aug Sep Oct Nov Dec
Dis
char
ge in
Cum
ec
Month
1999 2.50%5%10%
0
5000
10000
15000
20000
25000
Jan Feb Mar Apr May Jun Jul Aug Sep Oct Nov Dec
Dis
char
ge in
Cum
ec
Month
2001

CONCLUSIONS With limited hydrological input dataset, a semi-distributed
hydrological is able to predict the hydrological response of agro-forestry watersheds
Change in hydrological response due to water harvesting structures: less flow during early monsoon period, lumped storage varies year to year, significant increase in dry month flow, however, flashiness increased by 2 times
Hydrological impact of land use change: no significant change in both cumulative flow and flashiness
Long -period hydrological database can help to quantify the hydrologic response with its temporal component.
