world and asian economic outlook
TRANSCRIPT
The World Economy: Outlook and Issues
JICA – AFS Seminar Colombo, September 1, 2014
Akira Ariyoshi Professor and Program Director Asian Public Policy Program
Outline • External Environment and the Sri Lanka Economy
• The Global Economy Post-GFC
– Causes and policies for the slow recovery.
• Baseline Scenario and Risks to the Outlook
• Monetary Policies: Normalization? – Impact, outlook and spillovers.
• Emerging Market Economy Slowdown
– China Risk • Back to Policies
– Global baseline – Policies for Sri Lanka
2
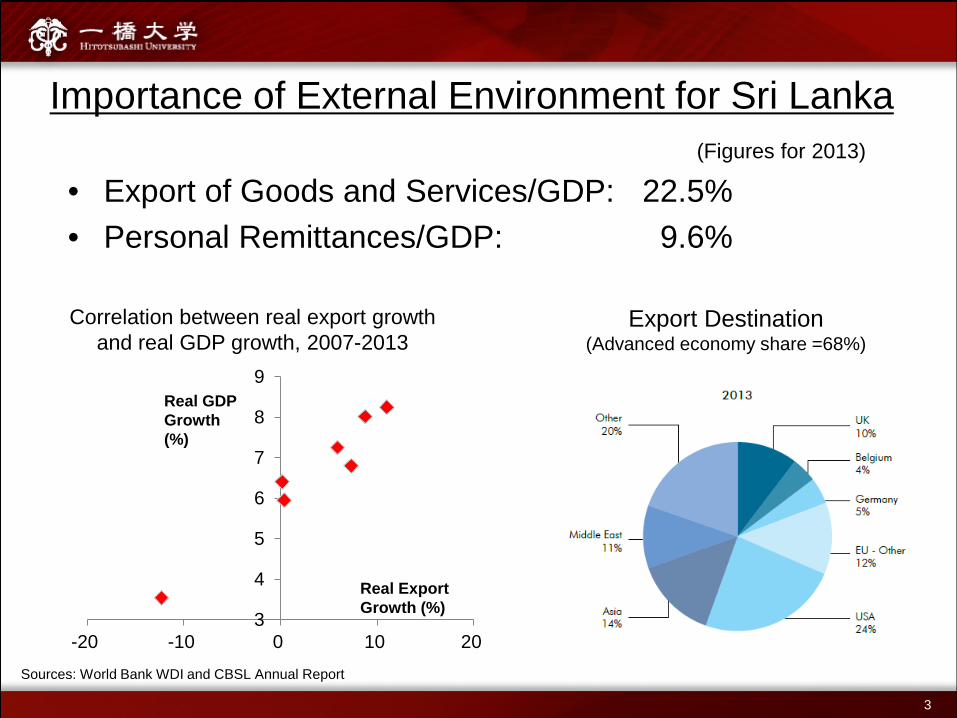
Importance of External Environment for Sri Lanka (Figures for 2013)
• Export of Goods and Services/GDP: 22.5% • Personal Remittances/GDP: 9.6%
3
4
5
6
7
8
9
-20 -10 0 10 20
Real Export Growth (%)
Real GDP Growth (%)
Correlation between real export growth and real GDP growth, 2007-2013
Export Destination (Advanced economy share =68%)
Sources: World Bank WDI and CBSL Annual Report
3
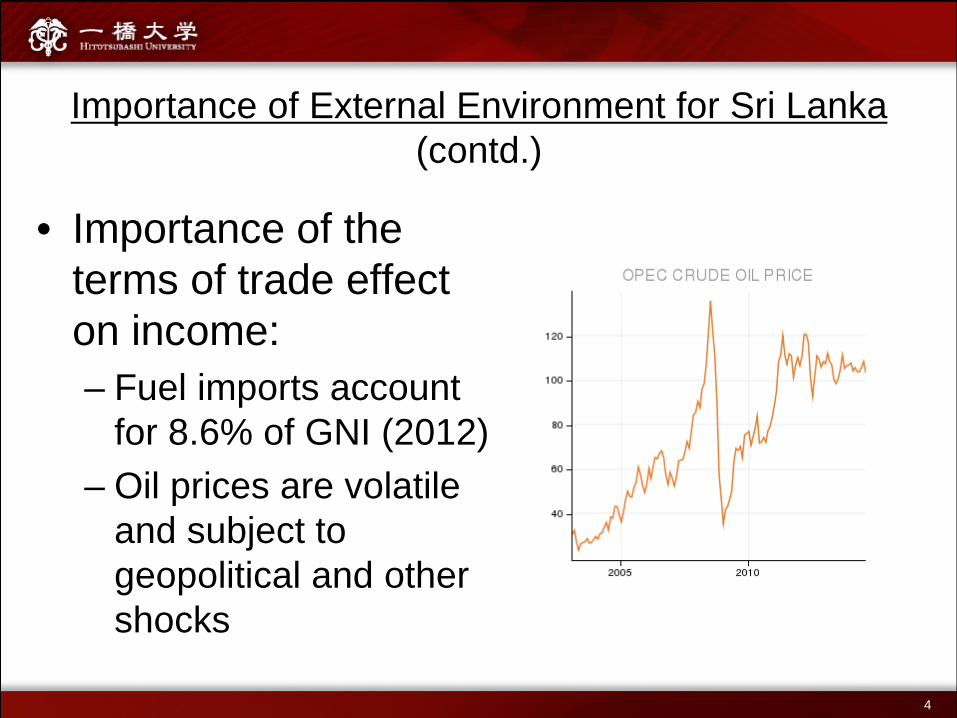
Importance of External Environment for Sri Lanka (contd.)
• Importance of the terms of trade effect on income: – Fuel imports account
for 8.6% of GNI (2012) – Oil prices are volatile
and subject to geopolitical and other shocks
4

Importance of global financial conditions for Sri Lanka
• Financing of C/A deficit relies on debt creating flows
5
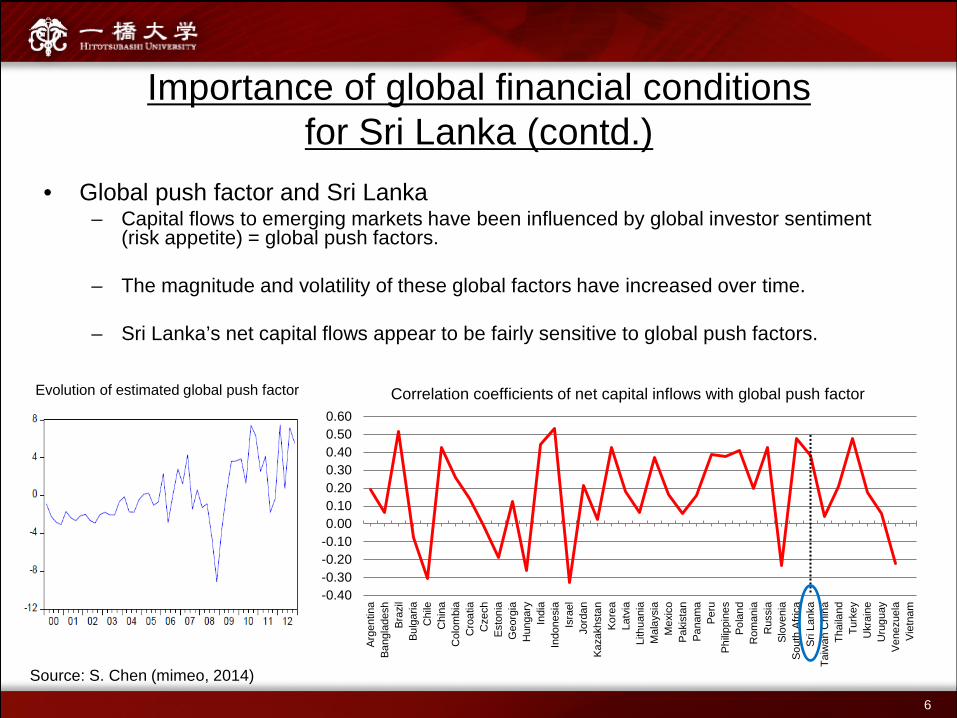
Importance of global financial conditions for Sri Lanka (contd.)
• Global push factor and Sri Lanka – Capital flows to emerging markets have been influenced by global investor sentiment
(risk appetite) = global push factors.
– The magnitude and volatility of these global factors have increased over time.
– Sri Lanka’s net capital flows appear to be fairly sensitive to global push factors.
Evolution of estimated global push factor
-0.40-0.30-0.20-0.100.000.100.200.300.400.500.60
Arge
ntin
aBa
ngla
desh
Braz
ilBu
lgar
iaC
hile
Chi
naC
olom
bia
Cro
atia
Cze
chEs
toni
aG
eorg
iaH
unga
ryIn
dia
Indo
nesi
aIs
rael
Jord
anKa
zakh
stan
Kore
aLa
tvia
Lith
uani
aM
alay
sia
Mex
ico
Paki
stan
Pana
ma
Peru
Philip
pine
sPo
land
Rom
ania
Rus
sia
Slov
enia
Sout
h Af
rica
Sri L
anka
Taiw
an C
hina
Thai
land
Turk
eyU
krai
neU
rugu
ayVe
nezu
ela
Viet
nam
Correlation coefficients of net capital inflows with global push factor
Source: S. Chen (mimeo, 2014)
6
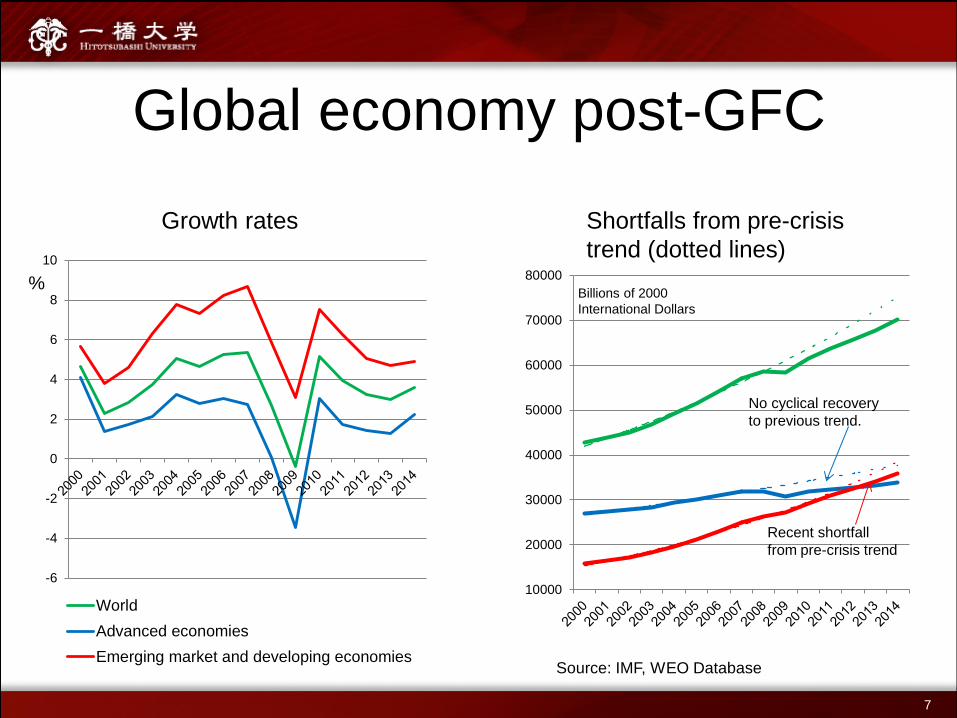
Global economy post-GFC
10000
20000
30000
40000
50000
60000
70000
80000
No cyclical recovery to previous trend.
Recent shortfall from pre-crisis trend
-6
-4
-2
0
2
4
6
8
10
WorldAdvanced economiesEmerging market and developing economies
Growth rates Shortfalls from pre-crisis trend (dotted lines)
% Billions of 2000 International Dollars
Source: IMF, WEO Database
7

Why do the (advanced) economies remain well below pre-crisis trend?: Three possibilities
• Prolonged adjustment to debt overhang. – Financial crisis induced recessions are deeper and
more protracted. – Growth will not resume fully until the financial sector
has been cleaned up.
• Reduction in potential growth rate.
• Something more fundamental: the secular stagnation hypothesis.
8

Reduction in the potential growth rate
From Summers (2014)
Y=F(A,K,L) (K) Weakened financial system
after crisis reduces intermediation and hence investment.
(L) Long period of high
unemployment reduces employable workers.
(A) Reduced risk appetite weakens
innovation.
Persistent output gap remains even with downward revision of potential; why?
9
What is secular stagnation? • Alvin Hansen’s original proposition in 1938.
– Reduced population growth and slowing innovation. – Reduced investment demand insufficient to maintain full
employment • Resurrected by Larry Summers (2013)
– In addition to lower population growth and possibly slower technological innovation, excess of savings over investment results in low equilibrium real interest rate.
• High savings from concentration of wealth (high savings rate), emerging market excess savings,
• Low investment rate caused by lower price of capital goods, less capital intensive industrial structure.
– Low inflation and zero lower bound for interest rates makes it difficult to lower real interest rate to equilibrium level, particularly during economic downturns.
10

Opposing views on correct policy response: • Monetary Policy (FED/IMF s. BIS)
+ Since equilibrium interest rate is low, then reduced policy interest rates and if necessary non-conventional policies are required to boost demand.
– Expansionary monetary policy does not increase productive investment, but rather creates asset price bubbles, which will cause problems when the bubble bursts.
• Exchange Rate Policy (Currency Wars) + Depreciated real exchange rate can stimulate exports and fill in the domestic output gap – Simultaneous depreciation of all major countries not feasible. Creates problems for other countries.
• Fiscal Policy (Keynesian vs. Ricardian) + Fiscal policy needs to close the demand gap from excess savings. Fiscal policies are effective because
multipliers are big during deep recessions. Investment in infrastructure will raise potential growth. – Fiscal policy does not increase aggregate demand, as the private sector will increase savings to prepare
for future taxes. Fiscal consolidation will increase private sector confidence and lead to higher investment, consumption and growth.
• Financial Sector Policy (BASEL III) + A rapid cleaning up of the banking sector is necessary for growth to resume. Bank capital must be raised,
and fiscal support for banks create moral hazard and risk creating future crisis. – Too rapid consolidation of the banking sector reduces credit flows and risks prolonged recession.
Strengthening of capital requirement when the banking system is still fragile is counterproductive.
• Structural Policies + Structural policies must be pursued to increase efficiency and raise longer-term potential growth. – Structural policies require time to generate positive growth impact, and possibly disruptive in the short run.
11

IMF Global Growth Outlook: A gradual recovery with reduced economic risk, but
risk still tilted to the downside
12
Source: IMF World Economic Outlook, April 2014
Major Economic Risks
• Large negative impact from monetary policy normalization
• Marked slowdown of emerging market
economies
13

Political risk difficult to evaluate, but potentially large impact
• Ukraine and Russia: Spillovers to EU
• Iraq (and the Middle East): Implications for oil prices
• Tensions in East and South China Seas
14
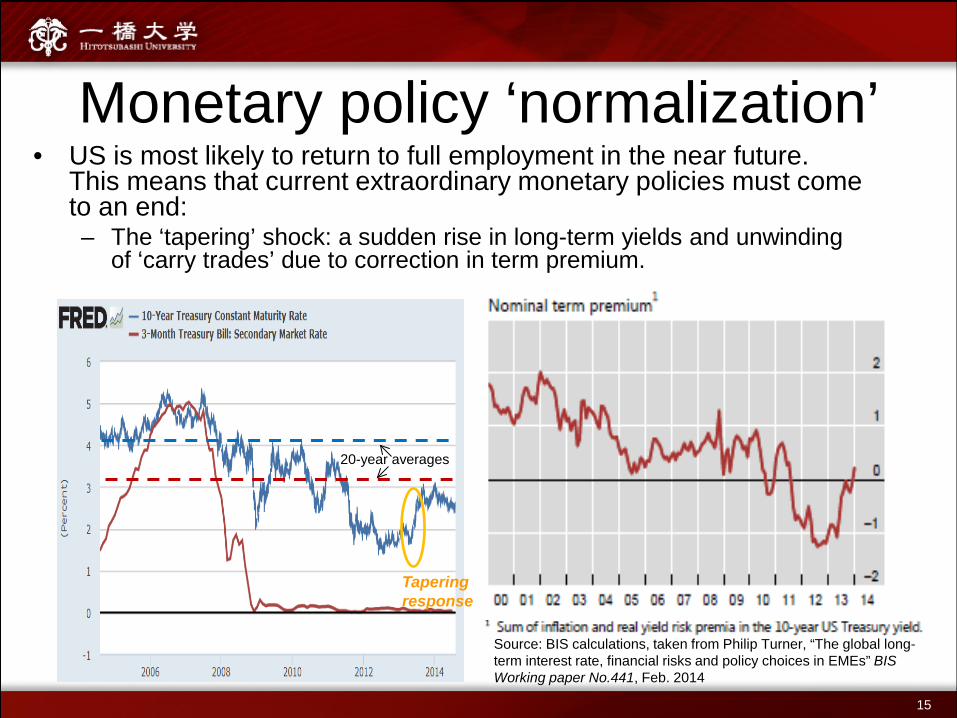
Monetary policy ‘normalization’ • US is most likely to return to full employment in the near future.
This means that current extraordinary monetary policies must come to an end: – The ‘tapering’ shock: a sudden rise in long-term yields and unwinding
of ‘carry trades’ due to correction in term premium.
20-year averages
Tapering response
Source: BIS calculations, taken from Philip Turner, “The global long-term interest rate, financial risks and policy choices in EMEs” BIS Working paper No.441, Feb. 2014
15
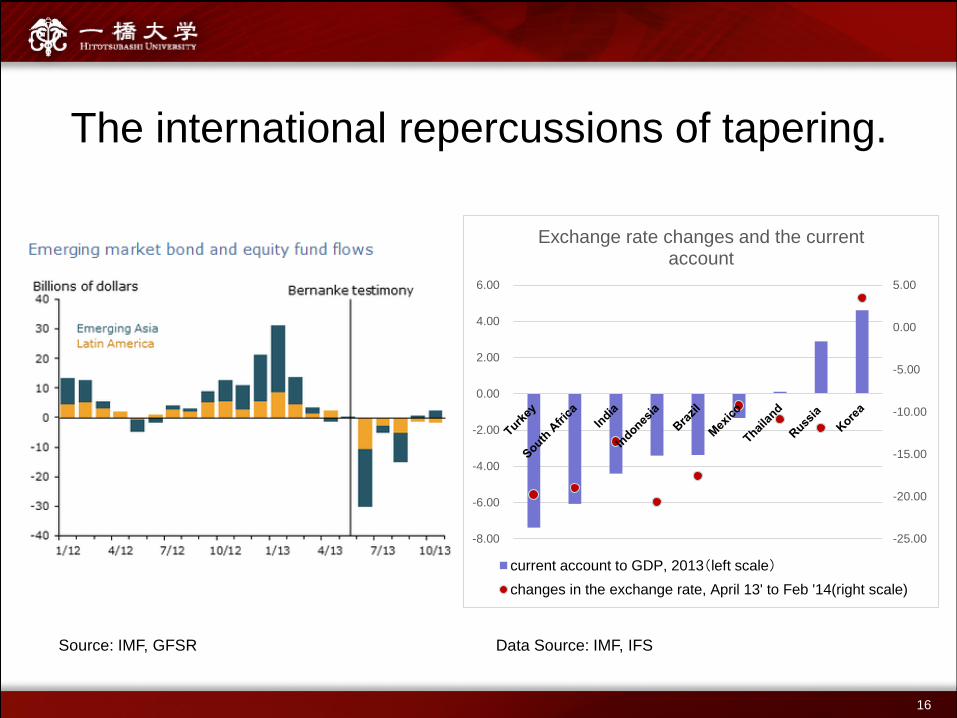
The international repercussions of tapering.
-25.00
-20.00
-15.00
-10.00
-5.00
0.00
5.00
-8.00
-6.00
-4.00
-2.00
0.00
2.00
4.00
6.00
Exchange rate changes and the current account
current account to GDP, 2013(left scale) changes in the exchange rate, April 13' to Feb '14(right scale)
16
Source: IMF, GFSR Data Source: IMF, IFS
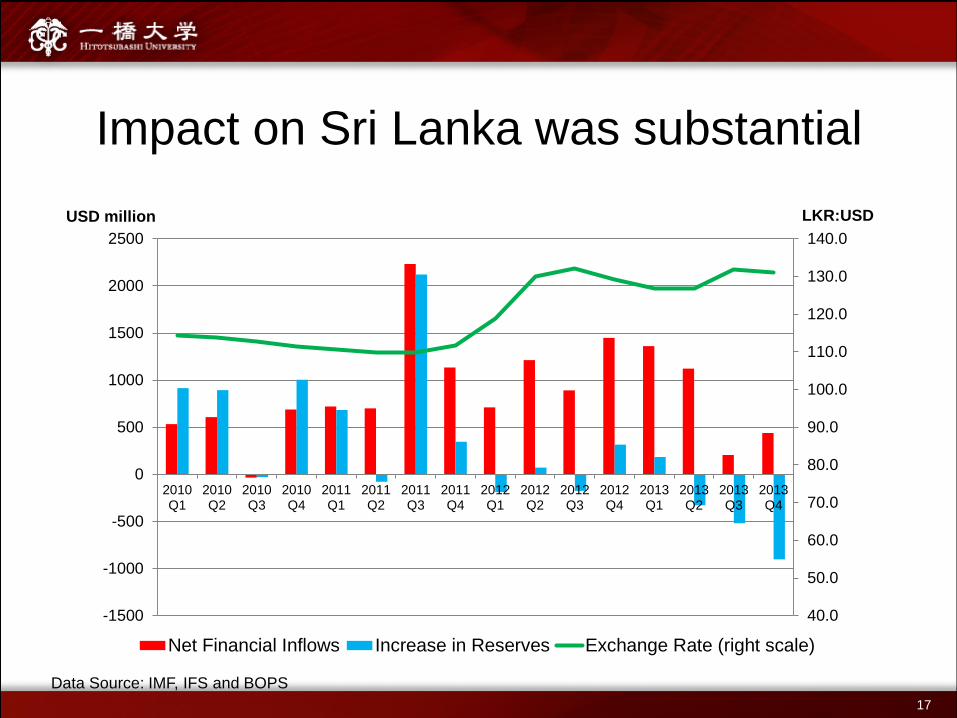
Impact on Sri Lanka was substantial
40.0
50.0
60.0
70.0
80.0
90.0
100.0
110.0
120.0
130.0
140.0
-1500
-1000
-500
0
500
1000
1500
2000
2500
2010Q1
2010Q2
2010Q3
2010Q4
2011Q1
2011Q2
2011Q3
2011Q4
2012Q1
2012Q2
2012Q3
2012Q4
2013Q1
2013Q2
2013Q3
2013Q4
Net Financial Inflows Increase in Reserves Exchange Rate (right scale)
USD million LKR:USD
17 Data Source: IMF, IFS and BOPS
Offsetting channels of transmission • To the extent US monetary policy normalization is a reflection of
recovery in the US, higher US domestic demand and stronger dollar should lead to higher exports for EME.
• US monetary policy normalization reduces capital inflows into EME and constrains their external financing and domestic growth.
• An unpleasant possibility under secular stagnation scenario in the US: – US monetary policy normalized with low growth, resulting in
financing constraints without the benefit of increased external demand.
18

Tapering was just an announcement -- what will happen when monetary policy is actually tightened? Must tightening always result in a large negative shock?
• If current long term rates properly reflect expected future rates (implying low growth and low inflation) rise in short and long-term rates will be gradual and limited.
• If current long term rates reflect excessive risk taking, then long-term rates could rebound sharply and cause a repeat of tapering induced disturbance.
• If rise in interest rates is the result of a better than expected recovery in the US (and other AE), then the result could be largely positive for EME.
19

Impact on EME depends on whether the shock is monetary or real
20
Source: IMF Spillover Report, 2014

Risks of EM Slowdown: China’s emerging financial problem
21
Bad debt resolution
4 trl. RMB Stimulus
Growth of shadow banking
A surge in credits almost invariably leads to a financial crisis.
But China still has the fiscal space to assume the loss and prevent an open crisis.

Sustaining growth in China is challenging
22
-4.0
-2.0
0.0
2.0
4.0
6.0
8.0
10.0
12.0
14.0
2001 2002 2003 2004 2005 2006 2007 2008 2009 2010 2011 2012 2013
Investment Net Exports GDP Growth
Post-Lehman Stimulus
Tightening
(Bad Debt Resolution)
(Exports and Related Investment)
?
Contributions to China’s GDP growth

Rebalancing is not that easy: a simple illustration
23
0
1
2
3
4
5
6
7Evolution of ICOR in China
2013 2014~2018 GDP Growth rate 7.7 7.5 Investment Growth 8.1 2.3 Investment/GDP ratio 48 37.5(end period) ICOR 6.3 5(end period)
In order to reach an ICOR of 5 in five years’ time, The investment to GDP ratio must decline to 37.5% by 2018. However, to reach a target growth rate of 7.5% without contribution from external demand, real consumption has to increase by 11.5% per annum. Government may need to continue to support demand, and be able to do so, but with consequences for longer-term public debt sustainability.
Note: ICOR (Incremental Capital Output Ratio) is a rough measure of efficiency of investment. High ICOR implies inefficient investment. ICOR in Japan and Korea during their high growth periods were around 3~3.5.

Policies: The Global Baseline • Monetary easing complemented by macroprudential
policies. – Still a lot of uncertainties about which macroprudential
measures work. – Capital flows management (capital controls) might also have a
role from macroprudential perspective.
• Short-term demand supporting fiscal stance as necessary, combined with credible long-term fiscal plan.
• Spillovers, but individual countries to pursue their domestic objectives, while others should address vulnerabilities and respond appropriately.
24
Implications for Sri Lanka • Sri Lanka need not worry about secular stagnation: a small country has
the possibility to grow by expanding trade, and Sri Lanka has room to increase openness.
• Need for debt-based current account financing leaves Sri Lanka vulnerable to external financial shocks. Monetary policy normalization in AE could have adverse impact. – Need to reduce vulnerabilities: Making sure external borrowing finances
productive investment, increase FDI, consider macroprudential measures for banks’ external borrowing.
• Slowdown in global growth will have impact, but US and EU growth
more important than China and EM slowdown. – EM slowdown likely to put pressure off oil and commodity prices, so has
positive elements (though lower oil prices may affect remittances from the middle east).
25

26
Thank you
A little advertisement…. • Hitotsubashi University Asian Public Policy Program (APPP)
– A two-year masters’ program for public sector economists. (Particularly strong on macroeconomic and public finance policies.)
• JICA’s JDS program supports Sri Lanka officials’ enrollment in the program – Two fully funded scholarships for APPP. Total of 15 places under JDS in
public policy, development economics, business administration and environment and disaster management at various universities.
• Ideal for young aspiring officials to build a solid basis to become fully-fledged economists.
• Applications for entry in fall 2015 will open soon. (Closing date last year was November 8, 2013 for fall 2014 intake.)
For details: APPP: http://www.ipp.hit-u.ac.jp/appp/ JDS: http://www.jds21.com/srilanka/ (to be updated)
27