world bank document - documents &...
TRANSCRIPT

1001 3W
WV
UO
0Ud
INH
W3O
VN
UW
1lIIT
IJ
10d'wS'
"s@s \\'\iiiss
Si i~~~~~~~~~~~~~~~~~0101
.01,~~~~~~~~~~~~~~~~I
I~~~~~~I
'1) I,Q
0 /s
':
1~~~~ 4
oS g'i/fr
C. ~ ~ ~
~ ~
~ ~
~ ~
~ .
.=
ael E
z
z 2
-,<
~~~~~~~~~~~~~~Cl2F-
CJID
~~~~~~~
cm E
3Ccom
^ e
e- ga:,
G-f
r=
-0
* s
o- =R
X2
CS
-a
C.fl
Pub
lic D
iscl
osur
e A
utho
rized
Pub
lic D
iscl
osur
e A
utho
rized
Pub
lic D
iscl
osur
e A
utho
rized
Pub
lic D
iscl
osur
e A
utho
rized
Pub
lic D
iscl
osur
e A
utho
rized
Pub
lic D
iscl
osur
e A
utho
rized
Pub
lic D
iscl
osur
e A
utho
rized
Pub
lic D
iscl
osur
e A
utho
rized


UNDP/UNCHS/World BankUrban Management Programme
Urban Management and Land
4
The Land Market AssessmentA New Tool for Urban Management
David E. Dowall
Published for the Urban Management Programme byThe World Bank, Washington, D.C.

This document has been prepared under the auspices of the United Nations Development Programme/UnitedNations Centre for Human Settlements (Habitat)/World Bank-sponsored Urban Management Programme. Thefindings, interpretations, and conclusions expressed here are those of the authors and do not necessarily representthe views of the United Nations Development Programme, UNCHS, the World Bank, or any of their affiliatedorganizations.
Deputy Director Chief ChiefDivision for Global Technical Co-operation Urban Development Division
and Interregional Programmes Division Transport, Water, and UrbanUnited Nations Development United Nations Centre Development Department
Programme for Human Settlements Environmentally Sustainable(Habitat) Development
The World Bank
Copyright (C 1995The International Bank for Reconstructionand Development/THE WORLO BANK
1818 H Street, N.W.
Washington, D.C. 20433, U.S.A
All rights reservedManufactured in the United States of AmericaFirst printing September 1995
The Urban Management Programme (UMP) represents a major approach by the United Nations family of organizations,together with external support agencies (ESAS), to strengthen the contribution that cities and towns in developingcountries make toward economic growth, social development, and the alleviation of poverty. The program seeks todevelop and promote appropriate policies and tools for municipal finance and administration, land management,infrastructure management, environmental management, and poverty alleviation. Through a capacity buildingcomponent, the UMP plans to establish an effective partnership with national, regional, and global networks and ESAs inapplied research, dissemination of information, and experiences of best practices and promising options.
The findings, interpretations, and conclusions expressed in this paper are entirely those of the author(s) and should notbe attributed in any manner to the World Bank, to its affiliated organizations, or to members of its Board of ExecutiveDirectors or the countries they represent. The World Bank does not guarantee the accuracy of the data included in thispublication and accepts no responsibility whatsoever for any consequence of their use. Some sources cited in this papermay be informal documents that are not readily available. Theboundaries, colors, denominations, and other informationshown on any map in this volume do not imply on the part of the World Bank Group any judgment on the legal statusof any territory or the endorsement or acceptance of such boundaries.
The material in this publication is copyrighted. Requests for permission to reproduce portions of it should be sent to theOffice of the Publisher at the address shown in the copyright notice above. The World Bank encourages disseminationof its work and will normally give permission promptly and, when the reproduction is for noncommercial purposes,without asking a fee. Permission to copy portions for classroom use is granted through the Copyright Clearance Center,Inc., Suite 910, 222 Rosewood Drive, Danvers, Massachusetts 01923, U.S.A.
ISSN: 1020-0215
Library of Congress Cataloging-in-Publication Data
Dowall, David E.The land market assessment: a new tool for urban management /
David E. Dowall.p. cm. - (Urban management programme, ISSN 10200215
4. Urban management and land)Includes bibliographical references.ISBN 0-8213-2703-81. Land use, Urban-Developing countries-Management. 2. Real
property-Valuation-Developing countries. 3. City planning-Developing countries. I. Title. II. Series: Urban managementprogram; 4. III. Series: Urban management program. Urbanmanagement and land.HD1131.D693 1995333.76'513'091724-dc2O 93-33937
CIP

CONTENTS
FOREWORD vii
ABSTRACT ix
ACKNOWLEDGMENTS xi
EXECUTIVE SUMMARY xiii
I. THE URBAN LAND CRISIS INot Enough Land in the Right Location at the Right Price 2High Cost and Low Affordability of Land and Housing i
Seoul 5Thailand 6Jakarta 6India 6Malaysia 7
Ineffective Government Urban Land Development Program 7Poor conceptualization of problems 7Poor coordination between government and between government andthe private sector 9Lack of funds 9
Plivate Sector Resistance to Government Land Regulations 10Envir-onmental Resource Constraints to Land Development 10Conclusions About the Urban Land Crisis II
H. WHY LAND MARKET ASSESSMENTS ARE NECESSARY 12Providing Information for Public Sector Planning and Decisionmaking 12
Using LMAs to evaluate government policies and actions 13Using LMAs for structuring land-based taxation systems 13Providing information for private sector investment and development decisions 13
Conclusions Regarding the Benefits of LMAs 14
III. ORGANIZING FOR LAND MARKET ASSESSMENTS 15Resources Necessary for Setting up a Land Market Assessment Process 1 5Timetable for Conducting Assessments 1 5
Dissemination of land market assessment information 16Developing Baseline Information 17Definc Area 17
Establish geographic zones for data organization 17Basic land-use and population data for tabulation 18Land value information 18
Design Layout of Spreadsheet Data Base 21Using Aerial and Satellite Images 22Tabulating Housing, Commercial, and Industrial Uses 22Assessing Land Conversion Trends 23Estimating Current and Future Developable Land Supply 23

iv
Adding Project Information to a Land Market Database 25Drawing up a sample of projects 25Project surveys 25Combining project surveys with market information 26
Using LMAs for Strategic Planning 26Case Study: Applying the LMA Process to San Pedro Sula, Honduras 26
San Pedro Sula LMA conclusions 27Projections of land for housing development 29Economic growth and nonresidential land needs 30Total land requirements for urban development, 1989-2001 30The strategic land development process 31Implications of the San Pedro Sula example 32
Case Study: The National Housing Authority of Thailand 33Using LMAs to Evaluate the Impacts of Government Actions 34
Ex post impact assessments 34Predicting land value impacts of future public actions 35
Case Study: Assessing the Impact of Infrastructure Development on Plot Prices,the Case of Karachi, Pakistant 36
Using LMA information for taxation and fiscal planning 37Case Study: Determining the Potential Benefits of Public Investments inKarachi, Pakistant 38
Private sector application of LMA information 40Gauging housing market competition in Bangkok's northern corridor 40
Conclusions 44
REFERENCES 45
ANNEXESANNEX A: Jakarta Broker Survey Methodology 49ANNEX B: The Use of Satellite Images for Urban Planning 63ANNEX C: Bangkok Housing Project Survey 65
TABLESTable 1-1. Annual urban land conversion: Selected cities ITable 3- 1. Residential land requirements in San Pedro Sula 30Table 3-2. Nonresidential land requirements in San Pedro Sula 31Table 3-3. Total land requirements for urban development in San Pedro Sula 32Table 3-4. Average residential plot prices by level of infrastructure development and
year in Karachi 36Table 3-5. Estimates of plot prices by level of infrastructure and distance 1988 37Table 3-6. Regression model of plot prices by size of plot, distance, and infrastructure
development 1980-85, Karachi 39Table 3-7. Comparison of KDA allotment revenues and developed value of plots
alloted by KDA in 1980 and 1985, in 1988 rupees, Karachi 40Table 3-8. Summary of the types of housing units on the market in the northern corridor,
April 1987 41Table 3-9. Characteristics and features of units for sale in the northern corridor,
April 1987 41

v
Table 3-10. Distribution of planned and sold units in the northern corridor by price,April 1987 42
Table 3-11. Sales rate by the type of housing unit in the northern corridor, April 1987 43Table 3-12. Sales rates of units by price in the northern corridor, April 1987 43Table A- 1. A comparison between infrastructure level and specific types of infrastructure
services 52
BOXESBox 1. The Kathmandu Valley 3Box 2. Redevelopment Problems in China 4Box 3. The Effects of India's Urban Land Ceiling Act 7Box 4. Bangkok's Road Problem 8
MAPSMap 1. Metropolitan Bangkok Kwaeng Location 19Map 2. Land conversion in square kilometers 1974-84, metropolitan Bangkok 24
FIGUREFigure B1-1. Different types of residential development in Karachi, Pakistan 64


FOREWORD
This paper has been prepared for the Land Management component of the joint UNDP/UNCHS/World Bank, Urban Management Program (UMP). The UMP represents a major approachby the UN family of organizations, together with external support agencies (ESAs), to strengthen thecontribution that cities and towns in developing countries make toward economic growth, socialdevelopment, and the alleviation of poverty. The program seeks to develop and promote appropriatepolicies and tools for municipal finance and administration, land management, infrastructur:management, and environmental management. Through a capacity building component, the UMPplans to establish an effective partnership with national, regional, and global networks and ESAs inapplied research, dissemination of information, and experiences of best practices and prom.singoptions.
This report was the first of a series of management tools produced by the UMP 'andmanagement component. The series covers a wide range of topics, including land informationmanagement, land registration, land development policies, standards for land regulation, and urbanspatial planning. The information in these reports contributes to the preparation of detailedoperational guidelines to help policy makers and technical staff in developing countries carry outappropriate land development policies and techniques, especially at the city and municipal level ofgovernment.
Phase 2 of the UMP (1992-96) is concerned with capacity building at both the countryand regional levels and with facilitating national and municipal dialogue on policy and programoptions. It emphasizes a participatory structure that draws on the strengths of developing countryexperts and expedites the dissemination of that expertise at the local, national, regional, and globallevels.
The main goal of the UMP in Phase 2 is to build the capacity for infrastructuremanagerment, municipal finance and administration, land management, urban environmental man-agement, and poverty alleviation by means of three interactive processes:
* City and country consultations. The UMP brings together national and localauthorities, private-sector networks, community representatives, and otheractors to discuss specific problems within the UMP's subject areas and topropose reasoned solutions.
* Regional panels and technical cooperation. To ensure sustained and effectivesupport for the activities to follow country consultations, the UMP is establish-ing regional offices, each headed by a regional coordinator, in Kuala Lumpur forthe Asia and Pacific region, in Accra for Africa, in Quito for Latin America andthe Caribbean, and in Cairo for the Arab States. From 1993 to 1996 the UMP willgradually build up regional panels of urban management expertise for each ofthe program's five areas of concem, which will provide the structure needed toinstitutionalize the UMP's capacity-building objective over the long term.Developing countries will be able to draw on this pool of expertise for technicaladvice on a sustained basis.
viii
Global support and synthesis. Nucleus teams in Nairobi and Washington,D.C., support the regional panels and national institutions by synthesizinglessons learned, conducting state-of-the-art research, identifying best practices,and disseminating program-related materials. The present paper is part of aseries of management tools produced by the UMP.
Mark Hildebrand Louis Y. PouliquenChief Former DirectorTechnical Cooperation Division Transportation, Water, andUnited Nations Centre for Urban Development DivisionHuman Settlements (HABITAT)

ABSTRACT
Over the next 15 to 20 years, the urban areas of developing countries are expected todouble in size. The rate at which urbanization is proceeding and pushing up the demand forresidential, industrial, commercial, and community land has no precedent even in the history ofdeveloped countries. Indeed, land is the essential ingredient in this process, as in all urban growth.The problem for most developing countries is not a shortage of developable land, but the ineffectiveand often outdated mechanisms they use to ensure an adequate supply of suitable land for urbangrowth.
But it is no easy matter to develop land policies that would address this problem,particularly because of the complex role that land plays in society-not only as an avenue ofdevelopment, but also as a commercial good and a natural birthright. Consequently, every landdecision is surrounded by an array of institutional, administrative, technical, financial, cultural,environmental, and political issues.
Despite the complexities of land development, its potential benefits are enormous.These may be measured by the lower cost of industrial and commercial development, higherstandards of living for residents, and the more efficient provision of urban services, not to mentionthe more intangible benefits, such as individual peace of mind, cultural satisfaction, and socialstability. Therefore, it is important for developing countries to understand their land issues and learnhow to deal with them so that these complexities can be overcome.
This report is part of a planned series on land issues being undertaken jointly by UNCHS(Habitat) and the World Bank. The series will cover a wide range of topics, including landinformation management, land registration, land development policies, standards for land regula-tion, and urban spatial planning. The information in these reports will be used to prepare detailedoperational guidelines to help policymakers and technical staff in developing countries carry outappropriate land development policies and techniques, especially at the city and municipal level ofgovernment.


ACKNOWLEDGMENTS
The author would like to thank Giles Clarke, Peter Dale, Catherine Farvacque, EmilioHaddad, Britton Harris, Lynn Holstein, Steven Malpezzi, and Patrick McAuslan for their commentson earlier drafts of this paper. Vicky McIntyre and Mary McNeil did a splendid job of editing thepaper. Vino David and Elizabeth Durst ably word processed revisions to the paper.


EXECUTIVE SUMMLARY
i. Under the mounting pressures of urban development, cities of the developing world are invital need of accurate and systematic information about their land markets. Such information isessential to a host of rational economic decisions in both public and private programs. Without it,cities are unable to plan and develop housing and residential plots or the urban infrastructureneeded to cope with their fast-growing populations. A tool that has been developed to providesuch information is the land market assessment (LMA).
LMA Objectives and Procedures
ii. The land market assessment provides accurate and up-to-date data on land prices, thesupply of serviced land, and present and projected land projects. In other words, it provides aconcrete foundation for defining appropriate strategies for improving land market performance.LMAs can be used to support four broad activities: 1) govemmental planning anddecisionmaking, 2) the evaluation of govemment policies and actions, 3) private sector investmentand development decisions, and 4) the structuring of land-based taxation systems.
iii. Land management assessments are carried out by a team of professionals that usuallyincludes a land economist familiar with market survey techniques; a land planner experienced ininterpreting aerial photographic and satellite images; a statistician with experience incomputing and data base management; data analysts for coding, data entry, and fieldwork; adraftsperson; and a group of surveyors. A computer system is used to develop the data baseand conduct statistical analyses.
iv. The time required to prepare a land market assessment depends on the size of the city, thelevel of detail of analysis, and the number of professional staff assigned to the project If the city isstarting from scratch, it will take approximately one to two years to complete a land marketassessment, although most of the basic data would have been collected somewhat earlier.
V. The first step in a land and housing market assessment is to review available reports anddata sources that have been compiled by public and private agencies on land and housingconditions in the metropolitan area. In addition, meetings will be held with govemment officialsand private real estate developers, brokers, and bankers. These preliminary efforts will yield theinformation needed to define the size and shape of the study area, the types of data to be collectedand analyzed, and the specific policy questions to be addressed.
vi. Next, changes in housing stock or land use are tabulated from aerial photographs andsatellite images. Housing types, including both informal and formal housing, are then tabulated indetail, differentiating slums and squatter settlements, land subdivisions, formal private housingdevelopments, and public housing projects. Nonresidential uses, including industrial areas,commercial districts, and institutional uses are also recorded.
vii. Detailed information about the price and characteristics of new housing units offered in themarket is then obtained to establish the current supply of housing on the market, the affordabilityof the current supply of housing relative to current household incomes in the metropolitan area,

xiv
and the types and locations of units selling most quickly. Households can be surveyed to obtaineven more refined details.
viii. The next step is to disseminate the information obtained from the assessment. This can beaccomplished through seminars, reports, and briefings to public and private sector professionals.The information will be of particular concem to officials in local, regional, and nationalgovernments who are responsible for urban land development and planning, programming anddevelopment of housing and residential plots, and the development and financing of urbaninfrastructure. It will also be of interest to housing and commercial developers, bankers lending onurban development projects, professional planners and advisers working for international donoragencies, and researchers working on land and shelter issues in developing countries.
Application of LMAs
ix. The land price data base developed by the LMA can be used to gauge the impact ofgovernment policies, investments, and actions. Such assessments fall into two types: ex postmeasurements of the effects of local public actions, and predictions of land market impactsresulting from future government actions. The ex post method in turn can be divided intomeasurements that employ econometric models and those that use case study comparisons toassess the effects of public investments. The econometric approach relies on regression models toisolate the net impact of a project on land values. Methods for estimating the effects are based oneither time-series or cross-sectional data. The time-series method begins by defining the area fromwhich historical land value data is collected. Usually, the analyst identifies some area in whichland parcels are assumed to have benefited or been affected by a project. In the case studycomparison, two areas are selected for analysis. One is located adjacent to the project and theother is a "control" case distant from the project, but similar in most other respects.
x. It is considerably more difficult to predict the likely impacts of public actions on landvalues. Two approaches are suggested, both of which require substantial information about landmarkets. The first method applies the estimates of past impact assessments to future projects orregulations. Although crude, this approach provides planners and finance specialists with someestimates. The second approach, which applies only to land use and development regulations,estimates the potential impact of a change in zoning or building controls on land values.
xi. LMA information is also used in taxation and fiscal planning. Many central governments,hard-pressed to fund the construction of infrastructure to support land development, are beginningto levy taxes, fees, and user charges on property owners. But to efficiently impose these charges itis necessary to measure the costs and benefits of infrastructure projects-particularly changes inland values.
xii. LMA information also has many applications in private sector development. In the case ofresidential development, most developers attempt to estimate the demand for housing units andcompare it with supply. The land market assessment of the location and characteristics of projectscan be used by developers to gauge the current level of the supply of projects by geographic area.

xv
Private developers as well as public developers can then compare then current level of supply withdemand to determine whether additional projects are warranted.
xiii. In sum, the land an dhousing market assessment is an essential first step toward makinglocal land and housing markets more efficient. The information base generated by the assessmentcan be used to gauge market performance, identify future needs for infrastructure, assess housingaffordability and assess the impacts of public policies and actions.


I. THE URBAN LAND CRISIS
1.1 Cities throughout the developing world are facing serious challenges as they attempt tocope with unprecedented population growth. In the struggle to respond to development pressures,their local institutions, both public and private, are being overwhelmed by a multitude of concerns:Will there be enough land to support urban development? Do all income groups have access to landfor housing, commercial, and industrial activities? Is infrastructure expanding fast enough to supporturban development, and are services being deployed in areas where needs are the greatest? How canthe government finance the construction of critical infrastructure? Is the land market operatingefficiently? How can the efficiency of the land market be increased? Will the prevailing patterns ofpopulation and housing density continue into the future, or are there alternatives to urban develop-ment that require less land? How can agricultural lands surrounding cities be preserved withoutdriving the price of land beyond the reach of low- and middle-income households? Should thegovernment attempt to aggressively control land development?
1.2 Population and economic growth does not take place in thin air. It requires land, and lotsof it. The rate of land conversion to urban use for Asian cities, for example, is enormous (see Table1.1). In Bangkok between 1974 and 1984, the rate was 32 square kilometers of agricultural land peryear (Dowall, 1989a); in Karachi, 24 square kilometers per year (Dowall, 1989b); and in Bangalore,a much smaller city, about 13 square kilometers per year (Srinivas, 1989). Even in remoteKathmandu, the pace of land conversion was so rapid that the residential land area of the city doubledbetween 1971 and 1981 (Doebele, 1987).
1.3 Against the backdrop of these growth trends, policymakers are beginning to recognizethat land-use policy-including infrastructure development, shelter provision, and land-use andenvironmental planning-is an important facetof national economic developmentplanning (Menezes,1988). Urban land-use policy is no longer a luxury best left to wealthy nations. Developing countriesare experiencing urban growth on a massive scale that calls for bold action from both the public andprivate sector. Policymakers and private developers need to work together to solve land developmentproblems.
Table 1-1. Annual urban land conversion, selected cities
City liectares Date
Ahmadabad 565 1980Bangalore 1,311 1983-2001Bangkok 3,200 1974-1984Jakarta 2,300 1979Karachi 2,400 1971-1985Bogota 2,325 1981Mexico City 4,826 1970
Sources: Dochele (1987). Dowall (I989a. b), and Srinivas (1989)

2
1.4 Urban land problems are too complex and wide ranging to classify neatly, but they maybe divided into five broad categories: 1) lack of enough land at the right price and in the right location;2) high cost and low affordability of land and housing; 3) ineffective government programs andactions in the area of urban development 4) private sector resistance to government land r egulations;and 5) environmental resource constraints to land development.
Not Enough Land in the Right Location at the Right Price
1.5 The urban land market operates to allocate land to buyers. It does so through adjustmentsto prices, the quantities supplied, and the quantities demanded. In many countries, policymakers areconcerned that the urban land markets are not operating cfficiently and that land is in short supply,land prices are high, or combinations of both.
1.6 One obstacle to the development of sound urban land policies is the fact that landmarkets are poorly understood, which is due in part to their complexity and in part to the lack ofsufficient perfiormance data. This lack of information often stands in the way of rational economicbehavior and leads to inappropriate government policies and investment programs (see for example,Mayo, Malpezzi, and Gross, 1986).
1.7 Unlike other markets, where supply and demand determine the dynamics of marketoperation, land markets are not driven by perfectly competitive forces. Land is not homogeneous;each parcel is unique, having a particular set of locational, physical, and neighborhood characteris-tics. Actors in the land market are diverse and have divergent objectives, expectations, and strategies.In some cases, only a few buyers and sellers may participate in particular land markets, and anindividual land sellei or buyer can greatly influence market outcomes. When there are barriers toentry-as, for example, when all land is owned by the state or by a tribe-less than norrnal profitsand rents can be earmed. In addition, land market attributes, such as ease of entry and exit, are closelycontrolled by local and national government policies and by public decisions about infrastructureinvestment, which is not the case in other markets.
1.8 A fundamental dif'ference between land and other commodities is that land is usedexclusively for producing some other product. The demand for land is therefore derived from thedemand for the product or serIvice produced on the land. The demand for residential land is derivedfrom the demand f'or housing; the demand for housing, in turn, is determined by demographic andeconomic factors such as the rate and level of household formation, household income, savings, andinterest rates. The demand for land is also affected by the number of people wanting to hold land asan investment. These factors, also apply to the demand for commercial and industrial land.
1.9 On the supply side, the quantity and price of land depends on the spatial pattern ofinfrastructure, the physical developability of land, the willingness of cuirent landowners to sell, andgovernment-imposed limitations on how land may be used. The level of infrastructure-such asroads, municipal water, and sewage treatment trunk lines-by and large determines whether land canbe developed (although this is not the case in inflormal settlements), to what extent, and in whatphysical direction. In rapidly growing cities, the infrastructure capacity is frequently inadequate andtherefore impedes land development and helps intlate land prices.

3
Box 1. The Kathmandu Valley
The Kathmandu Valley provides a good example of how both natural topography and land development controlslimit the available supply of land for future urban expansion. The Kathmandu Valley, nestled in the Himalayas,is one of the most agriculturally productive areas in Nepal. In 1981 it produced about 97 percent of the country'sfood grain. Valuable agricultural land in the valley is being converted to urban uses as the city of Kathmanduexpands. At current urbanization rates, all Class I and II farmlands will be converted to urban use by 2020, andNepal will become dependent on foreign impor ts of food. In response to these ominous trends, the government ofNepal recently embarked on a strict program to limit urban development in agricultural areas (PADCO, 1986).
1.10 A frequently mentioned but rarely proven allegation about the cause of land scarcity isspeculation and land hoarding. Many public officials claim that land is purchased by speculators andheld off the market in anticipation of substantial price appreciation. In many countries with highinflation, land is routinely viewed as being an excellent store of value (Walters, 1983), especially ifthere are no alternative financial assets. The Bangkok land market is a case in point: in 1990 the priceof suburban land there increased by more than 90 percent, making it an excellent investment.
1.11 Topography can also limit land supply. Many of the major cities of the developing worldare located in areas sulTounded by steep slopes, marshes, or water. In other cases, the systems of ruralland tenure severely limit urban development in fringe areas. The Kathmandu Valley stands as avividexample of how topography and government regulations limit land supply (see Box 1).
1.12 Zoning and other government land-use controls such as greenbelt policies can alsoaffect land markets. Zoning, by limiting building density or the uses allowed in certain areas, limitsthe effective supply of buildable land. And although establishing a greenbelt may offer certain publicamenities, policymakers must recognize that this can create an adverse impact on urban land supplyand piices (Dowall, 1984).
1.13 In the absence of local controls over the use of land, the market operates to allocate landto users on the basis of price. Those potential users capable of paying the highest price for a site willoccupy it.
1.14 Competition among land users sets prices and determines the pattern of land-useactivities in an urban area. As the pressure for urban development increases, rural and agriculturalland on the edges of cities is developed. The process of converting farmland to urban uses is triggeredwhen the demand for peripheral land pushes the price bids beyond the value of agricultural land. AsBrown and Roberts (1978) have pointed out, the process of agricultural land conversion is complexand, contrary to popular belief, involves many separate land markets stretching out from the currentlimit of development to areas that will not be converted to urban uses for at least twenty years.
1.15 Another, much different process of land conversion occurs in built-up areas. Competi-tion in urban land markets often causes land patterns to shift from one use to another. If a particularactivity is expanding and needs more space, land already in another use may be converted to the newactivity. As long as there is no restriction on such conversions, land uses in urban areas can flexibly

4
Box 2. Redevelopment Problems In China
Redevelopment projects in Guangzhou and Tianjin illustrate the financial difficulties of carrying out housingredevelopment projects and the resulting bias of real estate development corporations againstbuilt-up urban areas.
Two structural problems conspire against redevelopment projects in China: ironclad property rights of the existingresidents and limitations on development density. Inmost cases (Beijing is the exception, as explained below), therights of existing residents are protected to the extent that they must be provided with replacement units of at leastthe same size and be allowed to pay the same rents after redevelopment as before. It is not surprising that inGuangzhou and Tianjin more than 95 percent of the prior residents elect to retuni to the site.
In virtually all cases, the rents are so low that they do not even cover maintenance costs, let alone capital costrecovery. In such cases, the replacement units generate no caslh flow. Thus any redevelopment project stands orfalls on its ability to provide additional marketable housing units that can be sold at high enough prices to carrythe entire cost of the redevelopment project. It might be possible to build profitable redevelopment projects if thenew project could be extremely dense, but unfortunately planning standards and the general notion that "densitiesare too high" in the central cities usually makes it impossible for FARs to be increased to I-long Kong or Seoullevels. The net effect of these density constraints is that most redevelopment projects can build four units for everythree replaced. This means that the one marketable unit must finance tlhe cost of the tlhree replacement units. Thisis extremely difficult, if not impossible.
In Guangzhou, land acquisition costs in old developed areas are approximately 33 percent higlher than in"greenfield" areas. In Tianj in, the differences are greater since the prior residents usually receive even more usablespace than t&vy previously occupied.
In contrast, the Beijing Municipality recognizes the high costs of redevelopment, especially if all prior residentsare provided with replacement units on site. Accordingly, it has developed a promising lower-cost approach toredevelopment. The municipality's new procedure is based on a series of incentives to encourage priorredevelopment area residents to move to new suburban housing estates. So far, the approach is working-between70 and 80 percent of the prior residents elect to return to the site. This reduction in required replacement housingimproves the financial fcasibility of redevelopmenit projccts by increasinig itde portion of marketable units.
respond to shifting demands. Virtually all growing cities with market economies are going throughthis transformation. Redeveloping older areas is more difficult for cities in centrally plannedeconomies, such as China, mainly because of the nature of property rights, the structure of theinstitutions that oversee real estate development, and the way pro'ects are financed (see Box 2).
1.16 Since it tak-es time for any land market to adjust, most of the short-term shifts in demandor supply result in price changes. Depending on the price elasticity of demand for land, increases inthe price of land will reduce the demand for it. In the United States, for example, the price elasticityof demand for residential lots is inelastic, meaning that increases in demand will push up land pricesif supply is fixed (Witte, 1979; Sitmans and Redman, 1979). This suggests that the inflationaryeffects of poor land titling and registration, lagging infrastructure deployment, government regula-tions, and physical constraints that limit the supply of land can be considerable. In areas with highdemand and a limited choice of housing, price-inelastic demand can inflate land prices to a greaterdegree than in softer markets or those offering a wider set of alternative housing locations.
1.17 The efl'iciency and equity of urban land conversion depend on a variety of factors, suchas land tenure, land records, government regulations, the availability of' infrastructure, financing
5
sources, land prices, and the level of sophistication of private and public land developmentinstitutions. Take the case of Karachi and Bangkok. Karachi is experiencing an acute shortage of landbecause the Karachi Development Authority (KDA) grossly underprices residential plots and thuslimits its financial capacity to fund infrastructure development.
1.18 The low pricing also increases the speculative demand for plots, thwarting the accessof low-income households to plots. In the case of Bangkok, the land market is working extremelywell, quickly responding to demand pressures. The success of the Bangkok land market is due largelyto the absenice of strict planninig and development cotitrols and an aggressive private sector.
High Cost and Low Affordability of Land and Housing
1.19 The causes of rapidly escalating land and housing prices are manifold, but theyessenitially stem fiom an excess demand for land and housing relative to supply. In Karachi, forexamplc, where the land development, pricing, and allocation policies of the government haveseverely constrained the supply of land for housing, the prices of housing increased by an averageof 30 percent per year between 1985 and 1987. The prices of large residential plots increased by 22perIcCnt peI year over the same period (Dowall, 1989b). In real terms, after adjusting for priceinllalion. land prices have increased by more than 11 percent per year.
1.20 In most cities of developing countries, policymakers are greatly concerned with risinglaind anid hOuSillg prices. In Seoul, disenfranchised low-and moderate-income groups have beendeimonlstratinig ['or political action to ease housing pressures. In Thailand, Indonesia, India, andMalaysia, land and housing price inflation and housing affordability have become a critical policyissue.
Seoul
1.21 The precipitous increase in land and housing prices in Seoul is challenging the stabilityof the Roh governmelnL. Land prices in metropolitan Seoul are increasing at an annual rate of morethan 25 percenit. Accordinig to a recentstudy by the Korean Research InstituteforHuman Settlements,the anlual increase in land values in 1988 (88 trillion won) exceeded the annual wage income for allol'f tle couLntry's workers (Clit'ford, 1989).
1.22 The rapid increase in land costs is due to the combined impact of continued massivemigration to the capital and a series of governmental policies regarding property taxation, housinodevelopment, and planninig. In the 1 980s, in a move to decentralize economic activities out of Seoul,the government curtailed the suburban development of new towns, thereby limiting the opportunitiesfor large-scale residential development. Much of the blame for rapid land inflation has been put onspeculators. Current capital gains and property taxation rules limit capital gains taxes until the timeof sale, and annual property taxes are based on assessed values, which represent about 10 percent ofmarlket values. Both tax practices encourage the withholding of land from the market. A final culpritis lhe governrment's well-intentioned program of limiting the prices of new apartments to a lowUS$597 per square meter. These pricecontrols, together with tax polices, make it inexpensive to holdland and therel'ore have encouraged developers to "warehouse" their land rather than build newapartmetits (Cliltord, 1989).

6
Thailanid
1.23 Thailand's finance minister has recently pushed for policies that would tax assets inorder to cut down on land speculation. Under the tremendous demand pressures of recent years, landprices have skyrocketed, increasing by more than 90 percent per year in Bangkok. Although thehousing market has been perforning well under these pressures, the prices of single-family andtownhouse units have increased enormously, causing an affordability problem. In response,developers of low- and moderate-price housing have shifted their strategy and have started buildinghigh-rise condominiums. In 1990 approximately 15 percent of housing construction activity (11,500units) consisted of low- and moderate-cost condominiums (ranging from 182,000 to 360,000 baht,which is roughly two to four times the median household income). In 1991 20,000 condos in this costranre are expected to be built.
Jakarta
1.24 Accor-ding to a recent study of land prices in JakarLa, real prices of land increased by 20percent between 1987 and 1989. That study, the first of its kind in Jakarta, surveyed land prices forparcels in DKI according to whether they have infrastructure and clear title (Dowall and Leaf, 1991).Price intlation was found to be highest for parcels lacking clear title and in areas withoutinfrastructure, averaging more than 37 percent per year in real terms. In developed areas with cleartitles, land prices have increased less sharply, averaging only 10 to 15 percent between 1988 and1989.
1.25 In recent years, government officials and private sector developers have becomeincreasingly concerned about the difficulty of acquiring land for suburban housing projects. It nowtakes developers between 2.5 and 3 years to obtain development permission (Hoffman, 1989), butthe current process of land acquisition is equally time-consuming for the government. Because ofthese delays, the market cannot respond quickly enough to the increasing demand for housing, andhousing prices in DKI continue to rise. One possible response would be guided land development,where the public sector provides infrastructure to fringe land to facilitate private sector development.
India
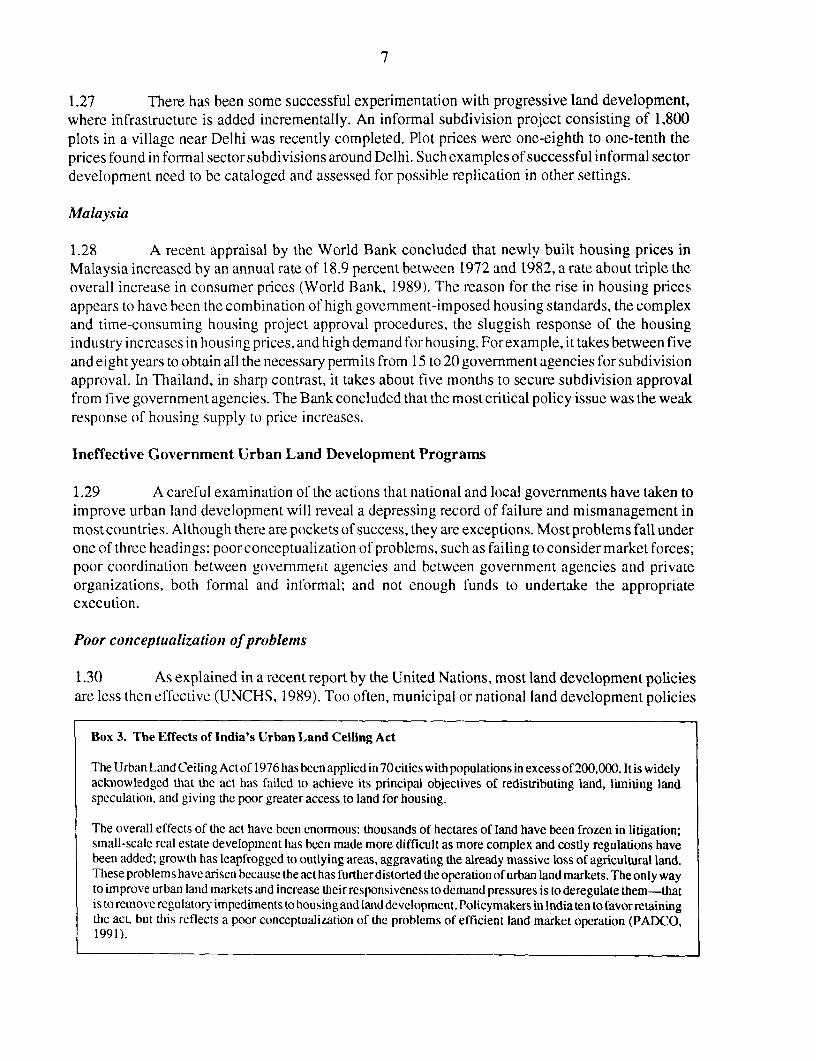
1.26 Strong population growth, urban migration, and the limited deployment of infrastruc-ture have sent land prices spiraling in India. In Bangalore, for example, a medium-sized city of about4.5 million that is growing at 8 percent per year, residential land prices have increased byapproximately 12 percent per year, far outstripping the increase in the incomes of residents. As aresult, housing affordability in the city has declined. Because this pattern is common in other Indiancities, the Urban Land Ceiling Act was passed in 1976 in an attempt to stop land speculation and landinflation. While well-intentioned, this act has caused substantial problems-significant reductionsin the supply of land for residential development, the creation of a vast black market for real estate,and an overall worsening of housing affordability in India's major urban areas (Acharya, 1989).These and other ancillary concerns prompted the establishment of the Task Force on Housing andUrban Development. This group has proposed a land-price monitoring system for India, and the datacollected will be used to gauge trends in land prices in cities across the nation, thereby enabling policyanalysts to assess the impacts of a myriad of government policies and actions on the urban land market(Center for Research, Planning and Action, 1990).
7
1.27 There has been some successful experimentation with progressive land development,where infrastructure is added incrementally. An informal subdivision project consisting of 1,800plots in a village near Delhi was recently completed. Plot prices were one-eighth to one-tenth thepfices found in formal sector subdivisions around Delhi. Such examples of successful infonnal sectordevelopment need to be cataloged and assessed for possible replication in other settings.
Malaysia
1.28 A recent appraisal by the World Bank concluded that newlv built housing prices inMalaysia increased by an annual rate of 18.9 percent between 1972 and 1982, a rate about triple theoverall increase in consumer prices (World Bank, 1989). The reason for the rise in housing pricesappears to have been the combination of high govemment-imposed housing standards, the complexand time-consuming housing project approval procedures, the sluggish response of the housingindustry increases in housing prices, and high demand for housing. Forexample, it takes between fiveand eight years to obtain all the necessary permits from 15 to 20 government agencies for subdivisionapproval. In Thailand, in sharp contrast, it takes about five months to secure subdivision approvalfrom five government agencies. The Bank concluded that the most critical policy issue was the weakresponse of housing supply to price increases.
Ineffective Government Urban Land Development Programs
1.29 A careful examination of the actions that national and local governments have taken toimprove urban land development will reveal a depressing record of failure and mismanagement inmost countries. Although there are pockets of success, they are exceptions. Most problems fall underone of three headings: poorconceptualization of problems, such as failing to consider market forces;poor coordination between governmenit agencies and between government agencies and privateorganizations, both formal and informal; and not enough funds to undertake the appropriateexecuiion.
Poor conceptualizationi of problems
1.30 As explained in a recent report by the United Nations, most land development policiesare less then effective (UNCHS, 1989). Too often, municipal or national land development policies
Box 3. The Effects of India's Urban Land Ceiling Act
The Urban Land Ceiling Actof 1976 has been applied in 70citieswith populations in excessof 200,000. Itis widelyacknowledged that the act has failed to achieve its principal objectives of redistributing land, limiting landspeculation, and giving the poor greater access to land for housing.
The overall effects of the act have been enormous: thousands of hectares of land have been frozen in litigation;small-scale real estate development has been made more difficult as more complex and costly regulations havebeen added; growth has leapfrogged to outlying areas, aggravating the already massive loss of agricultural land.These problems have arisen because the act has furtherdistorted the operation of urban land markets. The only wayto improve urban land markets and increase their responsiveness to demand pressures is to deregulate them-thatis to remove regulatory impediments to housing and landdevelopment. Policymakers in Indiaten to favorretainingthe act, but this reflects a poor conceptualization of the problems of efficient land market operation (PADCO,1991).

8
are the products of the political process, reflecting the aspirations and wishful thinking of governmentofficials. Most policymakers fail to consider how governmental programs will adversely affect landand housing market operations. Consider, for example, India's Urban Land Ceiling Act, which hasfrozen land development activities in many cities across the nation (see Box 3). Commonly, plansand policies are the result of inappropriately applying the experiences of other countries.
1.31 In the development of public land, it is quite common for agencies to ignore marketforces in the design of housing or land development projects. For example, up until recently,Indonesia's National Urban Development Corporation did not consider the annual effective demandfor housing or the competitive supply of housing in the local markets it was considering for possibleinvestment (Dowall and Sherer, 1989). In many cases, the agency would buy far too much land thanwas warranted by market conditions or it would build housing that was too expensive for residentsto purchase.
1.32 Another frequent problem is that land development policies are driven by a far toolimited set of objectives and fail to consider broader institutional, cultural, and historical factors. Asa result, land policies frequently generate a host of unanticipated side effects.
1.33 A growing trend in most countries is that an increasing amountof development is simplytaking place outside the formal sector. In many instances, the activities of the informal sector areignored by the government-data are not collected on informal development and planners andpolicymakers are unable to understand how the informal sector operates. Ignoring the informal sector
Box 4. Bangkok's Road l'roblem
Since 1980, traffic congestion has been amajor problem in Bangkok. The principal cause is thatthe roadway systemhas failed to providedistributorroadsto handle the flow oftraffic from small access streets (sois). Instead, virtuallyall trips have to be made on Bangkok's limited system of major roads. Without distributor roads, the lands forhousinig and commuercial development cannot be used efficiently.
In large metropolises, main roadsdivide the urbanareas into blocks. The sizeof these blocksdepends on thedensityof development. Typically, they range from I to 10 square kilometers. In Bangkok, these blocks are so large thatthey are referred to as "superblocks." The pattern of main roads is coarse and some of the superblocks exceed 50square kilometers. The paramount defect of these superblocks is their lack of distributor roads. As a result, smallaccess roads have been built directly from the main road into the superblock. Rarely does the soi go all the waythrough the superblock, and so it cannot operate as a distributor. Instead, the city has an array of dead-end sois thatfail to contribute to a network system.
Between 1984 and 1988. almost 30.000 hectares of land were urbanized, most of it located in the suburban areas.These areas are developing in this samne pattern of superblocks. Traffic congestion will continue in these areasuniess there is some advance planning and programuninig of a system of roads.
Why, then. haven' t distributorroads been developed in Bangkok? One reason is that Thailand's local governmentsleave the construction of minor roads to the private sector. in Bangkok, road building has been turned over largelyto developers. uw1hose maini objective has been to pro\ ide access to parcels owned by Lhe initiating builder, but theprivately constructed roads fail to generate opportunities tor Lhe lfurtherdevelopmentof residential parcels that arenot under LhC control ot Lhe builder. As a result, many parcels remain "land-locked." Unless the roadway systemis corrected, valuable land will remain vacant, tratfic congestioni will persist, and leapfrog development willcontinue to plague thC region (PADCO. 1990).

9
won't make it go away and understanding how it operates is essential to planning for futuredevelopment.
1.34 But the main reason most local governments are unable to cope with rapid urbanpopulation growth is that they are "flying blind;" they simply don't know what is going on in theirlocal land market. Visits to the planning offices of most large cities in the developing world revealhow little is known about patterns of urban land development, the number of housing units (bothformal and informal) built in the past year, land and housing prices, rents for office buildings andfactories, infrastructure deployment patterns, land subdivision patterns, and so on. This samecriticism can be made of the private sector. Developers frequently overbuild markets (for example,shophouses and condos in Bangkok) because they don't have up-to-date information about propertymarkets.
Poor coordination between government and between government and the private sector
1.35 One global problem is the lack of coordination between public agencies, on one hand,and between the public and private sector, on the other. As a result, work is often duplicated byvarious agencies. In Thailand, for example, the Government Housing Bank shares its housingmandate with the National Housing Authority, municipal housing authorities, and several initiativessponsored by the Royal Thai government. An extreme example is the Bangkok MetropolitanAuthority's twenty-seven functions, each of which is shared with at least one central governmentagency. This system is a natural response when agencies are unable to rely on each other for supportfunctions and have to do everything themselves.
1.36 It is also quite common to find that the people actually making the plans are not the onesmak-ing key decisions about public investments and private development. Consequently, housing orlarge-scale land development projects are not integrated with other public infrastructure projects-projects are built, but lack road access. Since the key decisionmakers often do not use planning andland market information to guide their actions, there needs to be much stronger coordination betweenthose who develop policies and those who implement them. Land development policy-setting is tooimportant to leave entirely to planners-it needs to be better integrated with national economicdevelopment programs (van Huyck, 1987). More important, there needs to be broader support andparticipation from government implementing agencies, private sector groups, and citizen organiza-tions.
1.37 Poor coordination between private sector organizations is also prevalent. One exampleis the failure of banks and investors to assess the investment decisions of their competitors. InBangkok, thc private provision of roads is not coordinated at all. The situation in Kathmandu issimilar (Doebele, 1987).
Lack offunds
1.38 Because of their rudimentary taxation systems, most cities of the developing world lackthe financial resources to implement critical urban development programs (World DevelopmentReport, 1988). Governments simply don't have the mechanisms for taxing the land value gainsresulting from investments in infrastructure, land registration, and titling. If they could tax landeffectively, they could finance infrastructure investment and land registration and titling systems.

10
1.39 The "free-rider problem" prevents the private sector from financing these investments.That is to say, they cannot exclude nonpayers from benefiting from the investments. Thus financingmust come from the public sector.
1.40 In Karachi, investments in infrastructure approximately double the value of residentialplots (Dowall, 1989b). In Jakarta, infrastructure adds 80 to 110 percent to the value of a residentialplot, depending on the type of tenure held (title of ownership). Having a clear title (Agrariacertificate) adds 40 to 50 percent to the value of a residential plot, depending on the level ofinfrastructure available to the plot (Dowall and Leaf, 1991).
1.41 Clearly, the land value benefits associated with government actions are considerable,and that they could form the basis for property taxes that could be used to recover public investments(Bahl, Collen, and Warford, 1973).
1.42 As local governments begin to seek new approaches for financing urban development,techniques such as special assessment districts, development fees, and exactions and beneficiarycharges will come into use. But these fiscal tools cannot be developed without accurate informationabout land values, the cost of providing infrastructure, and its impact on land values.
Private Sector Resistance to Government Land Regulations
1.43 Although governments shape urban land policies and provide investments in infrastruc-ture, it is largely the private sector (both informal and formal) that builds cities. Without the fullcooperation and compliance of private land and housing developers, most government programswould fail. At the same time, developers all too often ignore or resist following governmentregulations, with the result that development becomes haphazard and expensive to serve. Numerousexamples can be cited of developers failing to provide required parking, encroaching on setbackareas, and not providing required open space.
1.44 Developers are often a negative force resisting the implementation of new urban landdevelopment policies. They routinely fight height limitations, parking requirements, and zoningchanges, even though such actions would make the community better-off.
1.45 An urban land policy agenda cannot be set without the participation of both the publicand private sector. Policies need to balance the needs of society with the economic and financialrealities of real estate development.
Environmental Resource Constraints to Land Development
1.46 Urbanization and rapid urban land conversion are having serious environmentalrepercussions in the cities of the developing world. Despite the acute awareness and policy attentionaccorded environmental problems in developed countries over the past twenty years, policymakersin less developed countries until recently considered adverse environmental impacts the price theyhad to pay for rapid economic development. Now, there is a growing constituency for more rigorousenvironmental standards, and the pressure to preserve environmental quality will proliferate aseconomies develop and their middle-class blossoms. Although the emerging environmental move-ment will focus on a broad range of issues, urban development and land use will be a central concern.
I1
1.47 At the same time, the emerging environmental policy must not stifle the operation ofland and housing markets. Concerns over environmental quality must be balanced with housingavailability and affordability. However, even in those areas where resources are limited and theenvironment has traditionally been regarded as a luxury good, policymakers should pay particularattention to at least the following three potential problems: 1) pollution and resource degradation thatthreatens the economic well-being of communities; 2) disposal practices that make it expensive toimplement resource recycling; and 3) land-use decisions that undermine the value of land andhousing markets (Foster, 1989).
Conclusions About the Urban Land Crisis
1.48 Throughout the developing world, urban expansion is taxing the capacity of localinstitutions, both public and private, to adequately respond to development pressures. Compoundingthe problem is the lack of up-to-date information about land and property market conditions.Although the precise causes of planning failures are a subject of considerable debate, the lack ofaccurate and up-to-date information about urban growth is clearly thwarting effective urbanplanning. Without the kind of information the land market assessment (LMA) can provide, it isdifficult, if not impossible, to plan for and promote urban development. Many planners andpolicymakers have been merely following the assumptions or often inappropriate standards of othercountries, sometimes with disastrous results.
1.49 For their part, private sector investors and developers can use L,MA information toidentify development opportunities and assess the demand for projects they are considering. On abroader scale, better information enables developers, consumers, bankers, and land markets tooperate more efficiently.
1.50 The objective of this report is therefore to offer a method for assessing the past, current,and likely future patterns of land market operation, focusing on the demand, supply, and price of landfor urban development. It explains why land market assessments are useful and what steps are takenin conducting land market assessments, and offers some examples of the use of LMAs. The reportshould be of interest to a large audience: public sector officials in local, regional, and national officesconcerned with planning, programming, and financing urban land development and planning; publicofficials responsible for programming and developing housing and residential plots; private sectorhousing and commercial developers and bankers leinding on urban development projects; thecommunity of professional planners and advisers working for international donor agencies; andresearchers and academics concerned with land and shelter issues in the developing world.
1.51 The central concern here is to explain how LMAs can be applied in the cities of thedeveloping world. However, the method is equally applicable in cities in developed countries. Mostof the examples of land market assessments focus on housing and residential land markets. This isbecause housing accounts for the largest use of land in cities and because the supply of land forhousing the pooI- has become a critical problem in most cities of the developing countries.

H. WHY LAND MARKET ASSESSMENTS ARE NECESSARY
2.1 The purpose of the land market assessment is to provide an accurate and up-to-date coreof information on the operation of the urban land market. This information includes prices, statisticson the supply of serviced land, and detailed descriptions of present and projected projects. Thus itprovides the concrete foundation needed to define appropriate strategies for improving land marketperformance. LMAs can be used to support four broad activities: governmental planning anddecisionmaking; the evaluation of government policies and actions; the structuring of land-basedtaxation systems; and private sector investment and development decisions. The remainder of thissection discusses how LMAs can be used.
Providing Information for Public Sector Planning and Decisionmaking
2.2 The most significant benefit of the LMA is that it can vastly improve the qualiLy of landdevelopment planning and policymaking by providing public officials with basic assessmellts of thestate of the land market. In development planning, as in medicine, diagnosis is the first step inproblem solving. The LMA is a method for assessing the current condition of the land market.Therefore, one of its primary objectives is to answer the following questions:
i . Is the supply of urban serviced land expanding to meet growing population andemployment needs?
2. Which land uses are growing the fastest?
3. Where is urban land conversion taking place?
4. Where is urban land conversion outstripping the supply of serviced land'?
5. Are land prices increasing faster than the overall rate of inflation?
6. Where are land prices the highest and where are land prices increasing thefastest?
7. How much land is being provided with the minimum services needed tor lutureurban development?
8. Is there enough serviced land to accommodate urban growth fo r the next fiveyears?
9. Is the price and affordability of housing and commercial and industrial spacechanging-are real occupancy costs greater now than before?
10. Which segments of the population do not have access to housing from tlhe formalprivate sector?

13
2.3 Land market assessments can also be used to provide baseline estimates of future urbanland requirements. They can be used to guide infrastructure programming and investment decisionsand the development of land-use planning policies. For example, LMAs can be used to estimate thedemand for residential plots and commercial and industrial space associated with projections ofpopulation and employment. Armed with these estimates, planner can gauge the adequacy of thecurrent supply of land for urban expansion and develop plans for expanding the supply of servicedland.
Using LMAs to evaluate governtment policies and actions
2.4 Governments exert great influence, both positive and negative, over land marketoutcomes. Through investments in infrastructure and regulations over land development, govern-ments shape the operations of land markets, creating the potential for substantial increases in landvalues. At times, however, government plans and regulations unintentionally cause negative sideeffects on land market operations. Given the important role that governments play in shaping landmarket outcomes, it is extremely important that the implications of their investment and regulatorydecisions to be understood.
2.5 Unfortunately, adverse effects of planning regulations are complex and frequentlydifficult to estimate-in large part because little is known about the price of land or the demand andsupply conditions. With the land market assessment, an information base can be established tomonitor land markets and thus evaluate the potential effects of new government policies andprograms. The LMA can be used to answer a variety of questions: Are certain public policies oractions constraining the land market? Is infrastructure placement limiting residential development?Are greenbelts or agricultural land preservation policies limiting development? Are planningstandards and building codes pushing up housing prices?
Using LMAs for structuring land-based taxationi systems
2.6 As local governments begin to seek new approaches for financing urban development,techniques such as special assessment districts and beneficiary charges will come into use. Thesefiscal tools cannot function without accurate information about land values and the impacts ofinfrastructure developments on land values. The LMA, by systematically cataloging land valueinformation, can play a critical role in making these new rinancial tools functional. As a first step,the LMA can serve as a foundation for gauging trends in land prices. Over time, as data on land pricesare tabulated, the government can gauge the impacts of public investments and use the informationto set taxes, fees, or user charges.
Providintg iniformation for private sector investment and development decisions
2.7 Unlike stock, bond, and commodity markets, land markets are disorganized. There is nocentral clearinghouse for information about land prices, land conversion, and the demand for land.Most private sector land developers must take substantial economic risks when launching projects.Unfortunately, the lack of information about land and property markets in most cities of thedeveloping world has thwarted attempts by private sector developers, bankers, and consultants toprepare feasibility studies of potential projects.
14
2.8 LMAs can fill this gap. For example, by illustrating the effective demand for low- andmoderate-cost housing, LMAs can help stimulate the production of such units by the private sector.At the same time, LMAs can indicate when the production of certain urban uses farexceeds effectivedemand and thus help to bring about faster land market corrections. In the long run, with improvedinformation about the market, the risk associated with development is reduced and developers maybe able to operate with lower rates of profit (Walters, 1983).
2.9 The information provided by LMAs can also help improve the quality of loanunderwriting and private investment decisionmaking. Overall, more informed lending decisions canlead to a more efficient use of private capital for land development.
Conclusions Regarding the Benefits of LMAs
2.10 As should be clear by now, the benefits of LMAs are significant and are likely to drawwidespread support from public and private sector planners and decisionmakers, as well as manyother quarters of the public and private sector. As explained below, when organizing for the LMA,care should be taken to involve the full participation of benefiting agencies.
HI. ORGANIZING FOR LAND MARKET ASSESSMENTS
3.1 Before the LMA process is even begun, it is important to develop broad support for it.T'he best way to do this is to invite both the public and private sectors to participate in the planningand execution of the LMA. To avoid conflicts between competing line agencies in government, theresponsibility for executing the LMA should be lodged with the executive office of the localgovernment and should include the full participation of the private sector.
3.2 In San Pedro Sula, Honduras, for example, it was suggested that the city create a lineagency, the Department of Land and Housing Development, that would report directly to the mayor.Among iLs many powers, this agency would have statutory authority to compel government agenciesand public utilities to gather relevant information on land market operation. It was felt that acentralized authority reporting directly to the mayor was the only effective way of implementing theassessment. In other cases, this manner arrangement may not work.
3.3 The full cooperation of the private sector is essential. To this end, a land marketassessment steenng committee should be established, consisting of prominent professionals in theprivate sector development community. The group should be established at the start of the LMAprocess to discuss how the LMA can be used to improve the performance and efficiency of the privateand the public sectors. Agreement must be reached about which types of data to collect and thefrequency of collection, and firm protocols should be set for preserving the confidentiality ofsensitive market information. Procedures for periodically disseminating land market assessmentreports should also be drafted. It is also important to address the concerns of citizens who feel thatthe government is snooping. Here, the most effective method is to take the time to explain what thesurveys will be used for and what they will not used for (for example, for land-use planning purposes,not for tax collection audits). Survey teams must explain how the anonymity of those interviewedwill be protected (for example, the survey teams are not to submit the names of those interviewedto the governiment agency managing the LMA).
3.4 The surveys must be conducted in both formnal and informal areas of the city or town.The process in both areas is essentially the same, but it may be necessary to slightly modify thesurveys or the types of information collected in infolmal areas. Experience in Karachi, Jakarta, andBangkok indicates that informal land brokers can be identified quite easily and that they have littledifficulty responding to questionnaires of the type presented in Annex A (discussed below). Thehousing project survey discussed below and presented in Appendix C may need to be modified toaccurately capture relevant information about informal land and housing developments.
3.5 In Bangkok, the Housing Policy Subcommittee of the National Economic and SocialDevelopment Board serves as the steering committee for carrying out periodic aerial photographicassessments of the region's land and housing markets. The committee seeks input from the Thai RealEstate Association and from the financial and academic communities.
Resources Necessary for Setting up a Land Market Assessment Process
3.6 The LMA is calTied out by several types of professionals: a land economist withexperience in market survey research; a land planner with experience in interpreting aerial

16
photographic and satellite images; a statistician with experience in computing and managing data;two data analysts for coding, entering data, and fieldwork; a draftsperson; and a team of researchassistants for conducting field surveys. A team of this size will not be needed in smaller towns. Theminimum level of staffing is probably one urban planner who has been trained in applying the LMAand one to two survey assistants.
3.7 In large cities and metropolitan areas, a computer system will be needed to develop thedata base and to conduct statistical analyses. The minimal system is an IBM AT compatible systemwith 640k RAM, two disk drives, and 40mb hard disk. The system should have graphic capabilities,with either a color or monochromatic monitor. A high-speed dot matrix printer is necessary and itshould be able to handle continuous feed paper up to 14 inches wide (35.5 centimeters). For largemetropolitan areas, the best method of presenting land and housing market information is to use acomputer-mapping system. Such a system can be run on the IBM compatible system with a type "A"multicolor pen plotter and a 12-by-12-inch (30-by-30-cm) digitizing pad. The total cost for thecomputer equipment is between US$6,000-7,000, or US$4,000-$5,000 without the computer-mapping capability.
3.8 The software for running the computers and developing the data base and map files willrequire LOTUS 1-2-3 or a comparable spreadsheet system, an advanced statistical package such asSPSS- PC+ or STATGRAPHICS, and ATLAS GRAPHICS, a computer-mapping system. A wordprocessing system such as WordPerfect, Microsoft Word, or Wordstar, and a graphics program suchas Harvard Graphics, or Lotus Freelance will be needed for preparing reports. The prices of thesesoftware packages vary considerably, but should cost less than $2,000. Thus, for less than $10,000a complete computer installation can be created for conducting the land and housing marketassessment. This system can also be used for other management and research functions such asfinancial modeling, demographic projections, data base management, and report production. Insmaller cities and towns, the data can be analyzed manually using a small pocketcalculatoror addingmachine.
Timetable for Conducting Assessments
3.9 The time required to prepare a land market assessment will depend on the size of the city,the level of detail of analysis, and the number of professional staff assigned to the project. If the cityis starting from "scratch," it will take approximately one to two years to fully complete a land marketassessment. However, much of the inforrnation needed for the land market assessment has probablybeen collected already, shortening the time required for completion. The LMA should be updatedevery three to five years, depending on the rate of urban growth and available resources.
Dissemination of land market assessment information
3.10 A principal benefit of the land market assessment is that it increases the level ofunderstanding about the current state of land market operations. Thus, it is important for the resultsof the analysis to be widely disseminated. This can be accomplished by way of seminars, reports, andbriefings to public and private sector professionals. In the long run, it is desirable to issue an annualreport on the state of the land market. This report should pinpoint key constraints in the land marketand identify actions for removing land-supply bottlenecks. The report should be widely distributedto both public and private decisionmakers.

17
Developing Baseline Information
3.11 The first step in launching a land and housing market assessment is to review the reportsand data that have been compiled by public and private agencies on the land and housing conditionsin the metropolitan area. Meetings should be held with govemment officials and private real estatedevelopers, brokers, and bankers.
3.12 Using the results of these preliminary efforts, the study team can proceed to define theprecise scope of the land and housing market assessment, including the size and shape of the studyarea, the types of data to be collected and analyzed, and the specific policy questions to be addressed(Dowall, 1980).
Define Area
3.13 The definition of the area will depend on the political boundaries of the local govern-ment, the spatial organization of tabulated data (such as population, infrastructure, and cadastral andbuilding activity), and the location of employmentcenters and commuting patterns in the metropolis.The size of the land and housing market assessment area will depend on how far into the peripheryhouseholds one will search for housing (to purchase or rent) over the next ten years. In most cases,the information is tabulated at a district or subdistrict level, and these units form the basis for definingthe study area with respect to data collection and availability.
Establish geographic zones for data organization
3.14 If the LMA data base is to be useful in assessing precise land market conditions and isto effectively gauge the impacts of government policies and investment decisions, it should bespatially divided into zones.
3.15 On a conceptual level, these zones should be defined so that each provides a homoge-neous pattern of land and housing market characteristics. For example, the boundaries of the zonesshould be set so that the land-use patterns within zones are roughly similar, not a mixture ofcommercial, industrial, or residential areas. In outlying areas, the zones should be similar withrespect to the pattern and density of urban development. The zones should also be similar in termsof social and economic conditions such as household income. The finer the grain and the morehomogeneous the zones, the more accurate the data base and the assessment of the effects ofgovernment policies and investments. At the same time, thc greater the number of zones, the moredifficult and expensive it will be to collect and update data.
3.16 Another consideration in defining zones is that their size and total number should bebased on the underlying base of existing data. Although it is impossible to delineate different zonesfrom those in the data base, zones can be combined into larger groupings. In large metropolitan areas(with a population of 1,000,000 or more) where the potential number of zones is large and is likelyto be difficult to manage, it is appropriate to combine zones. The zones should he small enough,however, to illustrate the activities of fundamentally different housing and land markets but not toolarge to mask important differences in market activity. (On the problems of large-scale urban models,see Lee, 1974). A land and housing market information base of 344 zones was developed in Bangkok,

18
a metropolitan region of six million or more. Map 1 illustrates the zone system used for the BangkokLand Market Assessment. In Karachi, 271 were tabulated (Dowall, 1989). In other cities, the numberof zones for urban modeling has ranged from 100 to more than 1,000. For purposes of analysis, givencomputer and software capabilities, the total number of zones should be limited to less than 500. Thelimitation of a maximum of 500 cases should not present any significant problems for developing aclear assessment of a metropolitan area's land and housing market.
Basic land-use andpopulation data for tabulation
3.17 Foreach geographic zone, dataon land use and population attributes should be collectedfor at least two points in time-a "base year" and "current year." Ideally, the two years should spana period of five to ten years. Data on the following variables should be collected:
1. zone identification number 19. vacant land with infrastructure in current2. size of zone in hectares year3. x and y coordinate of the centroid of the 20. change in urbanized land, base-current
zone year in hectares4. total urbanized land in base year of hect- 21. change in residential land area, base-
ares current year5. total urbanized land in current year in 22. change in total housing units, base-cur-
hectares rent year6. total residential land area in base year 23. change in commercial land area, base-
(g.a.) current year7. total residential land area in current year 24. change in industrial land area, base-cur-
(g.a.) rent year8. total housing units in base year 25. change in institutional land area, base-9. total housing units in current year current year10. commercial land area in base year (g.a.) 26. change in vacant land area, base-current11. commercial land area in current year (g.a.) year12. industrial land area in base year (g.a.) 27. changeinvacantlandwithinfrastructure,13. industrial land area in current year (g.a.) base-current year14. institutional land area in base year (g.a.) 28. population in base year15. institutional landareaincurrentyear(g.a.) 29. change in population, base-current year16. vacant land area in base year 30. population density in base-current year17. vacant land area in current year 31. change in population density in base-18. vacant land with infrastructure in base current year
year
3.18 Baseline data on land-use changes, infrastructure availability, and population bygeographic zone over time can be used to arrive at a detailed assessment of the spatial patterns ofurban development in a metropolitan area. The data can be tabulated from land-use surveys, aerialphotographs, or satellite images.
Land value information
3.19 The next step in collecting data is to assemble land price information by zone and year.This information is available from a variety of sources. Many countries levy property taxes andtherefore compile inforrnation on land value assessments. Although in many instances these

Map 1. Metropolitan Bangkok: Kwaeng IA)CatOo

20
assessments lag or understate the market, they may provide a usable measure of land price inflation.In cases where private land value information is also available, it can be used to verify the public landvalue assessments.
3.20 Land value information can also be directly collected from intei-views with real estatebrokers. For example, in both Jakarta and Karachi, approximately 1(X) real estate brokers workingin either the formal or infornal sectors were interviewed to obtain land value information on plotprices. In all cases only experienced brokers were surveyed. Annex A presents a description of theJakarta broker survey. The general approach used in the survey is as follows:
A survey questionnaire was set up containing a series of questions designed tohelp brokers appraise the current probable selling price of several specific typesof residential plots (for example, a 120-square-meter plot located on a collectorstreet). The appraisal process was repeated for plots with different types of landtenure and levels of infrastructure. The appraisals covered only those neighbor-hoods in which the broker worked. Once the appraisals were completed, thebrokers were asked to estimate the probable selling prices of the previouslyappraised plots for 1980, 1985, and 1987 in Karachi and 1987, 1988, and 1989in Jakarta. All prices were tabulated in terms of price per square meter andadjusted to constant price levels.
* Since the objective of the land price data base was to comprehensively cover themetropolitan area's active land markets, interviews were scheduled in approxi-mately 100 neighborhoods. Within each neighborhood, at least three brokerswere interviewed. For each type of plot appraised, the median value was to beincluded in the database. Within each neighborhood, median values of betweenthree and nine types of parcels were tabulated for each year.
* A variety of methods were used to identify brokers. Membership lists ofprofessional organizations were used for brokers in the formal sectors andadvice from village headmen and residents for informal brokers.
* The results of each interview were tabulated on a questionnaire form. Theinformation recorded on each form was computer-coded using Lotus 1-2-3. Thecoding was verified for accuracy.
* The land price data were organized according to zone and combined withadditional information on land use and population.

21
3.21 In most cases, data on land values (based on appraisals) can be tabulated by type of land.All land values should be expressed in constant prices. For example, a comprehensive collection ofvalues for serviced and unserviced residential, commercial, and industrial land might include thefollowing variables for each zone, in addition to the variables listed above (continuing the samesequence of numbers):
32. median land value (per square meter) for 39. change in median land value (per squareserviced residential plots located on side meter) for serviced commercial plots lo-streets, base-current year cated on main streets, base-current year
33. change in median land value (per square 40. median land value (per square meter) formeter) for serviced residential plots lo- serviced industrial plots located on maincated on side streets, base-current year streets, base year
34. median land value (per square meter) for 41. median land value (per square meter) forserviced residential plots located on side serviced industrial plots located on mainstreets, base-current year streets, current year
35. median land value (per square meter) for 42. change in median land value (per squareserviced residential plots located on side meter) for serviced industrial plots lo-streets, current year cated on main streets, base-current year
36. change in median land value (per square 43. median land value (per square meter) forlocated on side streets, base-current year unserviced parcels located on side streets,meter) for serviced residential plots base year
37. median land value (per square meter) for 44. median land value (per square meter) forserviced commercial plots located on main unserviced parcels located on side streets,streets, base year current year
38. median land value (per square meter) for 45. change in median land value (per squareserviced commercial plots located on main meter) for unserviced parcels located onstreets, current year side streets, base-current year
3.22 It may not be possible to tabulate information on all of these variables, but this list isoffered as an example of what might be collected. Once the land value information has been codedinto the spreadsheet, patterns and trends of land values over time and space can be calculated. Thisinformation can be used to determine where land values are increasing fastest and also where landis priced low enough to make the construction of low- and moderate-cost housing feasible.
Design Layout of Spreadsheet Data Base
3.23 With the delineation of land and housing market study zones, a data base system shouldbe established for coding data. The data base should be developed on a microcomputer, using a

22
spreadsheet system such as LOTUS 1-2-3 (Landis, 1986). Basic information for each zone shouldinclude: 1) zone identification number; 2) size of zone in hectares or square kilometers; and 3) an "x"and "y" coordinate for locating each zone. The spreadsheet data base should be stored on a hard diskand frequently "backed up" on a diskette in case the file is inadvertently erased.
3.24 Once the initial spreadsheet file is created, the basic land use, population and demo-graphic and land value information can be added. Tabulations can be made of which zonesexperienced the greatest population increase between the two years and what share of the metropoli-tan area's total population increase took place in central city, inner suburban and peripheral areas.Such calculations generate useful information for identifying growth areas in the metropolitanregion. Population density patterns and their change over time can be recorded as well.
Using Aerial and Satellite Images
3.25 Since governments in most metropolitan areas do not compile detailed informationregarding changes in housing stock or land use by small area, it is necessary to interpret and tabulateaerial photographic surveys. Ideally, two aerial surveys that closely correspond with the time intervalof the assembled demographic data listed above should be used for the housing and land-use analysis.From the field surveys of the metropolitan area and preliminary assessments of the aerial surveys,a list of housing types, including both informal and formal housing development, should be compiledfor detailed tabulation, and it sho-ld differentiate slums and squatter settlements, land subdivisions,formal private housing developments, and public housing projects. Nonresidential uses, includingindustrial areas, commercial districts, and institutional uses can also be tabulated.
3.26 If aerial photographs are not available,an effort should be made to acquire satelliteimages. Satellite images can be obtained for less than US$2,000 (Bertaud, 1989). SPOT images havebeen available since 1986, and offer good resolution (10 meters in panchromatic mode). Combinedwith a thorough ground survey, SPOT images can be used to develop land-use typologies forassessing land-use and urban development patterns (Bertaud, 1989). Appendix B summarizes the useof satellite images for land market assessments.
Tabulating Housing, Commercial, and Industrial Uses
3.27 Once the typology has been established, tabulations of housing by type of unit shouldbe made for each zone. For example, using aerial photographic interpretation, it may be possible todifferentiate the following types of housing (for satellite images, the level of differentiation will bemuch coarser):
* informal housing settlements
* public sector housing projects
* formal private sector low-density housing estates
* formal private sector medium-density housing estates
* formal private sector high-density housing estates.

23
3.28 For each category of housing, the number of habitable units should be estimated for thebase and current-year aerial photographs or satellite images. A comparison of the tabulationsprovides a clear picture of changes in the housing stock over the period. Calculations of absolutechanges in the type of housing and change in housing by zone and by type will identify the specificpatterns of housing supply dynamics.
3.29 Although trends of past housing construction provide a partial assessment of futurehousing activity, a separate projection of housing demand is a more accurate method of gauging thefuture. Projection models oi regional housing demand, such as the USAID system (Struyk, 1987),can more fully incorporate the demographic factors that shape housing demand. With consistentprojections of future housing needs, land requirements for residential development can be deter-mined.
Assessing Land Conversion Trends
3.30 The rate of land conversion within each zone over time can easily be determined usingeither aerial photographic survey or satellite image information. By calculating the area convertedfrom agricultural to residential and other urban uses and correlating it with housing unit changes orchanges in commercial and industrial employment, an estimate can be made of the land required tosupport urban growth. This information can in turn be used to estimate annual requirements for land.Map 2 illustrates land conversion patterns for Metropolitan Bangkok between 1974 and 1984.
Estimating Current and Future Developable Land Supply
3.31 The most critical element of the assessment is the estimate of the current and futuresupply of developable land. Developable land is defined as land that has reasonable access to roadsand other critical infrastructure systems, such as water and electricity, and is not constrained byphysical impediments such as steep slopes or by governmental limitations on dlevelopment. Whichlands are potentially developable can be determined by examining parcels for physical constraints,governmental policies, and the location of current infrastructure. must Additional assessmentsshould be made of the potential for the redevelopment of urban areas. Although difficult to gaugeprecisely, redevelopment potential can be measured by determining past redevelopment activity andextrapolating into the near future. Depending on the type of infrastructure and the cost required toextend services, land located within 1/2 to 1 kilometer of existing infrastructure should be classifiedas developable, assuming there are no physical and governmental constraints. The potential supplyof serviced land can be estimated by combining this information with land-use data on vacant parcels(Dowall, 1980, 1981, 1989).
3.32 Future supply conditions are estimated by assessing and mapping proposed infrastruc-ture. If a parcel is expected to have access to road and water systems within the next five years andhas no other constraints, it should be classified as developable in the future estimates.
3.33 In determining land supply, it is extremely important to consider vacant and underutilizedparcels in built-up areas. Although many vacant parcels do not have road access, or are not well suitedfor development, their location and potential for infill construction make them important sites toconsider when estimating land supply. Gauging the potential of underutilized parcels is moredifficult. Here areas with low-rise older buildings should be evaluated and estirnates made of the neturban development potential.

Map 2. Lad converion in square kilometers 1974-84 in meropolitan Bangkok
Conversion in square
kilometers
0- .2
I I ~~~~~~~~~~~~~~~~~~~~~.7- 1.81.8 -9.5No data

25
3.34 Future land market conditions can be assessed by comparing the land supply estimateswith future demand. For example, the number of years of supply of serviced land should be estimatedby dividing the annual urban land requirements by the current supply of serviced land. A tableshowing the annual increase in the stock of serviced land and the annual urban land requirementsshould be prepared to illustrate whether the current and future supply of serviced land is sufficicntto meet urban growth requirements over the next five to ten years.
3.35 The land-supply estimates should be tabulated lfor each zone. This information can thenbe analyzed to determine the spatial patterns of land supply. Levels of current supply can becompared with past and anticipated patterns of land conversion to determine whether there issufficient land in areas of high demanid in the metropolitan region.
Adding Project Information to a Land Market Database
3.36 Detailed information about the characteristics and price of housing units offered in themarket can be obtained from a survey ot pro jects currently oni the market. This section describes thebasic strategy for carlying out a survey of housing projects, but the same technique can be appliedto commercial and industrial projects.
Drawing up a sample of projects
3.37 To gauge current market activity, a list should he compiled of the housing projects, bothformal and informal, currenltly otIlcring units, The list of projects should be assembled fromnewspaper ads and interviews with bankers, community organizers, government officials, real estatebrokers, and other key informants. All the identified projects should be classified into the samehousing typologies used for the aerial photographic or satellite image interpretation. Based on therelative share which each type of housing represents ot the total number of housing units selling atpresent, a stratified random sample of housing projects can be drawn up for further research(Malpezzi, Bamberger, and Mavo. 1929).
Project surveys
3.38 Detailed interviews with the sales personnel at each of the sampled project sites shouldbe conducted by field interviewers. The following types of information should be obtained:
* land area of project
* number of housing units or plots by model type or size
* the selling price of units or plots by model type or size
* the sales rate of units or plots per month by model type and size
* the terms of financing available for the project; and
* profiles of buyers of units or plots including income, occupation, prior resi-dence, and whether they were first-time buyers.
26
3.39 Annex C contains a project survey questionnaire used in Bangkok.
Combining project surveys with market information
3.40 These project surveys provide detailed information on the current supply of housing onthe market that can be used to assess the affordability of the current supply of housing relative tocurrent household incomes in the metropolitan area. They also provide a clear picture of the typesand locations of units selling most quickly.
3.41 The housing price information and land value infonnation can be used to gauge overallhousing affordabiLity in the metropolitan area. Following current financing practices and lendingterms, it is straightforward to estimate the monthly payment necessary to finance the purchase of ahouse. Housing affordability can be determined by comparing monthly housing costs to monthlycurrent household income (Malpezzi, Mayo, and Gross, 1985).
Using LMAs for Strategic Planning
3.42 Many governments formulate their plans for future development without a firmunderstanding of how their city is growing. As a starting point, it is useful to assess the currentperformance of the local land market using a technique such as the LMA. This will help authoritiesset an agenda for making the metropolitan area's land and housing markets more efficient.
3.43 A variety of questions need to be answered and evaluated to determine whether themarkets are performing efficiently. These questions were presented in section 2.2. The usefulnessof LMAs for planning can be illustrated through the San Pedro Sula, Honduras strategic land-useplanning process.
Case Study: Applying the LMA Process to San Pedro Sula, Honduras
3.44 The city of San Pedro Sula faces a majorchallenge. Over the next 13 years its populationwill grow by approximately 150,000 persons-1 5,000 per year. Between 62,000 and 83,000 newhousing units will be needed. This growth in population and housing demand, as well as associatedeconomic activities, will require (depending on the amount of infill and development that occurs) thedevelopment of upward of 3,500 hectares of land, an amount equal to two-thirds of the land urbanizedsince the beginning of the century. Put another way, the physical development of San Pedro Sula overthe next 13 years will equal 66 percent of the level and pace of development that has taken place overthe past 90 years.
3.45 Since 1985 there have been clear signs that the land and housing markets of the city havecome under increased pressure as a result of rapid population growth. The price of serviced urbanland is now increasing at an average of 15 percent per year in real, inflation-adjusted, terms. Sincethe late 1970s the proportion of barrios created through land invasions, squatting, and illegalsubdivision of land has accounted for about one-third of all new barrios.

27
3.46 A land market assessment of the San Pedro Sula metropolitan area conducted in 1989(PADCO, 1989) provided much-needed data on the city's land markets and led to the proposal thatthe city establish a strategic land development process and create a powerful line agency for itsexecution.
3.47 San Pedro Sula LMA conclusions.
1. Over the past 30 years, the population of San Pedro Sula grown at a compoundrate of 6 percent a year.
2. Between 1978 and 1988, its population increased by 107,000, an annual increaseof 4.9 percent.
3. During this same period, San Pedro Sula's housing stock increased from 30,254to 58,383, which represents an annual increase of 6.8 percent.
4. Since the stockof housing increased more rapidly than population between 1978and 1988, the average number of persons per house declined from 5.73 to 4.8,a 16 percent decrease.
5. The spatial patterns of population growth between 1978 and 1988 indicate thatmuch of San Pedro Sula's development took place on the east side, in an areaadjacent to the city center, and an area farther from the center to the southeast.
6. From 1978 to 1987, building permits were issued for 107 workshops andfactories and 481 commercial facilities. In the early part of the period, most ofthe industrial development was located on the east side of the city center.
7. Over the past ten years the densities in San Pedro Sula have increased with urbandevelopment. Although densities gradually decline with distance from the city,there is evidence that peripheral growth poles are emerging to the southeast.
8. The availability of essential services-such as potable water, electricity, andsanitary and storm drains-varies. Barrios within the first ring road have fullcoverage of services. Farther out, the coverage is more limited. Between the firstand second ring roads, most settlements have water and electricity but lack wastedisposal systems, although they are under construction. On the periphery, mostof the informal areas lack paved roads and proper waste and storm waterdrainage systems.
9. The physical growth of the city has accelerated. Between 1950 and 1988 thecity's growth consumed approximately 100 hectares per year; however, landconversion is currently running at 400 hectares per year. This acceleration is dueto several factors:

28
* an increase in illegal subdivisions
* urbanization initiatives of the municipality
* private sector development
* layout and installation of new roads and infrastructure by the city andDIMA (the municipal water department).
10. Between 1976 and 1988 the total land use of thecity increased to 5,317 hectares;3,398 for residential, 656 for commercial and services, 508 for industrial, and755 of open and institutional spaces. As of 1988, the city had approximately9,760 hectares of available land for future development.
11. According to the 1988 census, San Pedro Sula contains 7,122 dwelling units thatare of substandard condition and need replacement. An additional 2,265 ullitsare needed to reduce overcrowding. Thus, the city has a current housing deticitof approximately 9,500 units.
12. Economic conditions in terms of the income of San Pedranos have deterioratedover the past ten years, as real, inflation-adjusted, family income declinedbetween 1980 and 1986. (At the present time, the median income in San PedroSula is approximately US$300 per household.) With housing and land costsincreasing over time, especially over the past three years, housing is becomingmuch less affordable.
13. Because of the declining affordability of housing and the increase in low-incomehouseholds, the informal segment of San Pedro Sula's residential land markethas been proliferating. Between 1978 and 1987, invasions accounted for 27 of94 new barrios created-nearly 30 percent of all new barrios.
14. As of 1988, 38 percent of the total population of San Pedro Sula lived in theseinformal settlements.
15. A review of five low-cost housing projects in San Pedro Sula revealed that lotprices range from US$2,786 to US$5,200. The financing terms offered and therequired downpayment indicate that all five projects require payments ofbetween US$41 and US$65 per month. Using a ratio of 20 to 25 percent ofincome going to lot payments, these lots are affordable to families earningUS$250-300 month, which is affordable to those earning at or slightly below themedian household income of San Pedro Sula.
16. However, land price inflation is creating making housing less affordable. Thereal (inflation-adjusted) prices of serviced residential land increased at anannual compound rate of 15.4 percent between 1985 and 1988, much greaterthan before 1985, when the real rate of increase for such land was only 2.6percent. Patterns of price increases for raw undeveloped land suggest that

29
developers, both formal and informal, are bidding up prices in their search forraw land inside the urban limits. In these areas, the price of raw land increasedan average of 18 percent per year between 1980 and 1985.
17. San Pedro Sula' s economy, like that of Honduras, is oriented toward agricultuid iproduction and consequently is greatly affected by changes in world commodityprices and climatic conditions. Notwithstanding these conditions, the BancoCentral de Honduras projected that between 1988 and 1990 agricultural exportswould increase by 4.7 percent in real terms. Income from these exports wasexpected to increase by 6.8 percent between 1988 and 1990 and by 7.2 percentbetween 1990 and 1992.
18. According to a survey of firms with at least 10 workers, San Pedro Sula had42,891 workers in 1986. Of this number, 21,436 (or about 50 percent) wereemployed in industrial manufacturing. Trends covering the much broadereconomically active population indicate that 153,572 persons were in the laborforce in San Pedro Sula in 1987. This is an increase of 102,206 over the 1974estimate, or an annual increase of 8.8 percent per year. The increase of 100,000economically active persons reflects the dynamism of the San Pedro Sulaeconomy and explains the rapid growth of the city's population during the 1970sand 1980s.
19. A key element in the managementof San Pedro Sula's future developmentis thefiscal capacity of the city to fund infrastructure. The city's ability to generaterevenues has been adversely affected by legislation limiting the tax on undevel-oped land located outside the urban limit line to 1 mill, whereas similarproperties located inside the urban limit line are taxed at 3 to 5 mills.
3.48 The general outlook for San Pedro Sula is one of substantial demographic and economicgrowth. To date, the city has done a remarkablejob of accommodating urban development. However,there are indications that future growth will create substantial pressure on San Pedro Sula's land andhousing markets. To cope with these growth pressures effectively, the city needs to develop andimplement clearly focused policies.
Projections of land for housing development
3.49 The amount of land needed for housing development in San Pedro Sula has beencalculated from the projections of housing demand, including the required replacement of units.These estimates are based on the patterns of densities of residential estates for low-, middle-, andupper-income projects apportioned according to the income distribution of San Pedranos. Accordingto these patterns of housing density and plot sizes, the additional demand for housing will create aneed of 700 to 840 hectares of land between 1989 and 1993. The total demand for residential landfrom 1994 to 1997 is expected to range from 440 to 620 hectares for the low and high growthscenarios, respectively. And from 1998 to 2001 the demand for residential land is expected to rangefrom 530 to 800 hectares. The total demand for residential land from 1989 to 2001 will range from1,670 to 2,260 hectares (see Table 3-1).
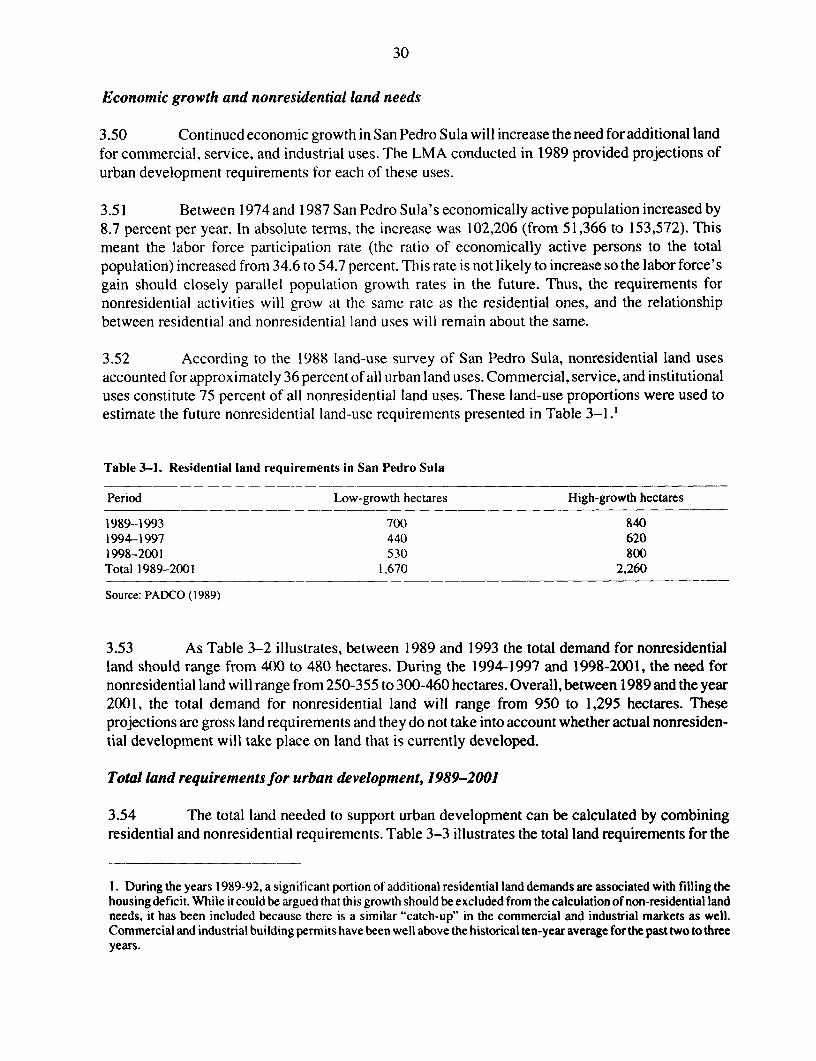
30
Economic growth and nonresidential land needs
3.50 Continued economic growth in San Pedro Sula will increase the need for additional landfor commercial, service, and industrial uses. The LMA conducted in 1989 provided projections ofurban development requirements for each of these uses.
3.51 Between 1974 and 1987 San Pedro Sula's economically active population increased by8.7 percent per year. In absolute terms, the increase was 102,206 (from 51,366 to 153,572). Thismeant the labor force participation rate (the ratio of economically active persons to the totalpopulation) increased from 34.6 to 54.7 percent. This rate is not likely to increase so the labor force'sgain should closely parallel population growth rates in the future. Thus, the requirements fornonresidential activities will grow at the same rate as the residential ones, and the relationshipbetween residential and nonresidential land uses will remain about the same.
3.52 According to the 1988 land-use survey of San Pedro Sula, nonresidential land usesaccounted for approximately 36 percent of all urban land uses. Commercial, service, and institutionaluses constitute 75 percent of all nonresidential land uses. These land-use proportions were used toestimate the future nonresidential land-use requirements presented in Table 3-1.'
Table 3-1. Residential land requirements in San Pedro Sula
Period Low-growth hectares High-growth hectares
1989--1993 700 8401994-1997 440 6201998-2001 530 800Total 1989-2001 1,670 2,260
Source: PADCO (1989)
3.53 As Table 3-2 illustrates, between 1989 and 1993 the total demand for nonresidentialland should range from 400 to 480 hectares. During the 1994-1997 and 1998-2001, the need fornonresidential land will range from 250-355 to 300-460 hectares. Overall, between 1989 and the year2001, the total demand for nonresidential land will range from 950 to 1,295 hectares. Theseprojections are gross land requirements and they do not take into account whether actual nonresiden-tial development will take place on land that is currently developed.
Total land requirements for urban development, 1989-2001
3.54 The total land needed to support urban development can be calculated by combiningresidential and nonresidential requirements. Table 3-3 illustrates the total land requirements for the
1. During the years 1989-92, a significant portion of additional residential land demands are associated with filling thehousing deficit. While it could be argued that this growth should be excluded from the calculation of non-residential landneeds, it has been included because there is a similar "catch-up" in the commercial and industrial markets as well.Commercial and industrial building permits have been well above the historical ten-year average forthe past two to threeyears.

31
Table 3-2. Nonresidential land requirements in San Pedro Sula
Period Low-growth hectares High-growth hectares
1989-1993
Commercial, Institutional Services 300 360Industrial 100 120Total Non residential 400 480
1994-1997
Commercial, Institutional Services 190 265Industrial 60 90Total Non residential 250 355
1998-2001
Commercial, Institutional Services 225 345Industrial 75 115Total Non residential 300 460
1989-2001
Commercial Institutional Services 715 970Industrial 235 325Total Non residential 950 1,295
Source: PADCO (1989)
next thirteen years. On an annual basis, between 200 and 270 hectares of land will be needed for urban
growth between now and the turn of the century. This is below the peak levels of land conversion that
have occurred over the past two to three years, but it is likely to be the rate that is clearly sustainable.
3.55 Over the next 13 years, a total of 2,620 to 3,555 hectares of urban uses will be developed.
According to the 1988 land-use survey, the total urban land area of the city of San Pedro Sula was
5,317 hectares. Thus, in the next 13 years, the urban area of the city will expand by one-half to two-
thirds. This implies that the physical development of San Pedro Sula during the remaining years of
the century will proceed at a rate 3.5 to 4.6 times faster than its historical average.
3.56 Land requirements of this magnitude pose an enormous challenge for planners. Unless
the growth is accommodated, the price of land and housing will continue on the path of inflation and
the housing affordability crisis will worsen.
The strategic land development process
3.57 The results of the land market assessment formed the basis of a proposal for a strategic
land development strategy for San Pedro Sula. The recommendations are based on three and one-half
months of fieldwork and analysis, and reflect numerous discussions with city officials, housing
developers, bankers, businessmen, and citizens (for details, see PADCO, 1989). The following seven
steps were recommended:

32
Table 3-3. Total land requirements for urban development in San Pedro Sula
Period Low-growth hectares High-growthhectares
1989-1993
Residential 700 840Commercial, Institutional & Services 300 360Industrial 10() 120Total I,I () 1,320
1994-1997
Residential 440 620Commercial, Institutional & Services 19( 265Industrial 60 90Total 690 975
1998-2001
Residential 530 800Commercial, Institutional & Services 225 345Industrial 75 115Total 830 1,260
19X9-2001
Residential 1,670 2,260Commercial, Institutional & Services 715 970Industrial 235 325Total 2.620) 3,555
Source: PADCO (1989)
1. Set quantitative land and housing development targets.
2. Prepare a San Pedro Sula development plan.
3. Establish institutional capacity for plan implementation.
4. Remove impediments to efficient land and housing market operation.
5. Design and implement mechanisms for financing development.
6. Promote private sector initiatives for low-cost housing development.
7. Develop a monitoring program for reviewing the progress of the strategic landdevelopment process and conduct ongoing forward planning and programming.
Implications of the San Pedro Sula example
3.58 The San Pedro Sula LMA helped identify the critical issues affecting the performanceof the city's land market. The assessment revealed that the land market was becoming overheatedand that real land prices were rising markedly. Projections of land demands for residential,

33
commercial, and industrial uses clearly suggested that considerable land will be needed for urbandevelopment over the next decade. The situation called for a fresh approach to land developmentplanning, including a more aggressive posture by the public sector to stimulate land development andinfrastructure financing for urban growth. As a result, it was suggested that the city establish apowerful land development agency, which is now under consideration.
Case Study: The National Housing Authority of Thailand
3.59 Recentexperience in Bangkok provides anotherexample of the practical value of a landand housing market assessment. The Bangkok Land Management Study was conducted to assist theNational Housing Authority (NHA) of Thailand improve the overall delivery of low- and moderate-cost housing in Bangkok (Bangkok Land Management Study, 1987). The study began by developinga data base of the Bangkok residential land market. Some of the objectives of the study, related tothe land and housing market assessment were as follows:
1. Assess the current performance of the NHA's land acquisition and housingdevelopment programs with a view to improving the capability of the NationalHousing Authority to provide low- and moderate-income housing.
2. Provide a thorough understanding of the operation of the Bangkok residentialland market so that NHA policymakers can design and implement appropriateland and housing development strategies.
3. Identify specific housing market segments not now served by the private sectorthat can and should be served by the NHA.
4. Determine appropriate roles for the private sector to deliver low- and moderate-income land and housing development in cooperation with the NHA.
5. Train NHA staff in the use of new tools, computer equipment, and proceduresand prepare procedure manuals for various aspects of land and housing marketassessment.
3.60 The land market assessment of the Bangkok metropolitan area showed that most of thepopulation growth and residential development between 1979 and 1984 took place in a ring 11 to 20kilometers from the central business district. Inspection of private housing development projects inthe metropolitan area revealed that most projects were located within this ring and that they averaged24 hectares. However, recent NHA projects in Bangkok were more remote and much larger(averaging 98 hectares). The LMA revealed that the rate of sales of housing decreased the farther theproject was located from the central city. Perhaps the most important finding was that private sectordevelopers were "moving downmarket," building and selling housing units below US$8,000. Interms of price, these units were in direct competition with the NHA's product, and they were betterlocated. Assessments of fringe land ownership indicated that the average size of parcels was less thanone-half a hectare, which was considerably smaller than the average size of NIA projects.
3.61 The results of the Bangkok LMA suggested that the NHA's current policy of buildinglarge housing projects on the fringes of Bangkok were inappropriate for current market conditions.

34
Based on the LMA, it was suggested that the NRA shift its housing development efforts to smaller-scale projects located closer to the central city. Also, since the private sector was moving into thelower price range, it was suggested that the NHA concentrate on increasing the supply of low-costland for private housing development and that it not attempt to compete directly with privatedevelopers as long as they are moving "downmarket."
3.62 As shown in the Bangkok case, it is quite clear that land market assessments can be usedto evaluate the competitive position of government housing programs in relation to private sectorprojects. The LMA played a critical role in illustrating the need to alter government housing and landdevelopment programs.
Using LMAs to Evaluate the Impacts of Government Actions
3.63 The land price data base developed by the LMA can be used to gauge the impacts ofgovernment policies, investments, and actions. This section presents a series of techniques forassessing impacts. An example of how infrastructure investments increase the economic value ofresidential plots is taken from the Karachi case study.
3.64 Fundamentally, there are two types of land market impact assessments: ex post
measurements of the effects of local public actions, and predictions of land market impacts resultingfrom future government actions. Within each approach, there are several ways of estimating effects.
Ex post impact assessments
3.65 Over the years, many researchers-including waterresourceeconomists, transportationanalysts, and housing economists-have attempted to assess how government actions affect landvalues (see Harris, 1973). A problem encountered in all this work is that public actions are difficultto isolate from the myriad of factors affecting land values. As Bahl, et al. (1973, p. 182) havesuggested, "the most difficult measurement problem is that of isolating project effects on land valuesfrom all other factors that might intluence land values."
3.66 Two devices used to estimate investment effects are econometric models and case studycomparisons. The econometric approach relies on regression models to isolate the net impact of aproject on land values. Methods for estimating the effects are based on either time-series or cross-sectional data. The time-series method begins by defining the area from which historical land valuedata are collected. Usually, the analyst identifies some area in which land parcels are assumed to havebenefited or been affected by a project. Often service boundaries of a project are used to determinethe effects of public investment. As Bahl et al., have suggested, land values can be regressed onfactors that affect land values and a dummy variable indicating whether the project was in place canbe used to isolate the land-value effects of the project. The regression equation usually takes thefollowing form:
PV =a+bD +C.X,
where PV, is the land value of a parcel at time t, D, is a dummy variable equal to zero before thecompletion of the project and equal to one afterwards, and Xi, is a vector of factors that inlluence land

35
values such as accessibility and zoning. The estimating equation determines values for coefficientsa,b,c. The value of b determines the net effect of the project on land value. Either linear or logarithmicforms can be used.
3.67 The main problem with the time-series approach is that it is not capable of incorporaLiligexogenous factors, such as demand shifts, that are not specified in the equation. Another problem isthat the impact of the project may extend beyond the area for which the data have been compiled. Thefirst problem causes the estimate to be biased upward, and the second biased downward.
3.68 An alternative to time-series estimation is the use of spatial cross-sectional land valuedata. In this approach, land value data are collected, and along with other factors, the distance fromthe project is included as an independent variable. Another variation is to include a dummy variableindicating that the parcel is provided with the project's service, such as water service or infrastruc-ture. In either case, the coefficient associated with distance or service benefit can be interpreted togauge the impact of the public investment.
3.69 Another way of estimating the effects of public investment on land values is the casestudy comparison. Instead of using time-series or cross-sectional spatial data, two areas are selectedfor analysis. One is located adjacent to the project and the other is a "control" case distant from theproject. The two cases should be as similar as possible except for the influence of the project.
3.70 As in the econometric approach, regression equations are run. Significant differencesin land values that cannot be explained by the nonproject factors are hypothesized to be estimates ofthe public investment impact. Time-series data can be used in the case comparison approach, and asoutlined above, can be used to isolate effects. The regression equation can take the following form:
projPV, - ,CPVU = a + bD,
where PV1 is land value in the project area at time t, ,O1,,PV island value in the control area at timet and D is the dummy variable equal to zero before the project and one afterwards. Independentvariables X,1 can also be incorporated into the case comparison approach, where control site valuesare subtracted from project site values such as:
projPV, - ,C,f~VPV = a + bD - C pro]X -cX)
3.71 Both the econometric and case comparison approach can be used to gauge the impactsof government regulations on land values. For such applications, evaluations are set up to measurethe effects of zoning or other development controls.
Predicting land value impacts offuture public actions
3.72 The likely impact of public actions on future land values is difficult to predict. Twoapproaches are suggested, both of which require substantial information about land markets. The firstmethod applies the estimates of past impact assessments to future projects or regulations. In the mostliteral sense, if the impact of a freeway interchange was found to raise property values by US$25 persquare meter, then this figure would be applied to the new project (adjusted for inflation). Obviouslythis approach is crude, but it provides planners and finance specialists with some estimation.

36
Table 3-4. Average residential plot prices by level of Infrastructure development and year in Karachi(Rs. per square yard)
Level of development 1980 1985 1987 1988
Developed 1,201 1,300 1,618 1,746Developing 499 572 695 756Not developed 267 371 429 454
Source: DowaU (1989b)
3.73 The second approach, which applies only to land-use and development regulations,
estimates the potential impact of a change in zoning or building controls on land values. For example,
if the government is considering changing its land subdivision requirements so that residential
projects must contribute a greater amount of land for public facilities, the impacts can be assessed
by calculating how the regulatory changes will alter the financial performance of hypothetical
projects.
Case Study: Assessing the Impact of Infrastructure Development on Plot Prices,
the Case of Karachi, Pakistan
3.74 To gauge the impact of infrastructure deployment on land prices in Karachi, land price
data collected from real estate brokers were analyzed to determine whether the plots were located in
neighborhoods that were fully developed, were developing, or not developed. These are defined as
follows:
Developed: Plots located in neighborhoods where all infrastructure has been
installed and all services have been completed.
Developing: Plots located in neighborhoods where the development work is
under progress-not all of the services and infrastructure are in place.
Not developed: Plots located in neighborhoods where no services and infra-
structure at all have yet been provided in any part of the scheme.
3.75 As Table 3-4 illustrates, the level of infrastructure development plays a critical role in
determining land prices. The ratio between the prices of developed and not-developed plots ranges
from 4.5 to 3.8 for 1980 and 1988. To gauge the impact of infrastructure on plot price, a regression
model was developed to capture the effects of infrastructure development, using a dummy variable.
The dummy variable "developed" singles out plots located in fully developed areas with infrastruc-
ture as defined above. To measure the effects of infrastructure, the following log form equation was
estimated:
InV = c + d + hx
where V is the estimated plot price at a distance of (x) kilometers to the CBD in 1988 rupees per
square yard; c is the constant; d is the dummy variable for developed areas; h is the distance gradient

37
coefficient; and x is distance in kilometers. For all years, the regression estimates are highlysignificant; all independent variables have the correct sign. The results provide extremely importantfindings about the benefits of infrastructure. Based on market conditions prevailing in 1987 and 1988,plots with full infrastructure (cases when the dummy variable "developed" is equal to 1) are valuedat approximately 100 percent more than plots without infrastructure. Put another way, the provisionof infrastructure doubles land values, after holding constant for distance from the city center. Table3-5 illustrates these patterns for 1988 by calculating plot price by distance fordeveloped, developing,and undeveloped plots for selected distances.
3.76 These results suggest that the Karachi Development Authority (KDA) is creatingsubstantial increases in land values through its scheme of development programs. By pricing its plotsat the cost of land development and by not charging market prices that reflect the added values ofinfrastructure, the KDA is giving the "development gain" away to allottees. Given the patterns of theactual development of plots and the rapid increase in plot transfers as reflected in the KDA transferand nonutilization fees, many KDA allottees are simply not building housing on their allotted plotsbut are selling their plots to cash in on the value gain created by the KDA-constructed infrastructure(Dowall, 1991).
Using LMA information for taxation andfiscal planning
3.77 Until recently, many local governments relied on central government subventions tofinance water, sewerage collection and treatment, and roadway projects. But now, burdened by a debtcrisis, many central governments are extremely hard-pressed to fund the construction of infrastruc-ture to support land development. Funds must be generated at the local level. One method of raisingrevenues is to levy taxes, fees, and user charges on those property owners who directly benefit frominfrastructure investments. But to efficiently impose these charges it is necessary to measure the costsand benefits of infrastructure projects. Some methods for assessing the impacts of infrastructureinvestments were presented earlier. This section illustrates how these assessments can be applied to
Table 3-5. Estimates of plot prices by level of infrastructure and distance, 1988(Rs. per square yard, Karachi)
Distance to CBD, km.. Developed Not developed
0 3,060.3 1,512.910 1,413.0 698.520 652.4 322.5
The regression equation presented below was used to estimate the values in Table 3-4.
Year Constant* Distance Developed+ R2 F Signif.
1988 1,512.9 -.07728 2.02 .491 .0000
All statistics significant at .05 level.
*The constant has been converted from log basis to rupees per square yard. Developed dummy has been convertedto a multiple of the constant value.
Source: Dowall (1991)
38
projects to determine the potential benefits of public investments, using the Karachi DevelopmentAuthority (KDA) as an example (Dowall, 1991)
Case Study: Determining the Potential Benefits of Public Investments in Karachi, Pakistan.
3.78 The KDA is Karachi's major land developer, charged with the responsibility ofdeveloping and distributing residential plots to residents. Over the past ten years, the agency has hada difficult time financing the construction of serviced plots, claiming that it lacked sufficientresources to provide necessary infrastructure. The information gathered by the Karachi land marketassessment was used to estimate the market value of fully serviced plots for 1980 and 1985. Thesetwo years provide an estimate of the potential revenues that could have been created by the KDA ifit had priced the sale of plots at their full development value.
3.79 A specific regression model was developed for 1980 and 1985 to estimate the potentialselling price of developed plots. The model rellects the size of plots as well as distance and whetherthe plot is fully developed with infrastructure. The equation takes the following form:
InVx =c +adM +a2 d2 +hx
where V is the estimated plot price in 1988 rupees per square yard; c is the constant; d, is the dummyvariable for p!ots larger than 120 square yards; d2 is a dummy variable for developed areas; a, anda2 are parameters reflecting the proportionate effect of large plots and developed areas respectively;h is the distance gradient coefficient; and x is distance in kilometers of the plot from the city center.
3.80 The equation is used to estimate, plot by plot, the potential revenues that could beachieved if plots were allotted at their full developed value, based on the size and location of plotsactually allotted in 1980 and 1985. Table 3-6 presents the results of the regression equation, whichprovides an estimate of the potential market value of the allotted plots. Table 3-7 compares the actualallotment revenues with estimated developed market values of plots in 1980 and 1985. In 1980, theKDA allotted 2,477 plots by computer ballot. Based on the 1980 allotment price schedules for theschemes in which these 2,477 plots were located, the KDA received a total of Rs 81,300,000. Of thisamount, Rs. 12,300,000 was from the allotment of "small plots" measuring less than 120 squareyards; the remainder was from larger plots. According to the regression model developed andpresented in Table 3-5, the total value of these plots, if fully developed, would be Rs 339,700,000.This is the total market value of the plots with infrastructure, taking into consideration their locationand size.
3.81 According to the land disposal regulations, the allotment prices are to be set to fullyrecover the cost of land development. Thus, in theory at least, the Rs 81,300,000 represent the KDA' scost of developing these 2,477 plots, which comes out to an average of Rs 33,000 each. When theseplots are developed and provided with infrastructure, their developed value in 1980 goes up to Rs339,700,000, for an average of Rs 137,000 per plot. (This estimate does not consider the fact that itmight take several years to actually develop these plots. However, it is not unreasonable to assumethat, in an inflationary environment, people would pay the full current development value of a plotthat will not be provided with infrastructure for two to three years.) Thus, the difference between theRs 81,300,000 and Rs 339,700,000 represents the development gain created by the KDA.
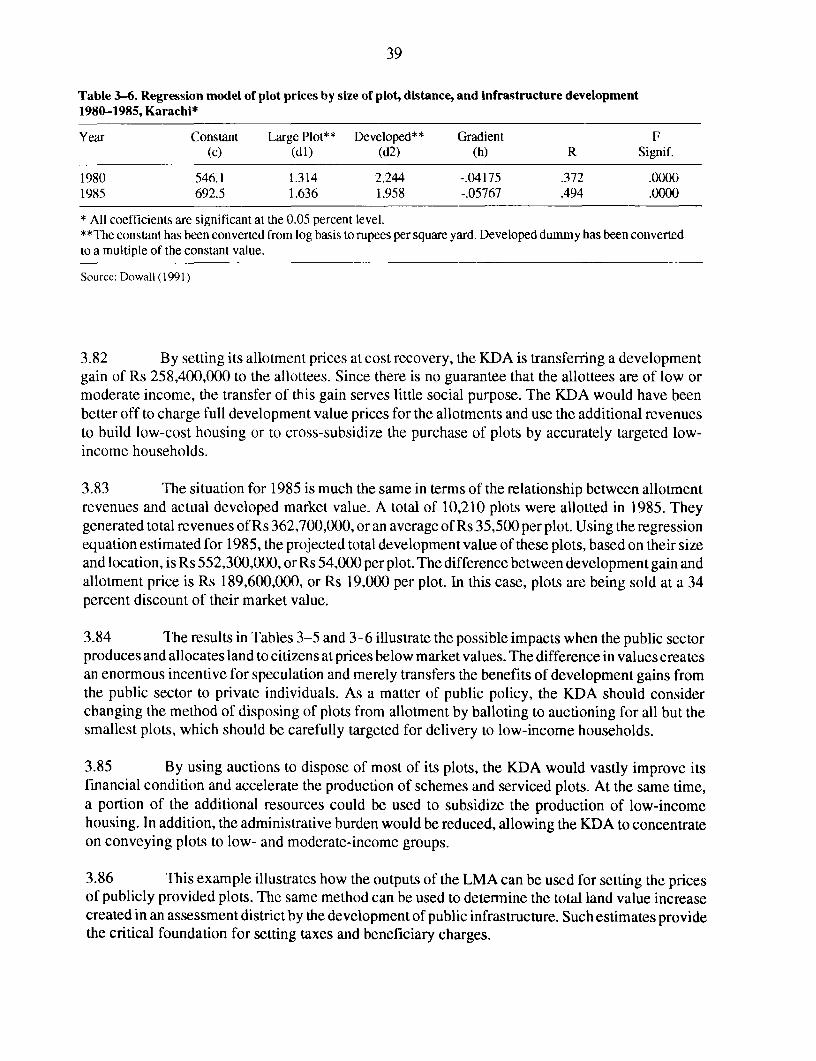
39
Table 3-6. Regression model of plot prices by size of plot, distance, and infrastructure development1980-1985, Karachi*
Year Constant Large Plot** Developed** Gradient F(c) (dl) (d2) (h) R Signif.
1980 546.1 1.314 2.244 -.04175 .372 .000O1985 692.5 1.636 1.958 -.05767 .494 .0000
* All coefficients are significant at the 0.05 percent level.**The constant has been convened from log basis to rupees per square yard. Developed dummy has been convertedto a multiple of the constant value.
Source: Dowall (1991)
3.82 By setting its allotment prices at cost recovery, the KDA is transferring a developmentgain of Rs 258,400,000 to the allottees. Since there is no guarantee that the allottees are of low ormoderate income, the transfer of this gain serves little social purpose. The KDA would have beenbetter off to charge full development value prices for the allotments and use the additional revenuesto build low-cost housing or to cross-subsidize the purchase of plots by accurately targeted low-income households.
3.83 The situation for 1985 is much the same in terms of the relationship between allotmentrevenues and actual developed market value. A total of 10,210 plots were allotted in 1985. Theygenerated total revenues of Rs 362,700,000, or an average of Rs 35,500 per plot. Using the regressionequation estimated for 1985, the projected total development value of these plots, based on their sizeand location, is Rs 552,300,000, or Rs 54,000 per plot. The difference between development gain andallotment price is Rs 189,600,000, or Rs 19,000 per plot. In this case, plots are being sold at a 34percent discount of their market value.
3.84 The results in Tables 3-5 and 3-6 illustrate the possible impacts when the public sectorproduces and allocates land to citizens at prices below market values. The difference in values createsan enormous incentive for speculation and merely transfers the benefits of development gains fromthe public sector to private individuals. As a matter of public policy, the KDA should considerchanging the method of disposing of plots from allotment by balloting to auctioning for all but thesmallest plots, which should be carefully targeted for delivery to low-income households.
3.85 By using auctions to dispose of most of its plots, the KDA would vastly improve itsfinancial condition and accelerate the production of schemes and serviced plots. At the same time,a portion of the additional resources could be used to subsidize the production of low-incomehousing. In addition, the administrative burden would be reduced, allowing the KDA to concentrateon conveying plots to low- and moderate-income groups.
3.86 This example illustrates how the outputs of the LMA can be used for setting the pricesof publicly provided plots. The same method can be used to determine the total land value increasecreated in an assessment district by the development of public infrastructure. Such estimates providethe critical foundation for setting taxes and beneficiary charges.

40
Private sector applications of LMA information
3.87 There are also many ways of applying LMAs to assist private sector development. In thecase of residential development, most developers attempt to estimate the demand for housing unitsand compare it with supply. The land market assessment, if it catalogs the location and characteristicsof projects, can play an important role in helping improve private decisionmaking.
3.88 Surveys of housing and commercial property development projects can be used bydevelopers to gauge the current level of supply by geographic area. If detailed project levelinformation is gathered regarding the types of housing or products currently for sale and is tabulatedby price and location, private as well as public developers can compare the current level of supplywith demand to determine whether an additional project is feasible.
3.89 The level of housing or property demanded in the market can be determined by the rateof sales of housing units or commercial units over the past year. This level of "absorption" willsuggest that so many housing units or square meters of office or commercial space can be sold in themarketplace over the next year. If the current level of units available for sale in the market exceedsa tull year's amount of absorption, then the market referred to in Table 3-7 may be oversupplied. Anexample of a housing study conducted in Bangkok using the results of the Bangkok land marketassessment illustrates this application.
Gauging housing market competition in Bangkok's northern corridor
3.90 In order to determine the level of competition in Bangkok's northern corridor market,an extensive survey was made of projects in the area. Based on a windshield survey, 1 10 land andhousing projects were identified in the market area and a sample of 40projects were selected forcloserexamination. The managers of each of the 40 projects were interviewed to determnine which types ofunits were for sale, their prices, rate of sale, financing characteristics, project size, location, and mixof units.
Table 3-7. Comparison of KDA allotment revenues and developed value of plots allotted by KDA in 1980 and1985, in 1988 rupees, Karachi
1980 1985
1. KDA plot allotment revenuesmall plots 12,300,000 142,700,000large plots 69,000,000 220,000,000
Total KDA allotment revenue 81,300,000 362,700,000
2. Developed market value of plotssmall plots 58,400,000 171,300,000large plots 281,300,000 381,000,000
Total developed plot value 339,700,000 552,300,000
3. Potential additional revenues (2-1)small plots 46,100.000 28,600,000large plots 212,300,000 161,000,000
Total potential revenues 258,400,000 189,600,000
Source: Dowall (1991)
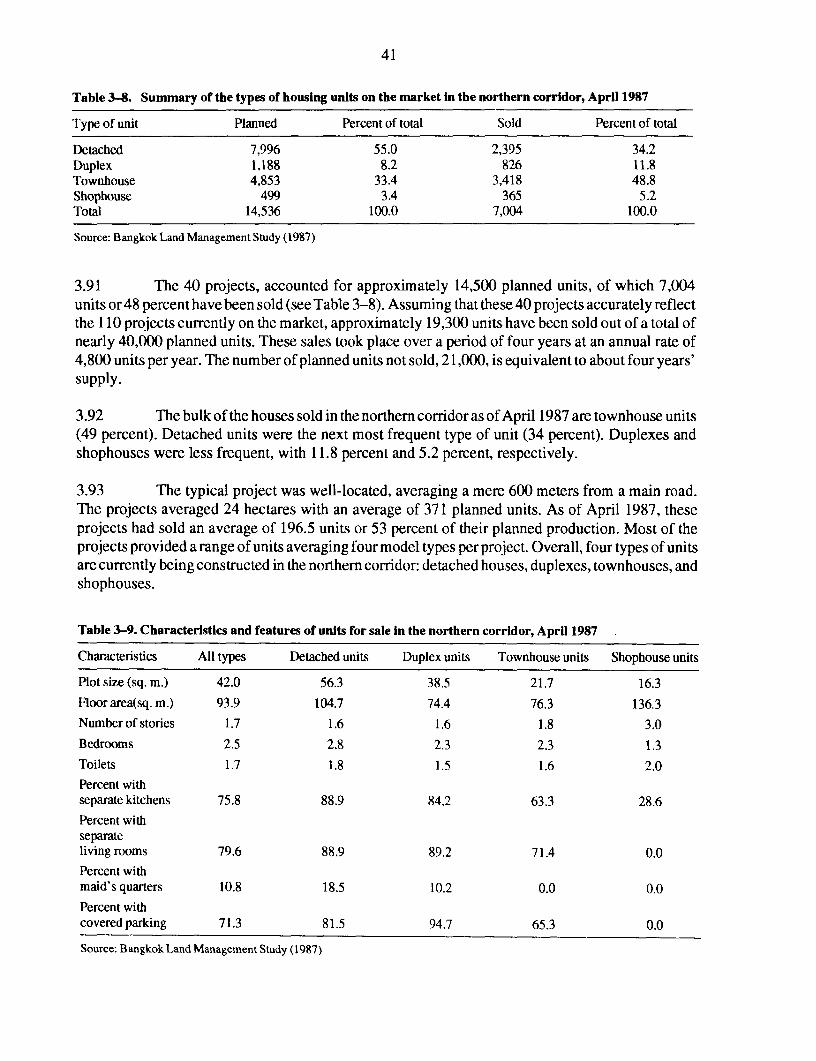
41
Table 3-8. Summary of the types of housing units on the market in the northern corridor, April 1987
Type of unit Planned Percent of total Sold Percent of total
Detached 7,996 55.0 2,395 34.2Duplex 1.188 8.2 826 11.8Townhouse 4,853 33.4 3,418 48.8Shophouse 499 3.4 365 5.2Total 14,536 100.0 7,004 100.0
Source: Bangkok Land Management Study (1987)
3.91 The 40 projects, accounted for approximately 14,500 planned units, of which 7,004units or 48 percent have been sold (see Table 3-8). Assuming that these 40 projects accurately reflectthe 110 projects currently on the market, approximately 19,300 units have been sold out of a total ofnearly 40,000 planned units. These sales took place over a period of four years at an annual rate of4,800 units per year. The number of planned units not sold, 21,000, is equivalent to about four years'supply.
3.92 The bulk of the houses sold in the northern corridor as of April 1987 are townhouse units(49 percent). Detached units were the next most frequent type of unit (34 percent). Duplexes andshophouses were less frequent, with 11.8 percent and 5.2 percent, respectively.
3.93 The typical project was well-located, averaging a mere 600 meters from a main road.The projects averaged 24 hectares with an average of 371 planned units. As of April 1987, theseprojects had sold an average of 196.5 units or 53 percent of their planned production. Most of theprojects provided a range of units averaging four model types per project. Overall, four types of unitsare currently being constructed in the northern corridor: detached houses, duplexes, townhouses, andshophouses.
Table 3-9. Characteristics and features of units for sale in the northern corridor, April 1987
Characteristics All types Detached units Duplex units Townhouse units Shophouse units
Plot size (sq. m.) 42.0 56.3 38.5 21.7 16.3
Floor area(sq. m.) 93.9 104.7 74.4 76.3 136.3
Number of stories 1.7 1.6 1.6 1.8 3.0Bedrooms 2.5 2.8 2.3 2.3 1.3Toilets 1.7 1.8 1.5 1.6 2.0
Percent withseparate kitchens 75.8 88.9 84.2 63.3 28.6Percent withseparateliving rooms 79.6 88.9 89.2 71.4 0.0Percent withmaid's quarters 10.8 18.5 10.2 0.0 0.0
Percent withcovered parking 71.3 81.5 94.7 65.3 0.0
Source: Bangkok Land Management Study (1987)

42
3.94 Table 3-9 illustrates the characteristics of the units by type. The size of plots ranged from65.2 to 225.2 square meters for shophouse and detached units, respectively. The most common sizeof plot was 86.8 square meters for townhouse units. Duplex units have plots averaging 154 squaremeters.
3.95 In terms of building size, the units ranged from 74.4 square meters to 136.3 squaremeters. These units were large, reflecting the preferences of the private sector to the middle- andupper-middle-income segment of the market. With the exception of shophouses, the units are fromone to two stories high and have an average of 2.5 bedrooms, and 1.7 toilets per ullit. The majorityof the units (75.8 percent) had separate kitchens and covered carports (71 percent). Very few of theunits had separate accommodations for maids.
3.96 Financing for the units was fairly consistent across all projects and types of units. Forall projects, the average downpayment made was 27.2 percent of the purchase price. Thedownpayment was normally made over a five-to six-month period. Long-term mortgages averaged176 months (14.7 years' and carried an interest rate of 11.8 percent.
3.97 The prices of the units offered for sale in the northern corridor area ranged fromUS$5,200 to US$25,230 (the average was US$20,360). The selling price of units (total priceincluding land and house) ranged from US$168 per square meter for shophouses to US$241 persquare meter for detached units. Table 3-10 illustrates the distribution of planned and sold units byprice category.
3.98 The most striking finding illustrated in Table 3-10 is the oversupply of units in theUS$16,000 to US$18,000 price range. Developers were planning more than 6,000 units in this rangeand as of April 1987 they had only sold 817 units, or 13.5 percent of the supply. As a result, nearly70 percent of the unsold units were priced in this range. The units that sold well were those pricedbetween US$10,040 and US$15,900 and over US$18,000.
Table 3-10. Distribution of planned and sold units in the northern corridor by price, April 1987
Price incategory Units Percent of Units Percent of Number Percent of(USS) planned total sold total on market total
5,200-7,999 946 6.5 333 4.8 613 8.28,000-9,999 491 3.4 205 2.9 286 3.810,000-11,999 853 5.9 644 9.2 209 2.812,000-13,999 1,318 9.1 1,148 16.4 170 2.,14,000-15,999 1,421 9.8 1,137 16.2 284 3.816,000-17,999 6,048 41.8 817 11.7 5,231 69.918,000-19,999 888 6.1 736 10.5 152 2.020,000-21,999 466 3.2 399 5.7 67 0.922,000-23,999 612 4.2 522 7.5 90 1.2over 24,000 1,443 10.0 1,063 15.2 380 5.1Total *14,486 100.0 7,004 100.0 7,482 100.0
* Total reflects 50 unit non-response.
Source: Bangkok Land Management Study (1987)

43
Table 3-11. Sales rate by the type of housing unit in the northern corridor, April 1987
Housing type Sales per month
Townhouse 6.8Duplex 3.4Shophouse 2.8Detached 2.4Average (all types) 3.4
Source: Bangkok Land Management Study (1987)
3.99 The market for units below US$ 10,000 was just starting to emerge and few units hadsold as of April 1987. In terms of the supply of units in the "pipeline," units priced below US$ 10,000accounted for 8.2 percent of the market.
3.100 The project survey revealed the rate of sales of units by type and price range. Table 3-11 illustrates the rates of sales by type of unit. Overall, units sell at a rate of 3.4 per month (for a totalof 136 units per month or 1,632 units per year for the 40 projects). As this table shows, the best-sellingtype of unit was the townhouse, which sold at an average of 6.8 units per month.. Duplexes were thenext best-selling model, averaging 3.4 units per month.
3.101 Table 3-12 illustrates the pattern of sales rates per month by the price of the unit. Thefastest selling units were those priced below US$10,000 and between US$18,000 and US$20,000.These sales rates for the lower end of the market suggest that the demand for lower-priced units isstrong.
3.102 The results of the project survey indicated a strong and demonstrated demand forhousing units priced below US$10,000 in the northern corridor of Bangkok. Units produced in thisprice range sold well, at about twice the rate of the overall housing market. The survey helped thedevelopment community recognize the potential profitability of building houses in this price rangein the northern corridor.
Table 3-12. Sales rate of units by price in the northern corridor, April 1987
Price category in $US Sales per month
5,200-7,999 6.18,000-9,999 5.010,000-11,999 2.112,000--13,999 3.814,000-15,999 5.616,000-17,999 4.618,000-19,999 8.020,000-21,999 3.822,000-23,999 5.8over 24,000 3.0Average 3.4
Source: Bangkok Land Management Study (1987)

44
Conclusions
3.103 The land and housing market assessment is an essential first step toward making localland and housing markets more efficient. The information base generated by the assessment can beused to gauge market performance, identify future needs for infrastructure, assess housing affordability,and assess the impacts of public policies and actions.
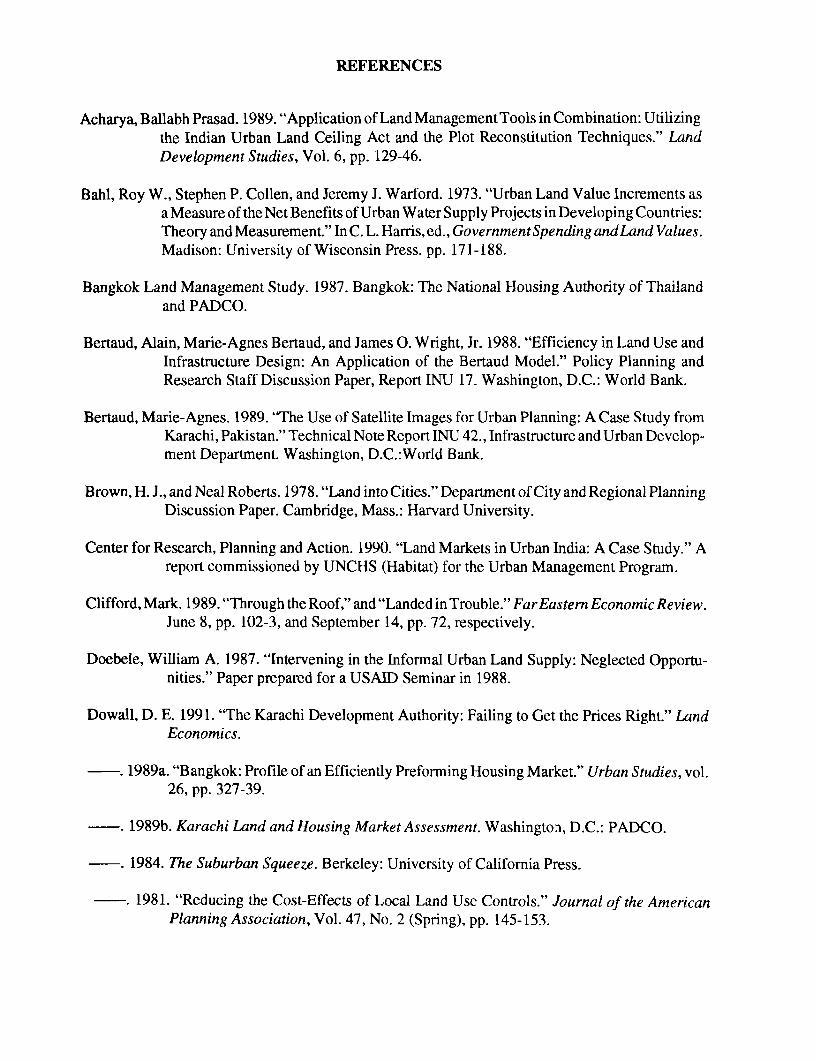
REFERENCES
Acharya, Ballabh Prasad. 1989. "Application of Land ManagementTools in Combination: Utilizingthe Indian Urban Land Ceiling Act and the Plot Reconstitution Techniques." LandDevelopment Studies, Vol. 6, pp. 129-46.
Bahl, Roy W., Stephen P. Collen, and Jeremy J. Warford. 1973. "Urban Land Value Increments asaMeasure of the NetBenefits of Urban WaterSupply Projects in Developing Countries:Theory and Measurement." In C. L. Harris, ed., GovernmentSpending and Land Values.Madison: University of Wisconsin Press. pp. 171-188.
Bangkok Land Management Study. 1987. Bangkok: The National Housing Authority of Thailandand PADCO.
Bertaud, Alain, Marie-Agnes Bertaud, and James 0. Wright, Jr. 1988. "Efficiency in Land Use andInfrastructure Design: An Application of the Bertaud Model." Policy Planning andResearch Staff Discussion Paper, Report INU 17. Washington, D.C.: World Bank.
Bertaud, Marie-Agnes. 1989. "The Use of Satellite Images for Urban Planning: A Case Study fromKarachi, Pakistan." Technical Note Report INU 42., Infrastructure and Urban Develop-ment Department. Washington, D.C.:World Bank.
Brown, H. J., and Neal Roberts. 1978. "Land into Cities." Department of City and Regional PlanningDiscussion Paper. Cambridge, Mass.: Harvard University.
Center for Research, Planning and Action. 1990. "Land Markets in Urban India: A Case Study." Areport commissioned by UNCHS (Habitat) for the Urban Management Program.
Clifford, Mark. 1989. "Through the Roof," and "Landed in Trouble." FarEastern Economic Review.June 8, pp. 102-3, and September 14, pp. 72, respectively.
Doebele, William A. 1987. "Intervening in the Informal Urban Land Supply: Neglected Opportu-nities." Paper prepared for a USAID Seminar in 1988.
Dowall, D. E. 1991. "The Karachi Development Authority: Failing to Get the Prices Right." LandEconomics.
1989a. "Bangkok: Profile of an Efficiently Preforming Housing Market." Urban Studies, vol.26, pp. 327-39.
1989b. Karachi Land and Housing Market Assessment. Washington, D.C.: PADCO.
1984. The Suburban Squeeze. Berkeley: University of California Press.
1981. "Reducing the Cost-Effects of Local Land Use Controls." Journal of the AmericanPlanning Association, Vol. 47, No. 2 (Spring), pp. 145-153.

46
1980. "Methods for Assessing Land Price Effects of Local Public Policies and Actions." In J. ThomasBlack and James E. Hoben, (eds.). Urban Land Markets: Price Indices, SupplyMeasures, and Public Policy Effects. Washington, D. C.: Urban Land Institute.
Dowall, David E., and Michael Leaf. 1990. "Residential Land Prices in DKI Jakarta: A Survey." Areport prepared for the USAID/Indonesia Urban Adviser.
Dowall, David E., and Samuel Sherer. 1989. "Summary of the Perum Perumnas Data Base."Washington, D.C.:PADCO.
Foster, David. 1989. Viewing Environmental Protection as Investment in Infrastructure. UrbanEnvironmental Concept Paper. Raleigh, N.C.: Research Triangle Institute.
Harris, C. Lowell, (ed.). 1973. Government Spending and Land Values, Tred-6. Madison: Universityof Wisconsin Press.
Landis, John. 1986. "Electronic Spreadsheets in Planning: the Case of Shiftshare Analysis." Journalof the American Planning Association, Vol. 51, No. 2 (Spring), pp. 216-25.
Lee, Douglas. 1974. "Requiem for Large-Scale Models." Journal of the American PlanningAssociation, Vol. 35, No. 3 (May), pp. 163-78.
Malpezzi, Stephen, Michael Bamberger, and Stephen Mayo. 1982. "Planning an Urban HousingSurvey: Key Issues for Researchers and Program Managers in Developing Countries."Water Supply and Urban Development Department Discussion Paper No.44. Washing-ton, D.C.: World Bank.
Malpezzi, Stephen, Stephen K. Mayo, and David J. Gross. 1985. "Housing Demand in DevelopingCountries." World Bank Staff Working Paper 733. Washington, D.C.: World Bank.
Mayo, Stephen K., Stephen Malpezzi, and David J. Gross. 1986. "Shelter Strategies for the UrbanPoor in Developing Countries." World Bank Research Observer, Vol. 1, No. 2 (July),pp. 183-203.
Menezes, L. M. 1988. "Urban Land Policy Trends in Asia: An Overview." Land Use Policy, July.
PADCO. 1989. San Pedro Sula, Honduras Land and Housing Market Study. Washington, D.C.
1. 991. 'Constraints Affecting the Efficiency of Urban Land Markets in India." Washington,D.C.
Sirnans, C. F., and Arnold L. Redman. 1979. "Capital-Land Substitution and the Price Elasticity ofDemand for Urban Residential Land." Land Economics, Vol. 55, pp. 167-76.
47
Srinivas, Lakshmi. 1989. "Proposal for a Land Market Study of Bangalore City." Professional ReportSubmitted to the Department of City and Regional Planning, University of California,Berkeley.
Struyk, Raymond J. 1987. "The Housing Needs Assessment Model." Journal of the AmericanPlanninig Association, Vol. 53, No. 2 (Spring), pp. 227-34.
UNCHS. 1989. "Land Development Policies." Draft Analysis and Synthesis Report. Nairobi,Kenya: UNCHS, March.
van Huyck, Alfred P. 1987. "Land Management in the Context of National Urban Strategies." Paperpresented to the Land Policy and Land Use Training for Developing Countries, LincolnInstitute of Land Policy, Cambridge, Mass.
Walters, Alan. 1983. "The Value of Land." In Harold Dunkerley, (ed.), Urban Land Policy: Issuesanid Opportunities. Oxford: Oxford University Press.
Witte, Ann. 1977. "An Examination of Various Elasticities for Residential Sites." LandEconomics,Vol. 53, pp. 401-9.
World Bank. 1988. World Development Report 1988. New York: Oxford University Press.
1989. "Malaysia: The Housing Sector, Getting the Incentives Right." Infrastructure DivisionCountry Department n1, Asia Regional Office. Washington, D.C.
Yonder, Ayse. 1990. "Istanbul Land Market Assessment " A report prepared for UNCHS (Habitat)for the Urban Management Programme.


ANNEX A: JAKARTA BROKER SURVEY METHODOLOGY
Notes on Methodology
A 1.1 The kelurahan, a governmental unit overseen by an administrative chief or Lurah, is thelowest level of local government in Indonesia. The city of Jakarta consists of 256 kelurahan(excluding the four kelurahan of the offshore islands); these range in area from less than 30 hectaresin the most densely settled parts of the city to more than 1,000 hectares on the urban periphery, andin population from roughly 3,000 to more than 60,000 persons.'
Al .2 For studying overall trends within the residential land markets of Jakarta, we consideredthe kelurahan to be a sufficiently small geographical area to serve as the basis for our sample. Withineach kelurahan surveyed, we sought to determine typical or average values for various types of landplots. The wide variation in sizes of kelurahan does not present a problem in this regard if oneconsiders that the largest kelurahan are at the edge of the city, where land prices tend to be morehomogeneous than in the center of the city. Nonetheless, there is generally a wide variation in landprices within any one kelurahan.2 The particular characteristics of land which we examined in thisstudy are intended to cover these ranges of values.
A1.3 It was decided at the outset that we would collect data on land tenure, plot size, andinfrastructure, as each of these variables is generally considered to be an important determinant ofland price. To keep the questionnaire manageable, it was decided to limit the number of levels or typesfor each of these variables to three or four. Initial selection and precise definitions of the categoriesof tenure, plot size, and infrastructure were arrived at after open-ended interviews with six landbrokers in the outer districts of the city, followed by long discussions with the surveyors. The purposeof this was to determine categories that would encompass important aspects of the three variables asthey affect market prices. Detailed definitions of the categories used for infrastructure and tenure aregiven below in a subsequent section. The variable plot size was not used in the analysis.
Al.4 One surprising aspect of the residential land markets in Jakarta is the general lack of adifference in land prices per square meter due to the size of plot being considered. At the outset, wechose standard sizes for our hypothetical lots to be 70, 120, and 200 square meters, representing.respectively, small, medium, and large lots such as one would find in the market. In our initialdiscussions with land brokers, we were told repeatedly that we would not find any difference in pricewithin this range of plot sizes. From these interviews, we determined that, in general, one would notbe able to obtain a price discount unless one bought a plot of at least 1,000 square meters in area.Therefore, for the survey, we chose 100, 1,000, and 2,000 square meters as the hypothetical sizes ofthe plots. In using sizes as large as these, we were stepping beyond the bounds of the residentialmarkets per se, although one might argue that lots of 1,000 oir 2,000 square meters would eventually,if not immediately, be subdivided for resale as housing lots.
1. Population figures are tak-en from the 1980 Census, and land area estimates are from the DKI Jakarta Structure Plan.Thcse dataare compiled iniGardincr, Peter. 1989. The Demograpft ofJakarta in th)e 1 990's:A Review ofilhe D)KlJakartaStrctuire Plan. Jakarta: Huszar, Brainnah and Associates.2. Differences between the highest and lowest values of land per kelurahan in our sample ranged from less thani 50percent for the most homogenous kelurahiani to more than 400 percent for the most diverse.
50
A1.5 Unlike the categories for tenure and infrastructure-which, when subjected to tableanalysis against ordinal categories of price proved to have statistically significant distributions at the.01 level-the categories of plot size did not exhibit good distributions. Although the values for thisvariable were not useful for analysis, it is at least noteworthy that all of the premia associated withsmaller plots have positive signs, meaning that within none of the geographical areas covered hereare per meter prices consistently higher for larger plots.
Al.6 Once the variables were defined and questionnaires developed, a pretest was given,where each surveyor covered or attempted to cover one kelurahan (e.g., three qualified brokers). Thepretest was undertaken not only to test the questionnaire and to accustom the surveyors to methodsof interviewing, but also to determine ways of locating brokers to interview. The proper means forlocating brokers was a topic of great discussion before the pretest was undertaken, as the surveyorswere of the opinion that brokers might be reluctant to participate in a survey that appeared to be"'official," as the status of their profession falls into a legal gray area. From the pretest, we determinedthat brokers were actually quite easy to locate, as they generally have a high profile in thecommunities they work in and are well known to most residents. We had no problems withuncooperative informants; nonetheless, we avoided asking them any questions about their actualland brokering activities other than the initial qualifying questions. We did not want the brokers tofeel that their personal business activities were being scrutinized. The only significant change to thequestionnaire that resulted from the pretest was a rewriting of the qualifying questions, which hadpreviously been based on the number of transactions the broker was involved in during the courseof the year, a measure that was harder to standardize across the range of participating brokers thanwas the proportion of their income earned from brokering work.
A 1.7 The five surveyors who carried out the interviews all had prior experience administeringsurveys, either from working on household surveys with Jakarta's Kampung Improvement Program,or, in the case of one surveyor, through coursework and academic research in his training to becomea sociologist. Nonetheless, the conversational approach to interviewing that we employed was adeparture from their previous household survey work, which had generally been based on specificquestions and answers. Basic instructions were given to the five surveyors in written form, althoughmore thorough information was communicated through a series of meetings prior to administeringthe survey.
A1.8 Throughout the course of the interviews (from August 18 to October 6, 1989), thesurveyors worked independently of each other, dividing up the four outer districts of the city (initiallyexcluding Central Jakarta) among themselves, with two surveyors starting out in South Jakarta, asthis was the area that initially had the largest number of kelurahan to cover. After the majority of thekelurahan in South Jakarta were surveyed, one of these two surveyors concentrated on kelurahanwithin Central Jakarta. Although the surveyors went out singly to the field, they often made contactwith well-connected brokers who would accompany them to meet other land brokers. The surveyorswere instructed to conduct interviews one broker at a time, in isolation from other brokers, so as todecrease the likelihood of biased appraisals.
A 1.9 The questionnaire was developed for recording information. All of the interviewers, outof personal preference, chose not to take the questionnaire forms with them to the interviews, usingnotepads instead so as not to inhibit the conversational tone of the interviews nor to unintentionallyintimidate their informants. After completing an interview, a surveyor would write up the results,transferring his information from notepad to recording sheet.

51
A 1.10 Initial selection of the kelurahan to be covered was made by examining a standard mapof the city of Jakarta and estimating the amount of open land in each kelurahan. If more than roughly20 percent of a kelurahan was indicated on the map as being open land, it was assumed that we wouldhave no trouble finding informants, as most likely there would be thriving land markets. The first 68kelurahan were determined in this manner, primarily along the edges of the city. Our intention wasto progress toward the center of the city from these kelurahan until we would not be able to find peopleknowledgeable about the price of empty land. Although at the outset we assumed that there wouldbe areas that are built up to the point where it would be difficult to find land brokers, in practice thereare enough dispersed empty lots for brokers to be able to make estimations, even in some of the innercity locations. In a few of the most central kelurahan, price appraisals were based wholly or partlyon informants' knowledge of prices for properties that had been sold with buildings of negligiblevalue.
Al. 1 The survey eventually covered 128 kelurahan (50 percent of the total in the city,excluding four located on the offshore islands). Three categories each of three variables gave apossibility of 27 different types of plots to be appraised for each kelurahan. Since brokers were askedto make appraisals for current prices as well as for each of the past two years, the total number ofpossible values that could be determined for each kelurahan is 81, giving a total of 10,368 priceappraisals to be entered into the data set. In practice, however, approximately 18 percent of thesevalues were unobtainable, inasmuch as not all of the types of land that were examined are availablein all the kelurahan.
Notes on Infrastructure
Al.12 The variable we are using as a measure of infrastructure availability (infrastructurelevel) is a categorization of lands that originated within the market, for it is used by land brokersthemselves. From our initial interviews, it was apparent that brokers use a three-part classification,based primarily on the distance of the plot from a main road, to indicate the marketability of a plotof land. Although the definitions of these three "classes" (the term used by brokers) of land are notprecisely the same throughout the whole of Jakarta, there are enough similarities in definitions fromvarious parts of the city that we were able to define usable categories for this survey.
A 1.13 Class I lands are considered in practice to be those close to a main, paved road, meaningin some parts of Jakarta less than 50 meters away and elsewhere, less than 100 meters. Definitionsof Class II range from 50-300 meters to 100-500 meters, with the greater distances used in moreoutlying parts of the city. Class III lands are those that are more than 300 meters or more than 500meters away from a main road. We chose as standard distances for our hypothetical plots thefollowing values: Class I refers to a plot 50 meters from a main road, Class II is 200 meters away,and Class III is more than 500 meters away. To further distinguish the three categories, the surveyorsincluded the possibility of flooding and poor water quality as related conditions. These are secondaryaspects of land quality that brokers also include in their working definitions of the three classes ofland.
A 1. 14 In our analysis, we took class of land quality as derived from the brokers' use of the termto be a reasonable proxy for the level of infrastructure available. Therefore, the terms used in thesurvey have been redefined for the analysis: "high infrastructure level" replaces "Class I," "mediuminfrastructure level" replaces "Class II," and "low infrastructure level" replaces "Class HI."

52
this variable is seemingly only a measure of accessibility of a plot, in essence it is also a generalmeasure of the quality of infrastructure provision. Types of infrastructure other than roads, which inother contexts would affect the value of a plot of land, appear not to be important considerations inJakarta. There are a variety of reasons for this. Electricity, for example, is already availablethroughout the whole of DKI Jakarta (or at least in every area covered by our survey), whereas thereis no closed sewerage system anywhere (households are essentially autonomous in this regard, usingeither pit latrines, septic systems, or the open drainage system for disposal of wastes). Householdautonomy also characterizes water use, as more than 78 percent of Jakarta households obtain theirwater from wells. Only 14 percent rely on the public water supply for drinking water, an indicationof the limited extent of this facility (Struyk, et al., 1989). Jakarta is well served by an extensive low-cost public transportation network; because access to this system is directly related to the availabilityof roads. the infrastructure level variable provides a reasonable measure of this.
A 1.15 In order to test whether the variable of infrastructure level is adequate as abroad measureof infrastructure provision, we also asked the brokers whether certain types of infrastructure or urbanservices would be available at the various types of hypothetical plots we were asking about. For thisquestion we used nine types of facilities: piped water, garbage collection, drainage, sanitation(actually a second measure of the quality of drainage), electricity, paved roads, sidewalks, neighbor-hood security system, and proximity to public transportation. By breaking down the answers to thisquestion by the infrastructure level variable (Table A-I), we were able to arrive at a more detailedunderstanding of this variable.
Al .16 In general, each of the three values (high, medium, and low) represents a lower level ofneighborhood services relative to the preceding level. Piped waterand sidewalks standoutastheonlytwo services that are not available at the majority of high infrastructure level plots, whereas electricityand security are available everywhere, irrespective of infrastructure level. For the low infrastructurelevel category, the striking drop-off in the availability of transportation, paved roads, and sidewalksrelative to both of the other categories is its strongest distinguishing characteristic.
A 1.17 The nine types of infrastructure or services were also examined in a series of regressionanalyses to determine their relative contribution to an estimation of land price. One result of theseregressions is that only three facilities-paved roads, sidewalks, and public transportation-are
Table A-i. A comparison between infrastructure level and specific types of infrastructure services
Percenta-c of surveyed Kelurahan where services are available
Infrastructure level
Infrastructure service Hioh Medium Low
Piped Water 48 44 35Garbage Collection 96 84 66Drainage 94 76 55Sanitation 85 70 51Electricity 100 100 100Paved Roads 98 62 12Sidewalks 30 1 1 3Security System 100 100 99Public Transport 100 88 37

53
useful as predictors of price. Differences in the accessibility of these facilities are already containedwithin the infrastructure level variable.
Notes on Tenure
A1.18 A variety of forms of land tenure claim are used in Jakarta. In addition to the five typesof primary land rights established by the Basic Agrarian Law (BAL) in 1960, other categories areused in practice to distinguish lands that have yet to be registered with the National Land Agency(Badan Pertanahan Nasional or BPN). In this survey, we sought to reduce this variety of land rightsto three principal categories, designated here as "registered" (i.e., registered with BPN), "tax receipt"("Girik," in Indonesian), and "weak claim." These categories were arrived at after initial consulta-tions with land brokers in various parts of the city and are intended to reflect the most significantaspects of tenure claim as they affect land price and market activities.
A 1.19 The distinctions between these three categories reflect the primary differences betweenthe types of land claim that exist in practice; nonetheless there was some unavoidable variation inhow these categories were used in the survey. For example, "registered" is meant to convey the ideaof the most secure obtainable claim to land by individual landowners, and for most of Jakarta thismeans a claim of Hak Milik (right of ownership) under the BAL. In certain kelurahan in the centerof the city, however, the high degree of governmental ownership of land (Tanah Negara) means thatthe highest available right for individuals is Hak Guna Bangunan (HGB, right of building), whichin relative terms is a weaker claim of ownership than Hak Milik. This is the case in seven of the 128kelurahan in our sample. We cannot speculate as to whether land prices in these areas would increaseif Hak Milik were available, but since these are also the kelurahan with some of the highest pricesin the city, it is reasonable to assume that differences in premia between Hak Milik and HGB wouldbe minor relative to the price differential between registered and unregistered lands.
A 1.20 A method that is often used for proving continuity of tenure when applying for an officialland registration certificate is the tax receipt. Because of this, it is common for people in Jakarta touse tax receipts as de facto proof of ownership. Brokers even use the term "Hak Girik"-literally,"tax receipt right"-when speaking of lands that are secured in this manner. Our working definitionof this category is that a buyer of such land would have a strong enough claim to ownership throughthe accumulation of land tax receipts that he could apply to register the land with BPN.
A1.21 Our third and lowest tenure category, "weak claim," is intended as a catch-all categoryfor a variety of tenure claims that are weaker than tax receipt (i.e., proof of ownership is insufficientfor directly applying for a certificate from BPN). An example of such a claim is the common casewhere the only proof of ownership of a property is a sales receipt between buyer and seller. The useof this category presented a problem in 17 of the kelurahan in Kecamatan Pasar Rebo (East Jakarta),where land brokers insisted that lands could not change hands without there being a claim at least asstrong as Girik.
54
Instructions for Surveyors
JAKARTA LAND MARKET STUDY
I. The Research Process
A. Methodoiogy
The purpose of this research is to determine the distribution of market prices ofresidential land in DKI Jakarta over the past three years. The purpose of this research is to compileas large a distribution of market prices as possible so as to be able to analyze the prices of landrelegated specifically for housing development. The areas targeted for study are the locations forhousing development in the newly developing parts of DKI Jakarta. These locations will be chosenfrom the various kelurahan of the city.
The people we will be questioning are those who have wide experience with prices, landquality, and the administration of land sales, that is, market intermediatries or brokers. Brokersusually maintain connections with each other within specific locations of their work, such as onekelurahan or more. Every kelurahan office contains land transaction records; however these statedprices are usually lower than the true market prices. At these offices you may also be able to obtaina list of names and addresses of brokers from the Lurah.
Kelurahan will be selected for study on the baseis of an examination of maps, visualsurveys, and information from the people being interviewed. Criteria for the selection of kelurahanwill b ewhether they show signs of recent development of housing and whether empty land may stillbe found for the development of settlements.
After a list of kelurahan is selected and the names of brokers are obtained for eachkelurahan, the surveyor will contact the first person on the list and ask him the set of qualifyingquestions. If his answers to these questions are satisfactory (indicating that he has worked as a landbroker for a sufficient length of time, etc.), he will then be asked to appraise typical land plots withcertain characteristics. If the broker's responses to the qualifying questions are unsatisfactory, he willnot he asked the appraisal questions, and the next broker on the list will be contacted. This processwill continue until three land brokers have been independently interviewed in that kelurahan. Theprocess will be repeated until more than 100 kelurahan are studied.
It is important that when a land broker is questioned, he understands that the plots he isappraising are only typical plots that he is asked to imagine, and not real plots. If the broker believesthat the interviewer wants to know the price of real lots, he may assume that the interviewer isinterested in buying the land, and therefore the price the broker gives may be inflated.
A number of characteristics distinguish the types of plots that will be asked about (asdiscussed below). However, for the sake of keeping to a minimum the variables that may affect theprice of land, we should explain to the broker who is being interviewed that all plots that are askedabout share the following standard characteristics:

55
1. They are located on streets that only have residential uses, and no businesses.2. They are located in the middle of a block and not at a more expensive corner
location.3. The street width for all plots that are asked about is assumed to be approximately
3 meters.4 There are no buildings existing on the plots.5. A plot is purchased in a single payment and not bought on credit extended by the
seller.
After three brokers have been interviewed in a particular kelurahan, the middle valueof the three responses will be chosen as the representative land price for that kelurahan, rather thancalculating an arithmetic mean. The reason for this is that we can assume that in at least a few casesone of the broker's responses may be exceptionally high or low (i.e., outliers). By choosing themiddle value of the three brokers' responses, we avoid the negative effects that such outliers haveupon the data, whereas calculating an arithmetic mean would include such biases.
B. Variables
Values for the following variables are to be obtained from these questions:
Y = Price of land (rupiah per square meter).
XI= Location (distance from city center-Monas). This is a variable that will be basedon the list of the selected kelurahan, that is, the location (kelurahan) where the broker operates. Thisinformation will be checked in the qualifying questions. The distance will be measured from a mapof the city.
X2= Plot Size. Values chosen for plot size are:1. 100 square meters2. 1000 square meters3. 2000 square meters
X3= Land Quality. From initial interviews, it has been determined that,the quality ofinfrastructure that is available at a particular plot is by and large not a consideration in determiningprice. The major exception to this is the accessibility of the plot (i.e., the distance to a paved road);to some extent the quality of the plot is also determined by the plot's susceptibility to flooding andthe quality of water available on the plot. Three classes of quality are used here; these generallycorrespond to classes of land quality that are used by land brokers in Jakarta. These classes are usedinformally by the brokers and undoubtedly the precise definitions of each will not be consistentthroughout the city. Nonetheless, if we base our definitions of categories on those used by the brokers,communication during the interviews will be enhanced. The categories are defined as follows:
Class I: The plot is located within 50 meters of a paved road, and is near other plotsthat have already been developed. There is a low probability of floodingand good-quality water may be obtained on the plot.
56
Class II: The plot is located approximately 200 meters from the road, and there arefewer developed plots nearby. There is a greater likelihood of flooding(although it is still low), and usable water may still be obtained on the plot.
Class [II: The plot is more than 500 meters from the main road and there are rarelyother developed plots nearby. There is a good likelihood that the plot willflood during the rainy season, and the quality of obtainable water may beless than satisfactory. (Note: this class of quality may not apply in all of theareas being surveyed.)
X4= Tenure Type. Three categories of tenure type will be examined here. Thedistinction between the three categories is the strength of the buyer's ability to claim freehold (i.e.,Hak Milik) status for the land. Among the various claims to land rights that exist in Indonesia, theofficial recognition of Hak Milik status may be surmised to be the claim to land that has the greatesteffect on the price of land. The first category is a certificate from Agraria (BPN), which gives thebuyer the most secure claim of Hak Milik status. The second category includes sufficient Girik (taxreceipt) certificates in the transfer of land to allow a claim of Hak Milik status to be made on the land.This is referred to here as Hak "Girik." The third category consists of all other claims to land that areweaker than Hak Milik. In brief, the categories are:
1. Hak Milik, which is guaranteed by a certificate from Agraria.2. Hak "Girik," which is sufficient to attain Hak Milik status.3. Less than Hak Milik status.
U. Questions
Instead of asking a series of specific questions, the interviewer is to have a conversationwith the land broker. There are too many different types of plots to ask for information on each oneseparately. Not all of the combinations will make sense to the land broker (i.e., there may be no suchthing as a 100-square-meter, Class III lot with an Agraria certificate in that kelurahan). Furthermore,we are asking for an appraisal of land value, and not an opinion; the answers that the land brokersgive must be based on knowledge derived from experience. Do not press the broker for an answerthat you or they do not feel sure of. It is acceptable for squares on the recording sheet to be filled with"Doesn't Know.")
Here is an example of a conversational approach to the interview: Since you are familiarwith the prices of plots in (name of area of study), you are a good person to ask about the prices ofcertain types of plots for building houses on. If a typical buyer, one without connections such asfamily ties, came to a land seller in this area and wanted to buy a 100-square-meter plot of empty landwith a Class III quality of land (give definition of quality classes as explained above), how would hebe expected to pay if he was not able to make a claim of Hak Milik? How much would he pay if hereceived sufficient "Grik" to make a claim of Hak Milik status? Or an Agraria Class II quality, butthe buyerwas not able to claim Hak Milik status? (This line of questioningwould be repeatedforeachplot size, and then for each of the past two years, 1988 and 1987). The broker would then be askedabout other kelurahan that he had said he had experience in.)

57
Jakarta Land Price Survey Recording Sheet
Qualifying questions (concerning Broker's Expenses)
Interview date Name of Interviewer
Number Name of Kecamatan
Yes No
1. How long have you worked as a land broker?More than five years?
2. Approximately what percentage of your income was derived from yourwork as a broker within Jakarta between July 1888 and July 1989?More than 50 percent?
3. Approximately what percentage of your income was derived from yourwork as a broker within Jakarta between July 1887 and July 1988?More than 50 percent?
4. Approximately what percentage of your income was derived from yourwork as a broker within Jakarta between July 1886 and July 1987?More than 50 percent?
5. Are the majority of lands you deal with used for building houses or forother uses?Majority for building houses?
6. Are the majority of lands you deal with empty land or plots withbuildings or houses? What percentage of the land sales you have beeninvolved in involve truly empty land?More than 50 percent?
INTERVIEWER: If ail the questions were answered YES, proceed with the interview. If there was a questionwhich was answered NO, do not continue the interviews.

58
Jakarta Land Price Survey Recording Sheet
Questions for ascertaining the location of brokers operations.
Interview date Name of Interviewer
Number Name of Kecamatan
Name of Kelurahan
1. In which kelurahan in Jakarta did you work as a land broker between July 1988 and July 1989. Please list below.
2. In which kelurahan in Jakarta did you work as a land broker between July 1987 and July 1988. Please list below.
3. In which kelurahan in Jakarta did you work as a land broker between July 1987 and July 1988. Please list below.
INTERVIEWER: Proceed with a set of appraisal questions for each kelurahan which Is listed for all three yearm

59
Jakarta Land Price Survey-Recording Sheet
Interview date Name of li.terviewer
Number Name of Kecamatan
Name of Kelurahan
Plot Size lOOm2 Price: x Rp. 1,000
1989 Land Quality
Tenure (Land Right) Class I Class II Class III
Agraria Certificate
Girik Receipts
Weak Claim
1988 Land Quality
Tenure (Land Right) Class I Class II Class III
AgrariaCertificate
Girik Receipts
Weak Claim
1987 Land Quality
Tenure (Land Right) Class I Class 11 Class III
Agraria Certificate
Girik Receipts
Weak Claim

60
Jakarta Land Price Survey-Recording Sheet
Interview date Name of Interviewer
Number Name of Kecamatan
Name of Kelurahan
Plot Size 1,000m2 Price: x Rp. 1,000
1989 Land Quality
Tenure (Land Right) Class I Class 11 Class IIl
Agraria Certificate
Girik Receipts
Weak Claim
1988 Land Quality
Tenure (Land Right) Class I Class 11 Class III
Agraria Certificate
Girik Receipts
Weak Claim
1987 Land Quality
Tenure (Land Right) Class I Class 11 Class III
Agraria Certificate
Girik Receipts
Weak Claim

61
Jakarta Land Price Survey-Recording Sheet
Interview date Name of Interviewer
Number Name of Kecamatan
Name of Kelurahan
Plot Size 2,000m2 Price: x Rp. 1,000
1989 Land Quality
Tenure (Land Right) Class I Class 11 Class III
Agrafia Certificate
Girik Receipts
Weak Claim
1988 Land Quality
Tenure (Land Right) Class I Class 11 Class III
Agraria Certificate
Girik Receipts
Weak Claim
1987 Land Quality
Tenure (Land Right) Class I Class II Class III
Agraria Certificate
Girik Receipts
Weak Claim
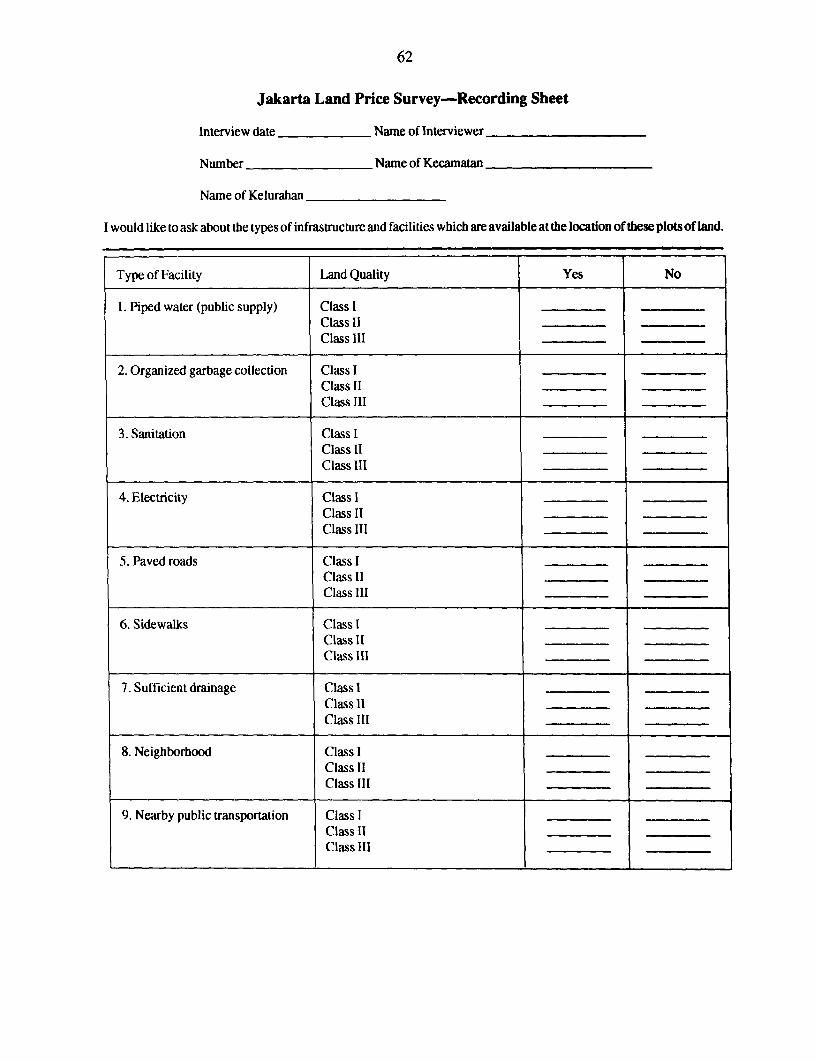
62
Jakarta Land Price Survey-Recording Sheet
Interview date Name of Interviewer
Number Name of Kecamatan
Name of Kelurahan
I would like to ask about the types of infrastructure and facilities which are available at the location of these plots of land.
Type of Facility Land Quality Yes No
1. Piped water (public supply) Class IClass 11Class III
2. Organized garbage collection Class I1Class 11Class III
3. Sanitation Class IClass 11Class III
4. Electricity Class IClass 11Class III
5. Paved roads Class IClass 11Class III
6. Sidewalks Class IClass 11 .Class Il1
7. Sufficient drainage Class IClass 11Class III
8. Neighborhood Class IClass 11Class Ill
9. Nearby public transportation Class IClass 11Class Il1

ANNEX B: The Use of Satellite Images for Urban Planning
B1.1 Effective urban planning requires access to accurate and continually updated informa-tion conceming the changing conditions of urban areas. Unfortunately, in most cities of thedeveloping world accurate and up-to-date data on land use are not available, making the planning andprogramming of infrastructure difficult. Originally, remote sensing using satellite media was notsuitable for urban applications because of the relatively poor resolution provided (80 meters by 80meters). Satellite images such as LANDSAT, have been generating land resource data over the past16 years for such purposes as agriculture, forestry, and mining, but until recently the resolution wasnot sharp enough for urban use. A new generation of remote sensing systems with resolutions equalto 10 meters by 10 meters in pan chromatic mode and 20 meters by 20 -meters in multispectral modehas now made urban applications possible. Since 1989 Spot I, a satellite financed by France, Belgiumand Sweden, has been sending images with eight times the spatial resolution of LANDSAT and othercivilian satellites. Spot's resolution is generally adequate for urban planning applications as itroughly captures most urban features of concern: such as streets, buildings, and plot layoutboundaries.
B1.2 In addition, advancements in microcomputers and related hardware and software havemade the urban applications of remote sensing much more affordable and accessible to urbanplanners, engineers, and policy makers. These new technological advances now provide a relativelyinexpensive solution to some of the problems of charting urban change in fast-growing cities of thedeveloping world.
B1.3 The SPOT satellite is in continuous orbit and provides up-to-date images of citiesaround the world. Changes can be detected by purchasing two images covering two points in time.The images can be accessed commercially without the lengthy security clearances needed for aerialphotography. It normnally takes about 30 days to obtain a satellite image. One image covers about 60square kilometers. In some cases, the satellite can be programmed to obtain special images such asstereographic pairs and composite images of an area normally requiring two separate images.
B 1.4 Film or transparency of an image can be enlarged through normal photographicprocesses to scales of 1 :100,000 down to 1:20,000. The cost of one pan chromatic (black and whiteimage) is approximately US$1,600, far less than a set of aerial photographs.
B 1.5 Prints of SPOT images at 1:100,000 scale can be used to identify major road networks.At a scale of 1:25,000, dense and loose grid patterns of various types of housing settlements can bedifferentiated, such as those illustrated in Figure B 1-1. Industrial and commercial areas can also beidentified as well.
B1.6 For further information on using SPOT images for land use planning, see Bertaud(1989).

64
Figure BI-l. Different types of residential development in Karachi, Pakistan.
Type A (Katchi Abadi) Type B (City Center)Squatter Settlement HIGH DENSITY
Aveage plot size(m2) 75 Average plot size(m2 ) 90No. of persons/plot 6.5 No. of persons/plot 8.5Percent circul. Percent circul.& open space 25 & open apace 25Density persons/ha 650 Density persons/ha 625
Type C (North-East Karachi) Type D (North Karachi)MEDIUM DENSITY LOW DENSITY
Average plot size(m2 ) 150 Average plot size(m2 ) 350No. of persons/plot 6.5 No. of persons/plot 6.5Percent circul. Percent circul.& open space 40 & open space 45Density persons/ha 260 Density persons/ha 102

ANNEX C: BANGKOK HOUSING PROJECT SURVEY
1. Name of Surveyor
2. Date of Interview
3. Project Name
4. Project address (street name and/or intersection)
5. Name of project person interviewed
6. How many years has interviewee worked at project?
7. Telephone number of person interviewed
8. Location of project (name of district and kwaeng)
9. What is the size of the project in rat?
10. What is the total number of housing units to be built in the project?
11. Will the project contain commercial and office uses? If yes, please describe them in terms of use and constructed area(square meters).
12. Describe the features of the project. Whatamenitiesdoes theprojectcontain?: >tenniscourts, swimming pools, othersports facilities, parks, fishponds, schools, temples, shopping areas, post offices, etc. List each feature.
13. What is the source of drinking water for the project? Deep tube wells for entire project? Municipal water? Individualwells for each house?
14. What kinds of infrastructure are provided for the project? In terms of electricity, telephone, sewerage treatment (sewerlines to municipal system of septic/cesspools)
15. How far is the project from the center of Bangkok (Hua Lampong railroad station) in kilometers?
16. How far is the project from the nearest major road (Thanon)?

66
17. Is there public transportation from the project to major employment and industrial centers in Bangkok?
18. If there is public transportation, how far is the nearest bus stop from the project?
19. In what month and year did the project start marketing housing units in the project? (use western calendar)
20. What are the sources of mortgage financing available to buyers? List banks providing mortgages to project buyers.
21. What are the terms of mortgage financing?A. Minimum down payment percentageB. Interest rateC. Length of time for mortgage to be repaid in months (for example, 180)
22. Provide a detailed breakdown of the types of housing units offered for sale in the project.
Type I Type 2
Bedrooms/Baths Bedrooms/Baths
Stories Stories
House size m3 House size m3
Plot size wa2 Plot size wa2
Detached/condo/townhouse Detached/condo/townhouse
Number of units in type Number of units in type
Sales price of type Sales price of type
Type 3 Type 4
Bedrooms/Baths Bedrooms/Baths
Stories Stories
House size m3 House size m
Plot size wa2 Plot size wa2
Detached/condo/townhouse Detached/condo/townhouse
Number of units in type Number of units in type
Sales price of type Sales price of type

67
Type 5 Type 6
Bedrooms/Baths Bedrooms/Baths
Stories Stories
House size m3 House size m3
Plot size wa2 Plot size wa2
Detached/condo/townhouse Detached/condo/townhouse
Number of units in type Number of units in type
Sales price of type Sales price of type
Type 7 Type 8
Bedrooms/Baths Bedrooms/Baths
Stories Stories
House size m3 House size m3
Plot size wa2 Plot size wa2
Detached/condo/townhouse Detached/condo/townhouse
Number of units in type Number of units in type
Sales price of type Sales price of type
23. Since the start of marketing, what is the total number of units sold for each type of unit?
Type 1Type 2Type 3Type 4Type 5Type 6Type 7Type 8
24. During the past month, how many units of each type have you sold in the project?
Type IType 2Type 3Type 4
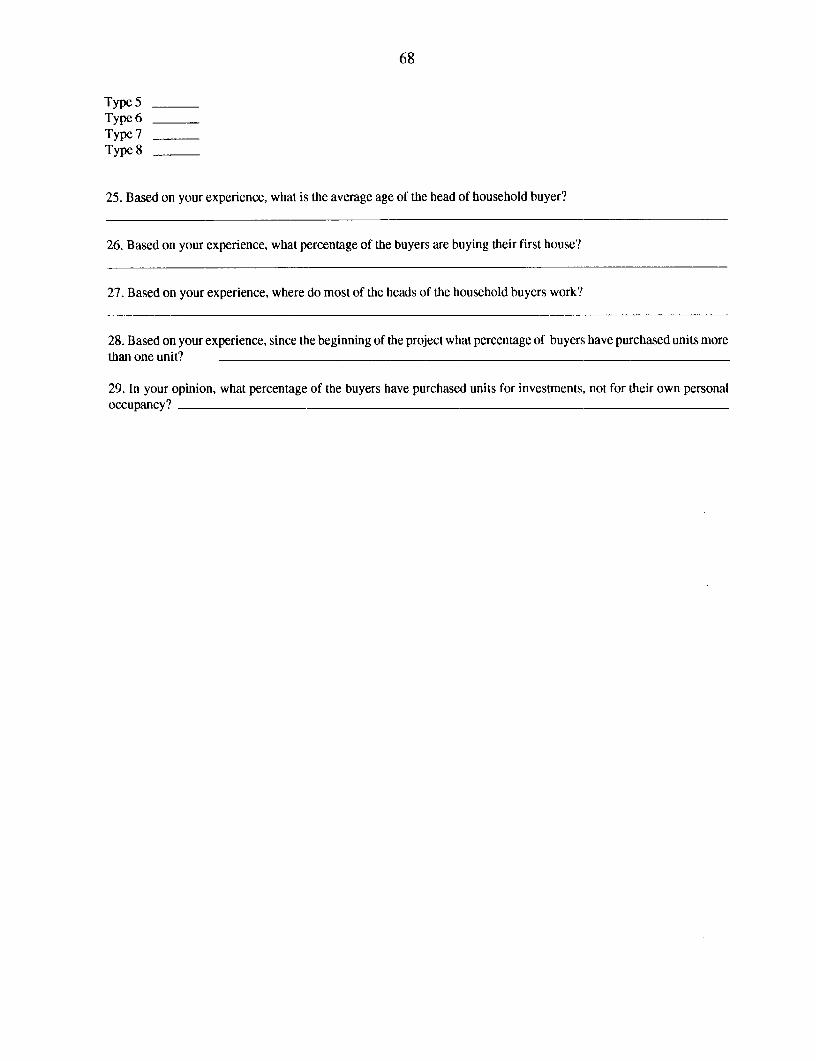
68
Type 5Type 6Type 7Type 8
25. Based on your experience, what is the average age of the head of household buyer?
26. Based on your experience, what percentage of the buyers are buying their first house?
27. Based on your experience, where do most of the heads of the household buyers work?
28. Based on your experience, since the beginning of the project what percentage of buyers have purchased units morethan one unit?
29. In your opinion, what percentage of the buyers have purchased units for investments, not for their own personaloccupancy?

Distributors of World Bank PublicationsARGENTINA The Middle East Obsrrver KENYA SINGAPORE TAIWAN,Carlo Hirsch. SRL 41.ShenlStreet Afnca BookService(E.A) LtdL MYANMAR,RUNEIGalea Guemes Cairo Quaran House Mfinganog Sot Gower Asia Pacfic Pt LAd.Flonda 165. 4th Floor-Oft. 453,/465 P.O. Box 45245 Golden Wheel Bulding1333 Buenos Aires FINLAND Nairobi 41 allang Pudding 004-03
Akateermnen Kirjakauppa Singaporm 1334Oficina del Ubro Entenwbioal P.O. Box 128 KOREA, REPUBLIC OFAlbern 40 SF-0101 HesWki 10 Pan Korea Book Corporstion SOUTH AFRICA. BOTSWANA1082 Buenos Airs P.O. Box 101, Kwangwhamun For sngle tbtis:
FRANCE Seoul Oxford University PrmAUSTRALIA, PAPUA NEW GUINEA, World Bank Publica ON Southem AfricaFiji, SOLOMON ISLANDS, 66. avenue d'itna Daeon Trding Co. Ltd. P0. Box 1141VANUATU, AND WESTERN SAMOA 75116 Pans P.O. Box 34. Yowdo CapeTown81800DA. Informnaton Services Seoul648 Whitehorse Road GERMANY For subscription ordrlMitcham 3132 UNO-Vertag MALAYSIA Intemaonal Subscription ServiceVictoria Poppelsdorfcr All" 55 University of MaiayaCoopntive P.O. Box 41095
33115 Bonn Bookshop, Lmited CraighallAUSTRIA P.O. Box 1127, Jalan Pantal Baru Johannesburg 2024Genold and Co. GHANA 59700 Kuala LuinpurGraben 31 Greenwich Mag. and Books SPAINA-0l11Wien Rlven BeachHotd MEXICO Mundi-PrensaUbros,S.A.
PO Bo. 01198 INFOTEC Castello 37BANGLADESH Osu-Arcra Apartado Postai 22-60 28001 MadridMicroIndustries Development 14060ThIlpan.Mex D.F.
Assstance Society (MIDAS) GREECE Libmera Intemacional AEDOSHouse 5. Road 16 Papawotinou S.A. NETHERLANDS Consell de Cent 391Dhanmondi R/Ar,a 353 Stournar Str. De Lindeboorn/lnOr-Publkaties 08009 BarcelonaDhaka 1209 106 62 Athens P.O. Box 202
7480 A_l Haaksbergen SRI LANKA AND THE MALDfVESBELCIUM HONC KON4 MACAO Lake House BookshopJesn De Lannoy Asia 2000 Ltd. NEW ZEALAND P 0. Box 244Av. du Roa 202 46-48 Wyndhamn Strt EBSCO NZ Ltd. 100. Sir Chittampalam A.1060 Brussels Winning Cnt Private Mail Bag 99914 Gardiner Maiatha
7th Floor New Market Colombo 2BRAZIL Centrai Hong Kong AucklandPubliuacoes Tecnicau Intemaconais Ltda. SWEDENRua Peioto Gomidt, 209 HUNGARY NIGERIA FritesCustomer Service01409 Sao Paulo. SP Foundaton for Market Ecornmy University Pm.s Lirmted S-106 47 Stockholm
Dornbovari Ut 17-19 Three Crowns Building JerichoCANADA H-1117Budapes Private Mail Bag 095 Wennergren-Williains ABLa Diffuseur Ibadan P.O Box 1305151A Boul. de Mortago INDIA S-17125 SolnaBouchervill Qutbec AUied Publishers Ltd. NORWAYJ4B 3E6 731 Mount Road Narveon Informatlon C ntwr SWITZERLAND
Madras - 60O 002 Book Deportment Ubra rie PayotRenouf Publishing Co. P.O. Box 6125 Ettesntd Case postalu 32121294 Algorna Road INDONESIA N-602 Oslo 6 CH 1002 LausarawOttwa. OQnt no Pt. Indua LiritedKIB3W8 Jalan Borobudur20 PAKISTAN Van Diernan Editions Tedunques-ADECO
P.O. Box 1181 MUrza Book Agency P.O. Box 463CHINA Jakarta 10320 65, Shahrmh-Quald--Azstm CH 1211 Geneva 16China Funanial & Econormic PO. Box No. 729
PublishLngHouse IRAN LAhore 54000 TANZANIAB, Da Fo Si Dong lie Kowkab Publishers Oxford University PreBeijing POl Box19f75-511 OxfordUnivemityP Pms MaktabaStreet
Tehrmn P.O. Box 13il33 P.O. Box 5299COLOMBIA Karahi - 7330 Dar es SalamnWoenlace Ltda. IRELANDApartado Aereo 34270 Government Supplie Agcy PERU THAILANDBogota DO. 4-5 Harcourt Road Editorial D frfollo SA Central Departmet Stonr
Dublin 2 Apartado 3824 306 Silom RoadCOTE D'IVOIRE Lima I BangkokCentre d'Edition et de Diffusion ISRAEL
Africains (CEDA) Yozmot Linmtert Ltd. PHILIPPINES TRINIDAD &TOBAGO04 B.P 541 P.O. Box 56055 Intemational Book Centr Systematics Studie UUnitAbidpan 04 Plamtu Tel Aviv 61560 Suite 1703, Cltytand 10 09 Watts Siestt
Condominium Tower I CUrpTCYPRUS ROY. International Ayala Avenue, H.V. dits Trinidad. West IndisCenter of Applied Resrdh PO.B. 13036 Costa ExtonatonCyprus College Tel Aviv 61130 Malan. Metro Manila UGANDA6. Diogenes Street Engoni Gustro Ltd.P0. Box 2006 Palestinian AauIetwhi East POLAND Ist Floor. Room 4, Gaogids ChsabexnNicosi P.O. Box 19502, Juaakm Intemationsl Publishng Svi P.O. Box 9997
UL. Ptekna 31/37 Plot (69) KampalaCZECH REPUBLIC ITALY 00Ul WarsiPt)sNational InWormation Center Licosa Co mn ia SuSiSPA UNITED KINGDOMP.O. Box 668 Via Duca Di Calabria, I1/ PORTUGAL Microinfo Ltd.CS-1 1357 Prague I Catltla Posta 352 Livraria Portul P.O. Box 3
50125 Firenaz Rue Do Canre 70-74 Alton. Kaonpshin GU34 2PCDENMARK 1200 Liabon EnglandSamhundLtsUtnt r JAMAICARosenoers Alliu LI Ian Randle Publisher Lid. SAUDI ARABIA. QATAR ZAMBIAOK-1970 FrdernabrgC 206 Old Hope Road Jarr Book Store Uniersity of Zambia Bookahop
Kingston 6 P.O. Boo 3196 Great East Road CampusDOMINICAN REPUBUiC Riah141P.O Bo. 32379Editora TaUer. C. por A. JAPAN LusalaRestau-ac6n e lsabel LI Catlica 309 Eastern Book Serve SLOVAK REPUBLICApantdo de Corros 2190 Z-1 Hongo 3-Choirs.. Bunkyo-ku 113 Slovart C.TG Ltd. ZIMBABWESanto Doopungo Tokyo Krupauka 4 Longiman Zimbabwe (Pvc) Ltd.
PO. P Box 152 Tourte Road, ArdbunnictEG'YPT, ARAB REPUBLUC OP BSZW"Bxanalavas P0O Box ST 123Al Ahrn SouthertonAl Gal Strm HarareCairo


/ ManagemeniProgramme
Current UMP publications:
OMP I Property Tax Reform: Guidelintes and Recotmmnendations. William Dillinger.
UMP2 Energy Environiment Linkages in the Urban Sector. Josef Leitmann.
UMP 3 Alternative Approaches to Pollutioni Control and Waste Managemient: Regu-latory and Econiomitic Instrumiienits. Janis D. Bernstein.
UMP 4 The Land Market Assessmientt: A Nez' Tool for Urbani Managemient. David E.Dowall.
UMP5 Reforinig Llrban Land Policies and Institiutionis in Developing Countries.Catherine Farvacque, l'atrick McAuslani.
IMP 6 A Review of Enviroinneittal Healti Imnpacts in Developing Count rtt Cities.D)avid Bradley, Carolyn Stephens, [Irtuldy I larpilalil, Sandy Cairncross.
UMP 7 A Franmiework for Reforming Urban Land Policies in Developinig Countrics.David E. Dowall, Giles Clarke.
IMP B Conditions de inise en1 place des si st0nes d'in formationt fonciere dnits lcs villesd'Afriquc sud-saharienne francoplh(ne. Alai n Durand Lasserve.
UMP9 Urban Applications of Satellite Remiote Sensing and GIS Analysis. BengtPaulsson.
UMP 10 Utility Mapping anid Record Keeping for Infrastructure. David Ilickering,Jonathan M. Park, David H. Bannister.
IMP 11 Elements of Urban Management. Kenneth J. Davey.
UM12 Land Use Considerationis in Urlun Environmental Management. Janis D. Bernstein.
UMP 13 Private Sector Participation in Mu nicipal Solid Waste Services in DevelopingCountries: Vol. 1. Thte Formal Sector. Sandra Cointreau-Levine.
UMP 14 Rapid Urban Enviroti nien tal Assessmtenit: Vol. 1. Methodology and PrelitmiiiaryFindinigs. Josef Leitmann.
UMP 15 Rapid Urban Environmental Assessmnenit: Vol. 2. Tools and Outputs. JosefLei tmann.
UMP 16 Decenitralizationt and Its Itmtplications for Urban Service Delivery. WilliamDillinger.
UMP 17 Strategic Options for Urban Infrastructure Managenment. William F. Fox.
UMP 18 Toward Environmental Strategies for Cities: Policy Considerations for UrbanEnvirotinienital Mauage7menit in Developing Countries. Carl Bartone,Janis D. Bernstein,Josef Leitmann, Jochen Eigen.
UMP Worhing Papel Ho. 1 Environimienital Ilnnovation and Maniagemienit in Curitiba, Brazil.Jonas Rabinovitch, Josef Leitmnann.
UMP WorhingPper P o.N2 The Life Cycle of Urban Ilinovations. Elwood M. Hopkins.
For more information about UMP materials, contact:
UMP CoordinatorTechnical Cooperation DivisionUnited Nations Centre for Human Settlements (Habitat)P.O. Box 30030Nairobi, KenyaTelephone: 254-2-623218/623207
Facsimile: 254-2-624264/624266
\Lii' * ! S FZ* , . . n ',
w w w ;;E 5 ,~~~~I . !6 - *
*S 5' 3 li .*6
.~~~~~~~~ ~~~~ ~~ .l 3* 66 6 _
3 ~~ e* * 5 . *.* '5. Ll *s ga .c ! .
4~ ~ ~ * S* . * I . * Ss ***i6!
4 ~ ~~~ 6l . !56 :..I. . : !!
6 666 .* *:e ._I .:
. ~ ~~~ . .. 66 , 96 6 6
C;~~~~~~~~~ 6;! 1
'I~~~~~~~~~~** 155 3;, .
I~~~ ~~~~~~~~~~~~ *s; is.tG .! . * .6a9
1 ! ! t ~~~~~~~. !*1|^~~~~~~~~~~~~~~~~~~~~~~~~~~~~~~~~~~~~~~ 6 6 U:i6SU
3 L, 33 j S ; . .! I~~~~~~ 6: .