world bank documentdocuments.worldbank.org/curated/en/997201498874510564/pdf/ghana... · education...
TRANSCRIPT

Document of
The World Bank
FOR OFFICIAL USE ONLY
Report No: PAD 2416
INTERNATIONAL DEVELOPMENT ASSOCIATION
PROJECT PAPER
ON A
PROPOSED ADDITIONAL FINANCING CREDIT
AND RESTRUCTURING
IN THE AMOUNT OF SDR 28.9 MILLION
(US$40 MILLION EQUIVALENT)
TO
THE REPUBLIC OF GHANA
FOR THE
SECONDARY EDUCATION IMPROVEMENT PROJECT
June 6, 2017
Education Global Practice
Africa Region
This document has a restricted distribution and may be used by recipients only in the
performance of their official duties. Its contents may not otherwise be disclosed without World
Bank authorization.
Pub
lic D
iscl
osur
e A
utho
rized
Pub
lic D
iscl
osur
e A
utho
rized
Pub
lic D
iscl
osur
e A
utho
rized
Pub
lic D
iscl
osur
e A
utho
rized

i
CURRENCY EQUIVALENTS
(Exchange Rate Effective 5/31/2017)
Currency Unit = New Ghanaian Cedi (GHS)
US$1.00 = GHS 4.305
SDR 1 = US$1.384320
FISCAL YEAR
January 1 – December 31
ABBREVIATIONS AND ACRONYMS
AF Additional Financing
BECE Basic Education Certificate Examination
CAGD
CSSPS
Controller and Account General Department
Computerized School Selection and Placement System
DLI Disbursement-Linked Indicator
DLR Disbursement-Linked Result
EEP Eligible Expenditure Program
ESMF Environmental and Social Management Framework
GDP Gross Domestic Product
GER Gross Enrollment Rate
GES Ghana Education Service
GIFMIS Ghana Integrated and Financial Management Information System
GLSS Ghana Living Standards Survey
GoG Government of Ghana
GSS Ghana Statistical Service
ICT Information and Communication Technology
IFR Interim Financial Report
IPF Investment Project Financing
IUFR Interim Unaudited Financial Report
JHS Junior High School
M&E Monitoring and Evaluation
MDG Millennium Development Goal
MOE Ministry of Education
MS4SSA Math and Science for Sub-Saharan Africa
NER Net Enrollment Rate
NITA National Information Technology Agency
PDO Project Development Objective
PIM Project Implementation Manual
PPSD Project Procurement Strategy Development
PTA Parent Teacher Association
RAP Resettlement Action Plan
RBF Results-based Financing
RF Results Framework

ii
RPF Resettlement Policy Framework
SDG Sustainable Development Goal
SEIP Secondary Education Improvement Project
SHS Senior High School
SPP School Performance Partnership
SPPP School Performance Partnership Plan
TA Technical Assistance
TIC Technical Implementation Committee
TVI Technical and Vocational Institution
WASSCE West Africa Senior Secondary Certificate Examination
Regional Vice President: Makhtar Diop
Country Director: Henry G. R. Kerali
Senior Global Practice Director:
Practice Manager/Manager:
Jaime Saavedra-Chanduvi
Halil Dundar
Task Team Leaders: Deborah Newitter Mikesell/ Eunice Yaa
Brimfah Ackwerh

iii
GHANA
SECONDARY EDUCATION IMPROVEMENT PROJECT ADDITIONAL FINANCING
CONTENTS
Project Paper Data Sheet
Project Paper
Additional Financing Data Sheet 1
I. Introduction 6
II. Background and Rationale for Additional Financing 8
III. Proposed Changes 19
IV. Appraisal Summary 27
V. World Bank Grievance Redress 33
Annex 1: Results Framework 34
Annex 2: Table on Disbursement-Linked Indicators and Disbursement-Linked Results and Verification
Protocol for SEIP and SEIP AF 40
Annex 3: Updated Economic and Financial Analysis 58
Annex 4: Updated Fiduciary Arrangements (including Eligible Expenditure Program) 70
MAP -IBRD 33411 78
1
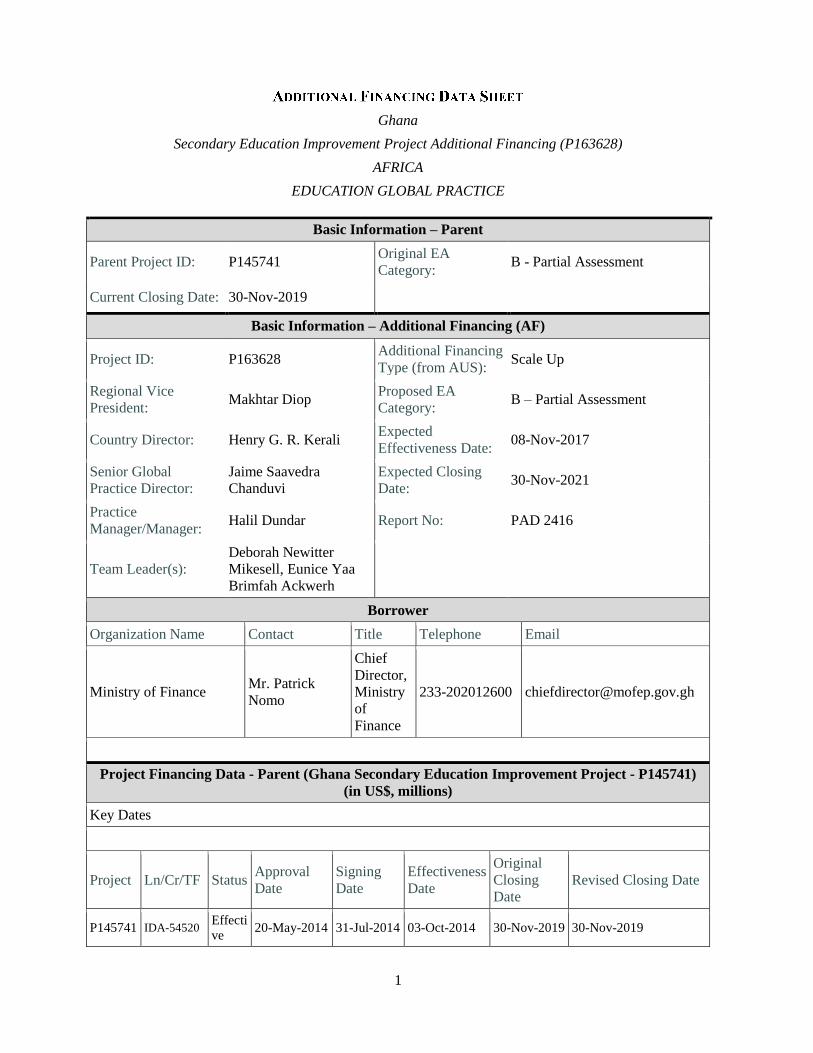
Ghana
Secondary Education Improvement Project Additional Financing (P163628)
AFRICA
EDUCATION GLOBAL PRACTICE
Basic Information – Parent
Parent Project ID: P145741 Original EA
Category: B - Partial Assessment
Current Closing Date: 30-Nov-2019
Basic Information – Additional Financing (AF)
Project ID: P163628 Additional Financing
Type (from AUS): Scale Up
Regional Vice
President: Makhtar Diop
Proposed EA
Category: B – Partial Assessment
Country Director: Henry G. R. Kerali Expected
Effectiveness Date: 08-Nov-2017
Senior Global
Practice Director:
Jaime Saavedra
Chanduvi
Expected Closing
Date: 30-Nov-2021
Practice
Manager/Manager: Halil Dundar Report No: PAD 2416
Team Leader(s):
Deborah Newitter
Mikesell, Eunice Yaa
Brimfah Ackwerh
Borrower
Organization Name Contact Title Telephone Email
Ministry of Finance Mr. Patrick
Nomo
Chief
Director,
Ministry
of
Finance
233-202012600 [email protected]
Project Financing Data - Parent (Ghana Secondary Education Improvement Project - P145741)
(in US$, millions)
Key Dates
Project Ln/Cr/TF Status Approval
Date
Signing
Date
Effectiveness
Date
Original
Closing
Date
Revised Closing Date
P145741 IDA-54520 Effecti
ve 20-May-2014 31-Jul-2014 03-Oct-2014 30-Nov-2019 30-Nov-2019

2
Disbursements
Project Ln/Cr/TF Status Currency Original Revi-
sed
Cancelle
d
Disbur-
sed Undisbursed % Disbursed
P14574
1
IDA-
54520
Effect
ive XDR 101.00
101.0
0 0.00 58.77 42.23 58.19
Project Financing Data - Additional Financing for the (Secondary Education Improvement Project
Additional Financing - P163628) (in US$, millions)
[ ] Loan [ ] Grant [ ] IDA Grant
[X] Credit [ ] Guarantee [ ] Other
Total Project Cost: 40.00 Total Bank
Financing: 40.00
Financing Gap: 0.00
Financing Source – Additional Financing (AF) Amount
International Development Association (IDA) 40.00
Total 40.00
Policy Waivers
Does the project depart from the CAS in content or in other
significant respects? No
Explanation
Does the project require any policy waiver(s)? No
Explanation
Bank Staff
Name Role Title Specialization Unit
Deborah Newitter
Mikesell
Team Leader
(ADM
Responsible)
Senior Education
Specialist
Education GED13
Eunice Yaa Brimfah
Ackwerh
Team Leader Senior Education
Specialist
Education GED13
Thomas Kwasi
Siaw Anang
Procurement
Specialist
(ADM
Responsible)
Senior
Procurement
Specialist
Procurement GGO01
Charles John Aryee
Ashong
Procurement
Specialist
Senior
Procurement
Specialist
Procurement GGO01

3
Robert Wallace
DeGraft-Hanson
Financial
Management
Specialist
Sr. Financial
Management
Specialist
Financial
Management
GGO31
Michael Gboyega
Ilesanmi
Safeguards
Specialist
Social
Development
Specialist
Safeguards GSU01
Nightingale
Rukuba-Ngaiza
Counsel Senior Counsel Country Lawyer LEGAM
Ana Isabel Dos Reis
E Sousa Piedade
Abreu
Safeguards
Specialist
Consultant Environmental
Safeguards
GEN01
Janet Omobolanle
Adebo
Team Member Program Assistant Team assistant GED13
Mariam Nusrat Adil Team Member Operations
Analyst
Economist OPSPQ
Stephen Kwaku
Tettevie
Team Member Team Assistant Team Assistant AFCW1
Locations
Country First
Administrati
ve Division
Location Planned Actual Comments
GHANA Ashanti Adansi North
Adansi South
Ahafo Ano North
Ahafo Ano South
Amansie Central
Amansie West
Asante-Akim South
Atwima Mponua
Bosome Freho
Ejura Sekyedumase
Kumasi Metropolitan
Offinso Municipal
Offinso North
Sekyere Central
Sekyere Kumawu
Sekyere South
Brong Ahafo
Asunafo North
Municipal
Asunafo South
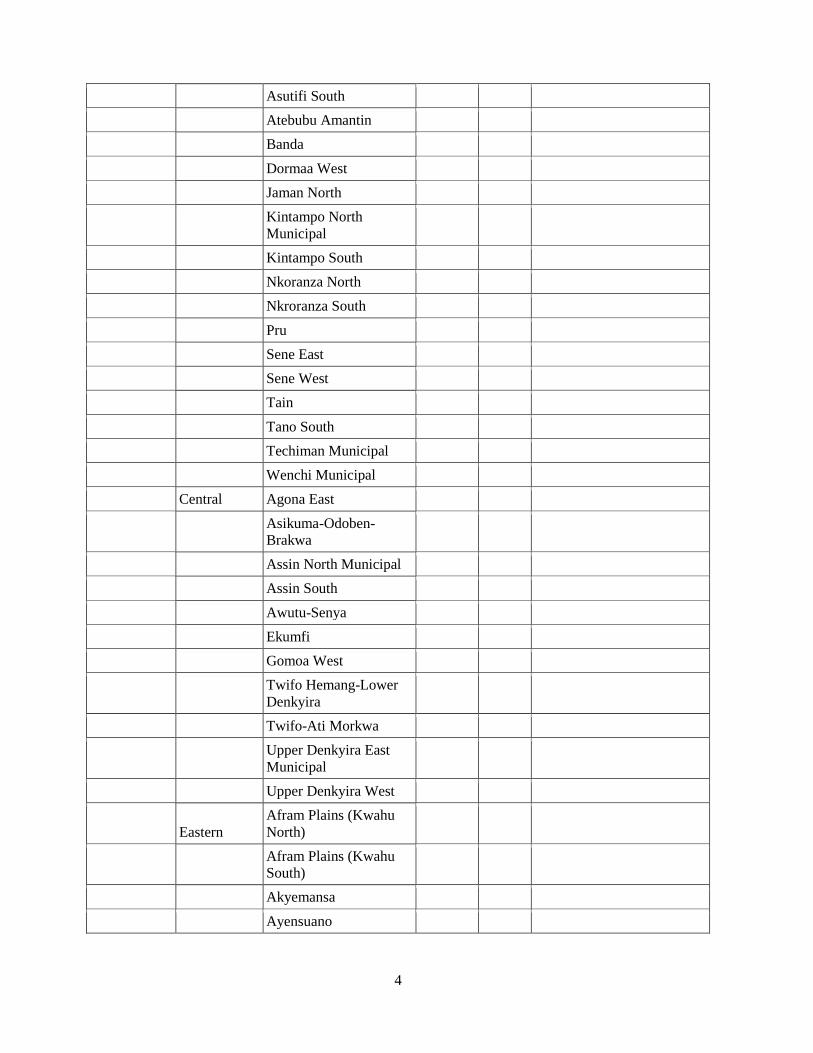
4
Asutifi South
Atebubu Amantin
Banda
Dormaa West
Jaman North
Kintampo North
Municipal
Kintampo South
Nkoranza North
Nkroranza South
Pru
Sene East
Sene West
Tain
Tano South
Techiman Municipal
Wenchi Municipal
Central Agona East
Asikuma-Odoben-
Brakwa
Assin North Municipal
Assin South
Awutu-Senya
Ekumfi
Gomoa West
Twifo Hemang-Lower
Denkyira
Twifo-Ati Morkwa
Upper Denkyira East
Municipal
Upper Denkyira West
Eastern
Afram Plains (Kwahu
North)
Afram Plains (Kwahu
South)
Akyemansa
Ayensuano

5
Upper Manya Krobo
Upper West Akim
Greater
Accra Accra Metropolitan
Northern Bole
Bunkpurugu-Yunyoo
Central Gonja
East Gonja
Gushiegu
Karaga
Kpandai
Nanumba North
Nanumba South
Saboba
Savelugu Nanton
Sawla-Tuna-Kalba
Tatale Sanguli
West Mamprusi
Upper East Bawku West
Bongo
Builsa North
Builsa South
Garu Tempane
Kassena Nankana East
Kassena Nankana West
Nabdam
Talensi
Upper West Daffiama-Bussie-Issa
Jirapa
Lambussie-Karni
Nadowli
Sissala West
Wa East
Volta Adaklu
Agotime Ziope
Akatsi North

6
Ketu South
Krachi East
Nkwanta North
Nkwanta South
North Tongu
Western Aowin
Bia West
Bodi
Juabeso
Nzema East
Prestea Huni Valley
Sefwi Akontombra
Suaman
Wasa Amenfi East
Wasa Amenfi West
Wassa East
Institutional Data
Parent (Ghana Secondary Education Improvement Project - P145741)
Practice Area (Lead)
Education
Contributing Practice Areas
Not applicable
Additional Financing for the Secondary Education Improvement Project Additional Financing -
P163628)
Practice Area (Lead)
Education
Contributing Practice Areas
Not applicable.
Consultants (Will be disclosed in the Monthly Operational Summary)
Consultants Required? Consulting services to be determined
1. This Project Paper seeks the approval of the Executive Directors to provide an
additional financing (AF) credit in the amount of SDR 28.9 million (US$40 million
equivalent) from IDA to the Republic of Ghana for the Secondary Education Improvement
Project (SEIP) (P145741) and to restructure the parent project. The SEIP is funded by an IDA

7
Credit in the amount of SDR 101 million (US$156 million equivalent). The SEIP was
approved on May 20, 2014, signed on July 30, 2014, and declared effective on October 3,
2014.
2. The proposed AF (P163628) would cover the costs associated with scaled-up activities
to enhance the impact of a well-performing project. The AF would extend project coverage to
additional low-performing secondary schools in the SEIP-targeted districts1 with the aim of
further increasing equitable access to and improving the quality of teaching and learning at the
secondary level. Funds would also be provided to cover the incremental management costs
and technical assistance (TA) activities associated with the expansion of activities under the
AF and the extension of the closing date of the parent project from November 30, 2019 to
November 30, 2021. The AF would help to achieve more fully the overall Project
Development Objective (PDO)—to increase access to senior secondary education in
underserved districts and improve quality in low-performing senior high schools (SHSs) in
Ghana. As with the original project, the proposed AF design is well aligned with the National
Education Strategic Plan (2016–2030) and the Ghana Country Partnership Strategy (CPS-
Report number 76369) (2013–2018). The AF aims to continue efforts to improve
competitiveness and job creation by increasing opportunities to build human capital through
post-basic education- one of the key pillars (Pillar 2) of the CPS.
3. Specifically, the proposed AF will provide support to implement activities under
Components 1 and 2. Under Component 1, the AF would support Results-based Financing
(RBF) for achievement of the following results:
(a) Increased utilized seats in existing low-performing schools (through additional
rehabilitation/expansion in selected schools and quality packages);
(b) Increased enrollment in beneficiary SHSs in targeted districts/schools for students
from low-income families, especially girls;
(c) Annual publication of school performance report/school mapping, online and in
print, to improve data management, monitoring, and information dissemination;
(d) 125 schools continue to receive school performance partnership (SPP) grants for
an additional 2 years; about another 1072 schools receive SPP grants for 3 years;
and
(e) Improved learning outcomes in selected SHSs measured through increased
number of information and communication technology (ICT) packages
implemented in beneficiary schools; increased numbers of teachers participating
1 Project districts were selected based on criteria related to the demand for senior secondary school places,
district poverty index, and the size of the school population. The bottom 100 districts (out of 216 total districts in
the country) were selected and schools within these districts were then identified based on their standardized
assessment scores and facilities assessment. The ranking of districts can be found in the Project Implementation
Manual (PIM). 2 About 107 schools, as the exact number is yet to be determined.

8
in mathematics and science training; and increased percentage of West Africa
Senior Secondary Certificate Examination (WASSCE) achievement of 6 credits.
4. Under Component 2, the AF will support activities related to management, research,
and monitoring and evaluation (M&E) including the following:
(a) Incremental operating costs associated with scale-up and extended closing date;
(b) Increased capacity building for policy analysis, school leadership and
management, procurement and financial management;
(c) Independent verification of results; and
(d) Research and diagnostic activities to support analysis on education policies.
5. A restructuring of the parent project is also requested to (a) extend the project closing
date to November 30, 2021, to align with the closing date of the proposed AF; and (b)
introduce revised wording to several of the disbursement-linked results (DLRs).
A. Country Context
6. Ghana, located on the west coast of Africa, has an estimated population of 28.3
million people.3 Ghana has achieved sound economic growth during the past two decades that
has translated into significant poverty reduction. Over the last 20 years, the Ghanaian
economy has grown more quickly than many other Sub-Saharan African countries, and the
national poverty rate declined from 52.7 percent to 21.4 percent, between 1991 and 2012. By
2012, the gross national income per capita had reached US$1,940, reflecting Ghana's status as
a lower-middle-income country. In recent years, however, a combination of energy rationing,
low commodity prices, rising inflation, and expenditure-side fiscal consolidation have
inhibited economic activity slowing annual gross domestic product (GDP) growth to an
estimated 3.6 percent in 2016. Further, significant geographic disparities exist in access to
economic and social, opportunities, mainly between the poorer three regions in the north and
the rest of the country.
7. Improvements have been observed on key human development outcomes with
Ghana ranking 139 out of 188 countries on the 2015 United Nations Development
Programme Human Development Index. By 2015, Ghana had attained Millennium
Development Goals (MDGs) such as halving extreme poverty (MDG 1A), halving the
proportion of people without access to safe drinking water (MDG 7B), universal primary
education (MDG 2A), and gender parity in primary school (MDG 3). Ghana had also made
substantial progress in reducing HIV prevalence (MDG 6C), increasing access to ICT (MDG
8F) and reducing the proportion of people suffering from hunger (MDG 1A).4 The primary
3 Ghana Statistical Service Data Production Unit, September 2016.
4 National Development Planning Commission and United Nations Development Programme. Ghana’s MDGs
Biennial Report, September 2015.

9
completion rate is 112 percent (as a percentage of the relevant age group in 2012/13). To
accelerate progress toward achievement of Sustainable Development Goal 4 (SDG 4) on
quality education to ensure inclusive and equitable quality education and promote lifelong
learning opportunities for all, the Government, through the Ministry of Education (MOE) and
Ghana Education Service (GES), has advanced education policy reforms under the Education
Strategic Plan (ESP 2010–2020) and is currently finalizing the revised National Education
Strategic Plan (2016–2030).
8. The general elections held in December 2016 led to another peaceful transition of
political power from one administration to another. Key among the priority areas of the
new administration is to promote universal access to basic and secondary education. At the
same time, the new Government has inherited a large fiscal deficit, high inflation, and weak
economic growth which may limit its ability to implement the planned reforms.
B. Sector Context
9. Ghana has made significant commitments to the education sector since 2000,
cutting across basic education (kindergarten, primary, and lower secondary), secondary
education,5
skills and technology, and tertiary education. Ghana has achieved near
universal access to primary education and enrollment gains have been substantial, even in
some of the most remote regions of the country, such as deprived districts in the Northern,
Upper East, and Upper West regions. The net enrollment rate (NER) in deprived districts
(93.5 percent in the 2014/2015) was slightly higher than the national NER for Ghana’s
primary schools of 91.0 percent. Improvements in enrollment are reflected in completion
rates, which in 2015/2016 was 113 percent at kindergarten, 112 percent at primary, 76 percent
at lower secondary, and 46 percent at upper secondary level.
10. Challenges persist with regard to expanding access to post-basic education,
particularly for low-income families, especially in deprived districts. Ghana Demographic
Health Survey data for 2014 reveal that among the 15–18 years’ age cohort, for every 100
children, 96 enter primary school and 16 transition to Senior High School (SHS) compared to
the poorest quintile where 90 out of 100 children enter primary school and only four actually
transition to SHS. Currently, a large number of adults have not attended any school—with the
rates varying significantly by gender and regions. Two-thirds of women and nearly one-half
of men have no education in the Northern region as compared to 8.3 percent of women and
2.9 percent of men in Greater Accra. While gender parity has been achieved at the primary
level, at higher levels of education, girls’ participation drops off significantly. Gender inequity
in education access and completion is linked to sociocultural factors including early marriage,
teenage pregnancies, high opportunity cost of education, high costs associated with secondary
education, as well as the availability of and distance to quality SHSs.
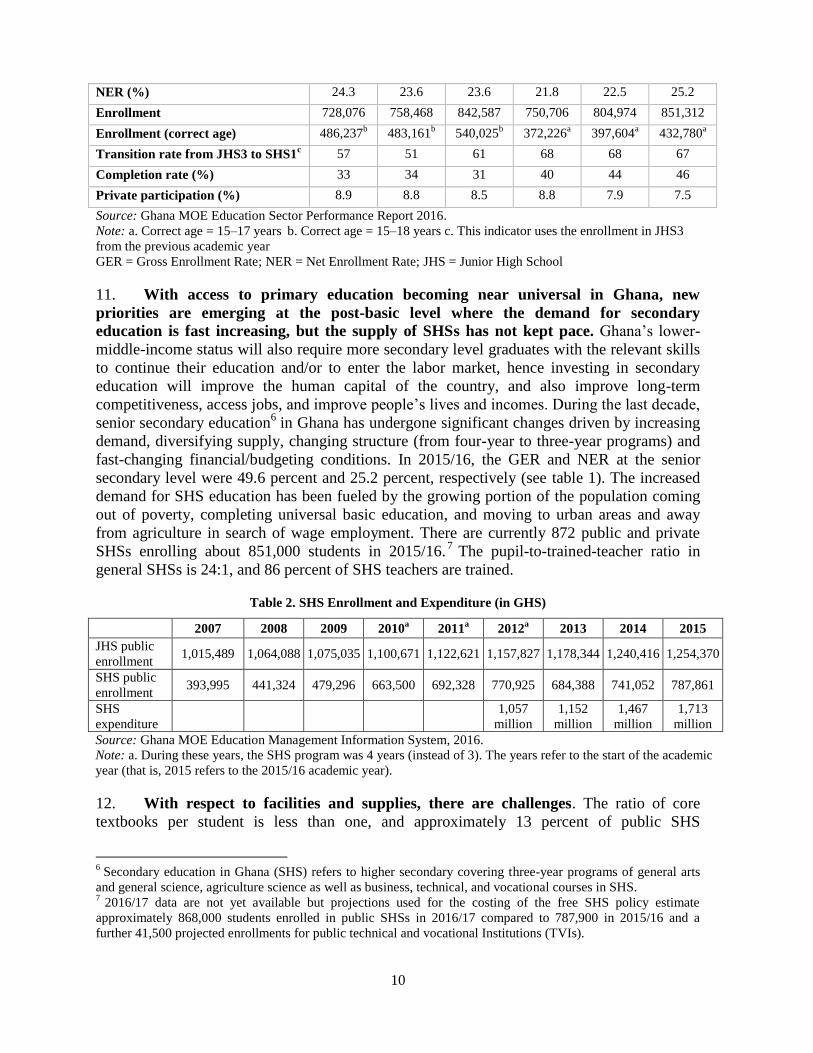
Table 1. SHS Enrollment Statistics
5 Reference to secondary education refers to higher secondary and under the SEIP it encompasses SHS.
Indicators 2010/11 2011/12 2012/13 2013/14 2014/15 2015/16
GER (%) 36.5 37.1 36.8 43.9 45.6 49.6
10
Source: Ghana MOE Education Sector Performance Report 2016.
Note: a. Correct age = 15–17 years b. Correct age = 15–18 years c. This indicator uses the enrollment in JHS3
from the previous academic year
GER = Gross Enrollment Rate; NER = Net Enrollment Rate; JHS = Junior High School
11. With access to primary education becoming near universal in Ghana, new
priorities are emerging at the post-basic level where the demand for secondary
education is fast increasing, but the supply of SHSs has not kept pace. Ghana’s lower-
middle-income status will also require more secondary level graduates with the relevant skills
to continue their education and/or to enter the labor market, hence investing in secondary
education will improve the human capital of the country, and also improve long-term
competitiveness, access jobs, and improve people’s lives and incomes. During the last decade,
senior secondary education6 in Ghana has undergone significant changes driven by increasing
demand, diversifying supply, changing structure (from four-year to three-year programs) and
fast-changing financial/budgeting conditions. In 2015/16, the GER and NER at the senior
secondary level were 49.6 percent and 25.2 percent, respectively (see table 1). The increased
demand for SHS education has been fueled by the growing portion of the population coming
out of poverty, completing universal basic education, and moving to urban areas and away
from agriculture in search of wage employment. There are currently 872 public and private
SHSs enrolling about 851,000 students in 2015/16.7 The pupil-to-trained-teacher ratio in
general SHSs is 24:1, and 86 percent of SHS teachers are trained.
Table 2. SHS Enrollment and Expenditure (in GHS)
2007 2008 2009 2010a 2011
a 2012
a 2013 2014 2015
JHS public
enrollment 1,015,489 1,064,088 1,075,035 1,100,671 1,122,621 1,157,827 1,178,344 1,240,416 1,254,370
SHS public
enrollment 393,995 441,324 479,296 663,500 692,328 770,925 684,388 741,052 787,861
SHS
expenditure
1,057
million
1,152
million
1,467
million
1,713
million
Source: Ghana MOE Education Management Information System, 2016.
Note: a. During these years, the SHS program was 4 years (instead of 3). The years refer to the start of the academic
year (that is, 2015 refers to the 2015/16 academic year).
12. With respect to facilities and supplies, there are challenges. The ratio of core
textbooks per student is less than one, and approximately 13 percent of public SHS
6 Secondary education in Ghana (SHS) refers to higher secondary covering three-year programs of general arts
and general science, agriculture science as well as business, technical, and vocational courses in SHS. 7 2016/17 data are not yet available but projections used for the costing of the free SHS policy estimate
approximately 868,000 students enrolled in public SHSs in 2016/17 compared to 787,900 in 2015/16 and a
further 41,500 projected enrollments for public technical and vocational Institutions (TVIs).
NER (%) 24.3 23.6 23.6 21.8 22.5 25.2
Enrollment 728,076 758,468 842,587 750,706 804,974 851,312
Enrollment (correct age) 486,237
b 483,161
b 540,025
b 372,226
a 397,604
a 432,780
a
Transition rate from JHS3 to SHS1c 57 51 61 68 68 67
Completion rate (%) 33 34 31 40 44 46
Private participation (%) 8.9 8.8 8.5 8.8 7.9 7.5

11
classrooms require major repairs. There remain inequities in the demand for SHSs because
half of the youth typically either do not have adequate qualifications to enter SHS or cannot
afford to move or commute to the schools where they are placed by the Computerized School
Selection and Placement System (CSSPS).8 A large portion of students do not complete basic
education and about one-third of those taking the Basic Education Certificate Examination
(BECE) do not enter SHS having completed JHS. Those coming from the poorest 20 percent
of households, the most deprived districts, and/or from rural areas are about five to six times
less likely to access SHS.
13. Measures to improve access to and quality of secondary education. The
Government has implemented measures to improve BECE results in deprived districts,
subsidize needy students, especially those from northern and other hard-to-reach areas
through means-tested support to boarding students and subsidized transport for day students
living within 20 km of schools. The Government has been expanding SHS access by building
new schools and rehabilitating old ones. The Government has recently completed 44 out of
124 planned new SHSs (including 13 out of 23 new SHSs under the SEIP). The construction
of the remaining 80 new SHSs are at various stages of completion. When completed, these
new SHSs will add at least 15 percent more schools to the total number of public SHSs.
14. In early 2017, to further increase access to SHS, the Government committed to
providing higher secondary and Technical and Vocational Institutes9 (TVI) programs
free of all charges (tuition in all Ghanaian public schools was already free). The new free
SHS policy will cover costs currently borne by families such as admission and examination
registration fee, library and laboratory charges, textbooks and exercise books, teaching and
learning materials, school uniforms, teacher incentive portion of Parent Teacher Association
(PTA) dues, other costs, and one meal for day students. According to the new free SHS
policy, the Government will absorb these costs and also subsidize the schools for the lost
revenues they would have collected from families. Board and meals for boarding students are
already subsidized by the Government and all meals for boarding students will be included
under the free SHS policy. The policy will commence in 2017/2018 by covering all
successfully admitted first-year SHS students while the second- and third-year students will
continue to benefit from existing subsidies.
15. The Government’s goal of universal access to upper secondary education is well
justified. There is evidence from Ghana and globally that higher secondary education is
positively associated with improved employment outcomes, earnings, and health, fewer early
marriages, lower rates of teenage pregnancy, and better child health outcomes. The impact of
participation/completion of SHSs is particularly significant for girls. In Ghana, the
Government has been providing targeted scholarships to some students, especially to girls and
students in need. Research shows that students who receive scholarships have improved
learning outcomes, improved access to tertiary education, and improved incomes and labor
8 During the last year of JHS, students submit a ranked list of up to four secondary schools that they would like
to attend. The CSSPS uses this ranking, together with their performance on the BECE, to place students in SHSs. 9 TVIs are at secondary level.

12
market outcomes, with the largest impact for girls.10
The new free SHS policy aims to
increase equitable access to higher secondary education in Ghana.
16. While the Government’s policies are likely to increase access to upper secondary
education, at the same time, it could lead to a decline in the quality of education
provided, unless well-designed policies/interventions for quality improvement are also
implemented. The new SHS policy will undoubtedly increase the demand for secondary
education. Children from families who previously could not afford to pay for SHS will be
more likely to pursue secondary education, further increasing needed budget and available
seats in school. Preliminary projections, for 2017/2018, of general SHS enrollment is at nearly
950,000 students, up from an estimated 870,000 in 2016/2017. Thus, it is possible that more
schools and classrooms will be needed, and more qualified teachers (particularly in
mathematics and science) may have to be deployed to meet this increased demand. While
access to SHSs will increase with the introduction of free SHSs, quality may be negatively
affected if deliberate interventions are not introduced in parallel to improve quality and
relevance of SHSs. The WASSCE results show that learning outcomes have been declining
since 2012. Further, these results demonstrate significant regional disparities.11
The WASSCE
results also show that a small number of SHSs supply over 90 percent of those who are
admitted to higher education while the rest of the SHSs produce between 60 percent and 90
percent of the fail rates at the examination. Since the high-quality SHSs will likely remain
selective, the increases in access will mostly be in lower-quality SHSs and TVIs, and this
could further exacerbate existing disparities between the elite institutions and the rest of the
schools. Without sufficient resources to support the new SHS policy and targeted
interventions to improve quality, inequities might increase and returns to higher secondary
education might decline (through both quality and supply effects).
C. Rationale for Additional Financing
17. The primary rationale for the AF is to ensure greater impact of the SEIP
activities in increasing access to and quality of SHSs. The proposed AF would provide
support to over 100 additional schools, nearly doubling the number of schools to receive
support under the SEIP. As such, the proposed AF will support the achievement of better
learning outcomes among a greater number of students while continuing to support activities
to increase enrollment in undersubscribed schools (for example, through bursaries
[scholarships], performance reporting, rehabilitation/renovation, and ICT-based instruction).
In light of the new government’s policy making SHS free for those who qualify to enroll,
lessons can be drawn from the parent project on how to target supply expansion, strengthen
school-level capacity, transform instruction methods, and influence school choice through
consistent access to comprehensive school information. The AF will also help to expand the
quality activities to ensure that the expected large numbers of new students entering SHS
would receive an effective education to prepare for entering the labor market and/or
advancing to tertiary education. The selection of project districts and schools (which were
10
Duflo, Esther, Pascaline Dupas, and Michael Kremer. 2017. The Impact of Free Secondary Education:
Experimental Evidence from Ghana. http://economics.mit.edu/files/12682 11
MOE Education Sector Performance Report 2016.
13
identified under the parent project) will contribute to the Government’s equity objectives and
to the broader aims for poverty reduction.
18. AF was considered the preferred mechanism to increase support for the
Government’s SHS program because the SEIP was approaching its midterm review and
would benefit from scaled-up implementation to consolidate project results (particularly for
increased attainment by low-income students and improved learning outcomes in beneficiary
schools). Preparation of a new operation was considered as an alternative to AF. However, the
efficiencies to be gained from working through the parent project design and implementation
arrangements led to the decision to use AF. The proposed AF design expands and continues
the activities supported under the parent project and its achievements to date. The proposed
AF is timely as the Government prepares to implement the new free secondary education
policy, with expectations that increased enrollment will require adequate supply of good
quality SHSs to meet this demand. Few development partners are working in the post-basic
education subsector; therefore, the World Bank continues to be the key partner in supporting
secondary education in Ghana.
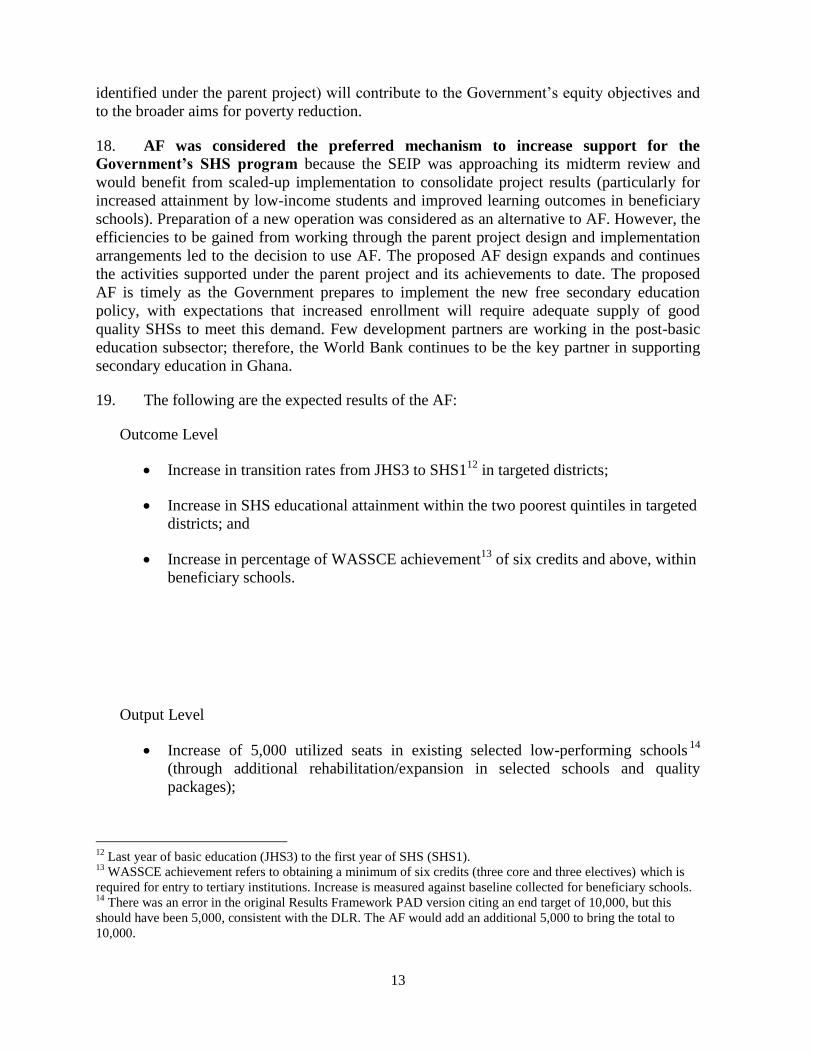
19. The following are the expected results of the AF:
Outcome Level
Increase in transition rates from JHS3 to SHS112
in targeted districts;
Increase in SHS educational attainment within the two poorest quintiles in targeted
districts; and
Increase in percentage of WASSCE achievement13
of six credits and above, within
beneficiary schools.
Output Level
Increase of 5,000 utilized seats in existing selected low-performing schools14
(through additional rehabilitation/expansion in selected schools and quality
packages);
12
Last year of basic education (JHS3) to the first year of SHS (SHS1). 13
WASSCE achievement refers to obtaining a minimum of six credits (three core and three electives) which is
required for entry to tertiary institutions. Increase is measured against baseline collected for beneficiary schools. 14
There was an error in the original Results Framework PAD version citing an end target of 10,000, but this
should have been 5,000, consistent with the DLR. The AF would add an additional 5,000 to bring the total to
10,000.

14
125 schools (selected using deprivation criteria) receive SPP grants for an
additional two years. About another 107 schools receive SPP grants for three
years;
Increase in enrollment in beneficiary SHSs for students from low-income families,
especially girls;
Increase in the number of ICT packages15
implemented in beneficiary schools;
Increase in numbers of teachers participating in mathematics and science training;
Improved data management, monitoring and dissemination through school
mapping; and
Additional research (two analyses) conducted on education policies.
D. Performance of the Original Project
20. The project is on track to achieve its PDO. The latest Implementation Status and
Results Report (December 2016) rated Progress towards achievement of the PDO and
Implementation Progress Satisfactory. The first three years of results (disbursement-linked
results – DLRs) have been met (Year 0–Year 2) and independently verified. All legal
covenants are complied with and there are no outstanding audits. The evidence of progress
against the PDO and intermediate results indicators is detailed in annex 1. Out of 18 DLI
milestones to be achieved by midterm, 17 have been fully met. One Year 2 milestone is
expected to be achieved by end-June 2017 (printing of the Annual School Performance
Report). The original Credit amount is 86.3 percent disbursed (US$120.5 million disbursed
out of a total of US$156 million).
21. The SEIP has two components: Component 1 - Support to Increase Access with
Equity and Quality in Senior High Schools and Component 2 - Management, Research,
and Monitoring and Evaluation. Component 1 uses an RBF approach (including DLIs) and
has two pillars (or results areas). Pillar 1 (Results Area 1) focuses on expanding senior
secondary places through the construction of approximately 23 new SHSs in underserved
districts, rehabilitating and expanding existing low-performing SHSs, and supporting
attainment of disadvantaged students (for example, through scholarships to students from low-
income families, especially girls). Pillar 2 (Results Area 2) focuses on improving the quality
of education in selected low-performing SHSs through (a) strengthened school management
and accountability; (b) improved mathematics and science teaching and learning; (c)
expanded ICT and Internet connectivity in schools; and (d) the introduction of SPPs.16
Component 2 finances TA, management, research, and M&E for effective project
implementation and uses a traditional investment approach.
15
Education portal for teachers and students to access multiple online resources (curriculum modules and open
source sites) to improve content knowledge. 16
SPPs include grants to SHSs for quality activities linked to achievement of improved teaching and learning.

15
22. The SEIP was restructured on August 31, 2016 to amend the table on withdrawal
of proceeds in the Financing Agreement. The revision included the reallocation among the
Eligible Expenditure Program (EEP) categories to merge the scheduled disbursement
categories for the DLRs going forward into a single disbursement category and to eliminate
any percentage requirements for advances or remaining payments so that all categories
indicate 100 percent financing of eligible expenditures. Originally the Financing Agreement
only allowed 50 percent advances with a dated time period for disbursement. The change
gives greater flexibility for paying for results without limitation for the timing of specified
advances.
Table 3. Progress Made Toward Achievement of Outcome Indicator Targets
Indicator Baseline
(2014)
Current End-of-project
Target (November 2019)
Status (as of April 2017)
Increase in transition rates
from JHS3 to SHS1 in
targeted districts
39% 47% 43%
Increase in SHS
educational attainment
within two poorest
quintiles in targeted
districts
8.4% 15% n.a.
WASSCE achievement of
6 credits and above within
beneficiary schools
10.7% (11.6% male;
9.55% female)
15% (15.9% male; 14.3%
female)
10.7% (12.6% male; 8.1%
female)
Direct project
beneficiaries (of which
female)
0 276,970 (44%) 134,721 (46%)
23. To date, the SEIP has made important progress toward achievement of its PDO
(see table 3). At the PDO-level, progress has been observed on one of the three PDO-level
indicators (transition rate) and is on track to meet the end-of-project target. The PDO-level
indicator on educational attainment will only be measured at project completion through a
household survey. The PDO-level indicator on learning results as measured by WASSCE
achievement could only be expected to show improvements with additional years of project
implementation. The core indicator (number of direct project beneficiaries) is also on track to
be fully achieved and all but one of the intermediate results indicators (completion rate) have
met yearly targets to date.
24. Implementation progress is on track, albeit four months delayed mainly because
of the national elections held in December 2016. The Government recently has met the
DLRs for Year 2 which include the following achievements: (a) 80 percent construction
works completed (achieved); (b) increase in enrollment in low-performing schools by 1,000
seats (achieved); (c) at least 4,000 SHS students receiving scholarships in project schools
(achieved); (d) publication of updated school performance data for FY2015/16 online and in
brochure (partially achieved); (e) SPPs for 104 schools signed and 80 received funding
(achieved); and (f) ICT-based instruction rolled out in about 50 percent of targeted schools
(achieved). The following section provides an overview of progress to date by component.

16
Component 1: Support to Increase Access with Equity and Quality in Senior High
Schools
Pillar 1: Increase Access with Equity in senior secondary education in underserved
districts
25. The construction of 23 new SHSs is 80 percent complete.17
Civil works began in July
2015 with completion originally scheduled for October 2016. Contracts for two technical and
three vocational blocks planned under the project (as some schools offer technical/vocational
programs), have not yet been awarded (because of current civil works overruns) and two
contracts have been terminated owing to poor performance. As of April 2017, 13 of the 23
new schools have reported enrollment of 3,111 students (averaging 240 students per school)
for the 2016/2017 academic year.
26. Performance of contractors for civil works currently underway has been inconsistent
with delays attributed to a few poorly performing contractors and the non-payment of some
contractors for work carried out over the last six months. An infrastructure technical review
has been launched to verify the differences in quantities for the same items at various sites,
quantities of additional items executed at sites, and calculations of fluctuations. The MOE has
also requested the Ghana Statistical Service (GSS) to review its price indices from April 2016
onward to guard against overpayment to contractors. It will be critical that the Government
completes the remaining 10 SHSs before the start of the next academic year in September,
2017, because further rewards for results will be dependent on increased utilized seats in these
newly constructed SHSs. In addition, the Government has also invested in constructing over
33 new additional SHSs18
over the last two years that are now accepting students. The results
on increased utilization of seats in newly constructed schools will continue to be rewarded
through FY2018, however the AF will not support the DLI for seats in newly constructed
schools given the significant support by the Government under its Community Day Secondary
School Program to construct 124 new SHSs.
27. With regard to the rehabilitation and expansion of 50 existing low-performing schools,
more than 95 percent of all rehabilitation work has been completed (with one contract
terminated for poor performance). Most of the upgraded and rehabilitated classrooms were
functional by September 2016 (at the beginning of the 2016/2017 academic year). The
facilities upgrade contributed to an increase in enrollment by 5,889 in the 125 schools,
exceeding the results target for this year.
28. In addition to the above, the parent project has provided 5,398 (2,074 in Year 1; 3,324
in Year 2) of the planned 10,000 scholarships to students from low-income families (61
percent of which were for girls) also exceeding the yearly targets.
17
These new schools are located in underserved communities and include key infrastructure such as classrooms,
computer and science laboratories, libraries, administrative space, toilets for students and staff, headmaster
bungalow, teacher housing, multipurpose canteen building, gate house and external works (including access
roads, utility connections, water, drainage, and so on). 18
The scope of the Government program is the construction of 124 new SHSs including the 23 new
constructions under the SEIP. In all, 13 new SHSs and 33 new SHSs have been completed under the SEIP and
the Government budget respectively, bringing the total completed to 46 new SHSs out of 124 planned.
17
Pillar 2: Improve Quality in low-performing Senior High Schools:
29. All 125 SHSs have submitted their School Partnership Performance Plans (SPPPs)
and 104 have been reviewed, approved, signed, and the initial grant funds disbursed to 80
schools. The SPPs provide a mutual accountability mechanism for incentivizing SHS quality
improvement activities as enrollment increases through the expansion of infrastructure and
scholarships. The SPPs provide non-salary resources to schools to implement activities to
improve quality of SHS teaching and learning. The funding also covers some of the costs of
equipment and training of science and mathematics teachers. Two cohorts of a total of 1,050
science and mathematics teachers have received training (with a focus on challenging topics
in core mathematics and science subjects) surpassing the end-of-project target. The training
aims to address the challenges of weak teacher content knowledge and limited student-
centered teaching methodologies. The parent project is also funding school leadership training
in an effort to improve teaching, coaching, school management, and teacher assessment.
Additional staffing audits and resource materials are being provided to address these areas.
New teaching methods are being explored, including potential participation in the Math and
Science for Sub-Saharan Africa (MS4SSA)—a regional initiative to introduce scripted lesson
plans with embedded classroom assessment techniques. A consulting firm is providing TA to
strengthen the in-service training modules for mathematics and science teachers. An impact
evaluation is under way to assess the impact of the science and mathematics training.
30. Electronic content has been developed for the i-campus system (teaching and learning
portal through i-box technology) with 200 modules in core subjects completed for SHS1.
SHS2 content development is completed and work is under way on SHS3 content. The i-
boxes deliver pre-prepared video lessons, student exercises, and content assessment to SHS
students and teachers. The i-boxes have been rolled out to the initial 70 schools following i-
box utilization training. An impact evaluation is underway to measure the impact of the i-box,
and the remaining schools will therefore receive the i-box next academic year in September
2017.
Component 2: Management, Research, and Monitoring and Evaluation
31. The Government team has hired two independent verification firms (one for civil
works and one for quality outcomes) to annually validate and verify project results. Baseline
data for the impact evaluations to test the impact of the i-box package and to assess the extent
to which follow-up science and mathematics teacher training has an impact on student
learning has been collected. The impact evaluation on the i-box will measure the functionality,
use, and cost-effectiveness of the i-box and determine its impact on learning; the impact
evaluation on science and mathematics training will assess the extent to which follow-up
science and mathematics teacher training has had an impact on educational outcomes. In
addition, progress is being made in identifying the research agenda for secondary education.
Recently, the research team hired an agency based at the University of Cape Coast to help
define the research agenda. A report which includes the work plan and timeline for carrying
out relevant studies has been submitted. The team has also set up a research database and the
project is supporting annual Education Research Evidence Summits (the first of which took
place on March 28–29, 2017) which bring researchers and the Government together to learn
about current evidence on education policy. All SHSs (public and private) have been mapped
and a website portal has been established to make information on SHSs available online

18
(www.ghanaschoolsinfo.org) for all stakeholders. The portal is being further enhanced and
expanded to include scholarship information, M&E, and academic performance tracking, and
a digest is being printed for wider dissemination. Under the project, there has been adequate
M&E of project indicators, excellent tracking of DLRs as well as in-depth monitoring reports
on implementation progress of the various components and semiannual project
implementation status reports.
32. Key lessons learned through the implementation of the parent project. The key
lessons include: (a) focusing on results and outcomes can expedite project implementation,
strengthen country systems, and allow for some flexibility in implementation planning; (b)
reducing the focus on inputs can encourage costs savings; (c) results focus allows for greater
diversity of interventions, some with little cost implications (for example, visits to JHSs to
sensitize communities about new SHSs available for potential students); (d) transparent
targeting criteria discourages political influence and encourages reliance on data for decision
making; (e) technology innovations are only useful if they are well understood and functional
in challenging environments; (f) an effective communications strategy is essential; and (g) use
of country systems builds ownership and capacity, but there is room for improvement (for
example, management of infrastructure contracts, i-box roll out limitations and methodology
for teacher training). The results approach has also experienced challenges within a fiscally
constrained environment—leading to an overreliance on project funds for program
implementation. While the learning curve for RBF was steep, the current implementing
agency teams are now knowledgeable about the instrument and advocate for its role in
expediting development outcomes.
Implementation Arrangements
33. Implementation arrangements of the proposed AF will be the same as those used
under the parent project, mainstreamed within the government agencies. The MOE/GES
will continue to take the lead as implementation agency, with responsibilities for the day-to-
day administration, coordination, and M&E of SEIP activities. Oversight of the SEIP rests
with the MOE, with the GES providing their mandated implementation role for service
delivery. Continued support to the Technical Implementation Committee (TIC), through the
Project Civil Works and Project Quality and Outcomes Team, will be necessary. The Chief
Director of the MOE, who reports to the Minister for Education, leads the technical team by
chairing the TIC which is responsible for the day-to-day project implementation. The GES
oversees all activities related to senior secondary institutional leadership and teacher training,
preparation of SPPs, resourcing of schools for quality improvements, improvement of senior
secondary school programs, ICT interventions, and M&E. These teams have clear terms of
references detailing their responsibilities as spelled out in the SEIP Project Implementation
Manual (PIM) that has been published and widely disseminated to project implementers. A
Project Steering Committee will continue to provide oversight and guidance to facilitate inter-
division and inter-sectoral coordination on implementation. The continued arrangements
would include extension of a project coordinator, procurement officer, and technical
consultants including safeguards consultant as detailed in the PIM. A revised PIM will be
available by project effectiveness to include updates, the expanded scope of the SEIP and
revised result targets. The revised PIM will be published on the MOE and GES websites and
will be disseminated to beneficiary schools, including the additional SHSs that will benefit
under the AF.
19
Monitoring and Evaluation
34. The MOE and GES will continue to be responsible for coordinating and overseeing all
M&E activities. The current framework builds on established systems for data collection and
analysis by embedding monitoring and reporting in the offices responsible for each of the
results areas. Data sources include the Education Management Information System, Ghana
Living Standards Survey (GLSS), Annual WASSCE results, and the newly operational school
mapping portal (e-Adido). Consolidated M&E reports are produced by the MOE and GES
twice per year and verified by independent third-party agencies responsible for assessing
whether results have been achieved. In addition to the core M&E reports, a number of
analytical studies will be undertaken under Component 2 of the project. The upcoming
midterm review scheduled for September 2017 will include independent in-depth fiduciary
review, procurement review, safeguards audit, technical audit of civil works, and an analysis
of SPPs/grants.
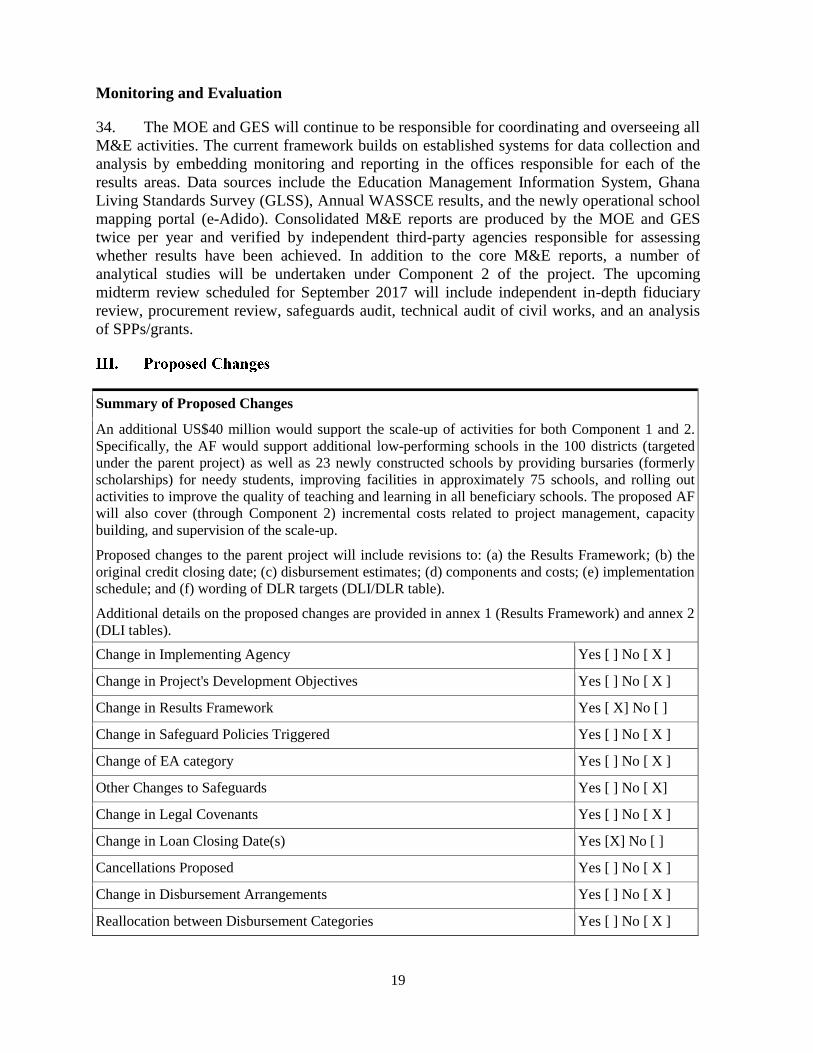
Summary of Proposed Changes
An additional US$40 million would support the scale-up of activities for both Component 1 and 2.
Specifically, the AF would support additional low-performing schools in the 100 districts (targeted
under the parent project) as well as 23 newly constructed schools by providing bursaries (formerly
scholarships) for needy students, improving facilities in approximately 75 schools, and rolling out
activities to improve the quality of teaching and learning in all beneficiary schools. The proposed AF
will also cover (through Component 2) incremental costs related to project management, capacity
building, and supervision of the scale-up.
Proposed changes to the parent project will include revisions to: (a) the Results Framework; (b) the
original credit closing date; (c) disbursement estimates; (d) components and costs; (e) implementation
schedule; and (f) wording of DLR targets (DLI/DLR table).
Additional details on the proposed changes are provided in annex 1 (Results Framework) and annex 2
(DLI tables).
Change in Implementing Agency Yes [ ] No [ X ]
Change in Project's Development Objectives Yes [ ] No [ X ]
Change in Results Framework Yes [ X] No [ ]
Change in Safeguard Policies Triggered Yes [ ] No [ X ]
Change of EA category Yes [ ] No [ X ]
Other Changes to Safeguards Yes [ ] No [ X]
Change in Legal Covenants Yes [ ] No [ X ]
Change in Loan Closing Date(s) Yes [X] No [ ]
Cancellations Proposed Yes [ ] No [ X ]
Change in Disbursement Arrangements Yes [ ] No [ X ]
Reallocation between Disbursement Categories Yes [ ] No [ X ]

20
Change in Disbursement Estimates Yes [ X] No [ ]
Change to Components and Cost Yes [ X] No [ ]
Change in Institutional Arrangements Yes [ ] No [ X ]
Change in Financial Management Yes [ ] No [ X ]
Change in Procurement Yes [ ] No [ X ]
Change in Implementation Schedule Yes [X] No []
Other Change(s) Yes [ ] No [ X ]
Development Objective/Results PHHHDO
Project’s Development Objectives
Original PDO
The PDO is to increase access to senior secondary education in underserved districts and improve
quality in low-performing senior high schools in Ghana.
Change in Results Framework PHHCRF
Explanation:
Annual and end-of-project targets for most of the indicators will be revised based on the increase in
the number of beneficiary schools. The extension of the parent project for two years will also require
revised end-line targets to correspond to the scale-up of interventions. In line with the recent policy
on corporate results indicators and citizen engagement, two new indicators have been added to track
the number of students benefitting from direct interventions to enhance learning and to track citizen
engagement through the carrying out of a survey on project beneficiaries. The indicator on number of
teachers trained under the project is already an intermediate results indicator being monitored in the
Results Framework ‘number of teachers participating in training to upgrade or acquire new skills in
mathematics or science.’ See annex 1 for revised Results Framework.
Compliance
Covenants - Additional Financing (Secondary Education Improvement Project Additional
Financing - P163628)
Source of Funds
Finance
Agreemen
t
Reference
Description of
Covenants
Date
Due Recurrent Frequency
Acti
on
IDA
Schedule
2, Section
I. C. 2. (a)
The Recipient shall
cause the
Independent
Verifiers to furnish
to the Association
every calendar
semester, starting
six months after
the Effective Date,
regular reports
(“EEP Spending
Reports”) prepared
X SemiAnnuall
y
NE
W

21
in accordance with
the provisions of
the Project
Implementation
Manual.
IDA
Schedule
2, Section
I, C.1(a)
The recipient shall,
by no later than 3
months after the
effective date,
appoint external
M&E experts
(independent
verifiers) to act as
third- party
verifiers of the
proper fulfillment
of the DLIs and
DLRs set forth in
Schedule 4 in the
Financing
Agreement
04-
Feb-
2018
NE
W
Conditions
P
Source Of Fund Name Type
IDA Project Implementation
Manual
Effectiveness
Description of Condition
Recipient has updated the Project Implementation Manual in form and substance satisfactory to the
Association.
Source Of Fund Name Type
IDA Withdrawal Condition 1 Disbursement
Description of Condition
No withdrawal shall be made for payments prior to the date of the Financing Agreement.
P
Source Of Fund Name Type
IDA Withdrawal Condition 2 Disbursement
Description of Condition
No withdrawal shall be made for eligible expenditures under Category 2 unless and until the
amount of the financing allocated to Category 2 of the table set forth in Section IV.A.1 Schedule 2
to the Original Financing Agreement has been fully utilized and disbursed.
Source Of Fund Name Type
IDA Withdrawal Condition 3 Disbursement
Description of Condition
No withdrawal shall be made for Category 1 with respect to each DLI in the table in Schedule 4 of
the Financing Agreement until the Recipient through MoE furnishes to the Association: (i) the

22
applicable EEP Spending Report and the verification of the achievement of the DLIs for the
respective Year as set out in Schedule 4 the Financing Agreement; and (ii) evidence satisfactory to
the Association as defined in the PIM that payment for the EEP under the Sector Budget Lines in
the Annex to Schedule 2 have been made by the Recipient in accordance with its applicable laws
and regulations.
Source Of Fund Name Type
IDA Withdrawal Condition 4 Disbursement
Description of Condition
The Association may restrict withdrawals if it determines, based on evidence referred to in
Schedule 2, Section IV. B.1. (c) of the Financing Agreement that: (i) the DLI targets as set out in
Schedule 4 to this Agreement, are not met or partially met; or (ii) at any time, any portion of the
amounts disbursed by the Recipient under Category 1 was made for expenditures that are not
eligible under the EEP, the Recipient shall promptly refund any such amount to the Association as
the Association shall specify by notice to the Recipient.
Source Of Fund Name Type
IDA Withdrawal Condition 5 Disbursement
Description of Condition
Without limitation to the provisions of Section IV.B.1. (d) (i), any amount of the Credit withheld
pursuant to said paragraph may be cancelled or reallocated by the Association in consultation with
the Recipient's Ministry of Finance, and any readjustment to the amount assigned to each
DLI/DLR linked to Category 1 shall be made with the agreement of the Recipient's Ministry of
Finance.
Source Of Fund Name Type
IDA Withdrawal Condition 6 Disbursement
Description of Condition
Upon the Recipient's request, the Association may by notice to the Recipient, adjust from time to
time the DLR amounts and targets set forth in the Schedule 4 to the Financing Agreement for
specific DLIs/DLRs.
Risk
Risk Category Rating (H, S, M,
L)
1. Political and Governance Substantial
2. Macroeconomic Substantial
3. Sector Strategies and Policies Substantial
4. Technical Design of Project or Program Moderate
5. Institutional Capacity for Implementation and Sustainability Substantial
6. Fiduciary Moderate
7. Environment and Social Moderate
8. Stakeholders Moderate
OVERALL Substantial
23
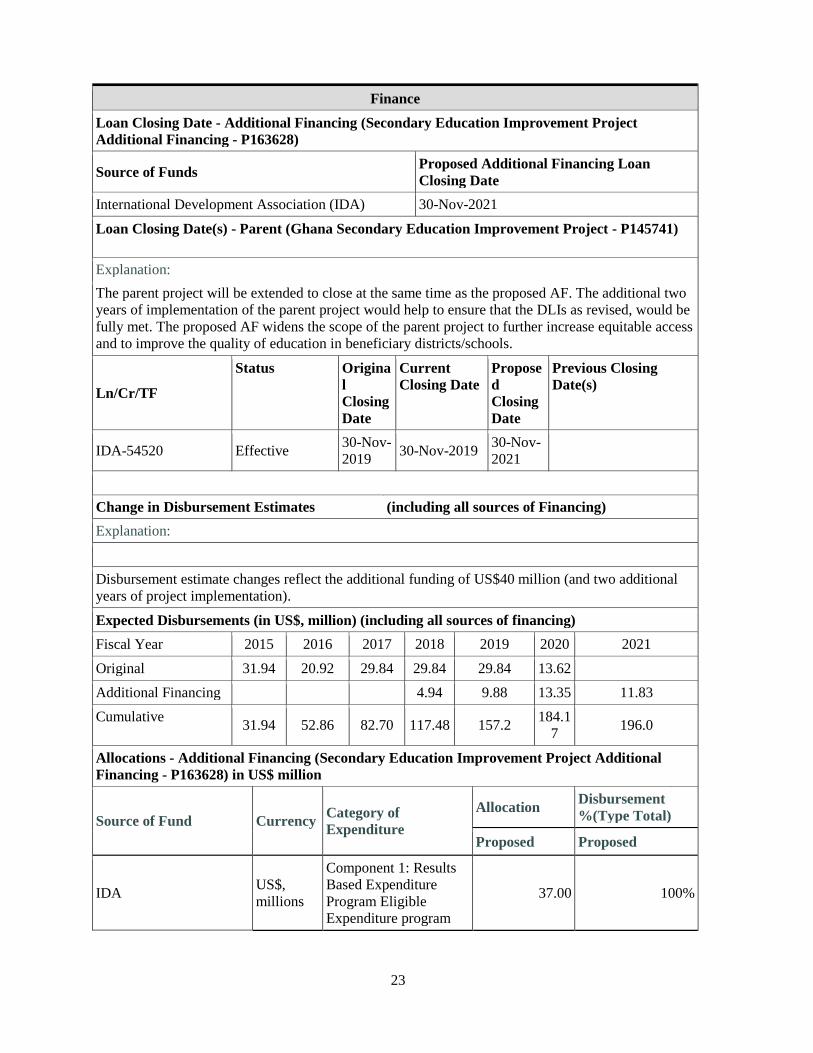
Finance
Loan Closing Date - Additional Financing (Secondary Education Improvement Project
Additional Financing - P163628)
Source of Funds Proposed Additional Financing Loan
Closing Date
International Development Association (IDA) 30-Nov-2021
Loan Closing Date(s) - Parent (Ghana Secondary Education Improvement Project - P145741) PHHCLCD
Explanation:
The parent project will be extended to close at the same time as the proposed AF. The additional two
years of implementation of the parent project would help to ensure that the DLIs as revised, would be
fully met. The proposed AF widens the scope of the parent project to further increase equitable access
and to improve the quality of education in beneficiary districts/schools.
Ln/Cr/TF
Status Origina
l
Closing
Date
Current
Closing Date
Propose
d
Closing
Date
Previous Closing
Date(s)
IDA-54520 Effective 30-Nov-
2019 30-Nov-2019
30-Nov-
2021
Change in Disbursement Estimates (including all sources of Financing)
Explanation:
Disbursement estimate changes reflect the additional funding of US$40 million (and two additional
years of project implementation).
Expected Disbursements (in US$, million) (including all sources of financing)
Fiscal Year 2015 2016 2017 2018 2019 2020 2021
Original 31.94 20.92 29.84 29.84 29.84 13.62
Additional Financing 4.94 9.88 13.35 11.83
Cumulative 31.94 52.86 82.70 117.48 157.2
184.1
7 196.0
Allocations - Additional Financing (Secondary Education Improvement Project Additional
Financing - P163628) in US$ million
Source of Fund Currency Category of
Expenditure
Allocation Disbursement
%(Type Total)
Proposed Proposed
IDA US$,
millions
Component 1: Results
Based Expenditure
Program Eligible
Expenditure program
37.00 100%
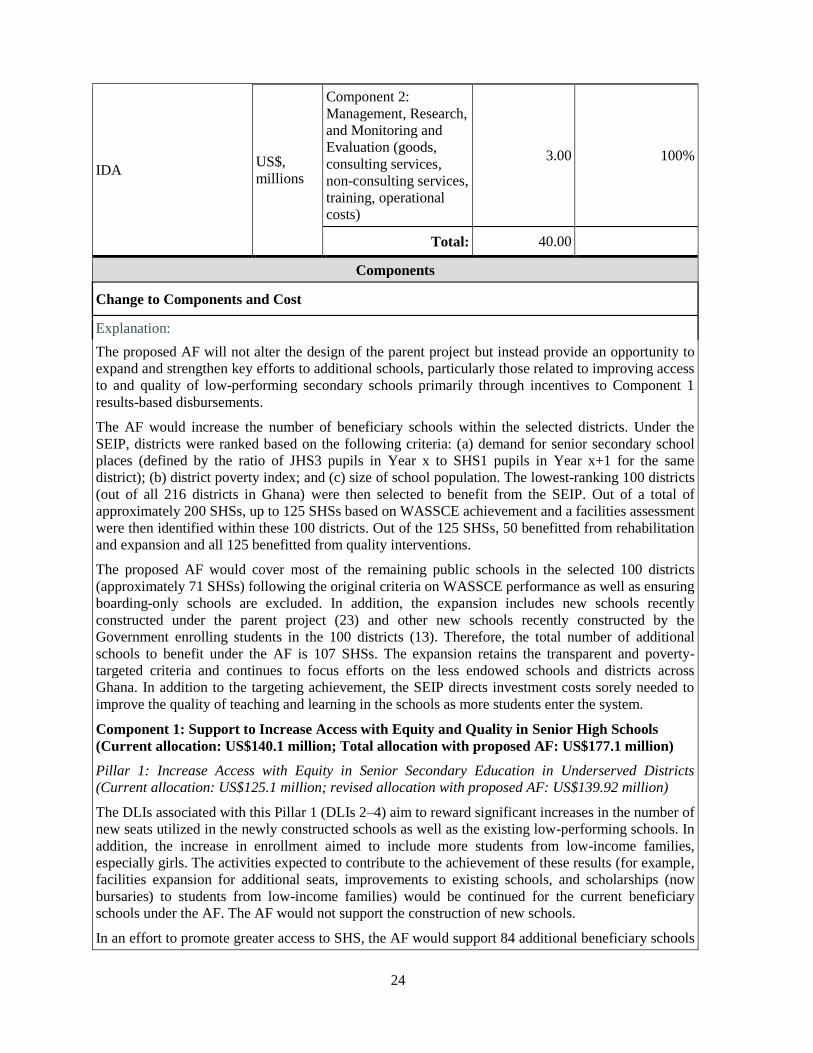
24
IDA US$,
millions
Component 2:
Management, Research,
and Monitoring and
Evaluation (goods,
consulting services,
non-consulting services,
training, operational
costs)
3.00 100%
Total: 40.00
Components
Change to Components and Cost
Explanation:
The proposed AF will not alter the design of the parent project but instead provide an opportunity to
expand and strengthen key efforts to additional schools, particularly those related to improving access
to and quality of low-performing secondary schools primarily through incentives to Component 1
results-based disbursements.
The AF would increase the number of beneficiary schools within the selected districts. Under the
SEIP, districts were ranked based on the following criteria: (a) demand for senior secondary school
places (defined by the ratio of JHS3 pupils in Year x to SHS1 pupils in Year x+1 for the same
district); (b) district poverty index; and (c) size of school population. The lowest-ranking 100 districts
(out of all 216 districts in Ghana) were then selected to benefit from the SEIP. Out of a total of
approximately 200 SHSs, up to 125 SHSs based on WASSCE achievement and a facilities assessment
were then identified within these 100 districts. Out of the 125 SHSs, 50 benefitted from rehabilitation
and expansion and all 125 benefitted from quality interventions.
The proposed AF would cover most of the remaining public schools in the selected 100 districts
(approximately 71 SHSs) following the original criteria on WASSCE performance as well as ensuring
boarding-only schools are excluded. In addition, the expansion includes new schools recently
constructed under the parent project (23) and other new schools recently constructed by the
Government enrolling students in the 100 districts (13). Therefore, the total number of additional
schools to benefit under the AF is 107 SHSs. The expansion retains the transparent and poverty-
targeted criteria and continues to focus efforts on the less endowed schools and districts across
Ghana. In addition to the targeting achievement, the SEIP directs investment costs sorely needed to
improve the quality of teaching and learning in the schools as more students enter the system.
Component 1: Support to Increase Access with Equity and Quality in Senior High Schools
(Current allocation: US$140.1 million; Total allocation with proposed AF: US$177.1 million)
Pillar 1: Increase Access with Equity in Senior Secondary Education in Underserved Districts
(Current allocation: US$125.1 million; revised allocation with proposed AF: US$139.92 million)
The DLIs associated with this Pillar 1 (DLIs 2–4) aim to reward significant increases in the number of
new seats utilized in the newly constructed schools as well as the existing low-performing schools. In
addition, the increase in enrollment aimed to include more students from low-income families,
especially girls. The activities expected to contribute to the achievement of these results (for example,
facilities expansion for additional seats, improvements to existing schools, and scholarships (now
bursaries) to students from low-income families) would be continued for the current beneficiary
schools under the AF. The AF would not support the construction of new schools.
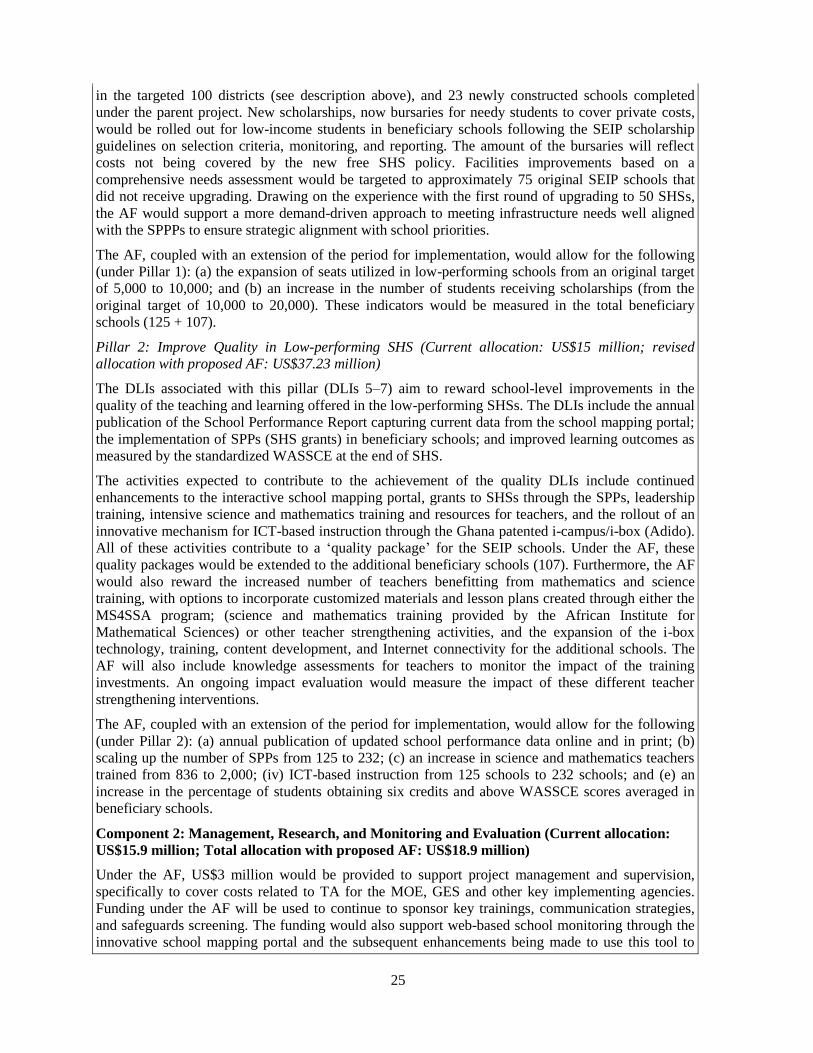
In an effort to promote greater access to SHS, the AF would support 84 additional beneficiary schools
25
in the targeted 100 districts (see description above), and 23 newly constructed schools completed
under the parent project. New scholarships, now bursaries for needy students to cover private costs,
would be rolled out for low-income students in beneficiary schools following the SEIP scholarship
guidelines on selection criteria, monitoring, and reporting. The amount of the bursaries will reflect
costs not being covered by the new free SHS policy. Facilities improvements based on a
comprehensive needs assessment would be targeted to approximately 75 original SEIP schools that
did not receive upgrading. Drawing on the experience with the first round of upgrading to 50 SHSs,
the AF would support a more demand-driven approach to meeting infrastructure needs well aligned
with the SPPPs to ensure strategic alignment with school priorities.
The AF, coupled with an extension of the period for implementation, would allow for the following
(under Pillar 1): (a) the expansion of seats utilized in low-performing schools from an original target
of 5,000 to 10,000; and (b) an increase in the number of students receiving scholarships (from the
original target of 10,000 to 20,000). These indicators would be measured in the total beneficiary
schools (125 + 107).
Pillar 2: Improve Quality in Low-performing SHS (Current allocation: US$15 million; revised
allocation with proposed AF: US$37.23 million)
The DLIs associated with this pillar (DLIs 5–7) aim to reward school-level improvements in the
quality of the teaching and learning offered in the low-performing SHSs. The DLIs include the annual
publication of the School Performance Report capturing current data from the school mapping portal;
the implementation of SPPs (SHS grants) in beneficiary schools; and improved learning outcomes as
measured by the standardized WASSCE at the end of SHS.
The activities expected to contribute to the achievement of the quality DLIs include continued
enhancements to the interactive school mapping portal, grants to SHSs through the SPPs, leadership
training, intensive science and mathematics training and resources for teachers, and the rollout of an
innovative mechanism for ICT-based instruction through the Ghana patented i-campus/i-box (Adido).
All of these activities contribute to a ‘quality package’ for the SEIP schools. Under the AF, these
quality packages would be extended to the additional beneficiary schools (107). Furthermore, the AF
would also reward the increased number of teachers benefitting from mathematics and science
training, with options to incorporate customized materials and lesson plans created through either the
MS4SSA program; (science and mathematics training provided by the African Institute for
Mathematical Sciences) or other teacher strengthening activities, and the expansion of the i-box
technology, training, content development, and Internet connectivity for the additional schools. The
AF will also include knowledge assessments for teachers to monitor the impact of the training
investments. An ongoing impact evaluation would measure the impact of these different teacher
strengthening interventions.
The AF, coupled with an extension of the period for implementation, would allow for the following
(under Pillar 2): (a) annual publication of updated school performance data online and in print; (b)
scaling up the number of SPPs from 125 to 232; (c) an increase in science and mathematics teachers
trained from 836 to 2,000; (iv) ICT-based instruction from 125 schools to 232 schools; and (e) an
increase in the percentage of students obtaining six credits and above WASSCE scores averaged in
beneficiary schools.
Component 2: Management, Research, and Monitoring and Evaluation (Current allocation:
US$15.9 million; Total allocation with proposed AF: US$18.9 million)
Under the AF, US$3 million would be provided to support project management and supervision,
specifically to cover costs related to TA for the MOE, GES and other key implementing agencies.
Funding under the AF will be used to continue to sponsor key trainings, communication strategies,
and safeguards screening. The funding would also support web-based school monitoring through the
innovative school mapping portal and the subsequent enhancements being made to use this tool to
26
better monitor program activities. Independent verification firms would be supported to annually
verify the DLRs. The research and diagnostic activities to support analysis on SHS policy and
strategy will be particularly critical to scale up now that the Government has announced the
implementation of free SHS in September 2017. The necessary data analysis and implementation
assessments would be supported to help guide such a transformative agenda, especially in light of the
structural nature of the education system (boarding versus day schools), fiscal constraints (limited
non-salary education expenditures), and quality challenges (low learning outcomes at completion of
basic education). The AF would also support more systematic procurement and financial management
capacity at the school level to strengthen the implementation of the SPPPs and facilities upgrade.
Operational costs of the SEIP associated with the scale-up and/or continuation of activities through
the extended closing date would also be supported.
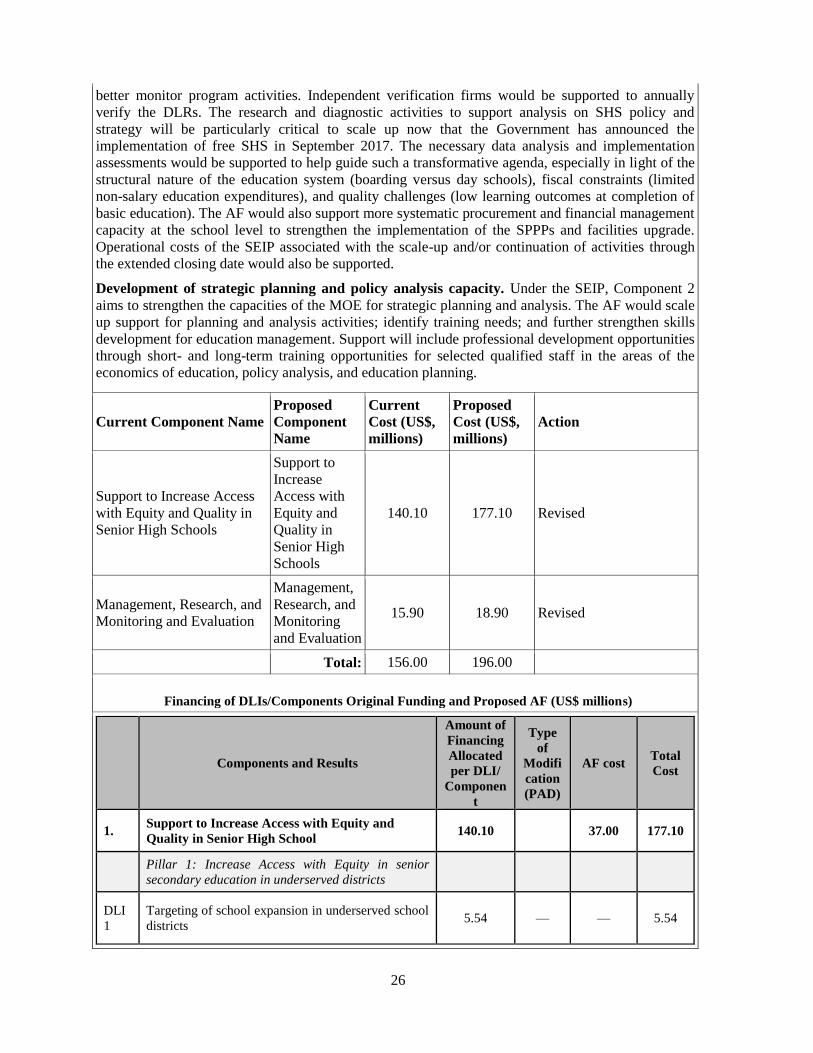
Development of strategic planning and policy analysis capacity. Under the SEIP, Component 2
aims to strengthen the capacities of the MOE for strategic planning and analysis. The AF would scale
up support for planning and analysis activities; identify training needs; and further strengthen skills
development for education management. Support will include professional development opportunities
through short- and long-term training opportunities for selected qualified staff in the areas of the
economics of education, policy analysis, and education planning.
Current Component Name
Proposed
Component
Name
Current
Cost (US$,
millions)
Proposed
Cost (US$,
millions)
Action
Support to Increase Access
with Equity and Quality in
Senior High Schools
Support to
Increase
Access with
Equity and
Quality in
Senior High
Schools
140.10 177.10 Revised
Management, Research, and
Monitoring and Evaluation
Management,
Research, and
Monitoring
and Evaluation
15.90 18.90 Revised
Total: 156.00 196.00
Financing of DLIs/Components Original Funding and Proposed AF (US$ millions)
Components and Results
Amount of
Financing
Allocated
per DLI/
Componen
t
Type
of
Modifi
cation
(PAD)
AF cost Total
Cost
1. Support to Increase Access with Equity and
Quality in Senior High School 140.10 37.00 177.10
Pillar 1: Increase Access with Equity in senior
secondary education in underserved districts
DLI
1
Targeting of school expansion in underserved school
districts 5.54 — — 5.54

27
DLI
2
Increase in new seats for SHS students in
underserved school districts 23.20 — — 23.20
DLI
3
Increase in number of seats utilized in existing low-
performing schools 23.20
Scale
up 9.88 33.08
DLI
4
Increased enrollment in SHS in targeted districts and
schools for students from low-income families,
especially girls
23.20 Scale
up 4.94 28.14
Pillar 2: Improve Quality in low-performing senior
high schools
DLI
5 Annual publication of School Performance Report 18.56
Contin
ue 4.94 23.5
DLI
6
School Performance Partnerships in beneficiary
schools 23.20
Scale
up 9.88 33.08
DLI
7
Improved learning outcomes in beneficiary SHS
23.20
Scale
up 7.41 30.61
2. Management, Research, and Monitoring and
Evaluation 15.90 3.00 18.90
Program management/operational
costs/communications/verification/TA/training/resea
rch
15.90 Scale
Up 3.00 18.90
TOTAL 156.00 40.00 196.00
Economic and Financial Analysis PHHASEFA
Explanation:
The economic analysis suggests that the proposed AF remains economically justified. The SHS
system in Ghana has undergone rapid expansion from 700 SHSs in 2006 to 872 total SHSs in 2016
and 376,049 public SHS enrollments in 2005/06 to an estimated enrollment of 868,000 students in
public schools in 2016/2017.
The private rates of return to secondary education in Ghana have also risen from 7.8 percent in
2005 to 8.8 percent in 2012. Within secondary education, returns are higher for females (11
percent) than males (6.5 percent). The returns to secondary education in Ghana are higher than the
global average for secondary education (6.8 percent) but lower than the Sub-Saharan Africa
average of 10.6 percent.19
The rationale for public investment in education is related to the high social, economic, and non-
economic rates of return to education, in addition to the market imperfections that preclude the poor
from reaping the private returns to education. Education is an investment that increases individuals’
19
Montenegro, Claudio E. and Harry Anthony Patrinos. 2014. “Comparable Estimates of Returns to Schooling
Around the World.” Policy Research Working Paper No. WPS 7020. Washington, DC: World Bank.

28
skills and makes more informed and socialized citizens. At the individual level, skills make
individuals more productive and employable, extending their labor market participation over their
lifetime, leading to higher earnings, and better quality of life. At the country level, education is
associated with economic growth.
After two years of implementation, the DLI-based design of the project has shifted the focus of the
Government toward results and empirical-based policy making. The AF would not alter the design
of the SEIP but instead provide opportunities for expansion and strengthening of key efforts,
particularly those related to improving the quality of education in low-performing secondary
schools.
The support to the construction of 23 new schools and rehabilitation of 50 schools provided under
the project is cost-effective. The unit costs of construction based on actual contract values are lower
than the estimated costs at project design. The unit cost for new schools is US$3.2 million compared
to the estimate of US$4.3 million and the unit cost for upgrades is US$0.12 million compared to an
estimated amount of US$0.32 million. As of March 2017, 13 of the 23 new schools have reported
enrollment of 3,111 students for the 2016/2017 academic year and 5,889 seats were created and
utilized within low-performing beneficiary SHSs.
A study on the provision of scholarships to students from low-income families, especially girls
under the project has found that scholarships have large significant impacts on completion rates and
learning outcomes. A randomized control trial of this intervention found that recipients of the
scholarship were 26 percentage points (55 percent) more likely to complete secondary school,
obtained 1.26 more years of secondary education, scored an average of 0.15 standard deviations
greater on a reading and mathematics test, and adopted more preventative health behavior. The
project has provided 5,398 (2,074 in year 1; 3,324 in Year 2) of the 10,000 scholarships to students
from low income families (61 percent of which were for girls).20
The World Bank’s involvement is expected to bring tangible value-added in several key domains.
The World Bank’s global knowledge, technical, and operational expertise will be critical in
providing technical support and consensus building around system and institutional changes, which
are expected to yield economic and social returns in the longer term. The World Bank’s value added
will continue to be significant under the AF. The World Bank has already brought substantial value
added under the parent project by nudging a shift toward a results-based policy making and
supporting innovative interventions such as school mapping and the i-box.
Furthermore, the World Bank has established itself as a trusted partner of the education sector and is
well-positioned to provide technical support to the Government in the rollout of the free SHS policy.
The policy will have significant impacts on the supply and demand of secondary education both
within and outside the scope of this project and the World Bank is expected to play a key role in
ensuring a quality-focused expansion of the sector.
A detailed economic analysis is presented in annex 3.
Technical Analysis PHHASTA
Explanation:
The AF supports the Government strategy to expand access to secondary education given the
increasing demand for post-basic opportunities, generate more sophisticated skills to transform the
20
Duflo, Esther; Pascaline Dupas, and Michael Kremer. 2017 The Impact of Free Secondary Education:
Experimental Evidence from Ghana.

29
labor market and level the playing field to reduce disparities/inequities. The planned rollout of free
SHS for first year students in September, 2017 also necessitates expediting an increase in the supply
of schooling while ensuring that the lower-performing schools strengthen the quality of their
learning environment. The design of the SEIP incentivizes results and payments are made based on
the achievement of the annual targets agreed with the Government. The focus on outcomes
encourages continuous policy dialogue and engagement. The AF would continue to further
incentivize Government efforts to improve the quality of lower-performing schools, particularly
those that service the poorer communities in Ghana. By almost doubling the number of schools
benefitting from quality packages as well as some infrastructure expansion, the SEIP would deepen
the impact in the communities that have not traditionally benefitted from post-basic education. As
the new free SHS policy is implemented, the AF will help inform the decisions about how to
allocate resources more effectively to balance access and quality objectives. With teachers at the
center of school improvement efforts, the AF incentivizes the piloting of different teacher training
methods such as customized materials under the MS4SSA initiative and/or teacher assessment and
training conducted by the African Institute for Mathematical Sciences. The new bursaries would
continue to encourage low-income students to enroll and stay in SHS by defraying private costs to
families that may not be fully covered/subsidized by the new policy. Expanding the quality package
to more schools will help quality improvements to keep pace with expansion and improve the
reputation of schools to attract more students in the future.
Fiduciary Analysis
Explanation:
Financial management arrangements were assessed to (a) ascertain if the current SEIP arrangements
are adequate to support the AF and (b) determine the level of compliance with the financial
covenants by the current project. The assessments concluded that the financial management systems
at both the MOE and GES are adequate and meet the minimum requirements as per World Bank
Policy Operational Policy 10.00. The SEIP’s financial management performance rating is
Moderately Satisfactory and the risk rating is Moderate. The original project has complied with the
financial covenants of submitting acceptable financial reports including audits. The auditors issued
an unqualified opinion on the accounts, and issued a Management Letter to highlight some internal
control weakness which are being addressed to minimize the risk of use of World Bank funds.
The MOE will be tasked with coordinating the activities of the various department and agencies.
Within the MOE, the Director of Finance will be responsible for ensuring compliance with all
fiduciary arrangements, while the Financial Controller of the GES will also be tasked with ensuring
that throughout implementation, there are adequate financial management systems which can
satisfactorily account for and report on the use of project funds. Disbursement under Component 1
provides for achievement of a total of five DLIs which will be measured and valued in monetary
terms for each respective year through a set of identifiable and measurable DLRs totaling 15 to be
achieved over the four-year period. These DLIs are considered significant indicators of performance
that will influence behavioral and policy reforms required to achieve outcomes related to increasing
equitable access to senior secondary education while improving the quality of SHS. Meeting the
defined DLRs as identified in annex 2 and also in the Financing Agreement will constitute the
primary basis for triggering credit disbursements under the Project’s Eligible Expenditure Program
(EEP). The total number of DLR’s have been individually priced, and as such, the eligible
disbursement amount will be the sum of the achieved DLRs multiplied by the unitary monetary
value (price) according to the Disbursement Schedule.
The underlying principle will be to disburse, after project effectiveness, and based on a half-year
forecast of the funding required to potentially achieve the set of DLRs in each year, an advance to

30
the MOE. Subsequently on a half-yearly basis, the borrower will provide satisfactory documentary
evidence including (a) acceptable interim financial reports (IFRs); (b) EEP spending reports; and (c)
evidence of independent verification of the set of DLRs for that particular year which have been
achieved. These reports will then form the basis of documenting for the advances made. Subsequent
advances will be made based on the approval by the World Bank of the next six months forecast of
expenditure.
Component 2 will be implemented under the principles of traditional IPF arrangements using the
report-based disbursement arrangements. Under this approach, the allocated resources will be
advanced to the GES’s Designated Account on the basis of an approved six-monthly forecast of
expenditures, and replenished quarterly for further periods of six months using IFRs prepared by the
GES and or generated from the GIFMIS. The IFRs (including the ‘procurement subject to prior
reviews’ and ‘designated account reconciliation statement’) will serve as the basis for requesting for
advances and also for documentation. The initial disbursement will be based on the consolidated
expenditure forecast for six months, subject to the World Bank’s task team leader and Financial
Management Specialist approval of the estimates. Subsequent replenishments of the Designated
Account would be done quarterly based on the forecast of the net expenditures for the subsequent
half-year period.
Procurement will be carried out, per the New Procurement Framework (NPF), in accordance with
the (a) World Bank Procurement Regulations for IPF -Borrowers Procurement in Investment
Project Financing Goods, Works, Non-Consulting and Consulting Services, dated July 2016; (b) the
‘Guidelines on Preventing and Combating Fraud and Corruption in Projects financed by IBRD
Loans and IDA Credits and Grants’, dated October 15, 2006, revised in January 2011; and (c) the
provisions stipulated in the Financing Agreement. The bid documents will be based on the Standard
Procurement Document, recently enhanced with the Environment, Social Health and Safety sections.
Procurement implementation arrangements remain unchanged. The implementing agency will be the
Ministry of Education (MOE), responsible for the project’s coordination, procurement, contract
management, financial management, and compliance with safeguards policies, in collaboration with
the Ghana Education Service and other relevant agencies under the MOE.
The procurement capacity assessment, in accordance with OCSPR guidelines and Procurement Risk
Assessment and Management System (P-RAMS), indicates that the procurement risk is Substantial
for the project and the prior review thresholds have been set to reflect this rating. These thresholds
are for the purposes of the initial procurement plan for the first 18 months. The thresholds will be
revised periodically based on re-assessment of risks. All contracts not subject to prior review will be
post-reviewed. Procurement post-reviews and technical audits will be carried out annually by the
Bank Procurement Specialist and Technical Specialist or independent auditors and based on the
findings of the reviews the prior review thresholds will be reviewed. The main risks identified are
the following: (i) the use of the NPF; (ii) inadequate monitoring; (iii) weak contract management;
(iv) delays in processing procurement and payments; (v) some political interference; and (vi) fraud
and corruption. The proposed mitigation will include (i) WB to organize and deliver training session
for GES and MOE, on the NPF during the appraisal and immediately after effectiveness, with
hands-on support to the implementing agencies to ensure the proper use of the borrower regulations;
and (ii) intensify training in procurement and contract management by the Bank
The Borrower prepared and the Bank cleared the Procurement Plan which covers the first 18 months
of project implementation. The Procurement Plan will be updated in agreement with the World Bank
Project team at least annually or, as required, to reflect the actual project implementation needs and
improvement in institutional capacity. Systematic Tracking of Exchanges in Procurement (STEP)

31
will be the primary software or platform to be used to submit, review, and clear all Procurement
Plans and prior review procurements. In preparing the Procurement Plan, at all times, the prior
review and methods thresholds associated with the recommended/prevailing procurement risk rating
are applicable.
Social Analysis PHHASSA
Explanation:
Building on the successes of its parent project, the proposed SEIP-AF aims to extend project
coverage to additional low-performing secondary schools in the SEIP targeted districts to strengthen
outcomes for increased equitable access and improved quality of teaching and learning. The AF will
not incentivize new school construction (DLI 2 original SEIP) as this result will be mostly achieved
by the time the AF becomes effective.
As it is with the parent project, the SEIP Additional Financing Project triggers Operational Policy
4.12 on Involuntary Resettlement. Significant land acquisition is not anticipated, however, some of
the activities under Pillar 1, of Component 1 may lead to land take, change in land use, relocation,
and/or restriction of access to sources of livelihoods.
Because the exact locations and the number of people to be affected are not known at this time, the
borrower has updated the Resettlement Policy Framework (RPF) prepared for the parent project to
cover the interventions and regions in which the proposed AF will be implemented. The RPF
outlines measures to avoid and minimize resettlement as well as assist project-affected people in
their effort to improve or at least restore their standards of living. The revised RPF was disclosed in-
country and at the World Bank’s Infoshop on May 27, 2017.
Under the parent project, the client prepared, consulted upon and implemented a Resettlement
Action Plan, which was approved by the World Bank. The client is currently finalizing an
Addendum to the Resettlement Action Plan.
Citizen engagement. The AF will build on the citizen engagement structure designed into the
parent project so as to improve transparency, accountability, and participation. To this end, the
project will continue to sensitize the public to the e-Adido school mapping portal where anyone can
download the app and provide feedback, queries, photos, and comments on the SHS site.
Communications activities have also focused on sensitizing communities located near the
beneficiary schools to encourage enrollment. Grievance redress mechanisms have been established
at all districts and hotlines have been set up. A Beneficiary Survey will be conducted at mid-term
and again at end line to measure beneficiary satisfaction with the project by surveying school-level
stakeholders and using their feedback to inform project implementation.
The proposed AF is expected to have a positive social impact as it will increase equitable access to
quality education for pupils from low-income backgrounds.
Environmental Analysis
Explanation:
The AF would not change the Category ‘B’ rating because the environmental and social impacts
associated with school rehabilitation and construction are expected to continue. The risks are not
substantial as the Government has prepared an excellent Environmental and Social Management
Framework (ESMF) that will be updated to cover the interventions and areas in which the proposed
AF will be implemented. The MOE will be responsible for maintaining capacity for supervising and
advising contractors throughout the lifetime of the project. The additional funds for project

32
management would also support third party audits and reporting to monitor safeguard compliance.
The ESMF was updated and disclosed in-country and at the World Bank’s InfoShop on May 27,
2017.
A Climate Risk and Disaster Screening was undertaken for the project covering climate and
geophysical hazards at project location with ratings on a scale from insufficient understanding; not
exposed or no potential impact or risk, slightly exposed or low potential impact or risk, moderately
exposed or moderate potential impact or risk, and highly exposed or high potential impact or risk.
The hazards identified included extreme temperature, drought, sea-level rise, and strong winds all of
which present low potential impact or low risk. The hazard of extreme precipitation and flooding
presents moderate potential impact or moderate risk. The overall climate risk under the project is
Low. The Climate and Disaster Risk Screening Results Summary is included in the project files.
Risk
Explanation:
The overall risk rating for the AF remains Substantial as Ghana continues to experience significant
fiscal challenges which could hamper achievement of the DLIs. The governance risks also remain
Substantial as a new government takes the helm and attempts to roll out an ambitious free secondary
education policy. The political administrative transition was smoothly attained in January, 2017. The
governance risk of large construction is mitigated under the SEIP AF (there is no new construction
under the AF), and the facilities improvement under Component 1 of the AF is selected based on
transparent and objective criteria, however, governance risks are considered substantial because of
frequent cost overruns on civil works and likely persistent teacher time on task issues in deprived
areas (teacher time on task is not consistently monitored but is estimated to be low). The
macroeconomic risk continues to be rated Substantial given the deteriorating macroeconomic
conditions since 2012. Steadily rising public expenditures in the face of weak revenue mobilization
has led to an increase in the fiscal deficit from 6.3 percent of GDP in 2015 to 8.7 percent of GDP in
2016 (Public Expenditure Review, 2017).
Implementation reliance on multiple institutions and agencies such as MOE, GES, and National
Teaching Council (NTC) has not posed a problem as coordination has been ensured with the
Technical Implementation Committee (TIC). However, the newly established NTC is not yet fully
functional and the capacity to oversee teacher governance is currently not very strong. Therefore, the
AF is designed to provide capacity strengthening of implementing institutions and agencies under
Component 2. The Project Implementation Manual will be updated to further clarify the roles of
implementing institutions and agencies. The plans to fully subsidize public and most of the private
costs for SHS has not been fully costed or budgeted yet. The Government may not be able to readily
afford the additional teachers, operational costs, and quality improvements anticipated over the next
three to five years. The TA/research activities under Component 2 would support more in-depth
modeling, costing and forecasting on the implementation of the free SHS policy. The risks related to
Sector Strategies and Policies are rated Substantial as the Education Sector Plan and other national
plans are currently being reviewed in line with the vision and policy directives of the new
administration. While overall implementation risk remains Substantial, the design risk has been
revised to moderate given the government's good experience implementing an RBF mechanism over
the last two and half years.

33
35. Communities and individuals who believe that they are adversely affected by a World
Bank (WB) supported project may submit complaints to existing project-level grievance
redress mechanisms or the WB’s Grievance Redress Service (GRS). The GRS ensures that
complaints received are promptly reviewed in order to address project-related concerns.
Project affected communities and individuals may submit their complaint to the WB’s
independent Inspection Panel which determines whether harm occurred, or could occur, as a
result of WB non-compliance with its policies and procedures. Complaints may be submitted
at any time after concerns have been brought directly to the World Bank's attention, and Bank
Management has been given an opportunity to respond. For information on how to submit
complaints to the World Bank’s corporate GRS, please visit http://www.worldbank.org/GRS.
For information on how to submit complaints to the World Bank Inspection Panel, please visit
www.inspectionpanel.org.

34
Project Development Objectives
Original Project Development Objective - Parent:
The PDO is to increase access to senior secondary education in underserved districts and improve quality in low-performing senior high schools in Ghana.
Proposed Project Development Objective - Additional Financing (AF): same as above
Results
Core sector indicators are considered: Yes Results reporting level: Project Level
Project Development Objective Indicators
Status Indicator Name Corporate Unit of
Measure Baseline Actual(Current) End Target
Revised Increase in transition rates from JHS3
to SHS1 in targeted districts Percentage Value 39.00 43.00 49.00
Date 01-Oct-2014 31-Oct-2016 01-Nov-2021
Comment Original target was 47%.
Revised Increase in SHS education attainment
within the two poorest quintiles in
targeted districts (disaggregated by
gender)
Percentage Value 8.40 15.00
Date 01-Oct-2014 01-Nov-2021
Comment n.a. Target date revised.
Revised Increase in SHS educational
attainment within the two poorest
quintiles in targeted districts (male)
Percentage Value 11.10 18.90
Date 01-Oct-2014 01-Nov-2021
Comment n.a. Change in target date
Revised Increase in SHS educational
attainment within the two poorest
quintiles in targeted districts (female)
Percentage Value 6.10 11.70
Sub Type Date 01-Oct-2014 01-Nov-2021
Breakdown Comment n.a. Change in target date
Revised Increase in WASSCE achievement of
Percentage Value 10.70 10.70 15.00

35
percentage of students obtaining 6
credits and above within beneficiary
schools (disaggregated by gender)
Date 01-Oct-2014 01-Sep-2016 01-Nov-2021
Comment Male actual was
12.6% (an increase
from 2015 when
achievement was
8.6%).
Target not revised. Change in target
date.
Revised Increase in WASSCE achievement of
percentage of students obtaining 6
credits and above within beneficiary
schools- percentage female
Percentage Value 9.50 8.10 14.30
Sub Type Date 26-Jan-2015 31-Mar-2017 01-Nov-2021
Breakdown Comment This is an increase
from 2015 (5.8%)
Target not revised. Change in target
date.
Revised Direct project beneficiaries
Number Value 0.00 134,658.00 711,000.00
Date 01-Oct-2014 29-Apr-2016 01-Nov-2021
Comment Original target was 276,970.
No
Change
Female beneficiaries
Percentage Value 0.00 45.80 44.10
Sub Type
Supplemental
Intermediate Results Indicators
Status Indicator Name Corporate Unit of
Measure Baseline Actual(Current) End Target
Revised New (additional) SHS seats created
and utilized by SHS students in
targeted schools (cumulative)
Number Value 0.00 3,111.00 15,000.00
Date 01-Oct-2014 31-Mar-2017 01-Nov-2021
Comment Change in target date
Revised Increase in seats created and utilized
within low-performing beneficiary
SHSs (cumulative)
Number Value 0.00 5,889.00 10,000.00
Date 01-Oct-2014 31-Mar-2017 01-Nov-2021
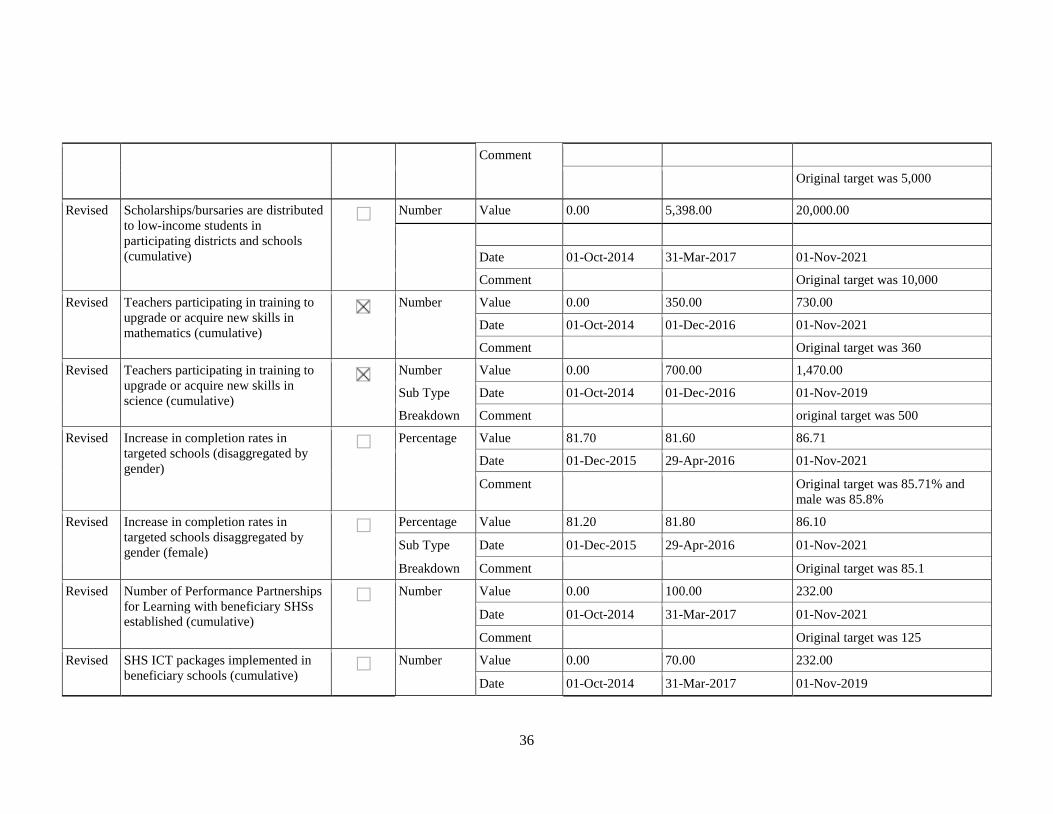
36
Comment
Original target was 5,000
Revised Scholarships/bursaries are distributed
to low-income students in
participating districts and schools
(cumulative)
Number Value 0.00 5,398.00 20,000.00
Date 01-Oct-2014 31-Mar-2017 01-Nov-2021
Comment Original target was 10,000
Revised Teachers participating in training to
upgrade or acquire new skills in
mathematics (cumulative)
Number Value 0.00 350.00 730.00
Date 01-Oct-2014 01-Dec-2016 01-Nov-2021
Comment Original target was 360
Revised Teachers participating in training to
upgrade or acquire new skills in
science (cumulative)
Number Value 0.00 700.00 1,470.00
Sub Type Date 01-Oct-2014 01-Dec-2016 01-Nov-2019
Breakdown Comment original target was 500
Revised Increase in completion rates in
targeted schools (disaggregated by
gender)
Percentage Value 81.70 81.60 86.71
Date 01-Dec-2015 29-Apr-2016 01-Nov-2021
Comment Original target was 85.71% and
male was 85.8%
Revised Increase in completion rates in
targeted schools disaggregated by
gender (female)
Percentage Value 81.20 81.80 86.10
Sub Type Date 01-Dec-2015 29-Apr-2016 01-Nov-2021
Breakdown Comment Original target was 85.1
Revised Number of Performance Partnerships
for Learning with beneficiary SHSs
established (cumulative)
Number Value 0.00 100.00 232.00
Date 01-Oct-2014 31-Mar-2017 01-Nov-2021
Comment Original target was 125
Revised SHS ICT packages implemented in
beneficiary schools (cumulative)
Number Value 0.00 70.00 232.00
Date 01-Oct-2014 31-Mar-2017 01-Nov-2019
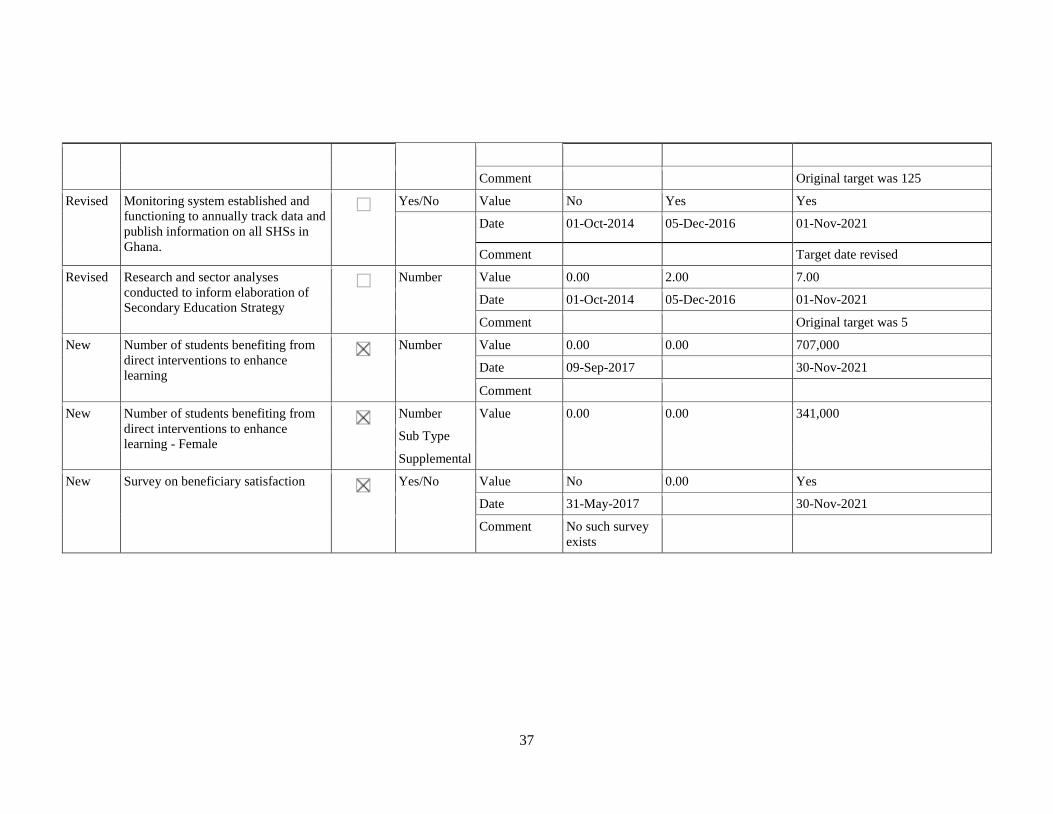
37
Comment Original target was 125
Revised Monitoring system established and
functioning to annually track data and
publish information on all SHSs in
Ghana.
Yes/No Value No Yes Yes
Date 01-Oct-2014 05-Dec-2016 01-Nov-2021
Comment Target date revised
Revised Research and sector analyses
conducted to inform elaboration of
Secondary Education Strategy
Number Value 0.00 2.00 7.00
Date 01-Oct-2014 05-Dec-2016 01-Nov-2021
Comment Original target was 5
New Number of students benefiting from
direct interventions to enhance
learning
Number Value 0.00 0.00 707,000
Date 09-Sep-2017 30-Nov-2021
Comment
New Number of students benefiting from
direct interventions to enhance
learning - Female
Number Value 0.00 0.00 341,000
Sub Type
Supplemental
New Survey on beneficiary satisfaction
Yes/No Value No 0.00 Yes
Date 31-May-2017 30-Nov-2021
Comment No such survey
exists

38
Proposed Changes to Results Framework
Indicator Proposed Revisions Comments/
Rationale for Change
PDO-Level indicators
Increase in transition
rates from JHS3 to SHS1
in targeted districts
Change in end of project target
value:
Original target: 47%
Revised target: 49%
Change in end-of-project target to correspond to
more interventions in each targeted district
Increase in SHS
educational attainment
within two poorest
quintiles in targeted
districts (disaggregated
by gender)
Continued
Adding more schools in the targeted districts
should help increase attainment.
Increase in WASSCE
achievement of
percentage of students
obtaining 6 credits and
above within beneficiary
schools (disaggregated by
gender)
Change in baseline with addition
of additional schools.
The increase in beneficiary schools would require
revised baseline and end-line target values with
yearly target values for an additional 2 years
(through 2021). A separate baseline would be
included for the additional schools being supported
under the AF. This indicator would therefore be
disaggregated by two cohorts of schools (original
SEIP and AF). The increase in the WASSCE is
measured yearly against the baseline.
Direct project
beneficiaries (% female)
(core indicator)
Change in end-of-project target
value:
Original target: 276,970
beneficiaries
Revised target: 711,000
The data on the additional schools would inform
the exact revised number of beneficiaries.
Intermediate Results indicators
Component 1:
Pillar 1: Increase Access with Equity in Senior Secondary Education in underserved districts
New SHS seats created
and utilized by SHS
students in targeted
schools
No change No new construction planned
Increase in seats created
and utilized within low-
performing beneficiary
SHSs
Change in end-of-project target
value
Original target: 5,000
Revised target: 10,000
Scholarships/bursaries
distributed to low-
income students in
participating districts
and schools
Change in end-of-project target
value
Original target: 10,000
Revised target: 20,000
Under the AF, bursaries are provided rather than
scholarships as newly entering students would all
be subsidized by the free SHS education policy.
Scholarships would continue for second- and third-
year students not covered by the new policy.
Pillar 2: Improve Quality in Low-Performing Senior High Schools
Teachers participating in
training to upgrade or
acquire new skills in
mathematics or science
Change in end-of-project target
value
Original target: 860
Revised target: 2,200
Approximately 8 teachers per additional school
would participate in training. This indicator is also
a core corporate report card policy.
Increase in completion Change in end of project target

39
Indicator Proposed Revisions Comments/
Rationale for Change
rates in targeted schools
(disaggregated by
gender)
value
Original target: 85.7%
Revised target: 86.7%
Number of performance
partnerships for learning
with beneficiary SHSs
established
Change in end of project target
value
Original target: 125
Revised target: 232
In addition to the 125 to be established under the
parent project, under the AF, an additional 107 to
be established (in 84 schools in the targeted
districts plus the 23 newly constructed schools).
SHS ICT packages
implemented in
beneficiary schools
Change in end of project target
value:
Original target: 125
Revised target: 232
In addition to the 125 to be established under the
parent project, under the AF an additional 107 to
be established (in 84 schools in the targeted
districts plus the 23 newly constructed schools).
Number of students
benefitting from direct
interventions to enhance
learning
707,000 (341,000 female)
New indicator - corporate report card policy. This indicator will be calculated as part of the
project beneficiary reporting.
Component 2. Management, Research, and Monitoring and Evaluation
Monitoring system
established and
functioning to annually
track data and publish
information on all SHSs
in Ghana
Continued No change
Research and sector
analyses conducted to
inform elaboration of the
Secondary Education
Strategy
Change in end of project target
value:
Original target: 5
Revised target: 7
The additional two years would allow for two
additional sector policy and/or research analyses.
Survey on Beneficiary
satisfaction
End line (yes/no) New indicator - core citizen engagement
indicator. This indicator will measure beneficiary
satisfaction with the SEIP by surveying school-
level stakeholders and using their feedback to
inform project implementation. The survey would
be conducted at the beginning and end of the AF.

40
DLIs
Actions to be
Completed
DLRs
Amount of the
Financing
Allocated per
DLR (US$,
million)
Verification
Source/entity Verification Protocol
DLI 1:
Targeting of
school
expansion in
underserved
school
districts
Achieved in Year 0
(2014)
5.54 Government Report
World Bank
Government list of districts
and schools with data on each
indicator as per agreed
selection criteria.
DLI 2:
Increase in
new seats for
SHS students
in
underserved
school
districts
(original
credit only)
Year 0 - 2014
DLR 2.1: Pre-
construction
requirements met for
new construction in 23
districts (Achieved)
4.64 Environmental
Screening Report;
Resettlement
Action Plans
(RAPs)
Safeguards compliance
through ESMF and RPF
verified in all new
construction sites (screening
and RAPs completed in 23
districts).
Year 1 - 2015
DLR 2.2: About21
30% of all
construction works
completed
(aggregated)
(Achieved)
4.64 Review of Bidding
Documents
World Bank
Complete package of final
bidding documents for new
construction in 23 districts in
line with appraised design
and including facilities
maintenance plans.
Year 2 - 2016
DLR 2.3: About 80%
of all construction
works completed
(aggregated)
(Achieved)
4.64 Third-party
verification
The Government of Ghana
(GoG) report which includes
schematic and site-specific
designs based on agreed
criteria and technical analysis
Year 3 - 2017
DLR 2.4: About
5,000 new seats
created in underserved
districts
4.64 Third-party
verification
Construction implementation
reports verified by mobile
monitoring and monthly
construction supervision
reports.
Year 4 - 2018
DLR 2.5: About 15,000 new
seats created in
underserved districts
(cumulative)
4.64
TOTAL SEIP:
23.20
Third-party
verification
Seat occupancy verified by
school enrollment records,
subsidy collection list, and
construction certificates.
21
The word ‘about’ indicates acceptable range in the absolute quantity to determine the indicator is ‘achieved’ based
on the principle that the spirit of the DLR has been met regardless of a slight difference in the absolute figure. The
range for all ‘about’ indicators would allow for a 5 percent differential as elaborated in the PIM.
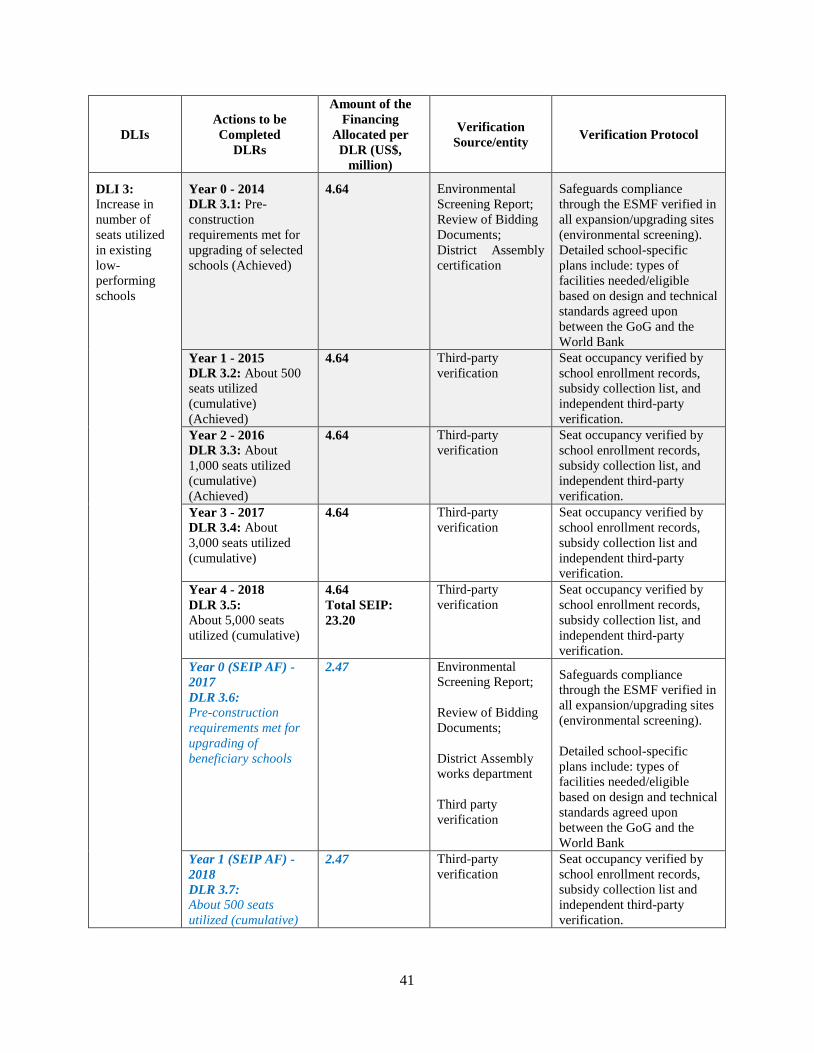
41
DLIs
Actions to be
Completed
DLRs
Amount of the
Financing
Allocated per
DLR (US$,
million)
Verification
Source/entity Verification Protocol
DLI 3: Increase in
number of
seats utilized
in existing
low-
performing
schools
Year 0 - 2014
DLR 3.1: Pre-
construction
requirements met for
upgrading of selected
schools (Achieved)
4.64 Environmental
Screening Report;
Review of Bidding
Documents;
District Assembly
certification
Safeguards compliance
through the ESMF verified in
all expansion/upgrading sites
(environmental screening).
Detailed school-specific
plans include: types of
facilities needed/eligible
based on design and technical
standards agreed upon
between the GoG and the
World Bank
Year 1 - 2015
DLR 3.2: About 500
seats utilized
(cumulative)
(Achieved)
4.64 Third-party
verification
Seat occupancy verified by
school enrollment records,
subsidy collection list, and
independent third-party
verification.
Year 2 - 2016
DLR 3.3: About
1,000 seats utilized
(cumulative)
(Achieved)
4.64 Third-party
verification
Seat occupancy verified by
school enrollment records,
subsidy collection list, and
independent third-party
verification.
Year 3 - 2017
DLR 3.4: About
3,000 seats utilized
(cumulative)
4.64
Third-party
verification
Seat occupancy verified by
school enrollment records,
subsidy collection list and
independent third-party
verification.
Year 4 - 2018
DLR 3.5:
About 5,000 seats
utilized (cumulative)
4.64
Total SEIP:
23.20
Third-party
verification
Seat occupancy verified by
school enrollment records,
subsidy collection list, and
independent third-party
verification.
Year 0 (SEIP AF) -
2017
DLR 3.6:
Pre-construction
requirements met for
upgrading of
beneficiary schools
2.47 Environmental
Screening Report;
Review of Bidding
Documents;
District Assembly
works department
Third party
verification
Safeguards compliance
through the ESMF verified in
all expansion/upgrading sites
(environmental screening).
Detailed school-specific
plans include: types of
facilities needed/eligible
based on design and technical
standards agreed upon
between the GoG and the
World Bank
Year 1 (SEIP AF) -
2018
DLR 3.7:
About 500 seats
utilized (cumulative)
2.47
Third-party
verification
Seat occupancy verified by
school enrollment records,
subsidy collection list and
independent third-party
verification.
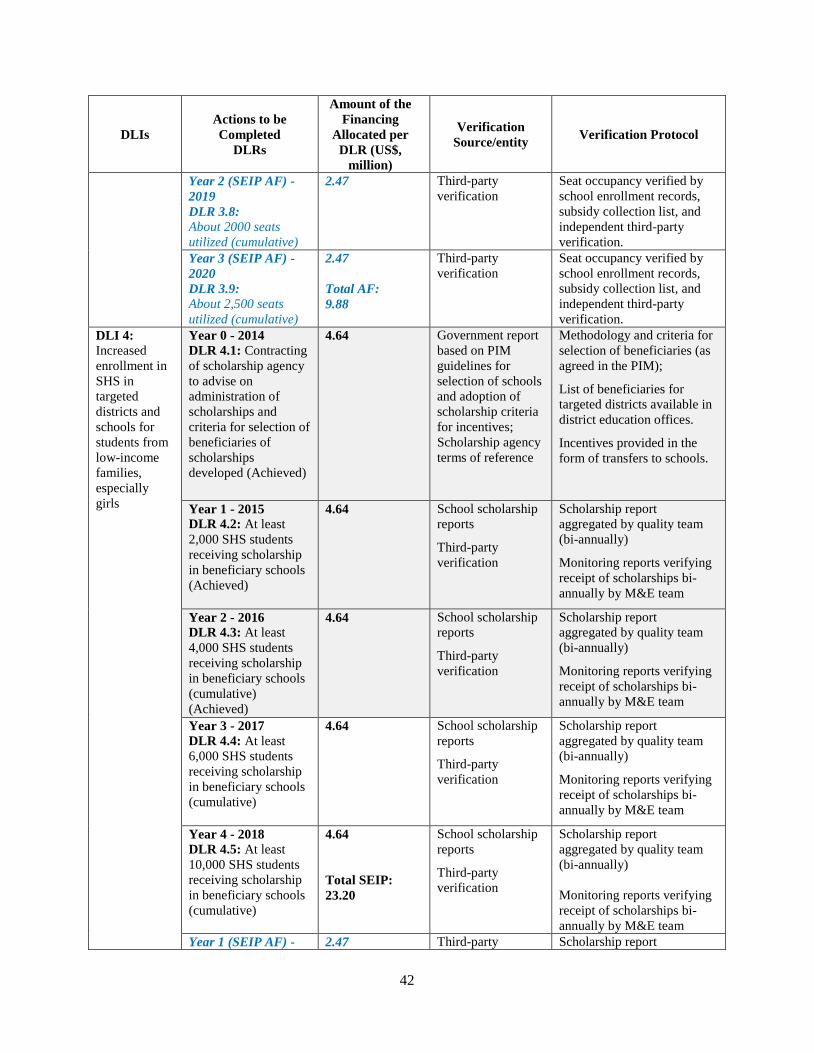
42
DLIs
Actions to be
Completed
DLRs
Amount of the
Financing
Allocated per
DLR (US$,
million)
Verification
Source/entity Verification Protocol
Year 2 (SEIP AF) -
2019
DLR 3.8:
About 2000 seats
utilized (cumulative)
2.47 Third-party
verification
Seat occupancy verified by
school enrollment records,
subsidy collection list, and
independent third-party
verification.
Year 3 (SEIP AF) -
2020
DLR 3.9: About 2,500 seats
utilized (cumulative)
2.47
Total AF:
9.88
Third-party
verification
Seat occupancy verified by
school enrollment records,
subsidy collection list, and
independent third-party
verification.
DLI 4: Increased
enrollment in
SHS in
targeted
districts and
schools for
students from
low-income
families,
especially
girls
Year 0 - 2014
DLR 4.1: Contracting
of scholarship agency
to advise on
administration of
scholarships and
criteria for selection of
beneficiaries of
scholarships
developed (Achieved)
4.64 Government report
based on PIM
guidelines for
selection of schools
and adoption of
scholarship criteria
for incentives;
Scholarship agency
terms of reference
Methodology and criteria for
selection of beneficiaries (as
agreed in the PIM);
List of beneficiaries for
targeted districts available in
district education offices.
Incentives provided in the
form of transfers to schools.
Year 1 - 2015
DLR 4.2: At least
2,000 SHS students
receiving scholarship
in beneficiary schools
(Achieved)
4.64
School scholarship
reports
Third-party
verification
Scholarship report
aggregated by quality team
(bi-annually)
Monitoring reports verifying
receipt of scholarships bi-
annually by M&E team
Year 2 - 2016
DLR 4.3: At least
4,000 SHS students
receiving scholarship
in beneficiary schools
(cumulative)
(Achieved)
4.64 School scholarship
reports
Third-party
verification
Scholarship report
aggregated by quality team
(bi-annually)
Monitoring reports verifying
receipt of scholarships bi-
annually by M&E team
Year 3 - 2017
DLR 4.4: At least
6,000 SHS students
receiving scholarship
in beneficiary schools
(cumulative)
4.64 School scholarship
reports
Third-party
verification
Scholarship report
aggregated by quality team
(bi-annually)
Monitoring reports verifying
receipt of scholarships bi-
annually by M&E team
Year 4 - 2018
DLR 4.5: At least
10,000 SHS students
receiving scholarship
in beneficiary schools
(cumulative)
4.64
Total SEIP:
23.20
School scholarship
reports
Third-party
verification
Scholarship report
aggregated by quality team
(bi-annually)
Monitoring reports verifying
receipt of scholarships bi-
annually by M&E team
Year 1 (SEIP AF) - 2.47 Third-party Scholarship report

43
DLIs
Actions to be
Completed
DLRs
Amount of the
Financing
Allocated per
DLR (US$,
million)
Verification
Source/entity Verification Protocol
2018
DLR 4.6:
At least 5,000 SHS
students receiving
bursaries in
beneficiary schools
verification and
World Bank
supervision
aggregated by quality team
(bi-annually) Monitoring
reports verifying receipt of
scholarships bi-annually by
M&E team
Year 2 (SEIP AF) -
2019
DLR 4.7:
At least 10,000 SHS
students receiving
bursaries in
beneficiary schools
(cumulative)
2.47
TOTAL AF: 4.94
Third-party
verification
Scholarship report
aggregated by quality team
(bi-annually) Monitoring
reports verifying receipt of
scholarships bi-annually by
M&E team
DLI 5: Annual
publication of
School
Performance
Report
Year 1 - FY2014
DLR 5.1: School
mapping of all SHS
completed (Achieved)
4.64 Report on school
mapping exercise
and data provided
to World Bank
(including code
book)
Spatial and geographic
mapping based on verifiable
data and a number of key
indicators; published as a
report by 2015 National
Education Sector Annual
Review (NESAR).
Year 2 - 2016
DLR 5.2: Publication
of updated school
performance data for
FY2015/16 online and
in brochure (Partially
Achieved)
4.64 Online school
performance data
Linked to the MOE
website and web
platform for mobile
monitoring
Annual publication includes
analysis of school-level data
with particular emphasis on
learning outcomes, equity
(including participation of
girls), new student
enrollment, and infrastructure
conditions.
Year 3 - 2017
DLR 5.3: Publication
of updated school
performance data for
FY2016/17 online and
in brochure
4.64 Online school
performance data
Linked to the MOE
website and web
platform for mobile
monitoring
Annual publication includes
analysis of school-level data
with particular emphasis on
learning outcomes, equity
(including participation of
girls), new student
enrollment, and infrastructure
conditions.
Year 4 - 2018
DLR 5.4: Publication
of updated school
performance data for
FY2017/18 online and
in brochure
4.64
TOTAL SEIP:
18.56
Online school
performance data
Linked to the MOE
website and web
platform for mobile
monitoring
Annual publication includes
analysis of school-level data
with particular emphasis on
learning outcomes, equity
(including participation of
girls), new student
enrollment, and infrastructure
conditions.
Year 2 (SEIP AF) -
2019
DLR 5.5:
Publication of updated
2.47
Online school
performance data
Linked to the MOE
Annual publication includes
analysis of school-level data
with particular emphasis on
learning outcomes, equity
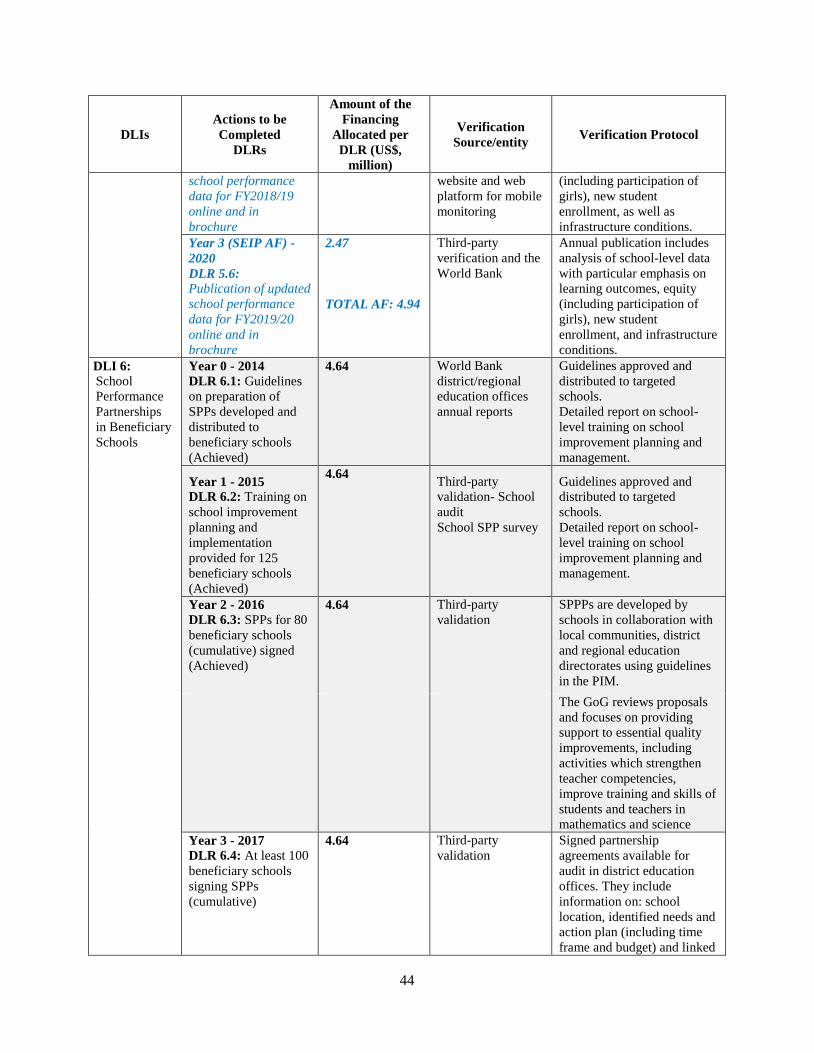
44
DLIs
Actions to be
Completed
DLRs
Amount of the
Financing
Allocated per
DLR (US$,
million)
Verification
Source/entity Verification Protocol
school performance
data for FY2018/19
online and in
brochure
website and web
platform for mobile
monitoring
(including participation of
girls), new student
enrollment, as well as
infrastructure conditions.
Year 3 (SEIP AF) -
2020
DLR 5.6:
Publication of updated
school performance
data for FY2019/20
online and in
brochure
2.47
TOTAL AF: 4.94
Third-party
verification and the
World Bank
Annual publication includes
analysis of school-level data
with particular emphasis on
learning outcomes, equity
(including participation of
girls), new student
enrollment, and infrastructure
conditions.
DLI 6: School
Performance
Partnerships
in Beneficiary
Schools
Year 0 - 2014
DLR 6.1: Guidelines
on preparation of
SPPs developed and
distributed to
beneficiary schools
(Achieved)
4.64
World Bank
district/regional
education offices
annual reports
Guidelines approved and
distributed to targeted
schools.
Detailed report on school-
level training on school
improvement planning and
management.
Year 1 - 2015
DLR 6.2: Training on
school improvement
planning and
implementation
provided for 125
beneficiary schools
(Achieved)
4.64 Third-party
validation- School
audit
School SPP survey
Guidelines approved and
distributed to targeted
schools.
Detailed report on school-
level training on school
improvement planning and
management.
Year 2 - 2016
DLR 6.3: SPPs for 80
beneficiary schools
(cumulative) signed
(Achieved)
4.64
Third-party
validation
SPPPs are developed by
schools in collaboration with
local communities, district
and regional education
directorates using guidelines
in the PIM.
The GoG reviews proposals
and focuses on providing
support to essential quality
improvements, including
activities which strengthen
teacher competencies,
improve training and skills of
students and teachers in
mathematics and science
Year 3 - 2017
DLR 6.4: At least 100
beneficiary schools
signing SPPs
(cumulative)
4.64
Third-party
validation
Signed partnership
agreements available for
audit in district education
offices. They include
information on: school
location, identified needs and
action plan (including time
frame and budget) and linked

45
DLIs
Actions to be
Completed
DLRs
Amount of the
Financing
Allocated per
DLR (US$,
million)
Verification
Source/entity Verification Protocol
to predefined learning
objectives.
Year 4 - 2018
DLR 6.5: At least
95% of beneficiary
schools implementing
SPPs based on SPPPs
(cumulative)
4.64
TOTAL SEIP:
23.20
Third-party
validation- school
audit
School SPP survey
Signed partnership
agreements available for
audit in district education
offices. They include
information on: school
location, identified needs and
action plan (including time
frame and budget) and linked
to predefined learning
objectives.
Financial management
quarterly interim unaudited
financial reports (IUFRs)
transfers to schools for SPPs.
Year 0 (SEIP AF) -
2017
DLR 6.6: Training on school
improvement planning
and implementation
provided for
additional schools;
Guidelines on SPPs
distributed to
additional schools and
about 50% of the
additional schools
have signed SPPs
2.47 Third-party
validation
Guidelines approved and
distributed to targeted
schools.
Detailed report on school-
level training on school
improvement planning and
management.
SPPPs are developed by
schools in collaboration with
local communities, district
and regional education
directorates using guidelines
in the PIM.
Year 1 (SEIP AF) -
2018
DLR 6.7:
SPPs for at least 95%
of additional schools
signed and
implemented
2.47 Third-party
validation
Signed SPPs available for
audit in district education
offices. They include
information on school
location, identified needs and
action plan (including time
frame and budget) and linked
to predefined learning
objectives.
Financial management
quarterly IUFR transfers to
schools for SPPs.
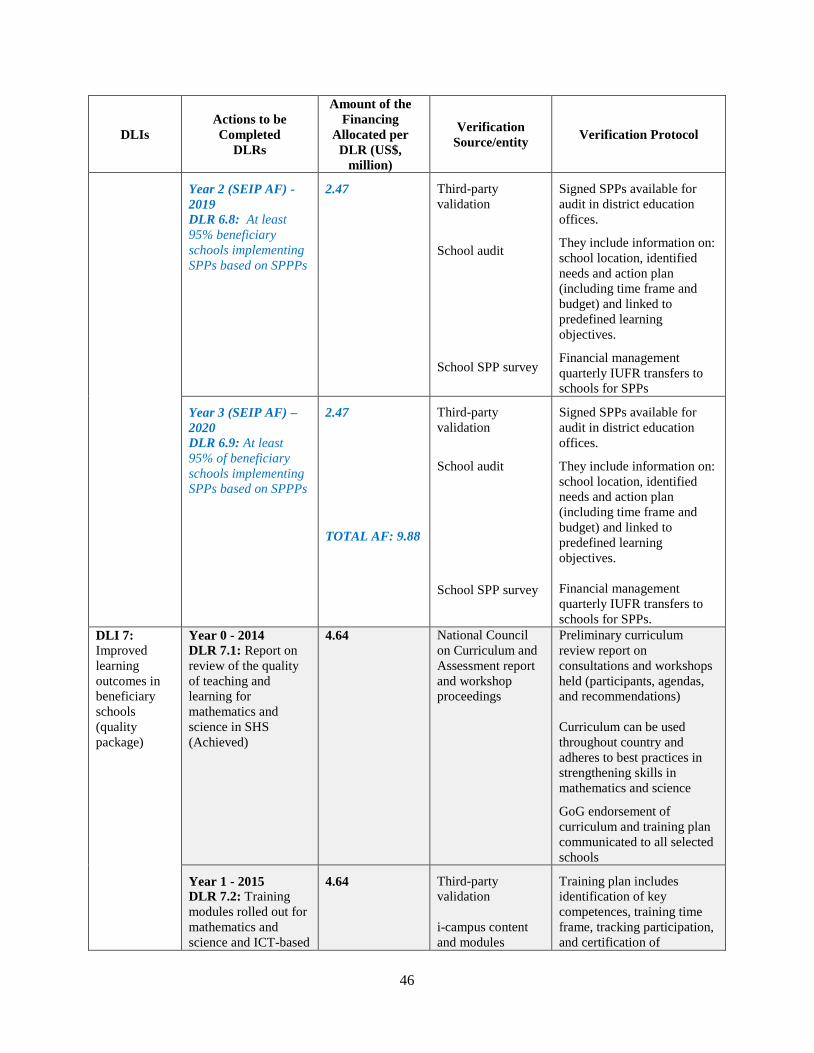
46
DLIs
Actions to be
Completed
DLRs
Amount of the
Financing
Allocated per
DLR (US$,
million)
Verification
Source/entity Verification Protocol
Year 2 (SEIP AF) -
2019
DLR 6.8: At least
95% beneficiary
schools implementing
SPPs based on SPPPs
2.47 Third-party
validation
School audit
School SPP survey
Signed SPPs available for
audit in district education
offices.
They include information on:
school location, identified
needs and action plan
(including time frame and
budget) and linked to
predefined learning
objectives.
Financial management
quarterly IUFR transfers to
schools for SPPs
Year 3 (SEIP AF) –
2020
DLR 6.9: At least
95% of beneficiary
schools implementing
SPPs based on SPPPs
2.47
TOTAL AF: 9.88
Third-party
validation
School audit
School SPP survey
Signed SPPs available for
audit in district education
offices.
They include information on:
school location, identified
needs and action plan
(including time frame and
budget) and linked to
predefined learning
objectives.
Financial management
quarterly IUFR transfers to
schools for SPPs.
DLI 7: Improved
learning
outcomes in
beneficiary
schools
(quality
package)
Year 0 - 2014
DLR 7.1: Report on
review of the quality
of teaching and
learning for
mathematics and
science in SHS
(Achieved)
4.64
National Council
on Curriculum and
Assessment report
and workshop
proceedings
Preliminary curriculum
review report on
consultations and workshops
held (participants, agendas,
and recommendations)
Curriculum can be used
throughout country and
adheres to best practices in
strengthening skills in
mathematics and science
GoG endorsement of
curriculum and training plan
communicated to all selected
schools
Year 1 - 2015
DLR 7.2: Training
modules rolled out for
mathematics and
science and ICT-based
4.64
Third-party
validation
i-campus content
and modules
Training plan includes
identification of key
competences, training time
frame, tracking participation,
and certification of

47
DLIs
Actions to be
Completed
DLRs
Amount of the
Financing
Allocated per
DLR (US$,
million)
Verification
Source/entity Verification Protocol
instruction developed
for school use
(Achieved)
finalized, rolled out
and reported by
Center for Distance
Learning
completion.
ICT equipment provided to
all selected schools,
including i-campus packages;
National Information
Technology Agency (NITA)
provided Wi-Fi connectivity
verified by service contracts.
Year 2 - 2016
DLR 7.3: ICT-based
instruction rolled out
in about 50% of
selected schools
(cumulative).
(Achieved)
4.64
Third-party
validation
ICT equipment provided to
selected schools, including i-
campus packages (core
curriculum modules and on
and offline capabilities);
NITA provided Wi-Fi
connectivity verified by
service contracts.
Year 3 - 2017
DLR 7.4: ICT-based
instruction rolled out
in at least 95% of
selected schools
(cumulative)
4.64
Annual school
survey
WASSCE report
Third-party
validation
ICT equipment provided to
all selected schools,
including i-campus packages
(core curriculum modules
and on and offline
capabilities); NITA provided
Wi-Fi connectivity verified
by service contracts.
Annual report includes
information on: rollout
activities, targeting, planned
attendance, number of
teachers successfully
completing training and
demonstrating improved
content knowledge in
mathematics and science,
pedagogical and classroom
management skills

48
DLIs
Actions to be
Completed
DLRs
Amount of the
Financing
Allocated per
DLR (US$,
million)
Verification
Source/entity Verification Protocol
Year 4 - 2018
DLR 7.5: Increase the
percentage of students
obtaining 6 credits and
above WASSCE
scores averaged in
beneficiary schools
4.64
TOTAL SEIP:
23.20
Annual report includes
information on: rollout
activities, targeting, planned
attendance, number of
teachers successfully
completing training and
demonstrating improved
content knowledge in
mathematics and science,
pedagogical and classroom
management skills
Year 1 (SEIP AF) -
2018
DLR 7.6: Science and
mathematics teachers
trained and ICT-based
instruction rolled out
in at least 95%
additional schools
2.47
Annual report includes
information on: rollout
activities, targeting, planned
attendance, number of
teachers successfully
completing training and
demonstrating improved
content knowledge in
mathematics and science,
pedagogical and classroom
management skills.
ICT equipment provided to
all selected schools,
including i-campus packages
(core curriculum modules
and on and offline
capabilities); NITA provided
Wi-Fi connectivity verified
by service contracts.
Year 2 (SEIP AF) -
2019 DLR 7.7:
Increase the
percentage of students
obtaining 6 credits
and above WASSCE
scores averaged in
beneficiary schools
2.47
WASSCE results aggregated
for beneficiary schools.
Increase is measured against
baseline.
Year 3 – (SEIP AF)
DLR 7.8: 2020
Increase the
percentage of students
obtaining 6 credits
and above WASSCE
2.47
WASSCE results aggregated
for beneficiary schools.
Increase is measured against
baseline.

49
DLIs
Actions to be
Completed
DLRs
Amount of the
Financing
Allocated per
DLR (US$,
million)
Verification
Source/entity Verification Protocol
scores averaged in
beneficiary schools
TOTAL AF: 7.41
TOTAL SEIP 140.10
TOTAL SEIP AF 37.00
TOTAL Component 1 177.1
Note: Shaded DLRs have been achieved under the first three years of the SEIP and funds were released
against the DLRs. Italicized DLRs represent SEIP AF results.
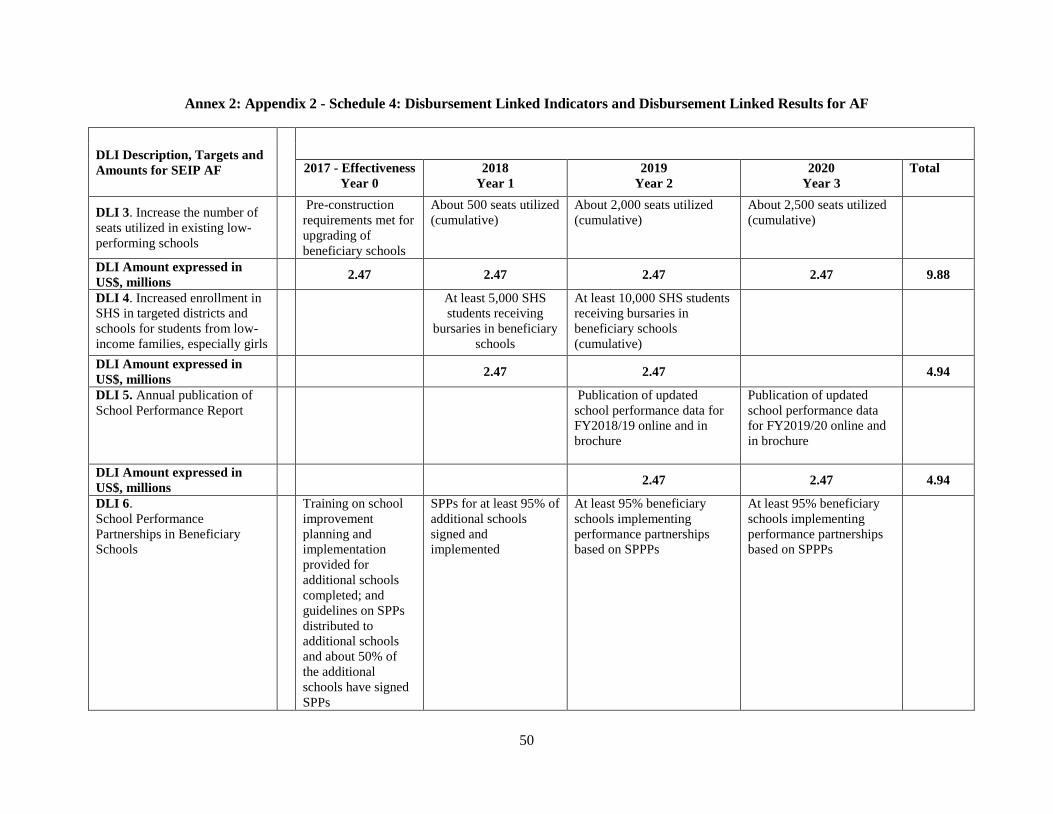
50
Annex 2: Appendix 2 - Schedule 4: Disbursement Linked Indicators and Disbursement Linked Results for AF
DLI Description, Targets and
Amounts for SEIP AF
2017 - Effectiveness
Year 0
2018
Year 1
2019
Year 2
2020
Year 3
Total
DLI 3. Increase the number of
seats utilized in existing low-
performing schools
Pre-construction
requirements met for
upgrading of
beneficiary schools
About 500 seats utilized
(cumulative)
About 2,000 seats utilized
(cumulative)
About 2,500 seats utilized
(cumulative)
DLI Amount expressed in
US$, millions 2.47 2.47 2.47 2.47 9.88
DLI 4. Increased enrollment in
SHS in targeted districts and
schools for students from low-
income families, especially girls
At least 5,000 SHS
students receiving
bursaries in beneficiary
schools
At least 10,000 SHS students
receiving bursaries in
beneficiary schools
(cumulative)
DLI Amount expressed in
US$, millions
2.47 2.47 4.94
DLI 5. Annual publication of
School Performance Report Publication of updated
school performance data for
FY2018/19 online and in
brochure
Publication of updated
school performance data
for FY2019/20 online and
in brochure
DLI Amount expressed in
US$, millions
2.47 2.47 4.94
DLI 6.
School Performance
Partnerships in Beneficiary
Schools
Training on school
improvement
planning and
implementation
provided for
additional schools
completed; and
guidelines on SPPs
distributed to
additional schools
and about 50% of
the additional
schools have signed
SPPs
SPPs for at least 95% of
additional schools
signed and
implemented
At least 95% beneficiary
schools implementing
performance partnerships
based on SPPPs
At least 95% beneficiary
schools implementing
performance partnerships
based on SPPPs

51
DLI Description, Targets and
Amounts for SEIP AF
2017 - Effectiveness
Year 0
2018
Year 1
2019
Year 2
2020
Year 3
Total
DLI Amount expressed in
US$, millions
2.47 2.47 2.47 2.47 9.88
DLI 7. Improved learning
outcomes in beneficiary schools
(quality package)
Science and
mathematics teachers
trained and ICT-based
instruction rolled out in
additional schools
Increase in percentage of
students obtaining 6 credits
and above WASSCE scores
averaged in beneficiary
schools
Increase in percentage of
students obtaining 6 credits
and above WASSCE
scores averaged in
beneficiary schools
DLI Amount expressed in
US$, millions
2.47 2.47 2.47 7.41
Total DLI Amount expressed
in US$, millions
37

52
Annex 2: Appendix 3 - SEIP and SEIP AF Targets and Indicative Timeline for DLI Achievement Total
Financing
Allocated to
DLI under
AF (US$
million)
As % of
Total
Financin
g
Amount
of AF
Targets and Indicative Time Line for DLI Achievement Rationale for
Change from
Original Year 0
(2014)
Year 1
(2015)
Year 2
(2016)
Year 3
(2017)
Year 0
(AF)
Year 4
(2018)
Year 1
(AF)
Year 5
(2019)
Year 2
(AF)
Year 6
(2020)
Year 3
(AF)
Total
DLI 1 Targeting of school expansion in underserved school district (met in Year 0 - 2014) US$5.54 million
Allocated
amount
(US$,
millions)
5.54
(Achieved)
— — — — — — 5.54 Achieved
DLI 2 Increase in new seats for SHS students in underserved school districts22
Pre-
constructio
n
requirement
s met for
new
constructio
n in 23
districts
About
30% of all
constructi
on works
completed
(aggregate
d)
About 80%
of all
construction
works
completed
(aggregated)
About
5,000 new
seats
created in
underserve
d districts
About
15,000 new
seats created
in
underserved
districts
(cumulative)
Status of
Achievemen
t/Disbursem
ent
100%
US$4.64
millions
100%
US$4.64
millions
100%
US$4.64
millions
Allocated
amount
(US$,
millions)
4.64 4.64 23.2 No new
schools to be
constructed
DLI 3: Increase in number of seats utilized in existing low-performing schools
Pre-
constructio
n
About 500
seats
utilized
About 1,000
seats utilized
(cumulative)
About
3,000
seats
About 5,500
seats utilized
(cumulative)
About
7,500
seats
About
10,000
seats
Includes
facilities
upgrading in
22
This DLI will not be continued under the AF.

53
Total
Financing
Allocated to
DLI under
AF (US$
million)
As % of
Total
Financin
g
Amount
of AF
Targets and Indicative Time Line for DLI Achievement Rationale for
Change from
Original Year 0
(2014)
Year 1
(2015)
Year 2
(2016)
Year 3
(2017)
Year 0
(AF)
Year 4
(2018)
Year 1
(AF)
Year 5
(2019)
Year 2
(AF)
Year 6
(2020)
Year 3
(AF)
Total
requirement
s met for
upgrading
of selected
schools
(cumulativ
e)
utilized
(cumulativ
e)
Pre-
constructi
on
requireme
nts met for
upgrading
of
additional
schools
utilize
d
(cumul
ative)
utilized
(cumulat
ive)
75 schools out
of 125. AF for
Years 1, 2,
and 3
correspond to
Years 4, 5 and
6 of original
SEIP and
provide
additional
seats of 500;
2,000; and
2,500
respectively
Status of
Achievemen
t/Disbursem
ent
100%
US$4.64
million
100%
US$4.64
million
100%
US$4.64
million
Allocated
amount
(US$,
millions)
9.88 25% 4.64
(original)
2.47
(AF)
4.64
(original)
2.47
(AF)
2.47
(AF)
2.47
(AF)
33.08
DLI 4: Increased enrollment in SHS in targeted districts and schools for students from low-income families, especially girls
Contracting
of
scholarship
agency to
advise on
administrati
on of
scholarship
s completed
At least
2,000 SHS
students
receiving
scholarshi
p in
beneficiar
y schools
At least
4,000 SHS
students
receiving
scholarship
in
beneficiary
schools
(cumulative)
At least
6,000 SHS
students
receiving
scholarshi
p in
beneficiar
y schools
(Cumulati
At least
10,000 SHS
students
receiving
scholarship
in
beneficiary
schools
(cumulative)
At
least
10,000
SHS
student
s
receivi
ng
bursari
Includes
additional
bursaries to
low-income
students
across all
beneficiary
schools.

54
Total
Financing
Allocated to
DLI under
AF (US$
million)
As % of
Total
Financin
g
Amount
of AF
Targets and Indicative Time Line for DLI Achievement Rationale for
Change from
Original Year 0
(2014)
Year 1
(2015)
Year 2
(2016)
Year 3
(2017)
Year 0
(AF)
Year 4
(2018)
Year 1
(AF)
Year 5
(2019)
Year 2
(AF)
Year 6
(2020)
Year 3
(AF)
Total
and criteria
for
selection of
beneficiarie
s of
scholarship
s developed
ve)
At least
5,000 SHS
students
receiving
bursaries in
beneficiary
schools (AF)
es in
benefic
iary
school
s
(cumul
ative)
(AF)
Bursaries
replace
scholarships
as free SHS is
rolled out.
Status of
Achievemen
t/Disbursem
ent
100%
US$4.64
million
100%
US$4.64
million
100%
US$4.64
million
Allocated
amount
(US$,
millions)
4.94 12% 4.64
(original)
4.64
(original)
2.47 m
(AF)
2.47
(AF)
28.14
DLI 5: Annual Publication of School Performance Report
School
mapping
of all SHS
completed
Publication
of updated
school
performance
data for
FY2015/16
online and in
brochure
Publicatio
n of
updated
school
performan
ce data for
FY2016/1
7 online
and in
brochure
Publication
of updated
school
performance
data for
FY2017/18
online and in
brochure
Public
ation
of
update
d
school
perfor
mance
data
for
FY201
8/19
online
and in
brochu
Publicati
on of
updated
school
perform
ance
data for
FY2019/
20
online
and in
brochure
AF would
support
performance
report
published in
last two years
of SEIP
implementatio
n.

55
Total
Financing
Allocated to
DLI under
AF (US$
million)
As % of
Total
Financin
g
Amount
of AF
Targets and Indicative Time Line for DLI Achievement Rationale for
Change from
Original Year 0
(2014)
Year 1
(2015)
Year 2
(2016)
Year 3
(2017)
Year 0
(AF)
Year 4
(2018)
Year 1
(AF)
Year 5
(2019)
Year 2
(AF)
Year 6
(2020)
Year 3
(AF)
Total
re
Status of
Achievemen
t/Disbursem
ent
100%
US$4.64
million
Allocated
amount
(US$,
millions)
4.94 12% 4.64
(original)
4.64
(original)
4.64
(original)
2.47
(AF)
2.47
(AF)
23.5
DLI 6: School Performance Partnerships in Beneficiary Schools
Guidelines
on
preparation
of SPPs
developed
and
distributed
to
beneficiary
schools
Training
on school
improvem
ent
planning
and
implement
ation
provided
for 125
beneficiar
y schools
SPPs for 80
beneficiary
schools
signed
SPPs for
at least
100
beneficiar
y schools
signed
(cumulativ
e)
Training
on school
improvem
ent
planning
and
implement
ation
provided
for
At least 95%
of
beneficiary
schools
implementin
g SPPs based
on SPPPs
SPPs for at
least 95% of
additional
schools
signed and
implemented
At
least
95% of
benefic
iary
school
s
imple
mentin
g SPPs
based
on
SPPPs
At least
95% of
benefici
ary
schools
impleme
nting
SPPs
based on
SPPPs
125 original
SPPs plus
estimated 107
additional
SPPs

56
Total
Financing
Allocated to
DLI under
AF (US$
million)
As % of
Total
Financin
g
Amount
of AF
Targets and Indicative Time Line for DLI Achievement Rationale for
Change from
Original Year 0
(2014)
Year 1
(2015)
Year 2
(2016)
Year 3
(2017)
Year 0
(AF)
Year 4
(2018)
Year 1
(AF)
Year 5
(2019)
Year 2
(AF)
Year 6
(2020)
Year 3
(AF)
Total
additional
schools;
Guidelines
on SPPs
distributed
to
additional
schools
and about
50%
additional
schools
have
signed
SPPs.
Status of
Achievemen
t/Disbursem
ent
100%
US$4.64
million
100%
US$4.64
million
100%
US$4.64
million
Allocated
amount
(US$,
millions)
9.88 25% 4.64
(original)
2.47
(AF)
4.64
(original)
2.47
(AF)
2.47
(AF)
2.47
(AF)
33.08
DLI:7: Improved Learning Outcomes in beneficiary schools
Report on
review of
the quality
of teaching
and
learning for
mathematic
Training
modules
rolled out
for
mathemati
cs and
science
ICT based
instruction
rolled out in
about 50%
of targeted
schools
(cumulative)
ICT based
instruction
rolled out
in at least
95% of
beneficiar
y schools
Increase in
percentage
of students
obtaining 6
credits and
above
WASSCE
Increas
e in
percent
age of
student
s
obtaini
Increase
in
percenta
ge of
students
obtainin
g 6
Original 125
schools plus
23 newly
constructed
schools and
84 additional
schools in
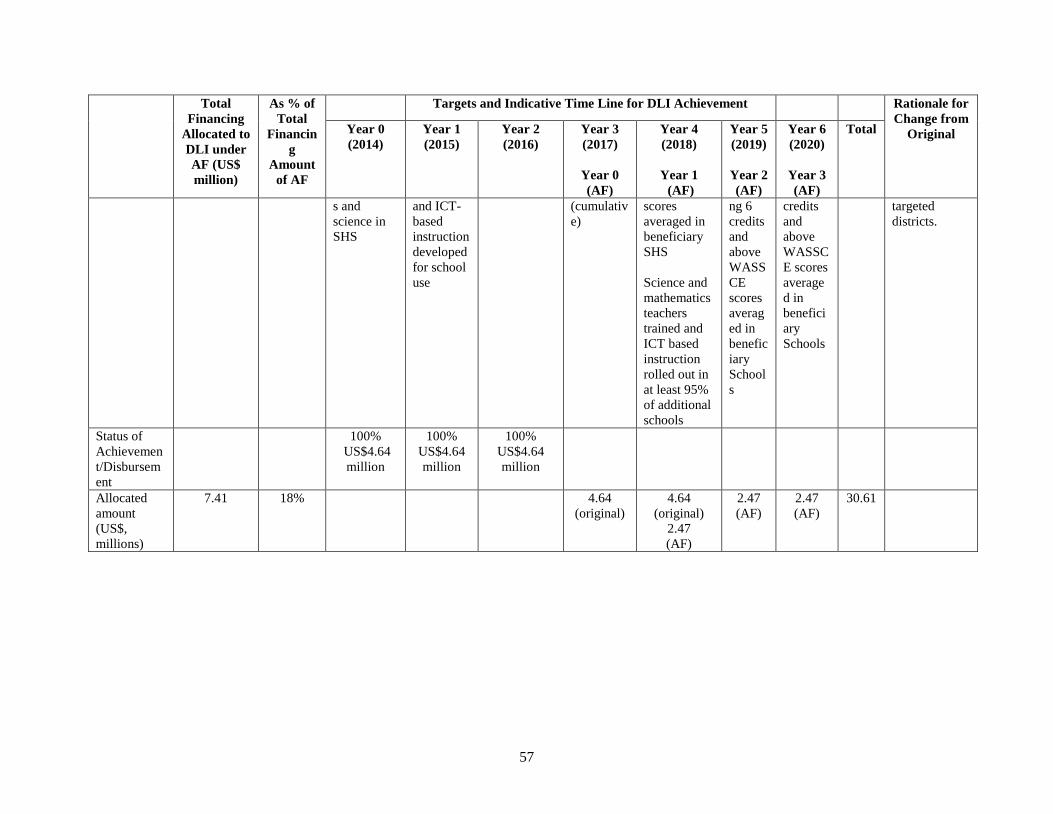
57
Total
Financing
Allocated to
DLI under
AF (US$
million)
As % of
Total
Financin
g
Amount
of AF
Targets and Indicative Time Line for DLI Achievement Rationale for
Change from
Original Year 0
(2014)
Year 1
(2015)
Year 2
(2016)
Year 3
(2017)
Year 0
(AF)
Year 4
(2018)
Year 1
(AF)
Year 5
(2019)
Year 2
(AF)
Year 6
(2020)
Year 3
(AF)
Total
s and
science in
SHS
and ICT-
based
instruction
developed
for school
use
(cumulativ
e)
scores
averaged in
beneficiary
SHS
Science and
mathematics
teachers
trained and
ICT based
instruction
rolled out in
at least 95%
of additional
schools
ng 6
credits
and
above
WASS
CE
scores
averag
ed in
benefic
iary
School
s
credits
and
above
WASSC
E scores
average
d in
benefici
ary
Schools
targeted
districts.
Status of
Achievemen
t/Disbursem
ent
100%
US$4.64
million
100%
US$4.64
million
100%
US$4.64
million
Allocated
amount
(US$,
millions)
7.41 18% 4.64
(original)
4.64
(original)
2.47
(AF)
2.47
(AF)
2.47
(AF)
30.61
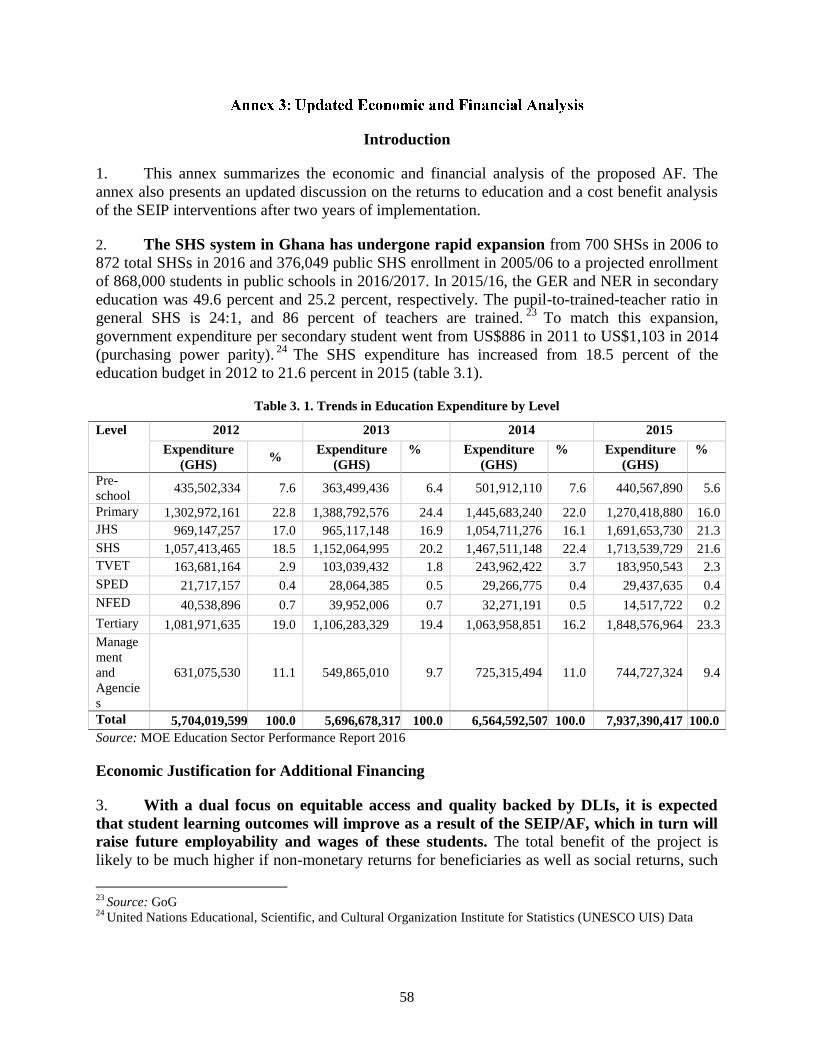
58
Introduction
1. This annex summarizes the economic and financial analysis of the proposed AF. The
annex also presents an updated discussion on the returns to education and a cost benefit analysis
of the SEIP interventions after two years of implementation.
2. The SHS system in Ghana has undergone rapid expansion from 700 SHSs in 2006 to
872 total SHSs in 2016 and 376,049 public SHS enrollment in 2005/06 to a projected enrollment
of 868,000 students in public schools in 2016/2017. In 2015/16, the GER and NER in secondary
education was 49.6 percent and 25.2 percent, respectively. The pupil-to-trained-teacher ratio in
general SHS is 24:1, and 86 percent of teachers are trained.23
To match this expansion,
government expenditure per secondary student went from US$886 in 2011 to US$1,103 in 2014
(purchasing power parity).24
The SHS expenditure has increased from 18.5 percent of the
education budget in 2012 to 21.6 percent in 2015 (table 3.1).
Table 3. 1. Trends in Education Expenditure by Level
Level 2012 2013 2014 2015
Expenditure
(GHS) %
Expenditure
(GHS)
% Expenditure
(GHS)
% Expenditure
(GHS)
%
Pre-
school 435,502,334 7.6 363,499,436 6.4 501,912,110 7.6 440,567,890 5.6
Primary 1,302,972,161 22.8 1,388,792,576 24.4 1,445,683,240 22.0 1,270,418,880 16.0
JHS 969,147,257 17.0 965,117,148 16.9 1,054,711,276 16.1 1,691,653,730 21.3
SHS 1,057,413,465 18.5 1,152,064,995 20.2 1,467,511,148 22.4 1,713,539,729 21.6
TVET 163,681,164 2.9 103,039,432 1.8 243,962,422 3.7 183,950,543 2.3
SPED 21,717,157 0.4 28,064,385 0.5 29,266,775 0.4 29,437,635 0.4
NFED 40,538,896 0.7 39,952,006 0.7 32,271,191 0.5 14,517,722 0.2
Tertiary 1,081,971,635 19.0 1,106,283,329 19.4 1,063,958,851 16.2 1,848,576,964 23.3
Manage
ment
and
Agencie
s
631,075,530 11.1 549,865,010 9.7 725,315,494 11.0 744,727,324 9.4
Total 5,704,019,599 100.0 5,696,678,317 100.0 6,564,592,507 100.0 7,937,390,417 100.0
Source: MOE Education Sector Performance Report 2016
Economic Justification for Additional Financing
3. With a dual focus on equitable access and quality backed by DLIs, it is expected
that student learning outcomes will improve as a result of the SEIP/AF, which in turn will
raise future employability and wages of these students. The total benefit of the project is
likely to be much higher if non-monetary returns for beneficiaries as well as social returns, such
23
Source: GoG 24
United Nations Educational, Scientific, and Cultural Organization Institute for Statistics (UNESCO UIS) Data

59
as increased aggregate productivity (over and above the direct effect on individual productivity),
reduced crime, and improved political participation are considered (see table 3.2).
Table 3.2. Types of Return to Education
Benefits Costs
Private (individual) Earnings (due to productivity)
Employability
Mobility
Quality of life
Direct cost: Tuition, boarding,
textbooks and so on
Indirect (opportunity) cost: Forgone
earnings
Social (public) Economic growth: More adaptable labor
force, technology adaptation, and
entrepreneurship
Externalities: Innovation
Saved expenses: From social benefits
Project cost
State’s spending
4. Private rates of return are used to explain the behavior of individuals in seeking
different education levels. Estimates of the returns to schooling and to potential experience are
a useful indicator of an individual’s productivity. The private rates of return to secondary
education in Ghana increased from 7.8 percent in 2005 to 8.8 percent in 2012. Within secondary
education, returns are higher for females (11 percent) than males (6.5 percent). The returns to
secondary education in Ghana are higher than the global average for secondary education (6.8
percent) but lower than the Sub-Saharan African average of 10.6 percent (tables 3.3 and 3.4).25
While there are methodological challenges associated with using Mincerian regressions—as the
controlling for covariates method does not address the endogeneity problem in the estimation
caused by unobservable characteristics like ability and motivation—they provide a useful
indicator of the productivity of individuals by level of education.
Table 3.3. Trends in Returns to Education in Ghana
Returns 2005 2012 Direction of Change
Return to another year of schooling 10.30 12.50
Standard deviation of return to another year of schooling 4.60 4.60
Returns to education total primary 4.70 2.70
Returns to education total secondary 7.80 8.80
Returns to education total tertiary 23.20 28.70
Returns to schooling male secondary 6.80 6.50
Returns to schooling female secondary 8.40 11.00
Source: Montenegro, Claudio E. and Harry Anthony Patrinos. 2014. “Comparable Estimates of Returns to Schooling
Around the World.” Policy Research Working Paper No. WPS 7020. Washington, DC: World Bank.
25
Montenegro, Claudio E. and Harry Anthony Patrinos. 2014. “Comparable Estimates of Returns to Schooling
Around the World.” Policy Research Working Paper No. WPS 7020. Washington, DC: World Bank
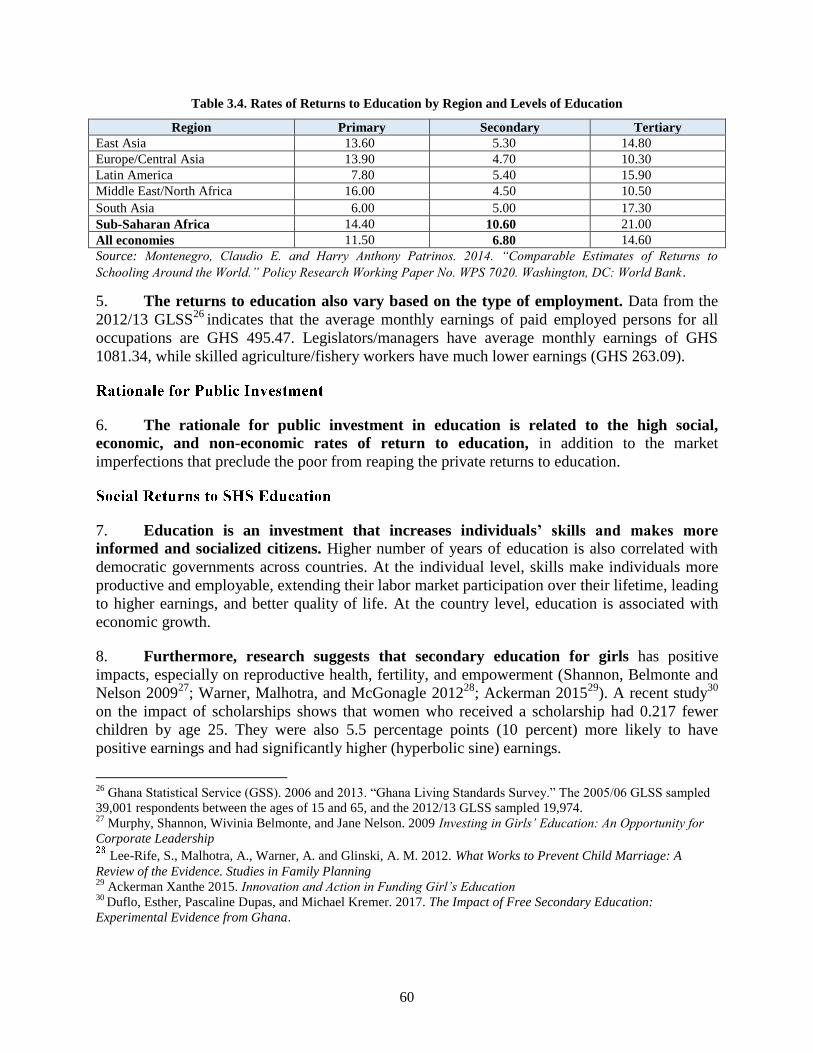
60
Table 3.4. Rates of Returns to Education by Region and Levels of Education
Region Primary Secondary Tertiary
East Asia 13.60 5.30 14.80
Europe/Central Asia 13.90 4.70 10.30
Latin America 7.80 5.40 15.90
Middle East/North Africa 16.00 4.50 10.50
South Asia 6.00 5.00 17.30
Sub-Saharan Africa 14.40 10.60 21.00
All economies 11.50 6.80 14.60
Source: Montenegro, Claudio E. and Harry Anthony Patrinos. 2014. “Comparable Estimates of Returns to
Schooling Around the World.” Policy Research Working Paper No. WPS 7020. Washington, DC: World Bank.
5. The returns to education also vary based on the type of employment. Data from the
2012/13 GLSS26
indicates that the average monthly earnings of paid employed persons for all
occupations are GHS 495.47. Legislators/managers have average monthly earnings of GHS
1081.34, while skilled agriculture/fishery workers have much lower earnings (GHS 263.09).
6. The rationale for public investment in education is related to the high social,
economic, and non-economic rates of return to education, in addition to the market
imperfections that preclude the poor from reaping the private returns to education.
7. Education is an investment that increases individuals’ skills and makes more
informed and socialized citizens. Higher number of years of education is also correlated with
democratic governments across countries. At the individual level, skills make individuals more
productive and employable, extending their labor market participation over their lifetime, leading
to higher earnings, and better quality of life. At the country level, education is associated with
economic growth.
8. Furthermore, research suggests that secondary education for girls has positive
impacts, especially on reproductive health, fertility, and empowerment (Shannon, Belmonte and
Nelson 200927
; Warner, Malhotra, and McGonagle 201228
; Ackerman 201529
). A recent study30
on the impact of scholarships shows that women who received a scholarship had 0.217 fewer
children by age 25. They were also 5.5 percentage points (10 percent) more likely to have
positive earnings and had significantly higher (hyperbolic sine) earnings.
26
Ghana Statistical Service (GSS). 2006 and 2013. “Ghana Living Standards Survey.” The 2005/06 GLSS sampled
39,001 respondents between the ages of 15 and 65, and the 2012/13 GLSS sampled 19,974. 27
Murphy, Shannon, Wivinia Belmonte, and Jane Nelson. 2009 Investing in Girls’ Education: An Opportunity for
Corporate Leadership
Lee-Rife, S., Malhotra, A., Warner, A. and Glinski, A. M. 2012. What Works to Prevent Child Marriage: A
Review of the Evidence. Studies in Family Planning29
Ackerman Xanthe 2015. Innovation and Action in Funding Girl’s Education 30
Duflo, Esther, Pascaline Dupas, and Michael Kremer. 2017. The Impact of Free Secondary Education:
Experimental Evidence from Ghana.

61
9. The rationale for public investment is even stronger in the context of this AF given
its focus on improving the quality of education, which is expected to reinforce its impact on
economic and social development. Quality of SHS programs shows large disparities between
the best 100 schools and the rest of the schools. The WASSCE results indicate that quality has
been declining since 2012 and these results also demonstrate significant regional disparities.31
The WASSCE exams also show that a small number of SHSs supply over 90 percent of the
higher education entrants and the rest of SHSs produce between 60 percent and 90 percent of the
fail rates at the examination. Forty-six percent of the students who qualify for tertiary education
by successfully sitting for the WASSCE are from the top 20 percent of SHS in the country while
8 percent of students from the bottom 20 percent of the schools (106 schools) qualify for tertiary
education.
10. The largest returns are observed among those with tertiary education (university
degree and polytechnics). Those having tertiary education receive hourly earnings which are 114
percent higher than the earnings of those without formal education. This finding highlights the
importance of quality SHS because without this, students cannot transit to the tertiary level. Data
from the 2012/13 GLSS32
show that the majority of professionals (87.5 percent), clerical support
workers (73.2 percent), technicians and associate professionals (63.4 percent), and legislators or
managers (59.6 percent) have attained secondary education or higher.
11. Regional location has the most significant impact on earnings with the poorest regions
providing the lowest earning opportunities regardless of education or employment status. The
economic benefits of SHS are sharply divided among the best performers going to tertiary
education from the best SHSs and the majority from the rest of the system who do not. The
2012/13 GLSS shows that there are marked differences in the unemployment rates recorded in
the regions, with Upper East (10.8 percent) recording the highest unemployment rate and Brong
Ahafo (2.9 percent) recording the lowest. The female unemployment rate is higher than that for
males in all regions except in the Central and Upper West regions where the reverse is the case.
12. Furthermore, the average monthly earnings for males (GHS 592.64) are much higher than
for females (GHS 395.48). In occupations such as agriculture, crafts, and related trades and in
elementary occupations, females remained at a disadvantage. The discrepancy in monthly
earnings between male and female workers has emerged partly on account of differences in
hours of work. Overall, the average monthly cash earnings by those receiving cash and the
average monthly in-kind earnings by those receiving payments in kind are more for males than
for females in almost all the occupational groups.
Cost-Benefit Analysis of SEIP Interventions under Pillar 1 (Unit Cost Analysis)
31
MOE Education Sector Performance Report 2016. 32
Ghana Statistical Service (GSS). 2006 and 2013. “Ghana Living Standards Survey.” The 2005/06 GLSS sampled
39,001 respondents between the ages of 15 and 65, and the 2012/13 GLSS sampled 19,974.

62
13. Having gone through two years of implementation, the DLI-based design has shifted
the focus of the Government toward empirical-based policy making. The interventions of
SEIP are amenable to a cost-benefit analysis because the benefits of activities under this
component can be reasonably appraised from existing data. Based on data compiled so far, the
section below provides a cost-benefit analysis for the different SIEP-supported interventions and
a justification for the expansion of these activities under the proposed AF.
14. Under Results Area 1, the project supports the construction of 23 new schools and
rehabilitation of 50 schools. The DLIs associated with this activity aim to reward significant
increases in the number of new seats utilized in the newly constructed schools as well as the
existing low-performing schools.
15. Costs. The projected total final cost of the new construction works including variations
and fluctuations is estimated at GHS 303,339,955.17 (US$72,801,589.2). This exceeds the
original total contract sum of GHS 268,592,295.86 (including contingencies) by GHS
34,747,661.31 representing an increase of 12.94 percent of the original total contract sums. The
projected final cost of the facility upgrade works including variations and fluctuations is
estimated at GHS 25,023,068.10 (US$6,005,536.3). This exceeds the original total contract sum
of GHS 22,223,550.68 (including contingencies) by GHS 2,799,517.42 representing 12.6 percent
increase of the original total contract sums.
16. The unit costs of construction based on revised contract values are lower than the
estimated costs at project design. The unit cost for new schools is US$3.2 million compared to
the estimate of US$4.3 million and the unit cost for upgrades is US$0.12 million compared to an
estimated amount of US$0.32 million (table 3.5).
Table 3.5. Unit Costs of Construction
No. of
Schools
Total Revised
Contract Value
(GHS)
Total Revised
Contract Value
(US$)
Unit Cost
(US$)
Unit cost
(US$,
millions)
Original
estimates
(US$,
millions)
Facility
upgrade
50 25,023,068.10 6,005,536.30 120,110.70 0.12 0.32
New works 23 303,339,955.20 72,801,589.20 3,165,286.50 3.20 4.30
Source: Project Data
17. The unit costs of construction are considerably lower than comparable regional
estimates (table 3.6). The average unit cost of a SEIP classroom is GHS 52,500.00 (US$13,125)
for a classroom measuring 8.85 m by 7.05 m with a 1.5 m wide veranda and accommodating 48
students. This is among the lower range of unit costs of construction of comparable WB projects
in Sub-Saharan African countries, with the lowest cost being US$12,931 in Benin and the
highest being US$24,434 in Burundi.
Table 3.6. Regional Comparison of Unit Costs of Construction
Unit Costs for Cote d’Ivoire Benin Burundi Uganda Ghana
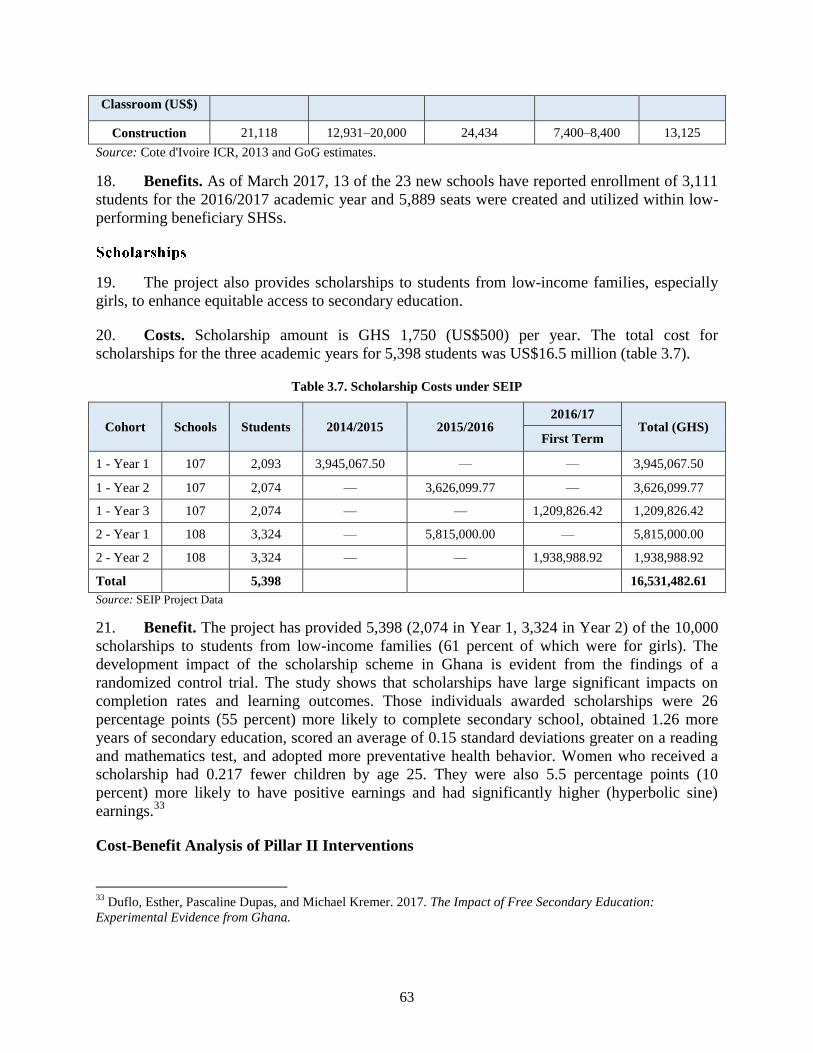
63
Classroom (US$)
Construction 21,118 12,931–20,000 24,434 7,400–8,400 13,125
Source: Cote d'Ivoire ICR, 2013 and GoG estimates.
18. Benefits. As of March 2017, 13 of the 23 new schools have reported enrollment of 3,111
students for the 2016/2017 academic year and 5,889 seats were created and utilized within low-
performing beneficiary SHSs.
19. The project also provides scholarships to students from low-income families, especially
girls, to enhance equitable access to secondary education.
20. Costs. Scholarship amount is GHS 1,750 (US$500) per year. The total cost for
scholarships for the three academic years for 5,398 students was US$16.5 million (table 3.7).
Table 3.7. Scholarship Costs under SEIP
Cohort Schools Students 2014/2015 2015/2016 2016/17
Total (GHS) First Term
1 - Year 1 107 2,093 3,945,067.50 — — 3,945,067.50
1 - Year 2 107 2,074 — 3,626,099.77 — 3,626,099.77
1 - Year 3 107 2,074 — — 1,209,826.42 1,209,826.42
2 - Year 1 108 3,324 — 5,815,000.00 — 5,815,000.00
2 - Year 2 108 3,324 — — 1,938,988.92 1,938,988.92
Total
5,398
16,531,482.61
Source: SEIP Project Data
21. Benefit. The project has provided 5,398 (2,074 in Year 1, 3,324 in Year 2) of the 10,000
scholarships to students from low-income families (61 percent of which were for girls). The
development impact of the scholarship scheme in Ghana is evident from the findings of a
randomized control trial. The study shows that scholarships have large significant impacts on
completion rates and learning outcomes. Those individuals awarded scholarships were 26
percentage points (55 percent) more likely to complete secondary school, obtained 1.26 more
years of secondary education, scored an average of 0.15 standard deviations greater on a reading
and mathematics test, and adopted more preventative health behavior. Women who received a
scholarship had 0.217 fewer children by age 25. They were also 5.5 percentage points (10
percent) more likely to have positive earnings and had significantly higher (hyperbolic sine)
earnings.33
Cost-Benefit Analysis of Pillar II Interventions
33
Duflo, Esther, Pascaline Dupas, and Michael Kremer. 2017. The Impact of Free Secondary Education:
Experimental Evidence from Ghana.

64
22. Results Area 2 (Pillar 2) focuses on improving the quality of education in SEIP
schools through (a) strengthened school management and accountability, (b) improved
mathematics and science teaching and learning, (c) expanded ICT and Internet connectivity in
schools, and (d) the implementation of SPPPs. This quality package will be introduced to 107
additional schools under the AF.
School Mapping
Costs
23. The cost of the school mapping activity includes an upfront cost of developing a new
platform to support school-level data, annual printing of school digests, and monitoring. The
initial costs of setting up the school mapping initiative are GHS 3,117,604 with approximately
GHS 4,406,020 of recurrent costs (table 3.8). The overall budget for the school mapping
activities was estimated at US$1.07 million.
Table 3.8. Costs Associated with School Mapping Activity
Activity Total Cost (GHS)
Initial Costs
Platform development 2,000,000
Initial data collection 184,000
Follow-up data collection 275,184
Cost of training to use the platform 658,420
Recurrent Costs
Citizen feedback and two-factor authentication for 4,000,000 SMS (250,000) per year 2,000,000
USSD34
code for school data per year for 4 years 200,000
Maintaining the portal 144,000
Recurring training costs 3 and 4 milestones 1,239,020
Printing and distributing the digest to JHS 700,000
Updating existing content 32,000
Hosting Scholarship database 91,000
Source: Project Data, September 2016 mission documents.
24. Benefits. 891 SHSs (public and private) have been mapped. The mapping includes the
following data:
Schools WASSCE pass rate, enrollment data, images, teacher-to-student ratio and so
on captured for every school
Time stamp, date stamp, and geo-coordinate stamp enhance accountability
Integration with social media fosters citizen participation and feedback
Cutting-edge and real-time monitoring/mapping capability will transform
management and supervision of schools
34
Unstructured Supplementary Service Data-USSD
65
25. While data are not yet available on the impact of the school mapping on education
outcomes, there is an evidence on the positive impact of a similar school mapping initiative
in the development of education in Tanzania.35
The study examined the experiences of six
districts where school mapping exercises were carried out. The school mapping process in
Tanzania was designed to do the following: (a) strengthen local capacities to collect, organize,
analyze, and use educational data to make informed decision for educational development; (b)
improve districts' administrative, planning and monitoring capacities with respect to education;
(c) mobilize community members to participate in the development/improvement of education;
and (d) establish accurate/reliable, detailed and accessible education information for use in
decision making and action. Through a combination of instruments and techniques—interviews,
questionnaires, focus group discussion, and document analysis, the study found that school
mapping affected in varying degrees positively on education outcomes in the districts with
regard to increased enrollment and attendance, decreased incidents of dropping out, improved
information for decision making, and enhanced capacities of field actors to plan and take action.
These findings are critical for the rollout and scale-up of the school mapping exercise under the
SIEP.
i-Box
26. One hundred and sixty i-Boxes have been procured in the first phase and 70 had
been installed by end of January 2017. The homegrown system has great potential for sharing
knowledge through its hardware, platform and content development.
27. Costs. The costs for the i-Box can be broken down between school-level costs and
system level costs (table 3.9) The upfront costs for 160 i-boxes are approximately GHS 79,730
while system-level costs for content development and transportation of the boxes is GHS 1.7
million. It is expected that the schools will bear a recurring cost of GHS 10,229 for the
maintenance of the i-box.
35
http://www.sciencedirect.com/science/article/pii/S0149718901000465
66
Table 3.9. Costs Associated with i-box
Activity School-Level Costs (GHS) System-Level Costs (GHS)
Initial Costs
i-box (160 sets) 17,550
Installation equipment 5,000
Cost of installation 729
Cost of training to use i-box, eContent, and i-campus
portal (5 teachers per school)
9,677
Solar power system 40,000
Specialized vehicle 187,000
Content development for one subject at one level
(learner text, audio-visuals and interactive). Includes
training of content developers)
1,559,929
Quality assurance of i-Box and content (4 subjects of 3
sets)
4,430
Upload of content onto i-Box (4 subjects of 3 sets) 2,344
Recurrent Costs
Maintenance costs 552
Re-training for new teachers in how to use the i-box,
eContent and i-campus portal (5 teachers per school)
9,677
Source: Project Data
Benefits
28. So far 70 i-boxes have been installed in schools and are expected to be used for
science and mathematics learning. An ongoing impact evaluation is aimed at estimating the
value-added and impact of the i-box on learning outcomes. Future allocations under the AF will
be assigned to i-box if there is an evidence of impact coming out of the impact evaluation in
September 2017.
World Bank Value Added
29. The World Bank’s involvement is expected to bring tangible value-added in several
key domains. The World Bank’s global knowledge, technical, and operational expertise will be
critical in providing technical support and consensus building around system and institutional
changes, which are expected to yield economic and social returns in the longer term. The World
Bank’s value added will continue to be significant under the AF. The World Bank has already
brought substantial value added under the parent project by nudging a shift toward a results-
based policy making and introducing innovative interventions such as school mapping and i-box.
30. Furthermore, the World Bank has established itself as a trusted partner of the
education sector and is well-positioned to provide technical support to the Government in
the rollout of the free SHS policy. The policy will have significant impacts on the supply and
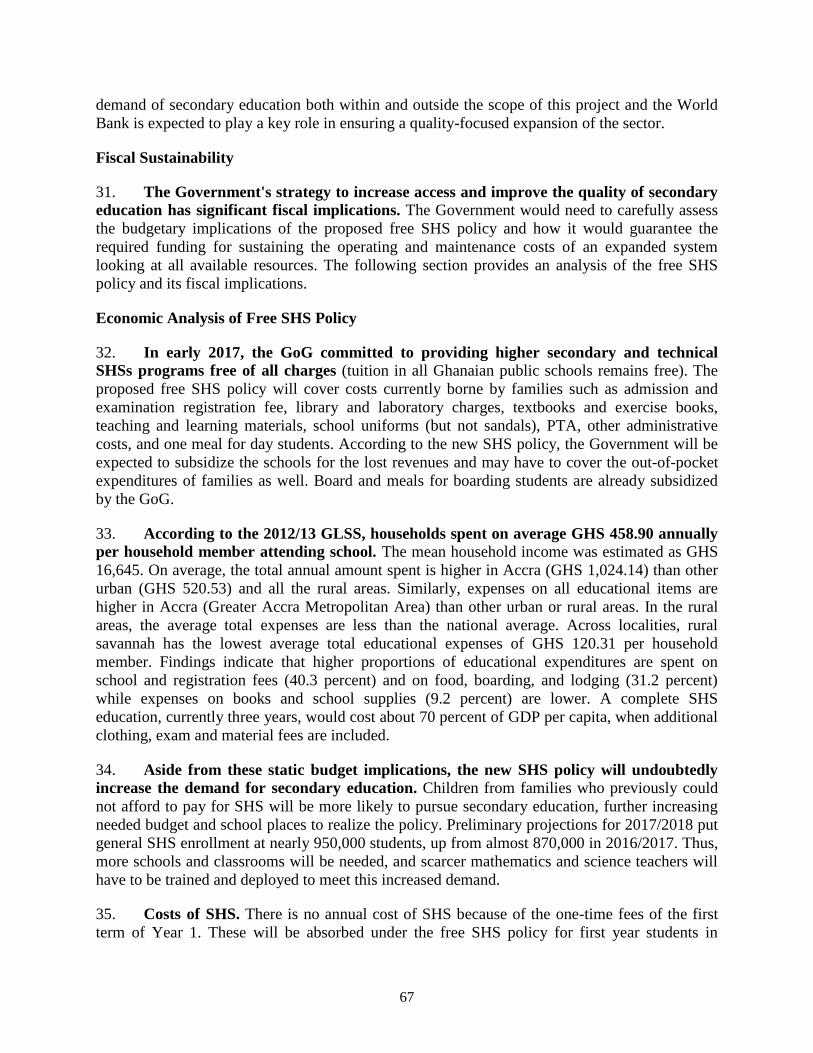
67
demand of secondary education both within and outside the scope of this project and the World
Bank is expected to play a key role in ensuring a quality-focused expansion of the sector.
Fiscal Sustainability
31. The Government's strategy to increase access and improve the quality of secondary
education has significant fiscal implications. The Government would need to carefully assess
the budgetary implications of the proposed free SHS policy and how it would guarantee the
required funding for sustaining the operating and maintenance costs of an expanded system
looking at all available resources. The following section provides an analysis of the free SHS
policy and its fiscal implications.
Economic Analysis of Free SHS Policy
32. In early 2017, the GoG committed to providing higher secondary and technical
SHSs programs free of all charges (tuition in all Ghanaian public schools remains free). The
proposed free SHS policy will cover costs currently borne by families such as admission and
examination registration fee, library and laboratory charges, textbooks and exercise books,
teaching and learning materials, school uniforms (but not sandals), PTA, other administrative
costs, and one meal for day students. According to the new SHS policy, the Government will be
expected to subsidize the schools for the lost revenues and may have to cover the out-of-pocket
expenditures of families as well. Board and meals for boarding students are already subsidized
by the GoG.
33. According to the 2012/13 GLSS, households spent on average GHS 458.90 annually
per household member attending school. The mean household income was estimated as GHS
16,645. On average, the total annual amount spent is higher in Accra (GHS 1,024.14) than other
urban (GHS 520.53) and all the rural areas. Similarly, expenses on all educational items are
higher in Accra (Greater Accra Metropolitan Area) than other urban or rural areas. In the rural
areas, the average total expenses are less than the national average. Across localities, rural
savannah has the lowest average total educational expenses of GHS 120.31 per household
member. Findings indicate that higher proportions of educational expenditures are spent on
school and registration fees (40.3 percent) and on food, boarding, and lodging (31.2 percent)
while expenses on books and school supplies (9.2 percent) are lower. A complete SHS
education, currently three years, would cost about 70 percent of GDP per capita, when additional
clothing, exam and material fees are included.
34. Aside from these static budget implications, the new SHS policy will undoubtedly
increase the demand for secondary education. Children from families who previously could
not afford to pay for SHS will be more likely to pursue secondary education, further increasing
needed budget and school places to realize the policy. Preliminary projections for 2017/2018 put
general SHS enrollment at nearly 950,000 students, up from almost 870,000 in 2016/2017. Thus,
more schools and classrooms will be needed, and scarcer mathematics and science teachers will
have to be trained and deployed to meet this increased demand.
35. Costs of SHS. There is no annual cost of SHS because of the one-time fees of the first
term of Year 1. These will be absorbed under the free SHS policy for first year students in

68
2017/18. The current per student subsidy is GHS 254.4 for day students (Sections A and B below
SHS fees *3 for the three terms) and GHS 258.4 for boarding students. This is expected to go up
to GHS 1075.40 for day students and GHS 2132.00 for boarding students. Table 3.10 provides
all the fee items associated with SHS broken down by the categories under the free SHS policy.
The fees for food of boarders will also be absorbed and day students will receive one hot meal a
day. Before the free SHS policy, feeding for day students would be paid for by the student. The
PTA levies will also be absorbed under the free SHS policy
Table 3.10: Costs Associated with Free SHS Policy
(A) Originally Subsidized Term Fees Day Boarding
General Stationery and Maintenance of Vehicle 2.00 2.00
First Aid 1.00 1.00
Building Maintenance 2.00 2.00
Sports Fees 2.00 2.00
Culture Fees 1.00 1.00
Sanitation Fee 1.50 1.50
Postage 1.50 1.50
Practical Fees 5.00 5.00
Tools for Maintenance of Machines 6.50 6.50
Furniture Maintenance 1.00 1.00
Utilities 7.30 7.30
Subtotal 30.80 30.80
(B) Newly Introduced Term Fees Day Boarding
Examination Fees 10.00 10.00
Entertainment 2.00 2.00
Library Fees 3.00 3.00
SRC Dues 2.00 2.00
Sports Fees 5.00 5.00
Culture Fees 3.00 3.00
Co-curricular Activities 2.00 2.00
ICT 3.00 3.00
National Science and Mathematics Quiz 5.00 5.00
Science Development 3.00 3.00
Development Levy 10.00 10.00
Utilities 6.00 10.00
Subtotal 54.00 58.00
(C) ‘One-Time’ Fees to Be Introduced Day Boarding
Admission Fee 20.00 20.00
Maintenance Fee 0.00 3.00

69
Cumulative Records 5.00 5.00
School Uniforms 100.00 100.00
House Dress 90.00 90.00
Physical Education Kits 30.00 30.00
School Cloth 80.00 80.00
Medical Exams 15.00 15.00
1 Supplementary Reader/3 Core Literature Books 45.00 45.00
9 Exercise Books 14.00 14.00
4 Note Books 36.00 36.00
Subtotal 435.00 438.00
D. PTA Levies (Term) Day Boarding
Teacher Motivation (GHS 20.00) per year 6.67 6.67
House Dues 10.00 10.00
Subtotal 16.67 16.67
E. Teaching and Learning Support for TVET Students Only Day Boarding
Technical Training Materials per term 10.00 10.00
Technical Drawing Instruments 60.00 60.00
Technical Drawing Board and Tee Square 30.00 30.00
Subtotal 100.00 100.00
F. Feeding Fees to Be Absorbed Day Boarding
Feeding Fee @ GHS 4.80 per day for 96 days (boarders) 0.00 459.20
1 Hot Meal for Day Students at GHS 1.60 per day for 70 days 112.00
Subtotal 112.00 459.20

70
Financial Management, Disbursements
1. Financial management arrangements were reviewed to (a) ascertain if the current SEIP
arrangements are adequate to support the AF and (b) determine the level of compliance with the
financial covenants by the current project.
2. The primary implementing agencies for the AF will be the MOE and GES. The MOE will
be tasked with coordinating the activities of the various department and agencies. In line with the
original project design, the project will have two components implemented by the MOE and
GES. Within the MOE, the Director of Finance will be responsible for ensuring compliance with
all fiduciary arrangements, while the Financial Controller of the GES will also be tasked with
ensuring that throughout implementation, there are adequate financial management systems
which can satisfactorily account for and report on the use of project funds.
3. The most recent financial management review conducted as part of the
September/October 2016 mission concluded that the financial management systems at both the
MOE and GES are adequate and meet the minimum requirements as per World Bank Policy
Operational Policy 10.00. The project’s financial management performance rating is rated as
Moderately Satisfactory and the risk rating is Moderate.
4. The project has generally complied with the financial covenants of submitting acceptable
financial reports including audits. In relation to the submission of audit reports, the most recent
audit due was for the year-ending December 2015 which was due for submission not later than
June 30, 2016. The audit report was received on June 30, 2016 which was within the six-month
period after the end of the fiscal year and thus in compliance with the provisions of the Financing
Agreement. The auditors issued an unqualified opinion on the accounts, but also issued a
Management Letter to highlight some internal control weakness which must be addressed to
minimize the risk of use of World Bank funds.
Disbursement Arrangements
5. Proceeds of the credit will be used by the project for eligible expenditures as defined in
the Financing Agreement and further detailed in the respective approved annual work plans and
budgets. Disbursement arrangements have been designed in consultation with the Government,
after considering the assessments of the implementing agency’s financial management
capacities, and anticipated cash flow needs of the operation.
6. Similar to the original credit, the design features of the proposed AF cater to the
requirements of a hybrid structure, all within the Investment Project Financing (IPF) instrument
of the World Bank. This involves a results-based (DLI/DLR) financing approach for Component
1 and a traditional investment financing approach for Component 2.
71
7. For ease of implementation the project will maintain only two (2) separate U.S. dollar
denominated designated accounts:
(a). Designated Account A: for Component 1 to be implemented by the MOE
(b). Designated Account B: for Component 2 as implemented by the GES
Modalities for Disbursements under Component 1
8. DLIs. The total AF resource allocation for Component 1 is US$37 million. According to
the design, disbursement under this component provides for achievement of a total of five DLIs
which will be measured and valued in monetary terms for each respective year through a set of
identifiable and measurable DLRs totaling 15 to be achieved over the four-year period. These
DLIs are considered significant indicators of performance that will influence behavioral and
policy reforms required to achieve outcomes related to increasing equitable access to senior
secondary education while improving the quality of SHS.
9. Meeting the defined DLRs as identified in annex 2 and also in the Financing Agreement
will constitute the primary basis for triggering credit disbursements under the Project’s EEP that
is, Component 1. The total number of DLR’s have been individually priced, and as such, the
eligible disbursement amount will be the sum of the achieved DLRs multiplied by the unitary
monetary value (price) according to the Disbursement Schedule.
10. The underlying principle will be to disburse, after project effectiveness, and based on a
half-year forecast of the funding required to potentially achieve the set of DLRs in each year, an
advance to the MOE. Subsequently on a half-yearly basis, the borrower will provide satisfactory
documentary evidence including (a) acceptable interim financial reports (IFRs); (b) EEP
spending reports; and (c) evidence of independent verification of the set of DLRs for that
particular year which have been achieved. These reports will then form the basis of documenting
for the advances made. Subsequent advances will be made based on the approval by the World
Bank of the next six months forecast of expenditure.
11. However, it must be noted that in subsequent years and beyond the first year, only one
DLR relating to the prior year, can remain unmet to allow for disbursements of any further
advances against the potential for meeting future period DLRs. This means that while
noncompliance with a DLR in a period will result in funds associated with that DLR being
withheld, disbursement associated with the achievement of other DLIs will not be affected.
Where the MOE is able to meet any of the DLRs, beyond the value of the total advances granted,
the borrower can request for such values as a reimbursement into any government account other
than the Designated Account.
12. Where achievement of a DLR cannot be certified, an amount equivalent to the unitary
DLR price will be withheld or considered as undocumented and outstanding obligation on the
Borrower. This amount will be paid at any later date, during project life, and at the discretion of
the World Bank’s task team when such achievement can be verified. The task team may consider
that a later achievement of the DLR performance would not qualify for disbursement against the

72
unmet DLR if it determines that the on-schedule achievement of the DLR is critically
fundamental to achieving the overall objectives of the project.
13. Government EEP: The overall government program of expenditures to be supported
under the component is defined as the EEP. For the purposes of the AF and as in the original
project, the selected EEP item will be the total compensation of employees and operating cost for
secondary education in the Chart of Accounts of the Government and as presented in the
approved budget estimates and actuals as per the accounting reports of the Controller and
Accountant General. The selected EEP is not a procurable item—the expenditure will not attract
any procurement actions under the World Bank’s Procurement Guidelines. Such an EEP would
be verified by the independent verification agency as part of the documentation for achieving
DLRs.

73
Table 4.1. SHS Actual and Projected Budget (2014–2021)
GIFMIS
Chart of
Account
Codes
BUDGET
CLASSIFICATION
ACTUAL BUDGET PROJECTED
2014 2015 2016 2017 2018 2019 2020 2021
GHS GHS GHS GHS GHS GHS GHS GHS
0230304 Compensation (SHS) 638,737,464 632,850,371 838,852,492 801,451,365 841,523,933 885,338,937 930,197,078 976,092,089
0230308 Compensation
(TVET) 51,107,916 48,791,452 54,061,733 55,200,216 57,960,227 59,119,431 61,484,209 65,173,261
Total 689,845,380 681,641,823 892,914,225 856,651,581 899,484,160 944,458,368 991,681,286 1,041,265,350
US$ equivalent @
GHS 4.2/US$ 164,248,900 162,295,672 212,598,625 203,964,662 214,162,895 224,871,040 236,114,592 247,920,322
Note: GIFMIS: Ghana Integrated and Financial Management Information System
Table 4.2 Eligible Expenditure Program Sector Budget Lines
Eligible Expenditure Program – Ministry of Education/Ghana Education Service
Agency –
Budgetary
Institutions
Line
ministry /
Institution
code
Item Code
&
Description
Program
Code
(Secondary)
SUB
Program
Code
Program
Description
GES 02303 2111001
Salaries 023003 0230031 SHS
GES 02303 2111001
Salaries 023003 0230032 TVET
Source: GIFMIS

74
Modalities for Disbursements Under Component 2
14. Funds flow and disbursement arrangements. All other components (other than
Component 1) will be implemented under the principles of traditional IPF arrangements using
the report-based disbursement arrangements. Under this approach, the allocated resources will be
advanced to the GES’s Designated Account on the basis of an approved six-monthly forecast of
expenditures, and replenished quarterly for further periods of six months using IFRs prepared by
the GES and or generated from the GIFMIS. The IFRs (including the ‘procurements subject to
prior reviews’ and ‘designated account reconciliation statement’) will serve as the basis for
requesting for advances and also for documentation. The initial disbursement will be based on
the consolidated expenditure forecast for six months, subject to the World Bank’s task team
leader and Financial Management Specialist approval of the estimates. Subsequent
replenishments of the Designated Account would be done quarterly based on the forecast of the
net expenditures for the subsequent half-year period.
15. It must be emphasized that other than activities under Component 1, for all other project
activities under Component 2, where applicable, the World Bank Procurement Guidelines shall
govern all procurement activities.
Disbursement Categories
16. Based on the project design there will be only two disbursement categories. The
disbursement category for Component 1 will be DLI/DLR-based and the disbursement category
expense line will be for the selected EEP—that is, Secondary Education Compensation and
Operating Cost as per GoG’s chart of accounts/budget classification code. For component Two,
there will be a single category - ‘goods, works, consulting services, non-consulting services,
training, and operating expenses.’
Table 4. 3. Disbursement Categories
Category Amount of
the Credit
Allocated
(expressed in
US$)
Amount of the Credit
Allocated (expressed in
SDR)
Percentage of Expenditure
to be Financed (inclusive of
Taxes)
Eligible Expenditure Program
under Part A of the Project 37,000,000 26,730,000
Up to 100% of each DLR
amount set out in the DLI
Schedule
Goods, non-consulting service,
consulting services, Training
and operating cost under all
Parts (except Part A)
3,000,000 2,170,000 100%
TOTAL 40,000,000 28,900,000
Conclusion
17. Based on the review of the current arrangements and the proposed design of the AF, there
will not be any changes in the financial management arrangements as they have proved adequate
during SEIP implementation to be continued to support the implementation of the AF.

75
Procurement Management
18. Procurement for the proposed AF under Component 2 will be carried out in accordance
with the World Bank’s Procurement Regulations for IPF Borrowers dated July 1, 2016 and
applicable to IPF herein after referred to as ‘Regulations’. The project will be subject to the
World Bank’s Anti-Corruption Guidelines, dated October 15, 2006, revised in January 2011 and
as of July 1, 2016. Modalities for RBF applies to Component 1 and hence the above
arrangements do not apply.
19. As per the requirements of the Regulations, a Project Procurement Strategy for
Development (PPSD) has been developed by the MOE and the GES with support and guidance
from the World Bank. The document has been reviewed by the World Bank and found to be
acceptable. Based on the PPSD, the Procurement Plan for the AF has also been developed and
accepted by the World Bank. The Procurement Plan will be updated annually or as required to
reflect the actual project implementation needs. The summary of the PPSD is provided below.
20. Summary of the Project Procurement Strategy for Development (PPSD). The
education infrastructure and services market is vibrant. There are local and experienced service
providers and contractors, willing to take part in competitive procurement to win bids and deliver
on them. The supply position of these service providers are for low risk and low volume
procurement. The Client/Borrower has also approached the market adequately in the past in
implementing the parent project and have adequate knowledge of the market.
21. Applicable guidelines. Procurement will be carried out, according to the New
Procurement Framework, in accordance with the (a) World Bank Procurement Regulations for
IPF Borrowers: Procurement in Investment Project Financing Goods, Works, Non-Consulting
and Consulting Services, dated July 2016; (b) the ‘Guidelines on Preventing and Combating
Fraud and Corruption in Projects financed by IBRD Loans and IDA Credits and Grants’, dated
October 15, 2006, revised in January 2011; and (c) the provisions stipulated in the Legal
Agreement. The bid documents will be based on the Standard Procurement Document, recently
enhanced with the Environment, Social Health, and Safety.
Procurement Implementation Arrangements and Capacity Assessment
22. The procurement implementation arrangements remain unchanged. The implementing
agency will be the MOE, responsible for the project’s coordination, procurement, contract
management, financial management, and compliance with safeguards policies, in collaboration
with the GES and other relevant agencies under the MOE.
23. Procurement capacity assessment. In accordance with Operations Core Services
Procurement Policy and Services guidelines and Procurement Risk Assessment and Management
System, the summary assessment of the procurement risk is Substantial for the project and the
prior review thresholds have been set to reflect this rating. Procurement post reviews and
technical audits will be carried out annually by the Bank Procurement Specialist and/or
independent auditors and based on the findings of the reviews, the prior review thresholds will be
reviewed. The main risks identified are the following: (a) the use of the National Procurement
Framework (NPF); (b) inadequate monitoring; (c) weak contract management; (d) delays in

76
processing procurement and payments; (e) some political interference; and (f) fraud and
corruption. The proposed mitigation will include the World Bank to organize and deliver training
session for the GES and MOE, on the NPF before effectiveness, with hands-on support to the
implementing agencies to ensure proper use of the borrower regulations and intensify training in
procurement and contract management.
24. Table 4.4 depicts the thresholds and procurement methods to be used under the project
reflecting a Substantial risk rating:
Table 4.4. Procurement Thresholds and Methods
25. These thresholds are for the purposes of the initial Procurement Plan for the first 18
months. The thresholds will be revised periodically based on reassessment of risks. All contracts
not subject to prior review will be post reviewed.
26. Procurement Plan. The borrower prepared and the World Bank cleared the Procurement
Plan which covers the first 18 months of project implementation. The Procurement Plan will be
updated in agreement with the World Bank project team at least annually or, as required, to
reflect the actual project implementation needs and improvement in institutional capacity.
27. Systematic Tracking of Exchanges in Procurement will be the primary software to be
used to submit, review, and clear all Procurement Plans and prior review procurements. In
preparing the Procurement Plan, at all times, the prior review and methods thresholds associated
with the recommended/prevailing procurement risk rating are applicable.
RISK RATING Works
Goods, IT
Systems+
Non Con.
Serv
Firms Individuals
Open
International
or ICB
Open
National or
NCB
Request for
Quotation/
National
Shopping
Open
International
or ICB
Open
National or
NCB
Request for
Quotation/
National
Shopping
Consulting
services
Engineering
&
construction
supervision
SUBSTANTIAL ≥$10,000 ≥$2,000 ≥$1,000 ≥$300 ≥$100 ≥15000 <15000 ≤200 ≥3000 <3000 ≤100 <300 ≤500
Prior Review Threshold in (US$ '000) Procurement Method s Thresholds (in US$'000)
ConsultantsSingle Source
& Direct
Contract
Works Goods, IT and non-consulting servicesShortlist of National
Consultants

77
Table 4.5. Activities to be Financed by the AF
Activity Reference
No./Description:
Review
Type Category
Cost Estimate
(US$)
Expected
Bid/Proposal
Submission
Deadline
(YY/MM/DD)
Expected
Contract
Completion Date
(YY/MM/DD)
Consultancy for end of project
financial review
Post Consultancy 150,000 18/02/06 21/09/30
Consultancy for project
completion report
Post Consultancy 250,000 18/10/04 21/02/07
Consultancy for independent
verification of in-school activities
Post Consultancy 160,000 18/10/04 20/09/07
Consultancy for end of project
technical review
Post Consultancy 110,000 19/02/02 19/05/17
Consultancy for end of project
procurement review
Post Consultancy 120,000 18/02/06 21/09/30
Printing of 11,500 numbers
School Mapping Digest for
2017/2018
Post Goods 170,000 18/11/30 19/02/21
Printing of 845 numbers SPP
training manuals
Post Goods 3,000 17/06/20 17/08/09
Printing of 1,600 numbers
Science and Mathematics
modules
Post Goods 12,000 17/02/17 17/08/09

78