world gold council board · pdf file · 2017-06-06•gold returns have outpaced...
TRANSCRIPT
World Gold Council
Gold in a Time of TurbulencePresented by John Reade | 5/06/2017

World Gold Council: Research & Strategy
2World Gold Council | Gold in a Time of Turbulence | 5 June 2017
Who we are and what we do
• Eight full-time Research and Strategy Professionals
- London – 3 Research; Strategy & Head of Research
- US - 2 Investment Research
- Mumbai 1 Research
- Shanghai 1 Research
• Products
- Gold Demand Trends: Quarterly Supply & Demand
- Gold Investor: Four times a year
- Strategy Twice Monthly, when I start it (June)
- Market Updates Sporadic
• Free to all: Sign up on www.gold.org

We’ve been here before…
… in many ways, we’ve never left.
3

Turbulence and Gold
4
• Gold was one of the best performing assets through the financial crisis
- Below $700/oz. at the start of 2007
- Above $1100/oz. at the end of 2009
• S&P500 fell by 21% over the same period
• But as the chart on the next slide shows:
- Gold was volatile over the period
- Fell from above $1000 per ounce to below $700/oz. after the failure of Lehman
- Volatility was extremely higher – realised and especially actual.
World Gold Council | Gold in a Time of Turbulence | 5 June 2017

Turbulence and Gold
5World Gold Council | Gold in a Time of Turbulence | 5 June 2017

More Turbulence and Gold
6
• From 2009, gold traded steadily higher, fears of inflation from QE
- Topped out above $1900/oz. in September 2011
- Declined through 2012 and then fell sharply in 2013
• US Debt-ceiling crisis
- Fears of US default due to political stalemate
- Resolution saw gold top-out and then weaken
• But demonstrated that politics has the potential to drive gold higher
- Especially if it risks Financial Stability
World Gold Council | Gold in a Time of Turbulence | 5 June 2017

Turbulence and Gold
7World Gold Council | Gold in a Time of Turbulence | 5 June 2017

Fast forward to the present
8

The Present
9World Gold Council | Gold in a Time of Turbulence | 5 June 2017

Are we living in a turbulent age?
10
• Politics has become less predictable
- Brexit
- Election of President Trump
- Populist parties more popular in Italy, France Netherlands, Austria, etc.
- North Korea tensions & Middle East conflicts
• Post Financial Crisis Malaise
- Summers’s Secular Stagnation
- Balance Sheet Recession and Tepid Recovery
• Concerns that asset markets are overvalued
World Gold Council | Gold in a Time of Turbulence | 5 June 2017

Economic Worries Higher than during Crisis
11World Gold Council | Gold in a Time of Turbulence | 5 June 2017

Sluggish post-crisis recovery
12World Gold Council | Gold in a Time of Turbulence | 5 June 2017

A 36-year Bull Market in US Government Debt
13World Gold Council | Gold in a Time of Turbulence | 5 June 2017

Equities hardly inexpensive
14World Gold Council | Gold in a Time of Turbulence | 5 June 2017
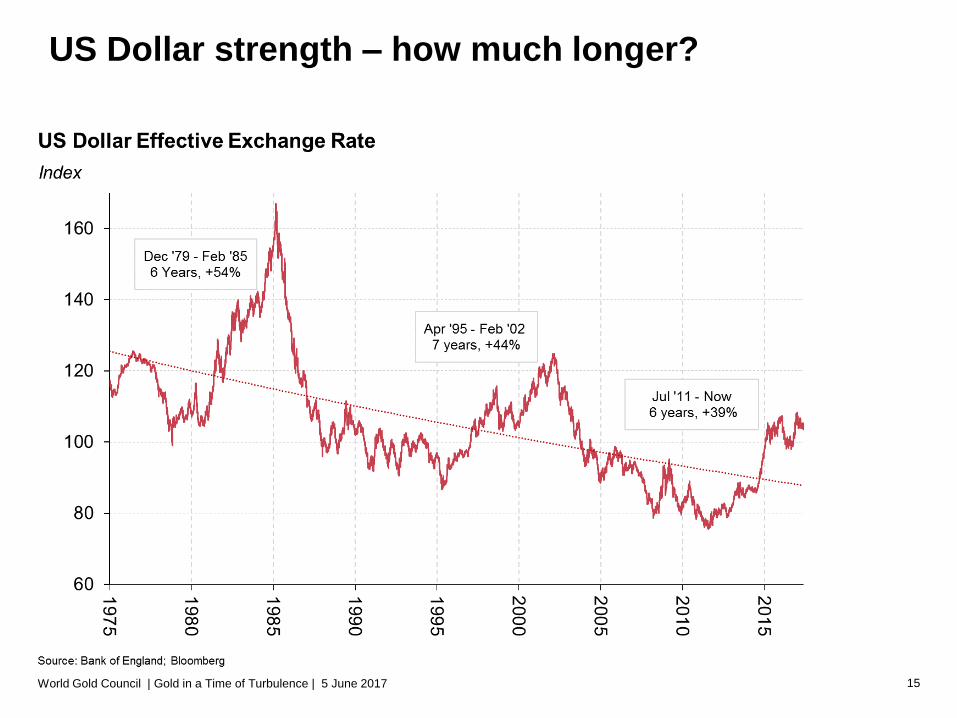
US Dollar strength – how much longer?
15World Gold Council | Gold in a Time of Turbulence | 5 June 2017

Low vol may point to higher risk
16World Gold Council | Gold in a Time of Turbulence | 5 June 2017

Gold is averagely priced
17World Gold Council | Gold in a Time of Turbulence | 5 June 2017
Has gold ever looked more alluring?
18
• Political shocks and worries abound
• Are we nearing the end of the post-crisis recovery?
• Asset markets looking expensive
• Gold averagely priced after the US dollar has come a long way
World Gold Council | Gold in a Time of Turbulence | 5 June 2017

Not just for times of turbulence
19
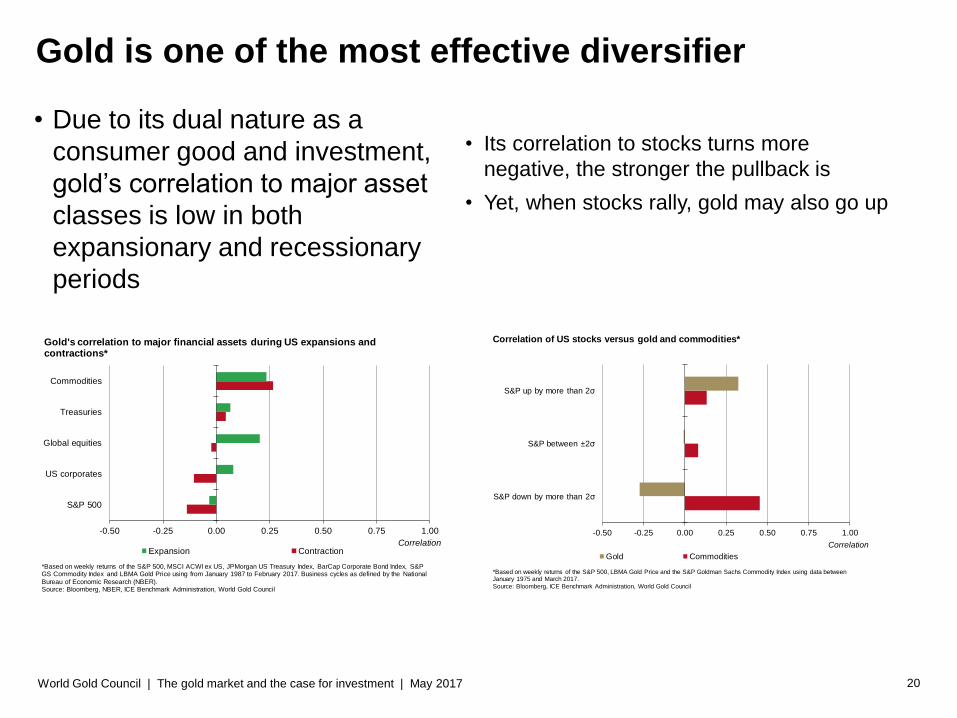
Gold is one of the most effective diversifier
20World Gold Council | The gold market and the case for investment | May 2017
• Due to its dual nature as a
consumer good and investment,
gold’s correlation to major asset
classes is low in both
expansionary and recessionary
periods
• Its correlation to stocks turns more
negative, the stronger the pullback is
• Yet, when stocks rally, gold may also go up
-0.50 -0.25 0.00 0.25 0.50 0.75 1.00
S&P 500
US corporates
Global equities
Treasuries
Commodities
CorrelationExpansion Contraction
Gold's correlation to major financial assets during US expansions and contractions*
*Based on weekly returns of the S&P 500, MSCI ACWI ex US, JPMorgan US Treasury Index, BarCap Corporate Bond Index, S&P GS Commodity Index and LBMA Gold Price using from January 1987 to February 2017. Business cycles as defined by the National
Bureau of Economic Research (NBER).Source: Bloomberg, NBER, ICE Benchmark Administration, World Gold Council
-0.50 -0.25 0.00 0.25 0.50 0.75 1.00
S&P down by more than 2σ
S&P between ±2σ
S&P up by more than 2σ
Correlation
Gold Commodities
Correlation of US stocks versus gold and commodities*
*Based on weekly returns of the S&P 500, LBMA Gold Price and the S&P Goldman Sachs Commodity Index using data between January 1975 and March 2017.
Source: Bloomberg, ICE Benchmark Administration, World Gold Council
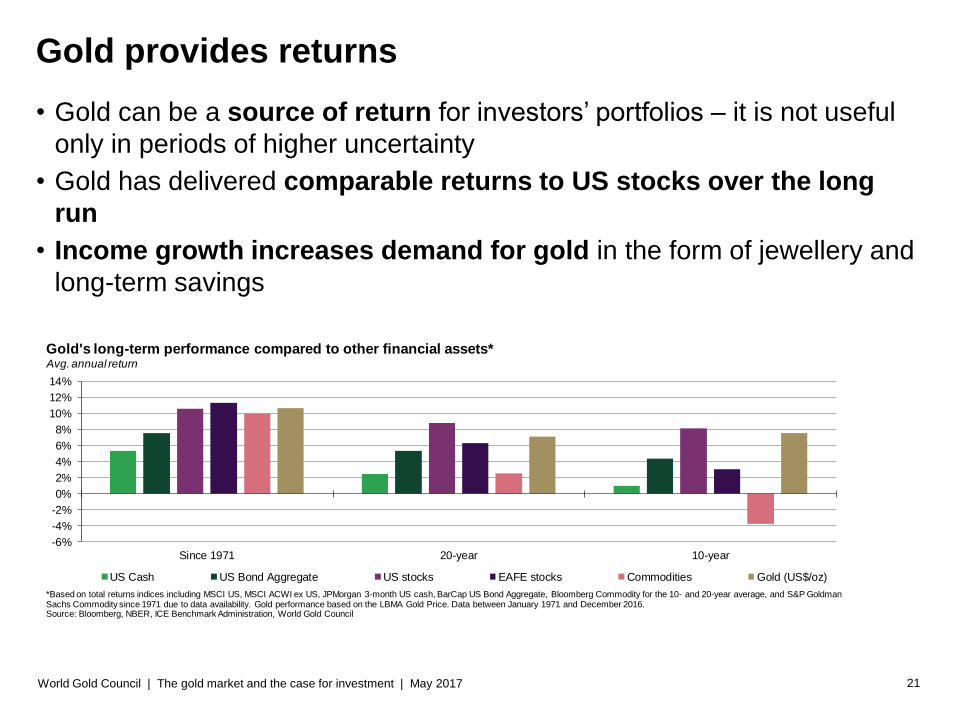
Gold provides returns
21World Gold Council | The gold market and the case for investment | May 2017
• Gold can be a source of return for investors’ portfolios – it is not useful
only in periods of higher uncertainty
• Gold has delivered comparable returns to US stocks over the long
run
• Income growth increases demand for gold in the form of jewellery and
long-term savings
-6%
-4%
-2%
0%
2%
4%
6%
8%
10%
12%
14%
Since 1971 20-year 10-year
Avg. annual return
US Cash US Bond Aggregate US stocks EAFE stocks Commodities Gold (US$/oz)
Gold's long-term performance compared to other financial assets*
*Based on total returns indices including MSCI US, MSCI ACWI ex US, JPMorgan 3-month US cash, BarCap US Bond Aggregate, Bloomberg Commodity for the 10- and 20-year average, and S&P GoldmanSachs Commodity since 1971 due to data availability. Gold performance based on the LBMA Gold Price. Data between January 1971 and December 2016. Source: Bloomberg, NBER, ICE Benchmark Administration, World Gold Council

Gold has outperformed inflation and cash
22World Gold Council | The gold market and the case for investment | May 2017
• Gold returns have outpaced CPI and short-term bonds over the long
run
• Gold prices tend to sharply increase in periods of high inflation
• Fiat currencies – including the US dollar – tend to fall in value against
gold
Compounded gold excess returns over various periods of time*
US inflation
global
inflation US cash global cash
Since 1971 3.59% 1.88% 2.17% 1.68%
20-year return 3.61% 3.21% 2.84% 4.07%
10-year return 3.99% 3.90% 4.26% 6.38%*Metrics computed using the LBMA Gold Price, US CPI, OECD global CPI, 3-month US T-Bill and
J.P. Morgan’s 3-month global cash index. Data betw een January 1971 and December 2016.
Source: Bureau of Labor Statistics, Federal Reserve, ICE Benchmark Administration Ltd,
OECD, J.P. Morgan, World Gold Council
Gold return in excess of:
0%
2%
4%
6%
8%
10%
12%
14%
16%
Low inflation (≤3%) High inflation (>3%)
Avg. annual return
US CPI %YoY
Nominal return Real return
Gold returns as a function of annual inflation*
* Inflation computed using annual US CPI year-on-year changes between 1970 and 2015. ** For each year on the sample, real return = (1+nominal return)/(1+inflation) -1.
Source: Bloomberg, Bureau of Labor Statistics, ICE Benchmark Administration, World Gold Council

Gold can improve risk-adjusted returns
23World Gold Council | The gold market and the case for investment | May 2017
• Over the past 10 years, a representative well-diversified US pension fund portfolio* with 50% of its assets
in stocks and 25% bonds and 25% in alternative assets would have returned 4.7% per year with an
annual volatility of 12.7%
• Proportionally re-allocating 2% of alternative assets to gold could have increased the average return to
4.8% and reduced volatility to 12.5%
• But investors could have done even better. Re-allocating 2% to gold and 2% to a long gold long dollar
position from alternatives could have further increased the portfolio’s average annual return to 4.9% while
reducing volatility to 12%
12.7%4.7%
12.5%4.8%
12.0%4.9%
4.6%
4.7%
4.7%
4.8%
4.8%
4.9%
4.9%
5.0%
Avg. PF portfolio
2% gold 2% gold/2% long gold long USD
Return
Portoflio mix
Performance of an average pension fund (PF) portfolio with and without gold*
*Based on performance between 12/2006-12/2016. The average PF portfolio is based on Willis Tower Watson Global Pension Assets Study 2017 and Global Alternatives Survey 2016. It includes a 50% allocation to stocks (30% Russell 3000, 20% MSCI ACWI ex US), 25% allocation to fixed income (22% Barclays US Aggreggate, 1% Barclays Global Aggregate ex US, 1% JPMorgan EM Global Bond Index, and 2% short-term Treasuries), and 25% alternative assets (9% FTSE REITs Index, 7% HFRI Hedge Fund Index, 7% S&P Private Equity Index, and 2% S&P GS Commodity Index). The allocation to gold comes from proportionally reducing the alternatives bucket. Source: Bloomberg, ICE Benchmark Administration, Solactive AG, World Gold Council
Annualized volatility
Annualized return
Disclaimer
24
COPYRIGHT AND OTHER RIGHTS
© 2017 World Gold Council. All rights reserved. World Gold Council and the Circle device are trademarks of the World Gold Council or its affiliates. All references to
LBMA Gold Price are used with the permission of ICE Benchmark Administration Limited and have been provided for informational purposes only. ICE Benchmark
Administration Limited accepts no liability or responsibility for the accuracy of the prices or the underlying product to which the prices may be referenced.
Other third party data and content is the intellectual property of the respective third party and all rights are reserved to them.
Any copying, republication or redistribution of content, to reproduce, distribute or otherwise use the statistics and information in this report including by framing or
similar means, is expressly prohibited without the prior written consent of the World Gold Council or the appropriate copyright owners except as provided below. The
use of the statistics in this report is permitted for the purposes of review and commentary (including media commentary) in l ine with fair industry practice, subject to the
following two pre-conditions: (i) only limited extracts of data or analysis be used; and (ii) any and all use of these statistics is accompanied by a clear
acknowledgement of the World Gold Council and, where appropriate, of Thomson Reuters, as their source. Brief extracts from the analysis, commentary and other
World Gold Council material are permitted provided World Gold Council is cited as the source. It is not permitted to reproduce, distribute or otherwise use the whole or
a substantial part of this report or the statistics contained within it. While every effort has been made to ensure the accuracy of the information in this document, the
World Gold Council does not warrant or guarantee the accuracy, completeness or reliability of this information. The World Gold Council does not accept responsibility
for any losses or damages arising directly or indirectly, from the use of this document.
The material contained in this document is provided solely for general information and educational purposes and is not, and should not be construed as, an offer to
buy or sell, or as a solicitation of an offer to buy or sell, gold, any gold related products or any other products, securities or investments. Nothing in this document
should be taken as making any recommendations or providing any investment or other advice with respect to the purchase, sale or other disposition of gold, any gold
related products or any other products, securities or investments, including without limitation, any advice to the effect that any gold related transaction is appropriate
for any investment objective or financial situation of a prospective investor. A decision to invest in gold, any gold related products or any other products, securities or
investments should not be made in reliance on any of the statements in this document. Before making any investment decision, prospective investors should seek
advice from their financial advisers, take into account their individual financial needs and circumstances and carefully consider the risks associated with such
investment decision.
Without limiting any of the foregoing, in no event will the World Gold Council or any of its affiliates be liable for any decision made or action taken in reliance on the
information in this document and, in any event, the World Gold Council and its affiliates shall not be liable for any consequential, special, punitive, incidental, indirect or
similar damages arising from, related to or connected with this document, even if notified of the possibility of such damages.
This document contains forward-looking statements. The use of the words “believes,” “expects,” “may,” or “suggests,” or similar terminology, identifies a statement as
“forward-looking.” The forward-looking statements included in this document are based on current expectations that involve a number of risks and uncertainties. These
forward-looking statements are based on the analysis of World Gold Council of the statistics available to it. Assumptions relating to the forward-looking statement
involve judgments with respect to, among other things, future economic, competitive and market conditions all of which are difficult or impossible to predict accurately.
In addition, the demand for gold and the international gold markets are subject to substantial risks which increase the uncertainty inherent in the forward-looking
statements. In light of the significant uncertainties inherent in the forward-looking information included herein, the inclusion of such information should not be regarded
as a representation by the World Gold Council that the forward-looking statements will be achieved. The World Gold Council cautions you not to place undue reliance
on its forward-looking statements. Except in the normal course of our publication cycle, we do not intend to update or revise any forward-looking statements, whether
as a result of new information, future events or otherwise, and we assume no responsibility for updating any forward-looking statements.