world investment report - unctadunctad.org/en/docs/wir2005ch3_en.pdf · technology transfer can...
TRANSCRIPT

United Nations Conference on Trade and Development
WorldInvestmentReport
United NationsNew York and Geneva, 2005
2005 Transnational Corporations andthe Internationalization of R&D
INTRODUCTION
Bridging the technology gap betweencountries is necessary to foster sustainableeconomic development. Technology is advancingfaster than ever before. Developing countries thatfail to build capabilit ies enabling them toparticipate in the evolving global networks ofknowledge creation risk falling further behindin terms of competitiveness as well as economicand social development. While internationaltechnology transfer can bring importantknowledge to an economy, that alone is notenough. Using new technologies efficientlyrequires creating additional absorptive capacity,while a continuous effort has to be made to keepup with technical change. This is particularly truegiven the fact that wages tend to rise as a countrydevelops, facilitating the entry of lower costcompetitors in the market. While actions of bothdomestic enterprises and the government areessential to build technology capabilities indeveloping countries, TNCs can also play a role.
One of the main reasons why developingcountries promote inward FDI is indeed to linkup to the global technology and innovationnetworks led by these firms. In terms of creatingnew technology and diffusing it internationally,TNCs are world leaders in many industries. Theyaccount for the bulk of global businessexpenditures on R&D. They dominate newpatents and often lead innovation in managementand organization. Establishing links with theirinnovation and production networks can helpcountries enhance their technological capabilitiesand enable them to compete better in internationalmarkets.
Technological capabilities are difficult toacquire. The rapid pace of technical change andthe growing importance of science-basedtechnologies in many industries call for moreadvanced and diverse skills and intense technicaleffort. These require better infrastructure, not the
least in information and communicationstechnologies. They also require strong supportinginstitutions as well as stable and efficient legaland governance systems. Moreover, they requireaccess to the international knowledge base,combined with a strategy to leverage this accessfor the benefit of local innovation systems. Thecumulative forces that are increasing the gapbetween countries with respect to innovationperformance make the role of policy increasinglyimportant at all levels – national and international.
The manner in which TNCs allocate theirR&D activities internationally is significant inthis context. R&D is among the leastinternationalized functions of TNCs.Traditionally, when R&D internationalizationtook place, both home and host countries werefound in the developed world. To the extent thatTNCs undertook R&D in developing countries,they did so almost exclusively to adapt productsand processes to local conditions. These stylizedfacts have begun to change.
These changes manifest themselves inseveral ways. First , the degree of R&Dinternationalization by firms is rising in all keyhome countries as part of the overall trendtowards the offshoring of services (WIR04).German TNCs, for example, set up more foreignR&D units during the 1990s than they did duringthe preceding 50 years (Ambos 2005). Second,R&D internationalization is now growing fastestin some host developing countries, notably inAsia. Third, the drivers of R&Dinternationalization are changing. The processis no longer driven only by the need for localadaptation or to tap into established knowledgecentres. In response to increasing competition,TNCs now relocate segments of R&D so as toaccess foreign pools of research talent, reduceR&D costs and speed up the process oftechnology development. Fourth, R&D in some

developing countries now goes well beyond localadaptation and involves complex stages of R&Don a par with work undertaken in the developedeconomies. Fifth, developing-country firms arealso setting up R&D units abroad. These trendshave become apparent only in the past few yearsand are likely to continue.
This new phenomenon is partly expectedand partly unexpected. It is expected in two ways.First, in most cases R&D undertaken abroadsupports production. As TNCs increaseproduction in developing countries, some R&D(of the adaptive kind) can be expected to follow.Second, R&D is a form of service activity. Manyother services are fragmenting in a processwhereby certain segments are located in countrieswith lower wages and appropriate skills. It is notsurprising that R&D is following suit. Indeed,the survey of Europe’s largest firms conductedin 2004 by UNCTAD and Roland Berger showedthat all service functions – including R&D – arenow candidates for offshoring (WIR04). It isunexpected in that R&D is a service activity withvery demanding skill, knowledge and supportneeds — traditionally only met in developedcountries with strong national innovationsystems. Moreover, R&D is taken to be the least“fragmentable” of economic activities becauseit involves knowledge that is strategic to firms,and because it often requires dense knowledgeexchange (much of it tacit) between users andproducers within localized clusters. A home-country bias in R&D activities “reflects thelinguistic and geographic constraints imposed byperson-embodied exchanges and transfers of tacitknowledge” (Patel and Pavitt 2000, p 218).
The extent to which developing countriesconnect with the internationalizing R&Dnetworks of TNCs depends in particular on thestrength of their national innovation systems. Thisin turn is dependent on policies, the quality ofinstitutions (including both organizations and therules governing innovation activities), the qualityof human resources and the production andinnovative capabilities of enterprises. Innovation
reflects an intense interaction between firms andother actors in the public and private sectors.Innovation in developing countries is often carriedout on the shop floor, in process or productengineering, quality control, procurement,distribution and overall management. However,a significant part also involves technical effortin R&D laboratories separated from production.R&D-based innovation is greater the moreadvanced, fast changing and large-scale thetechnology involved, but it is needed even if itdoes not aim to push forward frontiers ofknowledge.
Part Two of WIR05 reviews recent trendsin the internationalization of R&D by TNCs. Itbegins in chapter III by looking at the linksbetween R&D, innovation and development, andconsiders the levels of innovative capabilitiesamong countries around the world. Large gapsin this area prevail between countries — gapsthat limit the ability of many of them to take partin the global networks of knowledge creation anddiffusion. Addressing these gaps is a majordevelopment challenge; it is also essential toensure that the internationalization of R&D byTNCs benefits larger parts of the world.
Chapter IV identifies the main players(firms and countries) in the R&Dinternationalization process. The analysis isconfined to R&D due to data constraints, but,where available, other qualitative informationrelated to innovation, notably in services, is alsoconsidered. Chapter V discusses the changingdrivers and determinants of R&Dinternationalization. Chapter VI reviews theimplications of R&D internationalization for hostand home economies, recognizing the difficultiesinvolved in assessing the impact of thisphenomenon. The last two chapters (VII andVIII) focus on policy implications at the nationaland international levels. They place particularemphasis on the need to promote interactionbetween TNCs and domestic players (firms andinstitutions) in national innovation systems.
100 World Investment Report 2005: Transnational Corporations and the Internationalization of R&D
A. Innovation matters forall countries
Innovative activity and capabilities areessential for economic growth and development.A recent report identifies science, technology andinnovation as essential to achieving theMillennium Development Goals (UN MillenniumProject 2005, Sachs and McArthur 2005). Thisis true for the industrialized countries that areat the technology frontiers, as well as fordeveloping countries that need to catch up interms of technology.
Given the large gap between the developedand developing countries in terms oftechnological advancement, the latter continueto rely heavily on technology transfer from theformer in their development process. However,sustainable economic development requires thatcountries do more than simply “open up” andpassively wait for new technologies to flow in.It demands active, continuous technological effortby enterprises, along with government policiesthat help firms attract technologies, use themeffectively and innovate. Technology requiresefforts to absorb and adapt; it has strong “tacit”elements that cannot be embodied in equipmentor codified in instructions or blueprints. Tacitknowledge can only be transferred effectivelyif the recipient develops capabilities to learn andincorporate the knowledge. It must seek newinformation, experiment with the technology, findnew ways of organizing production and train itsemployees in new skills. It involves not just theenterprise itself but also interaction with otherfirms and institutions.
The development of technologicalcapabilities has always been necessary for theeffective use of new technologies; all the moreso today. Greater openness to trade and capital
��������
INNOVATION, R&D AND DEVELOPMENTflows does not reduce the need for localtechnological effort – on the contrary.Technologies are changing more rapidly, fallingtransport costs and liberalization are intensifyingcompetition, and TNCs are seeking locations withstrong capabilit ies to produce efficiently.Moreover, i t is not just export-orientedmanufacturing that needs to be competitive;manufacturers selling to domestic markets haveto compete against imports. Export-orientedservices and primary activities need to use newtechnologies to remain competitive in worldmarkets. The development of new capabilitiesapplies to both technical functions andmanagerial ones: organizational and marketinginnovation is as important as technical innovationto growth and competitiveness (Teece 2000).
Technological innovation means theintroduction of new products, processes orservices into the market.1 Innovation does notnecessarily mean pushing the frontiers ofknowledge, particularly in a developing-countrycontext. Rather, innovations can be new to theuser but not necessarily new to the world.2 Thenature of innovation – and of required capabilities– varies greatly between activities according totheir technological complexity, the creation ofnew technology being at one extreme and the useof existing technologies at the other.3 Figure III.1shows an illustrative pyramid, with the leastcomplex technological functions (in terms ofinnovative efforts) at the base, and the mostdemanding ones at the top.4 While thesecategories are generic activities in all threesectors – primary, manufacturing and services– they can be adapted to different technologiesto take account of particular machinery, process,product and organizational characteristics.
• The starting point is the acquisition of basicproduction capabilities to absorb and useexisting technology. This sounds easy but

102 World Investment Report 2005: Transnational Corporations and the Internationalization of R&D
it is not, at least in order for capabilities tomatch relevant global best practice and foractivity that goes beyond simple assembly.Reaching internationally acceptable levels ofproduction efficiency and quality in complexactivities is very demanding. Manyenterprises fail to do this, even after yearsof operation, unless they invest sufficientlyin collecting information, creating new skillsand developing appropriate managementstructures.
• Absorption and adaptation of technology areparticularly challenging if conditions aresignificantly different from those at the originof the technology, and if local support andsupply structures are weak.
• Adaptation, in turn, can grow into significanttechnological improvement and technologicallearning, with systematic efforts made toimprove product and process performance.At this stage, many firms start monitoringinternational technological trends andselecting those technologies that can feed intotheir own efforts.
• Finally there is the frontier innovation stage,when firms design, develop and test entirelynew products and processes.
Research and development (R&D) is onesource of innovation (box III.1). In the early stagesof technological activity, enterprises need not setup formal R&D departments. As they mature,however, it becomes increasingly desirable tomonitor, import and implement technologies. R&Das a distinct activity may appear as early as thesecond level of complexity, where multifacetedtechnologies are involved or if local conditionsdemand significant adaptation. In a developingcountry, such R&D is feasible once the operationis fairly large scale and the necessary technicalskills are available. The role of formal R&D thengrows as the firm attempts significanttechnological improvements to introduce newproducts or processes. Firms that reach the highestlevel in the pyramid need not, however, be frontierinnovators (technological “leaders”) – their R&Dmay build on or improve upon innovations doneelsewhere (technological “followers”). Aspecialized unit not involved in routine technicalor production work is needed to monitor newdevelopments outside the firm or country, assesstheir significance for the firm and master, adaptand improve on existing technologies.5 FormalR&D becomes an essential part of the
Figure III.1. Stages of technology development by innovation effort
Source: UNCTAD.
FRONTIERINNOVATION
Create new technologies:as leader or follower
TECHNOLOGYIMPROVEMENT &
MONITORING
Change products and processes, plant layout, productivitymanagement and quality systems, procurement methods andlogistics to adapt technology to local or export-market needs.
This is based on in-house experimentation and R&D as well ason search and interactions with other firms and institutions
SIGNIFICANT ADAPTATION
BASIC PRODUCTION
Train workers in essential production and technical skills; reach plant design capacityand performance levels; configure products and processes; set up essential quality
management systems; institute supervisory, procurement and inventory managementsystems; establish in-bound and out-bound logistics
Improve products, processes and skills toraise productivity and competitiveness,
based on own R&D, licensing, interactionswith other firms or institutions

103CHAPTER III
technological learning process, especially forcomplex and fast moving technologies.
Empirical studies suggest a directrelationship between R&D and growth.6 Thelong-term impacts on economic growth of publicR&D and business R&D have been found to bestrong and significant (Guellec and vanPottelsberghe 2004a). Business R&D undertakenin other countries also plays an important role.Moreover, increased domestic business R&Daccentuates the positive impact of both publicand foreign business R&D. In other words,business R&D (either domestic or foreign-funded) has both a direct impact on a country’seconomic growth and an indirect one throughimproved absorption of the results of public R&Dand R&D performed in other countries.
Enterprises are the principal agents ofinnovation today, but they do not innovate andlearn in isolation. They rely on intricate (formaland informal) links with other firms and withpublic research institutions, universities and other
knowledge creating bodies like standards andmetrology institutes. In undertaking innovation,they react to government policies on trade,competition, investment and innovation. Theyseek human resources for innovation from theeducation and training system, and they drawupon the financial system for funding innovativeefforts. The complex web within whichinnovation occurs is commonly referred to as the“national innovation system” or NIS (Nelson1993, Lundvall 1992b).
Most of the NIS li terature focuses onfrontier invention in industrialized countries,rather than on mastery and adaptation oftechnology that take place in developingcountries. However, the innovation systemconcept is just as relevant for the latter (UNIDO2003, Edquist and McKelvey 2001). Mostlearning, mastery and adaptive activity requiresclose and continuous interaction with otherenterprises l ike suppliers, subcontractors,competitors and consultants, as well as with otheractors such as public R&D institutes, universities,
R&D is only one component of innovationactivities, but it represents the most developed,widely available, and internationally comparablestatistical indicator of industrial innovationactivities.
According to international guidelines, R&D(also called research and experimentaldevelopment) comprises creative work“undertaken on a systematic basis in order toincrease the stock of knowledge, includingknowledge of man, culture and society, and theuse of this stock of knowledge to devise newapplications” (OECD 2002b, p. 30).
R&D involves novelty and the resolutionof scientific and technological uncertainty. Itincludes basic and applied research along withdevelopment (United States, NSB 2004):
• Basic research. The objective of basic researchis to gain a more comprehensive knowledgeor understanding of the subject under studywithout specific applications in mind. Inindustry, basic research is defined as researchthat advances scientific knowledge but doesnot have specific immediate commercialobjectives.
• Applied research. The objective of appliedresearch is to gain the knowledge orunderstanding to meet a specific, recognizedneed. In industry, applied research includesinvestigations to discover new scientificknowledge that has specific commercialobjectives with respect to products, processes,or services.
• Development. Development is the systematicuse of the knowledge or understanding gainedfrom research directed towards the productionof useful materials, devices, systems ormethods, including the design and developmentof prototypes and processes.
For data collection purposes, the boundarybetween R&D and other technological innovationactivities can be found in pre-productiondevelopment activities (OECD 2002b). Inpractice, however, it is difficult to make thedistinction. In technology-intensive industriesdistinguishing between “research” and“development” is especially difficult since muchof the R&D work conducted involves closeinteraction between researchers in both the privateand public sectors, often also including closecollaboration with customers and suppliers (BIAC2005, Amsden and Tschang 2003).
Box III.1. Definition of R&D
Source: UNCTAD and Moris 2005b.

104 World Investment Report 2005: Transnational Corporations and the Internationalization of R&D
the metrology, standards, testing and quality(MSTQ) system, small and medium-sizedenterprise (SME) extension services, venturecapital funds and export marketing or traininginstitutions. A good supportive institutionalinfrastructure is therefore important for effectiveinnovation. Incentive structures that fosterentrepreneurship, risk-taking and innovation atthe firm, industry and university level are alsoimportant.
As the internationalization of productiondeepens and communication costs decline, eachNIS increasingly draws on knowledge createdin other systems. Rapid technical progress andthe rising costs and risks of innovation forceinnovators to seek centres of scientific excellenceinternationally. Global production networks – inwhich TNCs play the leading role – link togetherthe productive activities that underly innovation.Parent companies are instrumental in suchnetworks, providing the initial technology to theiraffiliates and helping them absorb, adapt andsubsequently upgrade it . As a result , theinnovation systems of more and more countriesare becoming interlinked in a global network in
which technological activity is international andinformation networks span the world.
From an economic developmentperspective it is becoming increasingly importantto take part in this international exchange. Thosecountries that are in a position to do so stand abetter chance of accessing new technologies atan early stage, as well as commercializinginnovations developed in their own NIS. However,the capabilities needed for participating areunequally distributed among countries (seebelow), which increases the risk of a furtherwidening of already large development gaps.
While there are different ways for countriesto participate in the international exchange ofinnovation (box III.2), WIR05 focuses on the roleof TNCs in this process, with special emphasison the internationalization of R&D. As notedabove, R&D is not always necessary forinnovation. Due to data limitations, however, theanalysis in Part Two is confined to this particulartype of innovative activity. The next two sectionsdescribe the global allocation of R&D and ofinnovative capabilities. Subsequent chapters
Box III.2. Different ways of internationalizing innovation
There are three main categories ofinnovation internationalization (box table III.2.1).In the first category, national enterprises and TNCsas well as individuals are engaged in theinternational commercialization of technologydeveloped at home. The second category relatesto domestic and international technical and
scientific collaborations among private and publicinstitutions, including domestic firms and TNCs,universities and research centres. Internationalinnovation by TNCs is the third category. TheTNC is the only institution that, by definition,can control and carry out within its boundariesthe process of innovation across the globe.
Source: UNCTAD.
Box table III.2.1. Taxonomy of internationalization of innovation
Category Actors Forms
International exploitation Profit-seeking (national and • Exports of innovative productsof nationally produced transnational) firms and • Cession of licenses and patentsinnovations individuals • Foreign production of innovative goods internally
designed and developed
International techno- Universities and public • Joint scientific projectsscientific collaborations research centres • Scientific exchanges, sabbaticals
• International flows of studentsNational and transnational • Joint ventures for specific projectsfirms • Production agreements with exchange of technical
information and/or equipment
International generation TNCs • R&D and other innovative activities both in homeof innovations and host countries
• Acquisitions of existing R&D units or greenfieldR&D investment in host countries
Source: adapted from Archibugi and Michie 1995, Narula and Zanfei 2004.

105CHAPTER III
focus on the internationalization of R&D, thetrend towards increased R&D by TNCs indeveloping countries, the driving forces behindthis phenomenon, potential impacts and policyimplications.
B. Global R&D trends
1. R&D is geographicallyconcentrated
Between 1991 and 1996, global R&Dspending increased from $438 billion to $576billion (an average annual growth of 4.4%; annex
table A.III.2). The momentum of R&D spendingcontinued throughout the late 1990s and thebeginning of the new millennium. By 2002 it hadrisen to $677 bill ion,7 corresponding to anaverage annual growth rate of 2.8% since 1996.
R&D expenditure is geographicallyconcentrated. In 1996 and 2002, the ten largestspenders accounted for more than 86% of theworld total, with their share marginally increasingover that period (table III.1). Eight of them aredeveloped countries, of which the United Statesreported by far the largest amounts in both years.Only two developing countries are among the topten: China and the Republic of Korea.
Table III.1. The 10 leading economies in R&D and business R&D spending,1996 and 2002
(Ranked by their 2002 values, billions of dollars)
Total R&D Business R&D
Rank Economy 1996 2002 Rank Economy 1996 2002
World 575.6 676.5 World 376.3 449.81 United States 197.3 276.2 1 United States 142.4 194.42 Japan 138.6 133.0 2 Japan 92.5 92.33 Germany 52.3 50.2 3 Germany 34.6 34.84 France 35.3 32.5 4 France 21.8 20.65 United Kingdom 22.4 29.3 5 United Kingdom 14.5 19.66 China 4.9 15.6 6 Korea, Republic of 9.9 10.47 Korea, Republic of 13.5 13.8 7 China .. 9.58 Canada 10.1 13.8 8 Canada 5.9 7.99 Italy 12.6 13.7 9 Sweden 6.6 a 7.3 b
10 Sweden 8.8 a 9.4 b 10 Italy 6.7 6.6Total 495.8 587.6 Total 334.7 c 403.4Share in world (%) 86.1 86.9 Share in world (%) 88.9 89.7
Developing economies, Developing economies,South-East Europe and CIS 44.5 57.1 South-East Europe and CIS 20.4 31.9
1 China 4.9 15.6 1 Korea, Republic of 9.9 10.42 Korea, Republic of 13.5 13.8 2 China .. 9.53 Taiwan Province of China 5.0 6.5 3 Taiwan Province of China 2.9 4.04 Brazil 6.0 4.6 e 4 Russian Federation 2.6 3.05 Russian Federation 3.8 4.3 5 Brazil 2.7 1.9 e
6 India 2.1 3.7 b 6 Singapore 0.8 1.27 Mexico 1.0 2.7 7 Mexico 0.2 0.8 b
8 Singapore 1.3 1.9 8 Turkey 0.2 0.49 Turkey 0.8 1.2 9 Hong Kong, China 0.2 d 0.3
10 Hong Kong, China 0.7 d 1.0 10 Chile 0.1 0.2Total 39.1 55.4 Total 19.7 31.5Share in developing economies, Share in developing economies,South-East Europe and CIS (%) 88.0 97.0 South-East Europe and CIS (%) 96.4 98.7
Source: UNCTAD, based on annex table A.III.2.a 1995.b 2001.c In 1996, Switzerland was the 10th largest spender on business R&D ($5.7 billion). Thus, the total of the top ten in
that year was $340.4 billion.d 1998.e 2003.
106 World Investment Report 2005: Transnational Corporations and the Internationalization of R&D
The growth in global R&D is partly dueto increased expenditures by the largest spenders.Between 1996 and 2002, the growth in the R&Dexpenditure of the United States (5.8% per year)was twice as high as the world average. Canadaand the United Kingdom also showed fastexpansion during that period. The expendituresof China rose at an average annual rate of morethan 20% during the same period. This dynamismcontrasts sharply with the trends of France,Germany and Japan, where R&D expendituresactually contracted in dollar terms.8
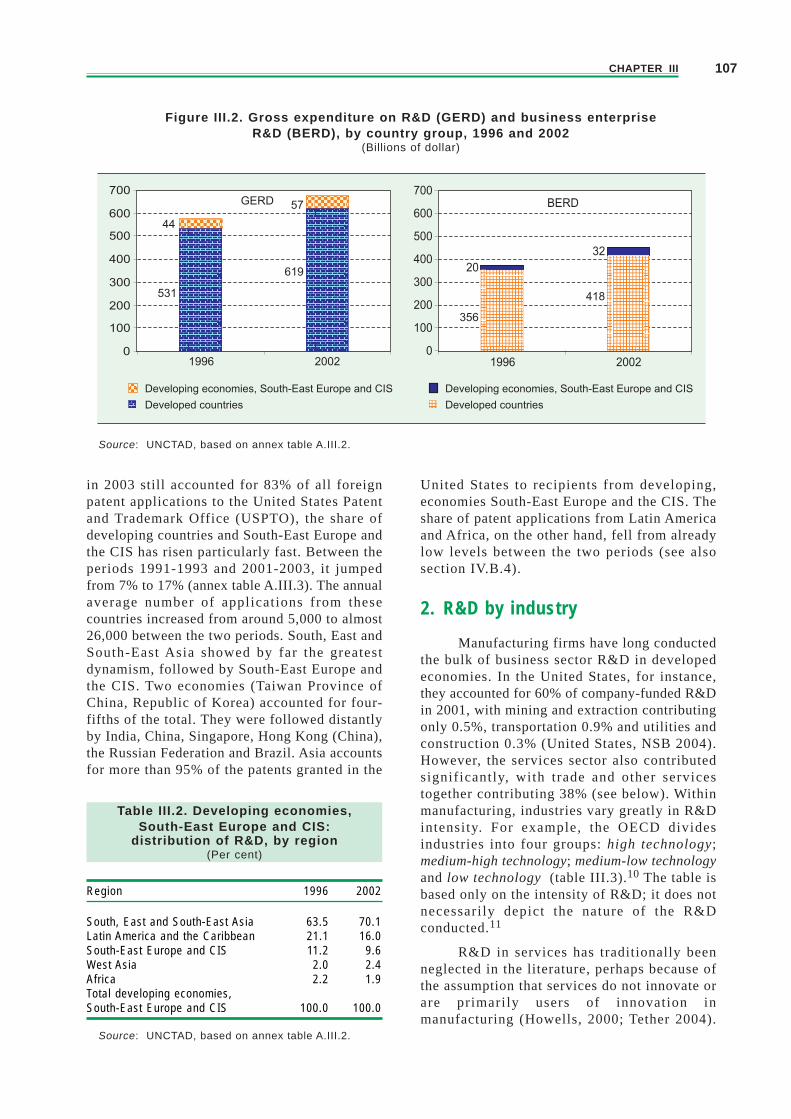
The combined share of developingeconomies, South-East Europe and the CIS inglobal R&D spending is on the rise, althoughfrom a very low level. In 1991 they accountedfor only 2.5% of the world total (annex tableA.III.2). By 1996 their share had reached 7.7%,and by 2002 it had increased further to 8.4%(figure III.2). This increase was concentratedmainly in South, East and South-East Asia (tableIII.2), which accounted for a dominant andgrowing share in R&D expenditure outsidedeveloped countries (more than two-thirds in2002). With the exception of West Asia, the shareof all other subregions in the grouping droppedbetween 1996 and 2002. The decline was the mostpronounced in Latin America and the Caribbean,the share of which shrunk from 21% to 16% ofthe total for the countries included in table III.2.Africa’s share also declined from 2.2% to 1.9%.
The concentration of R&D expendituresoutside developed countries is high and rising.The ten largest R&D spenders of the developingeconomies, South-East Europe and the CIS in2002 accounted for 97% of all R&D in theseeconomies (table III.1). Reflecting the dynamicsof South, East and South-East Asia, six of thetop ten are from these subregions. In the majorityof these economies, R&D expenditure grew fastduring the period. Double-digit annual growthrates were recorded for China, India and Mexico.R&D expenditures contracted in dollar terms onlyin Brazil.
In today’s world economy, enterprises(private and State-owned) account for the lion’sshare of global R&D. In 1991, they spent $292billion on R&D (annex table A.III.2). Thatamount increased to $376 billion in 1996 and$450 billion in 2002 (figure III.2). In other words,in each of these years enterprises wereresponsible for two-thirds of global R&Dspending; the remaining one-third was accounted
for by governments, higher education institutionsand non-profit private entities.
While the overall share was stable at theglobal level, the share of business enterprises intotal R&D expenditure varied considerably byregion and country (figure III.3). In the Triad– Japan, the United States and the EU – the shareof enterprises was above 60% in 2002. Between1996 and 2002 this share rose in Japan and theEU but not in the United States. In developingAsia, the share of enterprises rose rapidly overthat period, reaching a level similar to that ofthe EU by 2002 (62%). Conversely, the share ofenterprises in Latin America and the Caribbeanwas low and even declined in 1996-2002 (from37% to 33%).9
Reflecting the dominant role of enterpriseR&D in global R&D, the geographical patternsof the former show various similarities with thoseof the latter. R&D in the business sector isconcentrated, just like total R&D. Both in 1996and in 2002, the ten largest spenders on businessR&D accounted for about 90% of the world total,their share marginally increasing over that period(table III.1). The list of the largest business R&Dspenders is identical with that of the largest totalR&D spenders; only the rankings vary. In a slightcontrast to the global picture of total R&D, inbusiness R&D only the spending of France, Italyand Japan declined in dollar terms in 1996-2002.
The share of developing economies, South-East Europe and the CIS in global business R&Dspending is lower than in total R&D spending,reflecting a greater reliance on government R&Din these economies. Their share in the formerreached only 5.4% in 1996 and 7.1% in 2002(figure III.2). The top ten positions in terms ofbusiness R&D among the developing economies,South-East Europe and the CIS differ from thosefor total R&D only because data are not availablefrom India, and the tenth place is thus taken byChile (table III.1). Six of the ten economies arefrom South, East and South-East Asia. Anotherfeature of the list of the largest businessenterprise R&D spenders among the developingcountries is i ts very high geographicalconcentration (the share of the largest ten is 99%of the group total in 2002), reflecting in part alack of data reporting on business R&D in themajority of developing economies.
An output-based assessment of globalinnovation activities confirms the patternsobserved above. Whereas developed countries
107CHAPTER III
Figure III.2. Gross expenditure on R&D (GERD) and business enterpriseR&D (BERD), by country group, 1996 and 2002
(Billions of dollar)
Source: UNCTAD, based on annex table A.III.2.
Table III.2. Developing economies,South-East Europe and CIS:
distribution of R&D, by region(Per cent)
Region 1996 2002
South, East and South-East Asia 63.5 70.1Latin America and the Caribbean 21.1 16.0South-East Europe and CIS 11.2 9.6West Asia 2.0 2.4Africa 2.2 1.9Total developing economies,South-East Europe and CIS 100.0 100.0
Source: UNCTAD, based on annex table A.III.2.
in 2003 still accounted for 83% of all foreignpatent applications to the United States Patentand Trademark Office (USPTO), the share ofdeveloping countries and South-East Europe andthe CIS has risen particularly fast. Between theperiods 1991-1993 and 2001-2003, it jumpedfrom 7% to 17% (annex table A.III.3). The annualaverage number of applications from thesecountries increased from around 5,000 to almost26,000 between the two periods. South, East andSouth-East Asia showed by far the greatestdynamism, followed by South-East Europe andthe CIS. Two economies (Taiwan Province ofChina, Republic of Korea) accounted for four-fifths of the total. They were followed distantlyby India, China, Singapore, Hong Kong (China),the Russian Federation and Brazil. Asia accountsfor more than 95% of the patents granted in the
United States to recipients from developing,economies South-East Europe and the CIS. Theshare of patent applications from Latin Americaand Africa, on the other hand, fell from alreadylow levels between the two periods (see alsosection IV.B.4).
2. R&D by industry
Manufacturing firms have long conductedthe bulk of business sector R&D in developedeconomies. In the United States, for instance,they accounted for 60% of company-funded R&Din 2001, with mining and extraction contributingonly 0.5%, transportation 0.9% and utilities andconstruction 0.3% (United States, NSB 2004).However, the services sector also contributedsignificantly, with trade and other servicestogether contributing 38% (see below). Withinmanufacturing, industries vary greatly in R&Dintensity. For example, the OECD dividesindustries into four groups: high technology;medium-high technology; medium-low technologyand low technology (table III.3).10 The table isbased only on the intensity of R&D; it does notnecessarily depict the nature of the R&Dconducted.11
R&D in services has traditionally beenneglected in the literature, perhaps because ofthe assumption that services do not innovate orare primarily users of innovation inmanufacturing (Howells, 2000; Tether 2004).
GERD
531619
0
100
200
300
400
500
600
700
1996 2002
Developing economies, South-East Europe and CIS
Developed countries
BERD
418356
0
100
200
300
400
500
600
700
1996 2002
Developing economies, South-East Europe and CIS
Developed countries
44
531
57
619 20
356
32
418

108 World Investment Report 2005: Transnational Corporations and the Internationalization of R&D
Services do innovate in the broader sense in bothprocesses (organizational change) and products(new services), but much of this innovation doesnot involve formal R&D. Data on this aretherefore scarce, which makes empirical analysisdifficult. This may be changing, however, as aresult of new information and communicationtechnologies (ICTs) and their growing role inservice industries. The telecommunications andcomputer service industries have been investingin R&D for some time, and a new industry is nowemerging that provides R&D services tomanufacturers on a contractual basis (Tether2002).
Data on services R&D are patchy.Published sources cover only a few industrialized
Figure III.3. Share of enterprise R&D in total R&D by country/region, 1996 and 2002(Per cent)
Source: UNCTAD, based on annex table A.III.2.
Table III.3. Classification of manufacturing industries by R&D intensity
Industry category R&D intensity Industries
High technology >5% Aircraft and spacecraft; pharmaceuticals; office, accounting and computing equipment;radio, television and communications equipment; medical, precision and optical instruments
Medium-high 1.5-5% Electrical machinery and apparatus not elsewhere classified; motor vehicles, trailerstechnology and semi-trailers; chemicals excluding pharmaceuticals; railroad equipment and transport
equipment not elsewhere classified; machinery and equipment not elsewhere classifiedMedium-low 0.7-1.5% Coke, refined petroleum products and nuclear fuel; rubber and plastic products; othertechnology non-metallic mineral products; building and repair of ships and boats; basic metals;
fabricated metal products, except machinery and equipmentLow technology <0.7% Manufacturing, not elsewhere classified, and recycling; wood, pulp, paper, paper
products, printing and publishing; food products, beverages and tobacco; textiles,textile products, leather and footwear
Source: United States, NSB 2004, Table 6-1.
Note: R&D intensity is direct R&D expenditures as a percentage of production (gross output).
countries up to 2000. However, they suggest thatservices R&D is rising in most economies, butthat its share in total R&D varies greatly. Severalcountries showed substantial increases in servicesR&D from the early 1980s to the late 1990s; forinstance, the shares of services in company-funded R&D increased by about 5 percentagepoints in France and Italy and 13 percentagepoints in Canada and the United Kingdom(United States, NSB 2004). The United Statesled the industrialized economies in terms ofservices R&D (box III.3). Interestingly, the R&Dintensity of services (R&D as a percentage ofsales) was higher than for manufacturing, thoughit also varied greatly by activity.
0
20
40
60
80
Japan United States European
Union
Developing
Asia
South-East
Europe and
CIS
Latin America
and the
Caribbean
1996 2002

109CHAPTER III
3. Capability needs and benefitsdiffer across activities
The efforts and capabilities required tomaster, adapt and create technologies, and thusto undertake R&D, differ. At the industry level,clothing manufacture is usually less complex inthe range and depth of technical skills orinformation needed than making semiconductors.Within complex industries, technical processesmay differ according to the speed of change andin the effort needed to create new generationsof technology: steel technology today is morestable and less demanding in product innovationthan electronics. Within any industry there canbe differences according to product: in textiles,for instance, yarn spinning, a capital- and scale-intensive activity, requires more advancedtechnical skills than clothing manufacture.Finally, there are differences by function for anygiven product. In clothing, sewing is easier thandesigning new fashion products or managing aninternational supply chain.
There is a similar hierarchy of technicalcomplexity in services, though it may be moredifficult to define than in manufacturing. As notedin box III.2, some services now performconsiderable R&D (indeed, the only output ofcontract research firms is research anddevelopment). Others do not conduct muchformal R&D but innovate in terms of productdevelopment (e.g. new financial services bybanks or new packages by tour operators) andmanagement practices. In broad terms, serviceactivities and functions can be ranked by the levelof skills required – formal (education levels) orinformal (employee training). In export-orientedservices, for instance, the bottom end may includesome call centres while the top end representsadvanced R&D (WIR04).
Different types of R&D also yield differentbenefits in terms of adding value, learning, skillcreation, productivity improvement, marketgrowth and spillovers to other activities (chapterVI). Complex R&D activities generally call for,and so create, more advanced skills andknowledge than simple ones; they also yieldhigher value added. Activities associated withrapid technical progress offer better prospectsfor future productivity increase and enjoy fastergrowth than other activities.12 Within atechnology, advanced functions like design anddevelopment (as compared to basic production)provide higher value added and so higher wages.As innovation moves into higher functions, the
NIS itself grows stronger and permits greaterinnovation in a more diverse range of activities.
The deepening of the industrial structurefrom simple to complex activities, and ofinnovative activities from simple to advancedfunctions, is a natural result of economicdevelopment, but accelerating and facilitatingthe process often requires active policies.13 Thisapplies not only to manufacturing but also toprimary production (with the advent ofbiotechnology and genetic modification inagriculture), infrastructure and services(particularly those IT-based ones that areundergoing rapid offshoring, analysed in WIR04).
The R&D hierarchy for the manufacturingsector depicted above is actually a goodrepresentation of the industrialization process.Most developing economies start modernmanufacturing with the simplest (low R&D)technologies: textiles, clothing, food-processingand wood products. Some move up the scale intoheavy process industries (metals, petroleumrefining) and metal products, providing basicintermediates. A few go on to become efficientusers of “medium-high” technologies, makingmore advanced intermediate and capital goods(chemicals, automobiles, and industrialmachinery). Even fewer develop competitivecapabilities in high-technology industries likeaerospace, micro-electronics or pharmaceuticals.
There is an important exception to thisdepiction, of special interest to this analysis. The“fragmentation” of production (i.e. the relocationof processes or functions across countries byTNCs to take advantage of differences inproduction and communication costs and skills)allows some countries without a strong R&D baseto leapfrog to production in high-technologyindustries l ike electronics (Arndt andKierzkowski 2001, Lall and Zhang 2004).14
While developing countries generally start at thelowest level of technical complexity – finalassembly – it is possible for them to move upthe innovation ladder in electronics, taking onmore demanding functions, handling moreadvanced equipment and making the morecomplex products.15 For such science-basedindustries as biotechnology and some ICT-relatedindustries, there may be limited need to locatethe R&D activity in close proximity toproduction. As noted by one observer (Reddy2000, p. 174): “because of their science base eventheoretically trained personnel, with little or noindustrial experience, can be employed for R&Dfunctions in new technologies.”

110 World Investment Report 2005: Transnational Corporations and the Internationalization of R&D
Service enterprises in the United Statessharply increased their R&D spending and theirshare of total industrial R&D after the mid-1980s.Before 1983, service industries accounted for lessthan 5% of total industrial R&D; by 2002, theirshare reached 43%. The total value of R&D byservices was $82 billion compared to $109 billionfor manufacturing in 2002.
The amount of R&D by firms in serviceactivities varied greatly (box table III.3.1). Theleading performers were trade, scientific R&Dservices, software and computer systems design.With a combined R&D of $63 billion, theyaccounted for 77% of R&D by service firms.
The R&D intensity of service firms (R&Das a percentage of sales) is higher than that formanufacturing firms, though it also varies greatlyby activity (box table III.3.2).
However, the classification of firms underservice categories has to be treated with care.Companies are classified under various serviceactivities on the basis of payroll, and theclassification may be misleading as a result. Thisis particularly true of “trade”. Thus, firms with ahigh payroll in sales and marketing are classifiedunder “trade”, and may include manufacturers withhigh marketing payrolls or diversified industrialconglomerates. One example of misclassification(noted by NSF) is that over $1 billion of biotechR&D in 2001 appears to have been performed by
Box III.3. Services sector R&D in the United States
trading companies, when it is likely to have beenperformed by manufacturing companies.
Firms in software and computer systemsdesign and related services jointly spent $21billion on R&D in 2002, raising their share oftotal United States company-funded R&D from4% in 1987 to 12% in 2002.
Scientific R&D services, the leaders in R&Dintensity in 2001, are provided by companies thatperform R&D for other firms on a contractualbasis, mainly in manufacturing. R&D by thesefirms more than doubled during 1997-2001,showing both the rising pace of innovation andthe growing willingness of manufacturers tooutsource R&D previously kept in-house(Jankowski, 2001).
Health-care services are tightly linked tothe high-technology pharmaceutical industry.Firms in these services have traditionally donerelatively little R&D, but there was a sharpincrease in 2002. The financial services andinsurance industry, along with broadcasting andtelecommunications, does very little. However,formal R&D may not be the best way to measureinnovation in these industries, as they areconstantly designing and introducing newproducts and processes.
Box table III.3.1. R&D spending bynon-manufacturing activities in the
United States, 2002(Millions of dollars)
Total non-manufacturing 81 824
Mining, extraction and support activities app. 700Utilities app. 100Construction 164Trade app. 25 000Information 17 870Transportation and warehousing app. 300Newspapers, periodicals, books and databases 614Software 12 927Broadcasting and telecommunications app. 1 600Other information services app. 2 600Finance, insurance and real estate 1 903Architecture, engineering, related services 4 159Computer systems design, related services 11 983Scientific R&D services 13 034Other professional and scientific services 1 182Management of companies and enterprises 148Health-care services app. 4 200Other app. 900
Source: United States, NSF (forthcoming), tables A-2, A-3.Note: Approximate (app.) figures are based onR&D funded by industry; data on federal fundingof R&D are suppressed for confidentiality reasons,so that total R&D spending is also suppressed.
Box table III.3.2. R&D intensity: companyand other (non-federal) R&D funds as % of
net sales in R&D-performing firms
2001 2002All industries 3.8 3.6
Manufacturing 3.6 3.2Non-manufacturing 4.0 4.1Scientific R&D services 36.5 17.6Software 19.3 21.4Computer systems design, related services 16.5 14.3Management of companies 7.8 7.6Trade 6.2 5.0Architectural, engineering, related services 5.2 5.3Health-care services 4.1 15.1Newspapers, periodicals, books, databases 2.7 2.8Transportation and warehousing 2.4 0.5Construction 1.4 0.6Mining, extraction and support 1.3 3.2Finance, insurance and real estate 0.7 0.6Broadcasting and telecommunications 0.5 0.7Information 4.4 4.0
Source: United States, NSF (forthcoming), table A-27.
Source: UNCTAD, based on information provided by NSF.

111CHAPTER III
Some countries (Singapore amongdeveloping countries, Ireland among developedones) have managed such upgrading rapidly;China appears set to follow suit. In other words,provided they have the absorptive capacity andappropriate policies and institutions in place,developing countries can take advantage offragmentation to move up the technology ladder,both across activities and within them. Thefragmentation of functions is proceeding evenmore rapidly in some services, as communicationcosts fall dramatically due to new informationand communications technologies (WIR04) .However, taking advantage of the potential offragmentation requires countries to createknowledge and build local capabilities. As shownin the next section, the gap between theinnovative capabilities of countries is very wide.
C. The innovationcapability gap
1. Measuring innovationcapabilities
In order for countries to connect withglobal networks of knowledge creation as wellas to attract and benefit from R&D by TNCs, acertain basic level of innovative capabilities isneeded. However, countries vary greatly in thisrespect, and in many cases the gaps betweencountries have been growing over time. In orderto il lustrate the current situation, WIR05introduces a new measure of national innovationcapabilities: the UNCTAD Innovation CapabilityIndex (UNICI). The UNICI measures two criticaldimensions: (i) innovative activity (theTechnological Activity Index) and (ii) the skillsavailability for such activity (the Human CapitalIndex). As it is not possible to measure nationaltechnological activity or skills directly, theindices use proxies. Since the data available evenfor the proxies are not complete (caveats arenoted below) the indices should be interpretedwith caution and seen mainly as broad indicators(box III.4).16
National innovative activity can bemeasured by its inputs or outputs. On the “input”side, the usual measures are R&D expendituresand/or employment. R&D is a narrow measureof innovation effort in that it does not captureinformal technological effort; at the same timeit is rather broad in that it includes defence and
basic research that may not be relevant to thetypes of company R&D important for the presentanalysis.17 Still, R&D data are the only onesavailable on a comparable basis across countries,and they provide an indicator of technical effortin complex activities (where the absorption oftechnologies requires formal R&D). As R&Dexpenditure data are more limited than R&Dmanpower data for a given year, only the latterappear in the index.
Innovation “outputs” are often proxied bypatents (national or international) and scientificpublications.18 Data on patents taken out in theUnited States are singled out as they indicate thatthe innovation has reached a comparable levelof novelty and is commercially valuable.19
Patents are a better indicator of invention thanof innovation, since they do not capture thecommercial utility of the discovery; scientificpublications are further removed from the market,though they do show the knowledge base onwhich technological activities depend.
The human resource base for technologicalactivity is generally measured by educationalenrolment. Enrolment data do not capturedifferences in the quality and relevance of theeducation; neither do they reflect skilldevelopment by learning on the job or otherforms of employee training. Moreover, theavailable enrolment data are patchy and, in somecountries, out of date. Again, they are the onlydata available for benchmarking skills and theydo indicate differences in the education base onwhich technological capabilities are built.
These measures have to be normalized byeconomic size (say, population) to make themcomparable across countries. However, where theabsolute size of technological effort or skilledresearchers matters (i.e. where there are minimumcritical mass effects), it is also important tocompare total values for economies. This isparticularly relevant for the cross-border locationof R&D (chapter V).
The components and variables of theUNICI are shown in table III .4. The threecomponents of the Technological Activity Indexare weighted equally while those making up theHuman Capital Index are assigned differentweights to capture the greater importance of high-level skills for innovation. The UNICI iscalculated for 117 countries for the years 1995and 2001. The starting year, 1995, was selectedso as to include a large number of economies inSouth East Europe and the CIS.
112 World Investment Report 2005: Transnational Corporations and the Internationalization of R&D
The Technological Activity Index is shownin annex table A.III.4, with countries divided intofour roughly equal groups. Its ranks were stablebetween 1995 and 2001 (with a correlationcoefficient of 0.955). However, some countrieschanged ranks significantly. At the lower levelsthe changes generally arose from small shifts inone component, and so are difficult to interpret.At the higher levels they appear to be moreclearly related to changes in technological effort.It should be noted that the Index does not capturethe absolute size of the technological activities
in each country, thus biasing the Index againstcountries like China or India with large ruralpopulations, combined with large values for R&Dspending. To the extent that the internationalizationof R&D is affected by the absolute size oftechnological activity rather than its innovationintensity per capita, it is important to look at thisfactor as well (chapter V).
The Human Capital Index could becalculated for 119 countries.20 The countries aregrouped into three sets (annex table A.III.5). Most
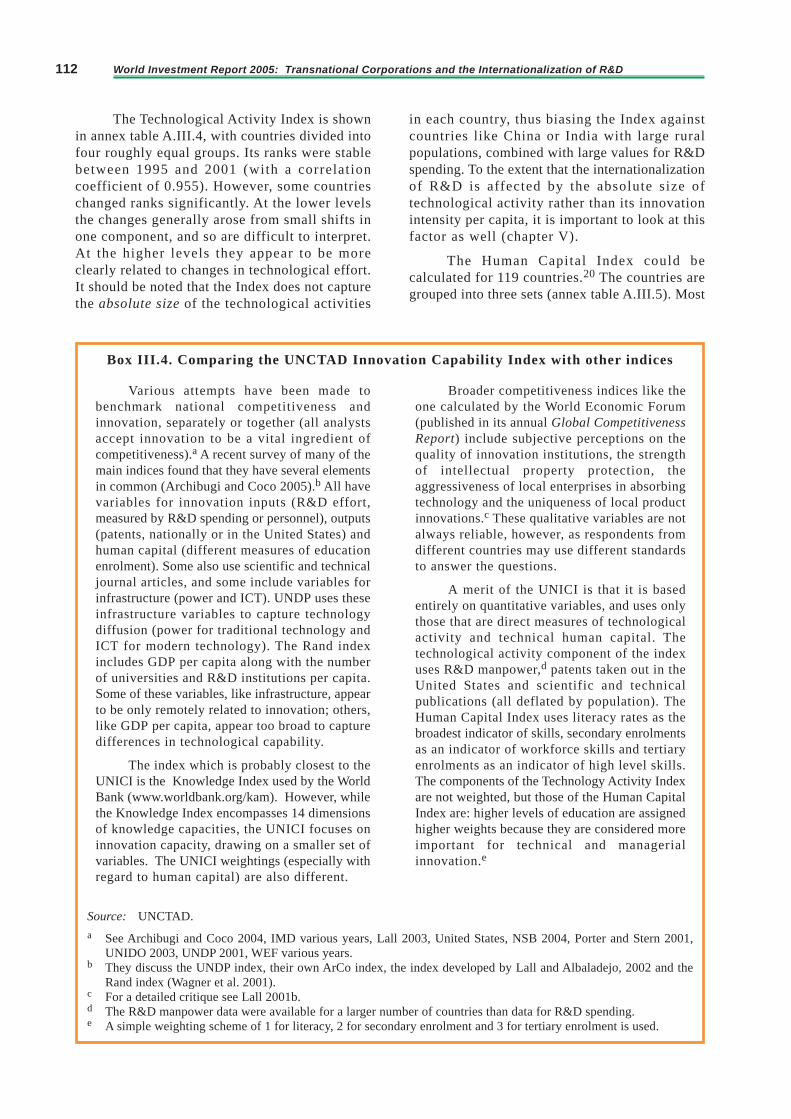
Various attempts have been made tobenchmark national competitiveness andinnovation, separately or together (all analystsaccept innovation to be a vital ingredient ofcompetitiveness).a A recent survey of many of themain indices found that they have several elementsin common (Archibugi and Coco 2005).b All havevariables for innovation inputs (R&D effort,measured by R&D spending or personnel), outputs(patents, nationally or in the United States) andhuman capital (different measures of educationenrolment). Some also use scientific and technicaljournal articles, and some include variables forinfrastructure (power and ICT). UNDP uses theseinfrastructure variables to capture technologydiffusion (power for traditional technology andICT for modern technology). The Rand indexincludes GDP per capita along with the numberof universities and R&D institutions per capita.Some of these variables, like infrastructure, appearto be only remotely related to innovation; others,like GDP per capita, appear too broad to capturedifferences in technological capability.
The index which is probably closest to theUNICI is the Knowledge Index used by the WorldBank (www.worldbank.org/kam). However, whilethe Knowledge Index encompasses 14 dimensionsof knowledge capacities, the UNICI focuses oninnovation capacity, drawing on a smaller set ofvariables. The UNICI weightings (especially withregard to human capital) are also different.
Broader competitiveness indices like theone calculated by the World Economic Forum(published in its annual Global CompetitivenessReport) include subjective perceptions on thequality of innovation institutions, the strengthof intellectual property protection, theaggressiveness of local enterprises in absorbingtechnology and the uniqueness of local productinnovations.c These qualitative variables are notalways reliable, however, as respondents fromdifferent countries may use different standardsto answer the questions.
A merit of the UNICI is that it is basedentirely on quantitative variables, and uses onlythose that are direct measures of technologicalactivity and technical human capital. Thetechnological activity component of the indexuses R&D manpower,d patents taken out in theUnited States and scientific and technicalpublications (all deflated by population). TheHuman Capital Index uses literacy rates as thebroadest indicator of skills, secondary enrolmentsas an indicator of workforce skills and tertiaryenrolments as an indicator of high level skills.The components of the Technology Activity Indexare not weighted, but those of the Human CapitalIndex are: higher levels of education are assignedhigher weights because they are considered moreimportant for technical and managerialinnovation.e
Source: UNCTAD.
a See Archibugi and Coco 2004, IMD various years, Lall 2003, United States, NSB 2004, Porter and Stern 2001,UNIDO 2003, UNDP 2001, WEF various years.
b They discuss the UNDP index, their own ArCo index, the index developed by Lall and Albaladejo, 2002 and theRand index (Wagner et al. 2001).
c For a detailed critique see Lall 2001b.d The R&D manpower data were available for a larger number of countries than data for R&D spending.e A simple weighting scheme of 1 for literacy, 2 for secondary enrolment and 3 for tertiary enrolment is used.
Box III.4. Comparing the UNCTAD Innovation Capability Index with other indices

113CHAPTER III
developed and some transition economies are inthe leading group; this group also has fourdeveloping economies: the Republic of Korea,Taiwan Province of China, Argentina andUruguay in that order. As with the TechnologicalActivity Index, the Human Capital Index is stableover time, with a correlation coefficient of 0.973between 1995 and 2001. Again, the absolute sizeof the skills availability is not captured by theindex but is of importance for the internationalallocation of R&D internationalization (chapterV). The technology and skill indices are highlycorrelated (coefficients of 0.910 in 1995 and0.889 in 2001), though technological effort andskill formation do not always go together.
2. The UNCTAD InnovationCapability Index
The UNCTAD Innovation Capability Index(UNICI) consists of the unweighted averages ofthe two indices mentioned above. Countries aredivided into three groups: high, medium and low(table III.5). The high capability group in theUNICI comprises all developed countries(including the new EU members) as well as fourdeveloping and four South-East European andCIS countries (all from Europe). Three of the fourdeveloping economies are from South-East andEast Asia; the fourth (Argentina) is from LatinAmerica. The Asian ones combine strongtechnological and skill performance, whileArgentina is weak in technology but somewhatstronger in skills. The economies in transitionare in the top group mainly because of their skillbase – their technological performance isrelatively weak, with only one (the RussianFederation) in the high innovation group.
Table III.4. Components of the UNCTAD Innovation Capability Index
Indices Components Weights attached
Technological Activity Index R&D personnel per mill ion population All 3 components have equal weightsUnited States patents granted per mill ion populationScientific publications per mill ion population
Human Capital Index Literacy rate as % of population Weight of 1Secondary school enrolment as % age group Weight of 2Tertiary enrolment as % of age group Weight of 3
UNCTAD Innovation Technological Activity Index Both indices have equal weightsCapability Index Human Capital Index
Source: UNCTAD.
The “medium” capability group containsother South-East European and CIS economiesas well as most resource-rich and newlyindustrializing economies (including China andtwo sub-Saharan African economies, South Africaand Mauritius). The “low” capability group hasall the South Asian economies, one from South-East Asia (Indonesia), most sub-Saharan Africaneconomies and the remaining countries of LatinAmerica, West Asia and North Africa. Therankings are in line with received knowledgeabout national capabilities. If some economies(like India) seem misplaced, the explanation liesin the use of total population as the deflator;while this is the correct way to construct theindex, i t can be misleading when minimumcritical mass is important.
The unweighted regional averages for theUNICI are shown in table III.6. The developedcountries are well in the lead, albeit with a slightdecline in the average score. This does not meanthat they are investing less in skills or innovation,but rather, that other countries are spendingrelatively more. The new EU members improvedtheir scores during the period studied,approaching the levels of developed countries.The South-East and East Asia subregions are theclear leaders among developing regions, and theiraverage score combined has improved over time.The West Asia and North African subregions alsoimproved their performance, and overtook LatinAmerica and the Caribbean, which had adeteriorating score between 1995 and 2001. SouthAsia also shows a lower score over time, mainlybecause of weaker technological performance byPakistan and declining human capitalperformance by Sri Lanka. Sub-Saharan Africaimproves its average score marginally but stilllags behind all other regions.

114 World Investment Report 2005: Transnational Corporations and the Internationalization of R&DT
ab
le I
II.5
. T
he
UN
CT
AD
In
no
va
tio
n C
ap
ab
ilit
y I
nd
ex
Hig
hM
ediu
m
Low
199
5
20
01
1
995
2
001
19
95
2
001
1Sw
eden
0.
957
Swed
en
0.97
940
Uzb
ekis
tan
0.60
5Jo
rdan
0.
595
79M
ongo
lia0.
321
Sri L
anka
0.
317
2Fi
nlan
d 0.
947
Finl
and
0.97
741
Hon
g K
ong
(Chi
na)
0.59
3G
eorg
ia0.
593
80Tu
nisi
a0.
302
Bot
swan
a0.
315
3C
anad
a 0.
947
Uni
ted
Stat
es
0.92
742
Cyp
rus
0.58
1C
hile
0.
576
81In
dia
0.28
7A
lger
ia0.
312
4U
nite
d St
ates
0.
946
Den
mar
k 0.
926
43C
hile
0.
581
Cyp
rus
0.56
682
Bol
ivia
0.28
3Vi
et N
am0.
295
5A
ustr
alia
0.94
4N
orw
ay
0.92
344
Slo
vaki
a0.
580
Uzb
ekis
tan
0.56
483
Hon
dura
s0.
279
Indi
a 0.
285
6D
enm
ark
0.93
4A
ustr
alia
0.92
045
Sou
th A
fric
a0.
579
Hon
g K
ong
(Chi
na)
0.56
384
Ecu
ador
0.27
9El
Sal
vado
r 0.
279
7N
orw
ay
0.92
9C
anad
a 0.
907
46A
rmen
ia0.
574
Leba
non
0.55
585
El S
alva
dor
0.27
6Zi
mba
bwe
0.27
88
Uni
ted
King
dom
0.
914
Uni
ted
King
dom
0.9
0647
Cos
ta R
ica
0.55
5R
oman
ia0.
554
86In
done
sia
0.27
6M
oroc
co0.
277
9N
ethe
rland
s 0.
912
Bel
gium
0.89
448
Latv
ia
0.55
4S
outh
Afr
ica
0.54
887
Bot
swan
a0.
264
Indo
nesi
a 0.
261
10B
elgi
um0.
911
Net
herla
nds
0.88
849
Rom
ania
0.55
4B
razi
l0.
529
88N
amib
ia0.
261
Ken
ya0.
260
11Ja
pan
0.90
6Ja
pan
0.88
550
Leba
non
0.53
8A
rmen
ia0.
526
89A
lger
ia0.
257
Syr
ian
Ara
b R
ep.
0.24
612
Fran
ce
0.90
2N
ew Z
eala
nd0.
879
51K
azak
hsta
n0.
521
Kaz
akhs
tan
0.52
590
Om
an0.
234
Om
an0.
232
13G
erm
any
0.88
9S
witz
erla
nd0.
877
52K
uwai
t0.
515
Uru
guay
0.50
691
Par
agua
y0.
233
Dom
inic
an R
epub
lic0.
221
14N
ew Z
eala
nd0.
874
Icel
and
0.87
653
Vene
zuel
a0.
504
Kyr
gyzs
tan
0.50
092
Syr
ian
Ara
b R
ep.
0.22
5N
amib
ia0.
218
15S
witz
erla
nd0.
871
Taiw
an P
OC
0.86
554
Mol
dova
, R
ep.
of0.
497
Thai
land
0.
488
93Vi
et N
am0.
218
Par
agua
y0.
213
16A
ustr
ia0.
852
Fran
ce
0.86
355
Sau
di A
rabi
a0.
496
Sau
di A
rabi
a0.
476
94N
icar
agua
0.21
2N
icar
agua
0.17
917
Taiw
an P
OC
0.85
2A
ustr
ia0.
852
56B
ahra
in0.
485
Egyp
t 0.
474
95K
enya
0.17
3H
ondu
ras
0.17
418
Icel
and
0.83
5G
erm
any
0.85
057
Qat
ar0.
471
Kuw
ait
0.47
396
Gua
tem
ala
0.16
5N
iger
ia0.
157
19Ire
land
0.
829
Kore
a, R
ep. o
f 0.
839
58Ta
jikis
tan
0.45
4C
osta
Ric
a0.
472
97Pa
kist
an
0.16
0Ta
nzan
ia, U
nite
d R
ep. o
f0.
145
20Ko
rea,
Rep
. of
0.82
1Sp
ain
0.81
959
Mex
ico
0.45
4M
exic
o0.
469
98Za
mbi
a0.
150
Gha
na0.
143
21Sp
ain
0.81
4Ire
land
0.
814
60Ph
ilipp
ines
0.
452
Mal
aysi
a 0.
467
99N
iger
ia0.
137
Uga
nda
0.14
022
Isra
el0.
808
Isra
el0.
804
61Eg
ypt
0.44
9B
ahra
in0.
466
100
Cam
eroo
n0.
133
Paki
stan
0.
137
23R
ussi
an F
ed.
0.79
7S
love
nia
0.80
162
Per
u0.
448
Vene
zuel
a0.
460
101
Gha
na0.
131
Gua
tem
ala
0.13
524
Italy
0.78
1R
ussi
an F
ed.
0.78
863
Turk
ey
0.43
0P
eru
0.42
510
2C
ôte
d’Iv
oire
0.12
9C
amer
oon
0.13
425
Esto
nia
0.77
4Es
toni
a 0.
775
64B
razi
l0.
421
Phili
ppin
es
0.42
310
3B
enin
0.11
8M
adag
asca
r0.
133
26Be
laru
s 0.
770
Sing
apor
e 0.
748
65Th
aila
nd
0.41
3M
oldo
va,
Rep
. of
0.41
310
4M
alaw
i0.
109
Yem
en0.
130
27S
love
nia
0.76
3Ita
ly 0.
746
66Ja
mai
ca0.
394
Qat
ar0.
403
105
Ban
glad
esh
0.10
9C
ôte
d’Iv
oire
0.12
728
Gre
ece
0.73
3P
ortu
gal
0.74
667
Mal
aysi
a 0.
393
Jam
aica
0.39
510
6S
eneg
al0.
105
Ban
glad
esh
0.12
129
Ukr
aine
0.72
8Li
thua
nia
0.74
268
Mau
ritiu
s0.
390
Col
ombi
a 0.
393
107
Uga
nda
0.08
1Za
mbi
a0.
115
30Si
ngap
ore
0.71
9G
reec
e0.
737
69K
yrgy
zsta
n0.
370
Mon
golia
0.39
110
8Ta
nzan
ia, U
nite
d R
ep. o
f0.
080
Ben
in0.
106
31Po
land
0.
717
Pola
nd
0.73
270
Col
ombi
a 0.
367
Turk
ey
0.39
010
9Ye
men
0.07
9M
alaw
i0.
105
32H
unga
ry
0.70
5H
unga
ry
0.72
571
Dom
inic
an R
ep.
0.35
7B
oliv
ia0.
367
110
Mau
ritan
ia0.
070
Sen
egal
0.10
133
Por
tuga
l0.
704
Ukr
aine
0.70
572
Chi
na
0.35
4Tu
nisi
a0.
365
111
Mad
agas
car
0.06
5M
aurit
ania
0.06
834
Geo
rgia
0.68
3La
tvia
0.
705
73Zi
mba
bwe
0.35
1Ta
jikis
tan
0.36
211
2D
jibou
ti0.
057
Erit
rea
0.05
435
Bul
garia
0.67
1Be
laru
s 0.
697
74Ir
an, I
slam
ic R
ep. o
f0.
349
Chi
na
0.35
811
3H
aiti
0.05
5E
thio
pia
0.05
136
Lith
uani
a 0.
665
Cze
ch R
ep.
0.69
075
Uni
ted
Ara
b E
mira
tes
0.34
6Ir
an, I
slam
ic R
ep. o
f0.
346
114
Erit
rea
0.04
7H
aiti
0.04
637
Cze
ch R
ep.
0.64
8A
rgen
tina
0.68
576
Jord
an
0.33
9U
nite
d A
rab
Em
irate
s0.
326
115
Eth
iopi
a0.
046
Moz
ambi
que
0.03
038
Arg
entin
a0.
640
Bul
garia
0.66
577
Sri L
anka
0.
336
Mau
ritiu
s0.
323
116
Ang
ola
0.02
2D
jibou
ti0.
028
39U
rugu
ay0.
617
Slo
vaki
a0.
626
78M
oroc
co0.
324
Ecu
ador
0.31
911
7M
ozam
biqu
e0.
018
Ang
ola
0.01
9
So
urc
e:
UN
CT
AD
.N
ote
:T
he
co
mb
ine
d i
nd
ex
is a
n u
nw
eig
hte
d a
vera
ge
of
the
Te
chn
olo
gic
al A
ctiv
ity
Ind
ex
an
d t
he
Hu
ma
n C
ap
ita
l In
de
x.

115CHAPTER III
Table III.6. Regional unweightedaverages for the UNCTAD
Innovation Capability Index
Region 1995 2001
Developed countries (excl. thenew EU members) 0.876 0.869The new EU members 0.665 0.707South-East Europe and CIS 0.602 0.584South-East and East Asia 0.492 0.518West Asia and North Africa 0.348 0.361Latin America and the Caribbean 0.375 0.360South Asia 0.223 0.215Sub-Saharan Africa 0.157 0.160
Source: UNCTAD.
Each of these three indices is highlycorrelated with income. In a regression analysis,the log of per capita income “explains” 75% ofthe variation in the Technology Activity Indexin 2001, 66% of the variation in the HumanCapital Index and 74% of the variation in theUNICI. As expected, technological activity, skillsand incomes reinforce each other. The causalconnections between the three are highlycomplex, and there are many possible feedbackloops. For example, more technological activityleads to higher incomes, and higher incomesallow countries to invest more in innovation.However, it can be argued that the main causallink is likely to run from innovative activity and
skills to incomes, and that innovative activityrequires more advanced skills.21
Still, the indices do not rise uniformly withincome levels. As the scatter diagram shows,there is a large variation around the regressionline for the UNCTAD Innovation Capability Index(figure III.4).22 Countries above the line havehigher incomes than predicted by their innovationindex value (i.e. scoring lower on the index thanpredicted by their incomes); those below the linescore higher on the index than predicted by theirincomes. Hong Kong (China) has the lowestcomposite innovation score in relation to its percapita income (presumably earning high incomefrom service activities that do not requiresignificant technological effort), followed bysome small resource-rich economies. At the otherend of the spectrum, various economies intransition have high composite scores relativeto income, a result, as noted above, of theirrelatively strong performance in skill creation.
To sum up, there are large gaps betweencountries in terms of technological activity andhuman capital. The gap is not just between thedeveloped and developing countries, but alsowithin the developing and transition economies.In the developing world, innovative capabilitiesare highly skewed, with South-East and East Asiaat the high end and sub-Saharan Africa at the lowend of the spectrum. Within South-East and East
Figure III.4. Relationship between the UNCTAD Innovation Capability Index andlog per capita GDP, 2001
Source: UNCTAD.
2
3
4
5
6
7
8
9
10
11
12
0 0.1 0.2 0.3 0.4 0.5 0.6 0.7 0.8 0.9 1
Innovation capability index
EthiopiaMalawi
Kenya MongoliaKyrgyzstan
Georgia
UzbekistanUkraine
BelarusLithunia
Djibouti
Guatemala
NamibiaMauritius
Botswana
Bahrain
Kuwait
Hong Kong,China
Cyprus
Italy
Singapore Ireland
Switzerland
Viet Nam
China
India Tajikistan
Bulgaria
RussianFederation
Japan
Sweden
Norway United States
Multiple R: 0.86R Square: 0.74Adjusted R Square: 0.74n= 113
Pe
rca
pita
GD
P(in
log
s)

116 World Investment Report 2005: Transnational Corporations and the Internationalization of R&D
Asia, the three leaders (the Republic of Korea,Taiwan Province of China, Singapore) are wellahead of the other economies. Transitioneconomies have large reservoirs of skills inrelation to their income levels but seem to lagin technological effort.
While the Index suffers from the inevitableproblems of finding the appropriate measures fortechnological effort and human capital, its useof hard statistics provides intuitively plausibleresults:
• Innovative capabilities differ greatly acrosscountries, and the ranks are quite stable overthe period considered. It is proving difficultfor countries at the bottom to improve theirposition over time; there are cumulativeforces at work that seem to reinforce theadvantages of the leaders. It also suggeststhat significant change takes time to achieve.
• However, some countries have improvedtheir ranking. Thus, while developedcountries dominate the “high” group in theUNICI, that group also includes fourdeveloping economies and four economiesin transition.
• The three leading developing economieshave participated vigorously in the globalproduction and innovation system, but eachdid so using different means to accesstechnologies and build domesticcapabilities.23 Each invested heavily ineducation and skills development, sincesustained progress in either strategy requireshighly skilled human capital. Mostfundamentally, in each case access to globaltechnologies and to foreign markets wascritical to sustained growth and upgrading.
• The main strength of the economies intransition, particularly those in Europe, liesin their human capital, rather than intechnological activity, suggesting that thereis scope for using the former to enhance thelatter.
• South Asia and sub-Saharan Africa lagbehind the other regions in innovation and,more particularly, in human capital creation.
What are the implications of theseobservations? The first , of course, is thatinnovative capabilities affect countries’ abilityto develop and raise l iving standards. In aglobalizing world with rapid technical change,strong and growing innovative capabilities are
essential to economic progress. This is as trueof resource-based economies as of others, andit applies as much to services and agriculture asit does to manufacturing. As technologicalprogress proceeds at an accelerating pace, andas the competitive pressure on firms intensifies,the demands made on countries’ capabilities rise.This makes it more important than ever beforeto seek ways to bridge the gaps that exist.
Second, innovative capabilities are directlyrelevant to the location of internationally mobileR&D – the theme of WIR05. TNCs seeking R&Dsites overseas look for adequate supplies ofqualified technical manpower and innovativeactivity (chapter V). This is not to say that theseare the only factors at work in their choices.Attracting global R&D, whether conducted in-house by TNCs or outsourced to local serviceproviders, also needs such conditions as a stableand conducive investment climate, capable localfirms, adequate ICT and other infrastructure, andintellectual property protection. But innovationcapabilities – of the right quality and at the rightcost – are clearly the conditio sine qua non.
Third, innovative capabilities also affectthe scope for host-country benefits frominternationalized R&D (chapter VI). The qualityof R&D that is internationalized depends on localcapabilities. The same applies to the resultingexternalities, in terms of how much local firmsand institutions are able to absorb and learn fromexposure to best practice R&D techniques andskills. Whether or not R&D deepens over time,and how far it spreads over different activities,are almost entirely a function of the strength ofthe local skill and innovation system.
Finally, a word of caution. Nationalinnovative capabilities as measured above canbe misleading where minimum critical massconsiderations apply. While deflatingtechnological effort and skill formation by thesize of the economy is the right way to calculatea capability index, it skews the result againstcountries that have a large pool of employableskilled manpower with diverse skills, even withlow rates of skill creation at the national level.Thus the absolute size of the stock of educatedpeople has to be taken into account whenconsidering the determinants of R&D location.This explains the relatively modest positions inthe UICI rankings of China and India, twosignificant players in the recent increase in R&Dinternationalization by TNCs (chapter IV).

117CHAPTER III
D. Conclusion
There is a co-evolution of economicdevelopment and technological complexity (byactivity and function). The higher levels of skillsand technological capabilities that accompanydevelopment permit countries to shift into moreadvanced activities and functions. More advancedactivities and functions, in turn, yield highervalue added, and allow countries to remaincompetitive despite higher wages. While this isa natural feature of the development process,countries can improve their innovativecapabilities by appropriate policy interventions(chapter VII).
To summarize the main features ofinnovation highlighted above:
• Innovation is essential for economicdevelopment. Although in today’sglobalizing world economy developingcountries can obtain new technology fromother, more developed countries, they haveto learn and innovate in order to use newtechnologies efficiently. As countries moveup the development ladder and undertake morecomplex activities they need to upgrade theirtechnological capabilities and undertakemore advanced forms of innovation.
• The ways in which innovation takes placecan be diverse, but an important source ofinnovation is through R&D. Formal R&Dbecomes essential at a certain stage,certainly in manufacturing, and increasinglyin some kinds of modern services andagriculture.
• Enterprise innovation involves interactionswith other firms and institutions: technologydevelopment is a systemic process. Giventhe externalities, coordination problems andpublic goods (basic research, testing,metrology) inherent in this process,government involvement is vital particularlyin the early stages. In fact, withoutappropriate industrial , technology andeducation policies, R&D in the businesssector is unlikely to take off (chapter VII).
• Business R&D is geographically andsectorally concentrated. While the bulk isundertaken in developed countries, R&D insome developing countries – especially indeveloping Asia – is expanding particularlyfast. Most R&D takes place inmanufacturing, but it is also growing in theservices sector.
• Technological advances worldwide,especially in ICT, have created newopportunities for developing countries toparticipate in global knowledge networksonce they have the necessary capabilities.At the same time, minimum entry levels arerising in terms of the capabilities required.The cumulative nature of capabilitybuilding, together with scale andagglomeration economies, means that thesuccessful early starters can continue pullingahead of latecomers that are unable to reachthe minimum entry levels. Policyintervention is necessary to reverse thistrend.
• Innovation – and especially R&D –increasingly needs constant access tointernational knowledge. All “lateindustrializers” tapped technical knowledgeand skills from the early starters, though indifferent ways. While there are various waysto link up with global knowledge networks,inward and outward FDI in R&D is perhapsthe most direct way in which a country canconnect with centres of knowledge in othercountries.
• National innovation systems are becomingincreasingly interdependent. The absenceof local capabilities can effectively limitinteraction between one system and the restof the world, and thereby condemn thesystem in question to isolation from themainsprings of technical change andcompetitiveness.
The extent to which developing countriescan link up with global networks of learning andknowledge creation depends on their nationalinnovative strengths. These strengths differgreatly, and the UNCTAD Innovation CapabilityIndex shows that gaps between countries tendto persist over long periods. While the earlystages of development necessarily have to involvenurturing indigenous innovative capabilities inthe public as well as in the private sector, TNCscan play a role in strengthening an NIS (chapterVI). But foreign affil iates do not alwaysundertake high-level technological activities inhost countries. Many developing economies havelong had FDI in resource extraction,manufacturing and services without foreignaffiliates doing R&D. What is new is that thetrend is for more TNCs to spread R&D to somedeveloping countries, to a degree and in waysnot seen before. The next two chapters map thisprocess and discuss the factors that drive itsinternationalization and location.

118 World Investment Report 2005: Transnational Corporations and the Internationalization of R&D
Notes1 According to the so-called Oslo Manual:
“Technological product and process (TPP) innovationcomprise implemented technologically new productsand processes and significant technologicalimprovements in products and processes. A TPPinnovation has been implemented if it has beenintroduced on the market (product innovation) or usedwithin a production process (process innovation). TPPinnovations involve a series of scientific, technological,organisational, financial and commercial activities.”(OECD 1997a, p. 31).
2 A large body of “evolutionary” literature on technologyargues that there is no essential difference betweenabsorbing, adapting and improving technologies andcreating entirely new technologies (Nelson and Winter1982, Metcalfe 1995). There is also a growing literaturein this tradition which analyses technological activityin developing countries, see, e.g. Bell and Pavitt 1993,Dahlman et al. 1987, Katz 1987, Ernst et al. 1998,Lall1992 and 2001a, Nelson 1990, Radosevic 1999,UNIDO 2003.
3 Several authors have classified technical functions byinnovativeness. See, for instance, Bell and Pavitt 1993,Hobday 2001, Figueiredo 2001, Ernst et al. 1998, Lall1992.
4 A more detailed classification of functions by levels oftechnical complexity is provided in annex table A.III.1.
5 Even in developed countries, much R&D (Cohen andLevinthal 1989 estimate it at about half) is of this type;R&D has “two faces”: learning and innovation.
6 For a survey, see Guellec and van Pottelsberghe 2004a.7 Data for at least one year’s total R&D spending over
the period 1996-2002 are available for 93 economies,including all the major R&D performers (annex tableA.III.2). Additionally, partial data are available from57 economies on business enterprise spending on R&D.
8 In national currencies, however, R&D expendituresincreased somewhat in these economies as well.
9 Data on business expenditures on R&D are notavailable for African countries.
10 For updated versions, see Hatzichronoglou 1997 andUnited States, NSB 2004.
11 For example, it is possible that low-technologyindustries engage in more complex or fundamentalresearch than do high-technology sectors.
12 Data on 70 economies that account for 97% of globaleconomic activity show that high-technologymanufacturing output grew at 6.5% per annum over1980-2001, while other manufacturing output grew at2.4% (United States, NSF 2004).
13 Government efforts to tap such technologicaldifferences date back to the beginnings of industrialpolicy in the 15th century (Reinert 1995). Countrieshave long tried to move their productive structures fromactivities with decreasing returns to those withincreasing returns – initially from primary productionto manufacturing and later, within manufacturing, fromlow- to high-technology activities. In modern economictheory, conditions of diffuse externalities withcoordination problems and other market failures leadto multiple equilibriums, and so require coherentgovernment intervention to move from low to highgrowth equilibriums (Hoff and Stiglitz 2001).
14 Other high-technology activities (e.g. in aerospace,precision instruments and pharmaceuticals), may not
be suited to fragmentation because of security concerns,specific skill needs, continuous processes of productionor scale economies.
15 Foreign technology and R&D facilities can also beacquired through outward FDI.
16 The UNCTAD Innovation Capability Index draws onthe World Bank (2004) for data on literacy rates,tertiary enrolment rates, technical publications, R&Dand general data on population and GDP; UNIDO(2003) for enrolments in technical subjects; theUNESCO website (www.unesco.org) for researchersin R&D and enrolments at primary and tertiary levels;the USPTO website (www.uspto.gov) for patents inthe United States; the Eurostat website (europa.eu.int/comm/eurostat) for R&D data; and the RICYT website(www.ricyt.org) for R&D in Latin America.
17 Even formal R&D data are deficient. Many developingcountries do not collect or publish them, or they providevery outdated information. Some data may not conformto internationally accepted definitions of whatcomprises R&D. For the purposes of industrialinnovation, the most important variable in R&Dinternationalization, the best measure would be R&Dconducted by enterprises. However, data on thiscomponent of R&D are even scarcer in developingcountries than on total R&D, and this measure was notused here for this reason.
18 Some studies also use total factor productivity (TFP)to measure the “output” of innovation. However,comparable TFP data are difficult to obtain and theresults are subject to severe methodological andinterpretational problems at the national level.
19 While there are potential biases associated with theuse of USPTO data, it is the least biased indicator(Dernis et al. 2001). Data on Triadic patents – takenout at the European Patent Office, the Japanese PatentOffice and the USPTO – can reduce the “home bias”,and may capture the most commercially valuablepatents (since taking them out involves substantialcosts). However, the number of Triadic patents isrelatively small (around 44,000 compared to some180,000 for USPTO patents) (OECD 2004b). They mayalso be biased against developing-country firms thattend to focus on patenting in the United States, whichis the largest export market for many of them.
20 This was two more than the Technological ActivityIndex, but the extra two were dropped for the combinedIndex.
21 There might be a reverse causality between per capitaincome and the UNICI. Richer countries are better ableto support education and innovation. In addition,countries with oil resources consistently display ahigher per capita income than the UNICI would predict.At the same time, in poorer countries, it is likely thata higher human capital index leads directly to higherincome, which in turn leads to higher technologicalcapabilities and a higher value in the UNICI.
22 Only countries deviating significantly from the lineare mentioned in the chart.
23 Singapore relied heavily on FDI and insertion into theproduction (and later, R&D) networks of developed-country TNCs (chapter V); the other two have reliedmore on arm’s length technology transfers by TNCs,using original equipment manufacture (OEM) contractsand licensing as well as developing local technologicaland R&D capabilities (Lall 2001a).