world meteorological · pdf fileworld meteorological organization concerning the legal status...
TRANSCRIPT

WORLD METEOROLOGICAL ORGANIZATION
INSTRUMENTS AND OBSERVING METHODS
REPORT No. 85
WMO RADIOSONDE HUMIDITY SENSOR INTERCOMPARISON
PHASE I: Laboratory Test Central Aerological Observatory Dolgoprudny, Russian Federation June 1995 - June 1997
A. Balagurov, A. Kats, N. Krestyannikova (Russian Federation)
PHASE II: Field Test NASA Wallops Flight Facility Virginia, United States 8 - 26 September 1995
F. Schmidlin (United States)
WMO/TD-No. 1305
2006

NOTE
The designations employed and the presentation of material in this publication do not imply the expression of any opinion whatsoever on the part of the Secretariat of the World Meteorological Organization concerning the legal status of any country, territory, city or area, or its authorities, or concerning the limitation of the frontiers or boundaries.
This report has been produced without editorial revision by the Secretariat. It is not an official WMO publication and its distribution in this form does not imply endorsement by the Organization of the ideas expressed.

- i -
FOREWORD
The WMO Radiosonde Humidity Sensor Intercomparison was carried following to a decision of the Eleventh Session of the Commission for Instruments and Methods of Observation (CIMO-XI). The Laboratory Test was held from June 1995 to June 1997; and the Field Test from 8 to 26 September 1995.
Previous WMO intercomparisons of radiosondes showed that the accuracy and stability of sensors used for measurement of humidity in the upper atmosphere not always met the need for reliable data for use in operational weather forecasting, climate research and monitoring for climate change.
An International Organizing Committee (IOC) was established to plan for and undertake a Radiosonde Humidity Sensor Intercomparison. The IOC established the rules and procedures for conducting these tests; and agreed to carried out the intercomparison in two phases: Phase I, under laboratory conditions covering a wide range of temperature and humidity values; and Phase II, under in-situ flight conditions. The laboratory testing was run from June 1995 to June 1997 in the Central Aerological Observatory, Dogoprudny (Russian Federation), while the field test was carried out in September 2005 at the NASA, GSFC Wallops Island Flight Facility, Virginia (USA).
The experiment was designed to determine the systematic error and the calibration stability of various candidate sensors and to determine the reliability of the measurements under a variety of conditions. Laboratory testing was done under well-defined standards for humidity measurement to which the candidate sensors were compared. Similar reference instruments were not available for use during the in-flight phase of testing. Ground and aircraft-based remote sensing systems were used during Phase II for this purpose in addition to specially prepared radiosondes.
The report consolidates data and information from these Intercomparisons, which were designed to determine overall performance characteristics of candidate sensors. The report also contains recommendations on how best to proceed in this field.
I wish to express my sincere gratitude and that of CIMO to the two national Project Leaders, namely Dr A. Ivanov (Russian Federation), and Mr F. Schmidlin (USA), responsible for Phase I and Phase II, respectively. We are also grateful to the operational staff of Members actively involved in this Intercomparison. I also wish to acknowledge the dedicated and important work done by the members of the IOC and its Chairman, Dr J. Nash (UK).
I am confident that Members of WMO and other data users, as well as designers and manufacturers of humidity sensors, will find this report very useful. It will contribute to better understanding the accuracy and homogeneity of national data sets, and through this, a better understanding of regional and global compatibility of the long-term data series.
(Dr. R.P. Canterford)
Acting President Commission for Instruments and Methods of Observation

WMO RADIOSONDE HUMIDITY SENSOR INTERCOMPARISON
PHASE I - LABORATORY TEST
Central Aerological Observatory Dolgoprudny, Russian Federation
June 1995 - June 1997

TABLE OF CONTENTS - PHASE I
FOREWORD .............................................................................................................................I PHASE I - TABLE OF CONTENTS..................................................................................0 1. SUMMARY ..................................................................................................................1 2. INTRODUCTION .........................................................................................................1 3. REFERENCE INSTRUMENTS AND FACILITIES......................................................2 3.1. UNIVERSAL GENERATOR OF MOIST AIR "DIPOLE"........................................................2 3.2. CONDENSATION HYGROMETERS "TOROS" AND "THYGAN"........................................4 3.3. CLIMATE CHAMBER "FEUTRON" ...............................................................................5 3.4. DYNAMIC TEST UNIT "CASCADE" ..............................................................................5 4. SENSORS, PARTICIPATED IN INTERCOMPARISON.............................................7 4.1. AIR INC.....................................................................................................................7 4.2. VAISALA OY...............................................................................................................8 4.3. VIZ MANUFACTURING COMPANY ................................................................................8 4.4. RUSSIA .....................................................................................................................9 4.5. UKRAINE ...................................................................................................................9 5. CARRYING OUT EXPERIMENT ..............................................................................12 5.1. TEST STAGE ............................................................................................................12 5.1.1. Examination of static characteristics ............................................................12 5.1.2. Examination of time response ......................................................................13 5.2. RESEARCH STAGE ...................................................................................................13 5.2.1. The investigation of static characteristics.....................................................13 5.2.2. The investigation of dynamic characteristics................................................14 6. EXPERIMENTAL RESULTS.....................................................................................15 6.1. DATA BASE..............................................................................................................15 6.2. STATIC CHARACTERISTICS........................................................................................19 6.3. DYNAMIC PROPERTIES .............................................................................................27 6.4. OVERALL PERFORMANCE .........................................................................................30 7. CONCLUSIONS AND RECOMMENDATIONS ........................................................31 8. APPENDICES ...........................................................................................................32 8.1. TABLES ...................................................................................................................32 8.2. FIGURES .................................................................................................................36 8.3. INTERNATIONAL ORGANIZING COMMITTEE .................................................................52 8.4. LIST OF PARTICIPANTS..............................................................................................52 8.5. GLOSSARY ..............................................................................................................53
Tables Table 3-1. COMPARISON REFERENCES ...............................................................................6 Table 4-1. Sensors, participated in intercomparison. ..............................................................11 Table 5-1. The number of Samples for given humidity category in static characteristics
examination at the Test stage ................................................................................13 Table 5-2. The number of Samples for given humidity and temperature categories in static
characteristics examination at the Research stage ...............................................14 Table 6-1. Total data base, received in static characteristics examination at the Test stage .16 Table 6-2. Data base received in installations "CASCADE" and "DIPOLE" (dynamic
characteristics) .......................................................................................................18

Table 6-3. Some results of time constant tests received in installations "CASCADE" and "DIPOLE"................................................................................................................29
Table 6-4. Radiosonde humidity sensors performance...........................................................30 Table 8-1. The amount of measurements, made by particular sensors in static characteristics
examination at the Test stage ................................................................................32
Figures Fig. 3-1. "DIPOLE". Examination of static characteristics. ........................................................... 3 Fig. 3-2. "DIPOLE". Examination of dynamic characteristics. ...................................................... 4 Fig. 3-3. Dew-point hygrometer "TOROS". Principle of operation................................................ 4 Fig. 3-4. Dew-point hygrometer "THYGAN"................................................................................. 5 Fig. 3-5. "CASCADE". ................................................................................................................... 6 Fig. 4-1. Sensors, participated in intercomparison: ....................................................................10 Fig. 6-1. Differences between "TOROS" and "THYGAN" readings............................................ 19 Fig. 6-3. Differences between "TOROS" and "DIPOLE" humidity .............................................. 21 Fig. 6-4. Mean differences of participated sensors against "TOROS" at normal conditions. ..... 22 Fig. 6-5. Root-mean square deviations of participated sensors against "TOROS" at normal
conditions...................................................................................................................... 23 Fig. 6-6. AIR sensor performance in "DIPOLE" .......................................................................... 24
Fig. 6-13. Determination of τ63 and τ90. Original humidity readings. ....................................... 28 Fig. 8-1. AIR arrangement in micro-chamber ............................................................................. 36 Fig. 8-2. RSA(RSH) and RS9 arrangement in micro-chamber................................................... 36 Fig. 8-3. VIZ arrangement in micro-chamber.............................................................................. 37 Fig. 8-4. DVR arrangement in micro-chamber............................................................................ 37 Fig. 8-5. GBS arrangement in micro-chamber........................................................................... 38 Fig. 8-7. Example of one RSA sensor difference against "TOROS" at the Test stage. ............. 39 Fig. 8-8. Example of one RSH sensor difference against "TOROS" at the Test stage. ............. 39 Fig. 8-9. Example of one RS9 sensor difference against "TOROS" at the Test stage............... 40 Fig. 8-10. Example of one VIZ sensor difference against "TOROS" at the Test stage. ............. 40 Fig. 8-11. Example of one DVR sensor difference against "TOROS" at the Test stage. ........... 41 Fig. 8-12. Example of one GBS sensor difference against "TOROS" at the Test stage. ........... 41 Fig. 8-21. An example of response time examination. ............................................................... 46 Fig. 8-22. An example of response time examination. ............................................................... 46 Fig. 8-23. An example of response time examination. ............................................................... 47 Fig. 8-24. An example of response time examination. ............................................................... 47 Fig. 8-25. An example of response time examination. ............................................................... 48 Fig. 8-26. An example of response time examination. ............................................................... 48 Fig. 8-27. An example of response time examination. ............................................................... 49 Fig. 8-29. An example of response time examination. ............................................................... 50 Fig. 8-31. An example of response time examination. ............................................................... 51 Fig. 8-32. An example of response time examination. ............................................................... 51 Fig. 8-33. An example of response time examination. ............................................................... 52

PHASE I - LABORATORY TEST
1. Summary - Phase I Phase I Laboratory Test of WMO Radiosonde Humidity Sensor Intercomparison was
held under initiative of the Russian Federal Service for Hydrometeorology and Natural Environment in the Central Aerological Observatory, Dolgoprudny, Russia, from June 1995 till June 1997. 8 types of radiosonde humidity sensors from the leading world manufacturers of radiosondes were presented for intercomparison (see Table 4-1).
The present report contains descriptions of reference instruments and facilities,
procedures of measurements, data acquisition, processing and analysis. Generalized results of laboratory experiments are presented for each sensor design.
2. Introduction Radiosonde relative humidity measurements are now of great interest for the
international meteorological society from their importance for environmental investigations. Beside the growing needs for accurate humidity measurement for numerical weather forecasting (CBS requirements for numerical weather prediction states better than 5% RH rms error; moreover some Members now seek accuracy as high as 2 % for relative humidity above 50% RH to avoid a negative impact of radiosonde observations on rainfall forecasts), climate and radiation studies claim insufficiency of humidity measurements throughout the troposphere, especially in tropical regions.
Results of different radiosounding systems performance evaluation and international
radiosonde comparisons reveal that differences in the performance of radiosonde humidity sensors introduce principal contribution into radiosonde humidity measurements uncertainty. Though leading radiosonde manufacturers devote great attention to investigation of their performance some characteristics important for upper-air sounding still remain insufficiently investigated (e.g. temperature influence and variation of response time under working conditions of radiosounding).
It is necessary to note the severe conditions of radiosonde humidity sensors
operation. They are situated in direct contact with ambient air and therefore should operate under temperatures down to -90°C. At that temperature the number of water molecules in air decreases by five orders of magnitude and, hence, the speed of water transfer between sensor surface and water vapour in ambient air decreases as much. Sensors may also be exposed to direct solar radiation and atmospheric precipitation. During passing of radiosonde through droplet clouds, water (or frost - under simultaneous temperature fall below 0°C) layer could appear on sensor surface distorting sensor readings after exit from clouds layer. These problems are solved in different ways by manufacturers and therefore the significant systematic biases (often from 5-10 % relative humidity) were found between measurements by modern relative humidity sensors in recent international radiosonde comparisons.
Problems also persist in definition and presentation of humidity measurements in
radiosonde reports. Current WMO regulations define relative humidity below 0°C according to saturation above a water surface, while legal approximation of water vapour pressure ranges only to -50°C. Restriction of dew point coding in TEMP messages implies the resolution of 1°C in reporting dew point depression more than 5°C and does not allow reporting dew point depression more than 50°C.
One of the most difficult problems of radiosonde humidity sensors investigation is
absence of miniature and precise reference able to produce true humidity values directly at balloon or aerostat ascent. From other side it is practically impossible to reproduce

PHASE I - Lab Test. WMO Radiosonde Humidity Sensor Intercomparison, June 1995-June 1997
PHASE I - page 2
completely in laboratory conditions all factors, influencing upon humidity sensor during ascent.
In recent years in Russia methods and equipment were developed allowing good
simulation of the operating conditions of radiosonde humidity sensors. It was possible to not only determine their basic errors, but to determine also their dynamic characteristics as well as the influence functions of different atmospheric factors on humidity measurements. The main technical characteristics of the reference equipment are listed in Section 3.
The Laboratory Test, Phase I of the WMO Radiosonde Relative Humidity
Comparison, consisted of preparatory and operational stages followed by a period for analysis of results. The objectives of Laboratory Test were:
- To specify the metrological characteristics of humidity sensors of various
radiosonde types under laboratory conditions; - To evaluate the compatibility of humidity measurements of the tested
systems in the temperature range from 20 to -60°C under laboratory conditions.
During the preparatory period (January 1994 - June 1995) the Programme and
methods of comparison were prepared and confirmed. The International Organizing Committee held its first session from 31 January to 2 February (the IOC staff is cited in Appendix 8.3). After this, responses from the participants were received, and sensors and auxiliary measuring equipment were received at Dolgoprudny. During the operational stage (June 1995 - June 1997) preparation of the sensors, equipment and software and then - experimental investigations were fulfilled. Unfortunately, because of custom regulations and lack of funds for custom duties part of the equipment (Vaisala and Meteolabor) had to be shipped back to Participants in the middle of June 1996. During August - October 1996 an analysis of quality of test data was performed and the original measurement results for each sensor designs with reference values were sent to the relevant Participant. After Vaisala equipment was received back, additional tests were performed until the middle of June 1997, when the final analyses and preparation of the report were performed.
3. Reference instruments and facilities Unfortunately, financial limitations did not allow CAO to utilize during comparison all
available equipment, in particular working standard of relative humidity ("STANDARD"). Nevertheless, the references used have allowed useful evaluation of the performance of the participating sensors. Following is a brief description of reference instruments and facilities used (see also Table 3-1).
3.1. Universal generator of moist air "DIPOLE" The principle of operation of "DIPOLE" is composite method of two temperatures and
two pressures:
U e Te T
PP
w i s
w w
w
s
= ⋅ ⋅/ ( )( )
100%
Where: Ts, Tw - temperatures in saturation and working chamber respectively; Ps, Pw - pressures in saturation and working chamber respectively; EW/I - saturated water vapour pressure with respect to water or ice surface
respectively.
Installation includes two independent saturation chambers. After preparation block, that includes compressor, dryer, wetter and mixing chamber with thermocryostat, air flow

PHASE I - Lab Test. WMO Radiosonde Humidity Sensor Intercomparison, June 1995-June 1997
PHASE I - page 3
goes to one or another saturation chamber, which reaches saturation at different temperatures and pressures. Then air flow passes through throttling valve into working chamber (interior diameter 200 mm and depth 400 mm), where temperature and pressure are changed and then enters into the laboratory interior or is exhausted by vacuum pump depending on specified regime.
In the working chamber with usable space of 10 liters special micro-chamber with
usable space about 25 cm3 could be installed which is used in investigation of dynamic characteristics of humidity sensors. During an experiment, air flow from one of the saturation chamber goes into working volume of micro-chamber with 5 m/s speed, while air flow with different relative humidity from another saturation chamber goes into working chamber bypassing micro-chamber. Special electromagnetic valves inside the working chamber switch over air flows using the equipment controls. The transition time in the working volume of the micro-chamber does not exceed 0.2 s while air temperature and pressure do not vary.
Both saturation chambers as well as the working chamber have separate thermostats
that allow independent temperature control in every particular chamber I the range from -70 to 30°C. According to specification, pressure could be set from 1000 to 3500 hPa in the saturation chambers and from 10 to 1100 hPa (the latter is actually ambient pressure) in the working chamber. Temperature and pressure in the micro-chamber are the same as in the working chamber since the micro-chamber is installed inside the latter.
"DIPOLE" was certified by Gosstandart in 1983. Fig. 3-1 and Fig. 3-2 present principle of operation of "DIPOLE" for examination of
static and dynamic characteristics correspondingly.
1. Compressor 2. Dryer 3. Wetter 3a. Mixing chamber 4. Saturation chamber 5. Saturation chamber 6. Working chamber 7. Sensors and reference equipment 8. Vacuum pump
Fig. 3-1. "DIPOLE". Examination of static characteristics.
PHASE I - Lab Test. WMO Radiosonde Humidity Sensor Intercomparison, June 1995-June 1997
PHASE I - page 4
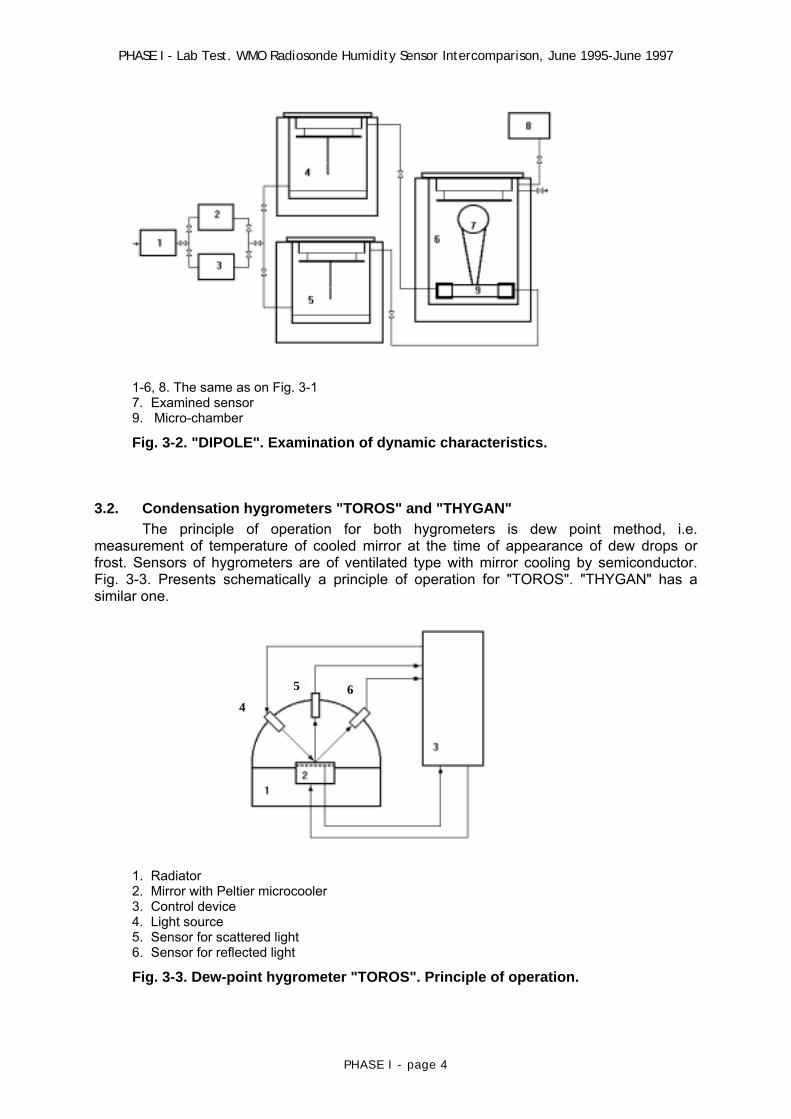
1-6, 8. The same as on Fig. 3-1 7. Examined sensor 9. Micro-chamber
Fig. 3-2. "DIPOLE". Examination of dynamic characteristics.
3.2. Condensation hygrometers "TOROS" and "THYGAN" The principle of operation for both hygrometers is dew point method, i.e.
measurement of temperature of cooled mirror at the time of appearance of dew drops or frost. Sensors of hygrometers are of ventilated type with mirror cooling by semiconductor. Fig. 3-3. Presents schematically a principle of operation for "TOROS". "THYGAN" has a similar one.
64
5
1. Radiator 2. Mirror with Peltier microcooler 3. Control device 4. Light source 5. Sensor for scattered light 6. Sensor for reflected light
Fig. 3-3. Dew-point hygrometer "TOROS". Principle of operation.

PHASE I - Lab Test. WMO Radiosonde Humidity Sensor Intercomparison, June 1995-June 1997
PHASE I - page 5
The Swiss reference hygrometer "THYGAN" was granted to CAO for period of comparison by Meteolabor. It was recommended by IOC as internationally recognized for intercalibration of comparison results and was used during experiments in "FEUTRON". For calculation of "THYGAN" humidity its thermometer was used.
290
357390
418 Fig. 3-4. Dew-point hygrometer "THYGAN".
Hygrometer "TOROS" has compact sensor with mirror and cooler of small size that
permit to utilize it during experiments in generator "DIPOLE". In addition it has a special feature enabling manual or automatic (after pre-defined intervals) frosting of mirror under negative dew-points. "TOROS" was certified by Gosstandart in 1984. Before an experiment a routine check of mirror temperature sensor of "TOROS" was made. It was examined at temperatures from -58 to 20°C and differences from reference thermometer were within 0.15°C that indicates the validity of TOROS� measurements during experiments
3.3. Climate chamber "FEUTRON" Climate chamber "FEUTRON" was utilized during Test stage (see section 5) of
comparison since it permits arrangement of large amount of sensor into its working volume (0.5 meter3). "FEUTRON" is a conventional industrial climate chamber. Humidity control is realized by passing of air flow through dryer or moistener. The temperature regulation error in the working chamber is about 0.2°C, and the one for humidity depends from specified regime and ranges from 2 to 5% RH.
To diminish the influence of humidity fluctuation on the readings of testing sensors
internal chamber was placed inside working volume of "FEUTRON". Humidity sensors as well as reference sensors were installed into interior chamber. By the signal of operator interior chamber was opened to provide air blow-through. The relative humidity was derived from readings of reference dew-point hygrometers and temperature inside chamber.
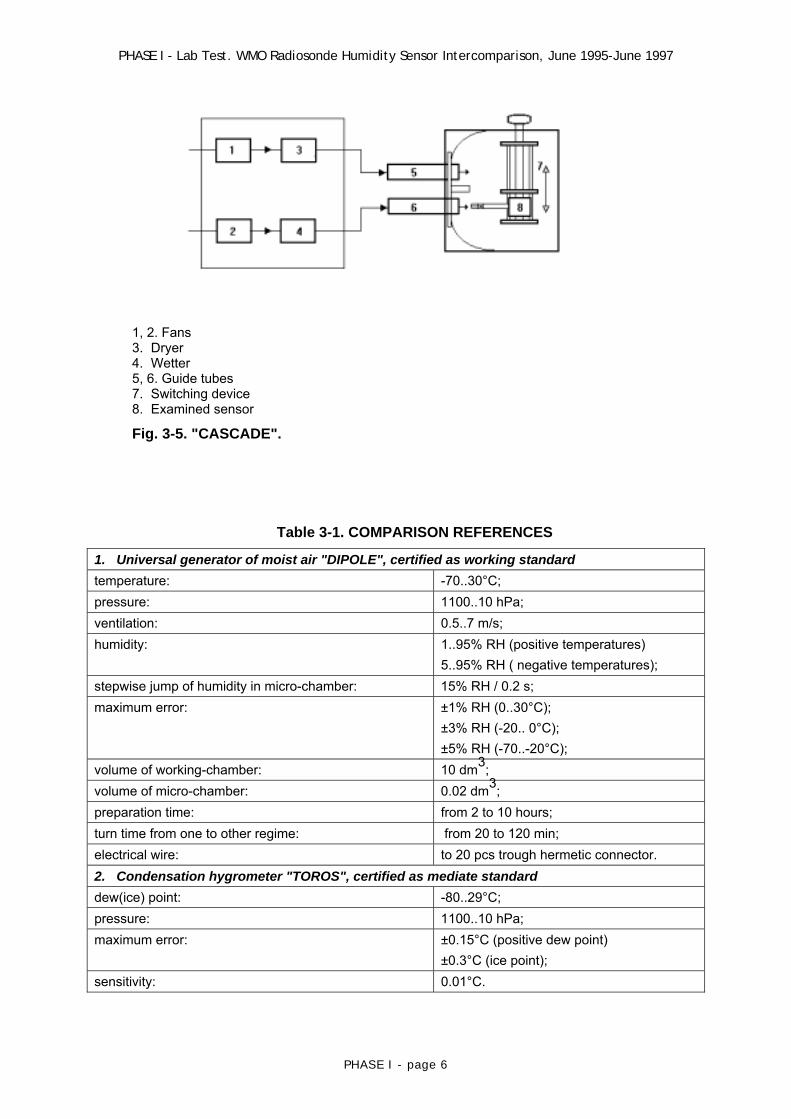
3.4. Dynamic test unit "CASCADE" The principle of operation of "CASCADE" is producing two air flows with different
relative humidity and performing step-wise jump of humidity by fast moving of sensor under investigation from one air flow to other and backwards.
Transient time does not exceed 1 s. Ventilation in "CASCADE" is about 5 m/s and
temperature is from 20 to 25°C. "CASCADE" was certified by metrological service of Roshydromet in 1984. Fig. 3-5 presents diagram of "CASCADE".
PHASE I - Lab Test. WMO Radiosonde Humidity Sensor Intercomparison, June 1995-June 1997
PHASE I - page 6
1, 2. Fans 3. Dryer 4. Wetter 5, 6. Guide tubes 7. Switching device 8. Examined sensor
Fig. 3-5. "CASCADE".
Table 3-1. COMPARISON REFERENCES
1. Universal generator of moist air "DIPOLE", certified as working standard temperature: -70..30°C; pressure: 1100..10 hPa; ventilation: 0.5..7 m/s; humidity: 1..95% RH (positive temperatures)
5..95% RH ( negative temperatures); stepwise jump of humidity in micro-chamber: 15% RH / 0.2 s; maximum error: ±1% RH (0..30°C);
±3% RH (-20.. 0°C); ±5% RH (-70..-20°C);
volume of working-chamber: 10 dm3; volume of micro-chamber: 0.02 dm3; preparation time: from 2 to 10 hours; turn time from one to other regime: from 20 to 120 min; electrical wire: to 20 pcs trough hermetic connector. 2. Condensation hygrometer "TOROS", certified as mediate standard dew(ice) point: -80..29°C; pressure: 1100..10 hPa; maximum error: ±0.15°C (positive dew point)
±0.3°C (ice point); sensitivity: 0.01°C.

PHASE I - Lab Test. WMO Radiosonde Humidity Sensor Intercomparison, June 1995-June 1997
PHASE I - page 7
3. Dynamic test unit "CASCADE" temperature: surroundings; ventilation: 0.5..7 m/s; humidity: 20...90% RH; systematic error: ±5% RH / 1s; stepwise jump of humidity: 15% RH / 1 s; volume of working-chamber: 1.0 dm3; preparation time: from 2 to 4 hours; turn time from one to other regime: from 20 to 60 min. 4. Condensation hygrometer "THYGAN" dew(ice) point: -65..50°C; maximum error: ±0.15°C (-20..50°C);
±0.25°C (-65..-20°C); resolution: 0.1 K. 5. Platinum thermometer "TSP", used in "FEUTRON" nominal resistance: 100 Ohms; maximum error: 0.02 K. 6. Reference platinum thermometer "TSPN-3", used in "DIPOLE" nominal resistance: 100 Ohms; maximum error: 0.001 K.
4. Sensors, participated in intercomparison As recommended by the IOC the priority for participation in the intercomparison was
given to sensors/radiosondes which are widespread in operational use. Only one submission of a prototype for each of the submitters was allowed. The precondition for participation in Phase II Field Test was the participation of the sensor concerned in Phase I. For those Members proposed the same radiosonde type, priority were given to the Member representing the manufacturer of the radiosonde.
According to the decision of the IOC the participants of intercomparison have
submitted in CAO following sensors (see also Fig. 4-1 and Table 4-1, where presented are brief specifications according to IOC questionnaires):
4.1. AIR Inc. AIR Inc. submitted 12 sensors, in the form of a laboratory version of the radiosonde,
i.e. sensor outrigger from radiosonde and radiosonde interior unit in laboratory design, in which were installed also sensors of temperature and pressure. Therefore despite small size of sensitive element dimensions of sensor boom with microprocessor unit were 20 x 90 x 265 mm. The output digital signal of a radiosonde was transformed to meteorological quantities (pressure, temperature, humidity by a special interface block, provided by the manufacturer), and transmitted through a serial interface to a computer. Calibration coefficients were firm wired in a microprocessor ROM and were transmitted into the interface unit during first 45 s after connection of sensor. Under an agreement with manufacturer valid humidity measurements were taken after 12 s since sensor connection. Sampling rate was from 1 to 3.5 s (the latter figure is valid for the first 45 s since connection of sensor). elapsed time, pressure and humidity were recorded rather than the actual sensor output data. The manufacturer provided a standard communication program for display and recording of data.

PHASE I - Lab Test. WMO Radiosonde Humidity Sensor Intercomparison, June 1995-June 1997
PHASE I - page 8
As only one interface board was available from AIR, a special switchboard was made allowing successive connection up to 10 sensors with registration time for one sensor not more than 15 sec. During a given measurement period, data of all the sensors involved were recorded into single file that demanded development of special software to separate readings for particular sensors.
4.2. Vaisala Oy Vaisala Oy has submitted 10 samples of each of three types of sensors (type
A-Humicap radiosonde RS80, type H-Humicap radiosonde RS80 and type H-Humicap radiosonde RS90). They have received the conditional designation RSX, where the symbol X varies, depending on sensor (A - A-Humicap RS80, H - H-Humicap RS80, 9 - H-Humicap RS90). The sensors were supplied as a part of a sensor unit of the respective radiosonde in which temperature and pressure sensors were installed as well. The three sensor types differed in the polymer used for the sensor and the dimensions of sensitive element. The RS90 has two sensitive elements on its sensor boom: so that in flight one element measures humidity while other one is heated to eliminate possible contamination in turns. Dimensions of sensor unit of RS80 are 30 x 50 x 150 mm and those of RS90 are 8 x 32 x 180 mm. The output frequency signal of sensor unit from special interface units provided by the manufacturer was transmitted into a computer. The computer provided by the manufacturer, processed the primary data, whilst recording the primary data (frequency) and the resultant physical parameters (elapsed time, pressure, temperature, humidity) computed by the manufacturers software.
Calibration coefficients were presented in separate files for each sensor unit and
were introduced into processing software. Equipment of Vaisala allowed connection up to 4 sensor units in arbitrary combination of different sensor type with recording of measurements of each sensor in separate file. The frequency of consecutive interrogation was 1 s, i.e. depends of amount of connected sensor sampling rate for particular sensor varied from 1 to 4 s.
For time response investigation separate software and equipment, based on IEEE board, were provided which allowed humidity sensor readings to be sampled every 0.07 s. After completing tests in�CASCADE� with IEEE board the board failed. Thereby in agreement and under assistance of Vaisala auxiliary software was developed for processing of primary results of time response tests.
The usual base-line correction procedures for Vaisala radiosondes were not
performed.
4.3. VIZ Manufacturing Company VIZ Manufacturing Company supplied 50 sensors. The sensors were provided
without calibration coefficients, so the procedure for measurements required initial calibration of each sensor in a range of humidity 25-40% RH at room temperature. The sensors were placed in special mounting with three samples each of humidity and temperature sensors. Overall dimensions of the whole unit were 200 x 110 x 120 mm. Two set of interface units, were also provided, converting temperature and humidity sensors' resistance into digital code, entered in computer through serial interface. The program code on QuickBasic was supplied, enabling recording of primary data (digital code) from interface unit, processing and calibration and recording of sensors' resistance and also recording physical parameters (elapsed time, temperature, humidity). Sampling rate is about 1 s.
To facilitate registration and data base organization and due to that the same
computer was used for receiving from serial interface both VIZ and GBS primary data, the code supplied was modified for off-line data processing and proper file-naming for data recording. Owing to limited volume of working chamber only one VIZ humidity sensor could

PHASE I - Lab Test. WMO Radiosonde Humidity Sensor Intercomparison, June 1995-June 1997
PHASE I - page 9
be placed in "DIPOLE", therefore special modification of data processing software was developed, allowing temperature compensation from reference thermometer. For investigation of time response the smoothing module was eliminated from software.
4.4. Russia CAO has presented 10 samples of sensors of two types. The first type (designated as
GBS gold-beater skin as used by the operational radiosonde MRZ-3A and MARZ. The second type designated as DVR capacitive �as used by the experimental radiosondes MRZ-6 and MRZ-3AM. Dimensions of GBS are 65 x 65 x 50 mm (during response time examination sensors were placed into "DIPOLE" without anti-droplet protection), interface board allowed connection up to 6 sensors. Resistance of GBS sensors was transformed by an interface into digital code, introduced in computer. The software, enabling to make processing primary data (digital code) and registration each 1 s resistance of sensors and humidity data were presented.
The sensors DVR were presented as a part of radiosonde humidity sensor block,
including capacitance-to-frequency converter (in flight design converter is placed into radiosonde case). Overall dimensions of DVR sensor including converter are 20 x 50 x 80 mm. The output signal of sensor block by multiplexer and specialized controller was transmitted into computer. Up to 7 sensors could be connected to multiplexer with commutation cycle about 20 s regardless of number of sensors. Presented software made processing of primary data with registration elapsed time, primary data (frequency) and humidity. For time response tests a single sensor was connected to controller without multiplexer that allowed registration of sensor readings with 0.2 s sampling via separate software.
4.5. Ukraine The representative of Ukraine - "Mateo" Co. has presented 5 pieces of experimental
sensors of humidity, including sensitive element and primary converter, output signal of which (the frequency) through a switch is measured by a frequency-meter without computer-based registration.
The host team performed a large amount of work on connection, commutation and
matching of sensors, interface blocks and software, provided by the participants of the Intercomparison, laboratory installations, recording data, adapting the equipment supplied for the test chambers and the provision of software for processing large amounts of measurements. Vaisala Oy provided a complete set of equipment and software, as well as experts sent to test site at the initial stage of intercomparison for installation of equipment and host staff training.

PHASE I - Lab Test. WMO Radiosonde Humidity Sensor Intercomparison, June 1995-June 1997
PHASE I - page 10
Fig. 4-1. Sensors, participated in intercomparison:
1 - AIR 2 - RSA 3 - RS9 4 - VIZ 5 - DVR 6 - GBS

PHAS
E I -
Lab
Tes
t. W
MO
Rad
ioso
nde
Hum
idit
y Se
nsor
Inte
rcom
pari
son,
Jun
e 19
95-J
une
1997
PHASE I
- p
age
11
Tabl
e 4-
1. S
enso
rs, p
artic
ipat
ed in
inte
rcom
paris
on.
Man
ufac
ture
r A
IR In
c.
Vai
sala
Oy
Vai
sala
Oy
Vai
sala
Oy
VIZ
Mfg
Co.
Zo
nd C
o.
Met
eo C
o.
AM
ETO
Co.
US
A
Finl
and
Finl
and
Finl
and
US
A
Rus
sia
Rus
sia
Ukr
aine
(AIR
) (R
SA
) (R
SH
) (R
S9)
(V
IZ)
(DV
R)
(GB
S)
(UK
R)
Type
/mod
el
thin
-film
th
in-fi
lm
thin
-film
th
in-fi
lm
carb
on fi
lm
thin
-film
go
ld-
cera
mic
poly
mer
po
lym
er
poly
mer
po
lym
er
(hyg
risto
r)
poly
mer
be
ater
ca
paci
tor
ca
paci
tor
capa
cito
r ca
paci
tor
capa
cito
r
capa
cito
r sk
in
/DV
-01
A-H
umic
ap
H-H
umic
ap
H-H
umic
ap
/A
PV
R
adio
sond
e IS
-5A
R
S80
R
S80
R
S90
M
AR
K-II
M
RZ-
6 M
RZ-
3AM
M
RZ-
3A
MA
RZ-
2 M
ETE
OR
-1
Ran
ge,%
RH
-
0..1
00
0..1
00
0..1
00
5..1
00
0..1
00
15..1
00
-
°C
-40.
.50
-60.
.90
-60.
.90
-60.
.40
-40.
.40
-60.
.50
-40.
.50
-70.
.60
Acc
urac
y,%
RH
3
Rep
rodu
ci-
bilit
y <3
R
epea
tabi
lity
of c
alib
ratio
n*)
2
Rep
rodu
ci-
bilit
y <3
R
epea
tabi
lity
of c
alib
ratio
n*)
2
Rep
rodu
ci-
bilit
y <2
R
epea
tabi
lity
of c
alib
ratio
n*)
2
±2
±5
±10
±4
Am
ount
12
10
10
10
50
10
10
5
Oth
er s
enso
rs
P/T
P
/T
P/T
P
/T
T -
- -
Nec
essi
ty o
f -
- -
- +
- -
+ ca
libra
tion
Out
put/
inte
rface
R
S23
2 R
S23
2 R
S23
2 R
S23
2 R
S23
2 In
terfa
ce
RS
232
frequ
ency
(IE
EE
) (IE
EE
) (IE
EE
)
card
R
esol
utio
n,%
RH
0.
01
0.0.
..1
0.0.
..1
0. 0
...1
0.1
0.1
0.1
* S
ampl
ing
rate
, s
1 1-
4 1-
4 1-
4 1
20
1 *
(0.0
7)
(0.0
7)
(0.0
7)
(0
.2)
* - s
tand
ard
devi
atio
n of
diff
eren
ces
betw
een
succ
essi
ve c
alib
ratio
ns

PHASE I - Lab Test. WMO Radiosonde Humidity Sensor Intercomparison, June 1995-June 1997
PHASE I - page 12
5. Carrying out experiment Terminology used below is explained in Appendix 8.5 The Test stage of the
laboratory intercomparison included checking at normal conditions the differences between the actual metrological characteristics of sensors and the design specifications given in the technical documentation for these sensors.
The Research stage included the determination of difference of sensors
measurements against reference at temperatures down to -60°C as well as time response examination at temperatures down to -20°C. The amount of experiments was limited by difficulties of arranging the sensors in "DIPOLE" and also the duration of tests.
5.1. Test stage During test stage following experiments was carried out:
5.1.1. Examination of static characteristics Checking of Bo at "FEUTRON" against "TOROS" and "THYGAN" was each Pass the
number of Samples in �FEUTRON� is listed in Table 5-2. performed at humidity U = (10, 20, 30, 40, 50, 60, 70, 80, 90, 95% RH) ±3% RH under temperature 20°C ± 2°C. The approach to each Point was made from previous one without over control, i.e. it was not allowed returning to specified humidity at passage through it (considering tolerance limits). At least 3 Samples were taken in each Point. Total time of recording all the sensors readings at single Sample was in average 6 min and did not exceed 12 min. For
According to possibilities of participants and CAO equipment, as well as limitations,
determined by time of stable maintenance of Sample, the maximum possible amount of sensors in one Batch for tests in installation "FEUTRON" was following: AIR - 10, RSX - 4, VIZ - 3, DVR - 7, GBS - 6, UKR - 5.
Totally 5 Passes were realized on installation "FEUTRON". Four of them were
complete (included all Points under the Programme of Intercomparison). One of Passes was shortened (10, 30, 60, 90, 95, 90, 60, 30, 10% RH) - Pass 2. At its realization measurements were conducted only for RSX, VIZ and DVR.
Totally in Passes 1-5 participated:
AIR - 12; RSA - 4; RSH - 4; RS9 - 8 (two sensors per sensor unit); VIZ - 15; DVR - 10; GBS - 10; UKR - 5.
During the Test stage, problems came to light concerning the sensors VIZ and UKR: VIZ: At realization of the first Pass (the general time of complete Pass takes from 10
till 16 hours net time during 2-3 days) the VIZ sensors observing at low relative humidity showed large negative bias. In order to estimate the influence of test conditions upon the indications of VIZ sensors, a short Pass 2 was performed. The time of to complete Pass 2 was made less than 4 hours and duration of sensors� exposure at high humidity did not exceed 30 minutes. In this case the large negative biases at low humidity were not found.

PHASE I - Lab Test. WMO Radiosonde Humidity Sensor Intercomparison, June 1995-June 1997
PHASE I - page 13
Later Passes confirmed the instability of the VIZ sensor calibration at low humidity if the VIZ sensors were exposed to prolonged high humidity.
UKR: From five submitted sensors only one worked. The sensors were submitted
without calibration characteristics and engineering specifications, therefore for calibration the data of first Pass were taken. In other Passes shift of readings relative to calibration characteristic was found out. There were also unacceptable hysteresis values. Actually concerning the UKR sensors the objectives, stood in Programme of Intercomparison could not be realized. Taking into account also limitations to amount of tested sensors UKR did not participate in the Research stage. The IOC agreed on the decision of the PL to stop testing the humidity sensor submitted by Ukraine after having available the results of the first initial testing.
Table 5-1. The number of Samples for given humidity category in static characteristics examination at the Test stage
Points (humidity category,% RH)
Pass 10 20 30 40 50 60 70 80 90 95 All humidities
1 6/3 6/3 6/3 3/3 3/3 3/3 3/3 3/3 3/3 3 662 1/1 0/0 1/1 0/0 0/0 2/1 0/0 0/0 1/1 1 103 3/4 6/1 5/4 3/1 3/1 3/1 3/1 3/1 3/3 3 524 3/3 3/3 3/3 3/3 3/3 3/3 3/3 3/3 2/7 3 605 3/6 3/3 3/3 3/3 3/3 3/0 0/3 3/3 3/3 3 54All Passes 16/17 18/10 18/14 12/10 12/10 14/8 9/10 12/10 12/17 13 242
Comment to Table 5-1: � nominator - number of Samples for given Point at wetting; � denominator - number of Samples for given Point at drying.
5.1.2. Examination of time response All types of sensors have been tested also in installation "CASCADE" under normal
conditions. Data were recorded by original programs, granted by participants of comparisons with enough discretion for the further calculation of sensors dynamic characteristics.
For tests, three sensors of each type were taken. The value of humidity jump was
chosen accordingly to operating conditions of installation "CASCADE" and it was on average 20-30 % in the range from 40 to 85 % of RH. Recordings of data were conducted for every sensor six times - three times for humidity reducing and three times for humidity increasing.
5.2. Research stage The measurements of temperature dependence have been conducted in the
installation "DIPOLE" using the reference hygrometer "TOROS". Also the dynamic characteristics of all the various types of sensors, except RS9, were also tested in the installation "DIPOLE".
5.2.1. The investigation of static characteristics Two different Batches were examined in installation "DIPOLE". It was only possible to
place not more than one or two sensor of each type in the working chamber of "DIPOLE�,

PHASE I - Lab Test. WMO Radiosonde Humidity Sensor Intercomparison, June 1995-June 1997
PHASE I - page 14
because of the large dimensions of the sensor transducer devices received from participants, Therefore the first Batch included sensors AIR#11, RSH#1, RS9#10, VIZ#20, DVR#1 and GBS#7, the second batch included sensors RSA#1 and #3, RS9#6, VIZ#22 and GBS#1. Thus, one each of AIR, RSH and DVR sensors and two each of RSA, VIZ and GBS sensors were investigate din this phase.
As planned in the Programme four Passes at +20, -10, -40 and -60°C were realized in
installation "DIPOLE" for both Batches: - Passes 8 - 11 for the first Batch; - Passes 12 - 13 and 15 - 16 for the second one.
Results from Passes 7, 8, 14 and 15 were not included into final data base due to
different problems with maintaining appropriate regimes in "DIPOLE" and recording the data.
Table 5-2. The number of Samples for given humidity and temperature categories in static characteristics examination at the Research stage
Points (humidity category,% RH)
Pass 10 20 30 40 50 60 70 80 90 All humidities
8 3/3 3/3 3/3 3/3 3/3 3/3 3/3 0/3 3 48 9 3/3 3/3 3/3 3/3 6/3 3/3 3 0 0 42 10 0 3/3 6/0 3/0 3/1 3 0 0 0 22 11 0/3 0 3/3 3 0 0 0 0 0 12 12 3/3 3/3 3/3 3/3 3/3 3/3 1/3 5/3 3 51 13 3/3 3/3 3/3 3/3 3/3 3/3 3/3 4/0 0 46 16 3/3 3/3 3/3 3/3 3 0 0 0 0 27 17 3/3 3/3 3/3 3 0 0 0 0 0 21
T, °C Totally for given temperatures 20 6/6 6/6 6/6 6/6 6/6 6/6 4/6 5/6 6 99 -10 6/6 6/6 6/6 6/6 9/6 6/6 6/3 4/0 0 88 -40 3/3 6/6 9/3 6/3 6/1 3 0 0 0 49 -60 3/6 3/3 6/6 6/0 0 0 0 0 0 33
Total amount of Samples : 269
At Pass 10 the reference thermometer in the working chamber failed. Therefore
humidity at Passes 10 and 11 could only be derived from "TOROS" dew-point. For calculations of relative humidity RS80 temperature was chosen as the temperature in best agreement with the reference thermometer in Passes 8-9. For each Pass and for each temperature the number of Samples in "DIPOLE� are listed in Table 5-2.
5.2.2. The investigation of dynamic characteristics Due to the restricted volume of the micro-chamber only one sensor could be
examined at once. Experiments were carried out at 20°C and - 20°C for each sensor individually. Therefore the amount of sensors examined in "DIPOLE" was determined mainly by duration of experiment and the dynamic characteristics of only one sensor of each type of sensors was tested in installation "DIPOLE".
The RS9 sensor was not examined at -20°C due to the failure of the Vaisala electronic switchboard. Fig. 8-1 - Fig. 8-5 present arrangement of different sensors in "DIPOLE" micro-chamber.

PHASE I - Lab Test. WMO Radiosonde Humidity Sensor Intercomparison, June 1995-June 1997
PHASE I - page 15
6. Experimental results
6.1. Data base Data bases for measurements of each sensor type were organized as dBase III files
(compatible with majority of spreadsheets, word processors and presentation programs), containing in each record a single measurement result of particular sensor - a serial number of particular experiment (Sample), sensor identifier and 3 subsequent readings of a sensor, according to condition of taking reference measurements:
- Passes 1-5 in "FEUTRON" - the last three readings from sensor/sensors data file
at Sample; - Passes 8-13, 16-17 in "DIPOLE" - the first three readings from sensor/sensors
data file at Sample, - and a special field, enabling flagging of a measurement. The average of 3 sensor's
readings was used as a single measurement for comparison. Special software was developed for importing data into dBase III format, which permitted quality control. Only a few measurements were flagged or completely lost due to problems with data acquisition systems or occasional operator errors.
For determination of dynamic characteristics original data files have been used. Data base of reference measurements contains both primary measurements ("TSP"
temperature, "TOROS" dew-point, "THYGAN" temperature and dew-point at the Test stage, temperatures and pressures in working and saturation chambers of "DIPOLE" and "TOROS" dew-point at Research stage) and derived reference humidity values. For humidity calculations Goff-Gratch equations from the WMO Technical Regulations have been used. The presence of alternative reference at each stage enabled effective control of manual data input.
Original readings of sensors as provided by software of Participants were archived
and distributed to each Participant together with data base of corresponding sensor and reference data base.
Table 6-1 gives an idea on amount of data, received in static characteristics
examination at the Test stage. More detailed information about amount of data for particular sensor could be found in Table 8-1.
The data availability in static characteristics examination at the Research stage
apparently is not so complicated and is clear from Table 5-2. Table 6-2 indicates amount of experiments on dynamic characteristics examination at
both Test and Research.

PHAS
E I -
Lab
Tes
t. W
MO
Rad
ioso
nde
Hum
idit
y Se
nsor
Inte
rcom
pari
son,
Jun
e 19
95-J
une
1997
PHASE I
- p
age
16
Tabl
e 6-
1. T
otal
dat
a ba
se, r
ecei
ved
in s
tatic
cha
ract
eris
tics
exam
inat
ion
at th
e Te
st s
tage
Hum
idity
cat
egor
y ,%
RH
Pas
sAm
ount
of
sens
ors
10
2030
4050
60
7080
9095
All
hum
iditi
es
AIR
1
1049
/30/
79
60/3
0/90
60/3
0/90
30/3
0/60
30/3
0/60
30
/30/
6030
/30/
6030
/30/
6030
/30/
6030
649
35
15/2
0/35
30
/5/3
525
/20/
4515
/5/2
015
/5/2
0 15
/5/2
015
/5/2
015
/5/2
015
/15/
3015
260
43
9/9
/18
9/9
/18
9/9
/18
9/9
/18
9/9
/18
9/9
/18
9/9
/18
9/9
/18
6/2
1/27
918
0 5
3 9
/18/
27
9/9
/18
9/9
/18
9/9
/18
9/9
/18
9/0
/9 0
/9/9
9/9
/18
9/9
/18
916
2 Al
l P
asse
s12
82/7
7/15
9 10
8/53
/161
103/
68/1
7163
/53/
116
63/5
3/11
6 63
/44/
107
54/5
3/10
763
/53/
116
60/7
5/13
563
1251
RSA
1
424
/12/
36
24/1
2/36
24/1
2/36
12/1
2/24
12/1
2/24
12
/12/
2412
/12/
2412
/12/
2412
/12/
2412
264
24
4/4
/8
0/0
/0 4
/4/8
0/0
/0 0
/0/0
6
/4/1
0 0
/0/0
0/0
/0 4
/4/8
4 3
8 Al
l P
asse
s4
28/1
6/44
24
/12/
3628
/16/
4412
/12/
2412
/12/
24
18/1
6/34
12/1
2/24
12/1
2/24
16/1
6/32
16 3
02
RSH
3
412
/16/
28
24/4
/28
20/1
6/36
12/4
/16
12/4
/16
12/4
/16
12/4
/16
12/4
/16
12/1
2/24
1220
8 R
S9
48
24/2
4/48
24
/24/
4824
/24/
4824
/24/
4824
/24/
48
24/2
4/48
24/2
4/48
24/2
4/48
16/5
6/72
2448
0 5
824
/48/
72
24/2
4/48
24/2
4/48
24/2
4/48
24/2
4/48
24
/0/2
4 0
/24/
2424
/24/
4824
/24/
4824
432
All
Pas
ses
1651
/78/
129
51/5
1/10
251
/51/
102
51/5
1/10
251
/51/
102
51/2
4/75
24/5
1/75
51/5
1/10
243
/83/
126
51 9
12

PHAS
E I -
Lab
Tes
t. W
MO
Rad
ioso
nde
Hum
idit
y Se
nsor
Inte
rcom
pari
son,
Jun
e 19
95-J
une
1997
PHASE I
- p
age
17
VI
Z 1
318
/9/2
7 18
/9/2
718
/9/2
7 9
/9/1
8 9
/9/1
8 9
/9/1
8 9
/9/1
8 9
/9/1
8 9
/9/1
8 9
198
23
3/3
/6
0/0
/0 3
/3/6
0/0
/0 0
/0/0
6
/3/9
0/0
/0 0
/0/0
3/3
/6 3
30
33
9/1
2/21
18
/3/2
115
/12/
27 9
/3/1
2 9
/3/1
2 9
/3/1
2 9
/3/1
2 9
/3/1
2 9
/9/1
8 9
156
43
9/9
/18
9/9
/18
9/9
/18
9/9
/18
9/9
/18
9/9
/18
9/9
/18
9/9
/18
6/2
1/27
617
7 5
3 9
/18/
27
9/9
/18
9/9
/18
9/9
/18
9/9
/18
9/0
/9 0
/9/9
9/9
/18
9/9
/18
916
2 Al
l P
asse
s15
48/5
1/99
54
/30/
8454
/42/
9636
/30/
6636
/30/
66
42/2
4/66
27/3
0/57
36/3
0/66
36/5
1/87
36 7
23
DVR
1
742
/21/
63
42/2
1/63
42/2
1/63
14/2
1/35
21/2
1/42
21
/21/
4221
/21/
4221
/21/
4221
/21/
4221
455
27
7/7
/14
0/0
/0 0
/7/7
0/0
/0 0
/0/0
14
/7/2
1 0
/0/0
0/0
/0 7
/7/1
4 7
63
37
21/7
/28
21/7
/28
35/2
8/63
21/7
/28
21/7
/28
21/7
/28
21/7
/28
21/7
/28
21/2
1/42
2132
2 4
721
/21/
42
21/1
4/35
21/2
1/42
21/2
1/42
21/2
1/42
21
/21/
4221
/21/
4221
/21/
4214
/49/
6321
413
57
21/4
2/63
21
/21/
4221
/21/
4221
/21/
4221
/21/
42
21/0
/21
0/2
1/21
21/2
1/42
21/2
1/42
2137
8 Al
l P
asse
s14
121/
108/
229
114/
69/1
8313
0/10
8/23
886
/77/
163
93/7
7/17
0 10
7/60
/167
69/7
7/14
693
/77/
170
92/1
32/2
2410
016
31
GB
S 1
636
/18/
54
30/1
8/48
36/1
8/54
18/1
8/36
18/1
8/36
18
/12/
3018
/18/
3618
/18/
3618
/18/
3617
383
34
12/1
6/28
24
/4/2
820
/16/
3612
/4/1
612
/4/1
6 12
/4/1
612
/4/1
612
/4/1
612
/12/
2412
208
46
18/1
8/36
18
/12/
3018
/18/
3618
/18/
3618
/18/
36
18/1
8/36
18/1
8/36
18/1
8/36
12/4
2/54
1835
4 Al
l P
asse
s10
66/5
2/11
8 72
/34/
106
74/5
2/12
648
/40/
8848
/40/
88
48/3
4/82
48/4
0/88
48/4
0/88
42/7
2/11
447
945
C
omm
ent:
at c
ells
are
pre
sent
ed if
app
ropr
iate
div
ided
by
slas
hes
�
num
ber o
f Sam
ples
for g
iven
Poi
nt a
t wet
ting;
�
num
ber o
f Sam
ples
for g
iven
Poi
nt a
t dry
ing;
�
tot
al n
umbe
r of S
ampl
es fo
r giv
en P
oint
.
PHASE I - Lab Test. WMO Radiosonde Humidity Sensor Intercomparison, June 1995-June 1997
PHASE I - page 18
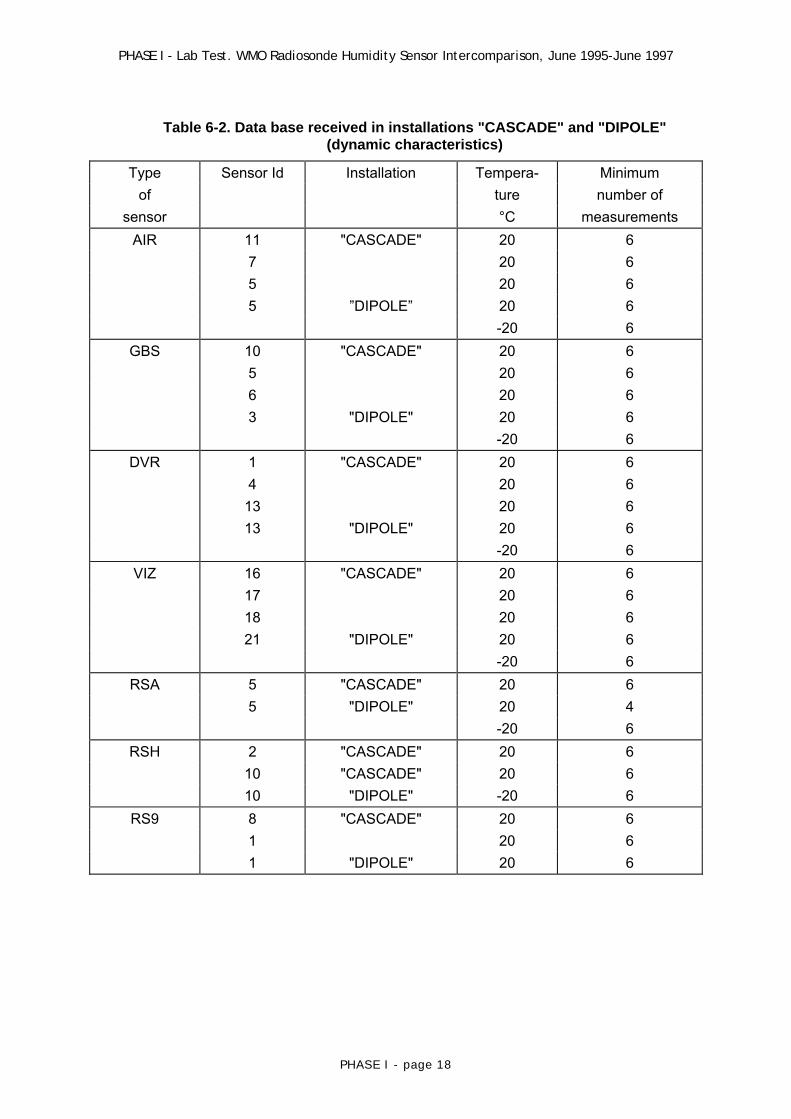
Table 6-2. Data base received in installations "CASCADE" and "DIPOLE" (dynamic characteristics)
Type Sensor Id Installation Tempera- Minimum of ture number of
sensor °C measurements AIR 11 "CASCADE" 20 6
7 20 6 5 20 6 5 �DIPOLE� 20 6 -20 6
GBS 10 "CASCADE" 20 6 5 20 6 6 20 6 3 "DIPOLE" 20 6 -20 6
DVR 1 "CASCADE" 20 6 4 20 6 13 20 6 13 "DIPOLE" 20 6 -20 6
VIZ 16 "CASCADE" 20 6 17 20 6 18 20 6 21 "DIPOLE" 20 6 -20 6
RSA 5 "CASCADE" 20 6 5 "DIPOLE" 20 4 -20 6
RSH 2 "CASCADE" 20 6 10 "CASCADE" 20 6 10 "DIPOLE" -20 6
RS9 8 "CASCADE" 20 6 1 20 6 1 "DIPOLE" 20 6

PHASE I - Lab Test. WMO Radiosonde Humidity Sensor Intercomparison, June 1995-June 1997
PHASE I - page 19
6.2. Static characteristics At the first Pass the reference thermometer was not available. From the analysis of
results from Passes 2-5 it was realized that the most reliable measurements of temperature in "FEUTRON" were given by the 4-th AIR temperature sensor. Therefore for calculation of relative humidity in the first Pass its temperature readings were taken.
20 40 60 80 100Humidity, %RH
-2
0
2
4
6
U"T
OR
OS"
-U"T
HYG
AN" ,%
RH
-2.0
0.0
2.0
DP "T
OR
OS"
-DP "T
HYG
AN",
C
Dew point differences
Humidity differences
Fig. 6-1. Differences between "TOROS" and "THYGAN" readings
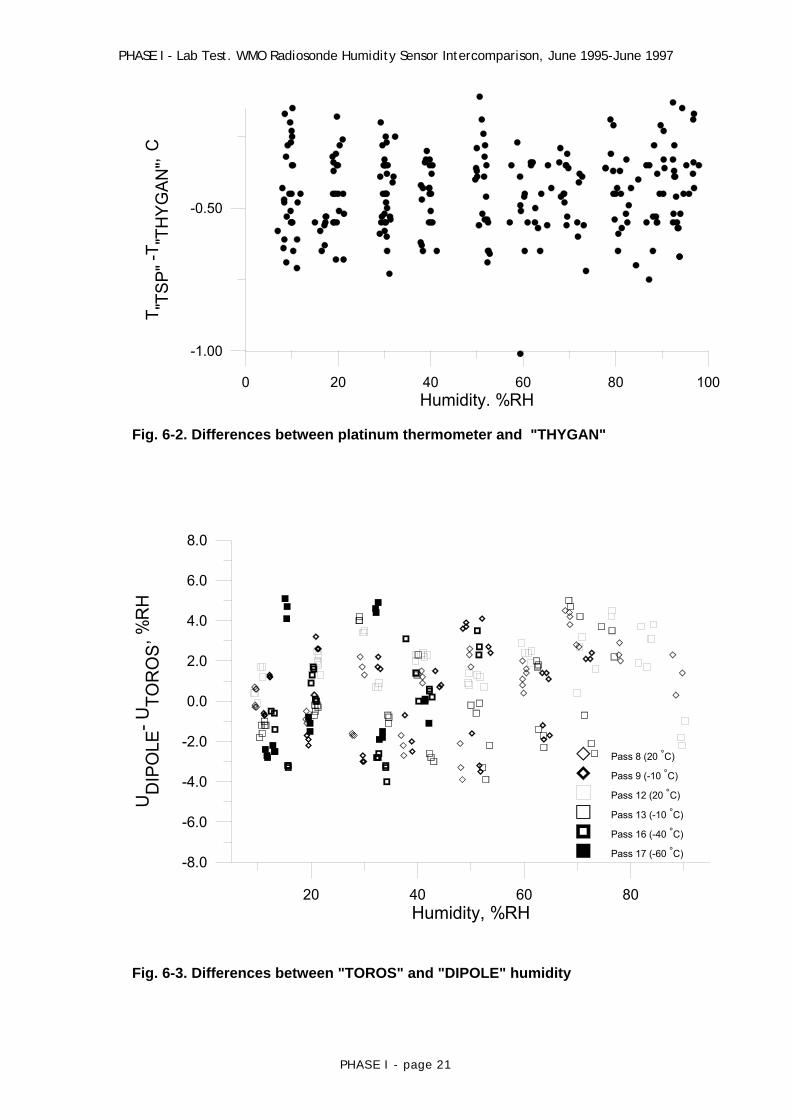
The principal question limiting interpretation of the test data is the compatibility of the reference measurements. The differences between readings of the two reference

PHASE I - Lab Test. WMO Radiosonde Humidity Sensor Intercomparison, June 1995-June 1997
PHASE I - page 20
hygrometers "TOROS" - "THYGAN� (measured in installation "FEUTRON" during Test stage) and between readings of hygrometer "TOROS" and generator "DIPOLE" (at Research stage) are in
Fig. 6-1 - Fig. 6-3. As one can see from these data the maximum difference "TOROS"-"THYGAN"
makes up near 0.25°C at high humidity, reaching about 1°C at dew points below -10°C, that could arise from presence of supercooled water on the surface of "THYGAN" mirror while "TOROS" design excludes such possibility. Again, "THYGAN" is actually field device rather than laboratory instrument, so it is possible that differences between "THYGAN" and "TSP" temperatures could arise owing to "THYGAN" heat dissipation. Nevertheless, humidity differences did not exceed more than 2% RH.
The maximum difference "TOROS" - "DIPOLE" did not exceed ±5% RH with no
significant bias. As "TOROS" was used throughout all the Passes it is expedient to accept its
measurements as reference for the comparison of static characteristics. Fig. 8-6 - Fig. 8-12 present the differences of one sensor sample against "TOROS"
humidity at the Test stage for each participating sensor design. Fig. 6-4 - Fig. 6-5 present for each humidity category, the mean differences and root-mean square deviations for each participated sensor design against "TOROS", obtained in the Test stage. Mean difference, or bias, and root-mean square deviations were calculated from differences between sensors readings and reference humidity using conventional statistical technique. Also from the Test stage was estimated reproducibility, as root-mean square deviations of sensors readings, and hysteresis at normal conditions, which are presented in Table 6-4.
Fig. 8-13 - Fig. 8-19 present humidity measurements of one sensor for each
participated sensor design versus "TOROS" humidity at different temperatures from the Research stage. Bearing in mind that in real ascents both sensitive elements of RS9 sensor report alternately, Fig. 8-20 also presents the differences between the sensitive elements of one RS9 sensor for the different temperature regimes.
On Fig. 6-6 - Fig. 6-12 for each humidity category and temperature regime are
presented mean differences for each participated sensor design against "TOROS" humidity at the Research stage.
PHASE I - Lab Test. WMO Radiosonde Humidity Sensor Intercomparison, June 1995-June 1997
PHASE I - page 21
0 20 40 60 80 100Humidity. %RH
-1.00
-0.50
T "TSP
" -T"T
HYG
AN",C
Fig. 6-2. Differences between platinum thermometer and "THYGAN"
20 40 60 80Humidity, %RH
-8.0
-6.0
-4.0
-2.0
0.0
2.0
4.0
6.0
8.0
UD
IPO
LE- U
TOR
OS, %
RH
Pass 8 (20 °C)
Pass 9 (-10 °C)
Pass 12 (20 °C)
Pass 13 (-10 °C)
Pass 16 (-40 °C)
Pass 17 (-60 °C)
Fig. 6-3. Differences between "TOROS" and "DIPOLE" humidity

PHAS
E I -
Lab
Tes
t. W
MO
Rad
ioso
nde
Hum
idit
y Se
nsor
Inte
rcom
pari
son,
Jun
e 19
95-J
une
1997
PHASE I
- p
age
22
1020
3040
5060
7080
90H
umid
ity, %
RH
-5.0
-3.0
-1.01.0
3.0
5.0
7.0
Bias, %RH
AIR
RSA
RSH
RS9
VIZ
DVR
GBS
Fig.
6-4
. Mea
n di
ffere
nces
of p
artic
ipat
ed s
enso
rs a
gain
st "
TOR
OS"
at n
orm
al c
ondi
tions
.

PHAS
E I -
Lab
Tes
t. W
MO
Rad
ioso
nde
Hum
idit
y Se
nsor
Inte
rcom
pari
son,
Jun
e 19
95-J
une
1997
PHASE I
- p
age
23
1020
3040
5060
7080
90H
umid
ity, %
RH
0.0
2.0
4.0
Standard deviation, %RHAI
R
RSA
RSH
RS9
VIZ
DVR
GBS
Fi
g. 6
-5. R
oot-m
ean
squa
re d
evia
tions
of p
artic
ipat
ed s
enso
rs a
gain
st "
TOR
OS"
at n
orm
al c
ondi
tions
.

PHASE I - Lab Test. WMO Radiosonde Humidity Sensor Intercomparison, June 1995-June 1997
PHASE I - page 24
0 20 40 60 80TOROS, %RH
-25
-20
-15
-10
-5
0
5
10
15
20
25
U, %
RH
20 °C
-10 °C
-40 °C
-60 °C
Fig. 6-6. AIR sensor performance in "DIPOLE"
0 20 40 60 80TOROS, %RH
-25
-20
-15
-10
-5
0
5
10
15
20
25
U, %
RH
20 °C
-10 °C
-40 °C
-60 °C
Fig. 6-7. RSA sensor performance in "DIPOLE".

PHASE I - Lab Test. WMO Radiosonde Humidity Sensor Intercomparison, June 1995-June 1997
PHASE I - page 25
0 20 40 60 80TOROS, %RH
-25
-20
-15
-10
-5
0
5
10
15
20
25
U, %
RH
20 °C
-10 °C
-40 °C
-60 °C
Fig. 6-8. RSH sensor performance in "DIPOLE".
0 20 40 60 80TOROS, %RH
-25
-20
-15
-10
-5
0
5
10
15
20
25
U, %
RH
20 °C
-10 °C
-40 °C
-60 °C
Fig. 6-9. RS9 sensor performance in "DIPOLE".

PHASE I - Lab Test. WMO Radiosonde Humidity Sensor Intercomparison, June 1995-June 1997
PHASE I - page 26
0 20 40 60 80TOROS, %RH
-25
-20
-15
-10
-5
0
5
10
15
20
25
U, %
RH
20 °C
-10 °C
-40 °C
-60 °C
Fig. 6-10. VIZ sensor performance in "DIPOLE".
0 20 40 60 80TOROS, %RH
-25
-20
-15
-10
-5
0
5
10
15
20
25
U, %
RH
20 °C
-10 °C
-40 °C
-60 °C
Fig. 6-11. DVR sensor performance in "DIPOLE".

PHASE I - Lab Test. WMO Radiosonde Humidity Sensor Intercomparison, June 1995-June 1997
PHASE I - page 27
0 20 40 60 80TOROS, %RH
-25
-20
-15
-10
-5
0
5
10
15
20
25U
, %R
H
20 °C
-10 °C
-40 °C
-60 °C
Fig. 6-12. GBS sensor performance in "DIPOLE".
6.3. Dynamic properties Two values were calculated to reflect the dynamic properties of sensors - the time of
reaching of sensors readings 63% and 90 % changes of sensors indications (in units of relative humidity) from the value of complete change (these values were marked accordingly τ63 and τ90).
The idea of τ63 and τ90 determinations is explained by Fig.6-13 - Fig.6-14, and
typical examples of recording and processing for each type of the sensors at 20°C and -20°C are given on Fig.8-21 - Fig.8-33, were indicated:
� UI - initial value of humidity; � UL - final value of humidity;
� Ut - normalized humidity, defined as Ut - UL UI - UL
� T - air temperature.

PHASE I - Lab Test. WMO Radiosonde Humidity Sensor Intercomparison, June 1995-June 1997
PHASE I - page 28
0.0 4.0 8.0 12.0 16.0Time, sec
50
60
70U
t, %R
H
AIRSensor № 5
"DIPOLE", T= +20°C
Fig. 6-13. Determination of τ63 and τ90. Original humidity readings.
0.0 20.0 40.0Time, sec
0.00
0.40
0.80
(Ut -
UI)/(
UL -
UI)
0.9
0.63..
AIRSensor № 11
"CASCADE", T= +20°CUI=73 %RH, UL=45 %RH
Normalized humidity
Approximation for τ 0.63=1.3 sec
Approximation for τ 0.9=11.1 sec
Fig. 6-14. Determination of τ63 and τ90. Normalized humidity readings.

PHASE I - Lab Test. WMO Radiosonde Humidity Sensor Intercomparison, June 1995-June 1997
PHASE I - page 29
Table 6-3. Some results of time constant tests received in installations "CASCADE" and "DIPOLE"
Sensor Installation T,°C UI,% RH UL,% RH τ63, s τ90, s AIR CASCADE 20 73 45 1.3 11.1
50 72 2.5 18.7 68 49 1.7 15.4 49 67 1.8 14.2 DIPOLE 20 75 52 3.0 7.4 51 74 3.0 8.1 -20 39 60 17.3 34.3 60 40 16.5 31.3
RSA CASCADE 20 56 33 0.5 6.9 50 34 0.7 9.6 DIPOLE 20 46 29 0.5 1.3 29 46 0.5 1.4 -20 38 59 5.4 12.2 68 49 5.7 12.8
RSH CASCADE 20 37 52 1.0 6.5 52 38 1.2 5.6 DIPOLE -20 34 62 7.0 13.6 65 43 10.5 22.3
RS9 CASCADE 20 30 52 0.4 3.7 52 32 0.4 3.1 40 55 0.3 3.1 41 54 0.4 3.0 DIPOLE 20 56 36 0.2 1.0 35 56 0.2 1.2
VIZ CASCADE 20 55 72 1.3 11.8 73 53 1.2 7.3 53 70 0.8 10.0 71 54 1.2 17.7 DIPOLE 20 33 55 0.2 0.6 55 31 0.2 0.9 -20 45 22 3.5 7.0 21 43 2.7 6.3
DVR CASCADE 20 71 53 1.7 7.2 52 71 2.2 8.9 77 56 1.7 7.4 56 76 2.1 7.2 DIPOLE 20 50 73 1.8 4.3 73 51 2.0 5.3 -20 48 58 21.6 44.1 59 49 20.4 42.9
GBS CASCADE 20 83 62 5.0 14.3 61 84 4.7 16.0 78 57 7.2 18.4 56 77 6.6 18.7 DIPOLE 20 79 63 16.4 31.9 63 79 17.0 37.9 -20 66 79 47.4 89.7 79 59 59.2 104.1
Certain differences should be mentioned for some sensors between results in
installation �CASCADE" and "DIPOLE", which, as appears, was stipulated by various relationships of the sizes of sensors and micro-chamber of installation "DIPOLE".

PHASE I - Lab Test. WMO Radiosonde Humidity Sensor Intercomparison, June 1995-June 1997
PHASE I - page 30
6.4. Overall performance Generalized results from the Test and Research stages are summarized in Table 6-4.
Table 6-4. Radiosonde humidity sensors performance
AIR RSA RSH RS9 VIZ DVR GBS
Static characteristics at normal conditions (Test stage) Bias,% RH -2.2 -0.5 -1.6 -0.7 0.9 1.0 -0.2 RMSD,% RH 1.6 1.9 2.2 1.5 5.2 3.4 3.2 Reproducibility, % RH
1.1 0.8 1.2 0.3 0.4 3.1 2.5
Hysteresis,% RH 2.6 3.1 - - - 6.5 - Max. error,% RH 1.9 3.3 3.0 2.3 10.4 14.8 10.1 Min. error,% RH -7.1 -4.4 -6.1 -3.7 -17.8 -7.6 -12.3
Temperature influence on static characteristics (Research stage) +20°C
Bias,% RH 1.3 -0.8 -0.7 1.0 6.9 4.5 5.4 RMSD,% RH 1.0 1.8 1.6 1.7 4.2 2.2 3.7 -10°C Bias,% RH -2.7 -0.5 -0.7 0.6 -2.1 -3.5 13.6 RMSD,% RH 2.4 2.1 2.0 2.2 3.8 2.4 3.4 -40°C Bias,% RH -8.4 -3.3 -2.8 -1.9 1.2 -14.7 10.1 RMSD,% RH 2.6 3.2 3.0 2.8 7.6 4.1 6.1 -60°C Bias,% RH -15.9 -6.9 -4.3 -1.9 5.3 -18.4 20.0 RMSD,% RH 4.9 5.1 2.7 3.6 14.3 8.5 10.0
Dynamic characteristics +20°C ("CASCADE" and "DIPOLE")
τ63, sec 2.0 1.0 1.0 0.3 0.2 2.0 8
τ90, sec 10 4 5 3 1 8 18
-20°C ("DIPOLE")
τ63, sec 17 5 8 - 3 18 50
τ90, sec 35 11 18 - 7 40 90
Some notes, concerning sensor's performance can be made from the results above: AIR has rather a good performance at normal conditions; however significant bias
appears at negative temperatures, as well as slow response, caused, apparently, by design of cover cap.
RSA reveals some hysteresis and large bias at -60°C at high humidity, while other
characteristics are very good.

PHASE I - Lab Test. WMO Radiosonde Humidity Sensor Intercomparison, June 1995-June 1997
PHASE I - page 31
RS9 sensors shows better performance than RSH sensor, RS9 has minimal bias and reproducibility as well as response time.
VIZ - has an excellent response and reproducibility; however it should not be
forgotten, that VIZ sensors were calibrated during intercomparison. Nevertheless, after influence of high humidity sensors don't come back to resistance at calibration point (33% RH), that explains growing scatter at low humidities on Fig. 6-5. VIZ completely looses sensitivity at -60°C
DVR shows large scatter and response time and the most poor reproducibility as well
as hysteresis; at -60°C it looses sensitivity. GBS has rather a big scatter, especially at low humidity, large response time that
drastically grows at negative temperature, as well as bias, actually GBS as well looses sensitivity at both -40° and -60°C.
7. Conclusions and recommendations The Phase I Laboratory Test of the first WMO Radiosonde Humidity Sensor
Intercomparison Phase I Laboratory was carried out since June 1995 till June 1997. 7 types of radiosonde humidity sensors from leading world manufacturers of radiosondes took part in intercomparison.
Performance of sensor examined is evaluated for temperature range from 20 to -
60°C. Almost all participated sensors are satisfied to WMO accuracy requirements (5 -10% RH) under temperatures ≤ 40°C. For the whole range of conditions, reproduced in Laboratory Phase, only Vaisala H-Humicap sensors tolerate these requirements.
Despite of relatively small amount of results obtained at -60°C it is possible to state
that humidity measurements, produced by the better humidity sensors are reasonable, and therefore it is necessary to consider extending the temperature range for WMO legal approximation of saturation water vapour above water surface.
Taking into account increased performance of modern radiosonde humidity sensors
it�s necessary to consider the matter of improving practice of dew point depression reporting in TEMP messages for better representation of information. The optimal solution would be application of 0.2 - 0.5°C resolution to dew point depression range from 5 to 20°C.
All sensors showed more or less satisfactory performance at normal temperature
while began essentially diverge at lower temperatures. That means to customers and members not to rely upon sensor�s specifications at normal temperature but to interest in ones for the whole range of conditions.
The similar design of sensor doesn�t guarantee itself the same or similar performance
as it could be seen from comparison of thin-film capacitive sensors: AIR sensors and, especially, DVR sensors were clearly not as reliable as HUMICAP sensors.
It is very difficult if ever possible to reproduce in laboratory several environmental
conditions, such as saturation, especially at negative temperatures, and simultaneous drastic changes in both humidity and temperature. In-flight intercomparisons between different sensors can give only comparative results. At the same time humidity sensors performance under such conditions is critical either for routine synoptic tasks or environmental studies. Therefore future intercomparison should involve in their flight phase direct comparison with balloon-borne humidity reference, although it is much more expensive.

PHASE I - Lab Test. WMO Radiosonde Humidity Sensor Intercomparison, June 1995-June 1997
PHASE I - page 32
To obtain reliable estimates of particular sensor design reproducibility and, therefore, of systematic bias laboratory examination should include at least 20 sensors.
Basing on the experiment results RS90 humidity sensor could be considered as link
sensor for the further analysis of combined results of Phase I and Phase II as well as comparison reference for flight comparisons of radiosonde humidity sensors.
8. Appendices
8.1. Tables
Table 8-1. The amount of measurements, made by particular sensors in static characteristics examination at the Test stage
AIR
Points (humidity category,% RH) Sensor Pass 10 20 30 40 50 60 70 80 90 95 All
humidities 1 1 5/3 6/3 6/3 3/3 3/3 3/3 3/3 3/3 3/3 3 652 1 5/3 6/3 6/3 3/3 3/3 3/3 3/3 3/3 3/3 3 653 1 5/3 6/3 6/3 3/3 3/3 3/3 3/3 3/3 3/3 3 65
3 3/4 6/1 5/4 3/1 3/1 3/1 3/1 3/1 3/3 3 52 4 3/3 3/3 3/3 3/3 3/3 3/3 3/3 3/3 2/7 3 60 5 3/6 3/3 3/3 3/3 3/3 3/0 0/3 3/3 3/3 3 54
All passes 14/16 18/10 17/13 12/10 12/10 12/7 9/10 12/10 11/16 12 2314 1 5/3 6/3 6/3 3/3 3/3 3/3 3/3 3/3 3/3 3 65
3 3/4 6/1 5/4 3/1 3/1 3/1 3/1 3/1 3/3 3 52 4 3/3 3/3 3/3 3/3 3/3 3/3 3/3 3/3 2/7 3 60 5 3/6 3/3 3/3 3/3 3/3 3/0 0/3 3/3 3/3 3 54
All passes 14/16 18/10 17/13 12/10 12/10 12/7 9/10 12/10 11/16 12 2315 1 5/3 6/3 6/3 3/3 3/3 3/3 3/3 3/3 3/3 3 65
3 3/4 6/1 5/4 3/1 3/1 3/1 3/1 3/1 3/3 3 52 4 3/3 3/3 3/3 3/3 3/3 3/3 3/3 3/3 2/7 3 60 5 3/6 3/3 3/3 3/3 3/3 3/0 0/3 3/3 3/3 3 54
All Passes 14/16 18/10 17/13 12/10 12/10 12/7 9/10 12/10 11/16 12 2316 1 5/3 6/3 6/3 3/3 3/3 3/3 3/3 3/3 3/3 3 657 1 5/3 6/3 6/3 3/3 3/3 3/3 3/3 3/3 3/3 3 658 1 5/3 6/3 6/3 3/3 3/3 3/3 3/3 3/3 3/3 3 659 1 4/3 6/3 6/3 3/3 3/3 3/3 3/3 3/3 3/3 3 64
10 1 5/3 6/3 6/3 3/3 3/3 3/3 3/3 3/3 3/3 3 6511 3 3/4 6/1 5/4 3/1 3/1 3/1 3/1 3/1 3/3 3 5212 3 3/4 6/1 5/4 3/1 3/1 3/1 3/1 3/1 3/3 3 52

PHASE I - Lab Test. WMO Radiosonde Humidity Sensor Intercomparison, June 1995-June 1997
PHASE I - page 33
RSA Humidity category,% RH
Sensor Pass 10 20 30 40 50 60 70 80 90 95 All humidities
5 1 6/3 6/3 6/3 3/3 3/3 3/3 3/3 3/3 3/3 3 66 2 1/1 0/0 1/1 0/0 0/0 0/1 0/0 0/0 1/1 1 8
All Passes 7/4 6/3 7/4 3/3 3/3 3/4 3/3 3/3 4/4 4 746 1 6/3 6/3 6/3 3/3 3/3 3/3 3/3 3/3 3/3 3 66
2 1/1 0/0 1/1 0/0 0/0 2/1 0/0 0/0 1/1 1 10All Passes 7/4 6/3 7/4 3/3 3/3 5/4 3/3 3/3 4/4 4 76
8 1 6/3 6/3 6/3 3/3 3/3 3/3 3/3 3/3 3/3 3 66 2 1/1 0/0 1/1 0/0 0/0 2/1 0/0 0/0 1/1 1 10
All Passes 7/4 6/3 7/4 3/3 3/3 5/4 3/3 3/3 4/4 4 7611 1 6/3 6/3 6/3 3/3 3/3 3/3 3/3 3/3 3/3 3 66
2 1/1 0/0 1/1 0/0 0/0 2/1 0/0 0/0 1/1 1 10All Passes 7/4 6/3 7/4 3/3 3/3 5/4 3/3 3/3 4/4 4 76
RSH
Humidity category,% RH Sensor Pass 10 20 30 40 50 60 70 80 90 95 All
humidities 1 3 3/4 6/1 5/4 3/1 3/1 3/1 3/1 3/1 3/3 3 522 3 3/4 6/1 5/4 3/1 3/1 3/1 3/1 3/1 3/3 3 523 3 3/4 6/1 5/4 3/1 3/1 3/1 3/1 3/1 3/3 3 52
10 3 3/4 6/1 5/4 3/1 3/1 3/1 3/1 3/1 3/3 3 52
RS9 Humidity category,% RH
Sensor Pass 10 20 30 40 50 60 70 80 90 95 All humidities1/1� 4 3/3 3/3 3/3 3/3 3/3 3/3 3/3 3/3 2/7 3 602/2� 4 3/3 3/3 3/3 3/3 3/3 3/3 3/3 3/3 2/7 3 603/3� 4 3/3 3/3 3/3 3/3 3/3 3/3 3/3 3/3 2/7 3 604/4� 4 3/3 3/3 3/3 3/3 3/3 3/3 3/3 3/3 2/7 3 607/7� 5 3/6 3/3 3/3 3/3 3/3 3/0 0/3 3/3 3/3 3 548/8� 5 3/6 3/3 3/3 3/3 3/3 3/0 0/3 3/3 3/3 3 549/9� 5 3/6 3/3 3/3 3/3 3/3 3/0 0/3 3/3 3/3 3 54
10/10� 5 3/6 3/3 3/3 3/3 3/3 3/0 0/3 3/3 3/3 3 54
VIZ Humidity category,% RH
Sensor Pass 10 20 30 40 50 60 70 80 90 95 All humidities1 1 6/3 6/3 6/3 3/3 3/3 3/3 3/3 3/3 3/3 3 662 1 6/3 6/3 6/3 3/3 3/3 3/3 3/3 3/3 3/3 3 663 1 6/3 6/3 6/3 3/3 3/3 3/3 3/3 3/3 3/3 3 664 2 1/1 0/0 1/1 0/0 0/0 2/1 0/0 0/0 1/1 1 105 2 1/1 0/0 1/1 0/0 0/0 2/1 0/0 0/0 1/1 1 106 2 1/1 0/0 1/1 0/0 0/0 2/1 0/0 0/0 1/1 1 107 3 3/4 6/1 5/4 3/1 3/1 3/1 3/1 3/1 3/3 3 528 3 3/4 6/1 5/4 3/1 3/1 3/1 3/1 3/1 3/3 3 529 3 3/4 6/1 5/4 3/1 3/1 3/1 3/1 3/1 3/3 3 52
10 4 3/3 3/3 3/3 3/3 3/3 3/3 3/3 3/3 2/7 2 5911 4 3/3 3/3 3/3 3/3 3/3 3/3 3/3 3/3 2/7 2 5912 4 3/3 3/3 3/3 3/3 3/3 3/3 3/3 3/3 2/7 2 5913 5 3/6 3/3 3/3 3/3 3/3 3/0 0/3 3/3 3/3 3 5414 5 3/6 3/3 3/3 3/3 3/3 3/0 0/3 3/3 3/3 3 5415 5 3/6 3/3 3/3 3/3 3/3 3/0 0/3 3/3 3/3 3 54

PHASE I - Lab Test. WMO Radiosonde Humidity Sensor Intercomparison, June 1995-June 1997
PHASE I - page 34
DVR Humidity category,% RH
Sensor Pass 10 20 30 40 50 60 70 80 90 95 All humidities
1 1 6/3 6/3 6/3 2/3 3/3 3/3 3/3 3/3 3/3 3 65 2 1/1 0/0 0/1 0/0 0/0 2/1 0/0 0/0 1/1 1 9
All Passes 7/4 6/3 6/4 2/3 3/3 5/4 3/3 3/3 4/4 4 742 1 6/3 6/3 6/3 2/3 3/3 3/3 3/3 3/3 3/3 3 65
2 1/1 0/0 0/1 0/0 0/0 2/1 0/0 0/0 1/1 1 9 3 3/1 3/1 5/4 3/1 3/1 3/1 3/1 3/1 3/3 3 46
All Passes 10/5 9/4 11/8 5/4 6/4 8/5 6/4 6/4 7/7 7 1203 1 6/3 6/3 6/3 2/3 3/3 3/3 3/3 3/3 3/3 3 65
2 1/1 0/0 0/1 0/0 0/0 2/1 0/0 0/0 1/1 1 9 3 3/1 3/1 5/4 3/1 3/1 3/1 3/1 3/1 3/3 3 46
All Passes 10/5 9/4 11/8 5/4 6/4 8/5 6/4 6/4 7/7 7 1204 1 6/3 6/3 6/3 2/3 3/3 3/3 3/3 3/3 3/3 3 65
2 1/1 0/0 0/1 0/0 0/0 2/1 0/0 0/0 1/1 1 9All Passes 7/4 6/3 6/4 2/3 3/3 5/4 3/3 3/3 4/4 4 74
5 4 3/3 3/2 3/3 3/3 3/3 3/3 3/3 3/3 2/7 3 59 5 3/6 3/3 3/3 3/3 3/3 3/0 0/3 3/3 3/3 3 54
All Passes 6/9 6/5 6/6 6/6 6/6 6/3 3/6 6/6 5/10 6 1136 5 3/6 3/3 3/3 3/3 3/3 3/0 0/3 3/3 3/3 3 548 1 6/3 6/3 6/3 2/3 3/3 3/3 3/3 3/3 3/3 3 65
2 1/1 0/0 0/1 0/0 0/0 2/1 0/0 0/0 1/1 1 9All Passes 7/4 6/3 6/4 2/3 3/3 5/4 3/3 3/3 4/4 4 74
9 3 3/1 3/1 5/4 3/1 3/1 3/1 3/1 3/1 3/3 3 46 4 3/3 3/2 3/3 3/3 3/3 3/3 3/3 3/3 2/7 3 59 5 3/6 3/3 3/3 3/3 3/3 3/0 0/3 3/3 3/3 3 54
All Passes 9/10 9/6 11/10 9/7 9/7 9/4 6/7 9/7 8/13 9 15910 3 3/1 3/1 5/4 3/1 3/1 3/1 3/1 3/1 3/3 3 46
4 3/3 3/2 3/3 3/3 3/3 3/3 3/3 3/3 2/7 3 59 5 3/6 3/3 3/3 3/3 3/3 3/0 0/3 3/3 3/3 3 54
All Passes 9/10 9/6 11/10 9/7 9/7 9/4 6/7 9/7 8/13 9 15911 5 3/6 3/3 3/3 3/3 3/3 3/0 0/3 3/3 3/3 3 5413 4 3/3 3/2 3/3 3/3 3/3 3/3 3/3 3/3 2/7 3 5915 1 6/3 6/3 6/3 2/3 3/3 3/3 3/3 3/3 3/3 3 65
2 1/1 0/0 0/1 0/0 0/0 2/1 0/0 0/0 1/1 1 9 3 3/1 3/1 5/4 3/1 3/1 3/1 3/1 3/1 3/3 3 46 4 3/3 3/2 3/3 3/3 3/3 3/3 3/3 3/3 2/7 3 59
All Passes 13/8 12/6 14/11 8/7 9/7 11/8 9/7 9/7 9/14 10 17918 1 6/3 6/3 6/3 2/3 3/3 3/3 3/3 3/3 3/3 3 65
2 1/1 0/0 0/1 0/0 0/0 2/1 0/0 0/0 1/1 1 9 3 3/1 3/1 5/4 3/1 3/1 3/1 3/1 3/1 3/3 3 46 4 3/3 3/2 3/3 3/3 3/3 3/3 3/3 3/3 2/7 3 59 5 3/6 3/3 3/3 3/3 3/3 3/0 0/3 3/3 3/3 3 54
All Passes 16/14 15/9 17/14 11/10 12/10 14/8 9/10 12/10 12/17 13 23320 3 3/1 3/1 5/4 3/1 3/1 3/1 3/1 3/1 3/3 3 46
4 3/3 3/2 3/3 3/3 3/3 3/3 3/3 3/3 2/7 3 59 5 3/6 3/3 3/3 3/3 3/3 3/0 0/3 3/3 3/3 3 54
All Passes 9/10 9/6 11/10 9/7 9/7 9/4 6/7 9/7 8/13 9 159

PHASE I - Lab Test. WMO Radiosonde Humidity Sensor Intercomparison, June 1995-June 1997
PHASE I - page 35
GBS Humidity category,% RH Sensor Pass 10 20 30 40 50 60 70 80 90 95 All
humidities 1 3 3/4 6/1 5/4 3/1 3/1 3/1 3/1 3/1 3/3 3 52
4 3/3 3/2 3/3 3/3 3/3 3/3 3/3 3/3 2/7 3 59All Passes 6/7 9/3 8/7 6/4 6/4 6/4 6/4 6/4 5/10 6 111
2 1 6/3 5/3 6/3 3/3 3/3 3/2 3/3 3/3 3/3 3 643 1 6/3 5/3 6/3 3/3 3/3 3/2 3/3 3/3 3/3 3 644 1 6/3 5/3 6/3 3/3 3/3 3/2 3/3 3/3 3/3 3 64
4 3/3 3/2 3/3 3/3 3/3 3/3 3/3 3/3 2/7 3 59All Passes 9/6 8/5 9/6 6/6 6/6 6/5 6/6 6/6 5/10 6 123
5 1 6/3 5/3 6/3 3/3 3/3 3/2 3/3 3/3 3/3 2 636 1 6/3 5/3 6/3 3/3 3/3 3/2 3/3 3/3 3/3 3 647 3 3/4 6/1 5/4 3/1 3/1 3/1 3/1 3/1 3/3 3 52
4 3/3 3/2 3/3 3/3 3/3 3/3 3/3 3/3 2/7 3 59All Passes 6/7 9/3 8/7 6/4 6/4 6/4 6/4 6/4 5/10 6 111
8 3 3/4 6/1 5/4 3/1 3/1 3/1 3/1 3/1 3/3 3 52 4 3/3 3/2 3/3 3/3 3/3 3/3 3/3 3/3 2/7 3 59
All Passes 6/7 9/3 8/7 6/4 6/4 6/4 6/4 6/4 5/10 6 1119 1 6/3 5/3 6/3 3/3 3/3 3/2 3/3 3/3 3/3 3 64
4 3/3 3/2 3/3 3/3 3/3 3/3 3/3 3/3 2/7 3 59All Passes 9/6 8/5 9/6 6/6 6/6 6/5 6/6 6/6 5/10 6 123
10 3 3/4 6/1 5/4 3/1 3/1 3/1 3/1 3/1 3/3 3 52 4 3/3 3/2 3/3 3/3 3/3 3/3 3/3 3/3 2/7 3 59
All Passes 6/7 9/3 8/7 6/4 6/4 6/4 6/4 6/4 5/10 6 111 Comment: � nominator - number of Samples for given Point at wetting; � denominator - number of Samples for given Point at drying.

PHASE I - Lab Test. WMO Radiosonde Humidity Sensor Intercomparison, June 1995-June 1997
PHASE I - page 36
8.2. Figures
Fig. 8-1. AIR arrangement in micro-chamber
Fig. 8-2. RSA(RSH) and RS9 arrangement in micro-chamber.

PHASE I - Lab Test. WMO Radiosonde Humidity Sensor Intercomparison, June 1995-June 1997
PHASE I - page 37
Fig. 8-3. VIZ arrangement in micro-chamber.
Fig. 8-4. DVR arrangement in micro-chamber.

PHASE I - Lab Test. WMO Radiosonde Humidity Sensor Intercomparison, June 1995-June 1997
PHASE I - page 38
Fig. 8-5. GBS arrangement in micro-chamber.
0 20 40 60 80 100TOROS, %RH
-8.0
-4.0
0.0
4.0
8.0
dU, %
RH
AIR#3 - Pass 1
AIR#3 - Pass 3
AIR#3 - Pass 4
Fig. 8-6. Example of one AIR sensor difference against "TOROS" at the Test stage. By arrows hereinafter is shown direction of humidity changes.

PHASE I - Lab Test. WMO Radiosonde Humidity Sensor Intercomparison, June 1995-June 1997
PHASE I - page 39
0 20 40 60 80 100TOROS, %RH
-8.0
-4.0
0.0
4.0
8.0dU
, %R
HRSA#8 - Pass 1
RSA#8 - Pass 2
Fig. 8-7. Example of one RSA sensor difference against "TOROS" at the Test stage.
0 20 40 60 80 100TOROS, %RH
-8.0
-4.0
0.0
4.0
8.0
dU, %
RH
RSH#1 - Pass 3
Fig. 8-8. Example of one RSH sensor difference against "TOROS" at the Test stage.

PHASE I - Lab Test. WMO Radiosonde Humidity Sensor Intercomparison, June 1995-June 1997
PHASE I - page 40
0 20 40 60 80 100TOROS, %RH
-8.0
-4.0
0.0
4.0
8.0dU
, %R
H
RS9#10/1 - Pass 5
RS9#10/2 - Pass 5
Fig. 8-9. Example of one RS9 sensor difference against "TOROS" at the Test stage.
0 20 40 60 80 100TOROS, %RH
-8.0
-4.0
0.0
4.0
8.0
dU, %
RH
VIZ#10 - Pass 4
Fig. 8-10. Example of one VIZ sensor difference against "TOROS" at the Test stage.

PHASE I - Lab Test. WMO Radiosonde Humidity Sensor Intercomparison, June 1995-June 1997
PHASE I - page 41
0 20 40 60 80 100TOROS, %RH
-8.0
-4.0
0.0
4.0
8.0dU
, %R
H
DVR#1 - Pass 1
DVR#1 - Pass 2
Fig. 8-11. Example of one DVR sensor difference against "TOROS" at the Test stage.
0 20 40 60 80 100TOROS, %RH
-8.0
-4.0
0.0
4.0
8.0
dU, %
RH
GBS#7 - Pass 3
GBS#7 - Pass 4
Fig. 8-12. Example of one GBS sensor difference against "TOROS" at the Test stage.

PHASE I - Lab Test. WMO Radiosonde Humidity Sensor Intercomparison, June 1995-June 1997
PHASE I - page 42
0 20 40 60 80TOROS, %RH
0
20
40
60
80U
, %R
H
AIR#11
Pass 8 (20 °C)
Pass 9 (-10 °C)
Pass 10 (-40 °C)
Pass 11 (-60 °C)
Fig. 8-13. AIR sensor humidity measurements at different temperatures.
0 20 40 60 80TOROS, %RH
0
20
40
60
80
U, %
RH
RSA#3
Pass 12 (20 °C)
Pass 13 (-10 °C)
Pass 16 (-40 °C)
Pass 17 (-60 °C)
Fig. 8-14. One RSA sensor humidity measurements at different temperatures
.

PHASE I - Lab Test. WMO Radiosonde Humidity Sensor Intercomparison, June 1995-June 1997
PHASE I - page 43
0 20 40 60 80TOROS, %RH
0
20
40
60
80U
, %R
H
RSH#11
Pass 8 (20 °C)
Pass 9 (-10 °C)
Pass 10 (-40 °C)
Pass 11 (-60 °C)
Fig. 8-15. RSH sensor humidity measurements at different temperatures.
0 20 40 60 80TOROS, %RH
0
20
40
60
80
U, %
RH
RS9#6 (mean of bothsensitive elements)
Pass 12 (20 °C)
Pass 13 (-10 °C)
Pass 16 (-40 °C)
Pass 17 (-60 °C)
Fig. 8-16. One RS9 sensor humidity measurements at different temperatures.

PHASE I - Lab Test. WMO Radiosonde Humidity Sensor Intercomparison, June 1995-June 1997
PHASE I - page 44
0 20 40 60 80TOROS, %RH
0
20
40
60
80U
, %R
H
VIZ#22
Pass 12 (20 °C)
Pass 13 (-10 °C)
Pass 16 (-40 °C)
Pass 17 (-60 °C)
Fig. 8-17. One VIZ sensor humidity measurements at different temperatures.
0 20 40 60 80TOROS, %RH
0
20
40
60
80
U, %
RH
DVR#1
Pass 8 (20 °C)
Pass 9 (-10 °C)
Pass 10 (-40 °C)
Pass 11 (-60 °C)
Fig. 8-18. DVR sensor humidity measurements at different temperatures.

PHASE I - Lab Test. WMO Radiosonde Humidity Sensor Intercomparison, June 1995-June 1997
PHASE I - page 45
0 20 40 60 80TOROS, %RH
0
20
40
60
80U
, %R
H
GBS#1
Pass 12 (20 °C)
Pass 13 (-10 °C)
Pass 16 (-40 °C)
Pass 17 (-60 °C)
Fig. 8-19. One GBS sensor humidity measurements at different temperatures.
20 40 60 80TOROS, %RH
0.0
2.0
dU, %
RH
RS9#10
Pass 8 (20 °C)
Pass 9 (-10 °C)
Pass 10 (-40 °C)
Pass 11 (-60 °C)
Fig. 8-20. Differences between two sensitive elements of RS9.

PHASE I - Lab Test. WMO Radiosonde Humidity Sensor Intercomparison, June 1995-June 1997
PHASE I - page 46
0.0 4.0 8.0 12.0Time, sec
0.00
0.40
0.80
(Ut -
U0)/(
Ue -
U0)
0.9
0.63..
AIRSensor № 5
"DIPOLE", T= +20°CUI=74 %RH, UL=50 %RH
Normalized humidity
Approximation for τ 0.63=2.7 sec
Approximation for τ 0.9=5.8 sec
Fig. 8-21. An example of response time examination.
0.0 20.0 40.0 60.0Time, sec
0.00
0.40
0.80
(Ut -
U0)/(
Ue -
U0)
0.9
0.63..
AIRSensor № 5
"DIPOLE", T= -20°CUI=59 %RH, UL=40 %RH
Normalized humidity
Approximation for τ 0.63=16.8 sec
Approximation for τ 0.9=34.5 sec
Fig. 8-22. An example of response time examination.

PHASE I - Lab Test. WMO Radiosonde Humidity Sensor Intercomparison, June 1995-June 1997
PHASE I - page 47
0.0 4.0 8.0 12.0Time, sec
0.00
0.40
0.80
(Ut -
UI)/(
UL -
UI)
0.9
0.63..
RSASensor № 5
"DIPOLE", T= +20°CUI=47 %RH, UL=30 %RH
Normalized humidity
Approximation for τ 0.63=0.5 sec
Approximation for τ 0.9=1.4 sec
Fig. 8-23. An example of response time examination.
0.0 5.0 10.0 15.0 20.0Time, sec
0.00
0.40
0.80
(Ut -
UI)/(
UL -
UI)
0.9
0.63..
RSASensor № 5
"DIPOLE", T= -20°CUI=44 %RH, UL=66 %RH
Normalized humidity
Approximation for τ 0.63=5.8 sec
Approximation for τ 0.9=14 sec
Fig. 8-24. An example of response time examination.

PHASE I - Lab Test. WMO Radiosonde Humidity Sensor Intercomparison, June 1995-June 1997
PHASE I - page 48
0.0 4.0 8.0 12.0Time, sec
0.00
0.40
0.80
(Ut -
UI)/(
UL -
UI)
0.9
0.63..
RSHSensor № 10
"CASCADE", T= +20°CUI=38 %RH, UL=52 %RH
Normalized humidity
Approximation for τ 0.63=0.7 sec
Approximation for τ 0.9=3.2 sec
Fig. 8-25. An example of response time examination.
0.0 10.0 20.0Time, sec
0.00
0.40
0.80
(Ut -
UI)/(
UL -
UI)
0.9
0.63..
RSHSensor № 10
"DIPOLE", T= -20°CUI=49 %RH, UL=81 %RH
Normalized humidity
Approximation for τ 0.63=8.3 sec
Approximation for τ 0.9=18.2 sec
Fig. 8-26. An example of response time examination.

PHASE I - Lab Test. WMO Radiosonde Humidity Sensor Intercomparison, June 1995-June 1997
PHASE I - page 49
0.0 1.0 2.0 3.0 4.0 5.0Time, sec
0.00
0.40
0.80
(Ut -
UI)/(
UL -
UI)
0.9
0.63..
RS9Sensor № 1
"DIPOLE", T= +20°CUI=36 %RH, UL=56 %RH
Normalized humidity
Approximation for τ 0.63=0.2 sec
Approximation for τ 0.9=1.0 sec
Fig. 8-27. An example of response time examination.
0.0 2.0 4.0 6.0Time, sec
0.00
0.40
0.80
(Ut -
UI)/(
UL -
UI)
0.9
0.63..
VIZSensor № 21
"DIPOLE", T= +20°CUI=55 %RH, UL=31 %RH
Normalized humidity
Approximation for τ 0.63=0.3 sec
Approximation for τ 0.9=0.6 sec
Fig. 8-28. An example of response time examination.

PHASE I - Lab Test. WMO Radiosonde Humidity Sensor Intercomparison, June 1995-June 1997
PHASE I - page 50
0.0 4.0 8.0 12.0 16.0Time, sec
0.00
0.40
0.80
(Ut -
UI)/(
UL -
UI)
0.9
0.63..
VIZSensor № 21
"DIPOLE", T=-20°CUI=43 %RH, UL=16 %RH
Normalized humidity
Approximation for τ 0.63=3.5 sec
Approximation for τ 0.9=7.4 sec
Fig. 8-29. An example of response time examination.
0.0 5.0 10.0 15.0 20.0 25.0Time, sec
0.00
0.40
0.80
(Ut -
UI)/(
UL -
UI)
0.9
0.63..
DVRSensor № 1
"CASCADE", T= +20°CUI=52 %RH, UL=71 %RH
Normalized humidity
Approximation for τ 0.63=2.2 sec
Approximation for τ 0.9=8.9 sec
Fig. 8-30. An example of response time examination.

PHASE I - Lab Test. WMO Radiosonde Humidity Sensor Intercomparison, June 1995-June 1997
PHASE I - page 51
0.0 20.0 40.0 60.0Time, sec
0.00
0.40
0.80
(Ut -
UI)/(
UL -
UI)
0.9
0.63..
DVRSensor № 13
"DIPOLE", T= -20°CUI=48 %RH, UL=60 %RH
Normalized humidity
Approximation for τ 0.63=17.3 sec
Approximation for τ 0.9=36 sec
Fig. 8-31. An example of response time examination.
0.0 10.0 20.0 30.0Time, sec
0.00
0.40
0.80
(Ut -
UI)/(
UL -
UI)
0.9
0.63..
GBSSensor № 6
"CASCADE", T= +20°CUI=48 %RH, UL=60 %RH
Normalized humidity
Approximation for τ 0.63=7.2 sec
Approximation for τ 0.9=18.3 sec
Fig. 8-32. An example of response time examination.

PHASE I - Lab Test. WMO Radiosonde Humidity Sensor Intercomparison, June 1995-June 1997
PHASE I - page 52
0.0 40.0 80.0 120.0Time, sec
0.00
0.40
0.80
(Ut -
UI)/(
UL -
UI)
0.9
0.63..
GBSSensor № 3
"DIPOLE", T= -20°CUI=66 %RH, UL=79 %RH
Normalized humidity
Approximation for τ 0.63=47.4 sec
Approximation for τ 0.9=89.7 sec
Fig. 8-33. An example of response time examination.
8.3. International Organizing Committee
- J. Nash (Chairman) Meteorological Office, United Kingdom - A.A. Ivanov (Project Leader Phase I) CAO, Russian Federation - F.J. Schmidlin (Project Leader Phase II) NASA, USA - K. Schulze WMO Secretariat
8.4. List of participants In organization and carrying out experiments were directly involved the following
employees of CAO:
- Balagurov Alexandre site manager - Kats Alexander data manager - Krestyannikova Nadezgda technical manager - Schagin Alexandre host manager - Grinchenko Vladimir engineer - Vinogradov Lev engineer - Kotlyarov Nikolay engineer - Maklakova Natalya engineer - Zymina Natalya engineer - Puschkov Vladimir technician.
PHASE I - Lab Test. WMO Radiosonde Humidity Sensor Intercomparison, June 1995-June 1997
PHASE I - page 53
8.5. Glossary
Batch is the same set of sensors, at realization of a series of measurements in one installation. Addition or the replacement of any sensor results in change of the Batch number;
Point is a unique combination of a complex of all reproduced quantities in one installation
within the limits, stipulated in Programme of intercomparison; Pass is a single successive reproduction of Points at wetting, following by drying for given
installation with particular Batch of sensors; Sample is a real combination of a complex of all reproduced quantities for a given Point and
Batch; Bo means maximum permissible error under normal conditions; Bw means maximum permissible error under operating conditions.
*********

WMO RADIOSONDE HUMIDITY SENSOR INTERCOMPARISON
PHASE II - FIELD TEST
Laboratory for Hydrospheric Processes Goddard Space Flight Center, Wallops Flight Facility
Wallops Island, Virginia (USA) 8-26 September 1995

TABLE OF CONTENTS - PHASE II 0 Summary - Phase II .......................................................................................................... 1
1 Introduction and Objectives ............................................................................................. 1
2 Test Plan and Schedule .................................................................................................... 3
3 Radiosonde Description and Performance ....................................................................... 4
4 Profiles and Analyses ....................................................................................................... 7
5 Statistical Results ........................................................................................................... 14
6 Summary and Conclusions............................................................................................. 23
7 Recommendations .......................................................................................................... 25
8 References ...................................................................................................................... 26

PHASE II - FIELD TEST 0 Summary - Phase II This relative humidity sensor intercomparison report discusses the performance of the relative humidity sensors available on operational radiosondes used global-wide. The intercomparison was sponsored by the World Meteorological Organization and hosted in two parts. The first by the CAO Russian Federation in Moscow, and the second part at NASA Wallops Flight Facility, Virginia USA. Results of the first part of the intercomparison are presented elsewhere; this document discuss the field trial that dook place in September 1995 at Wallops Island. It should be noted that the results of this intercomparison are long overdue and this document provides information about the relative humidity sensors as existed in 1995. 1 Introduction and Objectives The adequacy of radiosonde relative humidity sensor accuracy has concerned meteorologists for many years (Elliott and Gaffen, 1991; Morrissey and Brousaides, 1970; Brousaides and Morrissey, 1974). Intercomparisons sponsored by the World Meteorological Organization (WMO) and other organizations, showed that improvement of relative humidity sensor accuracy is needed. Especially in the upper troposphere and lower stratosphere. Thus, radiosonde manufacturers are challenged to produce more reliable and accurate relative humidity sensors to meet the routine needs of national meteorological services. Meteorological services are major purchasers of radiosondes, nevertheless, the large variety of research programs also are very much concerned about the quality of radiosonde relative humidity data. Among these are numerical weather prediction investigators, projects such as GEWEX, TOGA-COARE, TRMM, and others. Basically, relative humidity measurement discrepancies stem from: the different types of sensors in use and the methods in which they are handled; the manner in which they are mounted or otherwise exposed on the radiosonde; and, from deficiencies in transfer equations or algorithms (Wade, 1995). Not only are differences between radiosonde humidity measurements a problem for the meteorological community, but disagreement between remotely sensed and in situ radiosonde measurements pose particular troublesome problems. It is typical to validate remote observations using radiosonde measurements (Soden et al, 1994). Unfortunately, relative humidity measurement uncertainties make remote sensor validation results questionable, and in many instances misleading. An intercomparison of operational relative humidity sensors was planned byWMO and conducted in 1995 from Wallops Island, Virginia USA. This intercomparison’s objective was to identify measurement discrepancies and a better understanding of the role atmospheric humidity plays in dynamical and hydrological processes at various temporal and spatial scales. The WMO Commission on Instruments and Methods of Observation (CIMO) agreed to a proposal from the Working Group on Upper-Air Observations that an intercomparison of relative humidity sensors was necessary. The role of the Upper-Air Working Group is to monitor upper air instrument performance, identify observation discrepancies, and insure that meaningful measurement practices are recommended and,so far as practicable, followed. Previous intercomparisons (Hooper, 1986; Nash and Schmidlin, 1987; Schmidlin, 1988; Ivanov et al, 1991; and, Yagi et al, 1996) pointed to temperature measurements as a major cause of radiosonde differences, but recognized that the different relative humidity sensors employed was also a problem. An International Organizing Committee (IOC) was organized

PHASE II - Field Test. WMO Radiosonde Humidity Sensor Intercomparison, Sept. 1995
PHASE II - page 2
to define the intercomparison objectives, to monitor its conduct, and to insure that results would be disseminated. The IOC met during February 1995 at the facilities of the Central Aerological Observatory (CAO) in Moscow, Russian Federation. Participants were from Finland, Russia, Switzerland, United Kingdom (UK), and The United States of America (USA). The intercomparison took place in two phases. Phase 1, a laboratory comparison employed environmental test chambers capable of operating over a large range of temperature and relative humidity values. Phase 1 was carried out during June 1995in the laboratories of CAO in Moscow. Phase II was hosted between September 8-26 1995by the National Aeronautics and Space Administration (NASA) at Wallops Flight Facility (WFF) of the Goddard Space Flight Facility (GSFC) located at Wallops Island, Virginia USA. Phase II included the Russian MRZ-3 radiosonde, the Atmospheric Instrumentation Research, Inc. (AIR) digital Intellisonde, the Vaisala RS-80-15LA, RS80-15LH, and RS-90 radiosondes, and the VIZ Manufacturing Co. (VIZ) MK-2 digital radiosonde (VIZ was taken over by Sippican, Inc in 1997 and Sippican subsequently was incorporated into Lockheed Martin Sippican). Table 1 lists the radiosondes and sensor types flown in the intercomparison. The Phase II operations plan required each participant to prepare its own radiosonde for flight, acquire and verify its data, process and provide their data in a format suitable for analysis. Personnel from VIZ Manufacturing Co. and Vaisala Co. arrived at Wallops Flight Facility three days ahead of the first scheduled observation. Personnel from AIR, Inc. arrived at Wallops Island a few days after the initiation of the intercomparison. The first AIR radiosonde was flown beginning with flight number 17 on 12 September at 1700:35 UTC. Preparation of this instrument was simple, because of alkaline dry-cell batteries used to power this instrument. The dry-cell batteries also made it possible to turn the radiosonde on and off, as necessary. The Russian participants arrived on 14 September and rapidly set up their equipment. The first measurement of the Russian MRZ-3 radiosonde was obtained on 15 September. Data from all participants were delivered to the Project Leader as agreed to in the IOC operation plan. The specific objectives of the Phase II field test were to: (a) investigate performance of relative humidity sensors over a substantial range of flight conditions; (b) assess differences between simultaneous measurements; (c) determine whether adjustments for systematic relative humidity measurement error would be feasible; and, (d) obtain information to examine day-night relative humidity differences and determine whether contamination of the relative humidity sensors occurs after passing through clouds.

PHASE II - Field Test. WMO Radiosonde Humidity Sensor Intercomparison, Sept. 1995
PHASE II - page 3
Table 1. Radiosonde types, manufacturer, and characteristics of the participating radiosondes flown in Phase II of the WMO International Radiosonde Relative Humidity Sensor Intercomparison are listed below. The MRZ-3 radiosonde of the CAO, Russian Federation was considered to be an anomalous radiosonde in that it did not use a pressure sensor and the temperature sensor mount was fitted with a second relative humidity sensor. Radiosonde
Name Manufacture
r Transmitte
r Frequency
MHz
Pressure Sensor
Thermistor Sensor
Relative Humidity
Sensor
VIS MK 2 VIZ Mfg Co. 403 Capacitive Aneroid
Resistive Carbon Hygristor
RS80-15LA Vaisala Co. 403 Capacitive Aneroid
Capacitive Capacitive Humicap
RS80-15LH Vaisala Co. 403 Capacitive Aneroid
Capacitive Capacitive Humicap
RS90 Vaisala Co. 403 Capacitive Aneroid
Capacitive Heated Capacitive
Intellisonde AIR Inc. 403 Capacitive Aneroid
Capacitive Capacitive
MRZ-3 CAO, Russian Federation
1782 None None 1 – Capacitive 2 - Goldbeaters
2 Test Plan and Schedule As in previous WMO radiosonde intercomparisons, the IOC requested the host facility to designate one person to act as the Project Leader. The Project Leader’s responsibilities are: to specify the test procedures that the participants agree to observe, conduct the final analysis, and prepare the results for publication by WMO. It was agreed by the participants that any observation reaching the 50-hPa pressure level would be considered successful. This pressure level was acceptable because present day relative humidity sensors normally can not measure to low pressures. Each participating organization also was to appoint a Team Leader responsible for the performance of their group, and to provide coordination with the other groups. The Project Leader, with the cooperation of the Team Leaders, organized and scheduled the day-to-day balloon flights. To facilitate smooth and on-time performance a Balloon Launch Manager, assigned by the Project Leader and an employee of the host facility, insures that the balloon and flight train are correctly prepared and that each team's radiosonde is ready for flight at the designated time. Within 30 to 60 minutes following each balloon flight the NASA Data Coordinator transmitted each participants data to the central computing facility via the Wallops Island internal network where knnowledgable personnel reviewed the submitted measurement files for completeness, provide quality checking, arrange the data into a uniform format and, provide plots of each participants data to the respective teams for final quality check. Prior to the first balloon flight it was agreed that only five radiosonde types would be simultaneously flown on the instrument platform. The platform was constructed of two Styrofoam cross arms positioned 40 meters below the balloon allowing all radiosondes to obtain measurements at the same level. All instruments were suspended approximately 1 meter below the platform. Thus, the radiosondes made measurements at the same time and in the same place in space, except for the nominal horizontal separation between radiosondes of about 2.5 meters. A small parachute was necessary to allow safe descent of the instruments

PHASE II - Field Test. WMO Radiosonde Humidity Sensor Intercomparison, Sept. 1995
PHASE II - page 4
after balloon burst. A parachute is necessary on all free-flying balloons to meet the safety regulations of the United States Federal Aviation Administration (FAA). It was also necessary that the balloon configuration (total payload weight, individual instrument weight and size or density, number of instruments, etc) meet FAA regulations for unmanned, free-flying balloons (FAA, 1986). Four balloon flights were scheduled each day, weather permitting, two during daylight and two during nighttime. Observations were not be made in heavy precipitation because of potential sensor contamination, nor when surface winds were high and would inhibit an effective and safe launch of the balloon. The balloon release schedule and types of radiosondes flown is given in Table 2. 3 Radiosonde Description and Performance Brief descriptions of the participating radiosondes are provided below. This information is brief since it is expected that Members are generally familiar with operational radiosonde instrumentation. Additional details may be obtained from each participating manufacturer. a. Atmospheric Instrumentation Research, Inc. (AIR) – Intellisonde
The Atmospheric Instrumentation Research, Inc. (AIR) Intellisonde transits at a frequency of 403 MHz using digital transmission technology. Relative humidity is obtained using a hygroscopic polymer-type sensor. The sensor is a capacitive type encapsulated in polymer and is protected from direct water contact by a Teflon shield. As the relative humidity changes the capacitance of the sensor changes. The pressure sensor is a capacitive aneroid cell and a small aluminized bead thermistor was employed to measure temperature. The radiosonde is powered by a 9 volt alkaline or, optionally, a lithium battery. Wind data are not available from the Intellisonde. b. Russian Federation - (MRZ-3 with Capacitive and Goldbeaters Skin)
The Central Aerological Observatory of the Russian Federation brought MRZ-3 radiosonde instruments to Wallops Island. This radiosonde was modified to accommodate two relative humidity sensors. One, a capacitive relative humidity sensor and the second, goldbeaters skin. Goldbeaters skin has been used for many decades in a number of countries, and to some extent is still used today in Russia and China. Because of its large size, it was not practicable to transport the Russian ground station to Wallops Flight Facility. Alternatively, a receiver and data converter were brought to Wallops Island allowing measurements to be obtained from both sensors. The radiosonde transmitter frequency was 1790 MHz. Temperatures were not available from these instruments because the capacitive relative humidity sensor was substituted in the channel used for the temperature sensor. In order to convert the signals received into humidity data, temperature measurements were used from another participating radiosonde; possible because elapsed time was a common comparison parameter for every flight. The Russian radiosonde used a small lead-acid battery for power. c. Vaisala Co. – RS80-15LA and RS80-15LH
Typically, the RS-80 radiosonde samples pressure, temperature, relative humidity, and wind at intervals of approximately 1-2 seconds; 2-second intervals were provided for this intercomparison. The relative humidity sensor is a capacitive type with a range of 10 to 100 percent. Two RS80 radiosondes were included in the intercomparison, each employing a different humidity sensor. The RS80-15LA employs the A-humicap and the RS80-15LH the

PHASE II - Field Test. WMO Radiosonde Humidity Sensor Intercomparison, Sept. 1995
PHASE II - page 5
H-humicap. The L inidicates that the wind information is obtained using the navaid signal, LORAN-C. The A- and H-humicap sensors are slightly different but, as determined from the Phase II results held in 1985 their performance is similar. The pressure and temperture sensors are capacitive types with the aneroid cell measuring between 1060 hPa and 3 hPa and the temperature sensor measuring between 60°C and -90°C. Corrections to the temperature measurements in the form of ‘look-up’ tables keyed to atmospheric pressures and solar elevation angles, are incorporated in the data reduction software. A water activated battery is used, and a frequency of 403 MHz is used. d. Vaisala Co. – RS90
The Vaisala RS90 humidity sensor is the same type of polymer material as the H-humicap. There are two sensors, each one-half the size of the nominal RS80 H-humicap, that are alternately heated and cooled during flight to eliminate moisture that may form on the polymer surface as the radiosonde goes through clouds and moisture layers. The heating function usually is discontinued when ambient temperature reaches -40ºC. The temperature sensor is a capacitive type but is a different design than the type used with RS80 radiosondes. It is a faster responding sensor through the use of fine wires acting as capacitive plates. The pressure is measured with a capacitive-type aneroid cell. The transmitter frequency is 403 MHz. e. VIZ Manufacturing Co. – MK 2 Radiosonde
Pressure, temperature, and humidity measurements from the VIZ MK-2 radiosonde are transmitted digitally approximately every 1.3 seconds over a frequency of 403 MHz.The carbon-coated relative humidity sensor, called 'hygristor', is used with the MK2 radiosonde and is smaller than the older type sensor but still operates on the same resistance principle, whereby resistance increases as atmospheric moisture decreases. The hygristor is a polymer strip coated with a carbon slurry. The spaces between the carbon molecules increase or decrease as the relative humidity changes (i.e., as the number of water molecules change) leading to a resistance change. The hygristor is designed to provide measurements between 5 and 100 percent. A capacitive aneroid cell is used for the pressure measurement between 1050 hPa and 2 hPa. The temperature sensor is a shorter version (~2 cm long) of the white-coated (~4 cm long) resistive rod thermistor and measures between 50°C and -90°C. Resistance increases with decreasing temperature. It is now known (Schmidlin, 2002) that the short thermistor has a different radiation error than the long thermistor; operational corrections for either does not exist. A multi-thermistor method is available (Schmidlin, 1992) that is still being improved at this time. Wind direction and speed is obtained using the LORAN-C navaid technique. A 9-volt water-activated battery provides power to the radiosonde. All of the radiosondes performed well, however, it was not possible to place all of them on the balloon platform at the same time. The solution adopted was to stagger the placement of the instruments to allow the maximum number of comparison pairs to be obtained. Table 2 furnishes the dates and launch times of each balloon package, top altitudes, and lowest pressures reached. Additionally, the crosses indicate which radiosondes flew on any particular balloon flight.

PHASE II - Field Test. WMO Radiosonde Humidity Sensor Intercomparison, Sept. 1995
PHASE II - page 6
TABLE 2. Ballon release schedule for Phase II of Wmo Relative Humidity Sensor Comparison.

PHASE II - Field Test. WMO Radiosonde Humidity Sensor Intercomparison, Sept. 1995
PHASE II - page 7
4 Profiles and Analyses Between 8 and 26 September 1995, sixty-one balloons were released; two failed to reach 50 hPa, the established criterion for a successful balloon flight. Flights number 32 and 33 listed in Table 2, ended at the 64.1-hPa and 70.8-hPa pressure levels, respectively. Although not meeting the criterion for a successful flight, they, nonetheless, are used in our analysis. The following discussion include differences between relative humidity measurements made during balloon ascent and descent by the same radiosonde. Up and down profiles are reasonably good indicators of sensor sensitivity and repeatability. Results of a statistical analysis are also presented. Flight 4, at 0232+51 UTC on 9 September 1995, shown in Figure 1 is a particularly interesting study of vertical humidity structure. The profiles in Figure 1a display considerable fidelity. Although biases exist between the profiles, the perturbations follow each other quite well. The first recorded measurement of humidity, approximately two seconds after balloon release, disagreed with the surface observed relative humidity of 89 percent. Two seconds after release humidity measurements of 80 and 94 percent were reported by the humicaps and the hygristor, respectively. This raised the question, what is the proper radiosonde value that should be the used at release of the radiosondes? The first record of the radiosonde flight data, or the observation obtained from the surface equipment? In order to avoid reconciling very awkward differences between the surface and the first recorded radiosonde measurement the recorded radiosonde measurements at the time of balloon release would provide improved continuity to the measured profiles. This assumes that the radiosonde was properly conditioned to the ambient environment. Instrumentation necessary to remotely measure temperature and relative humidity at 10 meters above the ground was installed at the top of the balloon inflation shelter. Although the radiosondes and remote sensors were separated horizontally, the 10-meter height allowed comparisons to br made immediately following balloon release. The location of the remote instrument was an obvious choice since the rise rate of the balloon is typically 5 meters per second. The humicap measurements were approximately 3 to 9 percent lower than those measured by the remote surface observing equipment, while the RS90 measurements were within 1-2 percent. Using the same assessment method as above, the VIZ hygristor indicated 3 to 5 percent more relative humidity than the observation at 10 meters. This seemed to occur when the ambient humidity was above about 70 percent. At relative humidity values below 70 percent the hygristor recorded values of up to 3 percent lower than the surface observing equipment. AIR, Inc. capacitive sensor had the largest dry bias, up to 11 percent lower than the surface equipment.

PHASE II - Field Test. WMO Radiosonde Humidity Sensor Intercomparison, Sept. 1995
PHASE II - page 8
9 September 1995 02:32:51 UTC
Figure 1. (a) Comparison of relative humidity profiles of the Vaisala A- and H-humicaps abd the VIZ hygristor as a function of elapsed time in minutes; (b) comparison of mixing ratio on a linear scale as a function of altitude showing the saturation mixing ratio from the Vaisala temperature measurements; (c) similar to (b) except VIZ temperatures used to define saturation mixing ratio. Table 3. Average differences between first recorded RH and Surface RH observations. The first radiosonbde RH occurs at two seconds after balloon release. AIR, Inc.Intellisonde recordes the first RH at four seconds.
Table 3 provides more comparative information about the relative humidity measurements reported 2 seconds after balloon release with the surface observations measured at 10 meters. Figure 1a, shows that the relative humidity reported between minutes 2 and 4 by the the A- and H-humicaps, indicated approximately 96 percent relative humidity, respectively, while the hygristor indicated 100 percent. Although the VIZ reduction software limits the relative humidity measurements to 100 percent, it is likely that the hygristor measurement actually reached super saturation. The A- and H-humicap dry-bias also had been noted in earlier intercomparisons. When the atmosphere is dry, the hygristor usually reports less relative humidity than the humicaps, as observed near minute 25 in Figure 1a. However, the extremely dry hygristor value is probably an artifact of a VIZ software practice that adjusts the relative humidity values using a system of compensating coefficients.
R. H. Percent
VIZ Hygristor
Vaisala A-humicap
Vaisala H-humicap
Vaisala RS90
AIR, Inc. Capacitive
91-100 6 -4.7 -3 - -2.5 81-90 5.8 -6.3 -6.7 -0.3 -0.8 71-80 0.5 -9 -7 -3 -5.6 61-70 -2.6 -8 -7.2 -0.5 -9 51-60 -1.9 -7.5 -5 -1.3 -10.2

PHASE II - Field Test. WMO Radiosonde Humidity Sensor Intercomparison, Sept. 1995
PHASE II - page 9
Figure 1a also shows separation of the relative humidity measurements of the A- and H-humicaps near minute 45 of the flight (~240 hPa and -37°C), with the A-humicap reporting less humidity than the H-humicap. Furthermore, the slow drop of the relative humidity values above minute 45 shown by the Vaisala RS80 radiosondes suggests that the sensors may be ice coated. Mixing ratios for each of the radiosondes are examined in Figure 1b. The satruration mixing ratio curve was determined from the temperature and pressure measurements of the RS80-15LA radiosonde. Between the surface and 10 km altitude the mixing ratios did not reach saturation. Using the mixing ratio calculated with the RS80, which is our ‘working’ standard, even the hygristor-measured relative humidity, usually moist, does not reach saturation. This is unusual since the hygristor profile in Figure 1a touches 100 percent relative humidity on three occasions before 15 minutes after release has elapsed. On the other hand, when VIZ temperature and pressure measurements are used to derive the saturation mixing ratio, as in Figure 1c, the hygristor measurements not only reach saturation but in some cases, indicated super saturation. In fact, careful examination of the figure reveals that between 500 and 1000 meters even the RS80 A- and H-humicaps had exceeded saturation. The difference in the presentations of Figure 1b and Figure 1c is a result of different temperature and pressure measurements by VIZ and Vaisala radiosondes (Hooper, 1986; Schmidlin, 1988; Yagi et al, 1996). Another nighttime flight at 2347+09 UT on 20th September, 1995, Figure 2a, illustrates relative humidity profiles from the RS80 A-humicap, RS90, VIZ hygristor, AIR capacitive, and the Russian MRZ-3 capacitive and goldbeaters skin sensors. In this example the surface relative humidity was reported as 69 percent. Relative humidity, two seconds after balloon release, was reported to be 60 percent by the Vaisala A-humicap while the Vaisala RS90 reported 68 percent. The VIZ hygristor, reported 70 percent and the MRZ-3 capacitive and goldbeaters skin sensors reported 69 and 64 percent, respectively. As can be noted, the relative humidity values measured immediately after balloon release are different from the relative humidity values reported by the surface observation equipment. Relative humidity differences observed after release, i.e., at two seconds, indicated the RS80 A-humicap and the surface equipment report less humidity than the other sensors. The relative humidity profiles in Figure 2a converged to near 90 percent approximately six minutes after balloon release. Between 15 and 20 minutes, the VIZ hygristor and the RS90 reported about 98 percent relative humidity. However, near minute 23, a sharp reduction in the measured relative humidity occurred. The hygristor reported about 10-20 percent lower relative humidity than reported by the A-humicap. Near minute 23, Figure 2a, the hygristor continues to report the driest value, consistent with the presumed application of adjustments to the VIZ algorithm. Less relative humidity is measured when ambient relative humidity generally is below 30-40 percent.

PHASE II - Field Test. WMO Radiosonde Humidity Sensor Intercomparison, Sept. 1995
PHASE II - page 10
20 September 1995 23:47:09 UTC
Figure 2. (a) Comparison of RH sensors as a function of elapsed time; Comparison of mixing ratio from the sensors listed (Russian capacitive and goldbeaters skin not included) compared to the saturation mixing ratio from Vaisala temperature measurements against altitude. Figure 2a also suggests that at minute 34 and later (~230 hPa and -30°C) the amount of humidity recorded by all of the sensors starts to disagree, becoming increasingly further apart with altitude. After minute 34, the RS90 reports more relative humidity than the Vaisala RS80 A-humicap. After 45 minutes the AIR sensor reported approximately 7-10 percent less relative humidity than the RS90. The saturation mixing ratio curve in Figure 2b was determined using the Vaisala RS80-15LA temperature and pressure measurements. The mixing ratio diagram also indicates that the hygristor reported more humidity than the other radiosondes when the ambient relative humidity was above 70 percent. This is obvious between the surface and about 1.5 km and again between 4 and 5.5 km; however, the hygristor reports dryer relative humidity at other altitudes There is an indication in Figure 2b that the hygristor measurement exceeded saturation near 1 km. This appears to be an artifact resulting from the use of RS80 temperature and pressure measurements since the hygristor measurement never reached 100 percent. The saturation given by the hygristor measurement should be compared near minute four with the hygristor relative humidity profile in Figure 2a. Figure 3a contains daytime measurements from flight 31 made on 16 September at 2005+09 UTC. Relative humidity measurements between Vaisala RS80 A- and H-humicaps, VIZ

PHASE II - Field Test. WMO Radiosonde Humidity Sensor Intercomparison, Sept. 1995
PHASE II - page 11
hygristor, AIR capacitive sensor, and the Russian MRZ-3 capacitive and goldbeaters skin sensors are shown. AIR Intellisonde and Vaisala RS80 A-humicap measurements are similar from balloon release to about minute 24. The VIZ hygristor indicated more moisture than the other sensors from balloon release until approximately minute 18. Near minute 20 the hygristor momentarily reported less relative humidity than the other sensors, but again increased to higher values until near minute 33, when the hygristor sensed dryer humidity. Data from the hygristor ends near minute 50 and indications are that it has failed. The Russian capacitive sensor profiles are similar to the relative humidity profiles of the other sensors to approximately 22 minutes after balloon launch. After minute 23 the Russian capacitive sensor is noted to have an exceedingly dry bias relative to the other sensors, while the goldbeaters skin sensor continues to fit within the envelop of the other sensors to minute 30. Also at minute 22 the AIR capacitive sensor seems to have lost its sensitivity since it no longer imitates the perturbations shown by the other sensors. Sensor measurements were also examined immediately after balloon release. Unfortunately, the MRZ-3 did not record data for the first minute. The Vaisala humicaps and the VIZ hygristor reported relative humidity two seconds after balloon release while the AIR instrument first reported its first value at six seconds. The surface observed relative humidity was 75 percent. Two seconds after release of the instruments, the A- and H-humicaps reported 68 and 69 percent relative humidity, respectively, while the VIZ hygristor reported 80 percent. Comparison of ascending and descending relative humidity profiles measured with the same instrument is useful for appraising the sensors’ repeatability. Although not a normal operational practice, a limited number of descent observations were obtained. Figures 4(a-c) show only three upleg-downleg profiles. On 23 September 1995 at 2000+31 UTC; the ascent and descent data of the AIR capacitive, Vaisala A-humicap, and VIZ hygristor sensors are discussed. The measurements from these sensors were simultaneously obtained on the same balloon platform. It should be borne in mind that radiosondes typically do not descend over the same trajectory as their ascent so a true measure of repeatability is not expected. Nonetheless the similarity between the up and down profiles does provide a useful indication of repeatability. In the example, winds moved the balloon approximately 75 km east of the launch site. As Figure 4(a-c) shows, the relative humidity profiles have no similarity to each other below 300 hPa. After the sensors were immersed for tens of minutes in very cold, dry air it was expected that their response would improve, but as indicated the point where the ascent and descent measurements begin to agree occurs at different pressures.

PHASE II - Field Test. WMO Radiosonde Humidity Sensor Intercomparison, Sept. 1995
PHASE II - page 12
16 September 1995 20:05:09 UTC
Figure 3. Same as Figure 2. In the case of the AIR sensor, during descent, Figure 4a, above 400 hPa nearly similar performance is noted. It is interesting that the humidity measurements obtained with the AIR capacitive sensor between 150 and 20 hPa maintained a nearly constant 35-40 percent relative humidity, although during descent the relative humidity slowly decreased to about 18 percent at about 150 hPa, indicative of a poorly responding sensor. Figure 4b illustrates ascent and descent profiles from the Vaisala RS80 A-humicap. At the top of the flight (~20 hPa) the A-humicap relative humidity decreased to about 10 percent and maintained that value down to about 100 hPa before increasing to match the relative humidity measured during ascent. The VIZ hygristor measurements in Figure 4c, reported 0 percent relative humidity on ascent and descent, and exhibited noise as well. This condition may be due to the compensating coefficients invoked in the VIZ software. However, at pressures higher than 200 hPa the ascent and descent profiles show significant differences and tend toward saturation in the lower troposphere.

PHASE II - Field Test. WMO Radiosonde Humidity Sensor Intercomparison, Sept. 1995
PHASE II - page 13
23 September 1995 20:00:31 UTC
Figure 4. Comparison of RH profiles during upleg and downleg measurements. The ascending and descending measurements lead to speculation whether the relative humidity sensors are capable of accurately measuring humidity at pressures lower than about 200-300 hPa. Figure 4a, indicates that the AIR sensor’s ascent and descent measurements agree between the surface and approximately 300 hPa. Even considering that the up and down tracks are separated by 75 km or so, the agreement is good. There is a question, however, why did this sensor measure higher humidity on the ascent and less humidity on the descent? In fact, the same question should be asked of the Vaisala A-humicap at pressures lower than 200 hPa, in Figure 4b. Figure 4c suggests that the VIZ hygristor was very noisy at pressures lower than 250 hPa, but the in spite of the measured differences between the ascent and descent profiles, above 200-300 hPa this sensor may only be capable of measurements at higher pressures, i.e., higher temperatures. The failure of the humidity sensors to adequately measure at low pressures can be correlated with low atmospheric temperature. Temperatures near 300 hPa are approximately -32°C and temperatures near 200 hPa are about -37°C. This, and

PHASE II - Field Test. WMO Radiosonde Humidity Sensor Intercomparison, Sept. 1995
PHASE II - page 14
the earlier discussions (Figures 1-3), suggest that some of the current relative humidity sensors are not able to measure well at temperatures lower than approximately -35°C. For the most part, this is continues to be true in 2005. Since the 1995 intercomparison, adjustments to the Vaisala RS80 A- and H-humicaps have been developed, as well as the RS90 (Wang et al, 2002; Miloshevich, 2004), while these adjustments have found application in research, they have not been adopted for operational use bu weather services. 5 Statistical Results A simple approach describing differences observed between the various ralative humidity sensors would require an observation-by-observation discussion. This would necessarily be long, boring, and confusing. Alternatively, a statistical approach was employed. The analysis presented below was prepared with regard to the arbitrarily adopted ‘working’ standard relative humidity instrument allowing consistent comparisons of the sensors. The Vaisala RS80-15LA radiosonde was adopted as this working standard; another relative humidity sensor could have fulfilled the same purpose.This working standard should not be considered a reference radiosonde. Histograms comparing each sensor’s measurements with the RS80 A-humicap working standard are illustrated in Figure 5. These histograms were produced for the 0200 UTC release time at temperatures of 0ºC, -40ºC, and -60ºC. The A-humicap's variance was smaller than the other sensors which made it reasonably stable for judging the behavior of the other sensors. Nighttime observations were selected because heating effects from sunlight on the sensors’ supports would be different for each radiosonde. Nighttime comparisons should achieve more consistent results, although the effect of long-wave radiation error has not yet been considered. Listed on each panel in Figure 5 is the temperature at which the sensors were compared, the mean humidity difference determined from a Guassian fit, the standard deviation, and the name of the radiosonde or sensor being compared with the working standard. The arrowheads are included to indicate zero of the histogram so as not to confuse it with the different cells, nor mean difference. Figure 5a compares the VIZ hygristor with the Vaisala RS80 A-humicap at 0°C. The mean difference of -4.6 percent between these sensors, shown by the Gaussian curve, indicates that the hygristor reports less relative humidity. The standard deviation of the differences, 8.5 percent, is the smalllest value of the three temperatures cases shown in the figure. This suggests that the differences between the hygristor and A-humicap had large variation. Although not an intercomparison issue, the differences are seen to have a bi-modal distribution. These data have not been examined further to determine which sensor caused this variance. Two peaks are seen, one at 5 percent and a second, more major peak, at -9 percent relative humidity. Finally, in Figure 5a, the data, are not significantly skewed, and outliers are a minimum. At -40°C in Figure 5b the bi-modal distribution is still somewhat obvious and the distribution is negatively skewed. The difference, shown near -10 percent, is isolated from the bulk of the measurement differences. The Guassian indicates the mean difference is -11.9 percent, and outliers are not observed. At -40ºC the sensors begin to show a lack of response. At -60°C, Figure 5c, the distribution is vastly irregular, probably resulting from loss of measurement ability of both sensors at this low temperature.

PHASE II - Field Test. WMO Radiosonde Humidity Sensor Intercomparison, Sept. 1995
PHASE II - page 15
(a)
(b) (c)
(d)
(e) (f)
(g)
(h) (i)
(j)
(k) (l)
(m)
(n) (o)
- Figure 5. Histograms of RH distribution of various sensors compared to the RS80 A-humicap. Comparison with the RS80 H-humicap not shown. The distributions are given for 0ºC, -40ºC, and -60ºC.

PHASE II - Field Test. WMO Radiosonde Humidity Sensor Intercomparison, Sept. 1995
PHASE II - page 16
Figures 5d, 5e, and 5f, compare the RS90 with the RS80 A-humicap. At 0°C, Figure 5d, the relative humidity mean difference is 2 percent with the RS90 reporting slightly higher relative humidity. The agreement between the RS90 and the working standard is very good only indicating a slight bias; note, however, there is a suggestion of a bi-model distribution.The variation between these sensors is quite small suggesting good agreement and good repeatability. At -40°C the agreement between the RS90 and working standard is seriously skewed to the right suggesting a wet bias of the RS90. This bias was also reported in Wang et al (2002) and Miloshovich et al (2004) At -60°C, Figure 5f, the RS90 indicates 11 percent higher humidity than the working standard, but overall the agreement is not good at the lower temperature. The AIR Intellisonde compared with the working standard at 0°C, Figure 5g, agrees in the mean. By inference with Figure 5d, AIR is also in reasonably good agreement with the RS90. The standard deviation between the AIR and RS80 is relatively large, but smaller than shown in Figure 5a between VIZ and the strandard, indicating the AIR Intellisonde sensor’s measurements have greater variability than the RS90 and RS80. Although the difference between the Intellisonde and RS80A are the same at 0ºC and -40ºC, the standard deviation is larger at the lower temperature. The number of outliers is a contributor to the larger variance. It is interesting however, that the AIR Intellisonde measurements at -40ºC are in better agreement with the RS80 than is the RS90 with the RS80A. At -60°C the distribution is positively skewed with a mean difference of about 7-percent relative humidity. It is questionable whether the sensors are responding properly at the low temperature. The number of Russian MRZ-3 measurements available was small, 24 instruments only were available during the intercomparison. In spite of this, 21 pairs were compared with the Vaisala RS80 A-humicap and 18 pairs with the H-humicap as indicated in Table 2. Figure 5j illustrates the nighttime comparison between the MRZ-3 capacitive sensor and the A-humicap at 0°C. The outliers suggest that the MRZ-3 sensor might actually be reporting drier relative humidity than the A-humicap. This figure also indicates no mean difference between the measurements. The comparisons at -40°C and -60°C do not agree well and also are very different than the comparison at 0ºC. At -40°C the MRZ-3 capacitive sensor is negatively skewed. The goldbeaters skin measurements at 0°C in Figure 5m, indicate a mean difference of about 12 percent. In Figure 5n, the paired differences are similar to the differences shown in Figure 5m. A bi-modal distribution is evident but the bulk of the mean relative humidity differences is, once again, about 12 percent. The paired differences at -60°C, shown in Figure 5o, lacks agreement suggesting that goldbeaters skin performs poorly at cold temperatures. The pattern presented at the three temperatures is clear. At low temperature, humidity measurements are difficult to obtain with great accuracy. Thus,as the temperature decreases, disagreement between relative humidity sensors increases indicating a loss of the sensors' sensitivity. The results of the RS80 H-humicap measurements are not shown in Figure 5 because of its close similarity with measurements of the A-humicap.

PHASE II - Field Test. WMO Radiosonde Humidity Sensor Intercomparison, Sept. 1995
PHASE II - page 17
Figure 6. Nighttime measurements comparing all RH sensors against selected standard measurements adopted for the intercomparison discussion. Upper panel represent mean RH differences at ambient temperatures between 25ºC and -45ºC. Lower panel is the standard deviations of the RH differences. A comparison of measured mean relative humidity differences vs a range of temperatures for nighttime flights is shown in Figure 6. Differences were calculated from 25°C to -45°C at 5°C intervals. Standard deviations are also presented. The analysis was not made at temperatures lower than shown in the figure. The nighttime relative humidity mean differences as a function of temperature and standard deviations of all sensors are shown in Figure 6. At temperatures above 10°C all sensors reported higher relative humidity than the working standard. The Vaisala RS80 H-humicap whose measurements are quite similar to the chosen standard is an exception. Differences between the Russian MRZ-3 radiosonde’s goldbeaters skin and the Vaisala RS80A-humicap showed goldbeaters skin to differ by about 5 percent at 20°C and as the temperature decreased, the difference increased to about 15 percent at -25°C, similar to the increase shown between Figures 5n and 5o. The RS90, RS80 H-humicap, and AIR Intellisonde capacitive sensors agreed with the working standard within 5 percent between 25°C and -40°C. The RS80 H-humicap differed by about 1 percent to -35ºC. The difference between the RS90 and RS80 A-humicap increased to approximately 10 percent at -45°C, while the difference

PHASE II - Field Test. WMO Radiosonde Humidity Sensor Intercomparison, Sept. 1995
PHASE II - page 18
between the H-humicap and A-humicap increased to 7 percent at -45°C. The Russian MRZ-3 capacitive sensor also agreed within 5 percent of the A-humicap except at temperatures lower than -25°C where the difference decreased to -10 percent at -45°C. The hygristor measurements at 5°C and higher indicated higher relative humidity values than the RS80 working standard. At temperatures lower than 5°C differences between the hygristor and standard sernsor increased to -12 percent at -35°C. The standard deviation of the differences between the VIZ hygristor and the working standard was the largest and the H-humicap indicated the smallest standard deviation with the working standard. The RS90 relative humidity variation relative to the working standard measurement was 10 percent at -35°C. Figure 7 compares daytime relative humidity mean differences as a function of temperature. The Russian goldbeaters skin measured the largest difference from the working standard at temperatures lower than 0°C, while both the VIZ hygristor and AIR capacitive sensor measurements indicated greater than 10 percent. The AIR sensor consistently recorded lower relative humidity than the working standard. It is significant that the AIR sensor records lower humidity during the daytime and greater humidity during the nighttime, as seen in Figure 8. Apparently, there exists a diurnal bias of some consequence between day and night. This bias, may be a result from the heating of the sensor’s mounting arm. Between –5°C and –45°C, the measurements agreed within 5 percent of the RS80 A-humicap standard values, except at -45°C the where the RS90 indicated 6 percent higher relative humidity. The standard deviation between the H-humicap and the standard sensor is similar to the nighttime comparison shown in Figure 6, while the RS90 appears to have less variability during daytime. The standard deviations of the other radiosondes' measurements are grouped with a mean standard deviation of approximately 4-8 percent.

PHASE II - Field Test. WMO Radiosonde Humidity Sensor Intercomparison, Sept. 1995
PHASE II - page 19
Figure 7. Same as shown in Figure 6, except for daytime measurements. AIR capacitive and VIZ hygristor sensors agreed, both showed lower values than the standard. The hygristor measurements, however, indicated higher relative humidity than the working standard’s measurements at temperatures above 5°C. The Russian MRZ-3 capacitive sensor differs from the standard sensor’s measurement and slopes from approximately 10 percent higher than the standard at 25°C to 8 percent lower at -45°C. Differences between nighttime mean relative humidity measurements relative to ambient relative humidity are examined in Figure 8. Clearly, the VIZ hygristor measurements record lower values relative to the standard except at relative humidity higher than 60 percent. Figure 8 indicates that the hygristor reads considerably drier than the A-humicap at relative humidity lower than 60 percent. Above 60 percent the hygristor measured humidity rapidly increases. Below 90 percent, goldbeaters skin measures more relative humidity compared with the standard, but the difference is within 5 percent between 70 and 100 percent. The other radiosonde sensors, including the AIR capacitive sensor is in relatively good agreement with the working standard. The standard deviation of the nighttime data set will not be discussed.

PHASE II - Field Test. WMO Radiosonde Humidity Sensor Intercomparison, Sept. 1995
PHASE II - page 20
Figure 8. Nighttime measurements compared to standard test instrument adopted for this intercomparison. RH data are with respect to measured RH. Upper panel represents mean RH differences; lower panel standard deviations. Daytime relative humidity mean differences are shown in Figure 9 as a function of ambient relative humidity. The AIR Intellisonde capacitive sensor reads lower, in the mean, than the working standard at relative humidity lower than 50 percent. The VIZ hygristor relative humidity is consistently lower than the working standard, and Russian goldbeaters skin measurements suggest that the comments made about the nighttime results also apply during daytime. The RS90, and RS80 H-humicap agreed within 5 percent of the standard sensor. In particular, the H- RS90 and H-humicap are small, i.e., 2-4 percent. The other sensors indicate larger variances, i.e., approximately 6-10 percent.

PHASE II - Field Test. WMO Radiosonde Humidity Sensor Intercomparison, Sept. 1995
PHASE II - page 21
Figure 9. Same as Figure 8, except for daytime measurements. Observations when clouds were absent were examined with the results shown in Figure 10. Figure 10 clearly shows that mean differences of most of the sensors agreed to within 5-7 percent of each other except at -45°C. The exception is the goldbeaters skin sensor showing mean differences of nearly 15 percent. Of particular interest is the AIR capacitive sensor because of its very good agreement with the RS80 A-humicap sensor to temperatures as low as -45°C. humicap measurements are very close to the RS80 A-humicap. The standard deviations of the When clouds were present the mean differences have a larger spread than during clear skies. VIZ and goldbeaters skin had the largest differences overall. AIR capacitive, H-humicap, RS90, and the Russian capacitive sensors agreed with the standard sensor to within 5 percent The results of Figures 10 and 11 indicate that clouds have an important influence on sensor measurement response and accuracy. Furthermore, sensor mount design may incourage heating of the sensors from sunlight.

PHASE II - Field Test. WMO Radiosonde Humidity Sensor Intercomparison, Sept. 1995
PHASE II - page 22
Figure 10. All RH measurements compared with the adopted standard RH data relative to temperature during no-cloud conditions. Upper panel is mean RH differences and lower panel standard deviations.
Figure 11. RH differences relative to temperature during cloud-only conditions. Cloud cover is without regard to type. Upper panel is mean RH differences and lower panel standard deviations.

PHASE II - Field Test. WMO Radiosonde Humidity Sensor Intercomparison, Sept. 1995
PHASE II - page 23
6 Summary and Conclusions The WMO Radiosonde Relative Humidity Sensor Intercomparison was designed to examine sensor accuracies in laboratory chambers, to monitor differences through field comparisons, to review new sensor technology and recommend to national weather services and radiosonde vendors potential sensor improvements. This report identifies and discusses some of the more obvious radiosonde relative humidity sensor shortcomings. Sixty-one balloons, carrying 3-6 radiosonde instruments each, were flown from Wallops Flight Facility during the period of 8-26 September, 1995, in the second Phase of the relative humidity sensor intercomparison. A variety of radiosonde types, each with a unique humidity sensor was arranged on the balloon platform to obtain as many comparison pairs as possible. Individual relative humidity sensors disagreed with each other, however, the Vaisala RS80 A- and H-humicap sensors consistently reported, in the mean, nearly the same relative humidity values whenever flown together on the same balloon. It was noted that, although the relative humidity measurements between the Vaisala sensors were generally the same values, they tended to report different relative humidity at a pressure of approximately 200-250 hPa, with the RS80 H-humicap measurements reporting more relative humidity, i.e., generally at temperatures lower than –35°C. Similarly, the Vaisala RS90 indicated more relative humidity than the RS80A-humicap at low pressures. At low ambient relative humidity the VIZ hygristor measurements were lower by about 15 percent than the working standard RS80 A-humicap measurements. The histograms of Figures 5(a-c) indicate that at night, relative humidity measurement differences between the VIZ MK-2 carbon hygristor and Vaisala RS80 A-humicap are biased, with the hygristor measuring lower relative humidity values. At temperatures above 0°C the hygristor relative humidity measurements are higher, as shown in Figures 6 and 7. The AIR Intellisonde capacitive sensor performed nominally relative to the other sensors during nighttime, but reported consistently lower relative humidity than the standard sensor during daytime. Nighttime AIR and RS80 A-humicap measurement differences in Figure 6 are less than 5 percent, except at –45°C. During the daytime the AIR sensor reports 5-11 percent lower relative humidity than the A-humicap, as shown in Figure 7. Temperature is a parameter necessary for the conversion of engineering units to relative humidity values, suggesting that the diurnal difference in the relative humidity observed between Figures 6 and 7 might be related to day-night temperature differences of the sensor mount. The Russian MRZ-3 goldbeaters skin performance is reasonably good from the surface to about 600 hPa, but at lower pressures the measurements become less dependable and, for the most part, not usable. The MRZ-3 capacitive sensor worked well during nighttime, however, a bias of about 5 percent occurred at high temperatures and a negative bias of about 10 percent was found at a temperature of -45ºC. A similar bias appears in the daytime, except at high temperatures the bias is about 10 percent. The cause is thought to be the relative humidity sensor's sensitivity to temperature since the MRZ-3 sensor extended outside of the radiosonde case. In fact, only the VIZ sensor is located in a duct. Relative humidity measurements obtained from ascending and descending radiosondes were relatively similar between the surface and 200-300 hPa. The descent measurements correspond at approximately 300 hPa to measurements made on the ascent. This suggests that at pressures less than 300 hPa (i.e., at low temperatures) the sensors probably lost sensitivity. During some of the ascents it is probable that the sensors may also have become frozen, thus inhibiting reliable measurement. On the descent we suspect that the accumulated ice picked up during ascent apparently sublimated allowing recovery of sensor response. When

PHASE II - Field Test. WMO Radiosonde Humidity Sensor Intercomparison, Sept. 1995
PHASE II - page 24
differences in space and time between the ascent and descent trajectories are considered, the repeatability at pressures higher than 300 hPa is relatively good. The up-and-down measurement exercise suggested that the limit of present day relative humidity sensors is approximately 200-300 hPa, or the corresponding temperatures at these pressures. Perhaps a different mounting and/or exposure of the sensor on the radiosonde may improve measurement capability. The dry bias experienced by the Vaisala RS80 A-humicap after balloon release was also found in the RS80 H-humicap measurements. A more thorough and detailed examination of this dry bias is necessary, e.g., how long after instrument release does this bias persist. Given that this apparent dry bias is real then the differences between the sensors at higher temperature or higher ambient relative humidity could probably be reduced. Wang et al (2002) reported on the dry bias found in the RS80 humidity data of the TOGA-COARE test held in the central Pacific Ocean , and also developed an adjustment for sensor contamination and mis-calibration. Even so, the adjustments should be used cautiously especially in the upper troposphere. Miloschevich et al (2004) added additional information to the RS80 and RS90 methods of adjustment. Nevertheless, evan with the availability of djustments for the Vaisala RS80 and RS90 radiosondes, when ambient temperature is lower than -35°C there is still some level of uncertainty whether any of the sensors are reporting the correct relative humidity. After examining the relative humidity data from the intercomparison it is concluded that: 1. During any one of the 61 balloon ascents none of the sensors reported the same relative humidity. 2. The Vaisala RS80 A- and H-humicap radiosondes reported relative humidity values very close to each other, but analysis suggests that given the uncertainty present in either sensor neither the RS80A nor RS80H can be considered better than the other. 3. Within 2 seconds following release of the balloon (e.g., ~10 meters altitude) the capacitive sensors of the AIR and Vaisala RS80 A- and H-humicap radiosondes showed a dry bias of 7-9 percent, on average, compared with the surface observing equipment while the VIZ hygristor reported a moist bias of 3-5 percent. 4. At relative humidity values above about 70 percent, the VIZ hygristor reported higher relative humidity compared with the working standard sensor used for comparison and, at low ambient relative humidity less relative humidity. 5. Goldbeaters skin is a viable sensor at temperatures above 0°C but it responds very slowly. At pressures lower than about 600 hPa the goldbeaters skin no longer senses well. 6. Comparing the relative humidity measurements during clear and cloudy sky conditions the measurements from all of the sensors, except goldbeaters skin, grouped very closely together. There is an implication in the plotted data that there was a contamination problem when the sensors had experienced clouds during ascent.

PHASE II - Field Test. WMO Radiosonde Humidity Sensor Intercomparison, Sept. 1995
PHASE II - page 25
7. A final, and very important conclusion is that one must be careful accepting the absolute values of relative humidity measurements at temperatures lower than about -35 to -40°C. 7 Recommendations In view of what must be considered unacceptable agreement among the relative humidity sensors, recommendations are offered to manufacturers and weather services. If accuracies of the humidity sensors are to adequately meet the needs of users, the recommendations should not be overly burdensome to execute. On the other hand, improving the accuracy will require considerable effort and be costly, and may prove to be quite difficult and complex to accomplish. An amalgamation of manufacturers and users with the idea of designing better humidity sensor capability meeting present day radiosonde standards may prove advantageous to both groups.
a. Recommendations to Manufacturers 1. Design the relative humidity sensor mount to ensure the removal of, or inhibit, external influences, such as heating of the sensor mount from sunlight; reflections from the radiosonde case; or, other factors that could ventilation of the sensor. 2. Apply the actual temperature of the sensor, not the ambient temperature, to the processing of relative humidity. Some sensors already have temperature sensors imbedded, but new investigations into whether they perform properly is needed. 3. Review the relative humidity sensor manufacturing process paying special attention that coatings used are applied uniformly. 4. Take steps to determine relative humidity sensor response at higher and lower ventilation rates than the optimal 5 meter per second balloon rise rate. 5. Provide calibrations at relative humidity extremes using recognized procedures and include at least three additional calibration points between the extremes. Each calibration point might also be calibrated over a representative range of temperatures. 6. Considering that present sensor accuracies are not adequate, it becomes important to identify calibration standards that apply to every sensor. These should be traceable to a primary standard. Further, the characteristics of the standard used and procedures adopted should also be available to users. 7. It should be incumbent on manufacturers to make known changes to algorithms and also be responsible for providing updated software when instrument design or performance changes.
b. Recommendations to Weather Services 1. The procedure for reporting the necessary measured weather parameters at release of the radiosonde should be standardized. This should include all parameters, not just relative humidity. During the intercomparison it was learned that some observers used the first point

PHASE II - Field Test. WMO Radiosonde Humidity Sensor Intercomparison, Sept. 1995
PHASE II - page 26
reported by the radiosonde as the release record. Others used the independent surface observation as the first point of the radiosonde profile; occasionally the first reported record also alternated between surface observed data and radiosonde observed data. This should be identified as an important action item for purposes of observation quality and uniformity among all upper air stations. 2. Weather services should meet with manufacturers often to keep abreast of manufacturing changes, changes to transfer equations, and to provide feedback to the manufacturer of problems encountered in the field. Such problems would include, as a minimum, change of sensors, change in instrument performance, change of estimated accuracy, new documentation, etc. 3. It is also recommended that weather services and other users provide to manufacturers the accuracies desired to carry out various missions. Only by making these known to manufacturers in a timely manner can instrument performance be improved. It is known that some weather services specify accuracy requirements, others do not. 4. Review algorithms making sure that bias, arising from artificial adjustment of relative humidity measurements available for some radiosonde types, does not occur. Consider improving these algorithms. In addition, determine whether the variance of artificially adjusted measurements are comparable to all sensors, especially sensors used as references, for example the SNOW WHITE chilled mirror. 8 References Balagurov, A., A. Kats, and N. Krestyannikova, ,1998: Implementation and results of the
WMO radiosonde humidity sensors intercomparison (Phase I laboratory test). WMO Conf. on Meteorological and Environmental Instruments and Methods of Observation. Casablanca, Morocco. WMO Rep. 70, 181-184.
Elliott, W. P. and D. J. Gaffen, 1991: On the utility of radiosonde humidity archives for
climate studies, Bull. Amer. Meteor. Soc., 72, (10) pp 1507-1520. Hooper, A. H., 1986: WMO international radiosonde comparison Phase I, Beaufort Park, UK,
1984. WMO Instruments and Methods of Observations Report No. 28, 118 pp. Morrissey, J. F. and F. J. Brousaides, 1970:Temperature-induced errors in the ML-476
humidity data, J. Appl. Meteor., 8, 805-808. Brousaides, F. J. and J. F. Morrissey, 1974: Residual temperature-induced humidity errors in
the National Weather Service radiosonde, Final Report, USAF Report AFCRL-TR-74-0111, Feb. 1971, 39 pp.
FAA, 1986: Federal Aviation Regulations, Part 101, Moored Balloons, Kites, Unmanned
rockets, and unmanned free balloonbs. CFR Title 14, Subchaper F. Ivanov, A., A. Kats, S. Kurnosenko, J. Nash, and N. Zeitseva, 1991: WMO international
radiosonde comparison, Phase 3, WMO Instruments and Observing Methods Report No. 40, 135 pp.

PHASE II - Field Test. WMO Radiosonde Humidity Sensor Intercomparison, Sept. 1995
PHASE II - page 27
Miloschevich, L. M., A. Paukkunen, H, Vömel, and S. J. Oltmans, 2004: Development and
validation of time-lag correction for Vaisala radiosonde humidity measurements. J. Atmos. Oceanic Technol., 21, 1305-1327.
Nash, J., and F. J. Schmidlin, 1987: Final report of the WMO International Radiosonde
Intercomparison. WMO Report No. 30. 123 PP. Schmidlin, F. J., 1988: WMO International Radiosonde Intercomparison, Phase II, 1985:
Wallops Island, Virginia USA. WMO Report-Instruments and Observing Methods Report No. 29. 113 pp.
Soden, B. J., S. A. Ackerman, D. O'C. Starr, S. H. Melfi, and R. A. Ferrare, 1994:
Comparison of upper tropospheric water vapor from GOES, Raman lidar, and cross-chain loran atmospheric sounding system measurements. J. Geophys. Res., 99, 21005-21016.
Wade, C. G., 1994: An Evaluation of Problems Affecting the Measurement of Low Relative Humidity on the United States Radiosonde. J. Atmos. Oceanic Technol., 11, 687-700. Wang, J., H. L. Cole, D. J. Carlson, E. R. Miller, K. Beierle, A. Paukkunen, and T. K. Laine,
2002: Corrections of humidity measurement errors from the Vaisala RS80 radiosonde-Applications to TOGA COARE data. J. Atmos. Oceanic Technol., 19, 981-1002.
Yagi, S., A. Mita, and N. Inoue, 1996: WMO International Radiosonde Comparison - Phase
IV - Tsukuba, Japan, 15 February - 12 March 1993, Final Report, Instruments and Observing Methods Report No. 59, 130 pp.
___________________