world oil and natural gas situation and trends - fao.org · o despite heightened geopolitical...
TRANSCRIPT


Outline
Overview of recent commodity
price trends
Crude oil market developments
Oil and food commodities in the
context of CIS

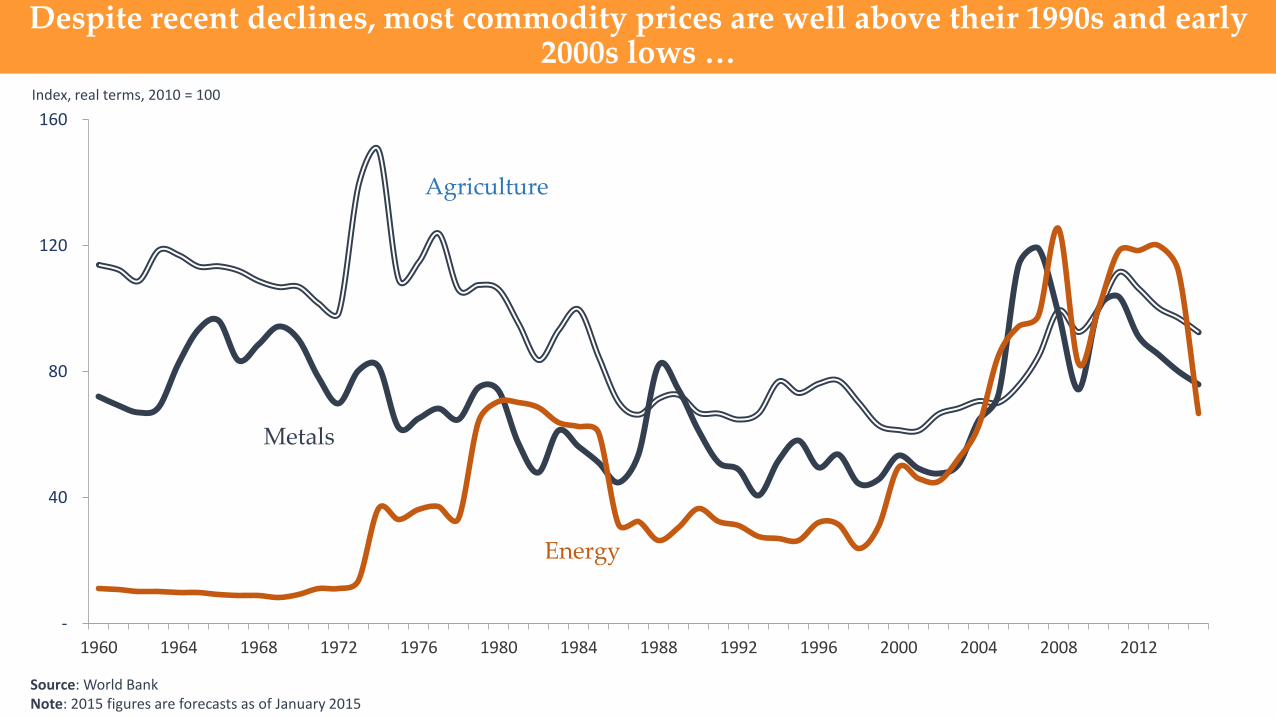
Despite recent declines, most commodity prices are well above their 1990s and early 2000s lows …
-
40
80
120
160
1960 1964 1968 1972 1976 1980 1984 1988 1992 1996 2000 2004 2008 2012
Source: World Bank Note: 2015 figures are forecasts as of January 2015
Agriculture
Metals
Energy
Index, real terms, 2010 = 100
20
60
100
140
180
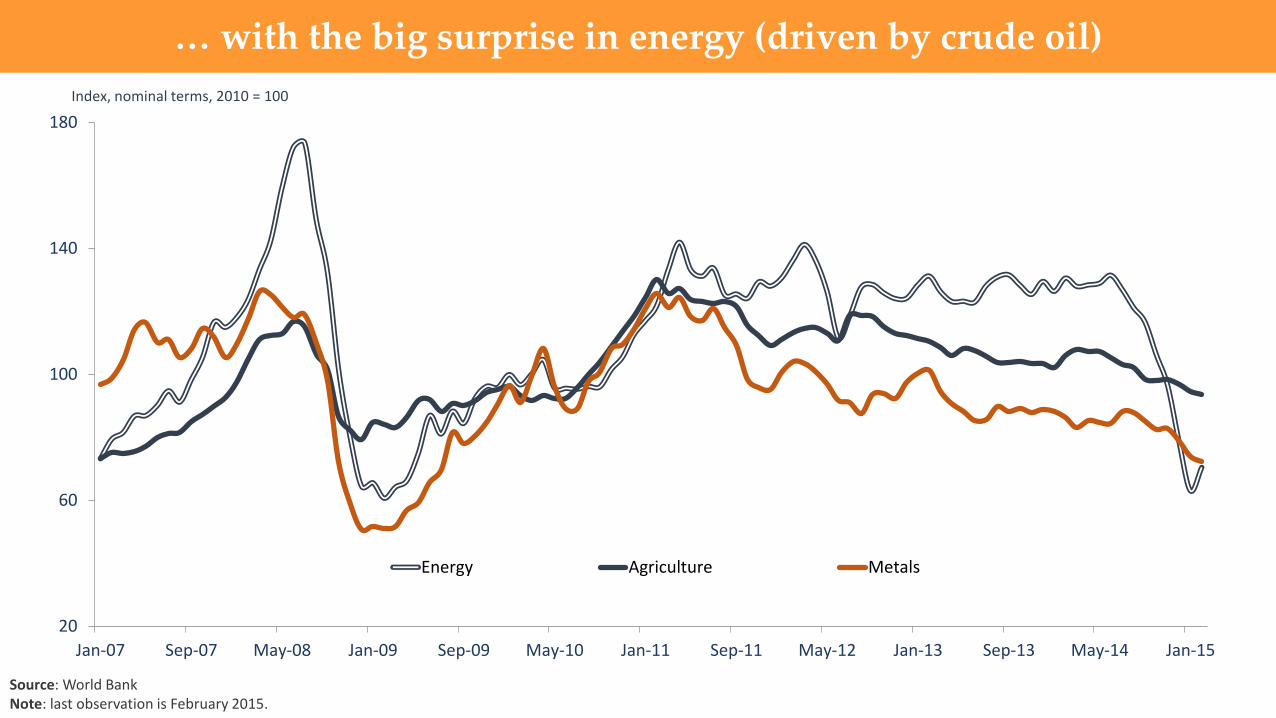
Jan-07 Sep-07 May-08 Jan-09 Sep-09 May-10 Jan-11 Sep-11 May-12 Jan-13 Sep-13 May-14 Jan-15
Energy Agriculture Metals
Index, nominal terms, 2010 = 100
… with the big surprise in energy (driven by crude oil)
Source: World Bank Note: last observation is February 2015.
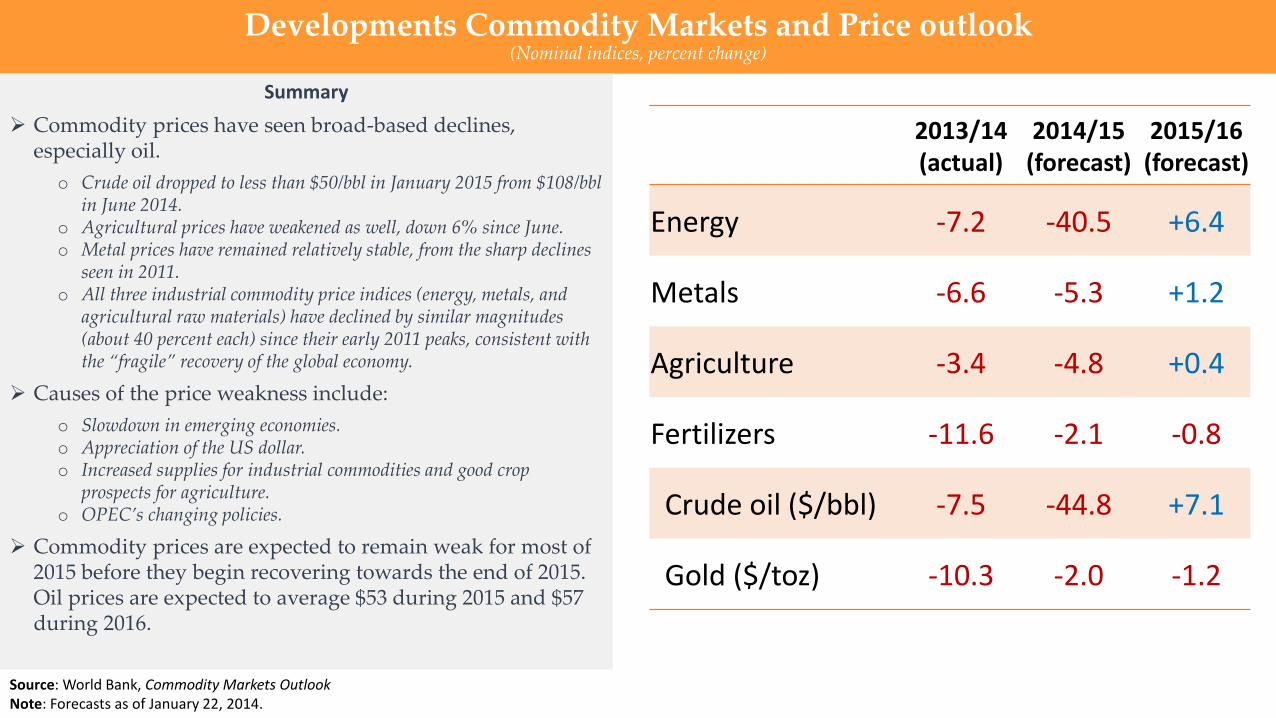
2013/14 (actual)
2014/15 (forecast)
2015/16 (forecast)
Energy -7.2 -40.5 +6.4
Metals -6.6 -5.3 +1.2
Agriculture -3.4 -4.8 +0.4
Fertilizers -11.6 -2.1 -0.8
Crude oil ($/bbl) -7.5 -44.8 +7.1
Gold ($/toz) -10.3 -2.0 -1.2
Developments Commodity Markets and Price outlook (Nominal indices, percent change)
Source: World Bank, Commodity Markets Outlook Note: Forecasts as of January 22, 2014.
Summary
Commodity prices have seen broad-based declines, especially oil.
o Crude oil dropped to less than $50/bbl in January 2015 from $108/bbl in June 2014.
o Agricultural prices have weakened as well, down 6% since June. o Metal prices have remained relatively stable, from the sharp declines
seen in 2011. o All three industrial commodity price indices (energy, metals, and
agricultural raw materials) have declined by similar magnitudes (about 40 percent each) since their early 2011 peaks, consistent with the “fragile” recovery of the global economy.
Causes of the price weakness include:
o Slowdown in emerging economies. o Appreciation of the US dollar. o Increased supplies for industrial commodities and good crop
prospects for agriculture. o OPEC’s changing policies.
Commodity prices are expected to remain weak for most of 2015 before they begin recovering towards the end of 2015. Oil prices are expected to average $53 during 2015 and $57 during 2016.

-
30
60
90
120
150
Jan-70 Sep-73 May-77 Jan-81 Sep-84 May-88 Jan-92 Sep-95 May-99 Jan-03 Sep-06 May-10 Jan-14
Source: World Bank
The 2014 oil price decline was the third largest in recent history …
OPEC abandons price targeting: Price drops -66.4% in 82 days
First Gulf war: Price drops -47.9% in 71 days
2008 financial crisis: Price drops -76.7% in 71 days
OPEC abandons price targeting: Price drops -51.2% in 83 days
US$/bbl, deflated by the US CPI (2014) terms
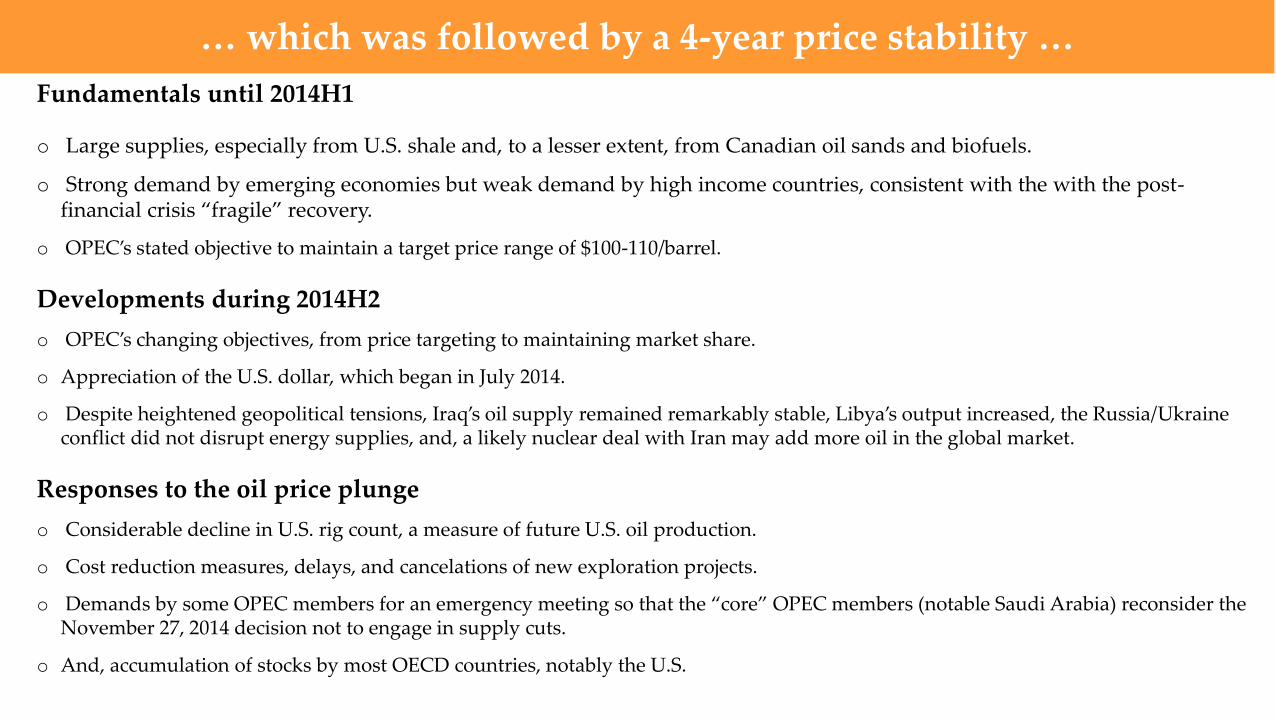
Fundamentals until 2014H1
o Large supplies, especially from U.S. shale and, to a lesser extent, from Canadian oil sands and biofuels.
o Strong demand by emerging economies but weak demand by high income countries, consistent with the with the post-financial crisis “fragile” recovery.
o OPEC’s stated objective to maintain a target price range of $100-110/barrel.
Developments during 2014H2
o OPEC’s changing objectives, from price targeting to maintaining market share.
o Appreciation of the U.S. dollar, which began in July 2014.
o Despite heightened geopolitical tensions, Iraq’s oil supply remained remarkably stable, Libya’s output increased, the Russia/Ukraine conflict did not disrupt energy supplies, and, a likely nuclear deal with Iran may add more oil in the global market.
Responses to the oil price plunge
o Considerable decline in U.S. rig count, a measure of future U.S. oil production.
o Cost reduction measures, delays, and cancelations of new exploration projects.
o Demands by some OPEC members for an emergency meeting so that the “core” OPEC members (notable Saudi Arabia) reconsider the November 27, 2014 decision not to engage in supply cuts.
o And, accumulation of stocks by most OECD countries, notably the U.S.
… which was followed by a 4-year price stability …

1.0
1.5
2.0
2.5
3.0
3.5
4.0
1990 1992 1994 1996 1998 2000 2002 2004 2006 2008 2010 2012 2014
Source: IEA, BP Statistical Review, and World Bank estimates.
… and brought in unconventional crude oil sources … mb/d
0.0
0.2
0.4
0.6
0.8
1.0
1.2
1.4
1990 1992 1994 1996 1998 2000 2002 2004 2006 2008 2010 2012 2014
6.0
7.0
8.0
9.0
10.0
11.0
12.0
1990 1992 1994 1996 1998 2000 2002 2004 2006 2008 2010 2012 2014
mb/d
Crude oil Production
Conventional (OPEC & non-OPEC)
Unconventional (mostly non-OPEC)
Existing Sources
Oil sands (Canada)
Biofuels (Global)
Shale oil (United States)
New Sources
Shale oil reserves (Russia, China,
Argentina, Libya)
Arctic exploration (U.S., Russia, Canada, Greenland, Norway)
Deep sea oil exploration (Brazil, Mexico, West
Africa)
mb/d of oil equivalent
Canadian oil production
U.S. oil production Global biofuel production
The new oil map

… with the U.S. oil production consistently surprising on the upside …
Source: International Energy Agency and World Bank Note: U.S. oil output includes biofuels
7
8
9
10
11
12
13
J A S O N D J F M A M J J A S O N D J F M A M J J A S O N D J F M A M J J A S O N D J F M A M J J A S O N D J F
2010 2011 2012 2013 2014 15
Solid lines: Actual production for the year
Dots: Projected production for the year on the specific month
2012
2013
2014
2011
Million barrels per day
2015
45
60
75
90
105
120
75
80
85
90
95
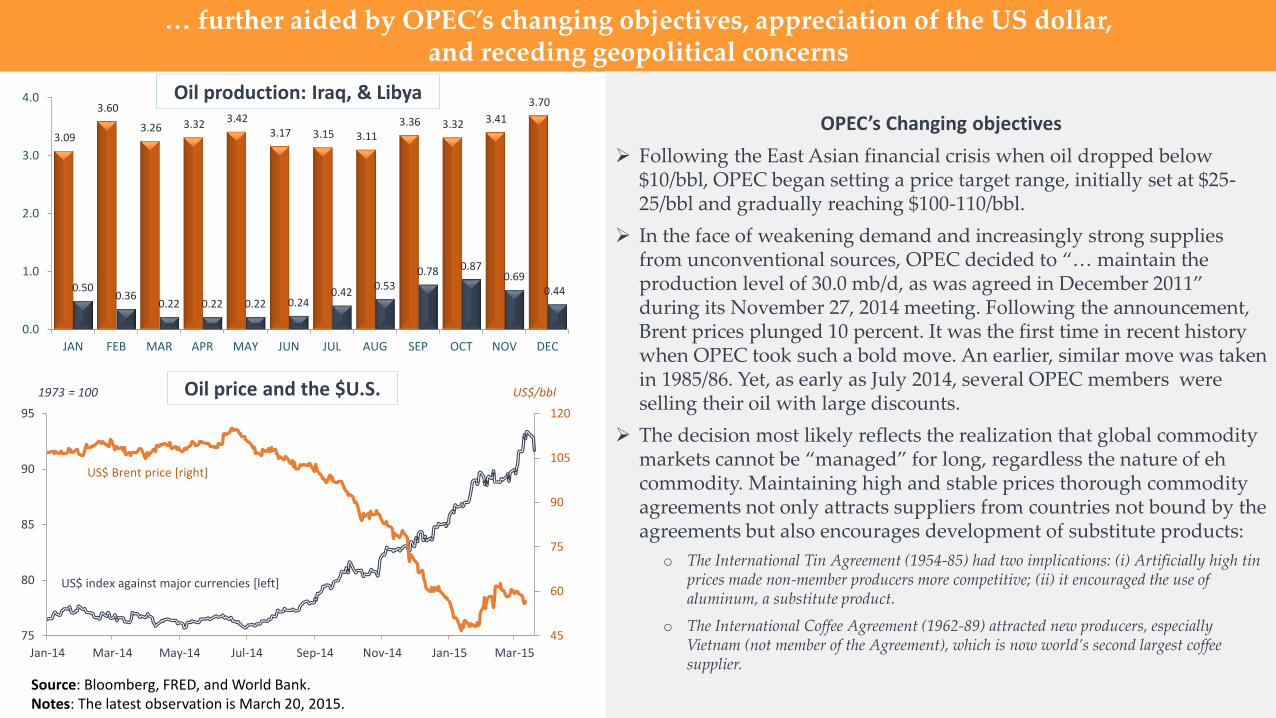
Jan-14 Mar-14 May-14 Jul-14 Sep-14 Nov-14 Jan-15 Mar-15
Source: Bloomberg, FRED, and World Bank. Notes: The latest observation is March 20, 2015.
1973 = 100
… further aided by OPEC’s changing objectives, appreciation of the US dollar, and receding geopolitical concerns
US$/bbl
US$ index against major currencies [left]
US$ Brent price [right]
3.09
3.60
3.26 3.32 3.42 3.17 3.15 3.11
3.36 3.32 3.41
3.70
0.50 0.36
0.22 0.22 0.22 0.24 0.42
0.53 0.78 0.87
0.69 0.44
0.0
1.0
2.0
3.0
4.0
JAN FEB MAR APR MAY JUN JUL AUG SEP OCT NOV DEC
mb/d
OPEC’s Changing objectives
Following the East Asian financial crisis when oil dropped below $10/bbl, OPEC began setting a price target range, initially set at $25-25/bbl and gradually reaching $100-110/bbl.
In the face of weakening demand and increasingly strong supplies from unconventional sources, OPEC decided to “… maintain the production level of 30.0 mb/d, as was agreed in December 2011” during its November 27, 2014 meeting. Following the announcement, Brent prices plunged 10 percent. It was the first time in recent history when OPEC took such a bold move. An earlier, similar move was taken in 1985/86. Yet, as early as July 2014, several OPEC members were selling their oil with large discounts.
The decision most likely reflects the realization that global commodity markets cannot be “managed” for long, regardless the nature of eh commodity. Maintaining high and stable prices thorough commodity agreements not only attracts suppliers from countries not bound by the agreements but also encourages development of substitute products:
o The International Tin Agreement (1954-85) had two implications: (i) Artificially high tin prices made non-member producers more competitive; (ii) it encouraged the use of aluminum, a substitute product.
o The International Coffee Agreement (1962-89) attracted new producers, especially Vietnam (not member of the Agreement), which is now world’s second largest coffee supplier.
Oil price and the $U.S.
Oil production: Iraq, & Libya
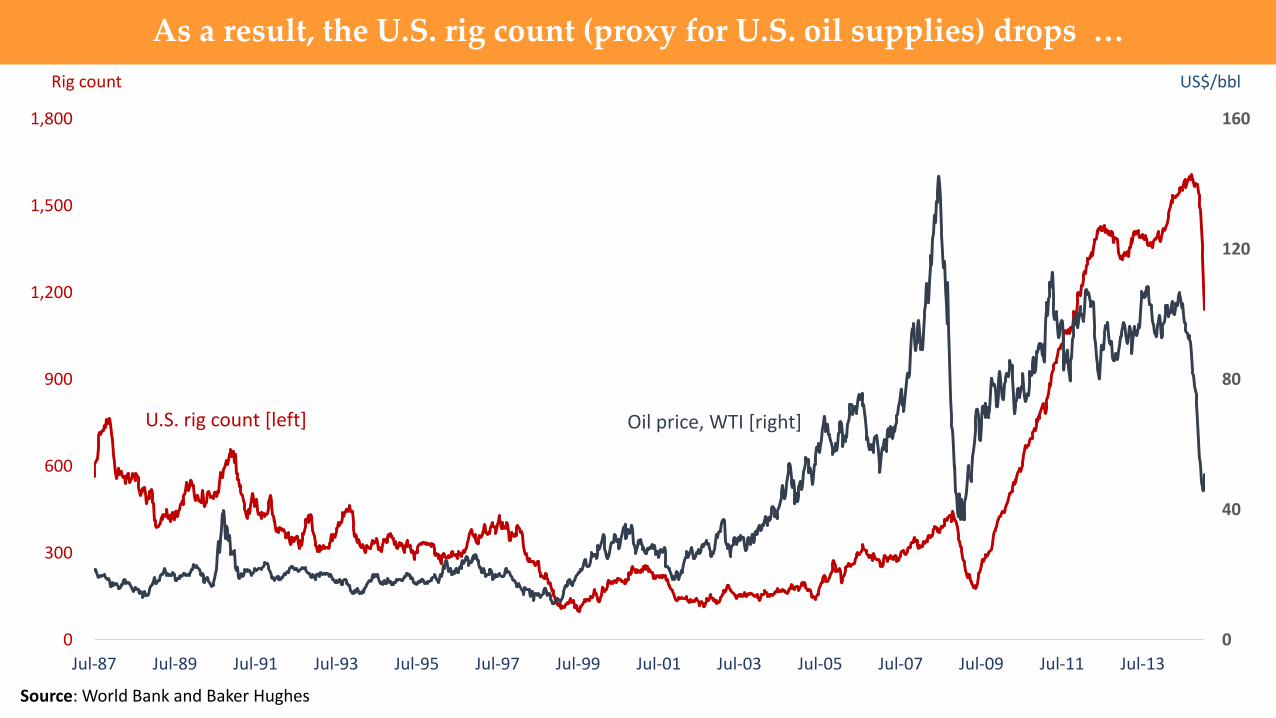
As a result, the U.S. rig count (proxy for U.S. oil supplies) drops …
0
40
80
120
160
0
300
600
900
1,200
1,500
1,800
Jul-87 Jul-89 Jul-91 Jul-93 Jul-95 Jul-97 Jul-99 Jul-01 Jul-03 Jul-05 Jul-07 Jul-09 Jul-11 Jul-13
US$/bbl Rig count
Oil price, WTI [right] U.S. rig count [left]
Source: World Bank and Baker Hughes

-
1
2
3
4
5
6
7
1985 1986 1987 1988 1989 1990 1991 1992 1993 1994 1995 1996 1997 1998 1999 2000 2001 2002 2003 2004 2005 2006 2007 2008 2009 2010 2011 2012 2013 2014
Source: World Bank Notes: Volatility is the standard deviation of the oil price (WTI) changes and is presented as a 60-day trailing window.
First Gulf war
2008 financial crisis
OPEC abandons price targeting
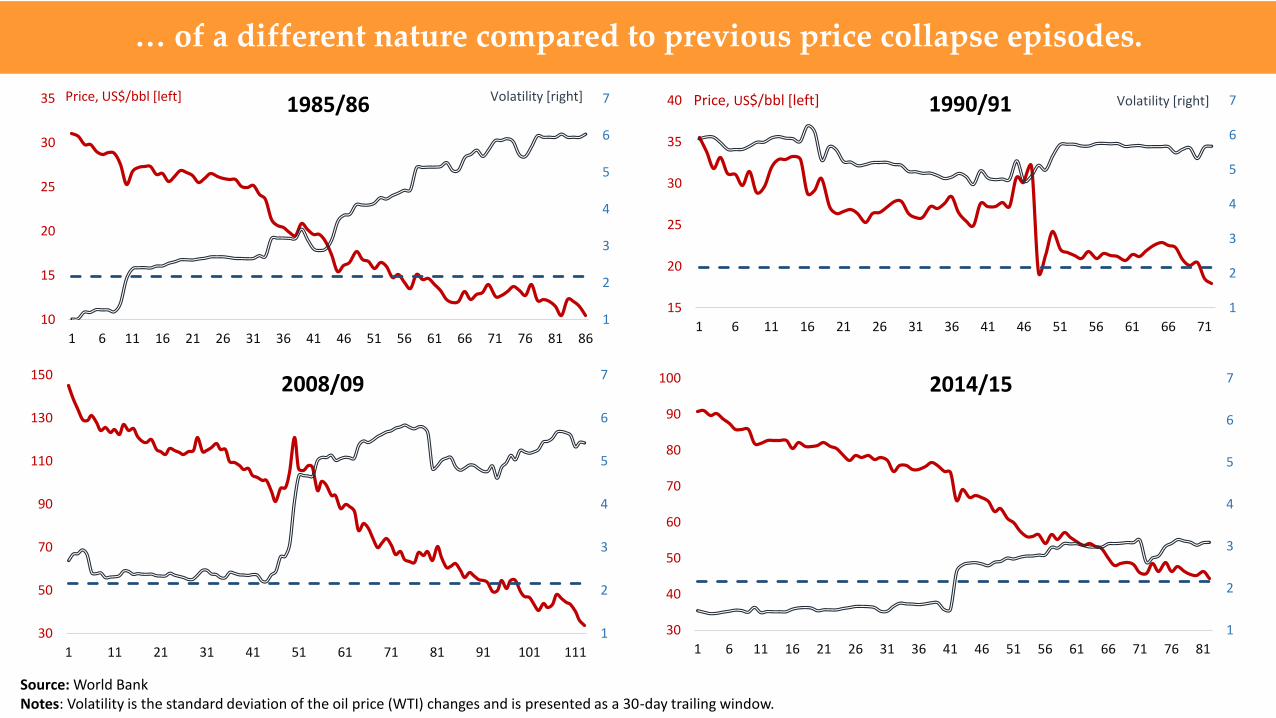
… in turn inducing higher price volatility, but less than earlier episodes …
OPEC abandons price targeting
1
2
3
4
5
6
7
10
15
20
25
30
35
1 6 11 16 21 26 31 36 41 46 51 56 61 66 71 76 81 86
1
2
3
4
5
6
7
15
20
25
30
35
40
1 6 11 16 21 26 31 36 41 46 51 56 61 66 71
Price, US$/bbl [left] Volatility [right]
1
2
3
4
5
6
7
30
50
70
90
110
130
150
1 11 21 31 41 51 61 71 81 91 101 111
1
2
3
4
5
6
7
30
40
50
60
70
80
90
100
1 6 11 16 21 26 31 36 41 46 51 56 61 66 71 76 81
1985/86 1990/91
2008/09 2014/15
Price, US$/bbl [left] Volatility [right]
… of a different nature compared to previous price collapse episodes.
Source: World Bank Notes: Volatility is the standard deviation of the oil price (WTI) changes and is presented as a 30-day trailing window.

Oil prices are much closer to U.S. natural gas and coal prices …
Source: World Bank Note: last observation is February 2015.
0
5
10
15
20
25
Jan-00 Jan-01 Jan-02 Jan-03 Jan-04 Jan-05 Jan-06 Jan-07 Jan-08 Jan-09 Jan-10 Jan-11 Jan-12 Jan-13 Jan-14 Jan-15
Crude oil (World Bank average)
Natural gas (US)
Coal (Australia)
US$/mmbtu

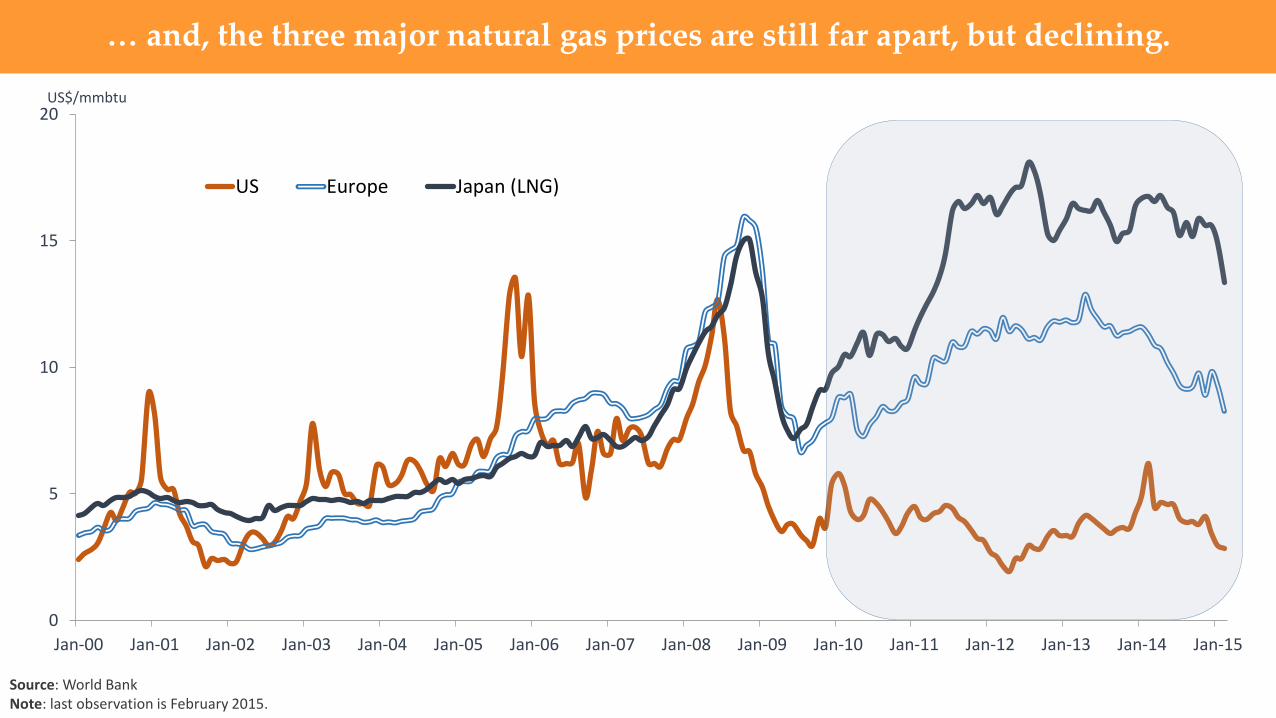
… and, the three major natural gas prices are still far apart, but declining.
0
5
10
15
20
Jan-00 Jan-01 Jan-02 Jan-03 Jan-04 Jan-05 Jan-06 Jan-07 Jan-08 Jan-09 Jan-10 Jan-11 Jan-12 Jan-13 Jan-14 Jan-15
US Europe Japan (LNG)
US$/mmbtu
Source: World Bank Note: last observation is February 2015.

0 3 6 9 12 15 18
Turkey
India
Brazil
China
EU-12
Canada
US
SSA
DEVELOPING
HIGH INCOME
WORLDManufacture
Agriculture
Source: Author’s calculations based on the GTAP database (shares) and Baffes and Etienne (2014) (elasticities) Notes: Elasticity estimates are based on an SUR reduced-form econometric model, 1960-2013 annual data.
Energy matters a lot to agriculture with food commodities responding strongly to oil prices
Share of energy component in 2007, percent
0.00 0.05 0.10 0.15 0.20 0.25 0.30 0.35 0.40 0.45
Palm oil
Soybeans
Maize
Rice
Wheat
Cotton
Transmission elasticity estimates
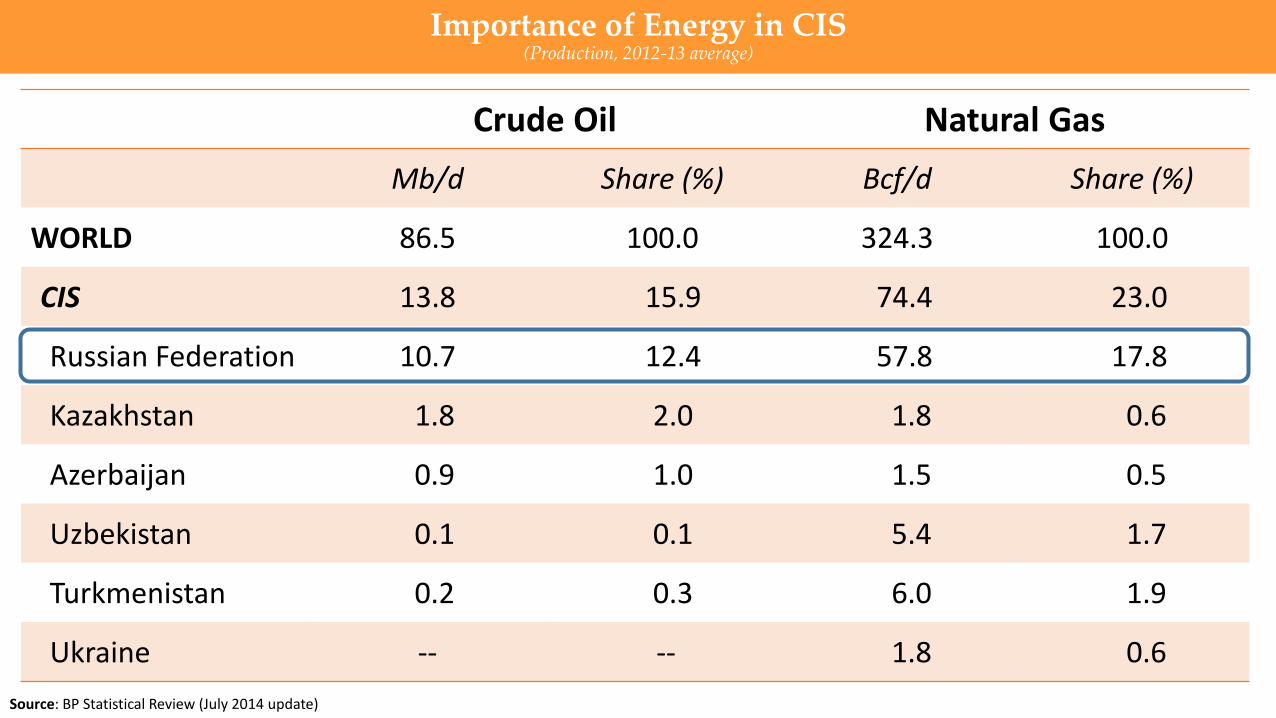
Importance of Energy in CIS (Production, 2012-13 average)
Source: BP Statistical Review (July 2014 update)
Crude Oil Natural Gas
Mb/d Share (%) Bcf/d Share (%)
WORLD 86.5 100.0 324.3 100.0
CIS 13.8 15.9 74.4 23.0
Russian Federation 10.7 12.4 57.8 17.8
Kazakhstan 1.8 2.0 1.8 0.6
Azerbaijan 0.9 1.0 1.5 0.5
Uzbekistan 0.1 0.1 5.4 1.7
Turkmenistan 0.2 0.3 6.0 1.9
Ukraine -- -- 1.8 0.6
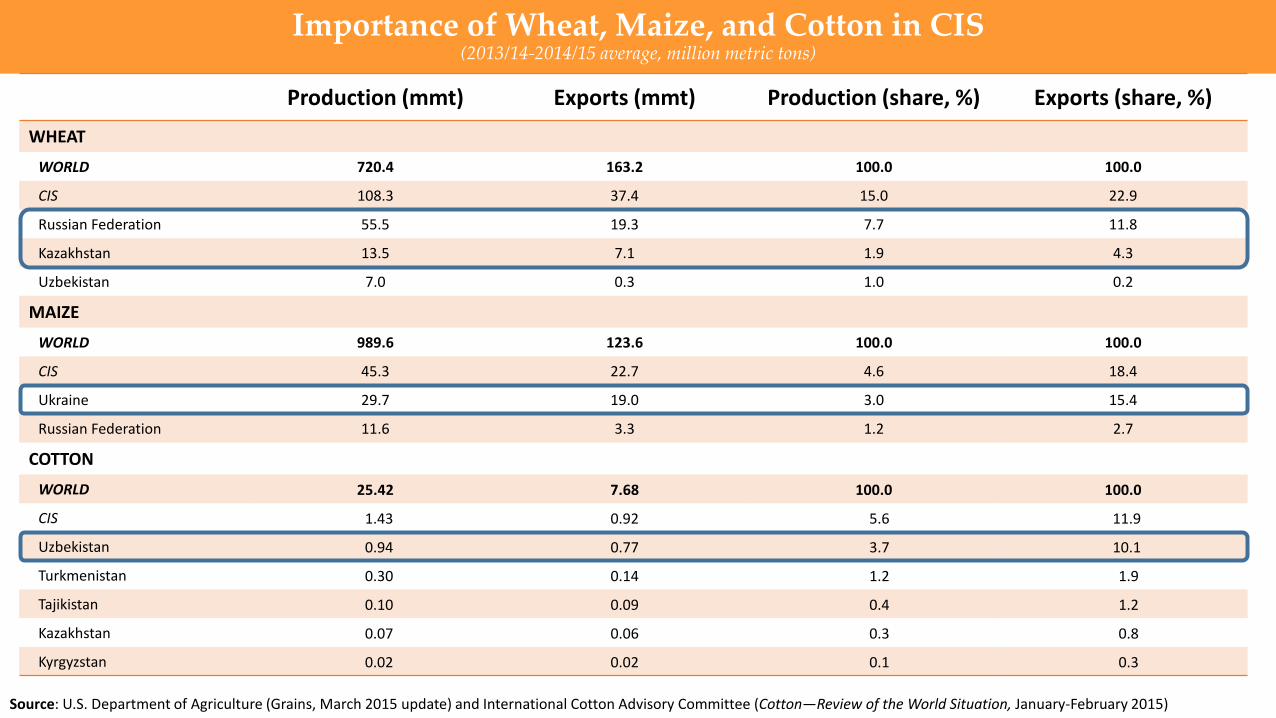
Importance of Wheat, Maize, and Cotton in CIS (2013/14-2014/15 average, million metric tons)
Source: U.S. Department of Agriculture (Grains, March 2015 update) and International Cotton Advisory Committee (Cotton—Review of the World Situation, January-February 2015)
Production (mmt) Exports (mmt) Production (share, %) Exports (share, %)
WHEAT
WORLD 720.4 163.2 100.0 100.0
CIS 108.3 37.4 15.0 22.9
Russian Federation 55.5 19.3 7.7 11.8
Kazakhstan 13.5 7.1 1.9 4.3
Uzbekistan 7.0 0.3 1.0 0.2
MAIZE
WORLD 989.6 123.6 100.0 100.0
CIS 45.3 22.7 4.6 18.4
Ukraine 29.7 19.0 3.0 15.4
Russian Federation 11.6 3.3 1.2 2.7
COTTON
WORLD 25.42 7.68 100.0 100.0
CIS 1.43 0.92 5.6 11.9
Uzbekistan 0.94 0.77 3.7 10.1
Turkmenistan 0.30 0.14 1.2 1.9
Tajikistan 0.10 0.09 0.4 1.2
Kazakhstan 0.07 0.06 0.3 0.8
Kyrgyzstan 0.02 0.02 0.1 0.3
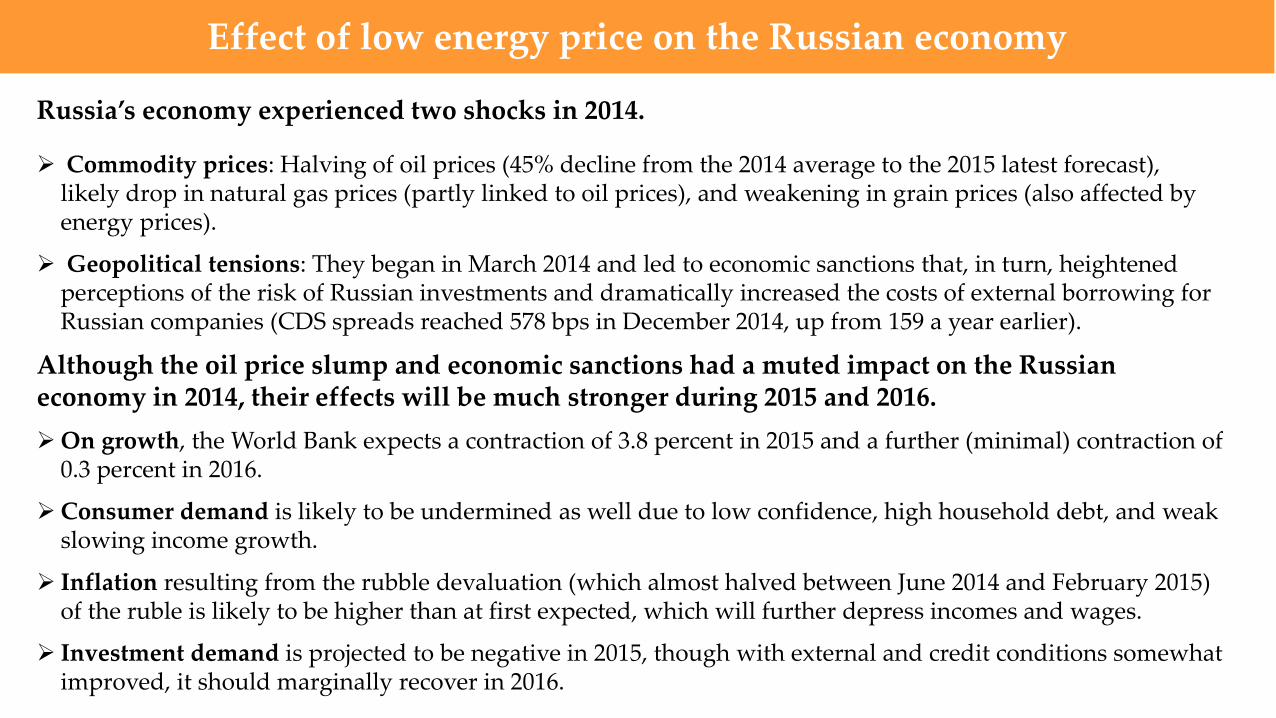
Russia’s economy experienced two shocks in 2014.
Commodity prices: Halving of oil prices (45% decline from the 2014 average to the 2015 latest forecast), likely drop in natural gas prices (partly linked to oil prices), and weakening in grain prices (also affected by energy prices).
Geopolitical tensions: They began in March 2014 and led to economic sanctions that, in turn, heightened perceptions of the risk of Russian investments and dramatically increased the costs of external borrowing for Russian companies (CDS spreads reached 578 bps in December 2014, up from 159 a year earlier).
Although the oil price slump and economic sanctions had a muted impact on the Russian economy in 2014, their effects will be much stronger during 2015 and 2016.
On growth, the World Bank expects a contraction of 3.8 percent in 2015 and a further (minimal) contraction of 0.3 percent in 2016.
Consumer demand is likely to be undermined as well due to low confidence, high household debt, and weak slowing income growth.
Inflation resulting from the rubble devaluation (which almost halved between June 2014 and February 2015) of the ruble is likely to be higher than at first expected, which will further depress incomes and wages.
Investment demand is projected to be negative in 2015, though with external and credit conditions somewhat improved, it should marginally recover in 2016.
Effect of low energy price on the Russian economy
The next edition of the World Bank’s Commodity Markets Outlook will be
published on April 22, 2015
www.worldbank.org/commodities