world retail banking report 2016
TRANSCRIPT


Contents
Preface 3
Executive Summary 4
Introduction – Evolving Toward a Digital Banking Ecosystem 5
Chapter 1: Improved Customer Experience but Non-Commensurate
Enhancement in Profitable Customer Behavior 6
Key Findings 7
Customer Experience Trends Upward 8
Positive Customer Experience Levels Make Gains 9
Profitable Customer Behaviors Lag 12
Summary 15
Chapter 2: Appeal of Fintech Continues to Expand 16
Key Findings 17
Fintech Firms Make Gains across Regions 18
Fintech Firms Gain Customer Trust 19
Fintech Firms Get More Referrals than Banks 21
Summary 23
Chapter 3: Defining the Future of Banking 24
Key Findings 25
Fintech Competition Takes on More Aggressive Edge 26
Partnerships Gain Greater Appeal 26
Evolving a Digital Banking Ecosystem 28
APIs Hold Promise 28
Roadmap to Create a Digital Banking Ecosystem 29
Summary 30
Appendix A: Country Snapshots 31
Appendix B: Customer Experience by Country 48
Methodology 52
About Us 54
Acknowledgements 55

3World Retail Banking Report 2016
This year, as we have for the past five, we polled thousands of retail banking customers around the world to gauge their attitudes toward their financial service providers. The most startling insights to emerge from this–survey—the largest of its kind in the–industry—have to do with the undeniable inroads fintech firms are carving into banking’s core businesses.
While fintech firms have been picking away at market share for some time, the nature of banking—highly regulated and deep-pocketed—has muted their impact. Our survey indicates that a tipping point is imminent, with fintech firms beginning to win overwhelming favor with customers compared to the entrenched banking industry. Turn to Chapter 2 of our report to find further details of how fintechs are attracting referrals, new customers, and even trust at a stunningly high rate.
Strategies that banks have traditionally employed to attract and retain customers are not proving strong enough against the emboldened fintech competition. We know this because a marked improvement in our Customer Experience Index (CEI) in 2016 failed to translate into greater levels of profitable customer behavior. See Chapter 1 of our report to find out how generally high levels of customer experience have resulted in only marginal improvements in measures like customer retention and referrals.
Especially striking was the finding that only 15.9% of customers said they would buy additional products from their bank. Clearly, the ingenuity and creativity that fintech firms are bringing to product development are starting to have an impact. Customers’ expectations are also augmented by the superior experience they are receiving with the technology in their day-to-day life. Customers are expecting much more in the way of innovation, but are not getting it from their banks.
In the face of increasingly aggressive fintech competition, banks know they need to do more than just improve the customer experience. Turn to Chapter 3 to find out the accelerated rate with which banks are now looking to partner with fintech firms. Partnering not only empowers banks in product development, but gives them a strong voice in defining the future of the digital banking ecosystem. Chapter 3 also outlines why banks need to think big—in terms of revamping their core systems and establishing a core competency in application programming interface (API)-based software–development—to support their ambitions in partnering with fintech firms.
There is little doubt that fintech is a game-changer. Banks have begun accepting that reality, but still need to move much more forcefully toward cementing their place in a more interconnected digital financial ecosystem. We have designed our report with the aim of making it easy for you to find answers to your biggest questions, as you navigate this dynamic environment. We hope you find it useful.
Preface
Anirban BoseHead, Global Banking & Financial Services
Capgemini (FS SBU)
Vincent BastidSecretary General
Efma

4
I. Customer Experience Rises, but Not Enough to Greatly Improve Profitable Customer Behavior
a. Retail banks improved their position on Capgemini’s Customer Experience Index by 2.9 points, registering advances across broad portions of the globe and through every channel. Banks in more than 85% of countries improved customer experience, with gains being highest in Central and Western Europe.
b. Younger customers registered lower levels of customer experience, raising concerns about the ability of banks to meet the higher expectations of this important segment. In nearly every region, Gen Y customers scored lower on the CEI than Gen X customers, who in turn scored lower than other age groups.
c. Despite the overall rise in CEI, profitable customer behavior improved only marginally, and was especially low in terms of additional purchases, pointing to the need for banks to continue to improve the customer experience, especially through more innovative product development.
II. Fintech Firms Gain Prominence
a. Nearly two-thirds of customers globally said they are using products or services from fintech firms, giving weight to the threat that banks may become disintermediated from their customers.
b. While customers have more complete trust in their banks, fintech firms are making gains; 87.9% or more of customers across all regions somewhat or completely trust their fintech providers.
c. Fintech firms are making positive impressions, causing customers to be much more likely to refer their fintech provider (54.9%) compared to their bank (38.4%).
d. Less than one-quarter of banks said they have an advantage over fintech firms in their ability to innovate or move nimbly.
III. Fintech Partnerships Will Define the Future of Banking
a. The vast majority of banks (87.1%) believe their infrastructures are not adequate to support the digital banking ecosystem of the future, giving momentum to the increasingly aggressive competition from fintech firms.
b. Nearly two-thirds of banks view partnerships as the most effective way of responding to the growing fintech threat.
c. To get the most from their fintech partnerships, banks will need to embrace APIs and begin laying the groundwork to revamp their core systems.
d. Banks will need to navigate the transition to fintech partnerships and API-based software development with care, to ensure they remain relevant in the evolving digital banking ecosystem and integral to customer relationships.
Executive Summary

5World Retail Banking Report 2016
Introduction – Evolving Toward a Digital Banking Ecosystem
Banks overwhelmingly agree that their core systems are not able to support the coming evolution of banking into an inter-connected digital financial services ecosystem. In response, they are exploring new approaches to innovation involving various levels of partnership with fintech firms.
The rise of fintech firms is undeniable, but just how widespread is its reach? We found nearly two-thirds of customers are using fintech products or services. Further, the level of customer trust in fintech firms is very high across all regions, and customers are more likely to refer their fintech provider over their bank.
Globally, banking industry witnessed an increase in the CEI by 2.9 points, with improvements occurring in 85% of the countries surveyed. This overall improvement, however, translated into only marginal gains in profitable customer behaviors, such as retention, referrals, and cross-sales.
Our annual rankings of global customer experience allows executives to track bank performance by individual country over time. Major shifts in the rankings occurred this year, with Japan recording the highest increase in the Customer Experience Index and Spain having the steepest fall, prompting big changes at the top and bottom of the overall ranking.
Assess current levels of customer experience
Determine the impact of improved customer experience
Gauge the true influence of fintech competitors
Take stock of their ability to manage the fintech threat
Get up to speed on the most effective responses to fintech’s advance
Several banks are embracing the open architecture of APIs to ensure ongoing dialogue with leading-edge fintech product developers. They are also exploring pathways to transforming their core systems, which will be fundamental to preparing for the digital banking ecosystem of the future.
Retail banks have been eyeing the steady advance of fintech competitors for some time now. With fintech’s momentum gaining, there is greater need than ever before for banks to develop an action plan that ensures them a central role in an increasingly digital and interconnected world. Please refer to the data and insights gathered in this report as an aid in devising your strategic response in this increasingly competitive terrain.
The comprehensive survey data in this report, gathered from polls of 16,000 customers in 32 countries, as well as over 140 industry executives around the world, is designed to assist banks in understanding the current competitive landscape and mapping out their strategic responses. The information in this report will help banks to:

Improved Customer Experience but Non-Commensurate Enhancement in Profitable Customer Behavior

7World Retail Banking Report 2016
Key FindingsThe Capgemini Customer Experience Index showed marked improvement in 2016, drawing momentum from almost all regions of the globe.
� More than 85% of countries witnessed an increase in their CEI scores, with the largest gains occurring in Japan, Netherlands, and Sweden.
� Latin America, pulled down by the performance of Mexico and Argentina, was the only region to experience a decline in CEI.
� The ranking of the top-five countries based on CEI shifted significantly, with Netherlands, United Kingdom, and Switzerland making large leaps, edging out the United States.
Levels of positive customer experience shifted by varying degrees around the globe, depending on geography, demographics, and channel usage.
� European banks, likely tapping into pent-up demand for consumer credit, were the most successful at boosting positive customer experience.
� Gen Y and Gen X customers emerged as areas of concern, given their lower levels of positive experience.
� Customers reported growth in positive experiences through every channel, with mobile quickly catching up with the Internet and branch channels.
� Customers with positive experiences were significantly more likely to have higher trust in their primary bank (71.0%), versus 32.0% of those with negative experiences.
Despite the overall rise in CEI, profitable customer behavior improved only marginally.
� Only 55.1% of customers said they are likely to stay with their bank for the next six months, an increase of 1.4 percentage points.
� Only 38.4% of respondents, up by 1.0 points, said they would refer their bank to a friend or family member.
� Only 15.9% of customers said they are likely to purchase another product from their bank, pointing to the need for more innovative product development.
8
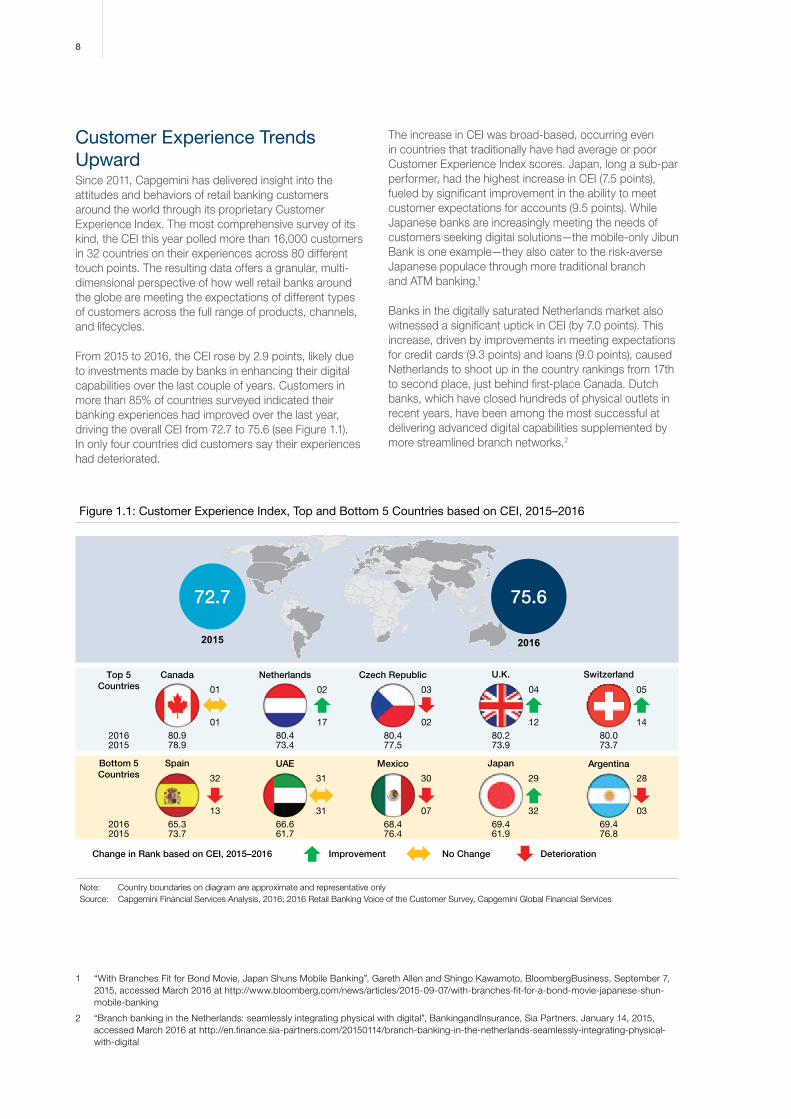
Customer Experience Trends UpwardSince 2011, Capgemini has delivered insight into the attitudes and behaviors of retail banking customers around the world through its proprietary Customer Experience Index. The most comprehensive survey of its kind, the CEI this year polled more than 16,000 customers in 32 countries on their experiences across 80 different touch points. The resulting data offers a granular, multi-dimensional perspective of how well retail banks around the globe are meeting the expectations of different types of customers across the full range of products, channels, and lifecycles.
From 2015 to 2016, the CEI rose by 2.9 points, likely due to investments made by banks in enhancing their digital capabilities over the last couple of years. Customers in more than 85% of countries surveyed indicated their banking experiences had improved over the last year, driving the overall CEI from 72.7 to 75.6 (see Figure 1.1). In only four countries did customers say their experiences had deteriorated.
The increase in CEI was broad-based, occurring even in countries that traditionally have had average or poor Customer Experience Index scores. Japan, long a sub-par performer, had the highest increase in CEI (7.5 points), fueled by significant improvement in the ability to meet customer expectations for accounts (9.5 points). While Japanese banks are increasingly meeting the needs of customers seeking digital solutions—the mobile-only Jibun Bank is one example—they also cater to the risk-averse Japanese populace through more traditional branch and ATM banking.1
Banks in the digitally saturated Netherlands market also witnessed a significant uptick in CEI (by 7.0 points). This increase, driven by improvements in meeting expectations for credit cards (9.3 points) and loans (9.0 points), caused Netherlands to shoot up in the country rankings from 17th to second place, just behind first-place Canada. Dutch banks, which have closed hundreds of physical outlets in recent years, have been among the most successful at delivering advanced digital capabilities supplemented by more streamlined branch networks.2
1 “With Branches Fit for Bond Movie, Japan Shuns Mobile Banking”, Gareth Allen and Shingo Kawamoto, BloombergBusiness, September 7, 2015, accessed March 2016 at http://www.bloomberg.com/news/articles/2015-09-07/with-branches-fit-for-a-bond-movie-japanese-shun-mobile-banking
2 “Branch banking in the Netherlands: seamlessly integrating physical with digital”, BankingandInsurance, Sia Partners, January 14, 2015, accessed March 2016 at http://en.finance.sia-partners.com/20150114/branch-banking-in-the-netherlands-seamlessly-integrating-physical-with-digital
Figure 1.1: Customer Experience Index, Top and Bottom 5 Countries based on CEI, 2015–2016
Note: Country boundaries on diagram are approximate and representative onlySource: Capgemini Financial Services Analysis, 2016; 2016 Retail Banking Voice of the Customer Survey, Capgemini Global Financial Services
Canada Netherlands Czech Republic U.K. SwitzerlandTop 5Countries
Spain UAE Mexico Japan Argentina
Change in Rank based on CEI, 2015–2016 Improvement No Change Deterioration
2015
2016 80.92015 78.9
Bottom 5Countries
80.473.4
80.477.5
80.273.9
80.073.7
2016 65.32015 73.7
66.661.7
68.476.4
69.461.9
69.476.8
13
32
31
31
07
30
32
29
03
28
01
01
17
02
02
03
12
04
14
05
72.7
2016
75.6

9World Retail Banking Report 2016
Sweden also witnessed an improvement in CEI by 7.0 points, primarily due to an improvement in meeting customer expectations for mortgages (8.7 points). Swedish banks are increasingly tapping into social media to further enrich their interactions with customers.
At the other end of the spectrum, declines in CEI were concentrated in Latin America, where weak economic growth has likely soured customer sentiment. Mexico recorded the second-highest fall in CEI with a drop of 8.0 points, largely due to a decline of 9.0 points in meeting customer expectations for accounts. The drop caused Mexico to plunge in the country rankings from seventh place to a near-bottom 30th. Argentina dropped even more precipitously, from third place to 28th, following a decline of 7.4 points in its CEI. Argentinean banks fared worse in meeting customer expectations across all four product lines—accounts, credit cards, loans, and mortgages.
The largest decline in CEI occurred in Spain, where the index fell by 8.4 points, dragged down by inferior performance across all four types of products. The decline caused Spain to fall to the very last position in the country ranking (32), from 13th. The only other country to experience a decline in CEI was Singapore, which recorded a modest fall of 0.4 points, putting it in the bottom fourth of the country rankings.
One of the few consistencies in the country rankings from 2015 to 2016 was that Canada retained its No. 1 spot. Along with Netherlands, the United Kingdom and Switzerland made large leaps to claim top-five positions, edging out the United States, which moved from 5th to 6th, and pushing Czech Republic from second to third. The bottom third of the rankings also shifted significantly, with Spain, Mexico, Argentina, and Singapore making new appearances.
Positive Customer Experience Levels Make GainsPositive CE by Country and Region: Countries move up the CEI rankings when banks increase the number of customers with positive experiences. Banks in Central and Western Europe were the most successful at doing this, improving positive customer experience by 9.0 and 8.8 percentage points, respectively (see Figure 1.2).
Despite still-weak economic growth in the Eurozone, demand for consumer credit increased during 2015, especially for housing loans.3 Banks in the region capitalized on this demand, delivering considerable customer experience improvement to customers taking out loans (a 7.7-point increase in Central Europe and a 5.0-point increase in Western Europe).
Figure 1.2: Positive Customer Experience, by Region (%), 2014–2016
Note: Country boundaries on diagram are approximate and representative only; Positive experience denotes an integer CEI score of more than 79Source: Capgemini Financial Services Analysis, 2016; 2016 Retail Banking Voice of the Customer Survey, Capgemini Global Financial Services
61.3%55.6%56.4%
5.7%
201620152014
North America
58.7%49.9%39.0%
8.8%
201620152014
Western Europe
63.7%54.7%38.2%
9.0%
201620152014
Central Europe
44.3%52.7%43.2%
(8.4%)
201620152014
Latin America
46.6%39.6%36.4%
7.0%
201620152014
Middle East & Africa
43.5%37.5%32.3%
6.0%
201620152014
Asia-Paci�c
3 “The euro area bank lending survey, Fourth quarter of 2015”, European Central Bank, January 2016, accessed March 2016 at https://www.ecb.europa.eu/stats/pdf/blssurvey_201601.pdf?4bd32f9c94e348f242a3d86d5dbd029a

10
Netherlands (70.6%) and Czech Republic (67.0%) recorded the highest overall levels of positive customer experience. European countries as a whole had the biggest gains in positive customer experience, led by Sweden (an increase of 16.0 percentage points), Netherlands, (14.3 percentage points), and Germany (13.8 percentage points). Spain was the only anomaly in the region, recording a drop in positive experience of 17.6 percentage points, bringing it to 35.7%, the second-lowest level after United Arab Emirates (34.9%).
Increasing uncertainty in the emerging markets—related to slowing growth in China, lower commodity prices, and the expected specter of U.S. rate hikes—led to much lower levels of positive customer experience in those regions. Latin America experienced a decline in positive experience (of 8.4 percentage points), putting it on par with the low levels found in Middle East & Africa and Asia-Pacific. This decline in Latin America was due to a decrease in positive customer experience across all products, channels, and lifecycle stages. North America had relatively modest growth in customer experience during 2016, but started from a strong base, giving it the second-highest level of positive experience overall.
Positive CE by Demographic: Underscoring the high expectations they have for their service providers, Gen Y customers4 registered lower levels of positive customer experience, compared to Gen X5 and other age group customers6 (see Figure 1.3).
This difference was especially apparent in North America, where only 47.7% of Gen Y customers reported positive experiences, compared to 62.5% of Gen X customers and 75.7% customers of other age groups. These lower levels are cause for concern as the younger generations become increasingly influential. Gen Y customers are particularly important to banks, given their large presence, expected longevity, and avid use of technology. Yet having grown up on a steady supply of advanced digital technology, Gen Y customers are also more difficult to please. They also have significantly less trust in their primary bank compared to other age groups. To remain competitive over time, banks must gear up to meet the more exacting demands of this important segment.
Figure 1.3: Positive Customer Experience for Gen Y, Gen X, and Other Age Groups, by Region (%), 2016
Note: Country boundaries on diagram are approximate and representative onlySource: Capgemini Financial Services Analysis, 2016; 2016 Retail Banking Voice of the Customer Survey, Capgemini Global Financial Services
North America
(14.8%)
Western Europe Central Europe
Latin America Middle East & Africa Asia-Pacific
75.7%
(13.2%)
51.2% 58.5%
(7.3%)
67.1%
(8.6%)
59.4% 63.7%
(4.3%)
69.7%
(6.0%)
43.5% 44.6%
(1.1%)
45.1%
(0.5%)
40.8% 44.4%
(3.6%)
54.6%
(10.2%)
36.9% 45.7%
(8.8%)
50.1%
(4.4%)
Gen Y Gen X Other Age GroupsGen Y less than Gen X
Gen Y more than Gen X
Gen X less than Other Age Groups
Gen X more than Other Age Groups
47.7% 62.5%
4 Gen Y refers to people born between 1981 and 2000
5 Gen X refers to people born between 1961 and 1980
6 Other age groups refers to people aged 55 years and older

11World Retail Banking Report 2016
Positive CE by Channel: Customer experience levels by channel illustrate the ongoing shift in how customers are choosing to interact with their banks. Mobile is gaining ground, becoming the second-most-used channel after the Internet. One-third of customers are using mobile at least weekly, up by 2.8 percentage points. Additionally, the level of positive experience associated with mobile increased by 6.5 percentage points in 2016 to 55.6% (see Figure 1.4). The increasing tendency of banks to adopt a mobile-first strategy is likely a catalyst of this outcome.
Usage of branch and Internet channels declined as customers began opting for the convenience of banking via smartphones. While the Internet remains the most popular way to access the bank by a large margin, usage
has decreased from 65.1% in 2015 to 59.4% in 2016. Branch usage is also down by 3.2 percentage points, to 13.0%. Social media usage, meanwhile, ticked upward by 1.2 percentage points to 11.0%.
Though they are changing how they use channels, customers still derive value from each one, and for different reasons. Every channel experienced a substantial increase in positive experience, with the branch gaining the most (7.2 percentage points), putting it at 60.7%, just behind the Internet at 63.8%. These numbers underscore the fundamental role the branch continues to play in customer experience. It also points to the need to develop a fully integrated set of channels to meet customers’ diverse needs.
Figure 1.4: Changes in Channel Experience and Usage (%), 2015–2016
Note: Country boundaries on diagram are approximate and representative onlyQuestion: “How often do/will you use the following channels for your banking needs? – Never, Couple of times a year, Monthly, Weekly, or Daily”Source: Capgemini Financial Services Analysis, 2016; 2016 Retail Banking Voice of the Customer Survey, Capgemini Global Financial Services
Increase in Customersfrom 2015–2016
Decrease in Customersfrom 2015–2016
Internet Mobile65.1%
59.4%
30.5%
33.3%
11.0%
Branch 16.2%
13.0%
9.8% SocialMedia
Customers Using Channels at Least Weekly
58.1%
63.8%
Branch 53.5%
60.7% 44.7%
SocialMedia
39.8%
2016
2015
Mobile49.1%
55.6%
2016
2015
Internet
Positive Experience with Channel
2016
2015
2016
2015

12
Though social media progressed slowly in usage over the last year, it is catching up to the other channels in terms of providing positive experience (44.7%). With customer receptivity to social media running high, banks should continue to upgrade this channel with additional functionalities that will distinguish them from the competition.
Positive CE by Trust Levels: Trust emerged as a pressing issue on a global scale, with only 54.5% of customers around the world expressing trust and confidence in their primary bank (see Figure 1.5). Trust was highest in North America (67.4%) and lowest in Asia-Pacific (47.6%), where every country recorded low trust levels except India, which was an outlier with the highest level of trust globally (75.9%).
Customers with positive experiences were significantly more likely to have trust in their primary bank. Globally, nearly three-quarters (71.0%) of customers with positive experiences had high levels of trust in their primary bank, compared to only about one-third (32.0%) of those with negative experiences.
Profitable Customer Behaviors LagBanks’ ability to engage customers in positive behaviors, such as staying with the bank, referring it to others, and purchasing additional products, is crucial to profitability. Overall gains in these types of behaviors, however, have not been commensurate with the increase in positive customer experience. On a global basis, only 55.1% of customers said they are likely to stay with their bank for the next six months, an increase of 1.4 percentage points (see Figure 1.6). At a regional level, North America retained its leading position in terms of customer likelihood to stay with their bank for the next six months (see Figure 1.7).
Loyalty was even less evident among Gen Y customers, with only 45.8% saying they would stay with their bank for six months, compared to 67.2% for other age groups. The difference in North America was especially stark, with 45.7% of Gen Y customers saying they would stick with their bank, compared to 85.1% for other age groups. This indifference of Gen Y customers toward their providers could well turn into a customer-retention problem for banks, especially in the face of stiffer technology-based competitors.
Positive Experience Neutral Experience Negative Experience
66.8%
43.3%29.8%
72.6%53.0%
25.0%
76.1%58.8%
41.8%
79.4%
50.1%28.3%
69.1%
42.8%31.4%
Figure 1.5: Customers with Positive, Neutral, and Negative Experience having High Trust and Con�dence with their Primary Bank, by Region (%), 2016
Note: Country boundaries on diagram are approximate and representative only; The number represents the percentage of customers who have high trust trust and confidence with their primary bank
Question: Please rate the following statement (Please rate each criterion on a scale of 1–7, 7 being strongly agree and 1 being strongly disagree) “– I have complete trust and confidence in my primary bank”
Source: Capgemini Financial Services Analysis, 2016; 2016 Retail Banking Voice of the Customer Survey, Capgemini Global Financial Services
North America Western Europe Central Europe
Latin America Middle East & Africa Asia-Pacific
79.3%
55.3% 49.0%

13World Retail Banking Report 2016
Stay
Refer
Buy
Figure 1.6: Likelihood of Customers to Stay, Refer, and Buy from their Primary Bank (%), 2015–2016
Note: Country boundaries on diagram are approximate and representative onlyQuestion: “How likely are you to change your primary bank within the next six months”? (Please rate on a scale of 1–7, where 7 is highly likely and 1 is highly
unlikely)Question: “How likely are you to refer a friend to your current primary bank”? (Please rate on a scale of 1–7, where 7 is highly likely and 1 is highly unlikely)Question: “How likely are you to purchase another product from your primary bank”? (Please rate on a scale of 1–7, where 7 is highly likely and 1 is highly unlikelySource: Capgemini Financial Services Analysis, 2016; 2016 Retail Banking Voice of the Customer Survey, Capgemini Global Financial Services
Unlikely
9.5%
11.0%
2016
2015
9.1%
15.5%
2016
2015
28.1%
28.7%
2016
2015
55.1%
53.7%
2016
2015
38.4%
37.4%
2016
2015
15.9%
15.3%
2016
2015
Percentage Point Increase from 2015Percentage Point Decrease from 2015
Likely
1.5 pp
6.4 pp
0.6 pp
1.4 pp
1.0 pp
0.6 pp
In terms of referrals, only 38.4% of respondents, up by 1.0 percentage points in 2016, said they would refer their primary bank to a friend. Efforts to boost referrals by building a better brand presence appeared to pay off in some markets, such as North America and Middle East & Africa, which each saw an increase in the likelihood of customers to refer by five percentage points. Although Asia-Pacific pushed the likelihood of referrals up by
a modest 2.2 percentage points, it remained the worst-performing region with only 31.9% of customers likely to refer. Gen Y customers behaved more in line with Gen X and other age groups in terms of referrals; they were only somewhat less likely to refer (36.7%), compared to Gen X (38.7%) and other age groups (40.0%).
When it comes to purchasing additional products, only 15.9% of respondents, an increase of 0.6 points in 2016, said they expected to buy an additional product from their primary bank. The likelihood rose the most in North America (by 2.7 percentage points) and fell the furthest in Central Europe (by 3.1 percentage points).
While Gen Y customers did not distinguish themselves from the pack in terms of product purchasing, the overall low level of potential cross-selling is cause for concern, pointing to the need for banks to aim high in terms of innovative product development.

14
Figure 1.7: Customers’ Likelihood to Stay with their Primary Bank in the Next Six Months, by Region (%), 2015–2016
Note: The number represents the percentage of customers who are likely or unlikely to stay with their primary bankQuestion: “How likely are you to change your primary bank within the next six months”? (Please rate on a scale of 1–7, where 7 is highly likely and
1 is highly unlikely)Source: Capgemini Financial Services Analysis, 2016; 2016 Retail Banking Voice of the Customer Survey, Capgemini Global Financial Services
2015
2016
Customers Likely to Stay, 2015–2016Customers Unlikely to Stay, 2015–2016
14.0%
15.1%
15.1%
10.5%
7.9%
10.7%
16.6%
16.2%
10.2%
7.6%
6.8%
10.2%
46.0%
46.6%
43.3%
51.0%
60.7%
61.9%
39.9%
47.2%
48.7%
56.2%
60.9%
62.2%
Asia-Paci�c
Latin America
Middle East& Africa
Central Europe
Western Europe
North America 0.3%
0.2%
(6.1%)
0.6%
5.4%
5.2%
(0.5%)
(1.1%)
2.6%
1.1%
(4.9%)
(2.9%)
Percentage PointChange from 2015
Percentage PointChange from 2015
One way for banks to promote more profitable behaviors is to deliver positive customer experiences. While the industry has long purported that good experiences make for more loyal customers, solid evidence has been hard to come by. Our findings confirm a strong correlation between positive customer experience and loyalty, highlighting the need for banks to devote additional resources to improving all aspects of how customers interact with the bank.
Simply put, positive experiences pay off in the form of retention and referrals. More than two-thirds of customers with positive experiences (67.8%) are likely to stay with their primary bank, compared to only 38.6% of those with negative ones. Further, customers are more than twice as likely to refer if they have positive rather than negative experiences (50.7% versus 22.4%). While the impact of positive experience on cross-sales is more muted, it is still tangible, especially in Latin America, Middle East & Africa, and Asia-Pacific.

15World Retail Banking Report 2016
SummaryThe 2.9-point increase in CEI is solid evidence that banks in most countries are delivering better experiences to their customers. Positive experience improved in unlikely places, such as Japan, which historically had low levels of customer experience. Europe, where countries are still trying to shrug off the effects of the financial crisis; and through every channel, including newer ones, like mobile and social media. Gen Y customers continue to have the most resistance to bank efforts to improve experience.
The overall movement up the CEI scale, however, is not paying off as much as banks would like in terms of fostering profitable customer behaviors like retention and referrals. Perhaps most frustrating is the level of cross-sale potential, which remains particularly low, at 15.9%. In addition to continuing to improve the customer experience, banks also need to up their game in digital innovation. Improving the customer experience will wind up meaning very little without ongoing interest and enthusiasm from customers.

Appeal of Fintech Continues to Expand

17World Retail Banking Report 2016
Key FindingsFintech firms are exerting great influence over the decisions customers make about their financial service providers.
� Nearly two-thirds of customers across the globe are using products or services from fintech firms, ratcheting up the threat of bank disintermediation.
� Penetration is currently highest in the emerging markets and among younger customers, but is expected to increase in all geographies and ages.
While banks have the advantage of greater amounts of customer trust, fintech firms are fast catching up.
� The percent of customers who completely or somewhat trust fintech firms is very high (87.9% or more) across all regions.
� Banks view customer trust as their greatest strength (70.3%), followed by established customer relationships (65.3%) and robust risk management (65.3%).
� Banks are constrained by their ability to move quickly and innovate, which may hamper their efforts to keep pace with the challenges posed by fintech firms.
Fintech firms have numerous strengths that are starting to pay off in the form of customer referrals.
� Globally, customers are more likely to refer their fintech service provider over their bank (54.9% versus 38.4%), with Latin America registering the highest tendency (67.2%).
� Banks are underestimating the value fintech firms provide in delivering a good experience and efficient service, as well as their potential influence on all areas of banking.

18
Fintech Firms Make Gains across RegionsFintech firms are playing an increasingly larger role in bringing financial services to customers. Backed by rising levels of venture capital and freed from the constraints of legacy technology, fintech firms are redefining banking and raising customer expectations for traditional banks in the process. Globally, nearly two-thirds of customers (63.1%) said they use products or services offered by fintech firms.
Penetration is highest in the emerging markets. In Latin America, nearly three-quarters of banking customers (77.4%) use fintech products or services, followed by Central Europe at 68.9% and Middle East & Africa at 63.6% (see Figure 2.1). The relative lack of banking infrastructure in emerging markets appears to be creating a hospitable environment for fintech firms to not only provide basic services, but also leapfrog beyond the standard levels of service found in developed markets. Customers in emerging markets also tend to have more relationships with fintech firms, likely reflecting gaps in services provided by traditional banks in those regions.
While younger customers are more likely to turn to fintech firms, the appeal of fintech is expected to intensify among customers of all ages. Globally, the demand for fintech is being driven more by Gen Y customers (67.4%), compared to customers in other age groups (55.9%). The biggest gap between Gen Y and other age groups in terms of fintech adoption is in North America (15.0%) (see Figure 2.2).
Despite some pockets of resistance, fintech adoption is expected to broaden across the board. Most individual fintech firms have the advantage of being highly specialized, providing attractive alternatives to mostly commoditized banking products and services. Collectively, fintech firms cater to a wide range of financial needs, providing customers with many avenues for initiating relationships.
Figure 2.1: Banking Customers’ Usage of Fintech Firms, by Region (%), 2016
Note: Country boundaries on diagram are approximate and representative only; The percentage represents the customers who are using financial products or services from fintech firms
Question: “Are you currently using any financial products or services from fintech firms (such as Alibaba, Apple, Google, Lending Club, PayPal, Paytm, Prosper, Stripe, Square, Zopa, etc.)”?
Question: “With how many fintech firms do you currently have a relationship”? (Please enter the number of fintech firms)Source: Capgemini Financial Services Analysis, 2016; 2016 Retail Banking Voice of the Customer Survey, Capgemini Global Financial Services
North America Western Europe Central Europe
Latin America Middle East & Africa Asia-Paci�c77.4% 63.6% 58.9%
59.1% 60.8% 68.9%
64.7%
20.6%
14.7%
66.4%
20.6%
13.0%
56.2%27.5%
16.3%
46.1%
30.4%
23.5%
51.4%24.1%
24.5%
55.2%26.0%
18.8%
1 2 3+Number of RelationshipsAdoption

19World Retail Banking Report 2016
Figure 2.2: Gen Y and Other Age Groups Using Financial Products/Services from Fintech Firms, by Region (%), 2016
Note: Country boundaries on diagram are approximate and representative only; The percentage represents the customers who are using financial products or services from fintech firms
Question: “Are you currently using any financial products or services from fintech firms (such as Alibaba, Apple, Google, Lending Club, PayPal, Paytm, Prosper, Stripe, Square, Zopa, etc.)”?
Source: Capgemini Financial Services Analysis, 2016; 2016 Retail Banking Voice of the Customer Survey, Capgemini Global Financial Services
Gen Y Other Age Groups Gen Y more than Other Age Groups
North America
15.0%
Western Europe Central Europe
Latin America Middle East & Africa Asia-Pacific
47.0% 65.6%
12.4%
53.2% 72.6%
9.5%
63.1%
83.2%
10.3%
72.9% 71.2%
13.8%
57.4% 60.9%
7.9%
53.0%
62.0%
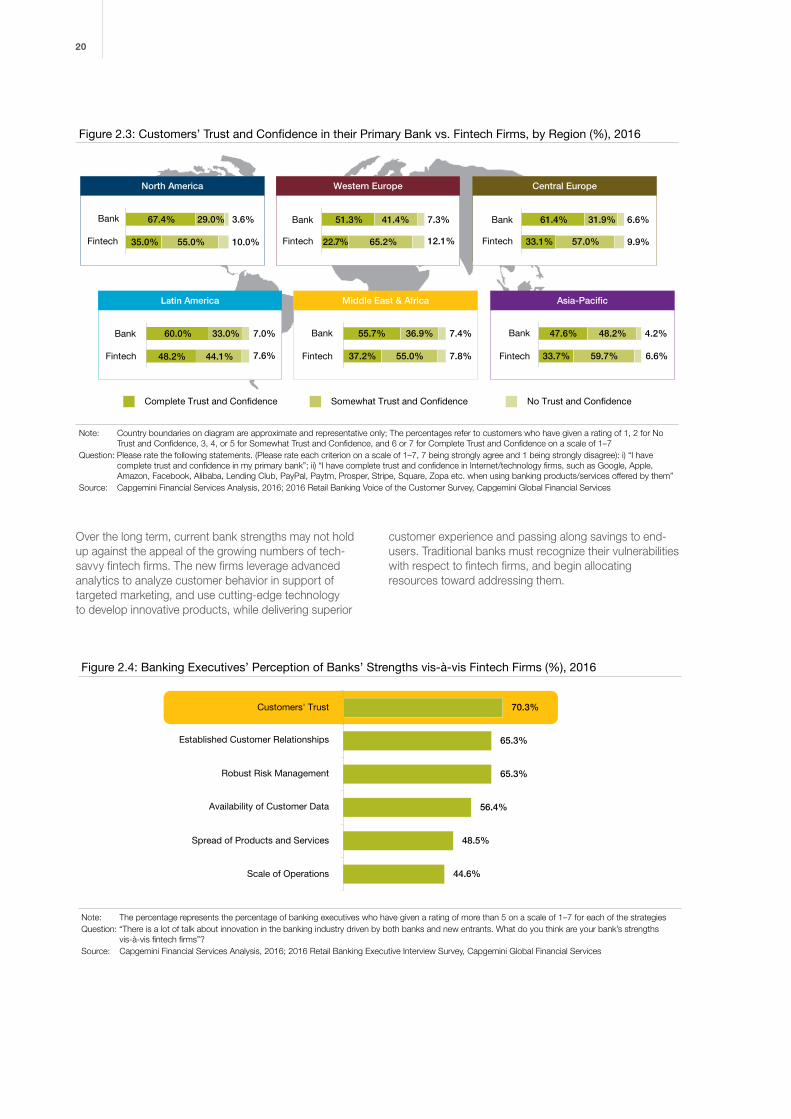
Fintech Firms Gain Customer TrustFor now, banks have the advantage of trust. In all regions of the globe, customer levels of complete trust are higher for primary banks. In some places, however, fintech firms are catching up. In Latin America, for example, nearly half of customers (48.2%) say they completely trust fintech firms, only 11.8 percentage points behind the 60.0% who say they completely trust banks. Across all regions, the percentage of customers who completely or somewhat trust fintech firms is very high (87.9% or more) (see Figure 2.3). As regulators increasingly turn their attention to fintech, driving broader customer protections and addressing security and privacy concerns, trust levels with fintech firms are expected to rise even higher.
Rising levels of trust in fintech firms may threaten what bank executives see as their greatest strength. Nearly three-quarters (70.3%) view customer trust as the most potent advantage banks have over fintech firms, followed by established customer relationships (65.3%) and robust risk management (65.3%). Banks also have advantage of their broad product portfolio over mono-line and niche portfolios of fintech firms. Some of the strengths perceived by bank executives may suggest an underlying weakness. For example, though banks have a wealth of customer data, they have not optimally leveraged it, resulting in only 56.4% of executives counting it as a strong point (see Figure 2.4).
20
Over the long term, current bank strengths may not hold up against the appeal of the growing numbers of tech-savvy fintech firms. The new firms leverage advanced analytics to analyze customer behavior in support of targeted marketing, and use cutting-edge technology to develop innovative products, while delivering superior
customer experience and passing along savings to end-users. Traditional banks must recognize their vulnerabilities with respect to fintech firms, and begin allocating resources toward addressing them.
Figure 2.4: Banking Executives’ Perception of Banks’ Strengths vis-à-vis Fintech Firms (%), 2016
Note: The percentage represents the percentage of banking executives who have given a rating of more than 5 on a scale of 1–7 for each of the strategiesQuestion: “There is a lot of talk about innovation in the banking industry driven by both banks and new entrants. What do you think are your bank’s strengths
vis-à-vis fintech firms”?Source: Capgemini Financial Services Analysis, 2016; 2016 Retail Banking Executive Interview Survey, Capgemini Global Financial Services
44.6%
48.5%
56.4%
65.3%
65.3%
70.3%
Scale of Operations
Spread of Products and Services
Availability of Customer Data
Robust Risk Management
Established Customer Relationships
Customers' Trust
Figure 2.3: Customers’ Trust and Con�dence in their Primary Bank vs. Fintech Firms, by Region (%), 2016
Note: Country boundaries on diagram are approximate and representative only; The percentages refer to customers who have given a rating of 1, 2 for No Trust and Confidence, 3, 4, or 5 for Somewhat Trust and Confidence, and 6 or 7 for Complete Trust and Confidence on a scale of 1–7
Question: Please rate the following statements. (Please rate each criterion on a scale of 1–7, 7 being strongly agree and 1 being strongly disagree): i) “I have complete trust and confidence in my primary bank”; ii) “I have complete trust and confidence in Internet/technology firms, such as Google, Apple, Amazon, Facebook, Alibaba, Lending Club, PayPal, Paytm, Prosper, Stripe, Square, Zopa etc. when using banking products/services offered by them”
Source: Capgemini Financial Services Analysis, 2016; 2016 Retail Banking Voice of the Customer Survey, Capgemini Global Financial Services
Complete Trust and Con�dence Somewhat Trust and Con�dence No Trust and Con�dence
North America Western Europe Central Europe
35.0%
67.4%
55.0%
29.0%
10.0%
3.6%
Fintech Fintech Fintech
Bank
22.7%
51.3%
65.2%
41.4%
12.1%
7.3%Bank
33.1%
61.4%
57.0%
31.9%
9.9%
6.6%Bank
Latin America Middle East & Africa Asia-Paci�c
48.2%
60.0%
44.1%
33.0%
7.6%
7.0%Bank
37.2%
55.7%
55.0%
36.9%
7.8%
7.4%Bank
33.7%
47.6%
59.7%
48.2%
6.6%
4.2%Bank
Fintech Fintech Fintech

21World Retail Banking Report 2016
Most banks, however, are bogged down by aging technology and siloed businesses, making it difficult for them to move with speed and agility. Less than one-quarter of bank executives surveyed said their institutions had an advantage over fintech firms in their ability to innovate or move nimbly (see Figure 2.5).
This slowness is a liability. Banks need to begin cutting through organizational barriers and transforming their systems to be able to compete against fintech firms.
Fintech Firms Get More Referrals than BanksThe perceived advantages of fintech firms extend far beyond their ability to innovate and move quickly. From the customers’ perspective, fintech firms have value in being easy to use (81.9%), offering faster service (81.4%), and providing a good experience (79.6%). Banks, however,
have mostly underestimated these value propositions. While they agree that fintech firms offer ease of use (89.1%), they do not perceive them as providing a good experience (only 39.6%) or fast turnaround (35.6%) (see Figure 2.6). Rather than discount fintech offerings, banks should take cues from them on how to provide an experience and service level that resonates with customers.
Figure 2.5: Banks’ Self-Assessment of their Agility and Ability to Innovate vis-à-vis Fintech Firms, 2016
Note: The percentages refer to banking executives who have given a rating of 1, 2 for Low, 3, 4, or 5 for Medium, and 6 or 7 for High on a scale of 1–7Question: “How would you compare your bank’s ability to innovate and agility vis-à-vis fintech firms”? Please explain. (Please rate on a scale of 1–7, with 7 being
the highest rating and 1 being the lowest rating)Source: Capgemini Financial Services Analysis, 2016; 2016 Retail Banking Executive Interview Survey, Capgemini Global Financial Services
Organizational Agility HighLow
Ab
ility
to
Inno
vate
Hig
hLo
w
2.0% 1.0%15.8%
47.5% 1.0%13.9%
10.9% 7.9%0.0%
Figure 2.6: Value Proposition of Fintech Firms (%), 2016
Note: The percentage represents the customers who have given a rating of more than 4 on a scale of 1–7Question: “What are the primary reasons for using products/services from fintech firms”? (Please rate each factor on a scale of 1–7, 7 being very important and 1
being not important at all)Question: “Some of the fintech firms (such as Moven, Lending Club, Zopa, etc.) have been gaining significant traction in the market. What do you think is the
value proposition of these firms? What are the strengths of fintech firms vis-à-vis banks”?Source: Capgemini Financial Services Analysis, 2016; 2016 Retail Banking Voice of the Customer Survey, 2016 Retail Banking Executive Interview Survey,
Capgemini Global Financial Services
Customers’ Perspective
Ease of Use 81.9%1
Faster Service 81.4%2
Good Experience 79.6%3
Lower Fees 76.9%4
More Features 63.5%5
Lack of Service by Primary Bank 54.8%6
Integration with Social Media 47.7%7
Banks’ Perspective
Ease of Use 89.1%1
Speed to Market 74.3%2
Lower Fees 68.3%3
Socially Integrated Services 49.5%4
Good Service/Experience 39.6%5
Quick Turnaround 35.6%6
Personalized Service 26.7%7

22
Bank executives acknowledge that fintech firms are well equipped to make significant inroads in specific banking businesses. One area of vulnerability is cards and payments, which 84.2% of bank executives perceive as an opportunity for fintechs, driven by rapid growth in mobile wallets, mobile payments, and greater demand for real-time payments.
Banks are less concerned about encroaching competition in the areas of loans (55.4%), accounts and investments (45.5%), financial advice (42.6%), and mortgages (20.8%)
(see Figure 2.7). Yet they may be underestimating the threat. Global investment in fintech was expected to nearly double from $10 billion in 2014 to $19.7 billion in 2015, with about 60% of that investment coming from outside the banking and financial community.7 The dramatic rise in investment indicates that fintech’s influence is seeping into all aspects of traditional banking.
The efforts of fintech firms appear to be already paying off. In every region of the globe, customers are more likely to refer their fintech service provider to a friend (54.9%), rather than their bank (38.4%). The tendency is highest in Latin America where 67.2% of customers say they would likely refer their fintech provider, followed by North America where 63.7% of customers would. In those regions, only 47.2% and 50.5%, respectively, say they would refer their bank (see Figure 2.8). The ability of fintech firms to provide
efficient and rewarding experiences, combined with the novelty of their offerings, is no doubt driving customers to make the referrals. As the volume of referrals expands, fintech firms will reap additional benefits in the form of higher adoption rates and lower acquisition costs.
Cards & Payments
Loans
Raising Financial Awareness
Accounts and Investments
Financial Advice
Mortgages 20.8%
42.6%
45.5%
51.5%
55.4%
84.2%
Figure 2.7: Banking Executives’ Assessment of Opportunity Areas for Fintech Firms (%), 2016
Note: The percentage represents the percentage of banking executives who have given a rating of more than or equal to 5 for each of the strategiesQuestion: “In your opinion, which of the following banking areas provide the biggest opportunity for fintech firms”?Source: Capgemini Financial Services Analysis, 2016; 2016 Retail Banking Executive Interview Survey, Capgemini Global Financial Services
7 “FinTech Investment Expected To Double In 2015”, Ryan W. Neal, Intelligent Advisor WealthMangement.com, Feb 19, 2015, accessed March 2016 at http://wealthmanagement.com/blog/fintech-investment-expected-double-2015

23World Retail Banking Report 2016
SummaryFintech firms have emerged as a potent force in financial services. Customers are drawn to them for the fresh perspective they bring to services that have been highly commoditized by the banking industry. Not only do a majority of customers use fintech services, they also place a high amount of trust in them, threatening to undermine
one of banks’ long-standing advantages. Perhaps the most disturbing threat for the banks is that fintech products are top-of-mind, with customers being much more likely to refer them to friends than bank products. Banks need to become more proactive in dismantling the organizational and technological barriers that are preventing them from competing more effectively against fintechs.
Figure 2.8: Likelihood to Refer a Friend to Primary Bank vis-à-vis Fintech Firms, by Region (%), 2016
Note: Country boundaries on diagram are approximate and representative only; The percentage represents the customers who have given a rating of 6 or 7 on a scale of 1−7
Question: “How likely are you to refer a friend to your current primary bank”? (Please rate on a scale of 1−7, where 7 is highly likely and 1 is highly unlikely)
Question: “How likely are you to refer a friend to the fintech firms with whom you currently have a relationship”? (Please rate on a scale of 1−7, where 7 is highly likely and 1 is highly unlikely)
Source: Capgemini Financial Services Analysis, 2016; 2016 Retail Banking Voice of the Customer Survey, Capgemini Global Financial Services
North America Western Europe Central Europe
Latin America Middle East & Africa Asia-Pacific
Likelihood to Refer Primary Bank Likelihood to Refer Fintech Firms
63.7%
50.5%
51.8%
35.4%
57.1%
40.4%
67.2%
47.2%
51.3%
41.3%
50.1%
31.9%

Defining the Future of Banking

25World Retail Banking Report 2016
Key FindingsBanks are struggling to respond to increasingly aggressive fintech competitors.
� Ninety percent of banking executives believe that the pace of change in banking is accelerating, driven by the need to innovate and rising competition from fintech firms.
� Competition is evolving into acceptance, with nearly two-thirds of bank executives (65.3%) saying they view fintech firms as partners. The most popular ways of partnering with fintechs are through collaboration (45.5%) and investment (43.6%).
� While 96.0% of bank executives agree that the industry is evolving toward a digital banking ecosystem, only 12.9% say their core systems can support such an ecosystem.
Fintech partnerships are expected to propel banks toward a much bigger role in defining the future of digital banking.
� Banks and fintech firms will need to work together and leverage each other’s strengths to create the best possible future ecosystem.
� By being proactive, banks can reduce the risk of being marginalized as the ecosystem evolves.
APIs are essential to the future of banking, offering the ability to take advantage of fintech assets such as speed and creativity.
� While some banks have embraced the open architecture of APIs, the industry as a whole still has a long way to go, mostly because of limits imposed by aging technology systems.
� Banks will need to navigate the transition into API-based software development carefully, to ensure they remain integral to customer relationships.
� Regulation such as Payment Services Directive 2 (PSD2) will exert ongoing pressure to expose banking core ledgers openly and transparently to third-party solution providers.
While banks will face challenges in evolving a digital banking ecosystem, a well-structured roadmap can help them overcome these challenges.
� Transforming legacy systems with more agile and scalable systems are essential for banks to fully leverage the potential of a digital banking ecosystem.
� As banks put agile systems in place and maintain a 360-degree view of their customers, they take on the facilitator’s role for both financial and non-financial transactions in the digital banking ecosystem and still retain their critical role in customer relationships.
26
Fintech Competition Takes on More Aggressive EdgeDisruptive technology has already transformed industries like music, publishing and retailing, and now it is starting to upend banking. For years, retail banks remained somewhat protected by barriers that helped keep competitors at bay, such as heavy regulation and long-standing customer relationships. While regulations have been burdensome to banks, they have also made it more difficult for non-banks to establish competitive offerings. In addition, non-banks have struggled to detach customers from sticky banking relationships.
Increasingly, however, these obstacles are starting to crumble, as fintech solutions become more and more compelling, and interest and investment in them soars. The growing clarity over the rules and regulations that govern fintech firms will only help the progress of non-banks. In addition, fintech firms are in a better position than ever to take customers from banks because of the clear articulation of their value proposition and superior customer experience.
The threat of competition has ratcheted up appreciably, with 90.1% of banking executives saying the pace of change is accelerating in the industry. The nature of the competition is also different. Though early competitors introduced new channels, they are still focused on
delivering traditional financial products and services. Banks were easily able to catch up to these Internet-only interlopers, and in fact could surpass them by emphasizing their full range of integrated channels.
Today’s competitors are much more aggressive. They are focused on peeling off specific pieces of the banking business, such as payments, loans or deposits, and developing niche offerings that are highly attuned to customer preferences. Drawing upon their expertise in digital, mobile and cloud technology, fintech firms are bringing to market highly creative products that hold special appeal for growing numbers of customers, especially ones who are younger and tech-savvy.
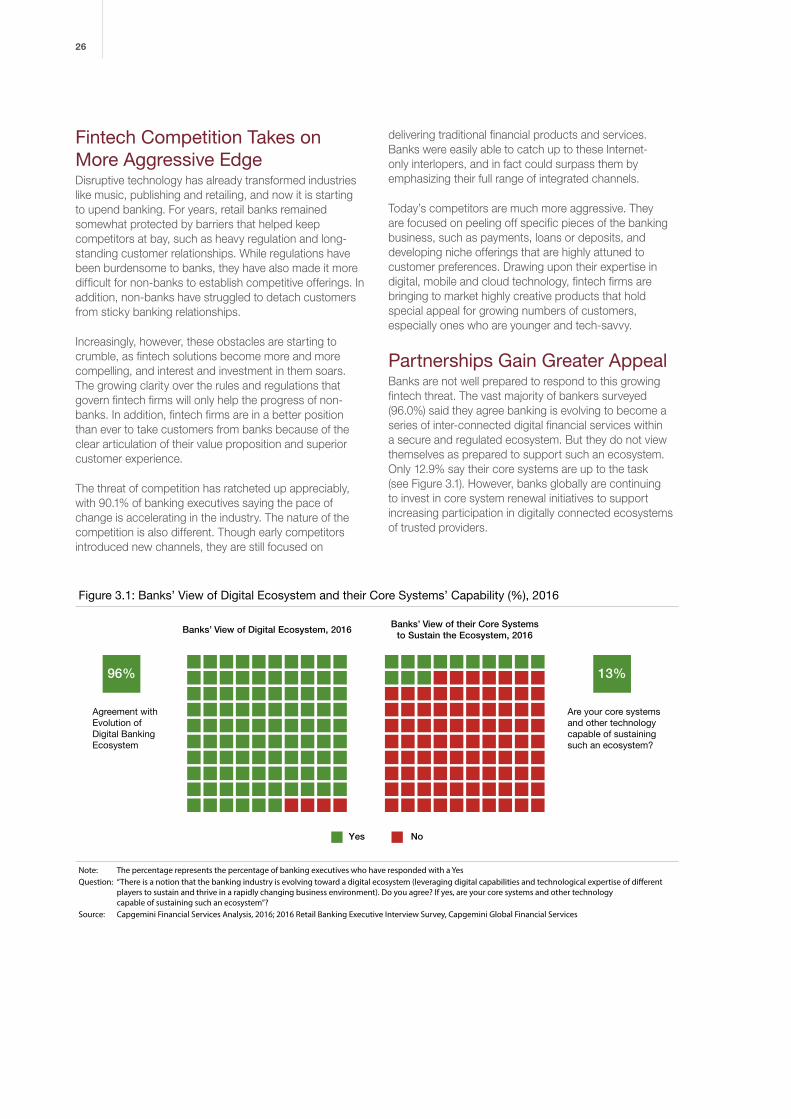
Partnerships Gain Greater AppealBanks are not well prepared to respond to this growing fintech threat. The vast majority of bankers surveyed (96.0%) said they agree banking is evolving to become a series of inter-connected digital financial services within a secure and regulated ecosystem. But they do not view themselves as prepared to support such an ecosystem. Only 12.9% say their core systems are up to the task (see Figure 3.1). However, banks globally are continuing to invest in core system renewal initiatives to support increasing participation in digitally connected ecosystems of trusted providers.
Yes No
Figure 3.1: Banks’ View of Digital Ecosystem and their Core Systems’ Capability (%), 2016
Note: The percentage represents the percentage of banking executives who have responded with a YesQuestion: “There is a notion that the banking industry is evolving toward a digital ecosystem (leveraging digital capabilities and technological expertise of di�erent
players to sustain and thrive in a rapidly changing business environment). Do you agree? If yes, are your core systems and other technology capable of sustaining such an ecosystem”?
Source: Capgemini Financial Services Analysis, 2016; 2016 Retail Banking Executive Interview Survey, Capgemini Global Financial Services
Banks’ View of Digital Ecosystem, 2016Banks’ View of their Core Systems
to Sustain the Ecosystem, 2016
Agreement with Evolution of Digital Banking Ecosystem
Are your core systems and other technology capable of sustaining such an ecosystem?
96% 13%

27World Retail Banking Report 2016
Figure 3.2: Banks’ Perception of Fintechs and Strategies of Banks to Compete with Fintechs (%), 2016
Note: The percentage represents the percentage of banking executives who have given a rating of more than 5 on a scale of 1–7 for each of the strategiesQuestion: “How do you view fintech firms – as a competitor, a partner, or irrelevant”? (Please choose the applicable option)Question: “What is your strategy to compete in the evolving banking environment from the perspective of competition from fintech firms”?Source: Capgemini Financial Services Analysis, 2016; 2016 Retail Banking Executive Interview Survey, Capgemini Global Financial Services
Banks’ Perception of Fintechs (%), 2016Strategies of Banks to Compete
with Fintechs (%), 2016
Collaborate 45.5%1
Invest 43.6%2
Compete by Building Capabilities 42.6%3
Acquire Fintech and Tech 17.8%4
Do Nothing 4.0%5
Competitor, 27.7%
Partner, 65.3%
Irrelevant, 6.9%
To keep up with the rapid changes caused by fintech firms, banks are exploring new approaches to innovation, including collaboration, incubation and acquisition. Nearly two-thirds of banks (65.3%) say they view fintech firms as partners, a striking level of acceptance, given the historical perception of fintech as a destructive element. The shift reflects the reality that each side offers something to
the other. Fintech firms excel in their ability to move quickly, innovate, and exploit new technology, while the banks have capital, deep customer bases, and expertise in dealing with regulators. While 27.7% of banks continue to view fintech firms as competitors, only 6.9% view them as irrelevant (see Figure 3.2).
The growing level of partnership between banks and fintech firms is expected to take many forms. Collaboration and investment are high on the list of bank strategies, with 45.5% citing collaboration and 43.6% looking to invest in fintech firms. By taking advantage of fintech capabilities, banks can grow existing businesses or enter into new ones, such as low-value payments and loans. Acquisition holds less appeal, with less than one-fifth (17.8%) saying they plan to acquire fintech firms or their technology. Virtually all the bankers surveyed agreed that the advance of fintech requires action. Only 4.0% cited doing nothing as a valid option (see Figure 3.2).
Already, banks have taken big steps toward partnering/investing/acquiring fintech firms. One prominent example is the acquisition of the U.S. mobile banking firm, Simple, by the U.S. unit of Spain’s BBVA. Nearly two years into the acquisition, Simple had doubled its number of customer
accounts and was growing users by 10% a month.8 Other banks are spreading their investments around. The U.K. arm of Spain’s Santander, for example, launched a $100 million venture-capital fund to invest in technologies it thinks will be critical to its future.9
Incubation is also a big theme in fintech partnerships. Barclays in the U.K. is keeping its financial outlay to a minimum by instead providing office space, equipment and mentorship to selected start-ups in the hope of soaking up some entrepreneurial know-how and perhaps gaining access to valuable applications for the bank.10 Singapore-based DBS has launched a similar type of fintech accelerator program in Hong Kong.11 In addition to a start-up accelerator, Wells Fargo in the U.S., like a growing number of banks around the globe, operates a series of innovation labs to test new ideas and applications with the aim of revamping the customer experience.12
8 “Banks and Fintech Firms’ Relationship Status: It’s Complicated”, Daniel Huang, The Wall Street Journal, Nov. 18, 2015, accessed March 2016 at http://www.wsj.com/articles/banks-and-fintech-firms-relationship-status-its-complicated-1447842603
9 “Santander to launch a $100M fund for Fintech companies out of London”, Santander, July 2, 2014, accessed March 2016 at http://santanderinnoventures.com/santander-to-launch-a-100m-fund-for-fintech-companiesout-of-london/
10 http://www.barclaysaccelerator.com/
11 https://www.dbs-accelerator.com/
12 https://labs.wellsfargo.com/

28
Evolving a Digital Banking EcosystemToday’s partnerships are a stepping-stone toward a much bigger role banks are expected to play in creating a digital banking ecosystem. In the emerging ecosystem, existing bank infrastructures and new fintech technologies will both play strong parts. Banks and fintech firms will need to work together to leverage each other’s strengths as they seek to create entirely new ways of interacting with customers.
Banks have much to gain by participating fully in the effort to forge a new digital banking ecosystem (see Figure 3.3). Being proactive will help them reduce the risk of being marginalized as the ecosystem evolves. They will also be better equipped to meet rising customer expectations for enhanced experiences and innovative services. Finally, they can explore ways of generating revenue from fintechs that want to tap their expertise in traditional banking areas like risk management and payments. Putting a price on assets like geo-enhanced data, customer authentications and money transfers could help banks generate new revenue streams.
To date, many of the emerging fintech providers are so-called modular producers,13 offering narrow, niche services that present less of an overall threat to traditional banks. More alarming is the idea of a technology heavyweight, such as Google, Apple, Facebook, or Alibaba, moving into financial services and leveraging its global brand to build a competing digital financial ecosystem. In that scenario, banks risk becoming mere suppliers in networks controlled and operated by non-bank powerhouses.
APIs Hold PromiseBanks can retain a lasting and important role in the evolving digital landscape by building bridges to third parties through open APIs. API software tools let data that is owned by the bank be securely accessed by mobile or Web application providers and then put to use in compelling ways. Essentially, by providing access to proprietary information with due consent from customers, banks create an inside track for innovative ideas and customer-focused apps to flow into the organization (see Figure 3.4).
Some banks around the world have already begun to embrace the open architecture of APIs. PrivatBank of Ukraine, one of the first to do so, today offers hundreds of API-based services, including one that lets customers tap their smartphones to the ATM to get cash.14 Fidor Bank, based in Germany, bills itself as an app store with a banking license, offering core banking services alongside a wealth of more advanced, API-developed capabilities, like peer-to-peer lending and foreign exchange transfers.15 YES BANK of India actively promotes its API Banking Services, which are leveraged by eCommerce firms to deliver services like instant refunds.16
The industry as a whole, however, is still far from having a core competency in API-based development, mostly because of the limits imposed by banks’ aging technology systems. Even with temporary fixes like screen scraping and wrapping, legacy systems still have limited scalability, restricted functionality, higher maintenance costs, increased complexity, and slower time to market.
Figure 3.3: Creating a Digital Ecosystem
Source: Capgemini Financial Services Analysis, 2016
Developers
OtherBusinesses Fintech
Customer OtherBanks
Bank
13 “Thriving in an Increasingly Digital Ecosystem”, Peter Weill and Stephanie L. Woerner, MIT Sloan Management Review, June 16 2015, accessed March 2016 at http://sloanreview.mit.edu/article/thriving-in-an-increasingly-digital-ecosystem/
14 “PrivatBank Brings Smartphone-Controlled ATM Technology to Western Market”, David Penn, Finovate.com, April 30, 2014, accessed March 2016 at http://finovate.com/privatbank-brings-smartphone-controlled-atm-technology-to-western-market/
15 www.fidortecs.com
16 “YES BANK Partners with Snapdeal and FreeCharge for Multiple Innovations”, September 15, 2015., accessed March 2016 at https://www.yesbank.in/media-centre/press-releases/fy-2015-16/yes-bank-partners-with-snapdeal-and-freecharge-for-multiple-innovations.html

29World Retail Banking Report 2016
Figure 3.4: Open API Banking Landscape
Source: Capgemini Financial Services Analysis, 2016
Drivers
Innovation
Customer Demand
Regulations
Threats
Commoditization ofBanking Processes
Disintermediation
Losing Business
Opportunities
New Products andServices
Better CustomerExperience
E�ective RegulatoryCompliance
Better Customer Insights
Getting maximum value from API development will require banks to analyze their IT architectures with the aim of transforming their core systems. Though high-risk and high-cost, core transformation offers a pathway toward a fully flexible, low-cost, reliable platform suitable for API development.
The pressure to move toward a more API-friendly environment is expected to increase as regulators take a more proactive approach to facilitating account access by trusted third parties. Various European Union directives and regulations, including the PSD2 and the Access to Accounts (XS2A) article, will define the technical requirements for secure account access, making it even more attractive and feasible for third parties to develop applications for all types of banking functions.
As banking becomes more open, fintech firms will have greater access to customer data. Customers themselves will own their data, and will grant permission to third parties wanting to access it. This openness will help spur an unprecedented level of creativity in product development and cause new services to be brought to market more quickly than ever before. The risk, however, is that bank-customer relationships may become increasingly splintered. Banks will have to work even harder to make a positive impression on customers and remain an integral part of the overall customer relationship.
Roadmap to Create a Digital Banking EcosystemBanks have different options to prepare themselves for the forthcoming challenges. Some banks, unaware of the coming shift or unable to decide what to do about it, are maintaining the status quo, though their inaction may prove fatal in the medium to long run. A temporary approach involves making incremental investments as and when required, while still operating in silos. A more collaborative approach would incorporate a wide range
of partnering strategies, ranging from joint ventures and venture capital funds, to innovation labs, accelerator programs, and acquisitions. Banks may leverage their collaboration with fintech firms to accelerate speed to offer new products and/or services. Though these approaches can help banks to an extent, full growth potential can be realized only if banks make themselves free of legacy systems and replace them with more agile and scalable systems.
In the absence of a defined approach to carrying out the transformation toward a digital banking ecosystem, banks may consider a step-wise approach (see Figure 3.5). They will first have to identify their focus areas. The next step would involve making strategic decisions around planning and execution. Banks then need to collaborate with fintech firms by creating an open API system, which will help banks leverage new technologies for superior product and services development. The most important step will be to transform legacy systems to a more agile infrastructure able to support the bank’s central role in the changing ecosystem. Banks would evolve from being the sole providers of financial services to being facilitators providing both financial and non-financial services.
Ensuring themselves a leadership role in the coming digital ecosystem will require banks to adopt a comprehensive strategy. As a first step, banks need to accept fintech firms as major players in the new ecosystem. In partnering with them, banks should strive to create an atmosphere where valued fintech characteristics, such as flexibility and speed, can thrive. That may mean ring-fencing fintech partners from the rest of the organization, especially legacy systems. At the same time, banks must ensure that their vast knowledge about compliance and security reaches their fintech partners through adequate training and guidance. Perhaps most important, banks must make sure they maintain a 360-degree view of all customer data, which will be crucial to preserving a strong role in customer relationships.

30
SummaryAs fintech firms proliferate and raise customer expectations, banks are starting to view them as partners with expertise in developing digital services that match heightened customer expectations. A steadily increasing number of fintech acquisitions, innovation labs, and accelerator programs illustrates that banks are increasingly seeking ways to collaborate with fintech firms rather than fight them. The most important elements of successful collaboration with fintechs will be liberal use of APIs, backed by modern technology freed from legacy constraints. Smartly embracing open architecture will help banks achieve the critical goal of bringing more compelling products to market, while still remaining central to the overall customer relationship.
Changing attitudes toward fintech providers foretell the coming of a new normal. With fintech continuing to gain momentum, it will not be long before they become fully integrated into business-as-usual banking.
Figure 3.5: Building a Digital Banking Ecosystem
Source: Capgemini Financial Services Analysis, 2016
Transforming legacy systems is imperative for banks to sustain in the long run:
Be more agile (shorten development time) by moving to a new technology base
Adopt Service-Oriented Architecture (SOA) to open their systems through APIs
Remove data duplication to enable real-time analytics
Transforming toward Digital Banking Ecosystem
Ban
k o
f the
Fut
ure
Trad
itio
nal
Ban
k
Transform
Collaborate
Strategize
Identify
Banks should identify the areas to focus and develop capabilities to attain long-term competitiveness and sustainability
Banks should devise a plan to develop capabilities in the identi�ed areas:
Build
Buy
Collaborate
Invest strategically
Banks should look to collaborate with �ntech �rms:
Build APIs to enable application development and innovation
Build services using new technologies

Appendix A: Country Snapshots

32
Trust with Fintech FirmsTrust with Fintech Firms
Likelihood to Refer
Likelihood to Stay
Likelihood to Refer
Likelihood to Purchase
CEI Rank CEI Index Positive Experience Trust with Primary Bank
Customers’ Perspective of Banks
Customers’ Perspective of Fintech Firms
Australia
Split of Fintech Customers by Number ofRelationships
Customer Channel Usage at Least Weekly
FintechAdoption Rank
Fintech Adoption
Top 3 Customers’ Perceived Bene�tswith Fintech Firms
Source: 2016 Retail Banking Voice of the Customer Survey, Capgemini
Pro�table Customer Behavior

33World Retail Banking Report 2016
Trust with Fintech Firms
Likelihood to Refer
Likelihood to Stay
Likelihood to Refer
Likelihood to Purchase
CEI Rank CEI Index Positive Experience Trust with Primary Bank
Source: 2016 Retail Banking Voice of the Customer Survey, Capgemini
Customers’ Perspective of Banks
Customers’ Perspective of Fintech Firms
Belgium
2373.3 56.7% 37.5%
49.5%
59.3%
23.0%
11.4%
6.6%
57.9%
30.5%
6.2%
70.6%
16.1%
13.3%
12.2%
39.9%
69.0%
68.5%
69.0%
Split of Fintech Customers by Number ofRelationships
Customer Channel Usage at Least Weekly
Mobile
Branch
Social Media
= 20%
= 20%
FintechAdoption Rank
Fintech Adoption
1
2
3+
Top 3 Customers’ Perceived Bene�tswith Fintech Firms
Internet
31
Faster Services
Ease of Use
Good Service/Experience
Pro�table Customer Behavior

34
Brazil
Trust with Fintech Firms
Likelihood to Refer
Likelihood to Stay
Likelihood to Refer
Likelihood to Purchase
CEI Rank CEI Index Positive Experience Trust with Primary Bank
Source: 2016 Retail Banking Voice of the Customer Survey, Capgemini
Customers’ Perspective of Banks
Customers’ Perspective of Fintech Firms
Split of Fintech Customers by Number ofRelationships
Customer Channel Usage at Least Weekly = 20%
= 20%
FintechAdoption Rank
Fintech Adoption
1
2
3+
Top 3 Customers’ Perceived Bene�tswith Fintech Firms
75.3 52.4% 60.8%
18
59.4%
Mobile 49.4%
Branch 23.5%
Social Media 13.1%
45.6%
47.8%
26.3%
Internet
73.9%6
43.7%30.5%
25.9%
47.4%
68.7%
88.1%
87.1%
89.5%
Faster Services
Ease of Use
Good Service/Experience
Pro�table Customer Behavior

35World Retail Banking Report 2016
Trust with Fintech Firms
Likelihood to Refer
Likelihood to Stay
Likelihood to Refer
Likelihood to Purchase
CEI Rank CEI Index Positive Experience Trust with Primary Bank
Source: 2016 Retail Banking Voice of the Customer Survey, Capgemini
Customers’ Perspective of Banks
Customers’ Perspective of Fintech Firms
Split of Fintech Customers by Number ofRelationships
Customer Channel Usage at Least Weekly
Mobile
73.0 52.3% 36.5%
67.7%
19.6%
7.9%
6.3%
53.4%
29.6%
6.9%
51.6%
73.1%
17.3%
9.6%
17.1%
46.9%
82.3%
76.2%
82.7%
France
24
Branch
Social Media
= 20%
= 20%
FintechAdoption Rank
Fintech Adoption
1
2
3+
Top 3 Customers’ Perceived Bene�tswith Fintech Firms
Internet
Faster Services
Ease of Use
Good Service/Experience
29
Pro�table Customer Behavior

36
Trust with Fintech Firms
Likelihood to Refer
Likelihood to Stay
Likelihood to Refer
Likelihood to Purchase
CEI Rank CEI Index Positive Experience Trust with Primary Bank
Source: 2016 Retail Banking Voice of the Customer Survey, Capgemini
Customers’ Perspective of Banks
Customers’ Perspective of Fintech Firms
Split of Fintech Customers by Number ofRelationships
Customer Channel Usage at Least Weekly
Mobile
Branch
Social Media
= 20%
= 20%
FintechAdoption Rank
Fintech Adoption
1
2
3+
Top 3 Customers’ Perceived Bene�tswith Fintech Firms
Internet
Faster Services
Lower Fees
Ease of Use
77.1 62.3% 56.9%
61.3%
43.1%
15.2%
1366.3%
24.0%
66.3%
84.3%
83.7%
84.9%
Germany
57.9%
26.5%
23.0%
5.2%
63.3%22.3%
14.5%
12
Pro�table Customer Behavior

37World Retail Banking Report 2016
Trust with Fintech Firms
Likelihood to Refer
Likelihood to Stay
Likelihood to Refer
Likelihood to Purchase
CEI Rank CEI Index Positive Experience Trust with Primary Bank
Source: 2016 Retail Banking Voice of the Customer Survey, Capgemini
Customers’ Perspective of Banks
Customers’ Perspective of Fintech Firms
Split of Fintech Customers by Number ofRelationships
Customer Channel Usage at Least Weekly = 20%
= 20%
FintechAdoption Rank
Fintech Adoption
1
2
3+
Top 3 Customers’ Perceived Bene�tswith Fintech Firms
Lower Fees
70.0 41.7% 35.4%
41.1%
18.2%
12.5%
2458.1%
25.1%
33.0%
73.1%
69.4%
77.2%
Hong Kong
50.2%
25.5%
14.4%
14.4%
65.6%
22.8%
11.6%
27
Mobile
Branch
Social Media
Internet
Faster Services
Ease of Use
Pro�table Customer Behavior

38
Trust with Fintech Firms
Likelihood to Refer
Likelihood to Stay
Likelihood to Refer
Likelihood to Purchase
CEI Rank CEI Index Positive Experience Trust with Primary Bank
Source: 2016 Retail Banking Voice of the Customer Survey, Capgemini
Customers’ Perspective of Banks
Customers’ Perspective of Fintech Firms
Split of Fintech Customers by Number ofRelationships
Customer Channel Usage at Least Weekly
Mobile
Branch
Social Media
= 20%
= 20%
FintechAdoption Rank
Fintech Adoption
1
2
3+
Top 3 Customers’ Perceived Bene�tswith Fintech Firms
Internet
Faster Services
Ease of Use
Good Service/Experience
73.4 43.8% 75.9%
40.2%
55.0%
37.5%
576.9%
61.0%
70.7%
India
59.8%
45.6%
21.5%
21.7%
89.4%
88.1%
89.6%
35.2%
35.0%
29.8%
22
Pro�table Customer Behavior

39World Retail Banking Report 2016
Trust with Fintech Firms
Likelihood to Refer
Likelihood to Stay
Likelihood to Refer
Likelihood to Purchase
CEI Rank CEI Index Positive Experience Trust with Primary Bank
Source: 2016 Retail Banking Voice of the Customer Survey, Capgemini
Customers’ Perspective of Banks
Customers’ Perspective of Fintech Firms
Faster Services
Split of Fintech Customers by Number ofRelationships
Customer Channel Usage at Least Weekly
Mobile
Branch
Social Media
= 20%
= 20%
FintechAdoption Rank
Fintech Adoption
1
2
3+
Top 3 Customers’ Perceived Bene�tswith Fintech Firms
Internet
Ease of Use
Good Service/Experience
75.7 59.5% 35.0%
46.0%
32.4%
13.8%
1962.4%
23.8%
59.6%
Italy
59.2%
33.8%
12.2%
10.0%
82.4%
79.8%
86.5%
69.6%
19.9%
10.6%
17
Pro�table Customer Behavior

40
Trust with Fintech Firms
Likelihood to Refer
Likelihood to Stay
Likelihood to Refer
Likelihood to Purchase
CEI Rank CEI Index Positive Experience Trust with Primary Bank
Source: 2016 Retail Banking Voice of the Customer Survey, Capgemini
Customers’ Perspective of Banks
Customers’ Perspective of Fintech Firms
Split of Fintech Customers by Number ofRelationships
Customer Channel Usage at Least Weekly
Mobile
Branch
Social Media
= 20%
= 20%
FintechAdoption Rank
Fintech Adoption
1
2
3+
Top 3 Customers’ Perceived Bene�tswith Fintech Firms
Internet
Ease of Use
Lower Fees
Faster Service
69.4 40.3% 29.1%
57.4%
16.9%
4.2%
3224.3%
17.3%
23.8%
Japan
26.9%
13.1%
11.4%
3.0%
73.8%
72.1%
82.0%
57.4%24.6%
18.0%
29
Pro�table Customer Behavior

41World Retail Banking Report 2016
Trust with Fintech Firms
Likelihood to Refer
Likelihood to Stay
Likelihood to Refer
Likelihood to Purchase
CEI Rank CEI Index Positive Experience Trust with Primary Bank
Source: 2016 Retail Banking Voice of the Customer Survey, Capgemini
Customers’ Perspective of Banks
Customers’ Perspective of Fintech Firms
Split of Fintech Customers by Number ofRelationships
Customer Channel Usage at Least Weekly
Mobile
Branch
Social Media
= 20%
= 20%
FintechAdoption Rank
Fintech Adoption
1
2
3+
Top 3 Customers’ Perceived Bene�tswith Fintech Firms
Internet
Good Service/Experience
Ease of Use
Faster Service
80.4 70.6% 54.1%
67.7%
37.9%
5.6%
3050.5%
21.8%
49.0%
Netherlands
69.5%
42.1%
4.6%
6.6%
72.3%
71.9%
77.9%
65.6%
23.3%
11.1%
2
Pro�table Customer Behavior
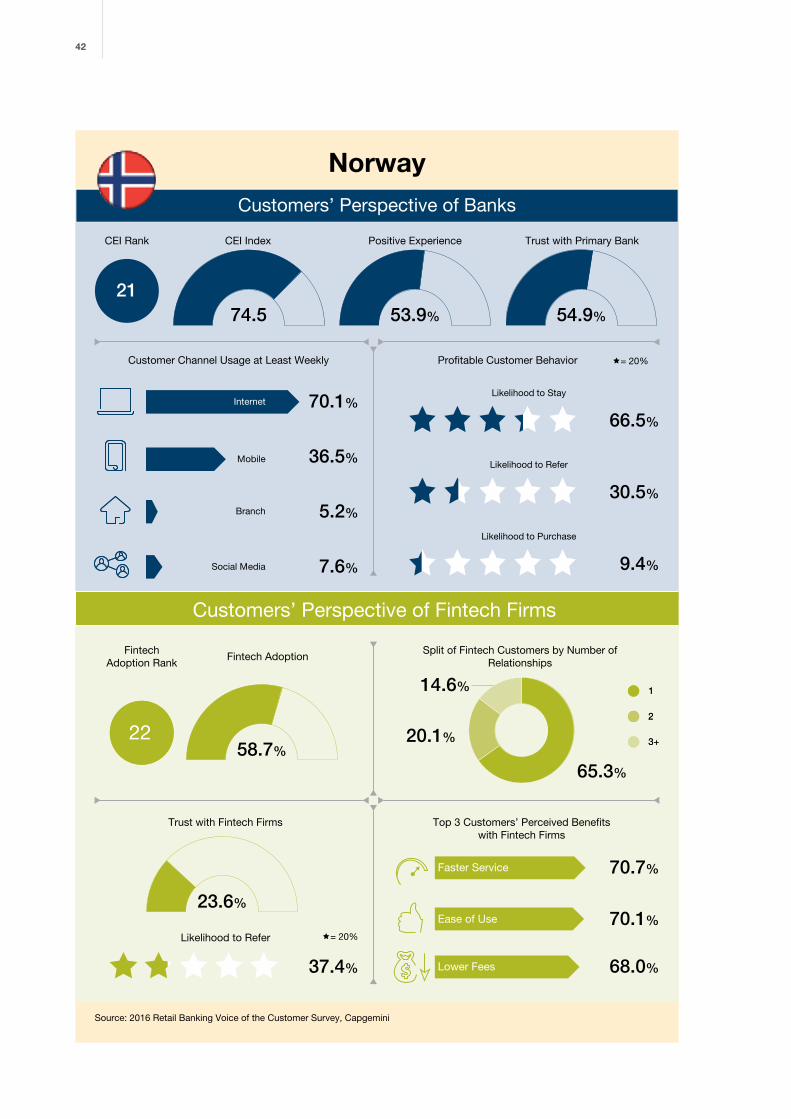
42
Trust with Fintech Firms
Likelihood to Refer
Likelihood to Stay
Likelihood to Refer
Likelihood to Purchase
CEI Rank CEI Index Positive Experience Trust with Primary Bank
Source: 2016 Retail Banking Voice of the Customer Survey, Capgemini
Customers’ Perspective of Banks
Customers’ Perspective of Fintech Firms
Split of Fintech Customers by Number ofRelationships
Customer Channel Usage at Least Weekly
Mobile
Branch
Social Media
= 20%
= 20%
FintechAdoption Rank
Fintech Adoption
1
2
3+
Top 3 Customers’ Perceived Bene�tswith Fintech Firms
Internet
Lower Fees
Faster Service
Ease of Use
1
2
3+
74.5 53.9% 54.9%
66.5%
30.5%
9.4%
2258.7%
23.6%
37.4%
Norway
70.1%
36.5%
5.2%
7.6%
70.1%
68.0%
70.7%
65.3%
20.1%
14.6%
21
Pro�table Customer Behavior

43World Retail Banking Report 2016
Trust with Fintech Firms
Likelihood to Refer
Likelihood to Stay
Likelihood to Refer
Likelihood to Purchase
CEI Rank CEI Index Positive Experience Trust with Primary Bank
Source: 2016 Retail Banking Voice of the Customer Survey, Capgemini
Customers’ Perspective of Banks
Customers’ Perspective of Fintech Firms
Good Service/Experience
Ease of Use
Faster Service
Split of Fintech Customers by Number ofRelationships
Customer Channel Usage at Least Weekly
Mobile
Branch
Social Media
= 20%
= 20%
FintechAdoption Rank
Fintech Adoption
1
2
3+
Top 3 Customers’ Perceived Bene�tswith Fintech Firms
Internet
71.0 36.0% 44.4%
55.8%
28.0%
11.4%
1564.0%
27.0%
36.9%
Singapore
42.8%
28.2%
9.8%
11.8%
79.4%
78.8%
81.3%
64.7%
21.6%
13.8%
26
Pro�table Customer Behavior

44
Trust with Fintech Firms
Likelihood to Refer
Likelihood to Stay
Likelihood to Refer
Likelihood to Purchase
CEI Rank CEI Index Positive Experience Trust with Primary Bank
Source: 2016 Retail Banking Voice of the Customer Survey, Capgemini
Customers’ Perspective of Banks
Customers’ Perspective of Fintech Firms
Split of Fintech Customers by Number ofRelationships
Customer Channel Usage at Least Weekly
65.3 35.7% 40.4%
37.8%
30.3%
11.0%
1166.9%
27.1%
50.9%
Spain
54.0%
26.3%
12.5%
13.1%
80.7%
79.8%
81.5%
54.5%
29.8%
15.8%
32
Mobile
Branch
Social Media
= 20%
= 20%
FintechAdoption Rank
Fintech Adoption
1
2
3+
Top 3 Customers’ Perceived Bene�tswith Fintech Firms
Internet
Lower Fees
Faster Service
Good Service/Experience
Pro�table Customer Behavior

45World Retail Banking Report 2016
Trust with Fintech Firms
Likelihood to Refer
Likelihood to Stay
Likelihood to Refer
Likelihood to Purchase
CEI Rank CEI Index Positive Experience Trust with Primary Bank
Source: 2016 Retail Banking Voice of the Customer Survey, Capgemini
Customers’ Perspective of Banks
Customers’ Perspective of Fintech Firms
Split of Fintech Customers by Number ofRelationships
Customer Channel Usage at Least Weekly
Mobile
Branch
Social Media
= 20%
= 20%
FintechAdoption Rank
Fintech Adoption
1
2
3+
Top 3 Customers’ Perceived Bene�tswith Fintech Firms
Internet
Lower Fees
Ease of Use
Good Service/Experience
76.3 60.7% 53.4%
65.4%
37.8%
11.4%
1067.6%
26.0%
52.4%
Sweden
60.4%
35.8%
3.6%
7.8%
63.9%
62.1%
70.7%
70.1%
16.6%
13.3%
15
Pro�table Customer Behavior

46
Trust with Fintech Firms
Likelihood to Refer
Likelihood to Stay
Likelihood to Refer
Likelihood to Purchase
CEI Rank CEI Index Positive Experience Trust with Primary Bank
Source: 2016 Retail Banking Voice of the Customer Survey, Capgemini
Customers’ Perspective of Banks
Customers’ Perspective of Fintech Firms
83.4%
81.0%
85.7%
U.K.
480.2 58.4% 47.7%
Pro�table Customer Behavior
55.1%
37.8%
13.1%
Split of Fintech Customers by Number ofRelationships
Customer Channel Usage at Least Weekly
Mobile
Branch
Social Media
= 20%
= 20%
FintechAdoption Rank
Fintech Adoption
1
2
3+
Top 3 Customers’ Perceived Bene�tswith Fintech Firms
68.2%9
72.6%
14.6%
12.8%
27.4%
53.6%
65.0%
30.8%
15.7%
5.2%
Internet
Ease of Use
Good Service/Experience
Faster Services

47World Retail Banking Report 2016
Trust with Fintech Firms
Likelihood to Refer
Likelihood to Stay
Likelihood to Refer
Likelihood to Purchase
CEI Rank CEI Index Positive Experience Trust with Primary Bank
Source: 2016 Retail Banking Voice of the Customer Survey, Capgemini
Customers’ Perspective of Banks
Customers’ Perspective of Fintech Firms
Split of Fintech Customers by Number ofRelationships
Customer Channel Usage at Least Weekly
Mobile
Branch
Social Media
= 20%
= 20%
FintechAdoption Rank
Fintech Adoption
1
2
3+
Top 3 Customers’ Perceived Bene�tswith Fintech Firms
Faster Services
Ease of Use
Good Service/Experience
80.0 60.5% 69.0%
58.9%
53.6%
22.8%
2062.3%
40.2%
69.6%
U.S.
65.4%
43.4%
25.3%
13.1%
59.6%
23.2%
17.2%
6
90.4%
87.7%
91.6%
Internet
Pro�table Customer Behavior

Appendix B: Customer Experience by Country

49World Retail Banking Report 2016
Figure B1: Customer Experience Index, by Country, 2015–2016
Source: Capgemini Financial Services Analysis, 2016; 2016 Retail Banking Voice of the Customer Survey, Capgemini Global Financial Services
0 20 40 60 10080
CEI (On a Scale of 100)
Point Change2015–2016
2016
2015
7.5
7.0
7.0
75.6 (2016)Global Average 72.7 (2015)
80.978.9
80.473.4
80.477.5
80.273.9
80.073.7
80.076.6
79.975.8
79.076.2
79.073.6
78.876.1
77.476.4
77.170.8
76.876.7
76.473.6
76.369.3
76.074.5
75.772.6
75.371.1
74.569.5
74.569.7
74.568.1
73.470.9
73.369.2
73.069.6
71.071.4
69.476.8
69.461.9
68.476.4
66.664.7
65.373.7
Canada
Netherlands
Czech Republic
U.K.
Switzerland
U.S.
Russia
Austria
Portugal
Turkey
Australia
Germany
South Africa
Poland
Sweden
Finland
Italy
Brazil
Denmark
China
Norway
India
Belgium
France
Saudi Arabia
Singapore
Hong Kong
Argentina
Japan
Mexico
UAE
Spain
2.0
2.9
6.3
6.3
3.4
4.1
2.8
5.4
2.7
1.0
6.3
0.1
2.8
1.5
3.1
4.2
5.0
4.8
6.4
2.5
4.1
3.4
5.0
(0.4)
4.2
(7.4)
(8.0)
1.9
(8.4)
72.967.9
70.065.8

50
Figure B2: Positive Customer Experience, by Country (%), 2015–2016
Source: Capgemini Financial Services Analysis, 2016; 2016 Retail Banking Voice of the Customer Survey, Capgemini Global Financial Services
70.656.3
67.061.4
66.859.9
66.755.8
64.854.9
63.056.9
63.050.0
62.348.4
61.650.1
60.744.7
60.554.9
60.152.1
59.551.9
58.448.0
58.249.8
56.745.4
55.946.9
55.650.3
55.051.3
53.942.8
52.442.0
52.346.2
47.139.2
43.838.1
42.734.7
42.059.5
41.733.4
40.328.1
38.156.6
36.036.1
35.753.3
34.928.4
U.S.
Italy
U.K.
Netherlands
Czech Republic
Austria
Russia
Switzerland
Canada
Portugal
Germany
Poland
Sweden
Turkey
Finland
Belgium
Denmark
South Africa
Australia
Norway
Brazil
France
Saudi Arabia
India
China
Argentina
Hong Kong
Japan
Mexico
Singapore
Spain
UAE
Customers with Positive Experience (%)
(18.5)
8.4
5.6
14.3
6.9
10.8
9.9
6.1
13.0
13.8
11.5
16.0
5.6
8.0
7.6
10.4
11.2
9.0
5.3
3.7
11.1
10.4
6.2
7.9
5.7
8.0
(17.5)
8.3
12.2
(0.1)
(17.6)
6.5
54.7% (2016)Global Average 48.1% (2015) Percentage Point Change2015–2016
0 20 40 60 80
2016
2015

51World Retail Banking Report 2016

Methodology

53World Retail Banking Report 2016
2016 Global Retail Banking Voice of the Customer SurveyA global survey of customer attitudes toward retail banking forms the basis of the tenth annual World Retail Banking Report. Our comprehensive Retail Banking Voice of the Customer Survey polled over 16,000 retail banking customers in 32 countries. The survey sought to gain deep insight into customer preferences, expectations, and behaviors with respect to specific types of retail banking transactions. The survey questioned customers on their general satisfaction with their bank, the importance of specific channels for executing different types of transactions, and their satisfaction with those transactions, among other factors. The survey also questioned customers on their likelihood to stay, refer a friend, purchase another product from their bank, why they choose to stay with/change their bank, and their behavior toward using products/services from fintech firms. We supplemented these detailed findings with in-depth interviews with senior banking executives around the world.
Capgemini’s Proprietary Customer Experience Index (CEI)The responses from the global Retail Banking Voice of the Customer Survey, which analyzed customer experiences across 80 data points, provide the underlying input for our proprietary CEI. The CEI calculates a customer experience score that can be analyzed across a number of variables. The scores provide insight on how customers perceive the quality of their bank interactions. They can be dissected by product, channel and lifecycle stage, as well as by demographic variables, such as country, age, investable assets and comfort level with technology. The result is an unparalleled view of how customers regard their banks, and the specific levers banks can push to increase the number of positive experiences for customers. The index provides a foundation for banks to develop an overall retail delivery strategy that will increase satisfaction in ways that are most meaningful to customers.

54
With more than 180,000 people in over 40 countries, Capgemini is one of the world’s foremost providers of consulting, technology and outsourcing services. The Group reported 2015 global revenues of EUR 11.9 billion. Together with its clients, Capgemini creates and delivers business, technology and digital solutions that fit their needs, enabling them to achieve innovation and competitiveness. A deeply multicultural organization, Capgemini has developed its own way of working, the Collaborative Business Experience™, and draws on Rightshore®, its worldwide delivery model.
Capgemini’s Financial Services Strategic Business Unit brings deep industry experience, innovative service offerings and next generation global delivery to serve the financial services industry. With a network of 24,000 professionals – 11,000+ in India dedicated to Financial Services – and more than 900 clients worldwide, Capgemini collaborates with leading banks, insurers and capital market companies to deliver business and IT solutions and thought leadership which create tangible value.
Learn more about us at www.capgemini.com/financialservices.
Rightshore® is a trademark belonging to Capgemini.
A global non-profit organization, established in 1971 by banks and insurance companies, Efma facilitates networking between decision-makers. It provides quality insights to help banks and insurance companies make the right decisions to foster innovation and drive their transformation. Over 3,300 brands in 130 countries are Efma members.
Headquarters in Paris. Offices in London, Brussels, Barcelona, Stockholm, Bratislava, Dubai, Mumbai, and Singapore.
Visit www.efma.com.
©2016 Capgemini
All Rights Reserved. Capgemini and Efma, their services mentioned herein as well as their logos, are trademarks or registered trademarks of their respective companies. All other company, product and service names mentioned are the trademarks of their respective owners and are used herein with no intention of trademark infringement. No part of this document may be reproduced or copied in any form or by any means without written permission from Capgemini.
Disclaimer
The information contained herein is general in nature and is not intended, and should not be construed, as professional advice or opinion provided to the user. This document does not purport to be a complete statement of the approaches or steps, which may vary accordingly to individual factors and circumstances, necessary for a business to accomplish any particular business goal. This document is provided for informational purposes only; it is meant solely to provide helpful information to the user. This document is not a recommendation of any particular approach and should not be relied upon to address or solve any particular matter. The text of this document was originally written in English. Translation to languages other than English is provided as a convenience to our users. Capgemini and Efma disclaim any responsibility for translation inaccuracies. The information provided herein is on an ‘as-is’ basis. Capgemini and Efma disclaim any and all representations and warranties of any kind concerning any information provided in this report and will not be liable for any direct, indirect, special, incidental, consequential loss or loss of profits arising in any way from the information contained herein.
About Us

55World Retail Banking Report 2016
AcknowledgementsWe would like to extend a special thanks to all of the banks, fintech firms and individuals who participated in our Banking Executive Interviews and Surveys.
The following companies are among the participants who agreed to be publicly named:ABN Amro Bank, Netherlands; ADCB, UAE; Al Khalij Commercial Bank, Qatar; Alior Bank S.A., Poland; ANZ Bank, Australia; Associated Bank, U.S.; Banca Agricola Commerciale, Italy; Banca Carige, Italy; Banca Mediolanum, Italy; Banca Mps Leasing e Factoring, Italy; Banca Popolare di Milano, Italy; Banca Popolare di Sondrio, Italy; BancABC, Botswana; Banco ActivoBank, Portugal; Banco Bradesco, Brazil; Banco de Credito del Peru, Peru; Banco de Sabadell, Spain; Banco Popular, Spain; Banco Santander, Spain; Banco Supervielle, Argentina; Banjo Loans, Australia; Bank Central Asia, Indonesia; Bank Millennium, Poland; Bank of Ireland, Ireland; Bank Simpanan Nasional, Malaysia; Bankhaus August Lenz & Co. AG, Germany; Bankia, Spain; Bankinter, Spain; Banque Libano-Française, Lebanon; Barclays, U.K.; BCDC, Congo; BCP, Peru; Bendigo and Adelaide Bank, Australia; BIT Bank, Lebanon; BNL - BNP Paribas, Italy; BNP Paribas Fortis, Belgium; BNP Paribas, France; Caixa Econômica Federal, Brazil; Cassa di Risparmio di Cento, Italy; Catalunya Banc, Spain; CBW Bank, U.S.; CheBanca!, Italy; CIB Bank ZRT, Hungary; CIBC, Canada; Crèdit Andorrà, Andorra; Credit Europe Bank Ltd., Russia; Credit Libanais, Lebanon; Credit Union Australia Limited, Australia; Credito Emiliano, Italy; Crelan, Belgium; Danske Bank, Denmark; Desjardins, Canada; Deutsche Bank, Italy; DNB, Norway; Ecobank, Cameroon; Erste Group Bank AG, Austria; Erste&Steiermärkische Bank d.d., Croatia; Fideuram, Italy; First National Bank, South Africa; Groupama Banque, France; ING, Belgium; Isbank, Turkey; JSC TBC Bank, Georgia; Laxmi Bank Limited, Nepal; Maritime Bank, Vietnam; Millennium BCP, Portugal; MoneyPlace, Australia; Moula, Australia; National Australia Bank, Australia; National Bank Of Egypt, Egypt; National Bank of Greece, Greece; NIBC, Netherlands; NLB banka AD Beograd, Serbia; NLB Montenegrobanka, Montenegro; Novo Banco, Portugal; Ocean, Australia; OTP Bank, CEE; OTP Banka Slovensko, Slovakia; PKO Bank Polski, Poland; Privredna banka Zagreb d.d., Croatia; Raiffeisen Bank International, Austria; Raiffeisen Bank, Kosovo; Raiffeisen Bank, Romania; Rosbank, Russia; Royal Bank of Canada, Canada; Sandnes Sparebank, Norway; Santander Consumer Bank, Norway; Sberbank CZ, Czech Republic; Sberbank of Russia, Russia; Skandinaviska Enskilda Banken AB, Sweden; Smartika, Italy; SpareBank 1 Alliansen, Norway; SpareBank 1 Group, Norway; Sparebanken Hedmark, Norway; Sumitomo Mitsui Banking Corporation, Japan; Swedbank, Baltic; The Bank of Tokyo-Mitsubishi UFJ, Ltd, Japan; Turkish Economy Bank, Turkey; UniCredit Bank Austria, Austria; UniCredit Bulbank, Bulgaria; Unicredit, Italy; Union Bank of Cameroon, Cameroon; United Amara Bank, Myanmar; United Bank Limited, Pakistan; United Bulgarian Bank, Bulgaria; Vaba d.d. banka Varazdin, Croatia; VTB 24, Russia and CIS; Westpac Group, Australia; Westra Wermlands Sparbank, Sweden; WIZZIT Bank, South Africa; XacBank, Mongolia; and Yapı Kredi Bank, Turkey.
We would also like to thank the following teams and individuals for helping to compile this report:William Sullivan and Vamshi Suvarna for their overall leadership for this year’s report; Amit Kumar, Avinash Saxena, and Chris Costanzo for researching, compiling, and writing the findings, as well as providing in-depth market analysis.
Capgemini’s Global Retail Banking network for providing their insights, industry expertise and overall guidance: Kartik Ramakrishnan, Nilesh Vaidya, Don Vadakan, Michael Leyva, Erik Van Druten, Kishen Kumar, Andrew Diaper, Philip Gomm, Kev Hendy, Ravi Pichan, Manish Grover, Vijaydeep Singh, Sharon Rode, Monia Ferrari, Jessica Ingrami, Mercedes Chacón Otero, Pascal Spelier, Rob Griffiths, Richard Hechenbichler, Joel Oliveira, Freek Roelofs, Shinichi Tonomura, Masao Tabata, Yasunori Taima, Takehito Yamada, Fredrik Borchgrevink, Marianne Sørlie, Johan Bergström, Jon Wallen, Kjetil Gudmundsen, Christian Morlacchi, Bruna Rigato, Antonella Taglienti, Francesco Spinelli, Christian Morlacchi, Alberto Casani, Francesco Chevallard, Pratheesh Kookanath, and Kartik Pawan.
Karen Schneider and Vanessa Baille for their overall marketing leadership for the report and the Global Product Marketing and Programs, Shared Services, Corporate Communications and Field Marketing Teams for producing and launching the report: Jyoti Goyal, Kalidas Chitambar, Partho Sarathi Bhattacharjee, Sai Bobba, Suresh Chedarada, Kanaka Donkina, Mary-Ellen Harn, Manisha Jaiswal, Martine Maître, Somesh Majumdar, Sourav Mookherjee, Stacy Prassas, Amit Rajbansh, Erin Riemer, and Suresh Sambandhan.
Vincent Bastid, Karine Coutinho, Philippe Van Fraechem, and the Efma team for their collaborative sponsorship, marketing, and continued support.

For more information, please visit:
www.worldretailbankingreport.com www.efma.com/wrbr
Please contact:
Capgemini: [email protected] Efma: [email protected]
For press inquiries, please contact:
Benjamin Pfeffer (EMEA) at [email protected] or +44 (0) 207 067 0461
Sophia Powe (North America and Rest of the World) at [email protected] or +1 212 445 8110
Mary-Ellen Harn (Capgemini) at [email protected] or +1 704 490 4146
Boris Plantier (Efma) at [email protected] or +33 1 47 42 67 69