world war i economic causes and...
TRANSCRIPT
World War I
Economic Causes and Burdens
Lecture by Robert M. Coen
Professor Emeritus of Economics
Northwestern University
November 5, 2015
Web site: faculty.wcas.northwestern.edu/~rcoen
Email: [email protected]
Today’s Lecture
International economy on the eve of 1914
Economic causes of the war?
War mobilization and economic performance
Economic costs of the war
Dec. 3 lecture: Economic Aftermath and Legacy
International Economy, 1870-1914:
Golden Age of Globalization
Growth of international trade
Growth of international investment
Heyday of the Gold Standard
Britain: dominant international economic power
Age of Imperialism
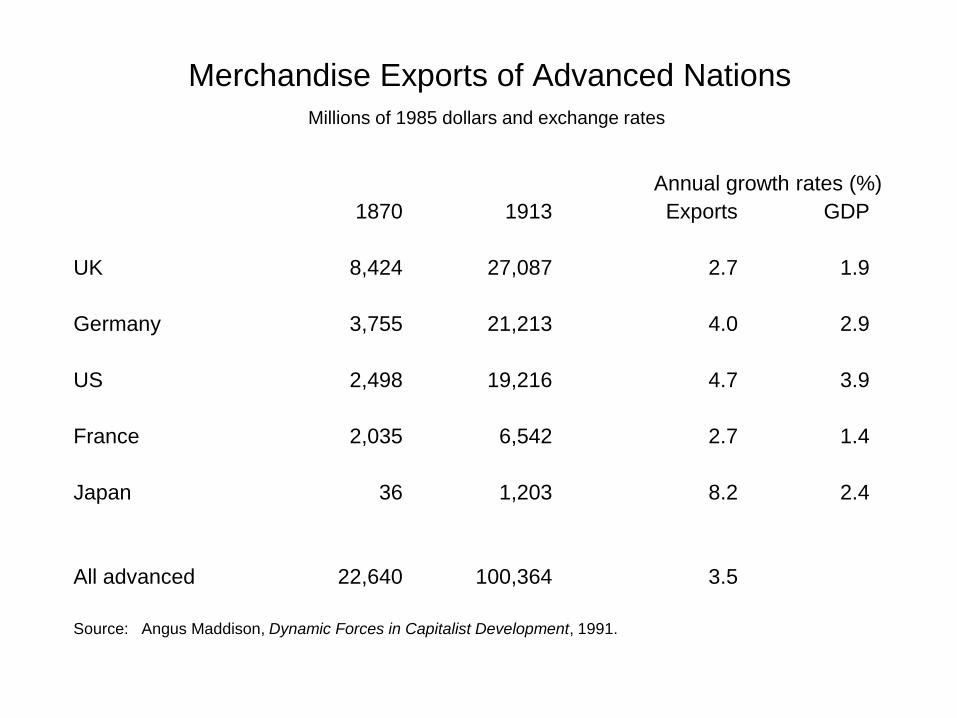
Merchandise Exports of Advanced Nations
Millions of 1985 dollars and exchange rates
Annual growth rates (%)
1870 1913 Exports GDP
UK 8,424 27,087 2.7 1.9
Germany 3,755 21,213 4.0 2.9
US 2,498 19,216 4.7 3.9
France 2,035 6,542 2.7 1.4
Japan 36 1,203 8.2 2.4
All advanced 22,640 100,364 3.5
Source: Angus Maddison, Dynamic Forces in Capitalist Development, 1991.
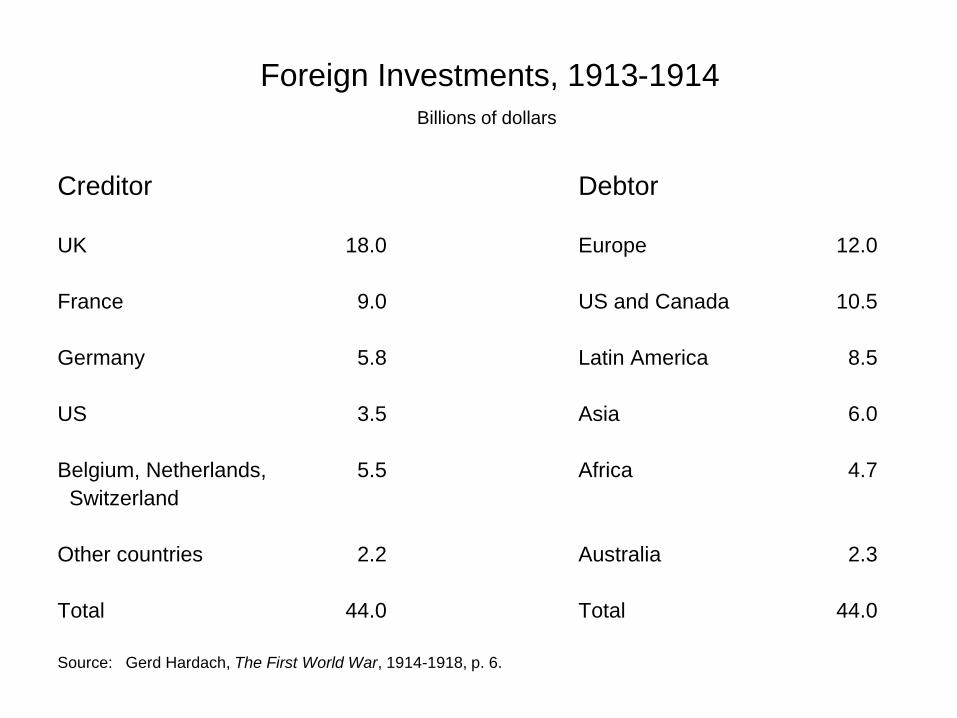
Foreign Investments, 1913-1914
Billions of dollars
Creditor Debtor
UK 18.0 Europe 12.0
France 9.0 US and Canada 10.5
Germany 5.8 Latin America 8.5
US 3.5 Asia 6.0
Belgium, Netherlands, 5.5 Africa 4.7
Switzerland
Other countries 2.2 Australia 2.3
Total 44.0 Total 44.0
Source: Gerd Hardach, The First World War, 1914-1918, p. 6.
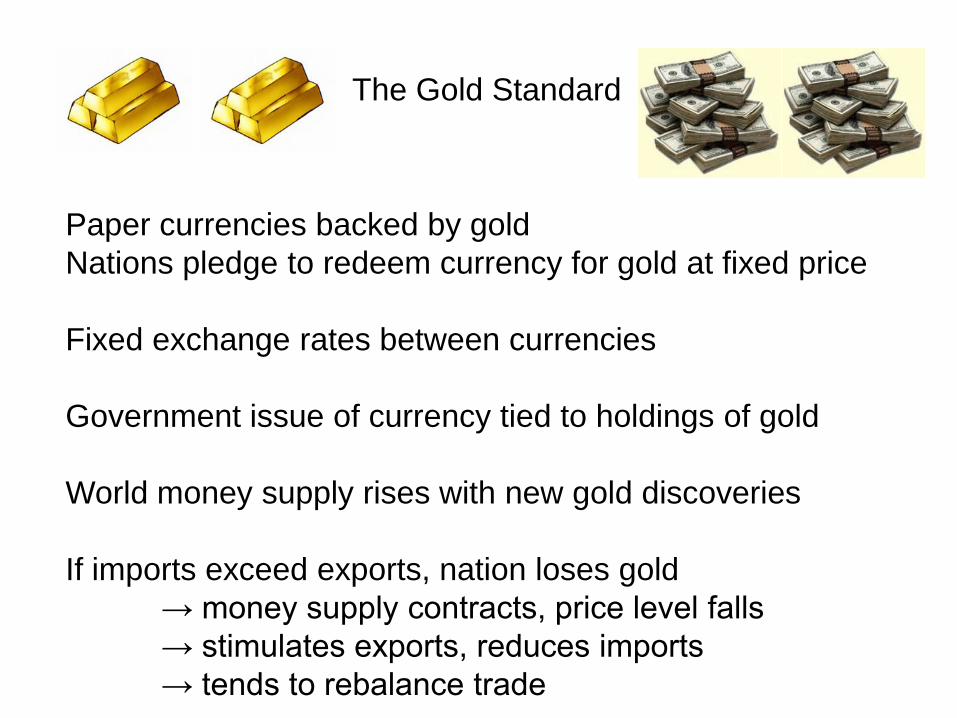
The Gold Standard
Paper currencies backed by gold
Nations pledge to redeem currency for gold at fixed price
Fixed exchange rates between currencies
Government issue of currency tied to holdings of gold
World money supply rises with new gold discoveries
If imports exceed exports, nation loses gold
→ money supply contracts, price level falls
→ stimulates exports, reduces imports
→ tends to rebalance trade
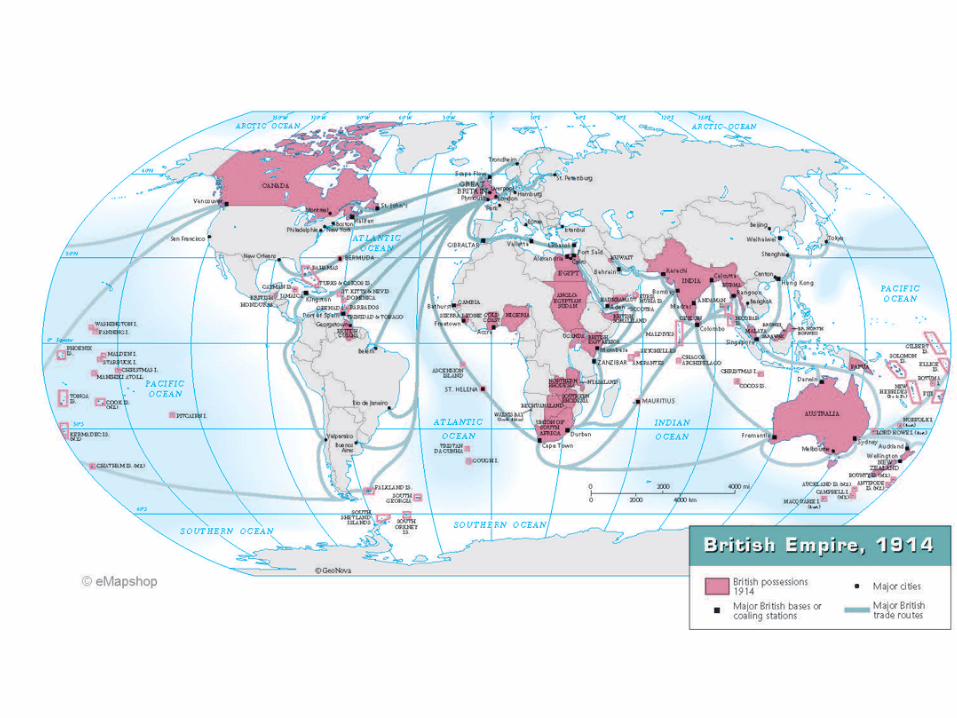
Britain Dominant International Economic Power
Largest empire: “Sun never sets on the British Empire”
Largest exporter
Largest foreign investor
Center of merchant and commercial banking: London
Largest navy
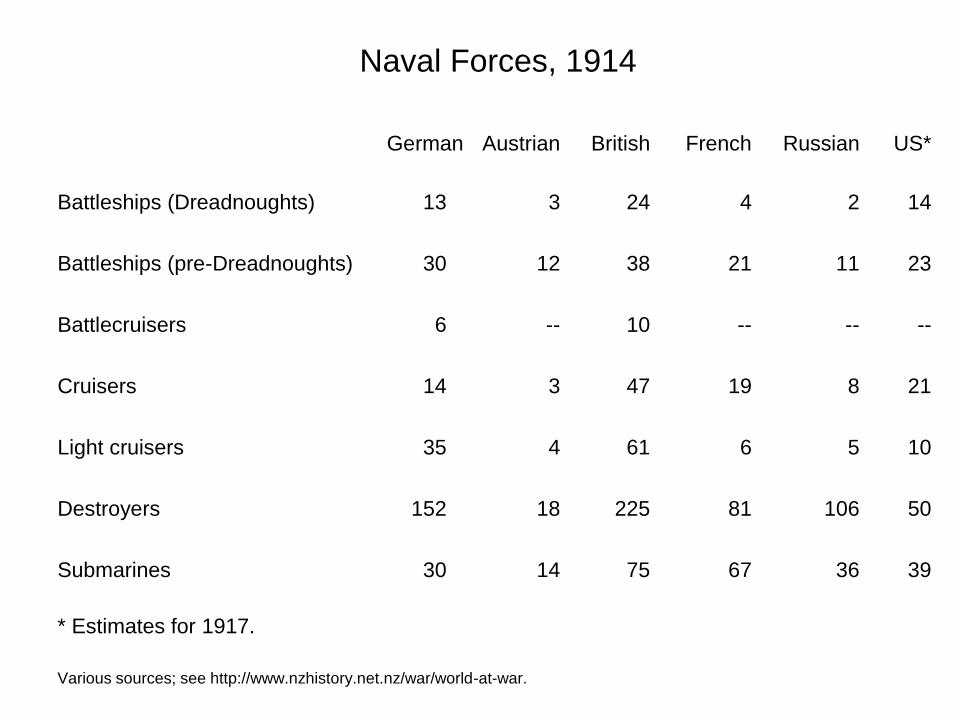
Naval Forces, 1914
German Austrian British French Russian US*
Battleships (Dreadnoughts) 13 3 24 4 2 14
Battleships (pre-Dreadnoughts) 30 12 38 21 11 23
Battlecruisers 6 -- 10 -- -- --
Cruisers 14 3 47 19 8 21
Light cruisers 35 4 61 6 5 10
Destroyers 152 18 225 81 106 50
Submarines 30 14 75 67 36 39
* Estimates for 1917.
Various sources; see http://www.nzhistory.net.nz/war/world-at-war.
Age of Imperialism
Purposes of empire
Ports and refueling stations for trade
Monopoly access to food and resources
Secure markets for exports
Lenin: Foreign investments sustain capitalists’ profits
Germany late to game
Austro-Hungarian Empire mainly European
Capitalist war over resources and markets?
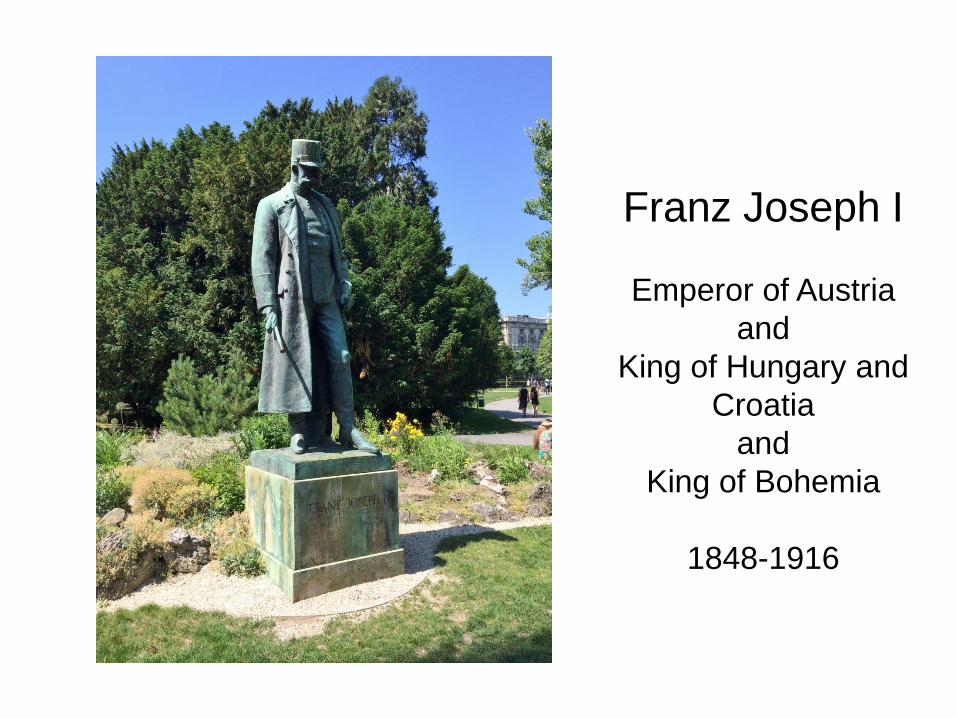
Franz Joseph I
Emperor of Austria
and
King of Hungary and
Croatia
and
King of Bohemia
1848-1916

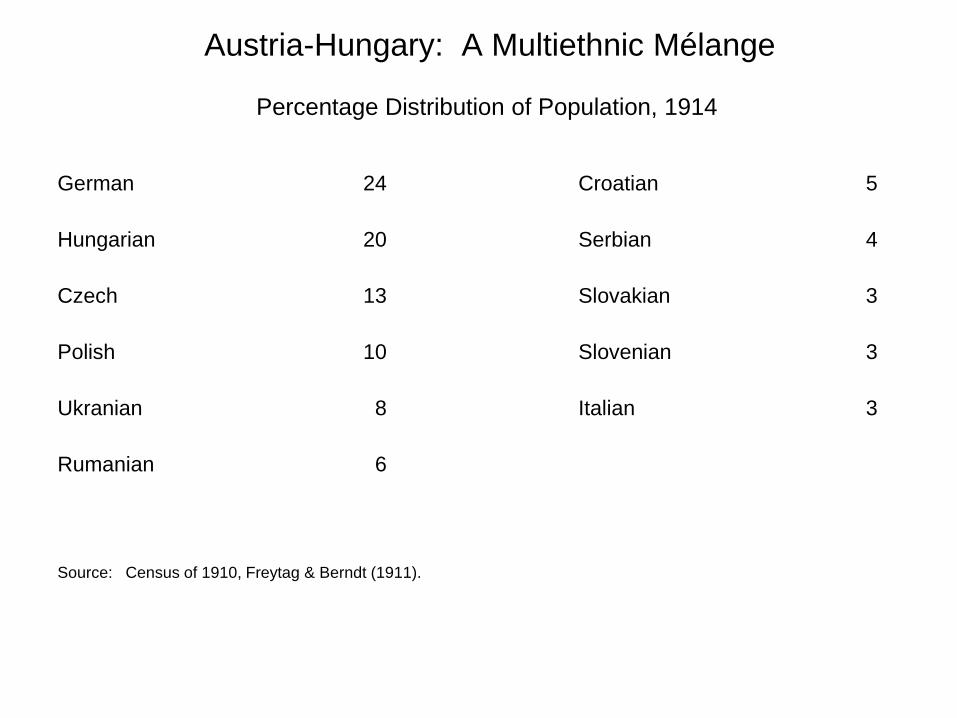
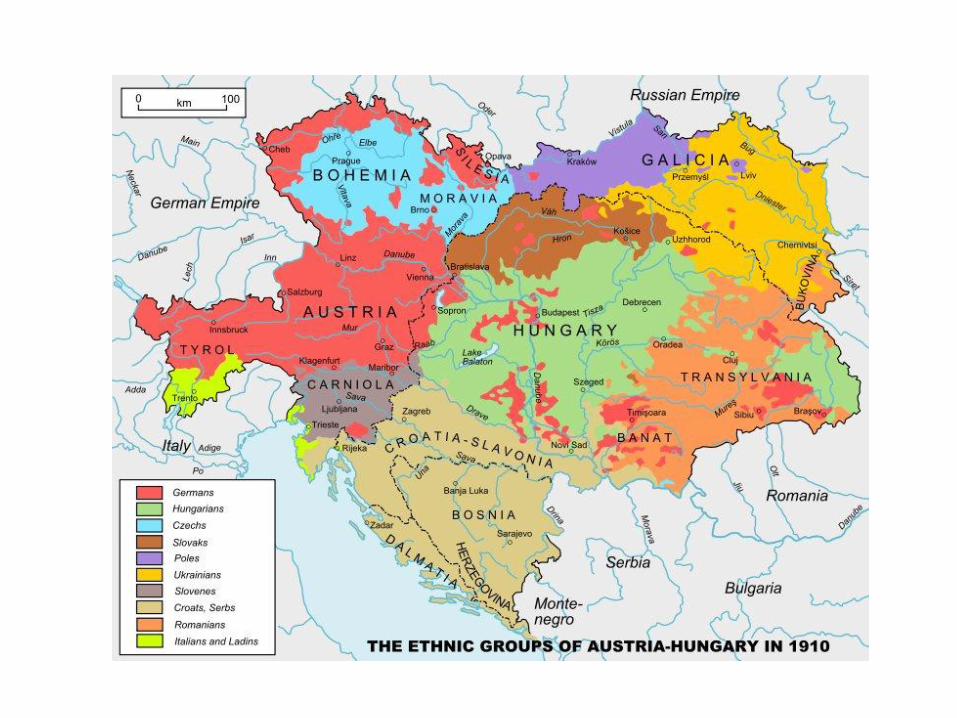
Austria-Hungary: A Multiethnic Mélange
Percentage Distribution of Population, 1914
German 24 Croatian 5
Hungarian 20 Serbian 4
Czech 13 Slovakian 3
Polish 10 Slovenian 3
Ukranian 8 Italian 3
Rumanian 6
Source: Census of 1910, Freytag & Berndt (1911).
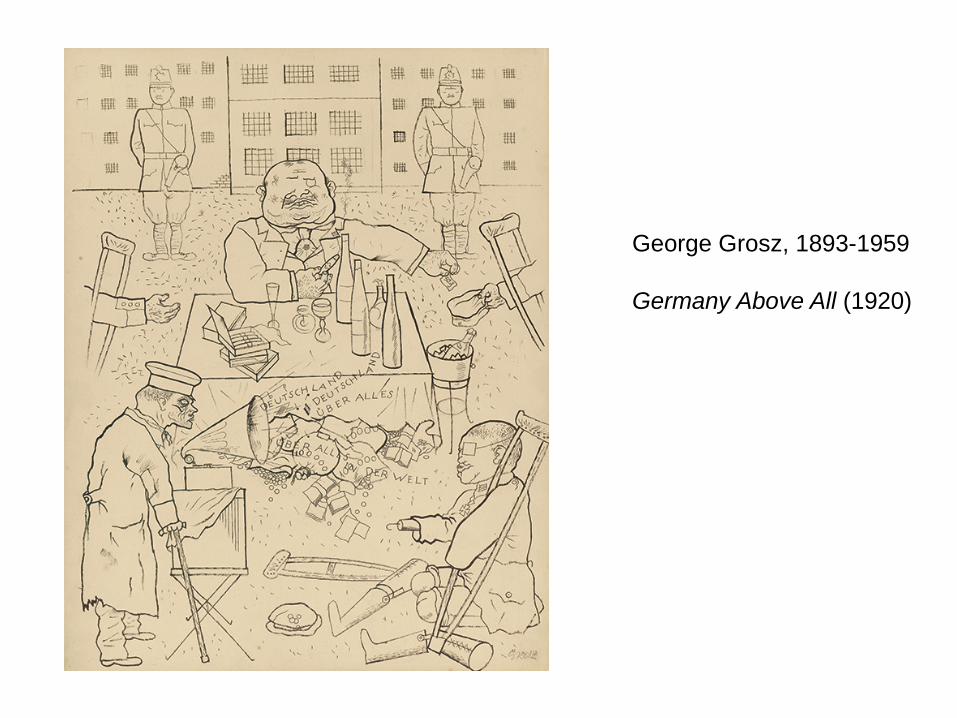
George Grosz, 1893-1959
Germany Above All (1920)


Norman Angell, 1872-1967
Awarded Nobel Peace Prize, 1933 First published 1910
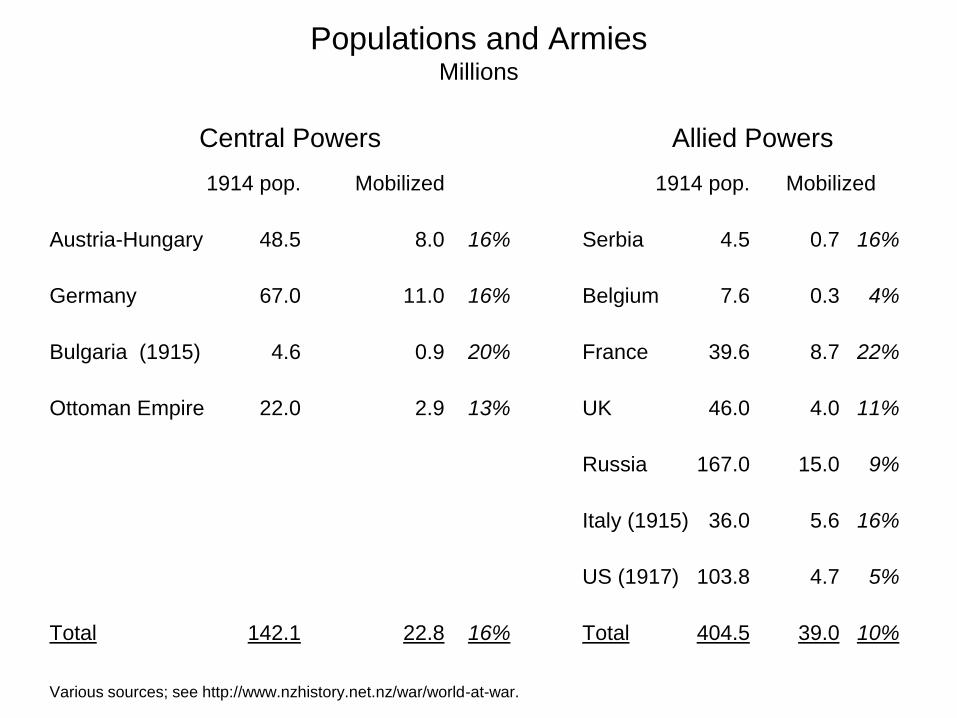
Populations and Armies Millions
Central Powers Allied Powers
1914 pop. Mobilized 1914 pop. Mobilized
Austria-Hungary 48.5 8.0 16% Serbia 4.5 0.7 16%
Germany 67.0 11.0 16% Belgium 7.6 0.3 4%
Bulgaria (1915) 4.6 0.9 20% France 39.6 8.7 22%
Ottoman Empire 22.0 2.9 13% UK 46.0 4.0 11%
Russia 167.0 15.0 9%
Italy (1915) 36.0 5.6 16%
US (1917) 103.8 4.7 5%
Total 142.1 22.8 16% Total 404.5 39.0 10%
Various sources; see http://www.nzhistory.net.nz/war/world-at-war.
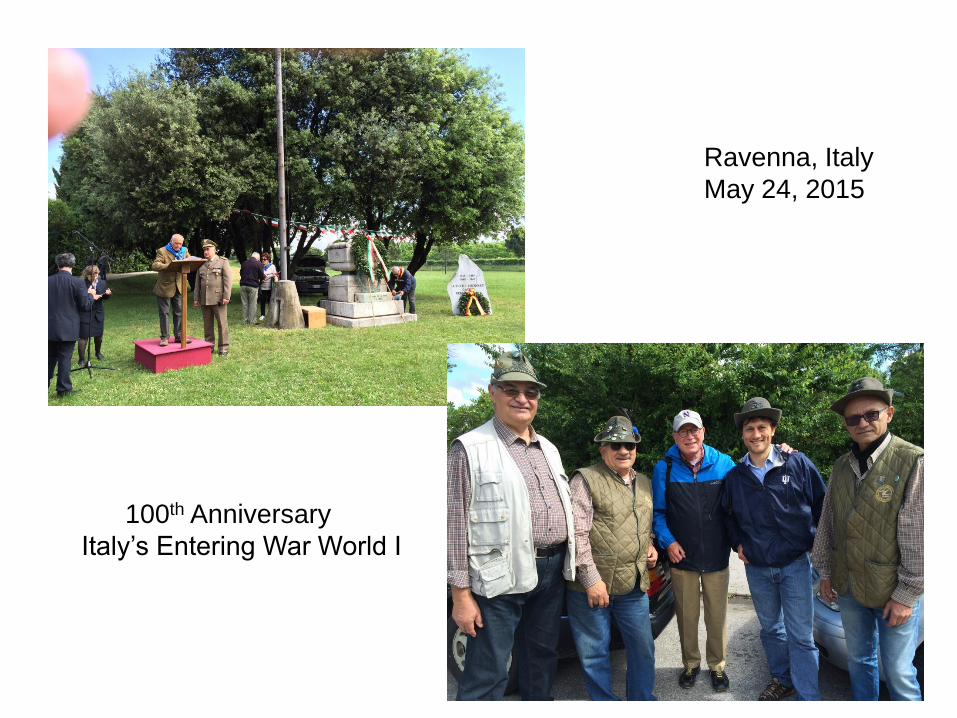
Ravenna, Italy
May 24, 2015
100th Anniversary
Italy’s Entering War World I
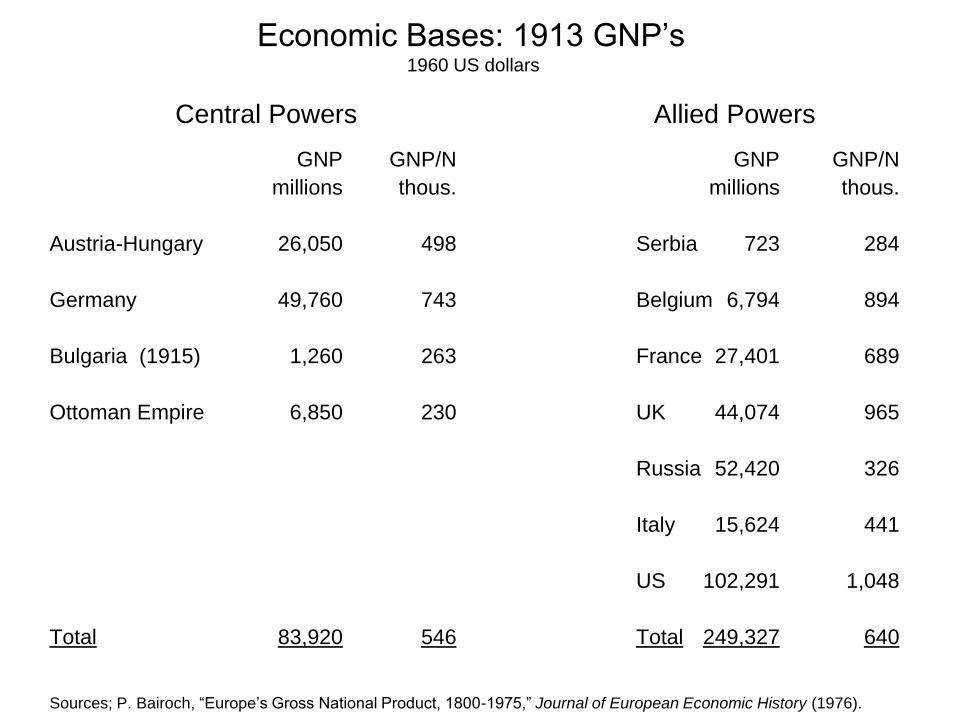
Economic Bases: 1913 GNP’s 1960 US dollars
Central Powers Allied Powers
GNP GNP/N GNP GNP/N
millions thous. millions thous.
Austria-Hungary 26,050 498 Serbia 723 284
Germany 49,760 743 Belgium 6,794 894
Bulgaria (1915) 1,260 263 France 27,401 689
Ottoman Empire 6,850 230 UK 44,074 965
Russia 52,420 326
Italy 15,624 441
US 102,291 1,048
Total 83,920 546 Total 249,327 640
Sources; P. Bairoch, “Europe’s Gross National Product, 1800-1975,” Journal of European Economic History (1976).

72
76
80
84
88
92
96
100
1913 1914 1915 1916 1917 1918
Austria Germany
Real GDP: Central Powers, 1913-1918
Index, 1913=100
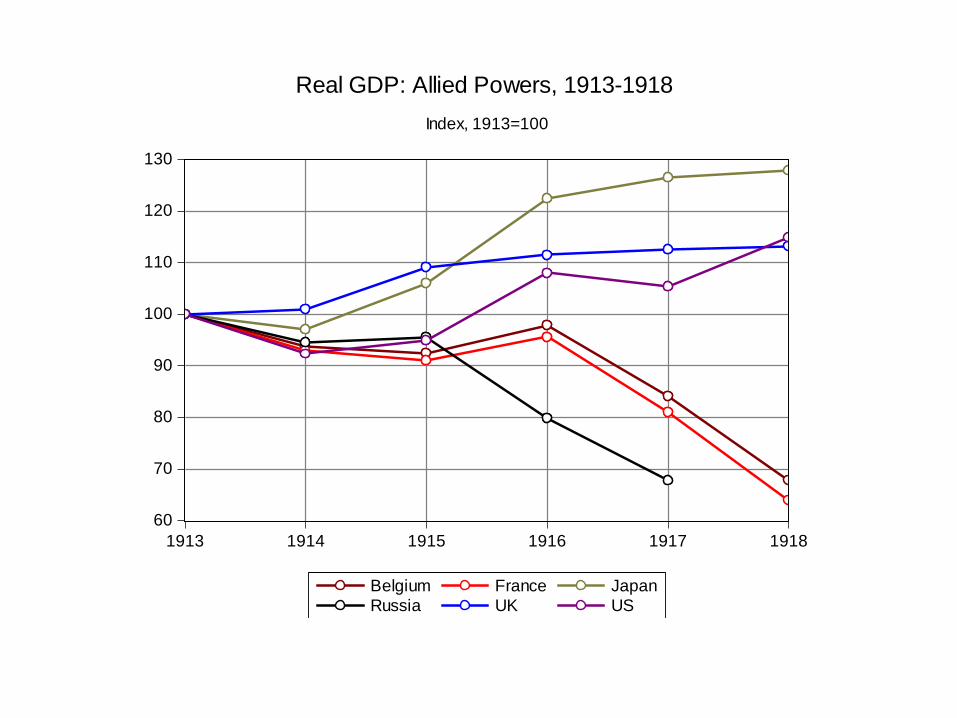
60
70
80
90
100
110
120
130
1913 1914 1915 1916 1917 1918
Belgium France Japan
Russia UK US
Real GDP: Allied Powers, 1913-1918
Index, 1913=100
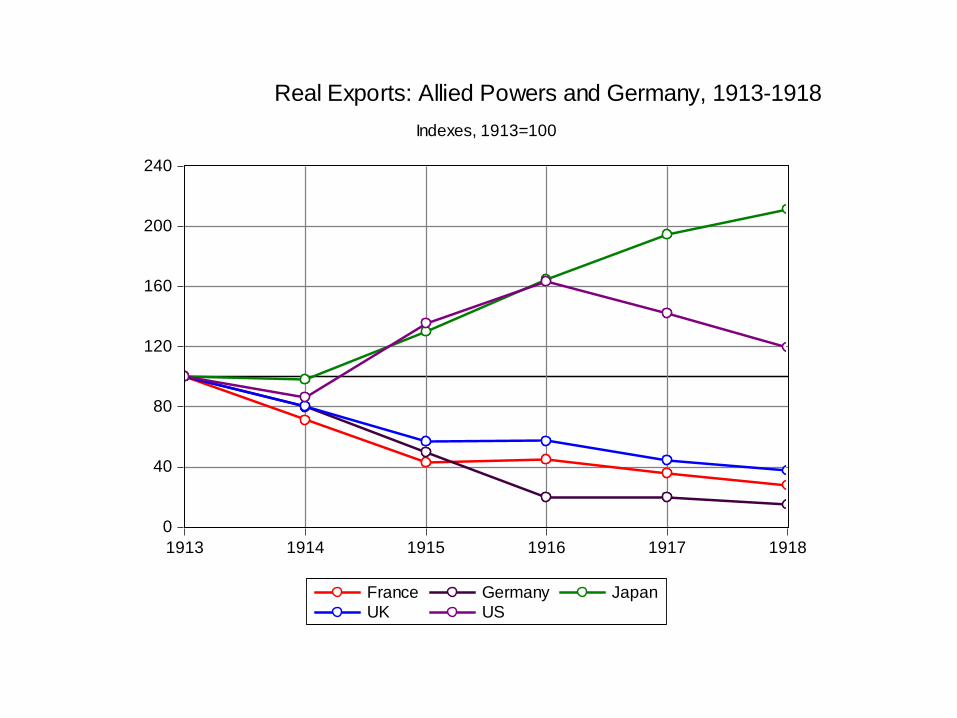
0
40
80
120
160
200
240
1913 1914 1915 1916 1917 1918
France Germany Japan
UK US
Real Exports: Allied Powers and Germany, 1913-1918
Indexes, 1913=100
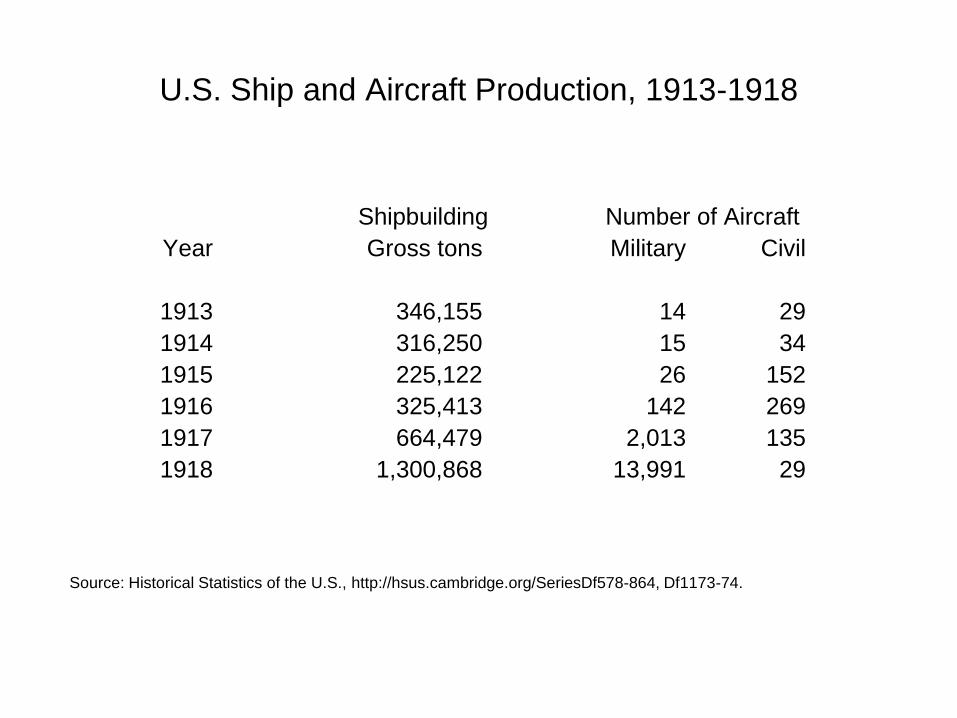
U.S. Ship and Aircraft Production, 1913-1918
Shipbuilding Number of Aircraft
Year Gross tons Military Civil
1913 346,155 14 29
1914 316,250 15 34
1915 225,122 26 152
1916 325,413 142 269
1917 664,479 2,013 135
1918 1,300,868 13,991 29
Source: Historical Statistics of the U.S., http://hsus.cambridge.org/SeriesDf578-864, Df1173-74.
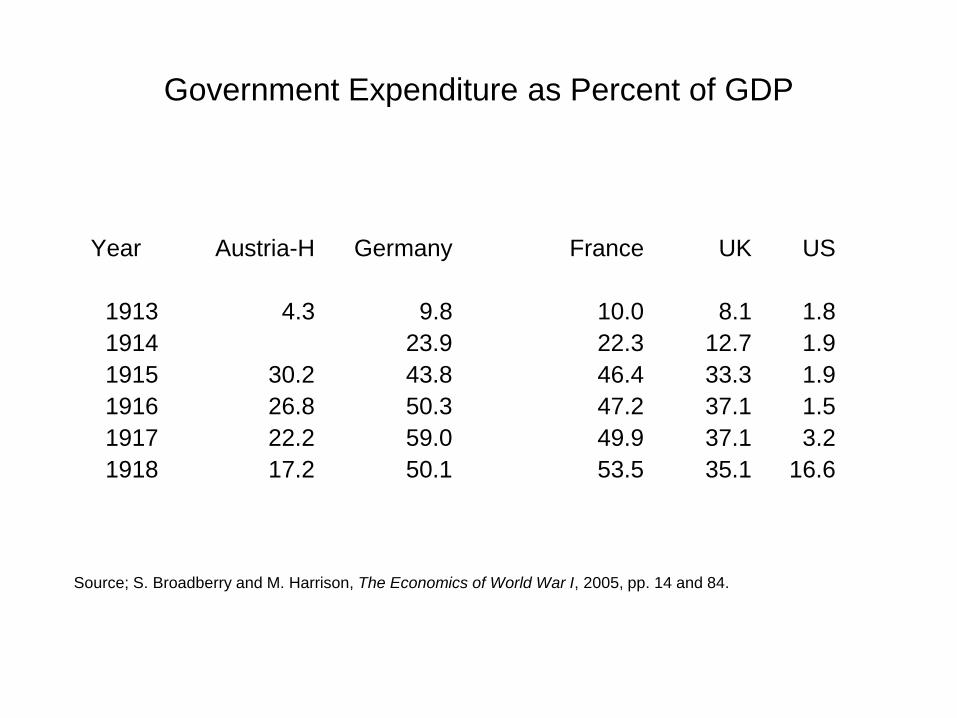
Government Expenditure as Percent of GDP
Year Austria-H Germany France UK US
1913 4.3 9.8 10.0 8.1 1.8
1914 23.9 22.3 12.7 1.9
1915 30.2 43.8 46.4 33.3 1.9
1916 26.8 50.3 47.2 37.1 1.5
1917 22.2 59.0 49.9 37.1 3.2
1918 17.2 50.1 53.5 35.1 16.6
Source; S. Broadberry and M. Harrison, The Economics of World War I, 2005, pp. 14 and 84.
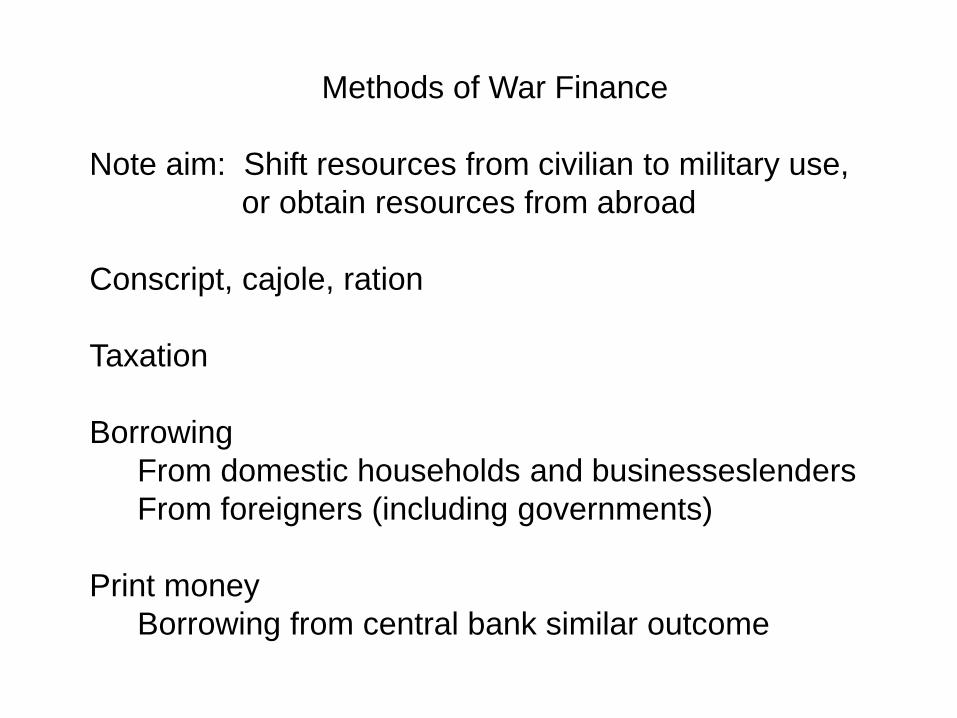
Methods of War Finance
Note aim: Shift resources from civilian to military use,
or obtain resources from abroad
Conscript, cajole, ration
Taxation
Borrowing
From domestic households and businesseslenders
From foreigners (including governments)
Print money
Borrowing from central bank similar outcome
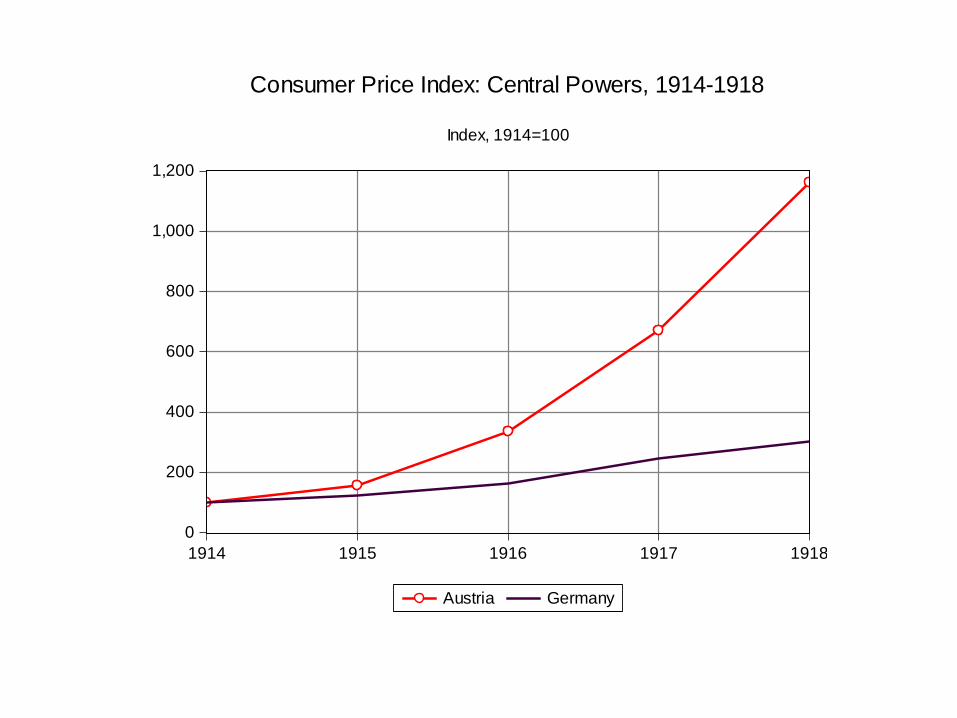
0
200
400
600
800
1,000
1,200
1914 1915 1916 1917 1918
Austria Germany
Consumer Price Index: Central Powers, 1914-1918
Index, 1914=100
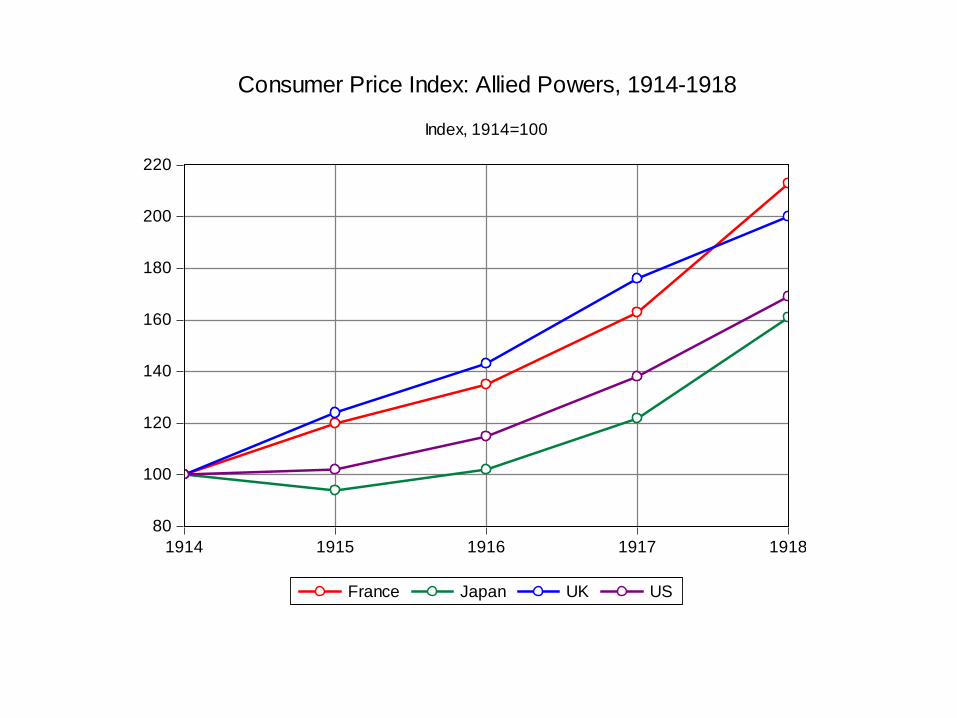
80
100
120
140
160
180
200
220
1914 1915 1916 1917 1918
France Japan UK US
Consumer Price Index: Allied Powers, 1914-1918
Index, 1914=100
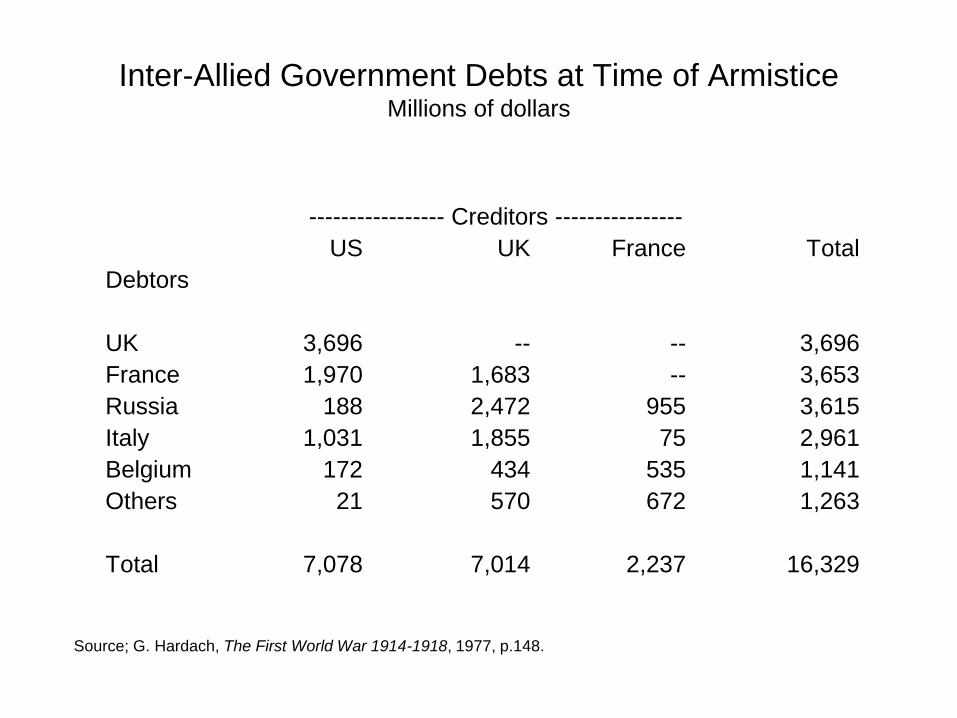
Inter-Allied Government Debts at Time of Armistice Millions of dollars
----------------- Creditors ----------------
US UK France Total
Debtors
UK 3,696 -- -- 3,696
France 1,970 1,683 -- 3,653
Russia 188 2,472 955 3,615
Italy 1,031 1,855 75 2,961
Belgium 172 434 535 1,141
Others 21 570 672 1,263
Total 7,078 7,014 2,237 16,329
Source; G. Hardach, The First World War 1914-1918, 1977, p.148.
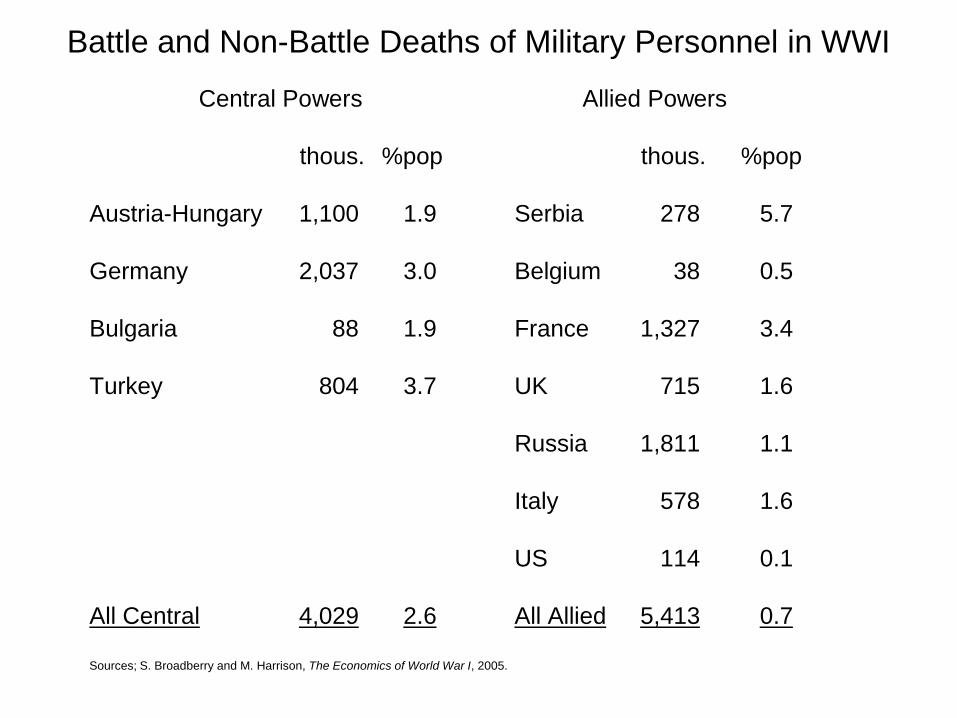
Battle and Non-Battle Deaths of Military Personnel in WWI
Central Powers Allied Powers
thous. %pop thous. %pop
Austria-Hungary 1,100 1.9 Serbia 278 5.7
Germany 2,037 3.0 Belgium 38 0.5
Bulgaria 88 1.9 France 1,327 3.4
Turkey 804 3.7 UK 715 1.6
Russia 1,811 1.1
Italy 578 1.6
US 114 0.1
All Central 4,029 2.6 All Allied 5,413 0.7
Sources; S. Broadberry and M. Harrison, The Economics of World War I, 2005.

THE END