world wheat production · world wheat production and utilization – million bushels 12-13 13-14...
TRANSCRIPT

WORLD WHEAT PRODUCTION
11,02212,85914,69616,53318,37020,20722,04423,88125,71827,55529,392
300350400450500550600650700750800
03-0
4
04-0
5
05-0
6
06-0
7
07-0
8
08-0
9
09-1
0
10-1
1
11-1
2
12-1
3
13-1
4
14-1
5
15-1
6
16-1
7
Proj
17-
18
Million Bushels
Source: USDA April 2018Xldata/world/all wheat/wheat/prod
Million Tons
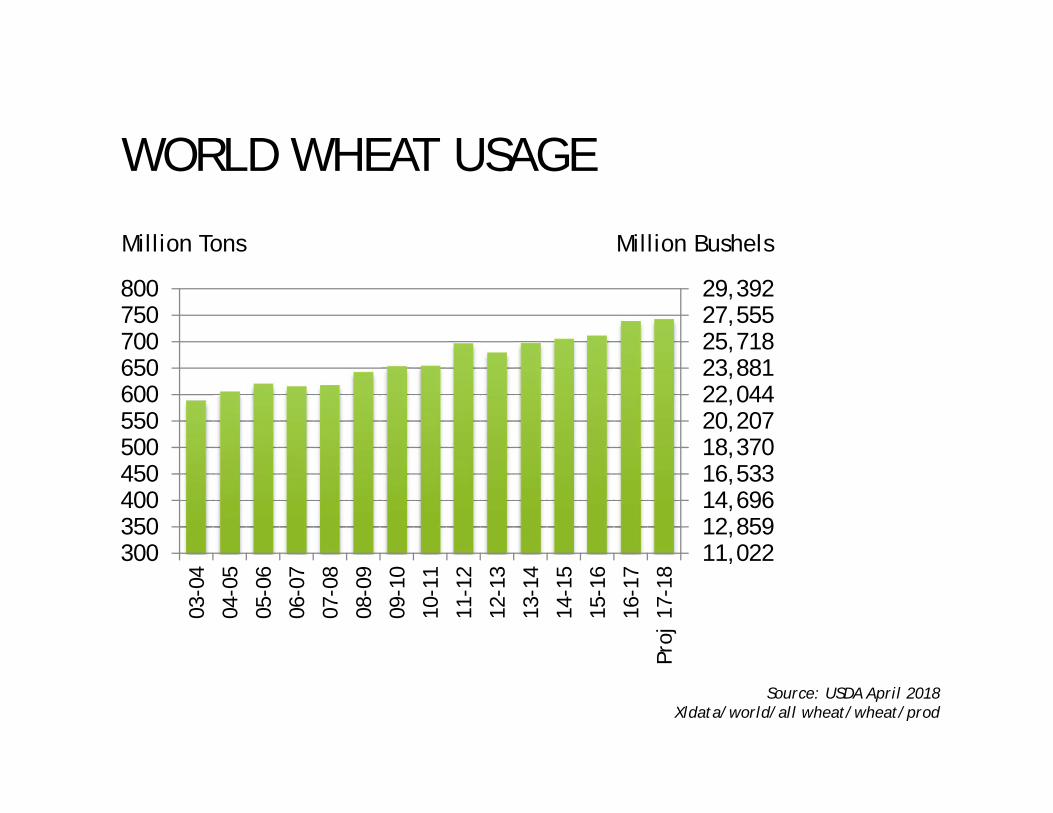
WORLD WHEAT USAGE
11,02212,85914,69616,53318,37020,20722,04423,88125,71827,55529,392
300350400450500550600650700750800
03-0
4
04-0
5
05-0
6
06-0
7
07-0
8
08-0
9
09-1
0
10-1
1
11-1
2
12-1
3
13-1
4
14-1
5
15-1
6
16-1
7
Proj
17-
18
Million Bushels
Source: USDA April 2018Xldata/world/all wheat/wheat/prod
Million Tons
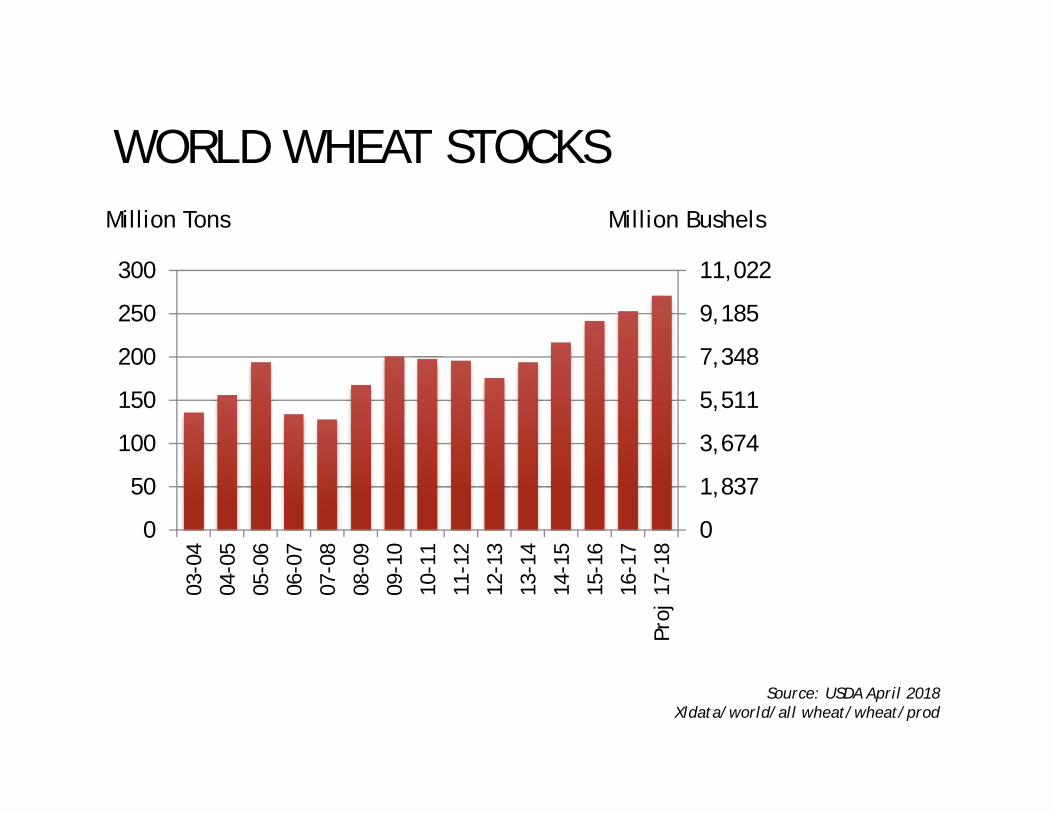
WORLD WHEAT STOCKS
0
1,837
3,674
5,511
7,348
9,185
11,022
0
50
100
150
200
250
300
03-0
4
04-0
5
05-0
6
06-0
7
07-0
8
08-0
9
09-1
0
10-1
1
11-1
2
12-1
3
13-1
4
14-1
5
15-1
6
16-1
7
Proj
17-
18
Million Bushels
Source: USDA April 2018Xldata/world/all wheat/wheat/prod
Million Tons

WORLD WHEAT PRODUCTION/ USE
11,02212,85914,69616,53318,37020,20722,04423,88125,71827,55529,392
300350400450500550600650700750800
03‐04
04‐05
05‐06
06‐07
07‐08
08‐09
09‐10
10‐11
11‐12
12‐13
13‐14
14‐15
15‐16
16‐17
Proj 17‐18
Production UseMillion Ton Million Bushel
USDA April 2018xldata/world/all/prod & use
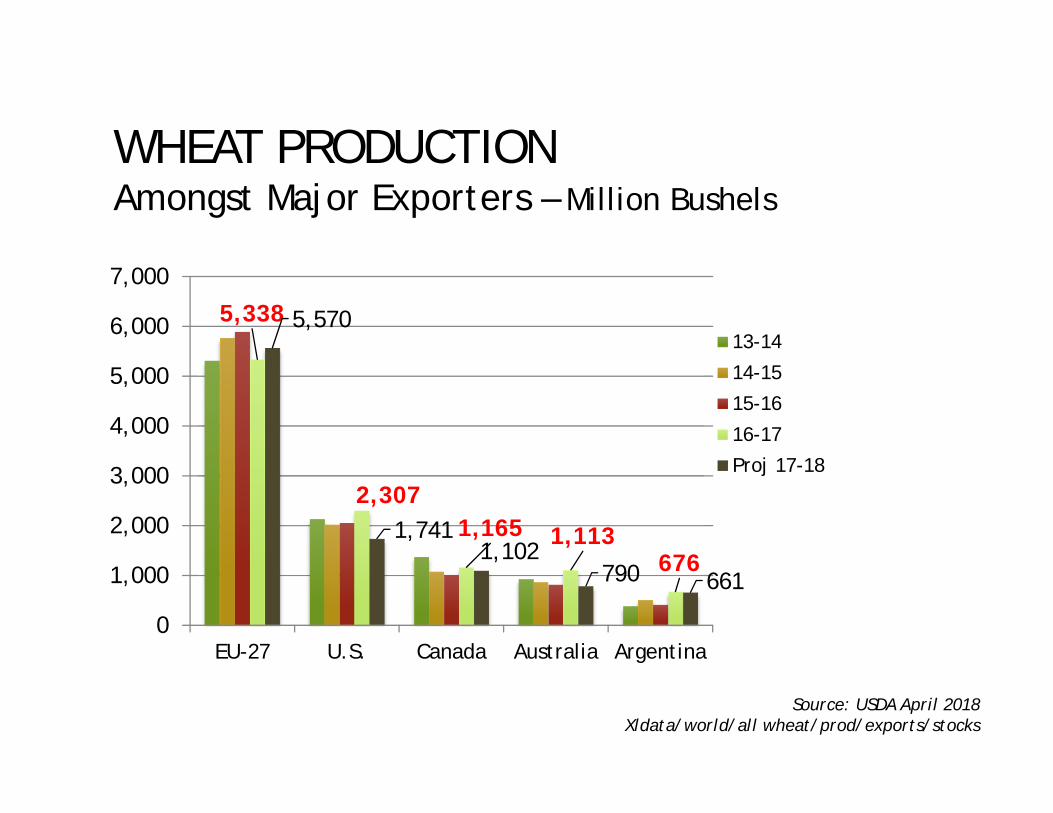
WHEAT PRODUCTIONAmongst Major Exporters – Million Bushels
5,338
2,3071,165 1,113
676
5,570
1,7411,102
790 661
0
1,000
2,000
3,000
4,000
5,000
6,000
7,000
EU-27 U.S. Canada Australia Argentina
13-14
14-15
15-16
16-17
Proj 17-18
Source: USDA April 2018Xldata/world/all wheat/prod/exports/stocks
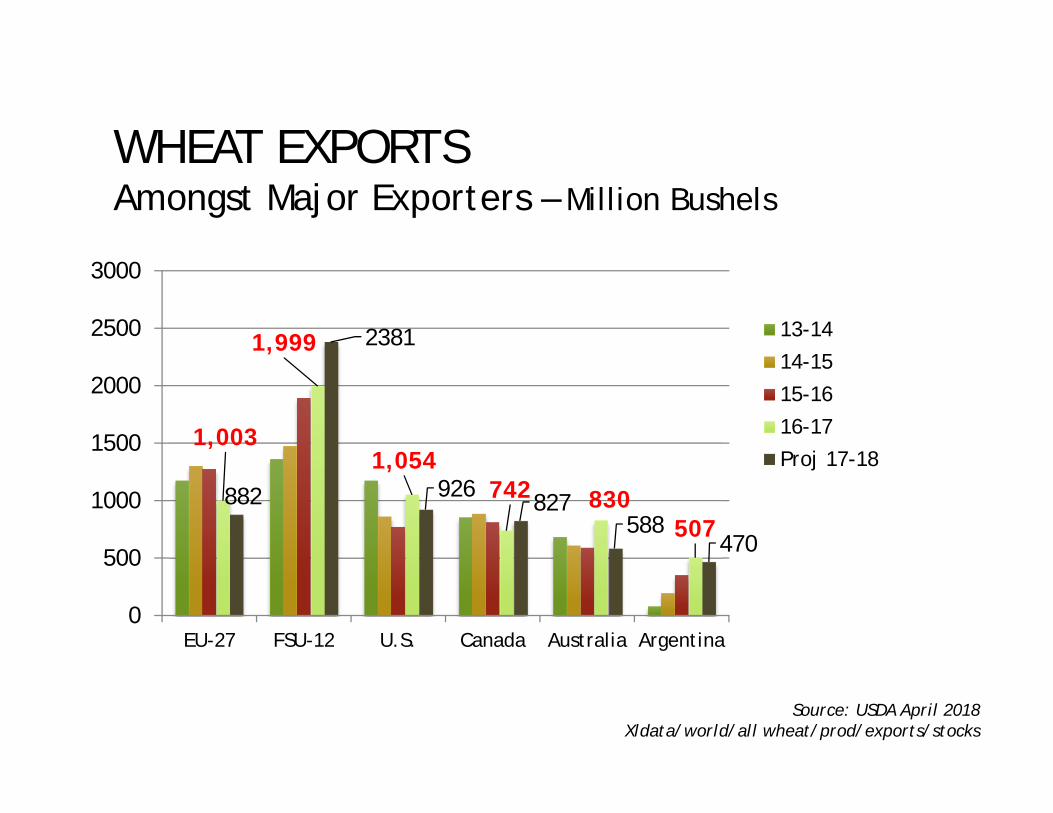
WHEAT EXPORTSAmongst Major Exporters – Million Bushels
1,003
1,999
1,054742 830
507882
2381
926 827588
470
0
500
1000
1500
2000
2500
3000
EU-27 FSU-12 U.S. Canada Australia Argentina
13-14
14-15
15-16
16-17
Proj 17-18
Source: USDA April 2018Xldata/world/all wheat/prod/exports/stocks

WHEAT STOCKSAmongst Major Exporters – Million Bushels
397
1,179
250162
7
478
1065
224
11811
0
200
400
600
800
1000
1200
EU-27 U.S. Canada Australia Argentina
13-14
14-15
15-16
16-17
Proj 17-18
Source: USDA April 2018Xldata/world/all wheat/prod/exports/stocks

WORLD WHEAT PRODUCTION AND UTILIZATION – Million Bushels
12-13 13-14 14-15 15-16 16-17 Proj17-18
Change
Argentina 342 386 514 415 676 661 -2%
Australia 841 930 871 819 1,113 790 -29%Canada 999 1,378 1,080 1,014 1,165 1,102 -5%EU-27 4,923 5,313 5,765 5,897 5,338 5,570 +4%China 4,446 4,479 4,637 4,784 4,736 4,769 +1%FSU 2,858 3,817 4,141 4,335 4,795 5,247 +9%U.S. 2,252 2,135 2,024 2,061 2,307 1,742 -25%World Prod 24,175 26,280 26,758 27,011 27,581 27,915 +1%World Use 24,976 25,659 25,927 26,130 27,144 27,301 +1%
World End Stocks
6,503 7,128 7,991 8,917 9,354 9,964 +7%
S/U Ratio 26% 28% 31% 34% 34% 36%

WORLD WHEAT PRODUCTION – MAP(Million Bushels)
1014 1165 1102
15-16 16-17 Proj 17-18
Canada
2062 23071742
15-16 16-17 Proj 17-18
U.S.
415676 661
15-16 16-17 Proj 17-18
Argentina
5897 5346 5570
15-16 16-17 Proj 17-18
EU 274336 4795 5247
15-16 16-17 Proj 17-18
FSU
4784 4736 4769
15-16 16-17 Proj 17-18
China
3178 3196 3615
15-16 16-17 Proj 17-18
India
8191113
790
15-16 16-17 Proj 17-18
Australia
USDA April 2018xldata/world/all/prod & use

DURUM PRODUCTION AND USE In Major Exporting CountriesUnited States, Canada & European Union
0
184
368
552
736
920
0.0
5.0
10.0
15.0
20.0
25.0
03‐04
04‐05
05‐06
06‐07
07‐08
08‐09
09‐10
10‐11
11‐12
12‐13
13‐14
14‐15
15‐16
16‐17
17‐18
Production UseSource: Stats Canada and Int’l Grains CouncilXldata/world/durum/sdmajor1 April 2018
Million Tons Million Bushels
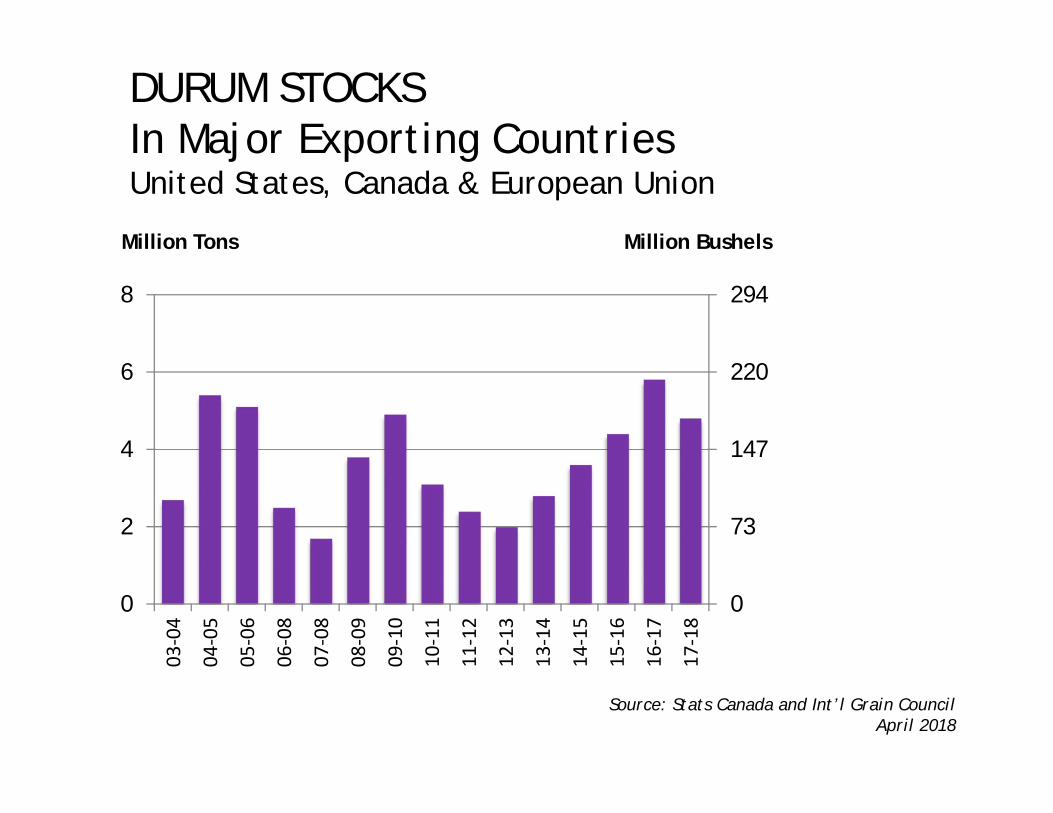
DURUM STOCKS In Major Exporting CountriesUnited States, Canada & European Union
0
73
147
220
294
0
2
4
6
8
03‐04
04‐05
05‐06
06‐08
07‐08
08‐09
09‐10
10‐11
11‐12
12‐13
13‐14
14‐15
15‐16
16‐17
17‐18
Source: Stats Canada and Int’l Grain Council April 2018
Million Tons Million Bushels
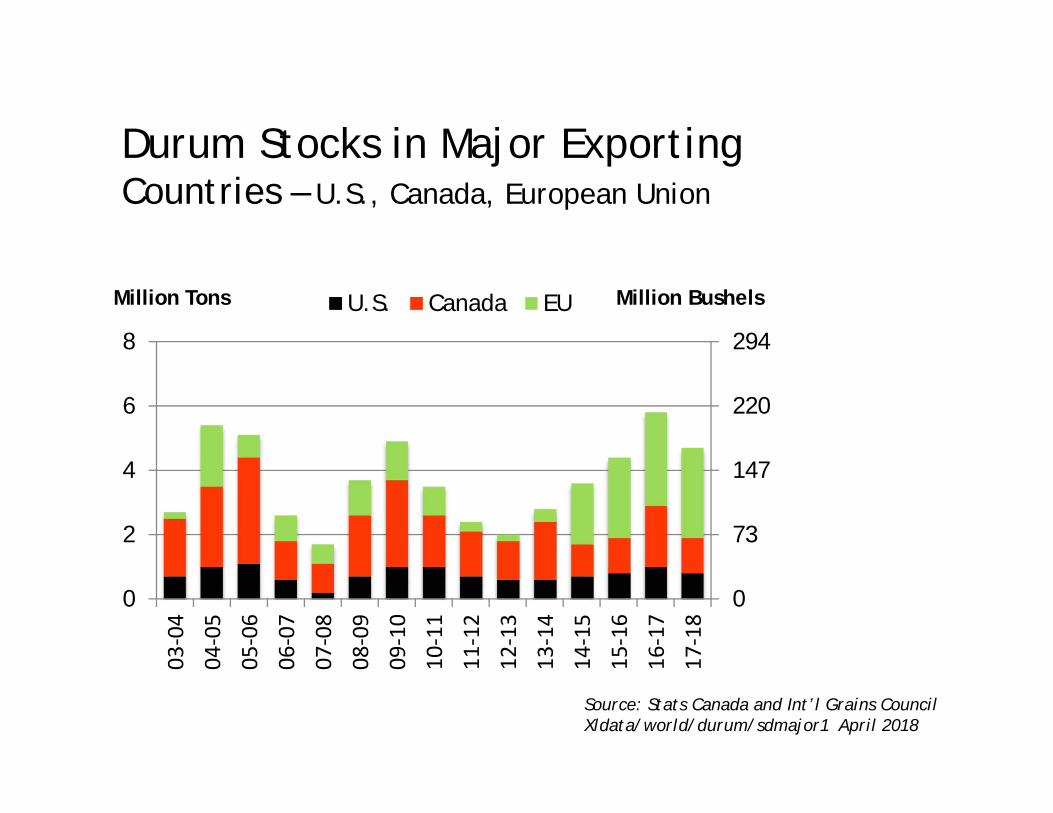
Durum Stocks in Major Exporting Countries – U.S., Canada, European Union
0
73
147
220
294
0
2
4
6
8
03‐04
04‐05
05‐06
06‐07
07‐08
08‐09
09‐10
10‐11
11‐12
12‐13
13‐14
14‐15
15‐16
16‐17
17‐18
U.S. Canada EU
Source: Stats Canada and Int’l Grains CouncilXldata/world/durum/sdmajor1 April 2018
Million Tons Million Bushels

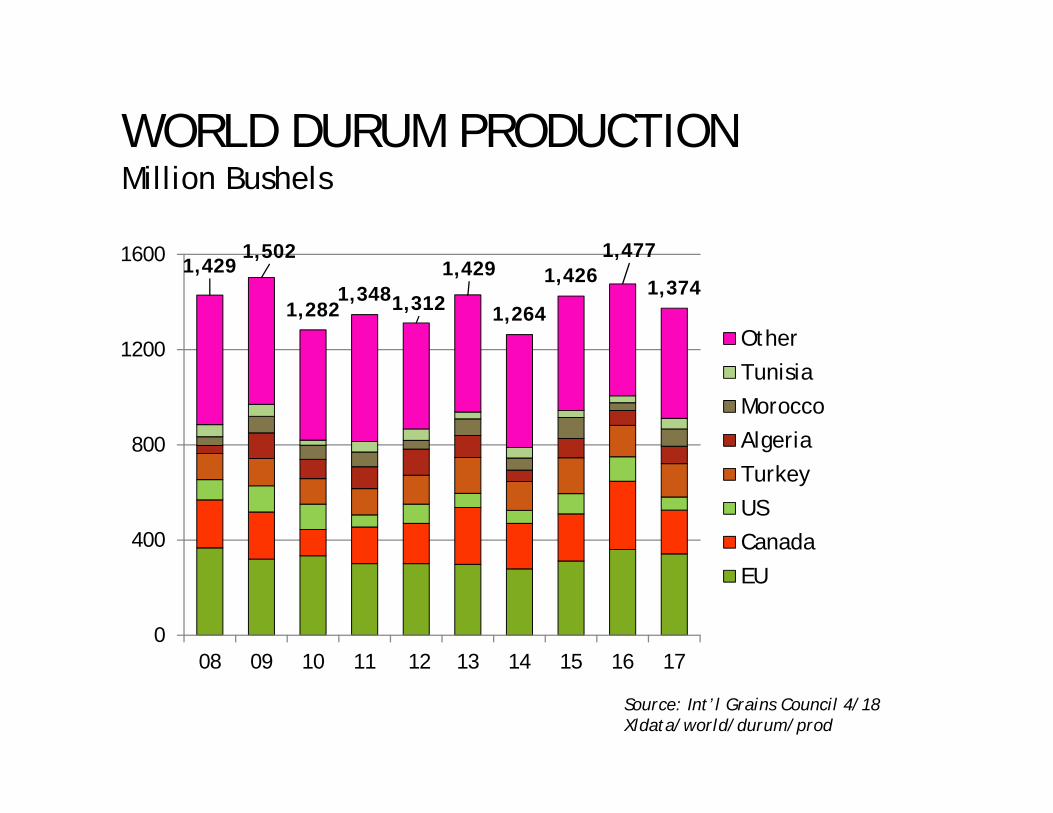
WORLD DURUM PRODUCTION Million Bushels
2012 2013 2014 2015 2016 2017 ChangeEU 301 298 279 312 360 342 -5%Canada 169 239 191 198 287 184 -36%U.S. 81 59 55 85 103 55 -46%Turkey 121 151 121 151 132 140 +6%Algeria 110 92 48 81 62 73 +18%Morocco 37 70 51 88 33 73 +122%Tunisia 48 29 44 29 29 44 +50%Others 445 492 474 481 470 463 -2%
World Total
1,312 1,429 1,264 1,426 1,477 1,374
Source: International Grains CommissionXldata/world/all wheat/wheat/prod

WORLD DURUM PRODUCTION – MAP(Million Bushels)
198287
184
15 16 17
Canada
81103
55
15 16 17
U.S.
7385 77
15 16 17
MEXICO
312 360 342
15 16 17
EUROPEAN UNION
279 246 246
15 16 17
TURKEY/SYRIA/KZ
265 250 261
15 16 17
OTHER
202129
195
15 16 17
NORTH AFRICA
18 22 18
15 16 17
AUSTRALIA
Source: Int’l Grains Council April 2018Xldata/world/durum/prod
WORLD DURUM PRODUCTIONMillion Bushels
1,4291,502
1,2821,3481,312
1,429
1,264
1,4261,477
1,374
0
400
800
1200
1600
08 09 10 11 12 13 14 15 16 17
OtherTunisiaMoroccoAlgeriaTurkeyUSCanadaEU
Source: Int’l Grains Council 4/18Xldata/world/durum/prod
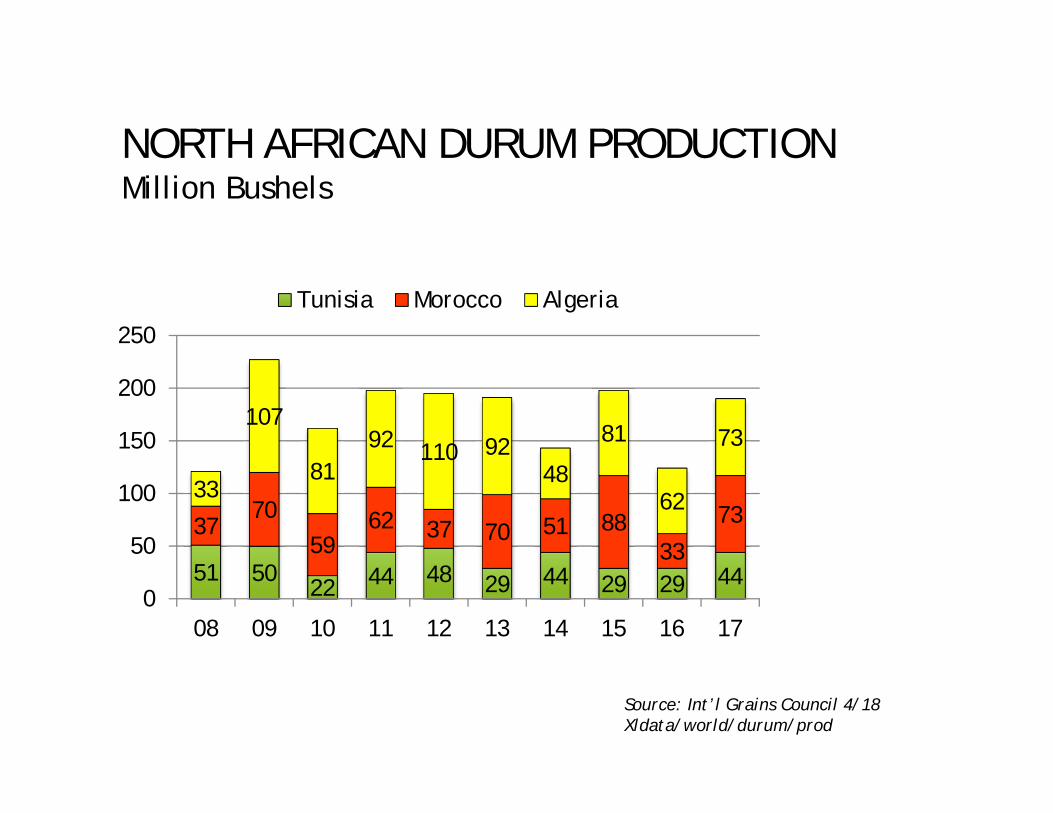
NORTH AFRICAN DURUM PRODUCTIONMillion Bushels
51 5022 44 48 29 44 29 29 44
3770
5962 37 70 51 88
33
7333
107
8192 110 92
48
81
62
73
0
50
100
150
200
250
08 09 10 11 12 13 14 15 16 17
Tunisia Morocco Algeria
Source: Int’l Grains Council 4/18Xldata/world/durum/prod
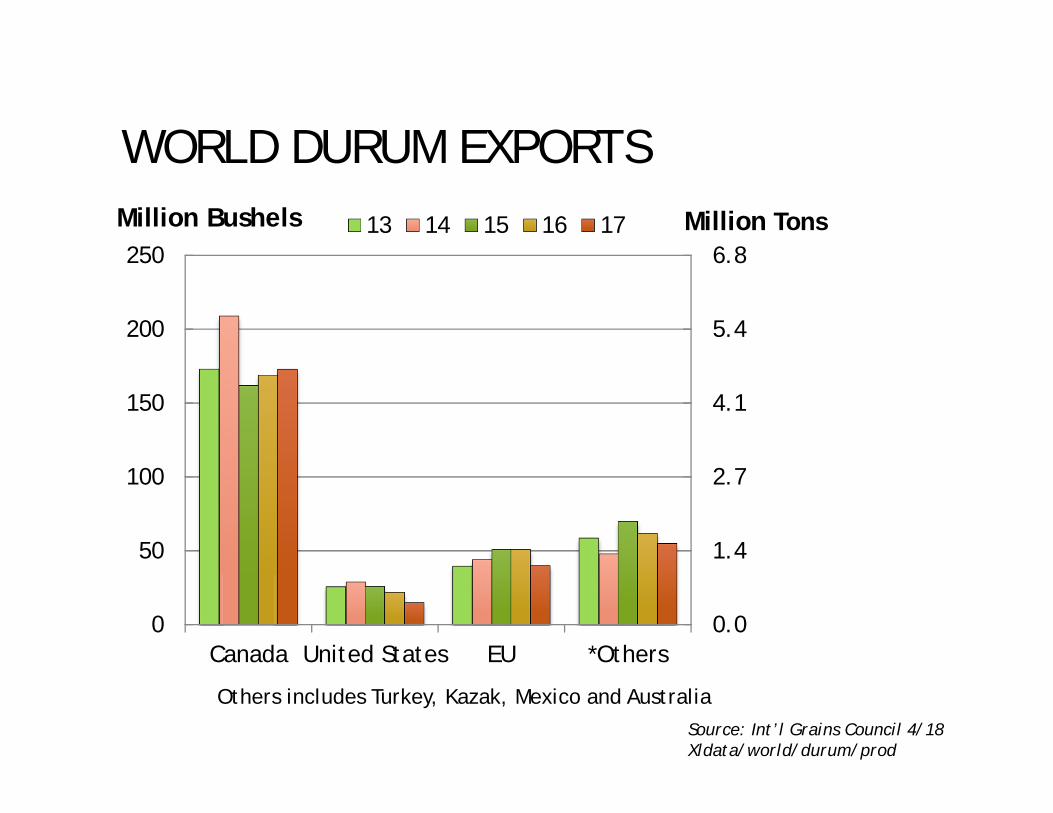
WORLD DURUM EXPORTS
0.0
1.4
2.7
4.1
5.4
6.8
Canada United States EU *Others0
50
100
150
200
250
Million Bushels 13 14 15 16 17 Million Tons
Others includes Turkey, Kazak, Mexico and AustraliaSource: Int’l Grains Council 4/18Xldata/world/durum/prod
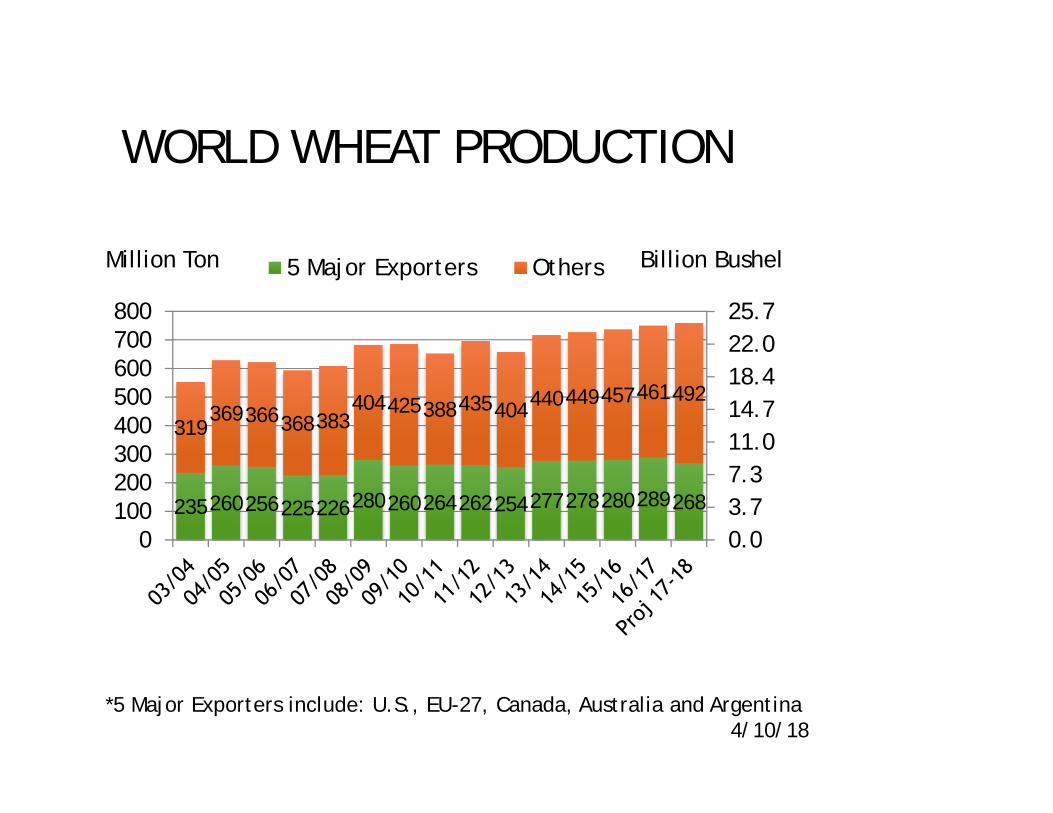
WORLD WHEAT PRODUCTION
235260256225226280260264262254277278280289268
319369366368383
404425388435404440449457461492
0.03.77.311.014.718.422.025.7
0100200300400500600700800
5 Major Exporters Others Billion Bushel
*5 Major Exporters include: U.S., EU-27, Canada, Australia and Argentina4/10/18
Million Ton
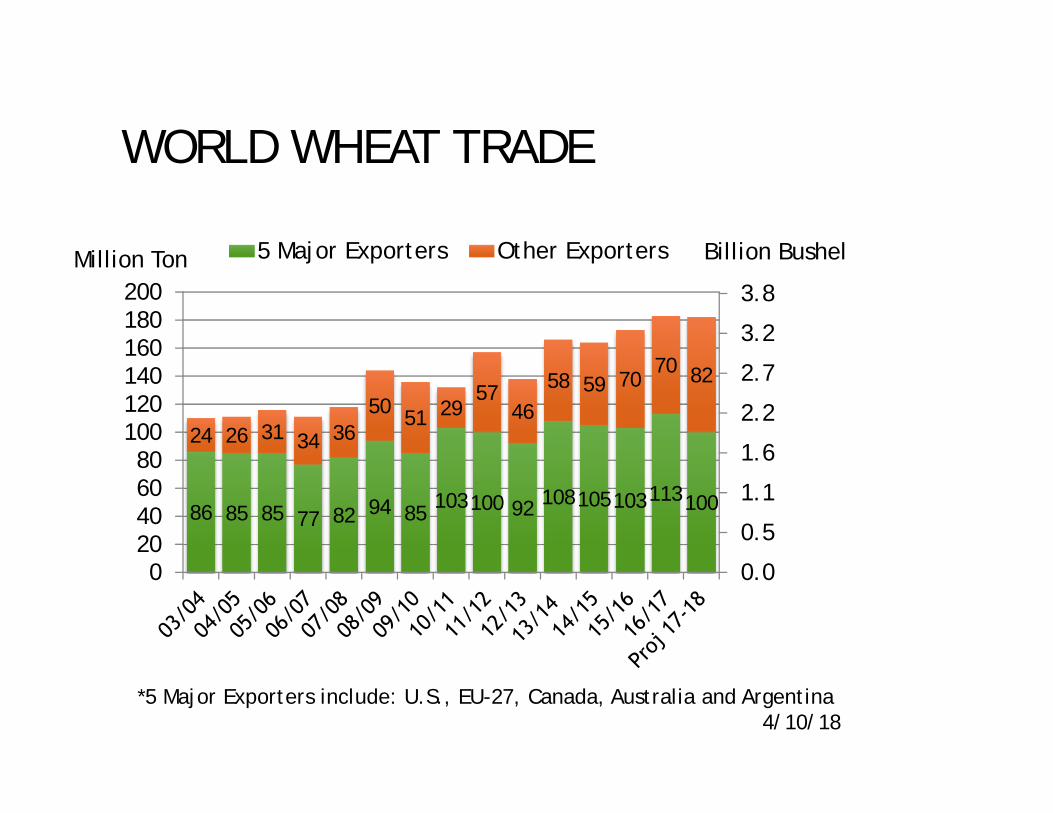
WORLD WHEAT TRADE
86 85 85 77 82 94 85 103100 92 108105103113100
24 26 31 34 3650 51 29
5746
58 59 7070 82
0.0
0.5
1.1
1.6
2.2
2.7
3.2
3.8
020406080
100120140160180200
5 Major Exporters Other Exporters Billion Bushel
*5 Major Exporters include: U.S., EU-27, Canada, Australia and Argentina4/10/18
Million Ton
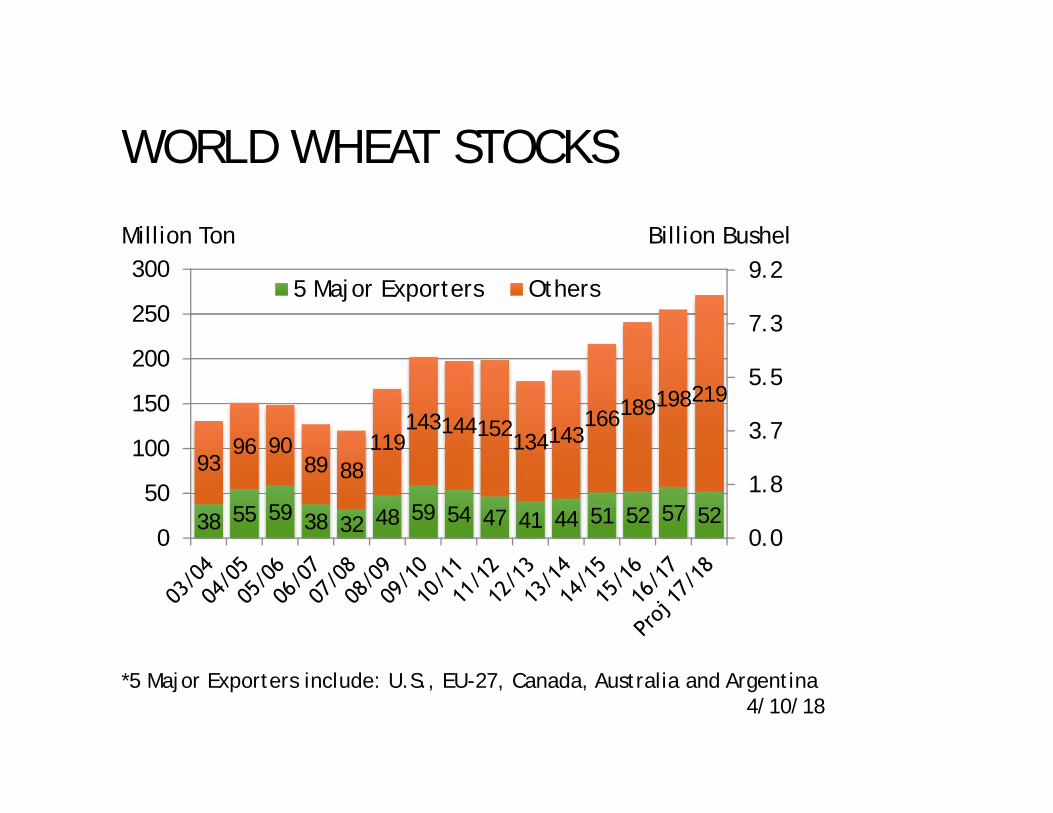
WORLD WHEAT STOCKS
38 55 59 38 32 48 59 54 47 41 44 51 52 57 52
9396 90
89 88119
143144152134143166189198219
0.0
1.8
3.7
5.5
7.3
9.2
0
50
100
150
200
250
3005 Major Exporters Others
Billion Bushel
*5 Major Exporters include: U.S., EU-27, Canada, Australia and Argentina4/10/18
Million Ton