world-wide physical inactivity: scope of the problem and what to do about it moscow, russia...
TRANSCRIPT

World-Wide Physical Inactivity: Scope of the Problem and What
to Do about It
Moscow, RussiaRussia-U.S.A. Scientific Forum
November 17, 2011
Steven N. BlairDepartments of Exercise Science &
Epidemiology/BiostatisticsUniversity of South Carolina

Non-Communicable Diseases (NCDs) Changing patterns in leisure and
work have led to a health crisis NCDs cause 65% of all deaths
worldwide 36.1 million deaths from CVD,
Stroke, Diabetes, Cancer & Respiratory diseases.
Physical inactivity causes 3.2 million deaths/year
WHO. Mortality and burden of disease estimates for WHO Member States in 2008. Geneva: World Health Organization, 2010.

NCDs: Key Risk FactorsBeaglehole et al., Lancet 2011; 377: 1438–47
Direct Causal Factors• Tobacco use• Physical Inactivity• Poor Nutrition
Intermediate Risk Factors• Obesity• Hypertension• Hyperglycemia
• Hypercholesterolemia
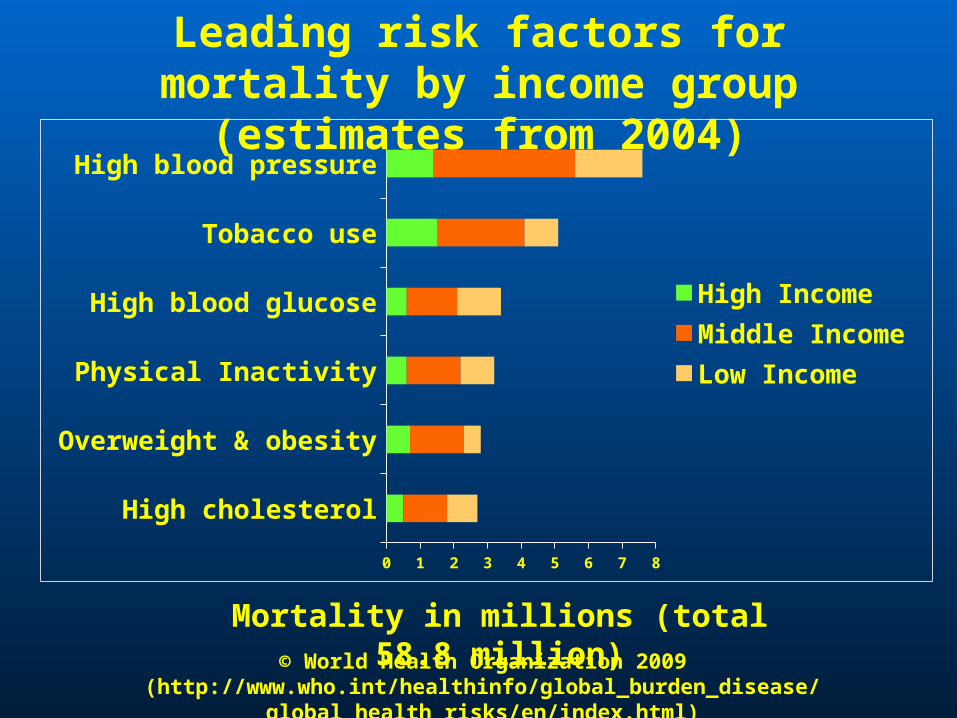
High cholesterol
Overweight & obesity
Physical Inactivity
High blood glucose
Tobacco use
High blood pressure
0 1 2 3 4 5 6 7 8
High IncomeMiddle IncomeLow Income
Mortality in millions (total 58.8 million)
Leading risk factors for mortality by income group (estimates from 2004)
© World Health Organization 2009(http://www.who.int/healthinfo/global_burden_disease/global_health_risks/en/index.html)
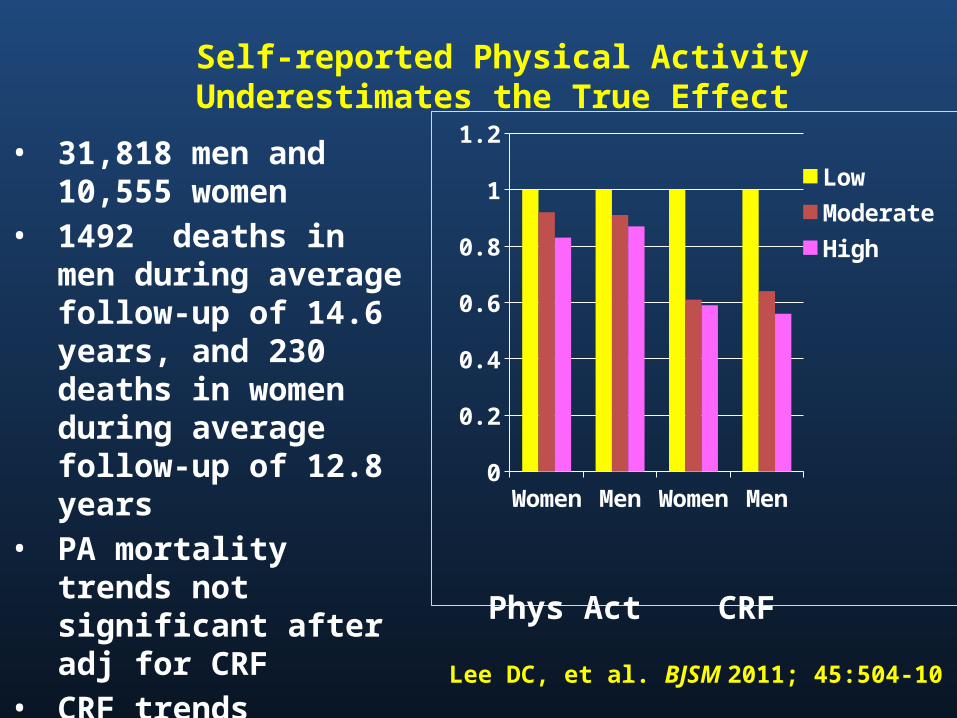
Self-reported Physical Activity Underestimates the True Effect
Wom
enM
en
Wom
enM
en0
0.2
0.4
0.6
0.8
1
1.2
LowModerateHigh
• 31,818 men and 10,555 women
• 1492 deaths in men during average follow-up of 14.6 years, and 230 deaths in women during average follow-up of 12.8 years
• PA mortality trends not significant after adj for CRF
• CRF trends significant after adj for PA
Phys Act CRF
Lee DC, et al. BJSM 2011; 45:504-10

Aerobics Center Longitudinal Study

Design of the ACLS
1970 More than 80,000 patients 2005
Mortality surveillance to 2003More than 4000 deaths
Cooper Clinic examinations--includinghistory and physical exam, clinical tests,body composition, EBT, and CRF
1982 ‘86 ‘90 ‘95 ’99 ‘04Mail-back surveys for case finding and monitoring habits and other characteristics

All-Cause Death Rates by CRF Categories—3120 Women and
10 224 Men—ACLS
0
10
20
30
40
50
60
70
Ag
e ad
j dea
th r
ate/
10,0
00 P
Y
Low Moderate High
Women
Men
Blair SN. JAMA 1989
Does Changing Cardiorespiratory Fitness
Reduce Mortality Risk?

Fitness Change Categories Unfit was defined as the least fit 20% of men
in each age group Men were classified as fit or unfit at both
examinations Change categories
• unfit at both examinations = never fit• unfit at first, fit at second = improvers• fit at both examinations = always fit
Blair SN et al. JAMA 1995; 273:1093-8

Age-Adjusted Death Rates by Fitness Change Groups, Men, ACLS
Age-adjusted Death Rates/10,000 Man-years
Fitness Groups
CVD All-cause
Never fit 65 122
Improvers 31 68
Always fit 14 40
Blair SN et al. JAMA 1995; 273:1093-8

CRF and Other Health Outcomes
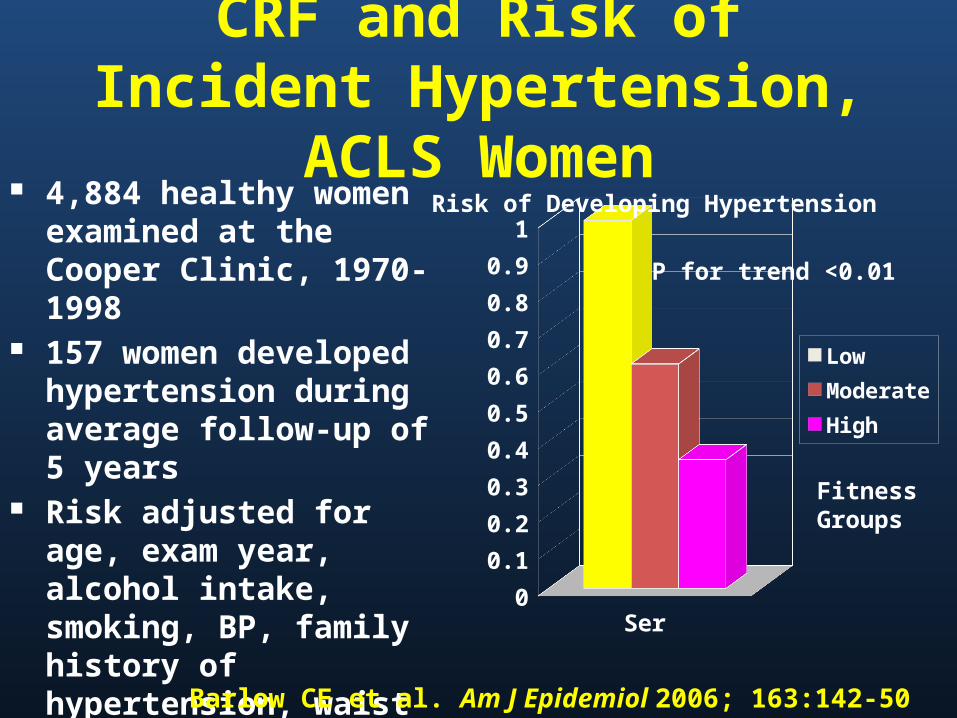
CRF and Risk of Incident Hypertension, ACLS Women
4,884 healthy women examined at the Cooper Clinic, 1970-1998
157 women developed hypertension during average follow-up of 5 years
Risk adjusted for age, exam year, alcohol intake, smoking, BP, family history of hypertension, waist girth, glucose, & triglycerides
Series10
0.1
0.2
0.3
0.4
0.5
0.6
0.7
0.8
0.9
1
Low
Moderate
High
FitnessGroups
Risk of Developing Hypertension
Barlow CE et al. Am J Epidemiol 2006; 163:142-50
P for trend <0.01

CRF and Breast Cancer Mortality
Low Moderate High0
0.1
0.2
0.3
0.4
0.5
0.6
0.7
0.8
0.9
1
•14,551 women, ages 20-83 years•Completed exam 1970-2001•Followed for breast cancer mortality to 12/31/2003•68 breast cancer deaths in average follow-up of 16 years•Odds ration adjusted for age, BMI, smoking, alcohol intake, abnormal ECT, health status, family history, & hormone use
Odds Ratio
p for trend=0.04
Sui X et al. MSSE 2009; 41:742

Activity, Fitness, and Mortality in Older Adults
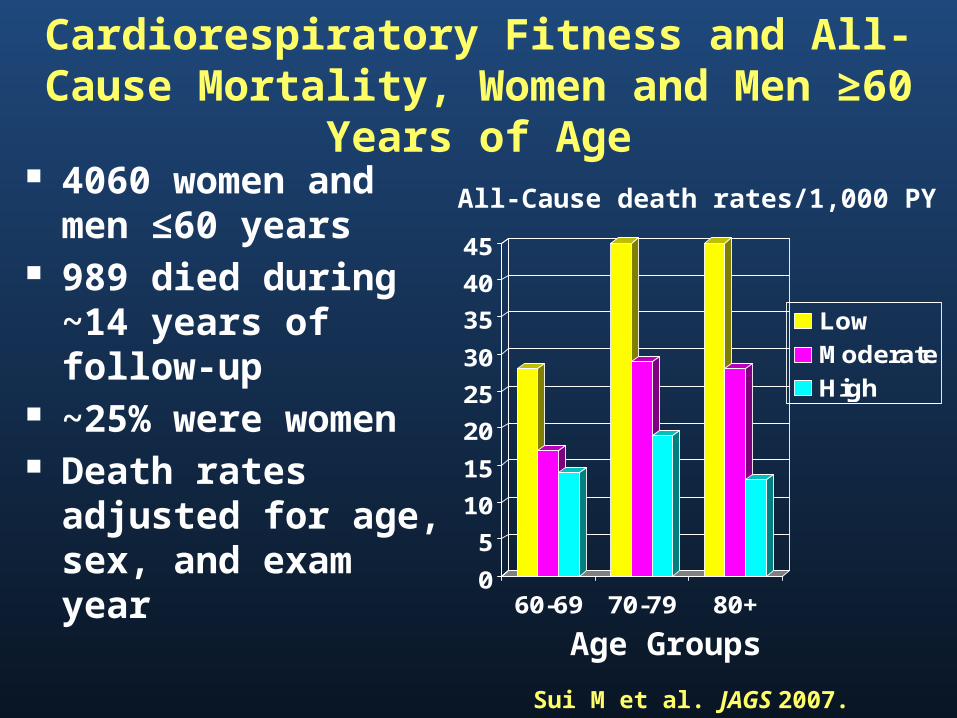
Cardiorespiratory Fitness and All-Cause Mortality, Women and Men ≥60 Years of Age
4060 women and men ≤60 years
989 died during ~14 years of follow-up
~25% were women Death rates adjusted
for age, sex, and exam year
0
5
10
15
20
25
30
35
40
45
60-69 70-79 80+
Low
Moderate
High
All-Cause death rates/1,000 PY
Age Groups
Sui M et al. JAGS 2007.

Cardiorespiratory Fitness and Health Outcomes in Various
Population SubgroupsSuch as People Who Are Overweight or Obese or
Those with Chronic Disease
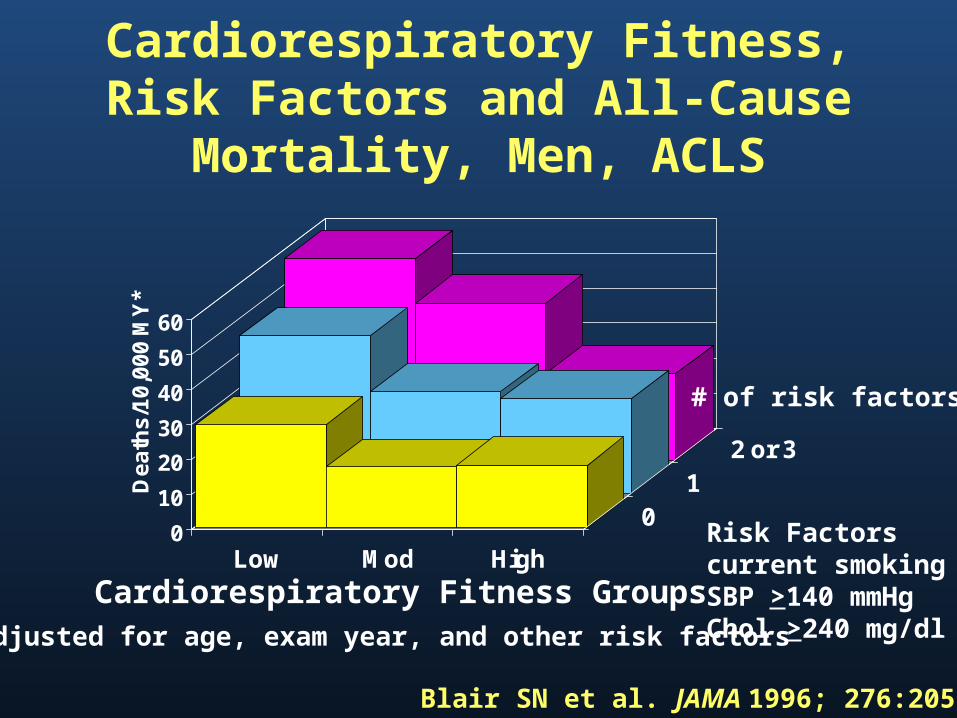
Cardiorespiratory Fitness, Risk Factors and All-Cause Mortality, Men,
ACLS
0
10
20
30
40
50
60
De
ath
s/1
0,0
00
MY
*
Low Mod High
01
2 or 3
# of risk factors
Risk Factorscurrent smokingSBP >140 mmHgChol >240 mg/dl
Cardiorespiratory Fitness Groups*Adjusted for age, exam year, and other risk factors
Blair SN et al. JAMA 1996; 276:205-10

CVD Mortality Risk* by Fitness and BMI Categories, 2316 Men with Diabetes,
179 CVD Deaths
0
1
2
3
4
5
6
7
8
9
10
Ris
k o
f C
VD
Mo
rta
lity
18.5 < BMI <25.0 25.0 ≤ BMI <30.0 30.0 ≤ BMI < 35.0
Re
fere
nc
e
Church TS et al. Arch Int Med 2005; 165:2114*Adj for age and examination year
p for trend <0.0001p for trend <0.0001 p for trend <0.002

0
2
4
6
8
10
12
14
16
18
LowModerateHigh
Controlled HTN Stage 1 HTN Stage 2 HTN
Severity of HTN
P <.001 P <.001 P =.048
CRF:
Age and exam year adjusted rates of total CVD events by levels of CRF and severity of HTN in
8147 hypertensive men
Sui X et al. Am J Hyptertension. 2007
CVD incidence/1000 man-years

Summary

Attributable Fractions (%) forAll-Cause Deaths
40,842 Men & 12,943 Women, ACLS
02468
1012141618
MenWomen
Blair SN. Br J Sports Med 2009; 43:1-2.

Getting People to Be Physically Active

Behavioral Approaches to Physical Activity Interventions
Theoretical foundations• Social Learning Theory• Stages of Change Model• Environmental/Ecological Model
Methods• Problem solving• Self-monitoring• Goal setting• Social support• Cognitive restructuring• Incremental changes• Manipulating the environment
Marcus & Forsyth. Motivating People to Be Physically Active, 2nd edition. 2009. Human Kinetics (www.hkusa.com

Track Record of Lifestyle PA Interventions
Successfully implemented in many different populations and settings• Men and women of all ages• African-American men and women,
Hispanic women• Prostate cancer survivors• Worksites, YMCA’s, public heath
departments, recreation facilities, senior centers, churches
We can get a substantial proportion of inactive people to become active

Using Modern Technology to Promote Healthful
Lifestyles

Promoting PA via PDA 37 healthy, inactive adults, ≥50 years of
age 8-week RCT PDA intervention (93% had not used
PDAs)• Questions about amount and type of PA • Alerted at 2 PM and 9 PM to complete PA
assessment• Gave motivational and behavioral tips
Controls—standard written materials
King AC et al. Am J Prev Med 2007; 34:138-42

Promoting PA via PDA Intervention participants completed 68%
of the 112 PDA entries available After adjusting for baseline differences
• PDA group reported 310.6 minutes of moderate to vigorous PA/week
• Control group reported 125.5 minutes/week• p=0.048 for group comparison
78.6% of PDA group reported enjoying using the device
King AC et al. Am J Prev Med 2007; 34:138-42

The SenseWear Armband (SWA)The SenseWearTM Armband
(BodyMedia, Pittsburgh, PA) Lightweight monitor worn on the
upper left arm Four sensors (skin temp,
galvanic skin response, heat flux, tri-axial accelerometer)
Estimates energy expenditure Physical activity – duration &
intensity

Effects across time for weight. Estimates adjust for age, gender, race, education, and wave.
Baseline Month 4 Month 992
94
96
98
100
102
104W
eig
ht
(Kg
)
SWA
GWL + SWA
Standard Care
GWL
GWL=Group Weight LossSWA=SenseWear Armband
Shuger S et al. 2011 IJBNPA

Where Do We Go from Here?

All countries should develop a national
physical activity plan

What is a Physical Activity Plan?
A comprehensive set of strategies including policies, practices, and initiatives aimed at increasing physical activity in all segments of the population.

Sectors•Mass Media•Public Health•Education•Healthcare•Volunteer and Non-Profit Organizations•Transportation, Urban Design, Community Planning•Business and Industry•Parks, Recreation, Fitness, and Sports

Prevention of NCDs Prevention is essential to reduce
immediate burden and protect future generations
NCDs threaten health and social systems and hinder economic performance
A 2% reduction in NCD death rates will achieve an increase in economic growth of 1% per year within a decadeCecchini et al. The Lancet 2010; 376:1775-84

Thank youQuestions?