world’s best quality by design software for lc method … · 2016-01-04 · development software...
TRANSCRIPT

FUSION METHOD DEVELOPMENT SOFTWARE
12 Reasons Why FMD is the
World’s Best Quality by Design Software for
LC Method Development
S-MATRIX CORPORATION www.smatrix.com

Fusion LC Method Development Software – 12 Reasons Why V6.1 Copyright © 2016 S-Matrix Corporation. All Rights Reserved. Page 2
Contents 1. Fully Scalable & Regulatory Compliance Ready....................................................... 3
2. Supports Risk Assessment ....................................................................................... 4
3. Facilitated LC Method Development Workflow ......................................................... 6
4. Simple Experiment Setup ......................................................................................... 9
5. Automated Experimental Design Selection ............................................................. 13
6. Supports Column Selection .................................................................................... 14
7. Automates QbD Experimentation on Your LC Instruments ..................................... 15
8. Automated Modeling & Critical Parameter Effects Ranking .................................... 18
9. Support for Peak Tracking ...................................................................................... 21
10. Identifies Best Performing and Most Robust Methods ......................................... 23
11. Graphically Visualizes the Robust Design Space and PARs ............................... 26
12. Generates Regulatory Submittal Quality Reports ................................................ 28

Fusion LC Method Development Software – 12 Reasons Why V6.1 Copyright © 2016 S-Matrix Corporation. All Rights Reserved. Page 3
1. Fully Scalable & Regulatory Compliance Ready
Fusion LC Method Development (FMD) comes in two configurations to suit your individual or
site needs. Each configuration is readily upgradable or extensible as needed, and each has all the
features and tools required to support full 21 CFR 11 Compliance for closed systems.
Compliance in FMD is not just a simple named user logon feature, but full E-Record and E-
Signature support, including full audit logging of all user executed operations and data events,
and even the ability to interject E-Review and E-Approve work management loops. This extends
to full auditing of all electronic data exchanges between FMD and chromatography data software
FMD – Workstation Configuration
This single PC configuration of FMD contains a built-in 21 CFR 11 Compliance Support
Toolset and associated Workflow Management System. The Workstation configuration
enables you to create and manage multiple named users, create User Roles with specific
access and use permissions and assign the roles to individual users, and incorporate e-
Review and e-Approve management review loops.
FMD – Network/Citrix Configuration
This configuration of FMD also contains the built-in 21 CFR 11 Compliance Support
Toolset and associated Workflow Management System. The Network configuration
enables you to operate FMD in a network environment to support concurrent use. FMD
can be deployed in a traditional network environment where the user application is
installed on multiple PCs or in a Citrix environment (Metaframe or XenApp) where the
user application is installed on one or more Citrix server PCs.

Fusion LC Method Development Software – 12 Reasons Why V6.1 Copyright © 2016 S-Matrix Corporation. All Rights Reserved. Page 4
2. Supports Risk Assessment
When considering the FDA/ICH guidance documents it is important to understand that the
regulatory agencies view an LC instrument as a “process in a box”, and therefore consider all of
the statistical tools and approaches used for process development, optimization, and robustness
characterization as directly applicable to LC method development. The Fusion LC Method
Development software module (FMD) is expert system software which integrates the four
“Supporting Statistical Tools” shown in blue highlight below which are relevant to LC method
development experiments listed in the ICH Q9 Quality Risk Management guidance (refer to
ICH Q9 Nov 9, 2005, Section I.9, reproduced below).
I.9 Supporting Statistical Tools
“Statistical tools can support and facilitate quality risk management. They can enable effective data assessment, aid in determining the significance of the data set(s), and facilitate more reliable decision making. A listing of some of the principal statistical tools commonly used in the pharmaceutical industry is provided:”
• Control Charts, for example: ... • Design of Experiments (DOE) • Histograms • Pareto Charts • Process Capability Analysis
As part of LC method development Risk Assessment includes identification of Critical Process
Parameters (CPPs – in this case critical LC instrument parameters), and accurate characterization
of all the types of effects that the CPPs have on the defined Critical Quality Attributes (CQAs –
in this case critical method performance characteristics). This quantitative characterization leads
to knowledge of the level of control of each CPP required for a robust method. FMD enables the
user to study multiple parameters in combination, can characterize their independent, interactive,
and complex effects, and can illustrate these effects in its graphical reporting of the Design Space
and Proven Acceptable Ranges for the study parameters (see Item 9). FMD therefore provides
strategic tools and capabilities which support Quality Risk Management (QRM) for LC method
development as defined in the ICH Q9 Quality Risk Management guidance (refer to ICH Q9
Section II.3, reproduced on the following page).

Fusion LC Method Development Software – 12 Reasons Why V6.1 Copyright © 2016 S-Matrix Corporation. All Rights Reserved. Page 5
II.3 Quality Risk Management as Part of development
To design a quality product and its manufacturing process to consistently deliver the intended performance of the product (see ICH Q8); (see Items 2, 8, 10, and 11)
To enhance knowledge of product performance over a wide range of material attributes (e.g., particle size distribution, moisture content, flow properties), processing options and process parameters; (see Items 2, 3, 6, 8, 10, and 11)
To assess the critical attributes of raw materials, solvents, Active Pharmaceutical Ingredient (API) starting materials, APIs, excipients, or packaging materials; (see Items 2, 6, and 8)
To establish appropriate specifications, identify critical process parameters and establish manufacturing controls ...; (see Items 8, 10, 11, and 12)
To decrease variability of quality attributes:
• reduce product and material defects; • reduce manufacturing defects.
(See Item 10)
To assess the need for additional studies (e.g., bioequivalence, stability) relating to scale up and technology transfer; (see Items 2, 8, and 10)
To make use of the “design space” concept (see ICH Q8). (see Items 10, 11, and 12)

Fusion LC Method Development Software – 12 Reasons Why V6.1 Copyright © 2016 S-Matrix Corporation. All Rights Reserved. Page 6
3. Facilitated LC Method Development Workflow
A general Method Development Sequence is presented below. FMD can generate experiments to support each phase in this sequence.
Sample Preparation Chemistry Screening Method Optimization Sample Preparation This is a critical starting point to make sure that you will get meaningful data from experiment
chromatograms. The variables studied here are discussed in the detail section on the next page.
The end point of the Sample Preparation workup is a chromatogram with acceptable S/N Ratio
for all peaks of interest, an acceptable k’ value for the 1st eluted peak, and some confidence that
most or all peaks are eluting during the gradient portion of the method.
Chemistry Screening The primary goal of this phase is selection of the mobile phase and stationary phase chemistry to
promote to optimization studies. Typical Reversed Phase study variables for this stage include:
• pH (very broad range can be done as two separate studies – e.g. 2-5 and 8-10)
• Strong Solvent Type (optional - e.g. ACN and MeOH)
• Gradient Time (use constant starting point and end point % Organic)
• Stationary Phase I (columns with differing chemistry – e.g. C8, C18, Phenyl, Amide,
Cyano).
• Stationary Phase II (can follow up with different suppliers or lengths of the column
identified as the best one from the Stationary Phase I experiment).
The end point of Chemistry Screening is the right range of pH (usually not the exact pH), the
right strong solvent type, the right column, and generally the right Gradient Time to use in
subsequent optimization studies. The screening endpoint method should yield a chromatogram
with acceptable S/N Ratio for all peaks of interest, an acceptable k’ value for the 1st eluted peak,
and some confidence that most or all peaks are eluting during the gradient portion of the method.

Fusion LC Method Development Software – 12 Reasons Why V6.1 Copyright © 2016 S-Matrix Corporation. All Rights Reserved. Page 7
Method Optimization The primary goal of this phase is a final method which meets all separation and chromatographic
quality goals and has an acceptable assay time. Typical Reversed Phase study variables for this
stage include those listed below. It should be noted that these instrument and chemistry
parameters are not normally all studied in a single optimization experiment.
• Pump Flow Rate • pH (narrow range with 5 levels - e.g. 2.0, 2.5, 3.0, 3.5, 4.0) • Gradient Slope • Oven Temperature • Buffer Type and/or Concentration
(optional - depends on chromatography type and sample compounds) • Additive Type and/or Concentration
(optional - depends on chromatography type and sample compounds) The end point of the optimization phase is a well characterized Design Space. This includes a
final method which demonstrates acceptable mean performance for all included CQAs and which
performs robustly for all CPPs.
Sample Preparation – Detailed Discussion Customers use FMD to develop and run quick sample preparation screening studies with
variables such as Pump Flow Rate, Injection Volume, and Sample Concentration (see Figure 1).
The user can then either (1) visually inspect the resulting chromatograms to find acceptable
starting-point conditions for more formal method development - for example check to see that
the signal is in the right range and scale, or (2) use our patented Trend Response chromatogram
results technology to obtain and model responses such as number of integrated peaks, number of
peaks with S/N Ratio > a user specified value, and retention time of the main peak (usually the
API). This type of study approach enables the user to quickly identify the best sample
preparation conditions in terms of compound concentrations and injection volume.
Figure 1
Fusion LC Method Development Software – 12 Reasons Why V6.1 Copyright © 2016 S-Matrix Corporation. All Rights Reserved. Page 8
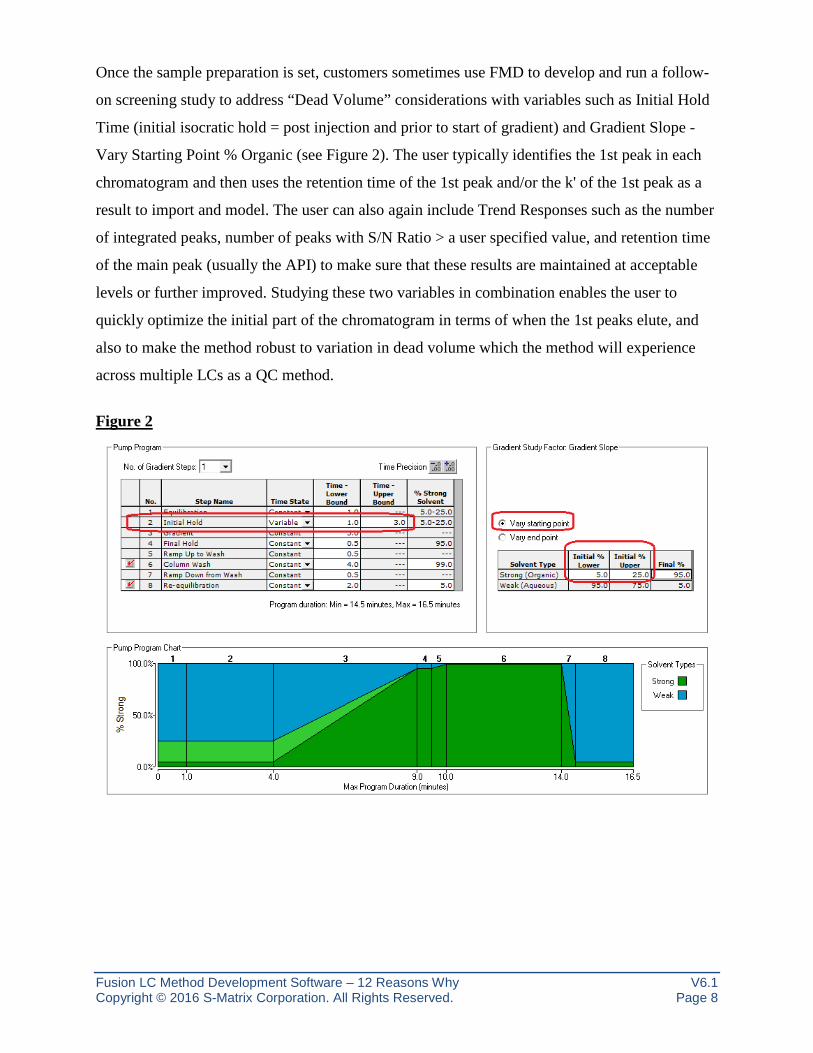
Once the sample preparation is set, customers sometimes use FMD to develop and run a follow-
on screening study to address “Dead Volume” considerations with variables such as Initial Hold
Time (initial isocratic hold = post injection and prior to start of gradient) and Gradient Slope -
Vary Starting Point % Organic (see Figure 2). The user typically identifies the 1st peak in each
chromatogram and then uses the retention time of the 1st peak and/or the k' of the 1st peak as a
result to import and model. The user can also again include Trend Responses such as the number
of integrated peaks, number of peaks with S/N Ratio > a user specified value, and retention time
of the main peak (usually the API) to make sure that these results are maintained at acceptable
levels or further improved. Studying these two variables in combination enables the user to
quickly optimize the initial part of the chromatogram in terms of when the 1st peaks elute, and
also to make the method robust to variation in dead volume which the method will experience
across multiple LCs as a QC method.
Figure 2

Fusion LC Method Development Software – 12 Reasons Why V6.1 Copyright © 2016 S-Matrix Corporation. All Rights Reserved. Page 9
4. Simple Experiment Setup
As described under Reason 3, FMD has default template experiments for column/solvent
screening and for method optimization for the Reversed Phase chemistry type. However, since
each sample represents a different set of compounds, these templates are user editable, and users
can create their own flexible templates for a given phase of method development.
Figures 3 and 4 show a part of the simple Experiment Setup workspace. Figure 3 shows that the
Pump Flow Rate has been included in the study, but set to a Constant level of 0.500 mL/min.
This convenient configuration tells FMD to build this flow rate into each experiment method. As
shown in Figure 4, the pH variable and the Oven Temperature instrument parameters are also
included, and in this case they are defined as State=Variable with multiple study levels.
Figure 3
Figure 4

Fusion LC Method Development Software – 12 Reasons Why V6.1 Copyright © 2016 S-Matrix Corporation. All Rights Reserved. Page 10
Online Preparation
Buffer Concentration Example As shown in Figure 5, the software will dilute the stock solution to each target level using the “Deionized Water” designated solvent. NOTE – the highest target level of “Buffer Concentration” will restrict the allowable upper bound of the Strong solvent(s). Therefore, the stock solution should be prepared at a concentration which will minimize this restriction; for example, one which will require at most 10.0% of the mobile phase to achieve the highest target level. As shown below, no more than 10.0% of the Stock Solution mobile phase will be required to achieve the highest target concentration of 10.00 mM given a stock solution concentration of 100.00 mM. Figure 5

Fusion LC Method Development Software – 12 Reasons Why V6.1 Copyright © 2016 S-Matrix Corporation. All Rights Reserved. Page 11
Maintain target level in each run:
UNchecked: as shown in the image above, the software will maintain the target buffer concentration in the Weak mobile phase within a given run (injection). However, the absolute concentration will change as the Strong/Weak solvent ratio changes across the gradient.
Checked: as shown in the image to the
right, the software will maintain the target buffer concentration in a given run (injection) as an absolute constant within the mobile phase independent of the change in the Strong/Weak solvent ratio across the gradient.
Include “Type” Variable: As shown in Figure 6, this setting adds a linked Buffer Type variable to the Buffer Concentration variable. This is a Categorical variable which you include when you want to study different buffer types (or suppliers, etc.) across the concentration study range. Figure 6

Fusion LC Method Development Software – 12 Reasons Why V6.1 Copyright © 2016 S-Matrix Corporation. All Rights Reserved. Page 12
pH Example For LC instrument systems with quaternary pump modules FMD can now automatically prepare
target levels of pH for experimenting. It does this by enabling the user to define an acid-base
solvent pair and the acid-base solvent ratio needed to achieve each desired study level of pH.
FMD will then build the proportions required to maintain the target level of pH for the run into
each step of the instrument method’s pump program. To illustrate, Figure 7 presents a table of
the acid-base solvent ratios for Formic Acid and Ammonium Formate which result in a six-level
pH screen covering a range from ~ 2.3 to 6.2. The experiment setup for this pH range is shown in
Figure 8 for the six target experimental levels of pH.
Figure 7
0.10 M Formic Acid
(%)
0.10 M
Ammonium Formate
(%) pH
100 0 2.31
80 20 2.99
60 40 3.39
40 60 3.75
5 95 4.80
0 100 6.16
Figure 8

Fusion LC Method Development Software – 12 Reasons Why V6.1 Copyright © 2016 S-Matrix Corporation. All Rights Reserved. Page 13
5. Automated Experimental Design Selection
FMD has a built-in Design Wizard which can automatically select the most efficient DOE design
based on your stage of work (e.g. chemistry screening or method optimization) and the LC
parameters you selected for study.
FMD has a comprehensive experimental design library which includes the statistical
experimental design types listed below. This assures the user that FMD can generate a
statistically valid and defensible DOE design for any combination of instrument parameters
selected for study. In the user-interactive mode of the built-in Design Wizard the user can select
an alternative to the FMD recommended design, as shown in the wizard dialog pictured in Figure
9. However, FMD will disable DOE design options which are not valid for the user’s selected
instrument parameters.
FPD has built-in knowledge of each experiment design type in its DOE Design library.
• Full Factorial Designs • Fractional Factorial Designs • Plackett-Burman Designs • Central Composite Designs • Box-Behnken Designs • Star Designs • Mixed-level Designs • Model Robust Designs (D-optimal, A+G Optimal)
Figure 9

Fusion LC Method Development Software – 12 Reasons Why V6.1 Copyright © 2016 S-Matrix Corporation. All Rights Reserved. Page 14
6. Supports Column Selection
Figure 10 is the Experiment Setup control within the Fusion LC Method Development software
module (FMD) for the Column Type variable. When the LC has a column switching valve, FMD
will set up the experiment to fully utilize the valve. When there is no valve, or when the number
of columns included in the study exceeds the valve capacity, FMD will automatically build the
experiment as multiple sequences in the chromatography data software. Column selection is
normally done as part of a chemistry screening experiment which also includes Gradient Slope,
pH (depending on the Chemistry Type – e.g. Reversed Phase), and strong solvent type. More
detail on chemistry screening is provided in Item 8.
Figure 10
Flow Rate
When Pump Flow Rate is not set as a global constant or an experiment variable the settings fields in this column are enabled. This lets the user define a specific flow rate for each column included in the experiment. When Pump Flow Rate is set as a global constant or an experiment variable the settings fields in this column are disabled.
Condition Column Time
FMD automatically inserts “Condition Column” methods to condition each column with the mobile phase chemistry which will be used in the next series of experiment runs. The user can define the time setting for each column which results in sufficient column volumes to acceptably condition the column for the next block of chemistry runs.
pH Upper Bound
When pH is included as an experiment variable FMD will not use a study level of pH with a column when the study level is greater than or equal to the pH Upper Bound setting.

Fusion LC Method Development Software – 12 Reasons Why V6.1 Copyright © 2016 S-Matrix Corporation. All Rights Reserved. Page 15
7. Automates QbD Experimentation on Your LC Instruments
FMD fully automates QbD experimentation on the Agilent ChemStation/OpenLab
Chromatography Data Software (CDS) and the Waters Empower 2 and 3 CDS.
• Fusion Export Wizard automatically builds your experimental design in the CDS as
ready to run methods and sequence.
• Fusion Import Wizard automatically imports all chromatogram results data from the
CDS as analysis-ready data sets.
Figures 11.a and 11.b illustrate the automated DOE experiment dataflow between FMD and your
CDS. Figures 11.c – 11.e are images of the LC modules and devices FMD supports for fully
automated experimentation within Agilent ChemStation/OpenLab, ThermoFisher Chromeleon,
and Waters Empower 2 and 3.
Figure 11.a

Fusion LC Method Development Software – 12 Reasons Why V6.1 Copyright © 2016 S-Matrix Corporation. All Rights Reserved. Page 16
Figure 11.b
Figure 11.c

Fusion LC Method Development Software – 12 Reasons Why V6.1 Copyright © 2016 S-Matrix Corporation. All Rights Reserved. Page 17
Figure 11.d
Figure 11.e

Fusion LC Method Development Software – 12 Reasons Why V6.1 Copyright © 2016 S-Matrix Corporation. All Rights Reserved. Page 18
8. Automated Modeling & Critical Parameter Effects Ranking
FMD has default template experiments for column/solvent screening and for method
optimization for the Reversed Phase chemistry type, as shown in Figure 12. These templates pre-
load recommended study variables into the Experiment Setup workspace. The templates are
based on many years of successful use of these variables in screening and optimization studies.
However, since each sample compound mix is unique, these templates can be directly edited to
make them meaningful to the current sample. In addition, users can build their own templates.
For example, many customers have created standardized chemistry screening protocol templates
which define specific levels of pH, specific columns, and strong solvent types or composition.
Figure 12
FPD has a built-in Analysis Wizard with both Automated and User-interactive Modes. The
Automated Mode will automatically derive the most statistically defensible prediction equation
(model) from the experimental data for each response included in the study. The Automated
mode is a state-of-the-art Multiple Linear Regression (MLR) technology which contains all the
relevant component analysis operations required of a fully automated MLR routine, implemented
in the correct operational sequence. The User-interactive mode gives the user complete control
over the MLR configuration settings while showing its statistically defensible recommendations,
as shown in the wizard dialog pictured in Figure 13.

Fusion LC Method Development Software – 12 Reasons Why V6.1 Copyright © 2016 S-Matrix Corporation. All Rights Reserved. Page 19
Figure 13
The correctness of FPD’s automated MLR routine was rigorously verified by Douglas C.
Montgomery, Ph.D., Regents' Professor of Industrial Engineering & Statistics at Arizona State
University. Dr. Montgomery is the acknowledged world leader in the field of applied industrial
statistics with special expertise in statistical experimental design, also referred to as Design of
Experiments (DOE).
“It is especially noteworthy that about a decade ago a major international corporation spent over $1,000.000.00 attempting to develop an automated MLR analysis capability. They were unsuccessful. This validation exercise therefore demonstrates that FusionQbD’s automated MLR software is at once both correctly implemented and a major advance in the field of MLR analysis.”
Douglas C. Montgomery, Ph.D.
FMD automatically generates a full statistical reporting of each equation derived from the
experimental data. One of these reports is the Mean Effects Pareto Ranking Table and Plot report
which is shown in Figure 14. This report was generated for the Peak 4 – USP Resolution
response data obtained from a method optimization experiment. The ranking is based on the
magnitude of the change in the response as the variables are changed across their individual
experimental ranges. The ranking is applied to all effects, including interaction effects [e.g.
(Xi*Xj)], curvature effects [e.g. (Xi)2], and complex effects [e.g. (Xi)2*Xj] as well as
independent additive effects (Xi).

Fusion LC Method Development Software – 12 Reasons Why V6.1 Copyright © 2016 S-Matrix Corporation. All Rights Reserved. Page 20
An experiment variable is identified as a Critical Method Parameter (CMP) if one or more
effects involving the variable are of practical significance. For example, although it is
statistically significant, the effect of the nonlinear interaction between Initial % Organic and pH
[(A)2*C] only changes the Peak 4 Resolution by 0.059 units, and so it is not practically
significant. However, both these study variables are CMPs for this response, since their
independent additive effects (A and C) and their interaction effect (A*C) are both statistically
significant and practically significant.
Figure 14

Fusion LC Method Development Software – 12 Reasons Why V6.1 Copyright © 2016 S-Matrix Corporation. All Rights Reserved. Page 21
9. Support for Peak Tracking
Most LC method development software only works when every peak is accurately identified in
each experiment chromatogram – an extremely difficult requirement for virtually all initial
chemistry screening experiments and also for almost all early development experiments for drug
product methods, stability-indicating methods, and cleaning methods in which the samples
contain several impurity and/or degradant peaks. This is why S-Matrix developed our patented
Trend Response™ technology in conjunction with several of our major international
pharmaceutical company customers. Trend Responses provide quantitative metrics of
chromatographic quality for early method development experiments such as column and solvent
screening studies without the need for extremely difficult and error prone peak tracking.
Our Trend Response technology enables you to easily define their critical metrics of
chromatographic quality for a given sample and stage of development. Example Trend
Responses include the total number of integrated peaks in the chromatogram, the number of well
resolved peaks, the number of peaks with S/N Ratio > a user specified value, etc. (see Figure 15).
Once defined by the user, FMD will automatically import these responses from the experiment
chromatogram data in the CDS and model these responses to identify the best column and
chemistry conditions to use in subsequent method optimization studies.
Figure 15

Fusion LC Method Development Software – 12 Reasons Why V6.1 Copyright © 2016 S-Matrix Corporation. All Rights Reserved. Page 22
S-Matrix’s patented Trend Response operators also enable Fusion QbD to track critical peaks in
each experiment chromatogram such as the First Peak and Last Peak, and capture all
chromatographic responses of interest for these peaks such as K-Prime and Retention Time.
Also, the Max Peak # operator enables Fusion QbD to automatically track one or more main
peak(s), and/or spiked peaks of interest, through the Peak Area response, and capture all
chromatographic responses of interest for these peaks. For example, the Max Peak 1 operator
will locate the largest peak (in area) in each experiment chromatogram, and automatically
capture the chromatographic result associated with it.
Fusion QbD can also utilize chromatographic results from peak tracking done in the CDS for
critical pair peaks or group peaks in method optimization experiments (see Figure 15). However,
this task is made easier by the column and chemistry screening experiments done earlier, since
the correct stationary phase and strong solvent type selected in the screening experiments are
now constant in optimization experiments. Also, other strong effectors such as pH are studied in
a more limited range. As a result, the Fusion QbD strategy has made peak tracking much simpler
in optimization experiments. When peak tracking help is needed, the user can set up FMD to
generate paired repeat runs of each experiment method in which the two repeat injections use
different sample vials. In this case one sample vial will contain all the compounds, while the
other sample vial includes only the sample solvent spiked with one compound from each critical
peak pair – each at a concentration which gives a different area. Since the same method is run
using both sample vials, a simple comparison of the paired chromatograms lets the user easily
identify the critical pair peaks using retention time.

Fusion LC Method Development Software – 12 Reasons Why V6.1 Copyright © 2016 S-Matrix Corporation. All Rights Reserved. Page 23
10. Identifies Best Performing and Most Robust Methods
The robustness approach implemented in FMD uses Process Capability indices (e.g. Cp, Cpk) to
quantify system robustness. Cp is a standard Statistical Process Control (SPC) metric widely used
to quantify and evaluate method variation in critical quality and performance characteristics. For
a given critical method performance characteristic, Cp is the ratio of the method’s allowable
tolerance width to its inherent variation, and is computed as shown in Figure 16.
Figure 16
where UTL and LTL are the upper and lower response tolerance limits, and 6σ variation is the
amount of inherent variation about the mean response value bounded by the ±3σ confidence
interval limits. Cp is therefore a direct measure of a method’s inherent variation in a given critical
performance characteristic relative to specified tolerances. UTL and LTL are symmetrical limits
which define the smallest and/or largest acceptable values for the response. For a given
instrument parameter, the 6σ variation represents the total expected variation around the
parameter’s setpoint which will be expressed on method transfer and routine use over time.
Figure 17 illustrates the Cp calculation elements for a critical method performance result – the
Resolution of two drug component peaks as measured by liquid chromatography – given a mean
resolution ( X ) of 2.00 and tolerance limits of ±0.50. Note that the lower tolerance limit of -0.50
assures that the resolution will never fall below 1.50 (2.00 – 0.50). In classical SPC a process is
deemed capable when its measured Cp is ≥1.33. The value of 1.33 means that the inherent
process variation, as defined by the 6σ variation limits, is equal to 75% of the tolerance limits
(4/3 = 1.33). Conversely, a process is deemed not capable when its measured Cp is ≤1.00, as the
value of 1.00 means that the 6σ variation limits are located at the tolerance limits.

Fusion LC Method Development Software – 12 Reasons Why V6.1 Copyright © 2016 S-Matrix Corporation. All Rights Reserved. Page 24
Figure 17 illustrates how FMD uses a critical CQA response prediction model in a Monte Carlo
simulation mode to obtain the prediction of the response variation for given candidate methods.
First, 10,000 level settings are defined for each study variable using the normal distribution with
mean value equal to a candidate method’s target level setting and the 6σ variation (the ±3.0σ
limits) the user has defined for the variable. Next, the 10,000 combinations of the variable’s
variation distribution level settings are input into the CQA response prediction model, one
combination at a time, which provides 10,000 response predictions. The distribution of these
predictions correctly reflects the cumulative variation resulting from the combined variations of
the individual study variables around their setpoints as the method executes. Statistically
characterizing this distribution then provides the 6σ variation value required in the Cp
calculation.
Figure 17
FMD equations derived from the experiment data characterize the effects of the experiment
variables on each analyzed response (CQA). FPD can combine these equations with the Monte
Carlo Simulation equations for predicting robustness into its global Best Answer Search utility to
find the best overall conditions from the current experiment.
Fusion LC Method Development Software – 12 Reasons Why V6.1 Copyright © 2016 S-Matrix Corporation. All Rights Reserved. Page 25
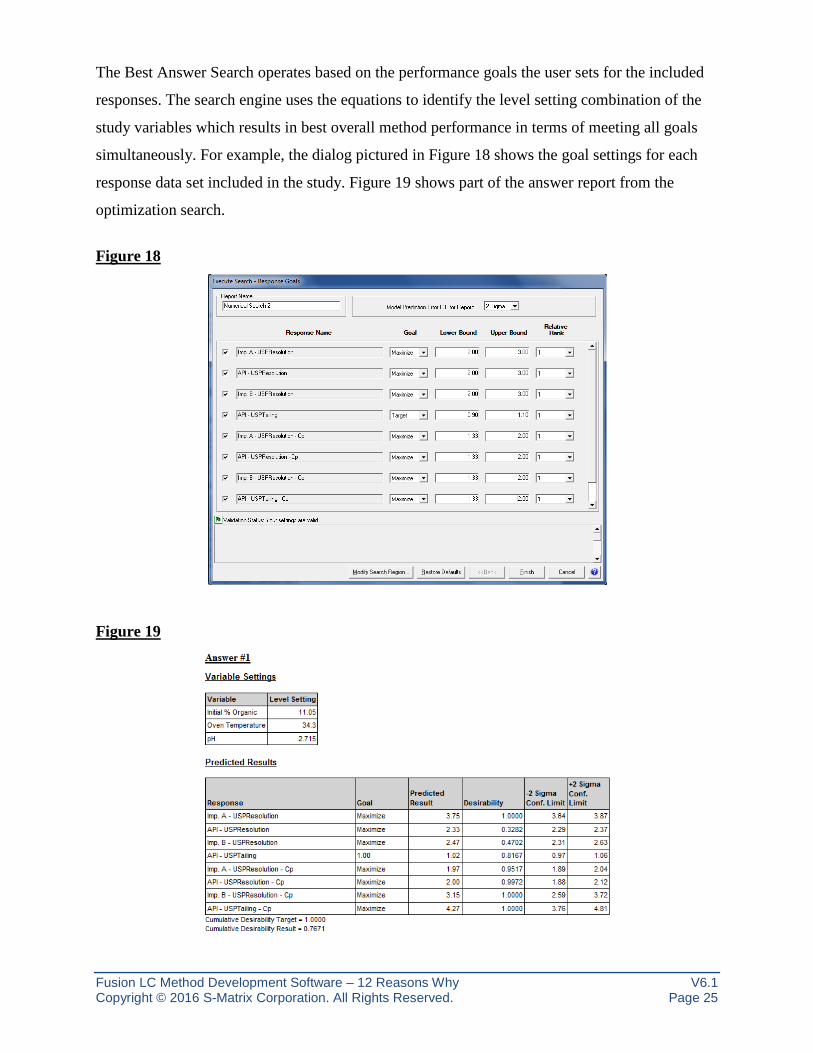
The Best Answer Search operates based on the performance goals the user sets for the included
responses. The search engine uses the equations to identify the level setting combination of the
study variables which results in best overall method performance in terms of meeting all goals
simultaneously. For example, the dialog pictured in Figure 18 shows the goal settings for each
response data set included in the study. Figure 19 shows part of the answer report from the
optimization search.
Figure 18
Figure 19

Fusion LC Method Development Software – 12 Reasons Why V6.1 Copyright © 2016 S-Matrix Corporation. All Rights Reserved. Page 26
11. Graphically Visualizes the Robust Design Space and PARs
The Cp metric is applied directly to critical responses to determine the relative robustness of a
candidate method in terms of each Critical Quality Attribute (CQA – critical method
performance characteristic). This enables you in a single plot to see the region where the graphed
variable settings will yield acceptable results for all responses simultaneously, including
robustness responses – i.e., the combined Robust Design Space. Such an overlay graph is
presented in Figure 20.a, while Figure 20.b presents the same graph after scribing the Proven
Acceptable Ranges (PARs) onto the design space within the graph.
Figure 20.a – Design Space Figure 20.b – Design Space & PARS
FMD also has a 4D trellis graphing capability shown in Figure 21. This lets you visualize and
report a graphical representation for up to 4-variable study variable combinations which result in
acceptable method performance (unshaded regions) and unacceptable performance (shaded
regions). The 4D trellis graphics also operate based on the performance goals the user sets for the
included responses. Note that a specific color is associated with each response to denote where
the performance for that specific response is unacceptable. This enables the 4D trellis feature to
graphically display the 4-variable Robust Design Space and PARs in terms of meeting all user-
defined goals simultaneously.

Fusion LC Method Development Software – 12 Reasons Why V6.1 Copyright © 2016 S-Matrix Corporation. All Rights Reserved. Page 27
Figure 21

Fusion LC Method Development Software – 12 Reasons Why V6.1 Copyright © 2016 S-Matrix Corporation. All Rights Reserved. Page 28
12. Generates Regulatory Submittal Quality Reports
FMD enables the user to create final reports of the Design Space and proven acceptable ranges
(PARs – the “operating space”) which conform to FDA/ICH Guidances. Figure 22 is an example
of one of these FMD reports, which can be compared directly to the guidelines presented in the
ICH Q8(R2) Guidance. This is an ideal format for reporting QbD experiment results.
Figure 22
FMD’s comprehensive documentation also includes detailed statistical reports of the DOE
design and the analysis results associated with each experiment. Any or all of these detail reports
can be compiled into an internal report or an external report, depending on the target audience
and the desired level of reporting detail.

Fusion LC Method Development Software – 12 Reasons Why V6.1 Copyright © 2016 S-Matrix Corporation. All Rights Reserved. Page 29
For each response (chromatographic result) included in the experiment FMD generates a detail
report of each of the interrelated analyses associated with the model (equation) it derives from
the data. This includes an experimental error report, a transformation analysis report, a regression
analysis report, a report of the statistical properties of the final model (equation), and a Pareto
Ranking of Variable Effects report. In addition to these detail reports, FMD creates an Analysis
Summary Report which contains a table and graph summarizing the key analysis results (Figure
23). The Analysis Summary Report defines the statistical quality of the model (model
sufficiency), and is often used by customers as part of their analysis documentation.
Figure 23