worldscope database datatype definitions guide
TRANSCRIPT

Issue 6: April 2007
T H O M S O N F I N A N C I A L
Worldscope Database Datatype Definitions Guide
www.thomson.com/financial
Performance MattersSM
Notice
This Worldscope Database Datatype Definitions Guide contains confidential and proprietary information of Thomson Financial and may be used only by a recipient designated by and for purposes specified by Thomson Financial. Reproduction of, dissemination of, modifications to, or creation of derivative works from this Worldscope Database Datatype Definitions Guide, by any means and in any form or manner, is expressly prohibited, except with the prior written permission of Thomson Financial. Permitted copies of this document must retain all proprietary notices contained in the original. The information in this document is subject to change without prior notice. Always confirm with Thomson Financial that you are using the most current version of this document. Thomson Financial is free to modify any of its products and services, in any manner and at any time, notwithstanding the information contained in this document. Certain information, including images, graphics, numerical or textual data pertaining to assets or securities may be included in this document to illustrate different types of products and services of Thomson Financial. Such information may be fictitious or incomplete and should not be relied upon or considered investment advice. THE CONTENTS OF THIS DOCUMENT SHALL NOT CONSTITUTE ANY WARRANTY OF ANY KIND, EITHER EXPRESSED OR IMPLIED, INCLUDING BUT NOT LIMITED TO THE IMPLIED WARRANTIES OF MERCHANTABILITY AND/OR FITNESS FOR A PARTICULAR PURPOSE OR GIVE RISE TO ANY LIABILITY OF THOMSON FINANCIAL, ITS AFFILIATES OR ITS SUPPLIERS. The terms and conditions governing the use of this Worldscope Database Datatype Definitions Guide shall consist of those set forth in written agreements with Thomson Financial. © Copyrights Thomson Financial 2003-2007. This document contains trademarks of Thomson and its affiliated companies in the United States and other countries and used herein under license. Non-Thomson marks are trademarks of their respective owners.
Issue 6 3
Table of Contents
Introduction to Worldscope ............................................................................................... 4
Client Support Services .................................................................................................... 12
Frequently Asked Questions ............................................................................................ 13
Data Templates .................................................................................................................. 33 Banks……………………………..33 Industrial………….………………56 Insurance…………………………79 Other Financials………............101 Security Level……….…………. 124 ADRs…………………………… ..128 Fast Updates…………..………..131 Limited Data Set……………….. 154 Interim Time Series…………… 183
Alphabetical List of Field Definitions .............................................................................. 199 Field Definitions - Explanation of Format……. 196 Accounting Standards Fields……………......... 197 Alphabetical List of Field Definitions…………. 199

Introduction to Worldscope
Issue 6
© Thomson Financial 2003-2007 4 Confidential Information of Thomson Financial
Introduction to Worldscope
General Description The Worldscope Global Database is the financial industry’s premier source of detailed financial statement data and profile data on public companies domiciled outside of the United States of America. It also contains complete coverage of US companies filing with the Securities Exchange Commission, with the exception of closed end investment companies. Using primary source documents and news clippings, Worldscope data analysts extract the data to global templates that are specific to industry groups. The templates take into consideration the variety of accounting conventions and are designed to facilitate comparisons between companies and industries within and across national boundaries. Please refer to the Database Methodology overview for more information regarding templated data.
Objective
Worldscope provides professional analysts and portfolio managers with the most comprehensive, accurate and timely data on publicly quoted companies around the world. Worldscope’s aim is to enhance the comparability of the financial data of companies from different countries and industries and across time periods.
Information Content The total universe of companies contained on the database has grown from about 4,000 in 1987, to over 51,100 at March 2007 This includes 33,300 currently active companies in developed and emerging markets, representing approximately 95% of global market capitalization. Worldscope contains extinct or inactive companies, i.e. those which have merged, liquidated or become privately held. History for these companies remains on the database.
Over 70 countries are represented, and include all countries in targeted global indices (FTSE All World, Dow Jones Global, MSCI World, MSCI EMF, S&P Global, S&P/Citigroup).
The base year for the Worldscope Database is 1980, although statistically significant company and data item representation is best represented from January 1985 forward. The following general types of information are available. The level of detail available for each company may differ depending on update type and company type:
Company Header Information and CV Profiles
Address Officers Business Descriptions
SIC Codes Product Segments Investor Relations
Auditors Company Status
Geographic Segments
Financial Statements
Balance Sheet Income Statement Cash Flow Statement

Introduction to Worldscope
Issue 6
© Thomson Financial 2003-2007 5 Confidential Information of Thomson Financial
Historical Growth Rates & Valuation Ratios
Growth Profitability Asset Utilization
Leverage Liquidity Foreign Business
Security and Market Data
Multiple Share Info Stock Prices Stock Performance
SEDOL/ISIN CUSIP/Ticker Exchange listing(s)
Other
Exchange Rates Global Industry Groups Key Index Membership
More details on the types of data contained in a Worldscope company record can be seen in the Industry Specific Templates
Applications Database applications include:
Construction and maintenance of global investment portfolios Global Industry and Sector analysis Comparison of capital structures and financing strategies of corporations
worldwide Evaluation and monitoring of the efficiency of capital markets Style Analysis Generalized screening, reporting and presentation of corporate data
Existing Worldscope clients include:
Money Management firms: Portfolio managers, research analysts Investment banks: Corporate finance, mergers & acquisitions departments Corporations: Strategic planners, librarians, treasurers, controllers, auditors Academic and Public Sector: Research libraries Consulting firms: Management consultancies, accounting firms, pension
consultants
Origins and Development The Worldscope Database originated in the international investment management activities of Wright Investors' Service, a U.S. based global money management firm. In 1987, Worldscope established a second research centre in Shannon, Ireland, to maintain and develop the database. In 1990, Worldscope/Disclosure Partners was formed as a joint venture between Wright Investors' Service and Disclosure Inc., a division of Primark Corporation (NYSE: PMK). In 1995, Worldscope/Disclosure established a third major research and data collection centre in Bangalore, India. Primark acquired the remaining interest in Worldscope in 1999. A fourth major research and data collection centre in Manila, Philippines was added with Primark’s 1999 acquisition of the Extel company database. In 2000, Primark Corporation was acquired by Thomson Corporation. Today, the database operations group, which supports the Worldscope database, employs over 500 people mainly located in 3

Introduction to Worldscope
Issue 6
© Thomson Financial 2003-2007 6 Confidential Information of Thomson Financial
collection centres located in Bangalore (India), Shannon (Ireland), and Manila (The Philippines).

Introduction to Worldscope
Issue 6
© Thomson Financial 2003-2007 7 Confidential Information of Thomson Financial
Database Methodology
Available Format Worldscope is available through a variety of Thomson Financial software products, including Thomson One products, Datastream, and MarketQA. Worldscope is also available via direct data feed, FTP. In addition to Thomson Financial software platforms, Worldscope is available on all the major equity applications serving the professional finance and investment communities. Please contact your local Thomson Financial sales office for specific information on Worldscope data delivery options and documentation.
Diversity in International Financial Reporting Despite recent advances by major exchanges, FASB, IASB, and other regulatory bodies, financial accounting practices and company’s presentation of financial accounts continue to be remarkably diverse around the world, due to differences in the legal and tax environments in which accounts are prepared. Naturally, linguistic and cultural diversity is reflected in financial accounts, but their form and content is additionally influenced by less obvious factors. These include the legal and taxation systems, transparency of corporate ownership, methods of corporate financing, the prominence of the accounting and auditing professions, and so on. The enormous increase in international investment flows in recent decades has highlighted the difficulties this diversity causes, as accounts prepared in one accounting environment are employed by users familiar with different practices. It is critically important to the efficient operation of capital markets that accounting information be mutually comprehensible to investors in different countries. This has been the impetus behind attempts to harmonize accounting standards, led by organizations such as the International Accounting Standards Committee and the Financial Accounting Standards Board.
Worldscope’s Treatment of Accounting Differences Worldscope is designed for the user who needs to compare the financial information of companies from different industries and countries throughout the world. For the reasons mentioned above, there are limitations to the comparability and thus utility of raw data as reported in company accounts. Our analysis of financial statements from around the world leads us to classify two main areas in which differences can arise to impede such comparisons:
1. Valuation. Companies and accounting systems differ in the cost basis used in financial statements; in the utilization of accruals and provisions; as well as in the accounting methods for business combinations, depreciation, research and development, foreign currency translation, leases, and so on.
2. Disclosure or Presentation. There can be extreme variations, even within supposedly 'standard' accounting systems, in the terminology used in financial statements, the definitions of individual accounting items, the format of accounts and the depth of detail contained in the statements themselves and in the notes to the accounts.
Introduction to Worldscope
Issue 6
© Thomson Financial 2003-2007 8 Confidential Information of Thomson Financial
Worldscope does not attempt to standardize data for all valuation differences between companies. We do not believe this is a feasible or desirable aim, given the lack of detailed published information and the sheer size and diversity of the database.
Where differences arise due to disclosure or presentation, however, it is possible to greatly improve the value of fundamental information to practitioners. In its simplest manifestation, this could mean that the reported 'Sales' of a tobacco company which include excise taxes should not be compared directly with the reported 'Sales' of another tobacco company which exclude excise taxes. There are numerous examples of such simple presentation issues which can cloud the usefulness of 'raw data', and of course this multiplies when different countries, industries, accounting systems, and different languages are involved.
Worldscope analysts use standard data definitions in the coding of financial accounts. By closely examining the nature and components of financial statements, footnotes and related disclosures, differences in accounting terminology, presentation, and language are minimized. These definitions form the last section of this book. Any variations from our standard definitions are footnoted where it is not possible to aggregate or disaggregate data accurately. Format variations are overcome by use of the standard industry templates contained in section four of this book.
Worldscope data analysts carefully examine the terminology used in reported financial information. Words like 'short-term', 'long-term', 'current', 'operating’, ’special’, and 'extraordinary' can be variously defined from company to company, and in different industries and accounting systems. Because each Worldscope data item is precisely defined in a standard way, any reported items which deviate from this definition are standardized to increase comparability. In the case noted above, for example, the 'Sales' figures contained on Worldscope can be compared, because our Field 01001 Net Sales or Revenues is always net of excise taxes, which is contained in a separate supplementary field (Field 18063).
To illustrate with another example, general business practice regards twelve months as an appropriate dividing line between 'current' and 'non-current'. Yet many companies include long-term portions in their 'current' investments, receivables, and so on. This is only apparent when one sifts through the notes to the accounts, as our analysts are required to do. Any such non-current amounts are reclassified to long-term receivables, long-term investments, etc. Thus the utility and comparability of working capital and other ratios is enhanced. Similarly, when companies report 'long term debt' including the current portion (amounts maturing within one year), we back out this amount and include it in the item Short Term Debt & Current Portion of Long Term Debt (Field 03051).
Another example is fixed assets impairment charges. It can be treated by companies as a non recurring item. Yet other companies may consider it as an operating expense and include it within cost of goods sold. This is only apparent when one sifts through the notes as our analysts are required to do. Worldscope treats fixed assets impairments as non recurring and an adjustment is made to cost of sold and operating profit when it includes this item. Thus the utility and comparability of operating profit and ratios such as operating margin is enhanced. A separate field exists for impairment allowing the customer to add the data back into operating profit if he would prefer to treat impairment as non recurring.
As a final illustration of Worldscope's methodology, minority interests may be separated from shareholders' equity or included and may or may not be deducted in arriving at net income. Our analysts reformat the accounts to standardize this for all

Introduction to Worldscope
Issue 6
© Thomson Financial 2003-2007 9 Confidential Information of Thomson Financial
countries, thereby improving the information value of such commonly utilized figures as Book Value (equity) per share and Earnings per share.
It is important to stress that Worldscope does not "change" the valuation of data reported by the company in its accounts. We simply scrutinize exactly what components each reported figure is made up of, and if necessary, rebuild the accounts using the same components the company originally used, to arrive at more uniform reporting templates. Our purpose is to help financial fiduciaries better deploy their time and efforts in analyzing financial statements around the world.
Introduction to Worldscope
Issue 6
© Thomson Financial 2003-2007 10 Confidential Information of Thomson Financial
Data Quality
Analyst Training At Worldscope, quality assurance begins with the recruitment of multilingual corporate data analysts, generally with accounting or financial academic qualifications. About twenty-five major languages are represented within Worldscope, either by native speakers or fluent non-native speakers. Worldscope analysts undergo extensive and detailed training before being allowed to make any meaningful contribution to the updating and analysis process. A further period of three to six months is spent in on-the-job training under supervision. Detailed country-specific accounting and financial practices documentation has been developed to assist Worldscope data analysts in their understanding of international accounting and reporting practices. These manuals define each discrete database item in considerable detail, so that information is interpreted accurately and consistently throughout all countries across all analysts.
Automated Testing Every piece of information entered into the database is subjected to a rigorous series of 2,300 computerized balance, magnitude, correlation and alpha tests, many of which are industry or country specific.
1. Balance tests check that formulas which should theoretically add up actually do. e.g. Total Assets (Field 02999) = Total Liabilities & Shareholders' Equity (Field 03999), or Operating Income (Field 01250) = Net Sales or Revenues (Field 01001) - Operating Expenses (Field 01249).
2. Magnitude tests compare data items in the current fiscal period with the same items for prior periods, and query items which exceed predetermined variances, e.g. Net Sales or Revenues (Field 01001) in the current year should be within a range of 100% to 125% of the prior year's figure.
3. Correlation tests are similar, but examine the relationships between appropriate data items in the same period, e.g. profitability and leverage ratios, for apparent outliers.
4. Alpha tests check the validity of alphanumeric (textual) data, e.g. checks for correct date formats, valid industry codes and correct field lengths.
Where these tests fail, analysts must recheck and if necessary make corrections. No information is allowed onto the database if any failed tests remain unresolved.
Supervision and Auditing When data for any company is updated, the computer automatically generates a report for that company, listing the last five years of historical information, including the year that has just been updated. This is reviewed by the analyst's group leader for consistency and accuracy. The group leader must be satisfied that errors have been corrected before 'signing-off' on that company.
All quality is monitored and controlled by a team of auditors. This department is charged with the task of examining and rechecking in great detail a random sample of

Introduction to Worldscope
Issue 6
© Thomson Financial 2003-2007 11 Confidential Information of Thomson Financial
each analyst's and country group’s work, generating regular performance and quality reports for management, supervisors and analysts.
Timeliness Timeliness is always one of Worldscope's key concerns and we strive to reduce the delay between publication of information and its availability to Worldscope users.
Timeliness involves issues such as filing requirements, the publication delay allowed to companies in various jurisdictions, and the speed with which Worldscope acquires any published documentation from the company or the local stock exchange.
Worldscope prioritizes the collection, analysis, and input of company information based on two key criteria.
First, priority is given to companies within a country with membership in one of a set of major global benchmark indices or local key indices.
Second, all companies within a country are prioritized by market capitalization or indicators of investor interest with the largest companies or companies having more than 5 individual broker forecasts updated first.
To ensure robust screening and sampling during peak reporting periods, preliminary data is updated from news sources. All companies also have Fast Update fields (approximately 100 key statement items) updated prior to the input of full Annual reports. Interim data is supported by both news and stock exchange sources and fuller interim documents where available
These issues are discussed further in the section Frequently Asked Questions.
The provision of support to clients in the use of our information is a major part of a Worldscope subscription, and is available in many forms.

Issue 6
© Thomson Financial 2003-2007 12 Confidential Information of Thomson Financial
Client Support Services
Data Support Helplines Worldscope is a large and complex database, with a dynamic company population that is evolving daily. Thus, we maintain a dedicated and knowledgeable client support group to work directly with our clients to help them understand and utilize Worldscope data in their fiduciary roles. Worldscope client support services are considered an integral part of your annual Worldscope subscription fee and clients are encouraged to contact us directly by e-mail or phone whenever any questions arise with regard to Worldscope data or its use.
Client Services
Email: [email protected]
Phone: +1 800.228.3220 (from USA only)
Phone: +353 61 771240
Fax: +353 61 771201
Sales/Vendor Support For questions regarding data delivery and technical support, please contact
Theresa Doran, Database Administrator & Vendor Services
Phone: +1 203 551 7348
Email: [email protected]
Worldscope Product Information Please visit our website at http://www.thomson.com/financial or contact your local Thomson Financial office.
Documentation In addition to the Worldscope Data Definitions Guide several pieces of technical support materials are available to assist you in using and understanding Worldscope. A monthly status report is also available.
In addition, many of our third party software vendors also provide documentation on their implementation of the Worldscope Database. Please call your vendor to obtain copies of these.
Client Visits Worldscope representatives will be happy to meet with clients by arrangement, to discuss any issues related to their use of the data.

Issue 6
© Thomson Financial 2003-2007 13 Confidential Information of Thomson Financial
Frequently Asked Questions
Some Notes on this Section The following section is organized alphabetically by topic. To see the full list of topics and questions, a Quick Reference List follows.
In the following section, reference may be made to data, collected and distributed by Worldscope, but not available on the particular software platform you are using to access the database, or available in a format different to that described below. For example, many CD-Rom applications of Worldscope no longer contain sufficient storage space to house the entire company universe contained in Worldscope Global. Any queries should be referred to your data software vendor, or to the Worldscope client support desk(s) whose details have been supplied in the introductory section entitled, ‘Client Support Services’.
Worldscope data items are identified below by a five-digit field number and a field name as contained in this book. These may not, in all cases, match the field names or numbers used by your data vendor.
In answering some of the questions in this section, Worldscope footnotes are mentioned. Footnotes are linked by our analysts to specific data fields, and may describe corporate actions (e.g., acquisitions, capital actions) and changes year to year (e.g., name changes, year end changes, comparability of accounts) or provide explanatory notes to data items (e.g., the exclusion of a long-term portion from a current asset item).
Quick Reference List
Acquisitions Is information on acquisitions available on Worldscope? (Question 1)
ADRs: American Depository Receipts (See also ADR Frequently Asked Questions) How can I tell if a company trades ADRs? (2)
Does Worldscope Coverage include ADRs? (39)
Brazil: Share Data How does Worldscope present share data for Brazilian companies? (4)
Consolidation
How do I know if the company accounts are consolidated or unconsolidated in a particular year? (5)
Is parent company data available on Worldscope? (6)
Corporate Actions Does Worldscope adjust data for corporate actions such as stock splits, stock dividends, etc.? (7)

Frequently Asked Questions
Issue 6
© Thomson Financial 2003-2007 14 Confidential Information of Thomson Financial
Coverage What companies are included on Worldscope and what are the selection criteria? (8)
Does Worldscope have full Western European Coverage? (8(a))
Does Worldscope have full US coverage? (8(b))
What is a Limited Data Set Company? (38)
What data is available for IPOs, e.g. newly listed companies? (37)
Currency What currency is used to update Worldscope data? (9)
If a country has a currency revaluation, what does Worldscope do? (10)
Earnings per Share Can I determine how earnings per share is calculated? (11)
Extraordinary Items Can I see the impact of extraordinary items on earnings per share? (12)
EURO How has Worldscope handled the EURO? (41)
Fast Update What is a Fast Update and what benefit does it have for Timeliness? (35)
How can I identify Full and Fast Updates On Worldscope? (36)
Fiscal versus Calendar Is per share data presented on a fiscal or calendar basis? (40)
Fiscal Year End How does Worldscope treat different fiscal year ends? (13)
How are fiscal year end changes treated on Worldscope? (14)
Formats In what formats is Worldscope available? (15)
History How much history is available for companies on Worldscope? (16)
Inactive Companies/Securities Does Worldscope provide information on inactive or dead companies and securities? (17)
How can I determine if a company is inactive? (18)
How can I determine if a security is inactive? (19)
Industry Changes How can I determine whether a company has changed industry? (20)

Frequently Asked Questions
Issue 6
© Thomson Financial 2003-2007 15 Confidential Information of Thomson Financial
Industry Classification What industry classifications are available within the Worldscope database? (21)
Interim/Time Series data Is interim financial statement data available on Worldscope? (34)
Limited Data Set What is a Limited Data Set Company? (38)
Multiple Share Classes How can I determine if a company currently has more than one type of share? (25)
What does Worldscope do if a company has more than one type of share? (22)
What is the difference in the data shown at the company level and data shown at the security level? (23)
If a company has more than one type of share, how does Worldscope select the share for the main company record? (24)
Name Changes How does Worldscope handle company name changes? (26)
Non-traded Companies and Securities How can I determine which companies or securities are not traded? (27)
Preliminary Data (see also Fast Update) How do I know if information on Worldscope is preliminary? (28)
Pro forma Data Does Worldscope carry pro forma data? (29)
Restated Data Does Worldscope carry restated data? (30)
Selection Criteria What companies are included on Worldscope and what are the selection criteria? (8)
Sources What are the sources of Worldscope data? (31)
Timeliness How soon after the fiscal year end/fiscal period end of a company can I expect to see the annual data on Worldscope? (32)
What is a Fast Update and what benefit does it have for Timeliness? (35)
What data is available for IPOs, e.g. newly listed companies? (37)
Time series (See Interim Time Series) Vendors
In what formats is Worldscope available? (15)

Frequently Asked Questions
Issue 6
© Thomson Financial 2003-2007 16 Confidential Information of Thomson Financial
Worldscope Identifiers Is a unique identifier available for each record on the Worldscope database? (33)

Frequently Asked Questions
Issue 6
© Thomson Financial 2003-2007 17 Confidential Information of Thomson Financial
1. IS INFORMATION ON ACQUISITIONS AVAILABLE ON WORLDSCOPE?
Yes. Footnote K to Field 01001, Net Sales or Revenues details the companies in which a holding of more than 50% was directly acquired during the financial year. This footnote is always in the format "Acq'd n% of [company] in [year]".
2. HOW CAN I TELL IF A COMPANY TRADES ADRs?
An "X" in Field 11496, Indicator – Trades ADR indicates that the company trades ADRs (American Depository Receipts).
3. DOES WORLDSCOPE SUPPLY SECTOR-LEVEL OR COUNTRY AVERAGES? No, sector-level and/or country data is not currently supported. .
4. HOW DOES WORLDSCOPE PRESENT SHARE DATA FOR COUNTRIES WHERE STOCKS TRADE PER THOUSAND SHARES?
For all Brazilian and Turkish companies on Worldscope all per share data (EPS, market prices, etc.) are shown per 1,000 shares. The actual number of shares, however, is not adjusted to reflect per 1,000 shares.
5. HOW DO I KNOW IF THE COMPANY ACCOUNTS ARE CONSOLIDATED OR UNCONSOLIDATED IN A PARTICULAR YEAR?
Worldscope utilizes consolidated account data when it is disclosed. In other cases, where there are no subsidiaries or no requirement to consolidate, only parent company accounts are available. Information on whether the company accounts are consolidated or unconsolidated in a particular year is given in the Accounting Practice Field 07531 Accounting Method for Long Term Investment > 50%. This field contains standard texts, such as: "All subsidiaries are consolidated", "No consolidation, cost basis" and "Consolidation for significant subsidiaries, others are on equity basis".
If a company changes its consolidation practice in a particular year, a standard footnote is attached to Field 01001 Net Sales or Revenues to describe the change in reporting that has occurred (e.g. Footnote BB reads "Change from unconsolidated to consolidated reports").
6. IS UNCONSOLIDATED/PARENT COMPANY DATA AVAILABLE ON WORLDSCOPE?
The following key parent company fields are available on Worldscope where annual data is available on a consolidated basis but interim data is only reported on an unconsolidated/parent basis, or preliminary data is only available on an unconsolidated basis. Additional Parent company data fields are available for Japan, Korea, and Taiwan.
Field 18169 Unconsolidated/Parent Company Depreciation
Field 18170 Unconsolidated/Parent Company Sales
Field 18171 Unconsolidated/Parent Company Pre-tax Earnings
Field 18172 Unconsolidated/Parent Company Net Profit
Field 18173 Unconsolidated/Parent Company Earnings per Share

Frequently Asked Questions
Issue 6
© Thomson Financial 2003-2007 18 Confidential Information of Thomson Financial
7. DOES WORLDSCOPE ADJUST DATA FOR CORPORATE ACTIONS SUCH AS STOCK SPLITS, STOCK DIVIDENDS, ETC.?
Yes. Worldscope adjusts all stock data for capital actions. Thus, share-related fields such as Common Shares Outstanding, Earnings Per Share, Book Value Per Share, Dividends Per Share, market prices and so on, all appear after adjustment for stock splits, stock dividends and rights issues. The adjustment factor is cumulative and is used to adjust the previous years to make them comparable with the most current year of reporting.
For example, a stock split of 2:1 in 2006 and a stock dividend of 50% in 2003 would result in an adjustment factor of 0.5 being applied to all stock data in 2005 back through 2003, and a cumulative adjustment factor of 0.33333 (that is, 0.66666*0.5) being applied to all stock data prior to 2003. The number of shares is divided by the factor, while per share data is multiplied by it.
Field 05576, Stock Split/Dividend Ratio contains the adjustment factors on the annual original time series. (calendar for the US and fiscal for non US). Field 05575 Stock Split/Dividend Ratio – Fiscal contains the adjustment factors for fiscal per share data. It is available on all time series supported by Worldscope. Footnote A to Field 05101, Dividends per Share contains a short description of the capital action(s).
These adjustments are also made at a security level.
8. WHAT COMPANIES ARE INCLUDED ON WORLDSCOPE AND WHAT ARE THE SELECTION CRITERIA?
The Worldscope database targets coverage of publicly quoted companies. A few large private companies are also included for some industries. The Worldscope database also contains history for extinct or inactive companies that were listed but have since then merged, liquidated or become privately held. Over 70 countries are represented, and include all countries in targeted global indices (FTSE All World, Dow Jones Global, MSCI World, MSCI EMF, S&P Global, S&P Citigroup
Coverage criteria is as follows:
1.1. Full Market coverage of all listed companies trading equity securities for developed markets and a selection of emerging markets (excludes mutual and closed end investment funds).
At December 2006:
• Developed markets
Australia, Austria, Belgium, Canada (excludes Canadian Venture listings), Denmark, Finland, France, Germany, Greece, Hong Kong, Ireland, Italy, Japan, Luxembourg, Netherlands, Norway, Portugal, Singapore, Spain, Sweden, Switzerland, United Kingdom, United States
• Advanced emerging
Brazil, Mexico, Korea (excls KOSDAQ), South Africa
• Emerging
Indonesia, Malaysia, Philippines, Thailand, China , Taiwan

Frequently Asked Questions
Issue 6
© Thomson Financial 2003-2007 19 Confidential Information of Thomson Financial
1.2. Coverage of listed companies for the other countries (developed, emerging and advanced emerging)
The targeted coverage comprises all markets included in global indices. The following countries are currently targeted: Argentina, Bermuda, Canadian Venture Market, Cayman Islands, Chile, Colombia, Czech Republic, Egypt, Hungary, Iceland, India, Israel, Jordan, Korean KOSDAQ market, Morocco, New Zealand, Pakistan, Peru, Poland, Russia, Saudi Arabia, Slovakia, Slovenia, Sri Lanka, Turkey, Venezuela Virgin Islands, and Zimbabwe.
Companies need to meet one or more of the following criteria to be included in our coverage:
• Broker estimates equal to or greater than 5
• Market capitalization equal to or greater than 100 million U.S. dollars
• Company belongs to the FTSE ALL World, Dow Jones Global, MSCI World, MSCI EMF, S&P Global, S&P/Citigroup
• Company has an ADR that is listed on the NYSE, ASE or NASDAQ or a sponsored ADR that trades over the counter (we need the non-US identifier and ADR identifier).
• Companies included in EASDAQ or EURO.NM
• Non US company which has a listing on the NYSE, ASE or NASDAQ
1.3. Non traded companies
A small number of non-traded companies are included in current coverage. These generally related to major industries (Banks, Utilities) not privatized.
1.4. ADRs
All ADRs listed on the NYSE, ASE or NASDAQ and sponsored ADRs which trade over the counter.
1.5 Content coverage.
A fully detailed analysis is required for all companies within the following countries: United Kingdom, and the U.S.
For all other countries fully detailed analysis is required if any of the following criteria is fulfilled:
• Company is a constituent of the, FTSE ALL World, Dow Jones Global, MSCI World, MSCI EMF, S&P Global, S&P/Citigroup or a selected local index
• Company has 5 or more broker estimates
• Company has a market capitalization of greater than 100 million dollar (exception Japan, China & Taiwan)
• Company is included in the legacy Extel population
Companies not meeting the above criteria will be under a ‘limited’ key data template.

Frequently Asked Questions
Issue 6
© Thomson Financial 2003-2007 20 Confidential Information of Thomson Financial
8(a). Does Worldscope have full Western European coverage?
Yes. Worldscope has targeted full Western European Coverage since 1999. For this purpose, Western Europe is defined as the 15 countries in the European Union prior to the expansion in membership on 1 May 2004, together with Norway and Switzerland. There is also coverage of many other European countries and companies.
8(b). Does Worldscope have full US coverage?
Yes, Worldscope targets complete coverage of US companies filing with the Securities Exchange Commission (SEC), with the exception of closed end investment companies.
9. WHAT CURRENCY IS USED TO UPDATE WORLDSCOPE DATA?
Worldscope data is without exception expressed in the local currency of the country of domicile, as shown in Field 06026, Nation or Field 06027, Nation Code. Where the financial statements are reported in another currency, Worldscope converts them to local currency using the exchange rate(s) given in the statements, or where this is not available, using the relevant Worldscope exchange rate(s). WS field 18215 – Exchange rate used for the income statement/cash flow and WS field 18214 – Exchange rate used to translate the balance sheet are available. Security prices are also converted to local currency if expressed in another currency.
To facilitate cross-country screening Worldscope supplies the following additional key financial variables in U.S. dollars:
Field 07210 Market Capitalization (U.S.$)
Field 07211 Market Capitalization (U.S.$) - Current
Field 07220 Common Equity (U.S.$)
Field 07221 Common Equity (U.S.$) - Current
Field 07230 Total Assets (U.S.$)
Field 07240 Net Sales or Revenues (U.S.$)
Field 07250 Net Income (U.S.$)
Worldscope provides month-end exchange rates for all countries represented on the database. These are provided on a derived country identifier and can be used to translate data into other currencies.
10. IF A COUNTRY HAS A CURRENCY REVALUATION/REDENOMINATION, WHAT DOES WORLDSCOPE DO?
Worldscope adjusts all historical fundamental and per share data for the revaluation/redenomination. In addition, Worldscope exchange rates are adjusted to reflect the revaluation/redenomination.
11. CAN I DETERMINE HOW EARNINGS PER SHARE IS CALCULATED?
Worldscope shows the value of earnings per share as reported by the company, in Field 18193 Earnings Per Share - As Reported, generally available from 1992

Frequently Asked Questions
Issue 6
© Thomson Financial 2003-2007 21 Confidential Information of Thomson Financial
onwards. With one exception, this value will also appear in Field 05201 Earnings Per Share and 05202 Earnings per share-Fiscal, provided it is not out of line with Worldscope accounting policies as described in the data definition for this field. The exception would be U.S. companies or securities with off-ending fiscal years where Field 05201 Earnings Per Share contains the earnings for the calendar rather than the fiscal year. The fiscal year earnings is contained in Field 05202 Earnings Per Share - Fiscal Year End.
As different companies and countries have varying definitions of earnings per share, footnotes are added to Field 05201 to provide explanatory detail. For example, Footnote U reads "Based on average shares outstanding", and Footnote Z reads "Earnings per share estimated using net income after preferred dividends divided by the year end shares outstanding or latest shares available" (this note is added where Worldscope analysts calculate earnings per share based on that country's generic definition or when no earnings per share is reported by the company). In addition to the generic EPS field (05201), basic and fully diluted EPS are also available.
12. CAN I SEE THE IMPACT OF EXTRAORDINARY ITEMS ON EARNINGS PER SHARE?
Worldscope excludes extraordinary items reported after tax from earnings per share but includes exceptional items reported pre-tax. The per share amounts of the extraordinary credits and/or charges included in or excluded from earnings per share are also available.
13. HOW DOES WORLDSCOPE TREAT DIFFERENT FISCAL YEAR ENDS?
While a majority of companies have a fiscal year which coincides with the calendar year, many end their fiscal year on a date other than 31 December. Normally, the year to which Worldscope assigns financial data is the year in which the company's fiscal year ended, so fiscal years ending 28 February 2005, 20 November 2005 and 31 December 2005 are all treated as 2005 on Worldscope.
However, special rules apply when this occurs within a short period after the calendar year end. For non-U.S. companies, the fiscal year is determined by a cutoff date of 15 January. Data for a fiscal year ending on or before 15 January is classified as the previous year's result. For example, company data for a fiscal year ending 15 January 2005 is classified as 2004 data. Company data for a fiscal year ending 16 January 2005 is classified as 2005 data.
For U.S. companies, the fiscal year cutoff date is 10 February. Data for a fiscal year ending on or before 10 February is classified as the previous year's result.
In addition, users should note that the per share data for all U.S. companies is adjusted where necessary, to reflect a calendar year reporting basis.
14. HOW ARE FISCAL YEAR END CHANGES TREATED ON WORLDSCOPE?
Where a company changes year-end date and publishes financial statements for more or less than the standard twelve months, Worldscope adjusts any income statement data to reflect twelve months of operations, in order to make the information more comparable to prior and subsequent years. This adjustment is indicated in a footnote (generally N) to Field 01001 Net Sales or Revenues, which reads: "year end changed from [month of old fiscal year end] in [year]. Income statement and related items adjusted to reflect 12 mos. of operations through [new fiscal year end]". Prior to 1988, such adjustments were not made and the changes in the length of the fiscal year for non-U.S. companies are noted with a footnote to Field 01001 Net Sales or Revenues.

Frequently Asked Questions
Issue 6
© Thomson Financial 2003-2007 22 Confidential Information of Thomson Financial
Field 05350 Date of Fiscal Period End is available for each year, and contains the month, day and year on which the company's fiscal period ended. Field 05351 Length of Fiscal Period is also available. Field 05352 Month of Fiscal Period End contains the month of the most recent completed annual period.
It should be noted that in some cases of fiscal year end change, the transitional fiscal period provided by companies may be greater than twelve months, and therefore it may seem as if there is a 'missing year' on Worldscope. An example is a change from December to March where the annual data released is for December 2003 followed by March 2005. Interim data provided will be maintained on the old year end basis until the new year end is complete. At that time the interim period data for both annual and interim series for the change year is overwritten to correspond with the new year end.
15. IN WHAT FORMATS IS WORLDSCOPE AVAILABLE?
The database is available directly from Worldscope or via internal or 3rd party software platforms. Further information on delivery platforms is available on http://www.thomson.com/financial or by calling our client support desk directly.
16. HOW MUCH HISTORY IS AVAILABLE FOR COMPANIES ON WORLDSCOPE?
The earliest information contained on Worldscope is for 1980. Many North American companies and larger companies in the other developed markets have history back to this date. History for most other companies in developed market commences in the mid 1980s for medium sized and mid 1990s for small sized companies.
Worldscope expanded coverage to include emerging markets in the early 1990s. Companies and countries have been gradually added since then. Asia-Pacific coverage increased significantly in 2004 and 2005
For new additions and IPOs, up to 4 years of historical data may be added.
Companies targeted for a full detailed update normally have a minimum of four years of financial information, with the obvious exceptions of newly created companies or recent privatisations. Smaller market capitalization coverage for which a summary data set may be targeted is added with one to two years of data. See FAQ 8 related to coverage criteria.
17. DOES WORLDSCOPE PROVIDE INFORMATION ON INACTIVE OR DEAD COMPANIES AND SECURITIES?
Worldscope’s prime aim is to target companies with listed equities. Worldscope contains extinct or inactive companies, i.e. those which have merged, liquidated or become privately held. History for these companies remains on the database.
Company data for inactive or dead companies may not be necessarily available on all delivery platforms.
18. HOW CAN I DETERMINE IF A COMPANY IS INACTIVE?
If data (in the form of a date) is present in Field 07015 Inactive Date (Company) then the company is inactive as of that date. The reason why the company became inactive can be found in Footnote N attached to Field 00000 Company Status. This note contains the standard text "Company inactive:", followed by an explanation, e.g.

Frequently Asked Questions
Issue 6
© Thomson Financial 2003-2007 23 Confidential Information of Thomson Financial
"Acquired by XYZ Corporation in May 97" or "Delisted - information will no longer be provided as of Jan 96".
19. HOW CAN I DETERMINE IF A SECURITY IS INACTIVE?
If either Field 07015 Inactive Date (Company) or Field 07012 Inactive Date (Security) contains data (in the form of a date) on the security identifier, then the security is inactive. On the main company record, security inactive dates are provided in Fields 20011, 20111, 20211, 20311, 20411, 20511, 20611 Inactive Date - Multi Share 1-7, respectively.
20. HOW CAN I DETERMINE WHETHER A COMPANY HAS CHANGED INDUSTRY?
A Footnote (generally A) to Field 00000 Company Status will record whether the company has changed industry, necessitating a change in the way Worldscope analysts have collected the financial accounts. For example, a company with footnote text of "Changed from financial format in 97" may have traditionally been a rental and leasing company whose construction or other industrial activities became predominant, causing a change in reporting format in 1997. Obviously, the historical detail that is available for companies which have changed in this way will vary in prior years.
21. WHAT INDUSTRY CLASSIFICATIONS ARE AVAILABLE WITHIN THE WORLDSCOPE DATABASE?
Worldscope carries SIC (Standard Industrial Classification) codes for each company. These codes were developed by the U.S. government. Worldscope assigns SIC codes based on contribution of business segments to net sales or revenues, in descending order of importance.
Each company is also assigned a General Industry Classification (Field 06010), which reports whether a company is an industrial, utility, transportation, banking, insurance or other financial company.
Additionally, all companies are assigned an Industry Group (Field 06011), which is a four-digit code. There are twenty-seven major industry groups (reflected in the first two digits of the code), each of which is further broken down into sub-industry groups. Again, the major activity of the company determined by net sales or revenues, is the deciding factor in assigning the industry group. In instances where there is no dominating activity and/or the company is a holding company, the industry classification of Diversified is used. All companies that do not fall within one of the major industry classifications are reported under the group Miscellaneous.
Finally, Thomson Financial has adopted the FTSE/Dow Jones Industrial Classification Benchmark (ICB) as its standard classification tool across a number of its global databases and these ICB codes are available within Worldscope (Field 07040). Please note that a separate licence is required for the use of ICB data.
22. WHAT DOES WORLDSCOPE DO IF A COMPANY HAS MORE THAN ONE TYPE OF SHARE?
If a company has only one type of common or ordinary share, all Worldscope information for that company is contained in a single company record.
If there are multiple types of common or ordinary share, Worldscope contains both a main company record as well as up to seven separate security-level records. 'Common or ordinary' includes hybrid security types whose structure and associated rights contain elements of 'preferred' equity. In such cases, participation in profits and liquidation proceeds, as well as maturities and conversion rights, are examined

Frequently Asked Questions
Issue 6
© Thomson Financial 2003-2007 24 Confidential Information of Thomson Financial
closely prior to their inclusion. The main company record and the security level records are linked by means of their Worldscope Identifier (Field 06035). Each security-level record contains a reference to the Worldscope identifier of the main company record in Field 06036 Primary Issue Identifier.
23. WHAT IS THE DIFFERENCE IN THE DATA SHOWN AT THE COMPANY LEVEL AND DATA SHOWN AT THE SECURITY LEVEL?
A main company record contains all general and fundamental data along with the combined number of shares (adjusted to like par value). Per share earnings, book value and cash flow are based on the combined number of shares Dividends per share and stock prices are provided for the primary share type. The selection of that share type is described under the next question. Further details can be seen in a footnote to Field 00000 Company Status. Typical text could read "Earnings, book value and dividend payout are based on ordinary and preference shares combined. Prices and dividends are for ordinary shares only" or "Prior to Jan 1997, earnings and book value are based on ordinary and preference shares combined. Preference shares were converted to ordinary shares in Jan 1997. Prices and dividends are for ordinary shares only".
The main company record also contains summary data for up to seven share types (Fields 20001-20648 as shown in the Industry Specific Templates under the heading Multiple Share Data). This includes their Worldscope Identifier Type of Share and other summary valuation data. These items are available for 1987 and subsequent years.
The separate security-level records contain more detailed market, share and stock performance data for each individual share type. Please note that data in the Security-level record is available for 1987 and subsequent years unless otherwise stated in the definition of the item.
24. IF A COMPANY HAS MORE THAN ONE TYPE OF SHARE, HOW DOES WORLDSCOPE SELECT THE SHARE FOR THE MAIN COMPANY RECORD?
Worldscope selects the share to represent the company on the main company record based on the following criteria:
1. It is available for foreign investment*
2. It is more widely traded
The share type chosen to represent the company can be found in Field 06005 Type of Share on the main company record.
*Some markets impose restrictions on foreign ownership of shares, and they may be required to list and trade separately from the shares owned by local investors - especially when the ownership ceiling has been reached - although in other respects they do not constitute a separate security class. Worldscope may choose the local share in such cases, as this is the underlying security. Thailand and Indonesia are examples.
25. HOW CAN I DETERMINE IF A COMPANY CURRENTLY HAS MORE THAN ONE TYPE OF SHARE?
An "X" in Field 11501 Indicator - Currently Multi-Share Company indicates that the company has more than one type of active common or ordinary share, regardless of whether they are trading or not.
Frequently Asked Questions
Issue 6
© Thomson Financial 2003-2007 25 Confidential Information of Thomson Financial
26. HOW DOES WORLDSCOPE HANDLE COMPANY NAME CHANGES?
Information regarding company name changes can be found in Footnote N to Field 01001 Net Sales or Revenues for the year in which the change of name occurred, or the latest year updated where the change is recent. This footnote is always in the format "Name changed from [old name] in [year]".
Worldscope company and security identifiers for U.S. companies are changed whenever a name change or other corporate action leads to a change in the CUSIP code issued by the Committee on Uniform Security Identification Procedures. When this happens Worldscope, with the exception of a few identifying fields, will delete the data on the old record and re-update it to a new record. Presence of data in Field 00000 Company Status indicates that the company or security had a CUSIP change. The data in this field contains the text "CUSIP changed to [new CUSIP]". Footnote C attached to Field 00000 Company Status will identify the new name of the company.
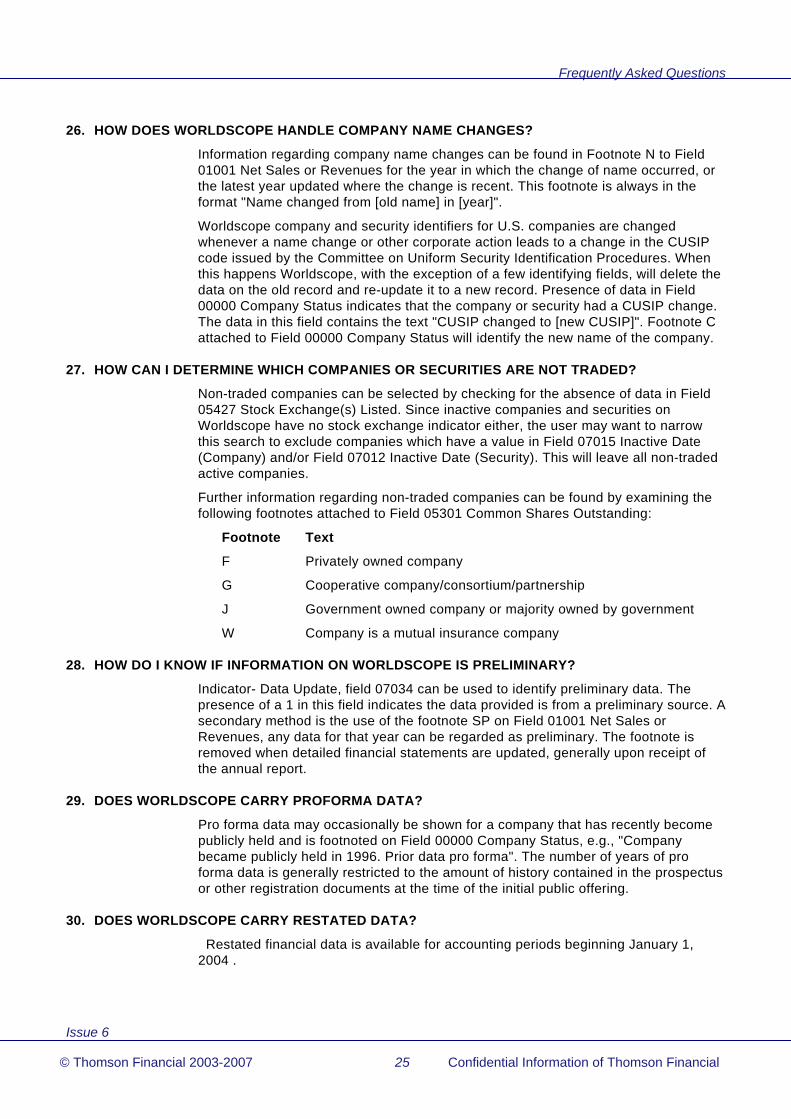
27. HOW CAN I DETERMINE WHICH COMPANIES OR SECURITIES ARE NOT TRADED?
Non-traded companies can be selected by checking for the absence of data in Field 05427 Stock Exchange(s) Listed. Since inactive companies and securities on Worldscope have no stock exchange indicator either, the user may want to narrow this search to exclude companies which have a value in Field 07015 Inactive Date (Company) and/or Field 07012 Inactive Date (Security). This will leave all non-traded active companies.
Further information regarding non-traded companies can be found by examining the following footnotes attached to Field 05301 Common Shares Outstanding:
Footnote Text
F Privately owned company
G Cooperative company/consortium/partnership
J Government owned company or majority owned by government
W Company is a mutual insurance company
28. HOW DO I KNOW IF INFORMATION ON WORLDSCOPE IS PRELIMINARY?
Indicator- Data Update, field 07034 can be used to identify preliminary data. The presence of a 1 in this field indicates the data provided is from a preliminary source. A secondary method is the use of the footnote SP on Field 01001 Net Sales or Revenues, any data for that year can be regarded as preliminary. The footnote is removed when detailed financial statements are updated, generally upon receipt of the annual report.
29. DOES WORLDSCOPE CARRY PROFORMA DATA?
Pro forma data may occasionally be shown for a company that has recently become publicly held and is footnoted on Field 00000 Company Status, e.g., "Company became publicly held in 1996. Prior data pro forma". The number of years of pro forma data is generally restricted to the amount of history contained in the prospectus or other registration documents at the time of the initial public offering.
30. DOES WORLDSCOPE CARRY RESTATED DATA?
Restated financial data is available for accounting periods beginning January 1, 2004 .

Frequently Asked Questions
Issue 6
© Thomson Financial 2003-2007 26 Confidential Information of Thomson Financial
This data is provided in separate time series utilizing existing Worldscope fields. Original data is not overwritten.
Four indicator fields facilitate the use of restated content.
11556 - Indicator- Restated data exists
11557 - Indicator – Restatement type
11558 - Indicator – Early Release
11559 - Restatement Reason Code
Per share data in the restated annual series will be provided on a fiscal basis only. Per share fields for U.S. companies currently provided on a calendar basis in the annual series content will not be supported in the restated content series. All original and restated interim series per share data is on a fiscal basis.
Restated data is provided for one prior year accounting period (including interim periods).
Price and dividend data as well as related ratios are not included in the restated series content.
Financial ratios that cross time periods are not included in the restated series
31. WHAT ARE THE SOURCES OF WORLDSCOPE DATA?
Our primary information source is the companies themselves, which send us all publicly available documents and financial statements (annual and interim) as soon as they are published. The full audited annual financial accounts supply much of the detailed information on the database. We also receive detailed filings from many regulatory agencies, such as the Securities and Exchange Commission (USA) and the Japanese Ministry of Finance.
Preliminary data is often available before the publication of the annual or interim accounts by the company. This information is made available on many Worldscope platforms. Sources of preliminary data include press releases issued by the company itself, statutory filings with stock exchanges or other regulatory bodies, and naturally the financial press and newswire services. Worldscope subscribes to a stock exchange publication and, where newswires are not sufficient, a major financial newspaper for each country on the database.
32. HOW SOON AFTER THE FISCAL YEAR END OR INTERIM PERIOD END OF A COMPANY CAN I EXPECT TO SEE THE ANNUAL DATA ON WORLDSCOPE?
There are three considerations related to timeliness:
1. Reporting/filing requirements. There are wide variations internationally in the length of time legally allowed between the fiscal period end of a company and the publication of its financial statements. While preliminary data and estimates of the company's performance for the fiscal year are generally available and are included on Worldscope soon after the year end, companies may take some time before making their audited annual accounts available to the public. This also applies to interim information, which is generally less regulated. Reporting regulations vary from country to country. In some instances companies may have up to 9 months after the end of the financial year to file an annual report with the statutory authorities. Most countries

Frequently Asked Questions
Issue 6
© Thomson Financial 2003-2007 27 Confidential Information of Thomson Financial
specify a 4 to 6 month reporting deadline and companies can delay their filing until this deadline is in sight.
2. Document acquisition. Worldscope aggressively pursues various sources of information. Companies themselves remain the primary source in most countries. In this, we are significantly aided by the Documents Acquisition team, whose corporate document acquisition activities are among the most extensive in the world.
3. Document update. When annual information is received, it is assigned an update priority generally based on inclusion in a targeted index, investor interest, and market capitalization. This becomes especially important where annual reports are received en masse due to clustering of fiscal year ends, e.g. Japan's predominant 31 March year-end. At such times, prompt turnaround may not be possible for all companies. Data processed from news sources is generally turned around within 72 hours. Key items from the final accounts are available within 5-10 days of receipt of document.
33. IS A UNIQUE IDENTIFIER AVAILABLE FOR EACH COMPANY ON THE WORLDSCOPE DATABASE?
Yes. Field 06105, Worldscope Permanent ID, provides a unique identifier for all company and security entities.
For all companies with the exception of U.S., field 06105 corresponds to Field 06035, Worldscope Identifier.
For U.S. companies and securities only, the Worldscope Identifier is based on the CUSIP code issued by the Committee on Uniform Security Identification Procedures. Therefore, when a CUSIP change occurs, the Worldscope Identifier must also change. In such cases Worldscope, with the exception of a few identifying fields, will delete the data on the old record and re-update it to a new record. Presence of data in Field 00000 Company Status indicates that the company or security had a CUSIP change. The data in this field contains the text "CUSIP changed to [new CUSIP]". Footnote C attached to Field 00000 Company Status will identify the new name of the company.
34. IS INTERIM FINANCIAL STATEMENT DATA AVAILABLE ON WORLDSCOPE?
Worldscope contains Interim time series financial statement data. The time series available may be quarterly, cumulative quarterly, semi-annual or trimester as determined by the individual company’s reporting pattern and is in addition to providing the key interim income statement fields on the annual times series. Interim time series data includes summary Balance Sheet, Income Statement and Cash Flow Information where this information is reported by the company concerned. (The Interim data items available on the annual time series are listed in the 4 main industry templates under the heading Annual Series Interim Data and date back to 1980. The full Interim data subset, including Financial Statement data, is available in time series. Items supported are listed under the Interim Time Series Template heading. . This data is generally available from Quarter 1 1998 for US coverage and from 2001 for non-US coverage.
It should be noted that both the reporting and detail of Interim data can vary greatly by country and company.

Frequently Asked Questions
Issue 6
© Thomson Financial 2003-2007 28 Confidential Information of Thomson Financial
35. WHAT IS A FAST UPDATE AND WHAT BENEFITS DO THESE UPDATES HAVE FOR TIMELINESS?
The Fast Update consists of a subset of 350 Financial Statement items and ratios, which are generally updated within 5-10 days of receipt of the annual filing or annual report This follows the update of preliminary data from news sources which is targeted for 72 hours from report. The Fast Update was introduced by Worldscope to improve the timely provision of key data, especially at peak times when it is not possible to fully update all annual reports on the day of receipt.
Generally, companies will:
1. first issue a Press Release with very summarized financials possibly followed by
2. a preliminary report (for example: the Regulatory News Service in the U.K., BALO in France and Tanshin filings for Tokyo listed companies)
3. And finally the full audited Annual Report.
Worldscope captures and constantly refreshes Fast Update items as more detailed information becomes available. The pattern of Worldscope updates is as follows:
1. Press Release information is captured on Worldscope, targeted within 48 hours of publication.
2. Fast Update, sourced from the 10K or annual report, 10 days.
3. Worldscope full updates are completed from the audited Annual Report. Priority is given to companies which are index constituents, companies with indicators of market interest and/or with high market capitalization.
36. HOW CAN I IDENTIFY FULL AND FAST UPDATES ON WORLDSCOPE?
Worldscope field 07034 - Indicator – Data Update can be used to determine if the update for a given period is Preliminary, FAST or Final. This indicator is available on a historic basis.
Worldscope also contains three current fields to help you distinguish these updates.
Field 07013 Year of Fast Update contains the latest year for which Fast Update information is available e.g. “2006”.
Field 07016 Latest Annual Updated contains the latest year for which the latest Worldscope full update is available, e.g. “2006”.
Field 07035 Latest Interim Date
37. WHAT DATA IS AVAILABLE FOR IPOs- E.G. NEWLY LISTED COMPANIES?
A newly listed company or IPO may provide insufficient data in the prospectus to populate a detailed update. In this instance, Worldscope will add the company to the database with the level of financial data provided (may only be a few items) until more detailed information is published by the company concerned.
38. WHAT IS A LIMITED DATA SET COMPANY?
Companies that do not meet the criteria for fully detailed update on Worldscope, on the basis of Market Capitalization or other criteria (see Question 8 above) may be added with a Limited Data Set of information. This subset is similar to the Fast Update subset outlined in Frequently Asked Question 37 above and detailed in the
Frequently Asked Questions
Issue 6
© Thomson Financial 2003-2007 29 Confidential Information of Thomson Financial
templates from page 154 . In February 2007, Worldscope contained 7,673 active and 1,837 inactive Limited Data Set companies across countries.
The current field 11519 Indicator-Limited Data Set Company identifies these companies, which will have Limited Data updates going forward.
A small number of companies, which previously had main market listings and were subsequently transferred to OTC market, may have prior year Full Updates. Annual field 07033 Full/Limited Coverage Indicator will show, for each year, whether the company has a Full or Limited update.
39. DOES WORLDSCOPE COVERAGE INCLUDE ADRs (AMERICAN DEPOSITORY RECEIPTS)?
Yes. ADRs trading on the NYSE, ASE, and NASDAQ under both sponsored and unsponsored programs are targeted under the coverage criteria. In addition, companies participating in sponsored programs and trading OTC are also targeted. See ADRs Template and ADR Frequently Asked Questions which follows the Frequently Asked Questions section for further information.
40. IS PER SHARE DATA PRESENTED ON A FISCAL OR CALENDAR BASIS?
All per share data for non-U.S. domiciled companies and securities and ratios derived from the per share data on the annual and interim time series is presented on a fiscal basis.
All annual time series per share data for U.S. domiciled companies and securities and ratios derived from the per share data is presented on a calendar basis, with the exception of data fields that are specifically designated as fiscal. All US interim time series data is provided on a fiscal basis. Further details related to fiscal years and per share data can be found in the definitions section. U.S. companies/securities can be identified by checking for 840 in field 06027 Nation Code.
All per share data and related ratios for ADR companies are presented on a fiscal basis.
Within the Worldscope database, unless otherwise stated, the following data items contained in the annual time series data are disclosed on a calendar year basis for U.S. companies and on a fiscal year basis for non-U.S. companies:
All price and per share data (e.g.: market prices, market capitalization, earnings per share, dividends per share, book value per share, etc.) listed under the headings “Stock Data Annual Statistics” and “Stock Performance Annual Statistics” in the templates section.
All interim data on the annual time series under the heading “Annual Series Interim Data” in the templates section..
Calendar year end basis means that the data is calculated on a December year-end basis whereas fiscal year end basis means that data is calculated on the company’s fiscal period end date basis.
Taking the EPS data as an example:
A company has a fiscal period end date of 30-06-2001 and reports quarterly information.
Calendar year end basis:
For the year 2001, EPS Q1 (05221) is at 31-03-2001; EPS Q2 (05222) is at 30-06-2001; EPS Q3 (05223) is at 30-09-2001 and EPS Q4 (05224) is 31-12-2001. Annual EPS (05201) is at 31-12-2001.

Frequently Asked Questions
Issue 6
© Thomson Financial 2003-2007 30 Confidential Information of Thomson Financial
Fiscal year end basis:
For the year 2001, EPS Q1 (05221) is at 30-09-2000; EPS Q2 (05222) is at 31-12-2000; EPS Q3 (05223) is at 31-03-2001 and EPS Q4 (05224) is at 30-06-2001. Annual EPS (05201) is at 30-06-2001.
Alternatively, Worldscope supplies the following data on a fiscal year end basis for all countries:
05202 Earnings per Share – Fiscal Period End
05491 Book Value – Outstanding Shares – Fiscal
05502 Cash Flow per Share – Fiscal
05110 Dividends per Share – Fiscal
05575 Stock Split/Dividend Ratio – Fiscal
10010 Earnings per Share basic – Fiscal Period End
10030 Earnings Per Share diluted – Fiscal Period End
18193 As reported EPS
18208 EPS continuing operations
18209 EPS including extraordinary items
18259 Includes extraordinary credit/charge per share
18260 Excludes extraordinary credit/charge per share
18261 Includes pre-tax extraordinary credit/charge per share
18205 Discontinued operations per share
05228 Discontinued operations per share (excl gains/losses)
18202 Cumulative effect of accounting changes
18210 Restructuring expense per share (after tax)
08816 Earnings Per Share Fiscal – 1 Yr Annual Growth
08821 Book Value Per Share Fiscal – 1 Yr Annual Growth
08302 Return on Equity Per share – Fiscal
08653 Reinvestment Rate Per Share - Fiscal
41. HOW HAS WORLDSCOPE HANDLED THE EURO?
The currency in which you receive Worldscope data may be determined by your product platform. In Worldscope, all historical data has been converted to EURO utilizing the 6 digit fixed exchange rate at the date of adoption and the associated Country Information changed. The historical legacy currency is maintained under alternate currency fields available in the direct delivery feed.

Issue 6
© Thomson Financial 2003-2007 31 Confidential Information of Thomson Financial
ADR Frequently Asked Questions 1. WHAT ADRs ARE INCLUDED ON WORLDSCOPE AND WHAT IS THE SELECTION CRITERIA?
The targeted population includes all ADRs listed on the NYSE, ASE or NASDAQ and sponsored ADRs which trade over the counter except for ADRs representing companies from countries not targeted for coverage.
2. HOW ARE ADRs CLASSIFIED ON WORLDSCOPE?
ADRs are treated as “company” entities on Worldscope. A link to the underlying foreign company represented by the ADR is provided if the company is included in the database. Financial statement and other templated data on the ADR Identifier other than U.S. GAAP data, pricing and dividends is derived from the underlying non-U.S. company and security adjusted by a conversion rate into U.S. dollars and the ADR factor, where applicable.
3. HOW CAN ADR COMPANY RECORDS BE IDENTIFIED?
ADRs on Worldscope can be identified by checking for the presence of data in field 11503 Indicator – ADR. In addition, ADRs have an Entity Type (field 06100) of “A”.
4. HOW ARE ADRs LINKED TO THE UNDERLYING NON-US COMPANY?
The Worldscope Identifier of the underlying non-U.S. company and security represented by the ADR is provided in fields 06115 ADR Non-U.S. Company Identifier and field 06116 ADR Non-U.S. Security Identifier, respectively. This link is only provided when the non-U.S. company is included in Worldscope.
5. HOW IS ADR FINANCIAL STATEMENT AND OTHER TEMPLATED DATA DERIVED?
With the exception of U.S. GAAP data, pricing and dividends, standardized data on the ADR identifier is derived by a transfer from the non-U.S. company or security identifier. During the transfer, standardized data is converted into U.S. dollars and shares outstanding and per share data are additionally adjusted by the ADR exchange ratio. The average monthly exchange rate during the company’s fiscal year (field 06101) is used to convert historical income statement items, cash flow items, and earnings per share. The fiscal year end exchange rate (field 06102) is used to convert historical balance sheet items and book value. The current exchange rate (field 06103) at the time of the update of the current item on the underlying non-US identifier) is used to convert all current items. The ADR exchange factor (field 05577), which is derived from the ADR ratio, is applied to shares and per share amounts after translating to U.S. dollars. Interim data in the current fiscal year (where year end earnings have not yet been reported) is translated to U.S. dollars using the current exchange rate and, when the fiscal year end data is updated, the interim data is recalculated using the year-end average exchange rate.
6. IS PER SHARE DATA PRESENTED ON A FISCAL OR CALENDAR BASIS?
Unlike the Worldscope presentation of U.S. companies, all per share data on ADRs is shown on a fiscal year basis rather than a calendar year basis.

ADR Frequently Asked Questions
Issue 6
© Thomson Financial 2003-2007 32 Confidential Information of Thomson Financial
7. DOES WORLDSCOPE CARRY U.S. G.A.A.P. INFORMATION FOR ADRs?
Yes. 135 additional items are available only on ADR company records. The majority of these additional items are Financial Statement, per share items and ratios which reflect data adjusted to conform to U.S. G.A.A.P., for example Field 06795 Common Equity-GAAP or 05490 Book Value per ADR- GAAP. See ADRs Template for further information or details.

Issue 6
© Thomson Financial 2003-2007 33 Confidential Information of Thomson Financial
Banks TemplateNotes: #: Currently U.S. and Canadian companies only.
General Information 06001 Company Name
06003 Company Name - Short
06014 Acronym
00000 Company Status
06094 Post Office Box
06021 Building
06022 Street
06023 Address City
06024 Address State
06025 Post Code/Zip Code
06026 Nation
06027 Nation Code
06028 Region
06031 Phone Number
06032 TELEX Number
06033 FAX Number
06030 Internet Address
06041 Officer 1 - Name
Officer 1 - Title
06051 Officer 2 - Name
Officer 2 - Title
06061 Officer 3 - Name
Officer 3 - Title
06071 Officer 4 - Name
Officer 4 - Title
06081 Officer 5 - Name
Officer 5 - Title
18357 Investor Relations - Name
18358 Investor Relations - Address
18356 Investor Relations – E-mail Address
18359 Investor Relations - Phone/FAX
18121 Registrar – Name
18122 Registrar – Address
18123 Registrar – Telephone Number
18124 Registrar – Fax Number
18125 Registrar – Website
18126 Registrar – Email Address
18272 Company Founded Date
18273 Date of Incorporation
11516 Date Added to Product
07033 Full/Limited Coverage Indicator
07034 Indicator – Data Update
07015 Inactive Date
06091 Business Description
06092 Business Description - Extended
07011 Employees
07001 Products
06100 Entity Type
06098 Currency of Analysis
06099 Currency of Document
05350 Date of Fiscal Period End
05352 Month of Fiscal Year End
05351 Length of Fiscal Period
11556 Indicator – Restated Data Exists
11557 Indicator – Restatement Type
11558 Indicator – Early Release (Restatement)
11559 Indicator – Restatement Reason Code
Industry 06011 Industry Group
06010 General Industry Classification
07040 ICB Code
07021 SIC Code 1

Banks Template
Issue 6
© Thomson Financial 2003-2007 34 Confidential Information of Thomson Financial
07022 SIC Code 2
07023 SIC Code 3
07024 SIC Code 4
07025 SIC Code 5
07026 SIC Code 6
07027 SIC Code 7
07028 SIC Code 8
Product Segment Data 19500 Product Segment 1 - Description
19501 Product Segment 1 - Sales
19502 Product Segment 1 - Operating Income
19503 Product Segment 1 - Assets
19504 Product Segment 1 - Capital Expenditures
19505 Product Segment 1 - Depreciation
19506 Product Segment 1 - SIC Code
19510 Product Segment 2 - Description
19511 Product Segment 2 - Sales
19512 Product Segment 2 - Operating Income
19513 Product Segment 2 - Assets
19514 Product Segment 2 - Capital Expenditures
19515 Product Segment 2 - Depreciation
19516 Product Segment 2 - SIC Code
19520 Product Segment 3 - Description
19521 Product Segment 3 - Sales
19522 Product Segment 3 - Operating Income
19523 Product Segment 3 - Assets
19524 Product Segment 3 - Capital Expenditures
19525 Product Segment 3 - Depreciation
19526 Product Segment 3 - SIC Code
19530 Product Segment 4 - Description
19531 Product Segment 4 - Sales
19532 Product Segment 4 - Operating Income
19533 Product Segment 4 - Assets
19534 Product Segment 4 - Capital Expenditures
19535 Product Segment 4 - Depreciation
19536 Product Segment 4 - SIC Code
19540 Product Segment 5 - Description
19541 Product Segment 5 - Sales
19542 Product Segment 5 - Operating Income
19543 Product Segment 5 - Assets
19544 Product Segment 5 - Capital Expenditures
19545 Product Segment 5 - Depreciation
19546 Product Segment 5 - SIC Code
19550 Product Segment 6 - Description
19551 Product Segment 6 - Sales
19552 Product Segment 6 - Operating Income
19553 Product Segment 6 - Assets
19554 Product Segment 6 - Capital Expenditures
19555 Product Segment 6 - Depreciation
19556 Product Segment 6 - SIC Code
19560 Product Segment 7 - Description
19561 Product Segment 7 - Sales
19562 Product Segment 7 - Operating Income
19563 Product Segment 7 - Assets
19564 Product Segment 7 - Capital Expenditures
19565 Product Segment 7 - Depreciation
19566 Product Segment 7 - SIC Code
19570 Product Segment 8 - Description
19571 Product Segment 8 - Sales
19572 Product Segment 8 - Operating Income
19573 Product Segment 8 - Assets

Banks Template
Issue 6
© Thomson Financial 2003-2007 35 Confidential Information of Thomson Financial
19574 Product Segment 8 - Capital Expenditures
19575 Product Segment 8 - Depreciation
19576 Product Segment 8 - SIC Code
19580 Product Segment 9 - Description
19581 Product Segment 9 - Sales
19582 Product Segment 9 - Operating Income
19583 Product Segment 9 - Assets
19584 Product Segment 9 - Capital Expenditures
19585 Product Segment 9 - Depreciation
19586 Product Segment 9 - SIC Code
19590 Product Segment 10 - Description
19591 Product Segment 10 - Sales
19592 Product Segment 10 - Operating Income
19593 Product Segment 10 - Assets
19594 Product Segment 10 - Capital Expenditures
19595 Product Segment 10 - Depreciation
19596 Product Segment 10 - SIC Code
Major Shareholders 18370 Major Shareholders
Auditors 07800 Parent Auditor 1
07801 Parent Auditor 1 - Affiliate 1
07802 Parent Auditor 1 - Affiliate 2
07803 Parent Auditor 1 - Affiliate 3
07804 Parent Auditor 1 - Affiliate 4
07805 Parent Auditor 2
07806 Parent Auditor 2 - Affiliate 1
07807 Parent Auditor 2 - Affiliate 2
07808 Parent Auditor 2 - Affiliate 3
07809 Parent Auditor 2 - Affiliate 4
07810 Parent Auditor 3
07811 Parent Auditor 3 - Affiliate 1
07812 Parent Auditor 3 - Affiliate 2
07813 Parent Auditor 3 - Affiliate 3
07814 Parent Auditor 3 - Affiliate 4
07815 Parent Auditor 4
07816 Parent Auditor 4 - Affiliate 1
07817 Parent Auditor 4 - Affiliate 2
07818 Parent Auditor 4 - Affiliate 3
07819 Parent Auditor 4 - Affiliate 4
01801 Auditor Fees
Key Items in US Dollars 07211 Market Capitalization - Current
07210 Market Capitalization
07221 Common Equity - Current
07220 Common Equity
07230 Total Assets
07240 Net Sales or Revenues
07250 Net Income
Stock Data
Current Information 06005 Type of Share
05601 Ticker Symbol
06004 CUSIP
06006 SEDOL
06008 ISIN
06035 Worldscope Identifier
06105 Worldscope Permanent I.D.
06034 Disclosure Company Identifier
06038 I/B/E/S Ticker
06040 Dow Jones Company Symbol
11501 Indicator - Currently a Multiple Share Company
11519 Indicator – Limited Data Set Company

Banks Template
Issue 6
© Thomson Financial 2003-2007 36 Confidential Information of Thomson Financial
07016 Latest Annual Updated
07013 Year of Fast Update
07035 Latest Interim Date
05427 Stock Exchange(s) Listed
05661 Stock Index Information
11496 Indicator – ADR
05006 Market Price - Current
05009 Date of Current Price
05007 Market Price - Year to Date - High
05008 Market Price - Year to Date – Low
05091 Market Price – 52 Week High
05092 Market Price – 52 Week Low
08003 Market Capitalization (Public) - Current
08005 Market Capitalization - Current
05302 Common Shares Outstanding - Current
05306 Date of Common Shares
05450 Common/Ordinary Shareholders
05449 Date of Common/Ordinary Shareholders
05474 Closely Held Shares - Current
05473 Date of Closely Held Shares
05255 Earnings per Share - Last 12 Months
05256 Date of Last 12 Months EPS
05145 Dividends per Share - Last 12 Months
05190 Indicated Dividend Rate
05480 Book Value per Share - Current
05510 Cash Flow per Share - Current
Annual Statistics 05001 Market Price - Year End
05002 Market Price - High
05003 Market Price - Low
05004 Market Price - 5 yr avg - High
05005 Market Price - 5 yr avg - Low
08001 Market Capitalization
08004 Market Capitalization - Public
05651 Common Shares Traded - Annual #
08006 Trading Volume ($ Amount) #
08010 Trading Volume - Weekly Average #
08011 Turnover Rate #
05201 Earnings per Share
05210 Earnings per Share – Basic – Year
10010 Earnings per Share – Basic – Fiscal #
05290 Fully Diluted Earnings per Share
10030 Earnings per Share – Fully Diluted – Fiscal #
05202 Earnings per Share - Fiscal Year End
18193 Earnings per Share - As Reported
05200 Earnings Report Frequency
18208 Earnings per Share – Continuing Operations - Fiscal
18209 Earnings per Share Including Extraordinary Items - Fiscal
05230 Earnings per Share after Extraordinary Items
05225 Includes Extraordinary Credit/Charge per Share
05226 Extraordinary Credit/Charge per Share
05227 Includes Pre-tax Extraordinary Credit/Charge per Share
05228 Discontinued Operations per Share
18205 Discontinued Operations – Total – per Share
05240 DVFA Earnings (Germany)
05203 OVFA Earnings per Share (Austria)
05725 Headline Earnings per Share (U.K.)
05260 Earnings per Share - 5 yr avg
05101 Dividends per Share
05140 Dividends per Share - 5 yr avg
05110 Dividends per Share - Fiscal
05102 Dividends per Share - Gross
05100 Dividend Report Frequency
05476 Book Value per Share
05486 Tangible Book Value per Share
05491 Book Value – Outstanding Shares - Fiscal

Banks Template
Issue 6
© Thomson Financial 2003-2007 37 Confidential Information of Thomson Financial
05501 Cash Flow per Share
05502 Cash Flow per Share - Fiscal
05508 Sales per Share
05509 Operating Profit per Share
18210 Restructuring Expense per Share
18211 Restructuring Expense per Share - Pre-tax
18202 Cumulative Effect of Accounting Change per Share
05505 Capital Expenditure per Share
18100 Enterprise Value
05301 Common Shares Outstanding
05326 Number of Shares Authorized
05303 Treasury Shares
05309 Par Value
05191 Common Shares Used to Calculate EPS
05192 Common Shares Used to Calculate Basic EPS
05194 Common Shares Used to Calculate Fully Diluted EPS
05475 Closely Held Shares
08021 Closely Held Shares %
05576 Stock Split/Dividend Ratio
05575 Stock Split/Dividend Ratio – Fiscal
Weekly Time Series 05652 Common Shares Traded – Weekly
05080 Market Price – Week Close
05081 Market Price – Week High
05082 Market Price – Week Low
Balance Sheet
Assets 02004 Cash & Due from Banks
02255 Investments – Total
02205 Treasury Securities
02206 Federal Agency Securities
02207 State and Municipal Securities
02208 Trading Account Securities
02211 Securities Purchased under Resale Agreements
02262 Mortgage Backed Securities
02210 Federal Funds
02209 Other Securities
02250 Other Investments
02276 Loans - Net
02271 Loans – Total
02055 Interbank Loans
02264 Lease Financing
02265 Commercial & Industrial Loans
02266 Consumer & Instalment Loans
02267 Real Estate Mortgage Loans
02268 Foreign Loans
02269 Broker & Financial Institution Loans
02263 Unspecified/Other Loans
02274 Unearned Income
02275 Reserves for Loan Losses
02256 Investment in Associated Companies
02018 Customer Liabilities on Acceptances (Assets)
02240 Real Estate Assets
02501 Property, Plant & Equipment - Net
02652 Other Assets
02280 Interest Receivable
02647 Deferred Charges
02648 Tangible Other Assets
02649 Total Intangible Other Assets - Net
02999 Total Assets
Supplementary Asset Fields 18214 Exchange Rate Used in Translating
Balance Sheet
02005 Cash & Equivalents - Generic
18165 Deferred Tax Asset - Current

Banks Template
Issue 6
© Thomson Financial 2003-2007 38 Confidential Information of Thomson Financial
18087 Treasury Securities Available for Sale
18088 Federal Agency Securities Available for Sale
18089 State/Municipal Securities Available for Sale
18090 Mortgage Backed Securities Available for Sale
18091 Corporate Stock Available for Sale
18092 Other Securities Available for Sale
18093 Total Securities Available for Sale
02287 Total Non-Performing Assets
02285 Non-Performing Loans
02286 Other Non-Performing Assets
01275 Net Loan Losses
01273 Actual Loan Losses
01274 Actual Recoveries
18280 Goodwill/Cost in Excess of Assets Purchased
02502 Goodwill – Gross
02503 Goodwill – Accumulated Amortization
02504 Development Costs – Net
02505 Development Costs - Gross
02506 Development Costs – Accumulated Amortization
02507 Brands, Patents – Net
02509 Brands , Patents – Gross
02508 Brands, Patents – Accumulated Amortization
02510 Licenses. – Net
02511 Licenses – Gross
02512 Licenses – Accumulated Amortization
18299 Computer Software – Net
02516 Computer Software – Gross
02517 Computer Software – Accumulated Amortization
02513 Other Intangibles – Net
02514 Other Intangible Assets - Gross
02515 Other Intangible Assets – Accumulated Amortization
02654 Total Intangible Other Assets - Gross
02655 Total Intangible Other Assets – Accumulated Amortization
02653 Pension Assets – Long Term
02300 Total Assets - As Reported
Liabilities & Shareholders' Equity 03019 Deposits - Total
03011 Demand Deposits
03015 Savings/Other Time Deposits
03017 Foreign Office Deposits
03018 Unspecified Deposits
03255 Total Debt
03051 Short Term Debt & Current Portion of Long Term Debt
03251 Long-Term Debt
03245 Long-Term Debt Excluding Capitalized Leases
18281 Non-Convertible Debt
18282 Convertible Debt
03249 Capitalized Lease Obligations
03260 Provision for Risks and Charges
03262 Deferred Income
03263 Deferred Taxes
18183 Deferred Taxes-Credit
18184 Deferred Taxes-Debit
03257 Deferred Tax Liability in Untaxed Reserves
03273 Other Liabilities
03351 Total Liabilities
03401 Non-Equity Reserves
03426 Minority Interest
03451 Preferred Stock
03448 Preferred Stock Issued for ESOP
03449 ESOP Guarantees-Preferred Issued
03501 Common Equity
03480 Common Stock

Banks Template
Issue 6
© Thomson Financial 2003-2007 39 Confidential Information of Thomson Financial
03481 Capital Surplus
03492 Revaluation Reserves
03493 Other Appropriated Reserves
03494 Unappropriated (Free) Reserves
03495 Retained Earnings
03490 Equity in Untaxed Reserves
03496 ESOP Guarantees
03497 Unrealized Foreign Exchange Gain/Loss
03498 Unrealized Gain/Loss on Marketable Securities
03499 Treasury Stock
03999 Total Liabilities & Shareholders' Equity
Supplementary Liabilities & Shareholders' Equity Fields
18232 Current Portion of Long Term Debt
03060 Accrued Taxes
18166 Deferred Tax Liability – Current
03055 Federal Funds (Liability)
03056 Securities Sold under Repurchase Agreements
03058 Customer Liabilities on Acceptances (Liabilities)
03506 Common Equity – Fully Diluted
03450 Preferred Stock Treated as Common
18289 Non-Redeemable Preferred Stock
18290 Redeemable Preferred Stock
03491 Goodwill Written Off
18065 Cumulative Goodwill Written Off
18352 Unfunded Pension Liabilities
03261 Pension/Postretirement Benefits
18141 Lease Commitments – Year 1
18142 Lease Commitments – Year 2
18143 Lease Commitments – Year 3
18144 Lease Commitments – Year 4
18145 Lease Commitments – Year 5
18146 Lease Commitments – Over 5 Years
18228 Tier 1 Capital
18229 Tier 2 Capital
18852 Comprehensive Income – Hedging Gain/Loss
18854 Comprehensive Income – Other
18851 Comprehensive Income – Pension Liability
18853 Comprehensive Income – Unearned Compensation
18168 Mandatorily Redeemable Trust Preferred Securities
18167 Other Mandatory Redeemable Instruments
Income Statement 01016 Interest Income - Total
01007 Interest and Fees on Loans
01008 Interest Income on Federal Funds
01009 Interest Income on Bank Deposits
01010 Interest Income on Government Securities
01011 Other Interest or Dividend Income
01075 Interest Expense - Total
01072 Interest Expense on Bank Deposits
01073 Interest Expense on Federal Funds
01074 Interest Expense on Other Borrowed Funds
01251 Interest Expense on Debt
01255 Interest Capitalized
01076 Net Interest Income
01021 Non-Interest Income
01006 Investment Income
01018 Foreign Exchange Income
01270 Gains/Losses on Sale of Securities - Pre-tax
01266 Non-Operating Interest Income
01017 Trading Account Income
01019 Trusts & Fiduciary Income/Commission & Fees
01014 Trust Income

Banks Template
Issue 6
© Thomson Financial 2003-2007 40 Confidential Information of Thomson Financial
01015 Commission & Fees
01020 Other Operating Income
01245 Non-Interest Expense
01084 Staff Costs
01085 Equipment Expense
04049 Depreciation and Depletion
01204 Taxes Other than Income Taxes
01302 Operating Provisions
01230 Other Operating Expenses
01271 Provision for Loan Losses
01250 Operating Income
01253 Extraordinary Credit - Pre-tax
01254 Extraordinary Charge - Pre-tax
01262 Other Income/Expense - Net
01267 Pre-tax Equity in Earnings
01301 Reserves - Increase/Decrease
01401 Pre-tax Income
01451 Income Taxes
18186 Current Domestic Income Tax
18187 Current Foreign Income Tax
18188 Deferred Domestic Income Tax
18189 Deferred Foreign Income Tax
18185 Income Tax Credits
01501 Minority Interest
01503 Equity in Earnings
01504 After Tax Other Income/Expense
01505 Discontinued Operations
01551 Net Income before Extraordinary Items/Preferred Dividends
01701 Preferred Dividend Requirements
01706 Net Income after Preferred Dividends (Basic EPS)
01601 Extraordinary Items & Gain/Loss Sale of Assets
Supplementary Income Statement Fields
18215 Exchange Rate Used in Translating Income Statement/Cash Flow
18094 Interest/Dividends on Investment Securities - Taxable
18095 Interest/Dividends on Investment Securities - Tax Exempt
18096 Interest/Dividends Securities Available for Sale - Taxable
18097 Interest/Dividends Securities Available for Sale - Tax Exempt
18098 Interest/Dividends on Trading Account Securities
18140 Rental/Operating Lease Expense
01249 Operating Expenses - Total
01001 Net Sales or Revenues
01151 Depreciation, Depletion & Amortization
01149 Amortization of Intangibles
01152 Amortization of Brands
01153 Amortization of Research and Development
01154 Amortization of Licenses
01155 Amortization of Other Intangibles
01156 Amortization of Goodwill
01157 Amortization of Computer Software
18224 Amortization and Impairment of Goodwill
18225 Impairment of Goodwill
18226 Impairment of Other Intangibles
18274 Impairment of Property, Plant & Equipment
18275 Impairment of Financial Fixed Assets
18227 Restructuring Expense
01268 Dividend Income - Non-Operating
01265 Monetary Correction
01269 Discontinued Operations - Pre-tax
18191 Earnings before Interest and Taxes (EBIT)
18198 Earnings before Interest, Taxes & Depreciation (EBITDA)
01306 Gain/Loss on Disposal of Assets
01352 Foreign Exchange Transactions
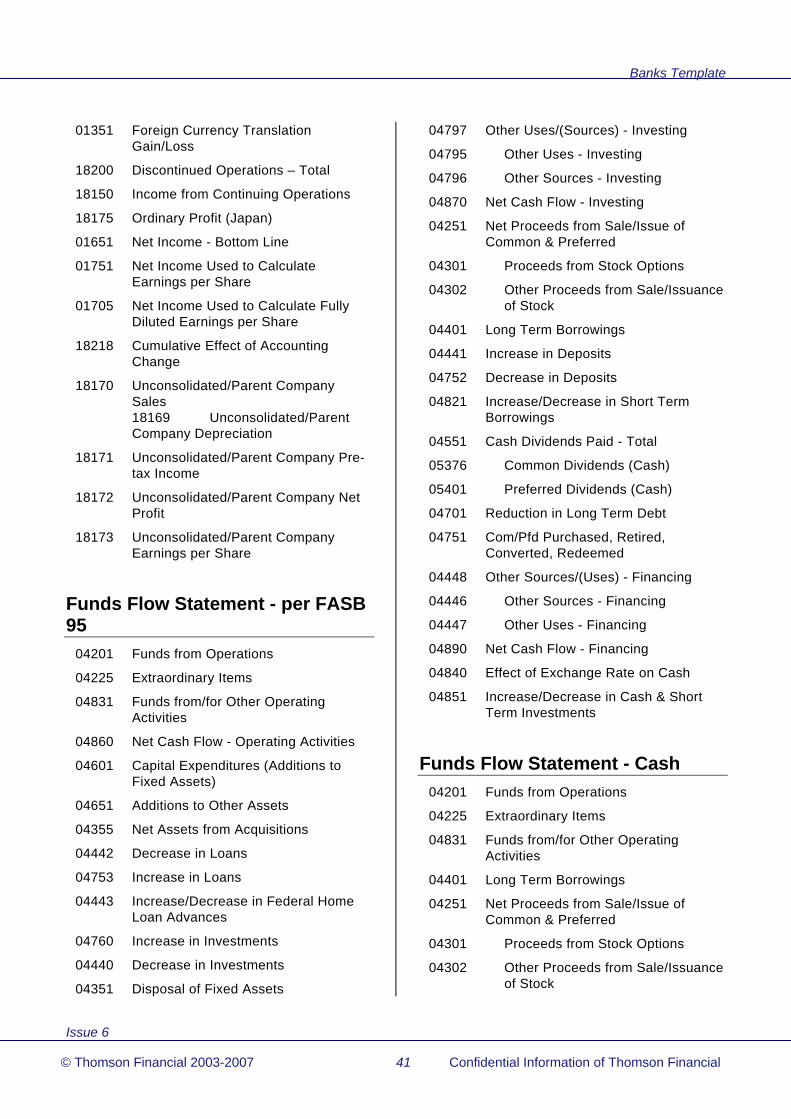
Banks Template
Issue 6
© Thomson Financial 2003-2007 41 Confidential Information of Thomson Financial
01351 Foreign Currency Translation Gain/Loss
18200 Discontinued Operations – Total
18150 Income from Continuing Operations
18175 Ordinary Profit (Japan)
01651 Net Income - Bottom Line
01751 Net Income Used to Calculate Earnings per Share
01705 Net Income Used to Calculate Fully Diluted Earnings per Share
18218 Cumulative Effect of Accounting Change
18170 Unconsolidated/Parent Company Sales 18169 Unconsolidated/Parent Company Depreciation
18171 Unconsolidated/Parent Company Pre-tax Income
18172 Unconsolidated/Parent Company Net Profit
18173 Unconsolidated/Parent Company Earnings per Share
Funds Flow Statement - per FASB 95
04201 Funds from Operations
04225 Extraordinary Items
04831 Funds from/for Other Operating Activities
04860 Net Cash Flow - Operating Activities
04601 Capital Expenditures (Additions to Fixed Assets)
04651 Additions to Other Assets
04355 Net Assets from Acquisitions
04442 Decrease in Loans
04753 Increase in Loans
04443 Increase/Decrease in Federal Home Loan Advances
04760 Increase in Investments
04440 Decrease in Investments
04351 Disposal of Fixed Assets
04797 Other Uses/(Sources) - Investing
04795 Other Uses - Investing
04796 Other Sources - Investing
04870 Net Cash Flow - Investing
04251 Net Proceeds from Sale/Issue of Common & Preferred
04301 Proceeds from Stock Options
04302 Other Proceeds from Sale/Issuance of Stock
04401 Long Term Borrowings
04441 Increase in Deposits
04752 Decrease in Deposits
04821 Increase/Decrease in Short Term Borrowings
04551 Cash Dividends Paid - Total
05376 Common Dividends (Cash)
05401 Preferred Dividends (Cash)
04701 Reduction in Long Term Debt
04751 Com/Pfd Purchased, Retired, Converted, Redeemed
04448 Other Sources/(Uses) - Financing
04446 Other Sources - Financing
04447 Other Uses - Financing
04890 Net Cash Flow - Financing
04840 Effect of Exchange Rate on Cash
04851 Increase/Decrease in Cash & Short Term Investments
Funds Flow Statement - Cash 04201 Funds from Operations
04225 Extraordinary Items
04831 Funds from/for Other Operating Activities
04401 Long Term Borrowings
04251 Net Proceeds from Sale/Issue of Common & Preferred
04301 Proceeds from Stock Options
04302 Other Proceeds from Sale/Issuance of Stock

Banks Template
Issue 6
© Thomson Financial 2003-2007 42 Confidential Information of Thomson Financial
04351 Disposal of Fixed Assets
04440 Decrease in Investments
04443 Increase/Decrease in Federal Home Loan Advances
04441 Increase in Deposits
04442 Decrease in Loans
04821 Increase/Decrease in Short Term Borrowings
04446 Other Sources - Financing
04796 Other Sources - Investing
04450 Other Sources
04551 Cash Dividends Paid - Total
05376 Common Dividends (Cash)
05401 Preferred Dividends (Cash)
04760 Increase in Investments
04752 Decrease in Deposits
04753 Increase in Loans
04701 Reduction in Long Term Debt
04601 Capital Expenditures (Additions to Fixed Assets)
04355 Net Assets from Acquisitions
04751 Com/Pfd Purchased, Retired, Converted, Redeemed
04651 Additions to Other Assets
04795 Other Uses - Investing
04447 Other Uses - Financing
04799 Other Uses
04840 Effect of Exchange Rate on Cash
04452 Changes in Cash and/or Liquid Items
04851 Increase/Decrease in Cash & Short Term Investments
Funds Flow Statement - Total Sources/Total Uses
Sources of Funds 04201 Funds from Operations
04225 Extraordinary Items
04831 Funds from/for Other Operating Activities
04401 Long Term Borrowings
04251 Net Proceeds from Sale/Issue of Common & Preferred
04301 Proceeds from Stock Options
04302 Other Proceeds from Sale/Issuance of Stock
04351 Disposal of Fixed Assets
04440 Decrease in Investments
04443 Increase/Decrease in Federal Home Loan Advances
04441 Increase in Deposits
04442 Decrease in Loans
04821 Increase/Decrease in Short Term Borrowings
04840 Effect of Exchange Rate on Cash
04452 Changes in Cash and/or Liquid Items
04851 Increase/Decrease in Cash & Short Term Investments
04446 Other Sources - Financing
04796 Other Sources - Investing
04450 Other Sources
04501 Total Sources
Uses of Funds 04551 Cash Dividends Paid - Total
05376 Common Dividends (Cash)
05401 Preferred Dividends (Cash)
04601 Capital Expenditures (Additions to Fixed Assets)
04355 Net Assets from Acquisitions
04701 Reduction in Long Term Debt
04751 Com/Pfd Purchased, Retired, Converted, Redeemed
04651 Additions to Other Assets
04760 Increase in Investments
04752 Decrease in Deposits
04753 Increase in Loans
04795 Other Uses - Investing

Banks Template
Issue 6
© Thomson Financial 2003-2007 43 Confidential Information of Thomson Financial
04447 Other Uses - Financing
04799 Other Uses
04811 Total Uses
Supplementary Cash Flow Fields 04500 External Financing
04891 Net Cash from Continuing Operations
04892 Net Cash from Discontinued Operations
18216 Format Code – Cash Flow
04052 Dividends
04053 Asset Disposal
04054 Discontinued Operations
04055 Minority Interest
04056 Equity In Earnings
04058 Unrealized Gains/Losses From Fair Value Adjustment Of Financial Assets
04148 Interest Paid
04149 Interest Income
04150 Taxation
Pension & Postretirement 18842 Healthcare Data – Actual Return on
Plan Assets
18834 Healthcare Data – Accumulated Benefit Obligation
18838 Healthcare Data – Amortization of Prior Service Costs
18832 Healthcare Data – Discount Rate
18831 Healthcare Data – Expected Long-Term Return Rate on Pension Assets
18843 Healthcare Data – Expected Return on Plan Assets for the Period
18833 Healthcare Data – Fair Value of Plan Assets
18840 Healthcare Data – Gains (Losses) from Settlements
18839 Healthcare Data – Interest Cost
18836 Healthcare Data – Net Periodic Pension (Income)/Expense
18841 Healthcare Data – Other Net Periodic Pension (Income)/Expense
18837 Healthcare Data – Pension Service Costs
18835 Healthcare Data – Projected Benefit Obligation (PBO)
18830 Healthcare Data – Unfunded Healthcare Defined Benefits
18844 Healthcare Data – Unrecognized Prior Service Cost
18845 Healthcare - Unrecognized Net Actuarial Gain/Loss
18846 Healthcare - Other Adjustments To Funded Status For Net Pension/Post Retirement Assets/Liabilities
18847 Healthcare Net Liability/(Asset) – Balance Sheet
18808 Pension Data – Accumulated Benefit Obligation
18816 Pension Data – Actual Return on Plan Assets
18802 Pension Data – Asset Allocation - % Bonds
18801 Pension Data – Asset Allocation - % Equities
18804 Pension Data – Asset Allocation- % Other
18803 Pension Data – Asset Allocation - % Property
18805 Pension Data – Expected Long-Term Return Rate on Pension Assets
18817 Pension Data – Expected Return on Plan Assets for the Period
18807 Pension Data – Fair Value of Plan Assets
18814 Pension Data – Gains (Losses) from Settlements
18810 Pension Data – Net Periodic Pension (Income)/Expense
18815 Pension Data – Other Net Periodic Pension (Income)/Expense
18806 Pension Data – Pension Discount Rate
18813 Pension Data – Pension Interest Cost

Banks Template
Issue 6
© Thomson Financial 2003-2007 44 Confidential Information of Thomson Financial
18811 Pension Data – Pension Service Costs
18812 Pension Data – Prior Service Costs
18809 Pension Data – Projected Benefit Obligation (PBO)
18818 Pension Data – Unrecognized Prior Service Cost
18819 Pension Data -Unrecognized Net Actuarial Gain/Loss
18820 Pension Data -Other Adjustments To Funded Status for Net Pension/Post Retirement Assets/Liabilities
18821 Pension Data - Net Pension Liability/(Asset) – Balance Sheet
Other Fields 18192 Dividends Provided for or Paid -
Common
18231 Weighted Cost of Debt
03998 Total Capital
18220 Net Interest Margin (NIM)
18157 Capital Adequacy Ratio – Tier 1
18158 Capital Adequacy Ratio – Total Capital
18199 Net Debt
18156 Risk Weighted Assets
18322 Stock Option Compensation Expense – Adjustment to Net Income, Net of Tax
18321 Stock Option Compensation Expense, Net of Tax
03995 Total Shareholders’ Equity
5 Year Summary Data 19760 Summary As Reported Year - Current Year
19761 Summary As Reported Revenue – Cur. Yr.
19762 Summary As Reported Net Inc. – Cur Yr
19763 Summary As Reported EPS Basic – Cur Yr
19764 Summary As Reported EPS Dil. – Cur Yr
19765 Summary As Reported Equity – Cur Yr
19766 Summary As Reported Year- -1 Year
19767 Summary As Reported Revenue – -1 Yr
19768 Summary As Reported Net Inc. – -1 Yr
19769 Summary As Reported EPS Basic – -1 Yr
19770 Summary As Reported EPS Dil. – -1 Yr
19771 Summary As Reported Equity – -1 Yr
19772 Summary As Reported Year- -2 Year
19773 Summary As Reported Revenue – -2 Yr
19774 Summary As Reported Net Inc. – -2 Yr
19775 Summary As Reported EPS Basic – -2 Yr
19776 Summary As Reported EPS Dil. – -2 Yr
19777 Summary As Reported Equity – -2 Yr
19778 Summary As Reported Year- -3 Year
19779 Summary As Reported Revenue – -3Yr
19780 Summary As Reported Net Inc. – -3 Yr
19781 Summary As Reported EPS Basic – -3 Yr
19782 Summary As Reported EPS Dil. – -3 Yr
19783 Summary As Reported Equity – -3 Yr

Banks Template
Issue 6
© Thomson Financial 2003-2007 45 Confidential Information of Thomson Financial
19784 Summary As Reported Year- -4 Year
19785 Summary As Reported Revenue – -4Yr
19786 Summary As Reported Net Inc. – -4 Yr
19787 Summary As Reported EPS Basic – -4 Yr
19788 Summary As Reported EPS Dil. – -4 Yr
19789 Summary As Reported Equity – -4 Yr
Annual Series Interim Data
Qtr 1 Qtr 2 Qtr 3 Qtr 4
Interim Sales 19101 19102 19103 19104
Interim Pre-tax Income
19105 19106 19107 19108
Interim Net Profit
19109 19110 19111 19112
Number of Months-EPS
05217 05218 05219 05220
Earnings per Share
05221 05222 05223 05224
Earning per Share-Basic
05211 05212 05213 05214
Fully Diluted EPS
05291 05292 05293 05294
EPS - Report Date
05901 05902 05903 05904
EPS - 12 Months
05251 05252 05253 05254
EPS - 5 yr avg
05261 05262 05263 05264
Dividends per Share
05121 05122 05123 05124
DPS – Gross 05125 05126 05127 05128
DPS - Declared Date
05910 05911 05912 05913
DPS - Record Date
05917 05918 05919 05920
DPS - Ex-Div Date
05923 05924 05925 05926
Qtr 1 Qtr 2 Qtr 3 Qtr 4
DPS - Payable Date
05929 05930 05931 05932
DPS – Extra 05151 05152 05153 05154
DPS - Extra – Gross
05171 05172 05173 05174
DPS - Extra - Dec Date
05935 05936 05937 05938
DPS - Extra - Rec Date
05941 05942 05943 05944
DPS - Extra - Ex-Div Date
05947 05948 05949 05950
DPS - Extra - Pay Date
05953 05954 05955 05956
DPS - Special
05155 05156 05157 05158
DPS - Special – Gross
05175 05176 05177 05178
DPS - Special - Dec Date
05965 05966 05968 05969
DPS - Special - Rec Date
05970 05971 05972 05973
DPS - Special - Ex-Div Date
05959 05960 05961 05962
DPS - Special - Pay Date
05976 05977 05978 05979
DPS - 12 Months
05131 05132 05133 05134
DPS - 5 yr avg
05141 05142 05143 05144
Monthly Price Information
Month End Market Price
High Price
Low Price
January 05015 05016 05017
February 05020 05021 05022

Banks Template
Issue 6
© Thomson Financial 2003-2007 46 Confidential Information of Thomson Financial
March 05025 05026 05027
April 05030 05031 05032
May 050350 5036 05037
June 05040 05041 05042
July 05045 05046 05047
August 05050 05051 05052
September 05055 05056 05057
October 05060 05061 05062
November 05065 05066 05067
December 05070 05071 05072
Stock Performance
Current Information 09102 Price/Earnings Ratio - Current
09103 Price/Earnings Ratio - Current High
09105 Price/Earnings Ratio - Current Low
09202 Earnings Yield - Current
09203 Earnings Yield - Current High
09205 Earnings Yield - Current Low
09602 Price/Cash Flow - Current
09302 Price/Book Value Ratio - Current
09402 Dividend Yield - Current
09502 Dividend Payout - per Share - Current
08372 Return on Equity - per Share - Current
08652 Reinvestment Rate - per Share - Current
09001 Price Trend - Last Week
09005 Price Trend - Four Week
09011 Price Trend - Quarter to Date
09016 Price Trend - Previous Quarter
09021 Price Trend - Year to Date
09006 Price Trend - 13 Weeks
09007 Price Trend – 26 Weeks
09026 Price Trend - 52 Weeks
09802 Beta
09803 Alpha
Annual Statistics 09104 Price/Earnings Ratio – Close
09100 Price/Earnings Ratio - High
09101 Price/Earnings Ratio - Low
09106 Price/Earnings Ratio - Avg High-Low
09204 Earnings Yield - Close
09200 Earnings Yield - High
09201 Earnings Yield - Low
09206 Earnings Yield - Avg High-Low
09604 Price/Cash Flow Ratio
09404 Dividend Yield - Close
09400 Dividend Yield - High
09401 Dividend Yield - Low
09406 Dividend Yield - Avg High-Low
09504 Dividend Payout per Share
09304 Price/Book Value Ratio - Close
09300 Price/Book Value Ratio - High
09301 Price/Book Value Ratio - Low
09306 Price/Book Value Ratio - Avg High-Low
09904 Price/Sales per Share Ratio
08801 Total Investment Return
08806 Price Volatility
09704 Market Capitalization/Common Equity
Three Year Averages 08803 Total Investment Return
Five Year Averages 09121 Price/Earnings Ratio - Close
09111 Price/Earnings Ratio - High
09116 Price/Earnings Ratio - Low
09126 Price/Earnings Ratio - Avg High-Low
09221 Earnings Yield - Close
09211 Earnings Yield - High
09216 Earnings Yield - Low
09226 Earnings Yield - Avg High-Low
09621 Price/Cash Flow Ratio

Banks Template
Issue 6
© Thomson Financial 2003-2007 47 Confidential Information of Thomson Financial
09421 Dividend Yield - Close
09411 Dividend Yield - High
09416 Dividend Yield - Low
09426 Dividend Yield - Avg High-Low
09521 Dividend Payout per Share
09321 Price/Book Value Ratio - Close
09311 Price/Book Value Ratio - High
09316 Price/Book Value Ratio - Low
09326 Price/Book Value Ratio - Avg High-Low
08805 Total Investment Return
09721 Market Capitalization/Common Equity
Growth Rates
Annual Statistics 08666 Loan Growth
08631 Net Sales/Revenues Growth
08646 Operating Income Growth
08636 Net Income Growth
08621 Total Assets Growth
08616 Equity Growth
08626 Employees Growth
08676 Net Margin Growth
08601 Earnings per Share Growth
08611 Dividends per Share Growth
08606 Book Value per Share Growth
08579 Market Capitalization Growth
08816 Earnings Per Share Fiscal Growth
08821 Book Value Per Share Fiscal Growth
Three Year Averages 08581 Market Capitalization Growth
08604 Earnings per Share Growth
Five Year Averages 08670 Loan Growth
08635 Net Sales/Revenues Growth
08650 Operating Income Growth
08640 Net Income Growth
08625 Total Assets Growth
08620 Equity Growth
08630 Employees Growth
08680 Net Margin Growth
08605 Earnings per Share Growth
08615 Dividends per Share Growth
08610 Book Value per Share Growth
Profitability
Annual Statistics 08301 Return on Equity – Total (%)
08371 Return on Equity - Per Share
08302 Return on Equity – Per Share Fiscal
08653 Reinvestment Rate – Per Share Fiscal
08656 Reinvestment Rate - Total
08651 Reinvestment Rate - Per Share
08326 Return on Assets
08376 Return on Invested Capital
15567 Return on Earning Assets
08911 Retained Earnings % Equity
08381 Cash Earnings Return on Equity
08311 Cash Flow/Sales
08316 Operating Profit Margin
08361 Operating Income Return on Total Capital
08321 Pre-tax Margin
08346 Tax Rate
08356 Interest Rate - Estimated Average
08366 Net Margin
15144 Net Interest Income % Earning Assets
15150 Net Interest Income % Average Deposits
15611 Efficiency of Earning Assets
15587 Earning Assets % Total Assets

Banks Template
Issue 6
© Thomson Financial 2003-2007 48 Confidential Information of Thomson Financial
08351 Sales per Employee
15593 Non-Interest Income % Total Revenues
15599 Total Interest Expense % Interest Bearing Liabilities
15605 Total Interest Income % Earning Assets
Five Year Averages 08305 Return on Equity - Total (%)
08375 Return on Equity - per Share
08656 Reinvestment Rate - Total
08660 Reinvestment Rate – per Share
08330 Return on Assets
08380 Return on Invested Capital
15570 Return on Earning Assets
08915 Retained Earnings % Equity
08385 Cash Earnings Return on Equity
08315 Cash Flow/Sales
08320 Operating Profit Margin
08365 Operating Income Return on Total Capital
08325 Pre-tax Margin
08350 Tax Rate
08360 Interest Rate - Estimated Average
08370 Net Margin
15147 Net Interest Income % Earning Assets
15153 Net Interest Income % Average Deposits
15614 Efficiency of Earning Assets
15590 Earning Assets % Total Assets
08355 Sales per Employee
15596 Non-Interest Income % Total Revenues
15602 Total Interest Expense % Interest Bearing Liabilities
15608 Total Interest Income % Earning Assets
Loan Loss Ratios
Annual Statistics 15019 Net Loan Losses % Total Loans
15079 Provision for Loan Losses % Total Loans
15073 Reserves for Loan Losses % Total Loans
15156 Reserves for Loan Losses % Total Assets
15085 Actual Loan Losses % Reserves for Loan Losses
15139 Loan Loss Coverage
15061 Non-Performing Loans % Total Loans
15001 Non-Performing Loans % Reserves for Loan Losses
15067 Non-Performing Loans % Equity
Five Year Averages 15022 Net Loan Losses % Total Loans
15082 Provision for Loan Losses % Total Loans
15076 Reserves for Loan Losses % Total Loans
15159 Reserves for Loan Losses % Total Assets
15088 Actual Loan Losses % Reserves for Loan Losses
15141 Loan Loss Coverage
15064 Non-Performing Loans % Total Loans
15004 Non-Performing Loans % Reserves for Loan Losses
15070 Non-Performing Loans % Equity
Deposit Ratios
Annual Statistics 15179 Demand Deposits % Total Deposits
15184 Savings Deposits % Total Deposits
15573 Foreign Office Deposits % Total Deposits

Banks Template
Issue 6
© Thomson Financial 2003-2007 49 Confidential Information of Thomson Financial
Five Year Averages 15181 Demand Deposits % Total Deposits
15187 Savings Deposits % Total Deposits
15577 Foreign Office Deposits % Total Deposits
Asset Utilization
Annual Statistics 08406 Assets per Employee
08401 Total Asset Turnover
15043 Total Loans % Total Assets
15091 Invested Assets % Total Assets
08416 Capital Expenditure % Total Assets
Five Year Averages 08410 Assets per Employee
08405 Total Asset Turnover
15046 Total Loans % Total Assets
15094 Invested Assets % Total Assets
08420 Capital Expenditure % Total Assets
Leverage
Annual Statistics 08231 Total Debt % Common Equity
08226 Long Term Debt % Common Equity
08221 Total Debt % Total Capital
08216 Long Term Debt % Total Capital
08211 Minority Interest % Total Capital
08201 Equity % Total Capital
08206 Preferred Stock % Total Capital
08236 Total Debt % Total Assets
08241 Common Equity % Total Assets
08287 Total Assets / Common Equity Ratio
15121 Total Capital % Total Assets
08261 Operating Cash/Fixed Charges
08256 Dividend Payout (% Earnings)
08906 Cash Dividends % Cash Flow
08266 Fixed Assets % Common Equity
08291 EBIT / Total Interest Expense Ratio
15167 Invested Assets & Loans % Total Deposits
15161 Invested Assets % Total Deposits
15007 Equity % Total Deposits
15025 Total Capital % Total Deposits
15037 Total Deposits % Total Assets
15173 Earning Assets % Total Available funds
15097 Invested Assets % Liabilities
15115 Reserves for Loan Losses % Total Capital
Five Year Averages 08235 Total Debt % Common Equity
08230 Long Term Debt % Common Equity
08225 Total Debt % Total Capital
08220 Long Term Debt % Total Capital
08215 Minority Interest % Total Capital
08205 Equity % Total Capital
08210 Preferred Stock % Total Capital
08240 Total Debt % Total Assets
08245 Common Equity % Total Assets
15124 Total Capital % Total Assets
08265 Operating Cash/Fixed Charges
08260 Dividend Payout (% Earnings)
08910 Cash Dividends % Cash Flow
08270 Fixed Assets % Common Equity
15170 Invested Assets & Loans % Total Deposits
15164 Invested Assets % Total Deposits
15010 Equity % Total Deposits
15028 Total Capital % Total Deposits
15040 Total Deposits % Total Assets
15176 Earning Assets % Total Available funds
15100 Invested Assets % Liabilities

Banks Template
Issue 6
© Thomson Financial 2003-2007 50 Confidential Information of Thomson Financial
15118 Reserves for Loan Losses % Total Capital
Liquidity
Annual Statistics 15013 Cash & Securities % Total Deposits
15049 Total Loans % Total Deposits
15055 Ratio of Total Loans to Total Capital
Five Year Averages 15016 Cash & Securities % Total Deposits
15052 Total Loans % Total Deposits
15058 Ratio of Total Loans to Total Capital
Foreign Business
Annual Statistics 07151 International Assets
07101 International Sales
07126 International Operating Income
08711 Foreign Return on Assets
08706 Foreign Asset Turnover
08701 Foreign Income Margin
08716 Foreign Assets Growth
08721 Foreign Sales Growth
08726 Foreign Income Growth
08736 Foreign Assets % Total Assets
08731 Foreign Sales % Total Sales
08741 Foreign Income % Total Income
Five Year Averages 08715 Foreign Return on Assets
08710 Foreign Asset Turnover
08705 Foreign Income Margin
08720 Foreign Assets Growth
08725 Foreign Sales Growth
08730 Foreign Income Growth
08740 Foreign Assets % Total Assets
08735 Foreign Sales % Total Sales
08745 Foreign Income % Total Income
Geographic Segment Data 19600 Geographic Segment 1 - Description
19601 Geographic Segment 1 - Sales
19602 Geographic Segment 1 - Operating Income
19603 Geographic Segment 1 - Assets
19604 Geographic Segment 1 - Capital Expenditures
19605 Geographic Segment 1 - Depreciation
19610 Geographic Segment 2 - Description
19611 Geographic Segment 2 - Sales
19612 Geographic Segment 2 - Operating Income
19613 Geographic Segment 2 - Assets
19614 Geographic Segment 2 - Capital Expenditures
19615 Geographic Segment 2 - Depreciation
19620 Geographic Segment 3 - Description
19621 Geographic Segment 3 - Sales
19622 Geographic Segment 3 - Operating Income
19623 Geographic Segment 3 - Assets
19624 Geographic Segment 3 - Capital Expenditures
19625 Geographic Segment 3 - Depreciation
19630 Geographic Segment 4 - Description
19631 Geographic Segment 4 - Sales
19632 Geographic Segment 4 - Operating Income
19633 Geographic Segment 4 - Assets
19634 Geographic Segment 4 - Capital Expenditures
19635 Geographic Segment 4 - Depreciation
19640 Geographic Segment 5 - Description
19641 Geographic Segment 5 - Sales

Banks Template
Issue 6
© Thomson Financial 2003-2007 51 Confidential Information of Thomson Financial
19642 Geographic Segment 5 - Operating Income
19643 Geographic Segment 5 - Assets
19644 Geographic Segment 5 - Capital Expenditures
19645 Geographic Segment 5 - Depreciation
19650 Geographic Segment 6 - Description
19651 Geographic Segment 6 - Sales
19652 Geographic Segment 6 - Operating Income
19653 Geographic Segment 6 - Assets
19654 Geographic Segment 6 - Capital Expenditures
19655 Geographic Segment 6 - Depreciation
19660 Geographic Segment 7 - Description
19661 Geographic Segment 7 - Sales
19662 Geographic Segment 7 - Operating Income
19663 Geographic Segment 7 - Assets
19664 Geographic Segment 7 - Capital Expenditures
19665 Geographic Segment 7 - Depreciation
19670 Geographic Segment 8 - Description
19671 Geographic Segment 8 - Sales
19672 Geographic Segment 8 - Operating Income
19673 Geographic Segment 8 - Assets
19674 Geographic Segment 8 - Capital Expenditures
19675 Geographic Segment 8 - Depreciation
19680 Geographic Segment 9 - Description
19681 Geographic Segment 9 - Sales
19682 Geographic Segment 9 - Operating Income
19683 Geographic Segment 9 - Assets
19684 Geographic Segment 9 - Capital Expenditures
19685 Geographic Segment 9 - Depreciation
19690 Geographic Segment 10 - Description
19691 Geographic Segment 10 - Sales
19692 Geographic Segment 10 - Operating Income
19693 Geographic Segment 10 - Assets
19694 Geographic Segment 10 - Capital Expenditures
19695 Geographic Segment 10 - Depreciation
Company Specific Accounting Practices
07531 Accounting method for long term investment > 50%
07536 Accounting standards followed
07546 Auditors' opinion
Multiple Share Data 20001 Type of Share - Mult Share 1
20003 Worldscope Identifier - Mult Share 1
20005 SEDOL - Mult Share 1
20006 CUSIP - Mult Share 1
20007 ISIN - Mult Share 1
20008 Ticker Symbol - Mult Share 1
20009 Stock Exchange(s) Listed - Mult Share 1
20011 Inactive Date - Mult Share 1
20020 Common Shares Outstanding - Current - Mult Share 1
20021 Market Price - Current - Mult Share 1
20022 Date of Current Price - Mult Share 1
20023 Market Capitalization - Current - Mult Share 1
20024 Earnings per Share - Last 12 Mos - Mult Share 1
20025 Dividends per Share - Last 12 Mos - Mult Share 1
20026 Price/Earnings Ratio - Current - Mult Share 1
20027 Price/Book Value Ratio - Current - Mult Share 1
20028 Dividend Yield - Current - Mult Share 1

Banks Template
Issue 6
© Thomson Financial 2003-2007 52 Confidential Information of Thomson Financial
20040 Common Shares Outstanding - Mult Share 1
20002 Par Value - Mult Share 1
20042 Market Price - Year End - Mult Share 1
20041 Market Capitalization - Mult Share 1
20043 Earnings per Share - Mult Share 1
20044 Dividends per Share - Mult Share 1
20045 Book Value per Share - Mult Share 1
20046 Price/Earnings Ratio - Close - Mult Share 1
20047 Price/Book Value Ratio - Close - Mult Share 1
20048 Dividend Yield - Close - Mult Share 1
20101 Type of Share - Mult Share 2
20103 Worldscope Identifier - Mult Share 2
20105 SEDOL - Mult Share 2
20106 CUSIP - Mult Share 2
20107 ISIN - Mult Share 2
20108 Ticker Symbol - Mult Share 2
20109 Stock Exchange(s) Listed - Mult Share 2
20111 Inactive Date - Mult Share 2
20120 Common Shares Outstanding - Current - Mult Share 2
20121 Market Price - Current - Mult Share 2
20122 Date of Current Price - Mult Share 2
20123 Market Capitalization - Current - Mult Share 2
20124 Earnings per Share - Last 12 Mos - Mult Share 2
20125 Dividends per Share - Last 12 Mos - Mult Share 2
20126 Price/Earnings Ratio - Current - Mult Share 2
20127 Price/Book Value Ratio - Current - Mult Share 2
20128 Dividend Yield - Current - Mult Share 2
20140 Common Shares Outstanding - Mult Share 2
20102 Par Value - Mult Share 2
20142 Market Price - Year End - Mult Share 2
20141 Market Capitalization - Mult Share 2
20143 Earnings per Share - Mult Share 2
20144 Dividends per Share - Mult Share 2
20145 Book Value per Share - Mult Share 2
20146 Price/Earnings Ratio - Close - Mult Share 2
20147 Price/Book Value Ratio - Close - Mult Share 2
20148 Dividend Yield - Close - Mult Share 2
20201 Type of Share - Mult Share 3
20203 Worldscope Identifier - Mult Share 3
20205 SEDOL - Mult Share 3
20206 CUSIP - Mult Share 3
20207 ISIN - Mult Share 3
20208 Ticker Symbol - Mult Share 3
20209 Stock Exchange(s) Listed - Mult Share 3
20211 Inactive Date - Mult Share 3
20220 Common Shares Outstanding - Current - Mult Share 3
20221 Market Price - Current - Mult Share 3
20222 Date of Current Price - Mult Share 3
20223 Market Capitalization - Current - Mult Share 3
20224 Earnings per Share - Last 12 Mos - Mult Share 3
20225 Dividends per Share - Last 12 Mos - Mult Share 3
20226 Price/Earnings Ratio - Current - Mult Share 3
20227 Price/Book Value Ratio - Current - Mult Share 3
20228 Dividend Yield - Current - Mult Share 3
20240 Common Shares Outstanding - Mult Share 3
20202 Par Value - Mult Share 3
20242 Market Price - Year End - Mult Share 3
20241 Market Capitalization - Mult Share 3
20243 Earnings per Share - Mult Share 3

Banks Template
Issue 6
© Thomson Financial 2003-2007 53 Confidential Information of Thomson Financial
20244 Dividends per Share - Mult Share 3
20245 Book Value per Share - Mult Share 3
20246 Price/Earnings Ratio - Close - Mult Share 3
20247 Price/Book Value Ratio - Close - Mult Share 3
20248 Dividend Yield - Close - Mult Share 3
20301 Type of Share - Mult Share 4
20303 Worldscope Identifier - Mult Share 4
20305 SEDOL - Mult Share 4
20306 CUSIP - Mult Share 4
20307 ISIN - Mult Share 4
20308 Ticker Symbol - Mult Share 4
20309 Stock Exchange(s) Listed - Mult Share 4
20311 Inactive Date - Mult Share 4
20320 Common Shares Outstanding - Current - Mult Share 4
20321 Market Price - Current - Mult Share 4
20322 Date of Current Price - Mult Share 4
20323 Market Capitalization - Current - Mult Share 4
20324 Earnings per Share - Last 12 Mos - Mult Share 4
20325 Dividends per Share - Last 12 Mos - Mult Share 4
20326 Price/Earnings Ratio - Current - Mult Share 4 20327 Price/Book Value Ratio - Current - Mult Share 4
20328 Dividend Yield - Current - Mult Share 4
20340 Common Shares Outstanding - Mult Share 4
20302 Par Value - Mult Share 4
20342 Market Price - Year End - Mult Share 4
20341 Market Capitalization - Mult Share 4
20343 Earnings per Share - Mult Share 4
20344 Dividends per Share - Mult Share 4
20345 Book Value per Share - Mult Share 4
20346 Price/Earnings Ratio - Close - Mult Share 4
20347 Price/Book Value Ratio - Close - Mult Share 4
20348 Dividend Yield - Close - Mult Share 4
20401 Type of Share - Mult Share 5
20403 Worldscope Identifier - Mult Share 5
20405 SEDOL - Mult Share 5
20406 CUSIP - Mult Share 5
20407 ISIN - Mult Share 5
20408 Ticker Symbol - Mult Share 5
20409 Stock Exchange(s) Listed - Mult Share 5
20411 Inactive Date - Mult Share 5
20420 Common Shares Outstanding - Current - Mult Share 5
20421 Market Price - Current - Mult Share 5
20422 Date of Current Price - Mult Share 5
20423 Market Capitalization - Current - Mult Share 5
20424 Earnings per Share - Last 12 Mos - Mult Share 5
20425 Dividends per Share - Last 12 Mos - Mult Share 5
20426 Price/Earnings Ratio - Current - Mult Share 5
20427 Price/Book Value Ratio - Current - Mult Share 5
20428 Dividend Yield - Current - Mult Share 5
20440 Common Shares Outstanding - Mult Share 5
20402 Par Value - Mult Share 5
20442 Market Price - Year End - Mult Share 5
20441 Market Capitalization - Mult Share 5
20443 Earnings per Share - Mult Share 5
20444 Dividends per Share - Mult Share 5
20445 Book Value per Share - Mult Share 5
20446 Price/Earnings Ratio - Close - Mult Share 5

Banks Template
Issue 6
© Thomson Financial 2003-2007 54 Confidential Information of Thomson Financial
20447 Price/Book Value Ratio - Close - Mult Share 5
20448 Dividend Yield - Close - Mult Share 5
20501 Type of Share - Mult Share 6
20503 Worldscope Identifier - Mult Share 6
20505 SEDOL - Mult Share 6
20506 CUSIP - Mult Share 6
20507 ISIN - Mult Share 6
20508 Ticker Symbol - Mult Share 6
20509 Stock Exchange(s) Listed - Mult Share 6
20511 Inactive Date - Mult Share 6
20520 Common Shares Outstanding - Current - Mult Share 6
20521 Market Price - Current - Mult Share 6
20522 Date of Current Price - Mult Share 6
20523 Market Capitalization - Current - Mult Share 6
20524 Earnings per Share - Last 12 Mos - Mult Share 6
20525 Dividends per Share - Last 12 Mos - Mult Share 6
20526 Price/Earnings Ratio - Current - Mult Share 6
20527 Price/Book Value Ratio - Current - Mult Share 6
20528 Dividend Yield - Current - Mult Share 6
20540 Common Shares Outstanding - Mult Share 6
20502 Par Value - Mult Share 6
20542 Market Price - Year End - Mult Share 6
20541 Market Capitalization - Mult Share 6
20543 Earnings per Share - Mult Share 6
20544 Dividends per Share - Mult Share 6
20545 Book Value per Share - Mult Share 6
20546 Price/Earnings Ratio - Close - Mult Share 6
20547 Price/Book Value Ratio - Close - Mult Share 6
20548 Dividend Yield - Close - Mult Share 6
20601 Type of Share - Mult Share 7 20603 Worldscope Identifier - Mult Share 7
20605 SEDOL - Mult Share 7
20606 CUSIP - Mult Share 7
20607 ISIN - Mult Share 7
20608 Ticker Symbol - Mult Share 7
20609 Stock Exchange(s) Listed - Mult Share 7
20611 Inactive Date - Mult Share 7
20620 Common Shares Outstanding - Current - Mult Share 7
20621 Market Price - Current - Mult Share 7
20622 Date of Current Price - Mult Share 7
20623 Market Capitalization - Current - Mult Share 7
20624 Earnings per Share - Last 12 Mos - Mult Share 7
20625 Dividends per Share - Last 12 Mos - Mult Share 7
20626 Price/Earnings Ratio - Current - Mult Share 7
20627 Price/Book Value Ratio - Current - Mult Share 7
20628 Dividend Yield - Current - Mult Share 7
20640 Common Shares Outstanding - Mult Share 7
20602 Par Value - Mult Share 7
20642 Market Price - Year End - Mult Share 7
20641 Market Capitalization - Mult Share 7
20643 Earnings per Share - Mult Share 7
20644 Dividends per Share - Mult Share 7
20645 Book Value per Share - Mult Share 7
20646 Price/Earnings Ratio - Close - Mult Share 7
20647 Price/Book Value Ratio - Close - Mult Share 7
20648 Dividend Yield - Close - Mult Share 7

Banks Template
Issue 6
© Thomson Financial 2003-2007 55 Confidential Information of Thomson Financial
Monthly Foreign Exchange Rates 11013 To U.S. Dollars - Current
11002 To U.S. Dollars - January Month End
11003 To U.S. Dollars - February Month End
11004 To U.S. Dollars - March Month End
11005 To U.S. Dollars - April Month End
11006 To U.S. Dollars - May Month End
11007 To U.S. Dollars - June Month End
11008 To U.S. Dollars - July Month End
11009 To U.S. Dollars - August Month End
11010 To U.S. Dollars - September Month End
11011 To U.S. Dollars - October Month End
11012 To U.S. Dollars - November Month End
11001 To U.S. Dollars - December Month End
11113 From Euro Currency to Legacy/Local – Current
11102 From Euro Currency to Legacy/Local – January
11103 From Euro Currency to Legacy/Local – February
11104 From Euro Currency to Legacy/Local – March
11105 From Euro Currency to Legacy/Local – April
11106 From Euro Currency to Legacy/Local – May
11107 From Euro Currency to Legacy/Local – June
11108 From Euro Currency to Legacy/Local – July
11109 From Euro Currency to Legacy/Local – August
11110 From Euro Currency to Legacy/Local – September
11111 From Euro Currency to Legacy/Local – October
11112 From Euro Currency to Legacy/Local – November
11101 From Euro Currency to Legacy/Local – Year End
11202 From ECU Currency to Local – January
11203 From ECU Currency to Local – February
11204 From ECU Currency to Local – March
11205 From ECU Currency to Local – April
11206 From ECU Currency to Local – May
11207 From ECU Currency to Local – June
11208 From ECU Currency to Local – July
11209 From ECU Currency to Local – August
11210 From ECU Currency to Local – September
11211 From ECU Currency to Local – October
11212 From ECU Currency to Local – November
11201 From ECU Currency to Local – Year End
11313 Legacy to U.S. Currency – Current
11302 Legacy to U.S. Currency – January
11303 Legacy to U.S. Currency – February
11304 Legacy to U.S. Currency – March
11305 Legacy to U.S. Currency – April
11306 Legacy to U.S. Currency – May
11307 Legacy to U.S. Currency – June
11308 Legacy to U.S. Currency – July
11309 Legacy to U.S. Currency – August
11310 Legacy to U.S. Currency – September
11311 Legacy to U.S. Currency – October
11312 Legacy to U.S. Currency – November
11301 Legacy to U.S. Currency – Year End

Issue 6
© Thomson Financial 2003-2007 56 Confidential Information of Thomson Financial
Industrial Companies TemplateNotes:
#: Currently U.S. and Canadian companies only.
General Information 06001 Company Name
06003 Company Name - Short
06014 Acronym
00000 Company Status
06094 Post Office Box
06021 Building
06022 Street
06023 Address City
06024 Address State
06025 Post Code/Zip Code
06026 Nation
06027 Nation Code
06028 Region
06031 Phone Number
06032 TELEX Number
06033 FAX Number
06030 Internet Address
06041 Officer 1 - Name
Officer 1 - Title
06051 Officer 2 - Name
Officer 2 - Title
06061 Officer 3 - Name
Officer 3 - Title
06071 Officer 4 - Name
Officer 4 - Title
06081 Officer 5 - Name
Officer 5 - Title
18357 Investor Relations - Name
18358 Investor Relations – Address
18356 Investor Relations – E-mail Address
18359 Investor Relations - Phone/Fax
18121 Registrar – Name
18122 Registrar – Address
18123 Registrar – Telephone Number
18124 Registrar – Fax Number
18125 Registrar – Website
18126 Registrar – Email Address
18272 Company Founded Date
18273 Date of Incorporation
11516 Date Added to Product
07033 Full/Limited Coverage Indicator
07034 Indicator – Data Update
07015 Inactive Date
06091 Business Description
06092 Business Description - Extended
07011 Employees
07001 Products
06100 Entity Type
06098 Currency of Analysis
06099 Currency of Document
05350 Date of Fiscal Period End
05352 Month of Fiscal Year End
05351 Length of Fiscal Period
11556 Indicator – Restated Data Exists
11557 Indicator – Restatement Type
11558 Indicator – Early Release (Restatement)
11559 Indicator – Restatement Reason Code
Industry 06011 Industry Group
06010 General Industry Classification
07040 ICB Code
07021 SIC Code 1

Industrial Companies Template
Issue 6
© Thomson Financial 2003-2007 57 Confidential Information of Thomson Financial
07022 SIC Code 2
07023 SIC Code 3
07024 SIC Code 4
07025 SIC Code 5
07026 SIC Code 6
07027 SIC Code 7
07028 SIC Code 8
Product Segment Data 19500 Product Segment 1 - Description
19501 Product Segment 1 - Sales
19502 Product Segment 1 - Operating Income
19503 Product Segment 1 - Assets
19504 Product Segment 1 - Capital Expenditures
19505 Product Segment 1 - Depreciation
19506 Product Segment 1 - SIC Code
19510 Product Segment 2 - Description
19511 Product Segment 2 - Sales
19512 Product Segment 2 - Operating Income
19513 Product Segment 2 - Assets
19514 Product Segment 2 - Capital Expenditures
19515 Product Segment 2 - Depreciation
19516 Product Segment 2 - SIC Code
19520 Product Segment 3 - Description
19521 Product Segment 3 - Sales
19522 Product Segment 3 - Operating Income
19523 Product Segment 3 - Assets
19524 Product Segment 3 - Capital Expenditures
19525 Product Segment 3 - Depreciation
19526 Product Segment 3 - SIC Code
19530 Product Segment 4 - Description
19531 Product Segment 4 - Sales
19532 Product Segment 4 - Operating Income
19533 Product Segment 4 - Assets
19534 Product Segment 4 - Capital Expenditures
19535 Product Segment 4 - Depreciation
19536 Product Segment 4 - SIC Code
19540 Product Segment 5 - Description
19541 Product Segment 5 - Sales
19542 Product Segment 5 - Operating Income
19543 Product Segment 5 - Assets
19544 Product Segment 5 - Capital Expenditures
19545 Product Segment 5 - Depreciation
19546 Product Segment 5 - SIC Code
19550 Product Segment 6 - Description
19551 Product Segment 6 - Sales
19552 Product Segment 6 - Operating Income
19553 Product Segment 6 - Assets
19554 Product Segment 6 - Capital Expenditures
19555 Product Segment 6 - Depreciation
19556 Product Segment 6 - SIC Code
19560 Product Segment 7 - Description
19561 Product Segment 7 - Sales
19562 Product Segment 7 - Operating Income
19563 Product Segment 7 - Assets
19564 Product Segment 7 - Capital Expenditures
19565 Product Segment 7 - Depreciation
19566 Product Segment 7 - SIC Code
19570 Product Segment 8 - Description
19571 Product Segment 8 - Sales
19572 Product Segment 8 - Operating Income
19573 Product Segment 8 - Assets

Industrial Companies Template
Issue 6
© Thomson Financial 2003-2007 58 Confidential Information of Thomson Financial
19574 Product Segment 8 - Capital Expenditures
19575 Product Segment 8 - Depreciation
19576 Product Segment 8 - SIC Code
19580 Product Segment 9 - Description
19581 Product Segment 9 - Sales
19582 Product Segment 9 - Operating Income
19583 Product Segment 9 - Assets
19584 Product Segment 9 - Capital Expenditures
19585 Product Segment 9 - Depreciation
19586 Product Segment 9 - SIC Codes
19590 Product Segment 10 - Description
19591 Product Segment 10 - Sales
19592 Product Segment 10 - Operating Income
19593 Product Segment 10 - Assets
19594 Product Segment 10 - Capital Expenditures
19595 Product Segment 10 - Depreciation
19596 Product Segment 10 - SIC Code
Major Shareholders 18370 Major Shareholders
Auditors 07800 Parent Auditor 1
07801 Parent Auditor 1 - Affiliate 1
07802 Parent Auditor 1 - Affiliate 2
07803 Parent Auditor 1 - Affiliate 3
07804 Parent Auditor 1 - Affiliate 4
07805 Parent Auditor 2
07806 Parent Auditor 2 - Affiliate 1
07807 Parent Auditor 2 - Affiliate 2
07808 Parent Auditor 2 - Affiliate 3
07809 Parent Auditor 2 - Affiliate 4
07810 Parent Auditor 3
07811 Parent Auditor 3 - Affiliate 1
07812 Parent Auditor 3 - Affiliate 2
07813 Parent Auditor 3 - Affiliate 3
07814 Parent Auditor 3 - Affiliate 4
07815 Parent Auditor 4
07816 Parent Auditor 4 - Affiliate 1
07817 Parent Auditor 4 - Affiliate 2
07818 Parent Auditor 4 - Affiliate 3
07819 Parent Auditor 4 - Affiliate 4
01801 Auditor Fees
Key Items in US Dollars 07211 Market Capitalization - Current
07210 Market Capitalization
07221 Common Equity - Current
07220 Common Equity
07230 Total Assets
07240 Net Sales or Revenues
07250 Net Income
Stock Data
Current Information 06005 Type of Share
05601 Ticker Symbol
06004 CUSIP
06006 SEDOL
06008 ISIN
06035 Worldscope Identifier
06105 Worldscope Permanent I.D.
06034 Disclosure Company Identifier
06038 I/B/E/S Ticker
06040 Dow Jones Company Symbol
11501 Indicator - Currently a Multiple Share Company
11519 Indicator – Limited Data Set Company

Industrial Companies Template
Issue 6
© Thomson Financial 2003-2007 59 Confidential Information of Thomson Financial
07016 Latest Annual Updated
07013 Year of Fast Update
07035 Latest Interim Date
05427 Stock Exchange(s) Listed
05661 Stock Index Information
11496 Indicator – ADR
05006 Market Price - Current
05009 Date of Current Price
05007 Market Price - Year to Date - High
05008 Market Price - Year to Date – Low
05091 Market Price – 52 Week High
05092 Market Price – 52 Week Low
08003 Market Capitalization (Public) - Current
08005 Market Capitalization - Current
05302 Common Shares Outstanding - Current
05306 Date of Common Shares
05450 Common/Ordinary Shareholders
05449 Date of Common/Ordinary Shareholders
05474 Closely Held Shares - Current
05473 Date of Closely Held Shares
05255 Earnings per Share - Last 12 Months
05256 Date of Last 12 Months EPS
05145 Dividends per Share - Last 12 Months
05190 Indicated Dividend Rate
05480 Book Value per Share - Current
05510 Cash Flow per Share - Current
Annual Statistics 05001 Market Price - Year End
05002 Market Price - High
05003 Market Price - Low
05004 Market Price - 5 yr avg - High
05005 Market Price - 5 yr avg - Low
08001 Market Capitalization
08004 Market Capitalization - Public
05651 Common Shares Traded - Annual #
08006 Trading Volume ($ Amount) #
08010 Trading Volume - Weekly Average #
08011 Turnover Rate #
05201 Earnings per Share
05210 Earnings per Share – Basic – Year
10010 Earnings per Share – Basic – Fiscal #
05290 Fully Diluted Earnings per Share
10030 Earnings per Share – Fully Diluted – Fiscal #
05202 Earnings per Share - Fiscal Year End
18193 Earnings per Share - As Reported
05200 Earnings Report Frequency
18208 Earnings per Share – Continuing Operations - Fiscal
18209 Earnings per Share Including Extraordinary Items - Fiscal
05230 Earnings per Share after Extraordinary Items
05225 Includes Extraordinary Credit/Charge per Share
05226 Extraordinary Credit/Charge per Share
05227 Includes Pre-tax Extraordinary Credit/Charge per Share
05228 Discontinued Operations per Share
18205 Discontinued Operations – Total – per Share
18202 Cumulative Effect of Accounting Change per Share
05240 DVFA Earnings (Germany)
05203 OVFA Earnings per Share (Austria)
05725 Headline Earnings per Share (U.K.)
05260 Earnings per Share - 5 yr avg
05101 Dividends per Share
05140 Dividends per Share - 5 yr avg
05110 Dividends per Share - Fiscal
05102 Dividends per Share - Gross
05100 Dividend Report Frequency
05476 Book Value per Share
05486 Tangible Book Value per Share

Industrial Companies Template
Issue 6
© Thomson Financial 2003-2007 60 Confidential Information of Thomson Financial
05491 Book Value – Outstanding Shares - Fiscal
05501 Cash Flow per Share
05502 Cash Flow per Share - Fiscal
05507 Free Cash Flow per Share
05503 Long Term Liabilities per Share
05508 Sales per Share
05509 Operating Profit per Share
18210 Restructuring Expense per Share
18211 Restructuring Expense per Share - Pre-tax
05506 Working Capital per Share
05505 Capital Expenditure per Share
18100 Enterprise Value
05301 Common Shares Outstanding
05326 Number of Shares Authorized
05303 Treasury Shares
05309 Par Value
05191 Common Shares Used to Calculate EPS
05192 Common Shares Used to Calculate Basic EPS
05194 Common Shares Used to Calculate Fully Diluted EPS
05475 Closely Held Shares
08021 Closely Held Shares %
05576 Stock Split/Dividend Ratio
05575 Stock Split/Dividend Ratio – Fiscal
Weekly Time Series 05652 Common Shares Traded – Weekly
05080 Market Price – Week Close
05081 Market Price – Week High
05082 Market Price – Week Low
Balance Sheet
Assets 02001 Cash & Short Term Investments
02003 Cash
02008 Short Term Investments
02051 Receivables (Net)
02101 Inventories -Total
02097 Raw Materials
02098 Work in Process
02099 Finished Goods
02100 Progress Payments & Other
02140 Prepaid Expenses
02149 Other Current Assets
02201 Current Assets - Total
02258 Long Term Receivables
02256 Investment in Associated Companies
02250 Other Investments
02501 Property Plant and Equipment – Net
02301 Property Plant and Equipment - Gross
18375 Land
18376 Buildings
18377 Machinery & Equipment
18378 Rental/Lease Property
18380 Transportation Equipment
18379 Property Plant & Equipment - Other
18381 Property Plant & Equipment under Capitalized Leases
02401 Accumulated Depreciation
18383 Accumulated Depreciation - Land
18384 Accumulated Depreciation - Buildings
18385 Accumulated Depreciation - Machinery & Equipment
18386 Accumulated Depreciation - Rental/Lease Property
18388 Accumulated Depreciation - Transportation Equipment
18387 Accumulated Depreciation – Other Property Plant & Equipment

Industrial Companies Template
Issue 6
© Thomson Financial 2003-2007 61 Confidential Information of Thomson Financial
18389 Accumulated Depreciation - P P & E under Capitalized Leases
02652 Other Assets
02647 Deferred Charges
02648 Tangible Other Assets
02649 Total Intangible Other Assets - Net
02999 Total Assets
Supplementary Asset fields 18214 Exchange Rate Used in Translating
Balance Sheet
02005 Cash & Equivalents - Generic
18297 Trade Receivables - Net
18298 Provision for Bad Debt
18165 Deferred Tax Asset – Current
18382 Computer Software and Equipment
18391 Accumulated Depreciation – Computer Software and Equipment
18390 Construction Work in Progress
18392 Accumulated Depreciation – Construction Work in Progress
18280 Goodwill/Cost in Excess of Assets Purchased
02502 Goodwill – Gross
02503 Goodwill – Accumulated Amortization
02504 Development Costs – Net
02505 Development Costs - Gross
02506 Development Costs – Accumulated Amortization
02507 Brands, Patents – Net
02509 Brands , Patents – Gross
02508 Brands, Patents – Accumulated Amortization
02510 Licenses. – Net
02511 Licenses – Gross
02512 Licenses – Accumulated Amortization
18299 Computer Software – Net
02516 Computer Software – Gross
02517 Computer Software – Accumulated Amortization
02513 Other Intangibles – Net
02514 Other Intangible Assets - Gross
02515 Other Intangible Assets – Accumulated Amortization
02654 Total Intangible Other Assets - Gross
02655 Total Intangible Other Assets – Accumulated Amortization
02653 Pension Assets – Long Term
02300 Total Assets - As Reported
Liabilities & Shareholders' Equity 03040 Accounts Payable
03051 Short Term Debt & Current Portion of Long Term Debt
03054 Accrued Payroll
03063 Income Taxes Payable
03061 Dividends Payable
03066 Other Current Liabilities
03101 Current Liabilities - Total
03251 Long Term Debt
03245 Long Term Debt Excluding Capitalized Leases
18281 Non Convertible Debt
18282 Convertible Debt
03249 Capitalized Lease Obligations
03260 Provision for Risks and Charges
03262 Deferred Income
03263 Deferred Taxes
18183 Deferred Taxes - Credit
18184 Deferred Taxes - Debit
03257 Deferred Tax Liability in Untaxed Reserves
03273 Other Liabilities
03351 Total Liabilities
03401 Non-Equity Reserves
03426 Minority Interest
03451 Preferred Stock
03448 Preferred Stock Issued for ESOP
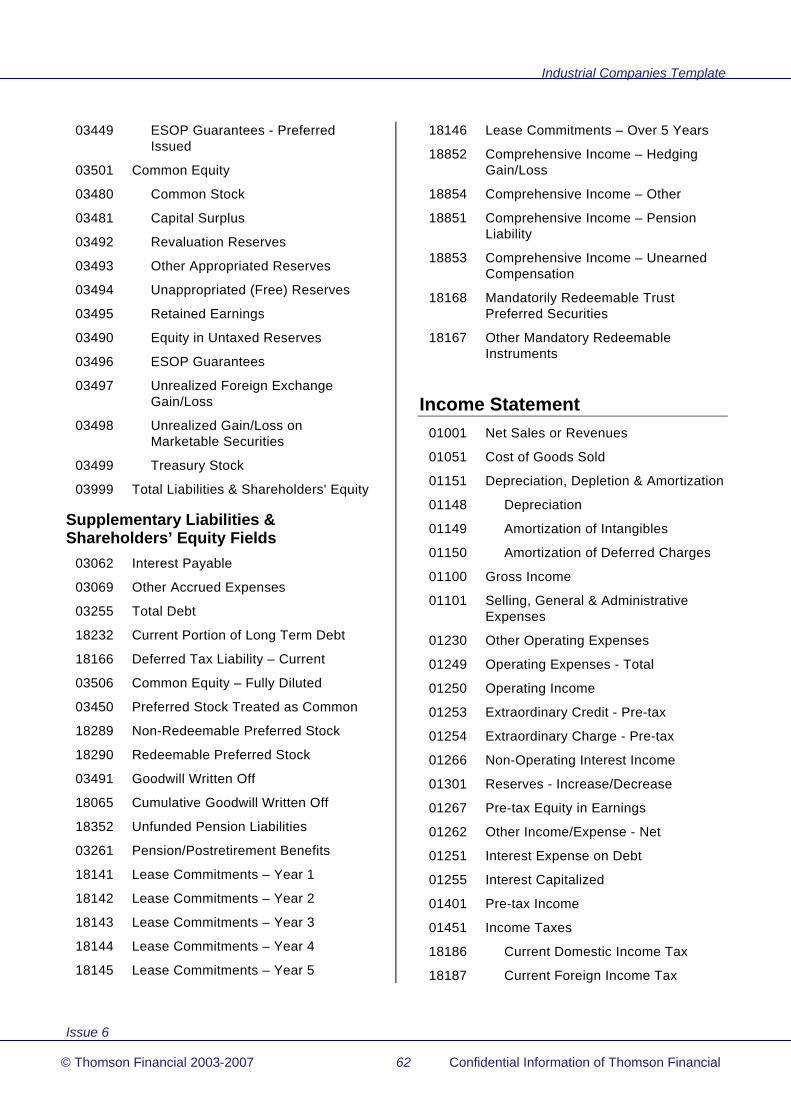
Industrial Companies Template
Issue 6
© Thomson Financial 2003-2007 62 Confidential Information of Thomson Financial
03449 ESOP Guarantees - Preferred Issued
03501 Common Equity
03480 Common Stock
03481 Capital Surplus
03492 Revaluation Reserves
03493 Other Appropriated Reserves
03494 Unappropriated (Free) Reserves
03495 Retained Earnings
03490 Equity in Untaxed Reserves
03496 ESOP Guarantees
03497 Unrealized Foreign Exchange Gain/Loss
03498 Unrealized Gain/Loss on Marketable Securities
03499 Treasury Stock
03999 Total Liabilities & Shareholders' Equity
Supplementary Liabilities & Shareholders’ Equity Fields
03062 Interest Payable
03069 Other Accrued Expenses
03255 Total Debt
18232 Current Portion of Long Term Debt
18166 Deferred Tax Liability – Current
03506 Common Equity – Fully Diluted
03450 Preferred Stock Treated as Common
18289 Non-Redeemable Preferred Stock
18290 Redeemable Preferred Stock
03491 Goodwill Written Off
18065 Cumulative Goodwill Written Off
18352 Unfunded Pension Liabilities
03261 Pension/Postretirement Benefits
18141 Lease Commitments – Year 1
18142 Lease Commitments – Year 2
18143 Lease Commitments – Year 3
18144 Lease Commitments – Year 4
18145 Lease Commitments – Year 5
18146 Lease Commitments – Over 5 Years
18852 Comprehensive Income – Hedging Gain/Loss
18854 Comprehensive Income – Other
18851 Comprehensive Income – Pension Liability
18853 Comprehensive Income – Unearned Compensation
18168 Mandatorily Redeemable Trust Preferred Securities
18167 Other Mandatory Redeemable Instruments
Income Statement 01001 Net Sales or Revenues
01051 Cost of Goods Sold
01151 Depreciation, Depletion & Amortization
01148 Depreciation
01149 Amortization of Intangibles
01150 Amortization of Deferred Charges
01100 Gross Income
01101 Selling, General & Administrative Expenses
01230 Other Operating Expenses
01249 Operating Expenses - Total
01250 Operating Income
01253 Extraordinary Credit - Pre-tax
01254 Extraordinary Charge - Pre-tax
01266 Non-Operating Interest Income
01301 Reserves - Increase/Decrease
01267 Pre-tax Equity in Earnings
01262 Other Income/Expense - Net
01251 Interest Expense on Debt
01255 Interest Capitalized
01401 Pre-tax Income
01451 Income Taxes
18186 Current Domestic Income Tax
18187 Current Foreign Income Tax
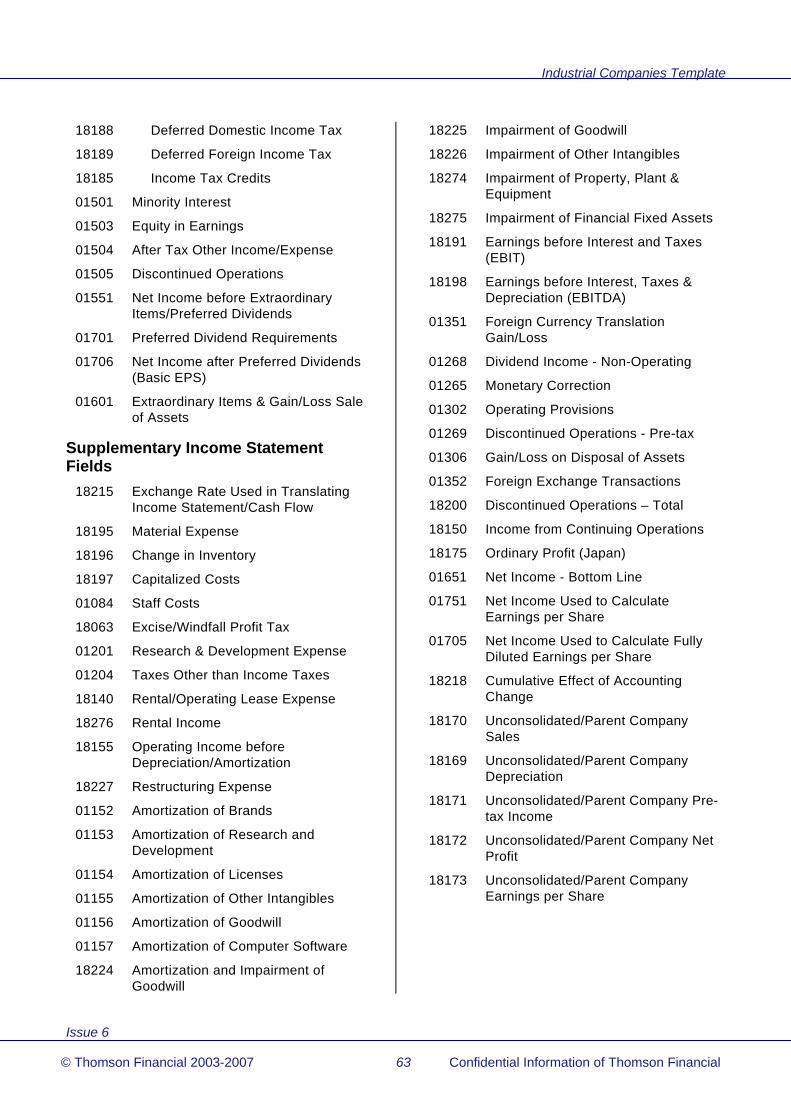
Industrial Companies Template
Issue 6
© Thomson Financial 2003-2007 63 Confidential Information of Thomson Financial
18188 Deferred Domestic Income Tax
18189 Deferred Foreign Income Tax
18185 Income Tax Credits
01501 Minority Interest
01503 Equity in Earnings
01504 After Tax Other Income/Expense
01505 Discontinued Operations
01551 Net Income before Extraordinary Items/Preferred Dividends
01701 Preferred Dividend Requirements
01706 Net Income after Preferred Dividends (Basic EPS)
01601 Extraordinary Items & Gain/Loss Sale of Assets
Supplementary Income Statement Fields
18215 Exchange Rate Used in Translating Income Statement/Cash Flow
18195 Material Expense
18196 Change in Inventory
18197 Capitalized Costs
01084 Staff Costs
18063 Excise/Windfall Profit Tax
01201 Research & Development Expense
01204 Taxes Other than Income Taxes
18140 Rental/Operating Lease Expense
18276 Rental Income
18155 Operating Income before Depreciation/Amortization
18227 Restructuring Expense
01152 Amortization of Brands
01153 Amortization of Research and Development
01154 Amortization of Licenses
01155 Amortization of Other Intangibles
01156 Amortization of Goodwill
01157 Amortization of Computer Software
18224 Amortization and Impairment of Goodwill
18225 Impairment of Goodwill
18226 Impairment of Other Intangibles
18274 Impairment of Property, Plant & Equipment
18275 Impairment of Financial Fixed Assets
18191 Earnings before Interest and Taxes (EBIT)
18198 Earnings before Interest, Taxes & Depreciation (EBITDA)
01351 Foreign Currency Translation Gain/Loss
01268 Dividend Income - Non-Operating
01265 Monetary Correction
01302 Operating Provisions
01269 Discontinued Operations - Pre-tax
01306 Gain/Loss on Disposal of Assets
01352 Foreign Exchange Transactions
18200 Discontinued Operations – Total
18150 Income from Continuing Operations
18175 Ordinary Profit (Japan)
01651 Net Income - Bottom Line
01751 Net Income Used to Calculate Earnings per Share
01705 Net Income Used to Calculate Fully Diluted Earnings per Share
18218 Cumulative Effect of Accounting Change
18170 Unconsolidated/Parent Company Sales
18169 Unconsolidated/Parent Company Depreciation
18171 Unconsolidated/Parent Company Pre-tax Income
18172 Unconsolidated/Parent Company Net Profit
18173 Unconsolidated/Parent Company Earnings per Share
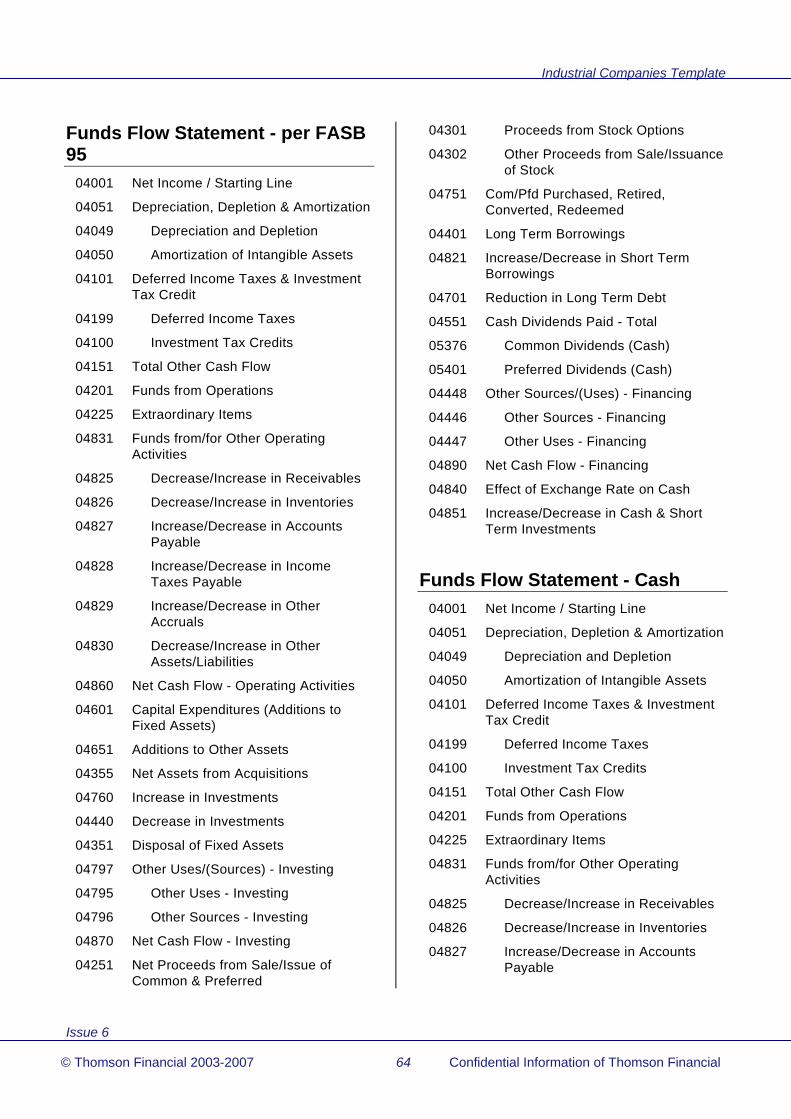
Industrial Companies Template
Issue 6
© Thomson Financial 2003-2007 64 Confidential Information of Thomson Financial
Funds Flow Statement - per FASB 95
04001 Net Income / Starting Line
04051 Depreciation, Depletion & Amortization
04049 Depreciation and Depletion
04050 Amortization of Intangible Assets
04101 Deferred Income Taxes & Investment Tax Credit
04199 Deferred Income Taxes
04100 Investment Tax Credits
04151 Total Other Cash Flow
04201 Funds from Operations
04225 Extraordinary Items
04831 Funds from/for Other Operating Activities
04825 Decrease/Increase in Receivables
04826 Decrease/Increase in Inventories
04827 Increase/Decrease in Accounts Payable
04828 Increase/Decrease in Income Taxes Payable
04829 Increase/Decrease in Other Accruals
04830 Decrease/Increase in Other Assets/Liabilities
04860 Net Cash Flow - Operating Activities
04601 Capital Expenditures (Additions to Fixed Assets)
04651 Additions to Other Assets
04355 Net Assets from Acquisitions
04760 Increase in Investments
04440 Decrease in Investments
04351 Disposal of Fixed Assets
04797 Other Uses/(Sources) - Investing
04795 Other Uses - Investing
04796 Other Sources - Investing
04870 Net Cash Flow - Investing
04251 Net Proceeds from Sale/Issue of Common & Preferred
04301 Proceeds from Stock Options
04302 Other Proceeds from Sale/Issuance of Stock
04751 Com/Pfd Purchased, Retired, Converted, Redeemed
04401 Long Term Borrowings
04821 Increase/Decrease in Short Term Borrowings
04701 Reduction in Long Term Debt
04551 Cash Dividends Paid - Total
05376 Common Dividends (Cash)
05401 Preferred Dividends (Cash)
04448 Other Sources/(Uses) - Financing
04446 Other Sources - Financing
04447 Other Uses - Financing
04890 Net Cash Flow - Financing
04840 Effect of Exchange Rate on Cash
04851 Increase/Decrease in Cash & Short Term Investments
Funds Flow Statement - Cash 04001 Net Income / Starting Line
04051 Depreciation, Depletion & Amortization
04049 Depreciation and Depletion
04050 Amortization of Intangible Assets
04101 Deferred Income Taxes & Investment Tax Credit
04199 Deferred Income Taxes
04100 Investment Tax Credits
04151 Total Other Cash Flow
04201 Funds from Operations
04225 Extraordinary Items
04831 Funds from/for Other Operating Activities
04825 Decrease/Increase in Receivables
04826 Decrease/Increase in Inventories
04827 Increase/Decrease in Accounts Payable

Industrial Companies Template
Issue 6
© Thomson Financial 2003-2007 65 Confidential Information of Thomson Financial
04828 Increase/Decrease in Income Taxes Payable
04829 Increase/Decrease in Other Accruals
04830 Decrease/Increase in Other Assets/Liabilities
04401 Long Term Borrowings
04251 Net Proceeds from Sale/Issue Common & Preferred
04301 Proceeds from Stock Options
04302 Other Proceeds from Sale/Issuance of Stock
04351 Disposal of Fixed Assets
04440 Decrease in Investments
04821 Increase/Decrease in Short Term Borrowings
04446 Other Sources - Financing
04796 Other Sources - Investing
04450 Other Sources
04551 Cash Dividends Paid - Total
05376 Common Dividends (Cash)
05401 Preferred Dividends (Cash)
04760 Increase in Investments
04701 Reduction in Long Term Debt
04601 Capital Expenditures (Additions to Fixed Assets)
04355 Net Assets from Acquisitions
04751 Com/Pfd Purchased, Retired, Converted, Redeemed
04651 Additions to Other Assets
04795 Other Uses - Investing
04447 Other Uses - Financing
04799 Other Uses
04840 Effect of Exchange Rate on Cash
04452 Changes in Cash and/or Liquid Items
04851 Increase/Decrease in Cash & Short Term Investments
Funds Flow Statement – Total Sources/Total Uses
Sources of Funds 04001 Net Income / Starting Line
04051 Depreciation, Depletion & Amortization
04049 Depreciation and Depletion
04050 Amortization of Intangible Assets
04101 Deferred Income Taxes & Investment Tax Credit
04199 Deferred Income Taxes
04100 Investment Tax Credits
04151 Total Other Cash Flow
04201 Funds from Operations
04225 Extraordinary Items
04831 Funds from/for Other Operating Activities
04825 Decrease/Increase in Receivables
04826 Decrease/Increase in Inventories
04827 Increase/Decrease in Accounts Payable
04828 Increase/Decrease in Income Taxes Payable
04829 Increase/Decrease in Other Accruals
04830 Decrease/Increase in Other Assets/Liabilities
04401 Long Term Borrowings
04251 Net Proceeds from Sale/Issue Common & Preferred
04301 Proceeds from Stock Options
04302 Other Proceeds from Sale/Issuance of Stock
04351 Disposal of Fixed Assets
04440 Decrease in Investments
04821 Increase/Decrease in Short Term Borrowings
04840 Effect of Exchange on Cash
04452 Changes in Cash and/or Liquid Items

Industrial Companies Template
Issue 6
© Thomson Financial 2003-2007 66 Confidential Information of Thomson Financial
04851 Increase/Decrease in Cash & Short Term Investments
04446 Other Sources - Financing
04796 Other Sources - Investing
04450 Other Sources
04501 Total Sources
Uses of Funds 04551 Cash Dividends Paid - Total
05376 Common Dividends (Cash)
05401 Preferred Dividends (Cash)
04601 Capital Expenditures (Additions to Fixed Assets)
04355 Net Assets from Acquisitions
04701 Reduction in Long Term Debt
04751 Com/Pfd Purchased, Retired, Converted, Redeemed
04651 Additions to Other Assets
04760 Increase in Investments
04795 Other Uses - Investing
04447 Other Uses - Financing
04799 Other Uses
04811 Total Uses
Supplementary Cash Flow Fields 04148 Interest Paid
04149 Interest Income
04150 Taxation
04500 External Financing
04900 Increase/Decrease in Working Capital
18216 Format Code – Cash Flow
04891 Net Cash from Continuing Operations
04892 Net Cash from Discontinued Operations
04052 Dividends
04053 Asset Disposal
04054 Discontinued Operations
04055 Minority Interest
04056 Equity In Earnings
04058 Unrealized Gains/Losses From Fair Value Adjustment Of Financial Assets
04057 Other Cash Flow
Pension & Postretirement 18842 Healthcare Data – Actual Return on
Plan Assets
18834 Healthcare Data – Accumulated Benefit Obligation
18838 Healthcare Data – Amortization of Prior Service Costs
18832 Healthcare Data – Discount Rate
18831 Healthcare Data – Expected Long-Term Return Rate on Pension Assets
18843 Healthcare Data – Expected Return on Plan Assets for the Period
18833 Healthcare Data – Fair Value of Plan Assets
18840 Healthcare Data – Gains (Losses) from Settlements
18839 Healthcare Data – Interest Cost
18836 Healthcare Data – Net Periodic Pension (Income)/Expense
18841 Healthcare Data – Other Net Periodic Pension (Income)/Expense
18837 Healthcare Data – Pension Service Costs
18835 Healthcare Data – Projected Benefit Obligation (PBO)
18830 Healthcare Data – Unfunded Healthcare Defined Benefits
18844 Healthcare Data – Unrecognized Prior Service Cost
18845 Healthcare - Unrecognized Net Actuarial Gain/Loss
18846 Healthcare - Other Adjustments To Funded Status For Net Pension/Post Retirement Assets/Liabilities
18847 Healthcare Net Liability/(Asset) – Balance Sheet
18808 Pension Data – Accumulated Benefit Obligation
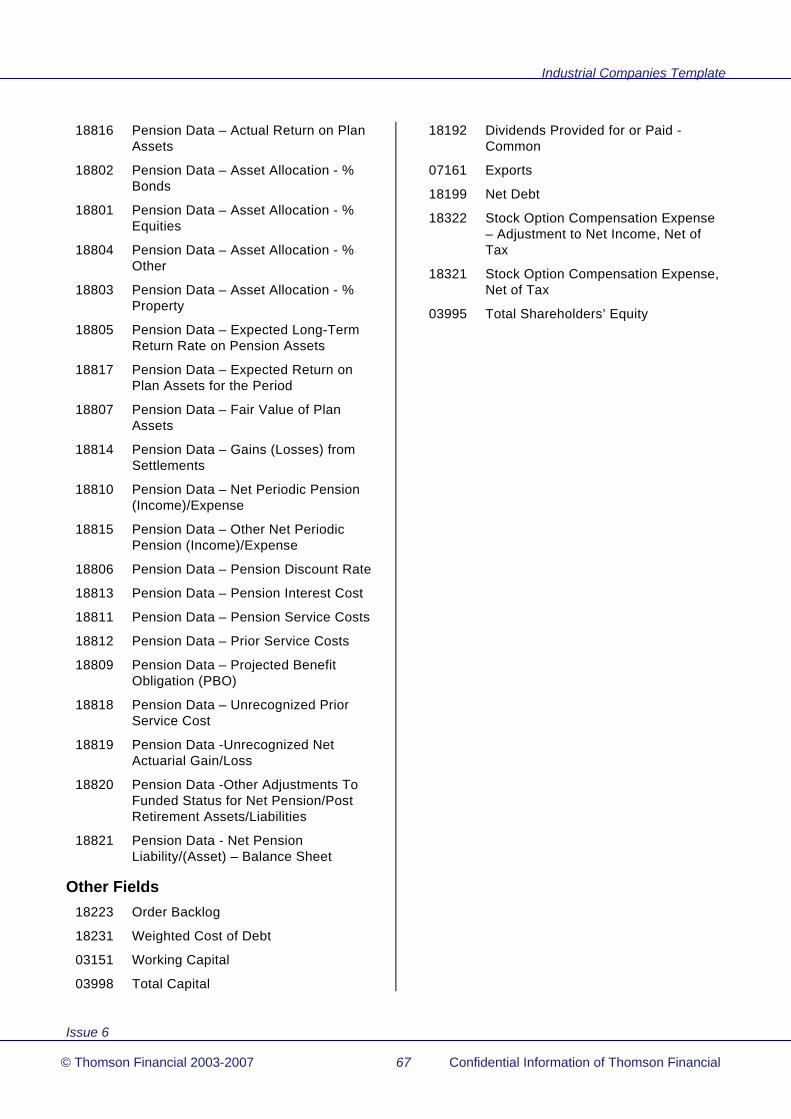
Industrial Companies Template
Issue 6
© Thomson Financial 2003-2007 67 Confidential Information of Thomson Financial
18816 Pension Data – Actual Return on Plan Assets
18802 Pension Data – Asset Allocation - % Bonds
18801 Pension Data – Asset Allocation - % Equities
18804 Pension Data – Asset Allocation - % Other
18803 Pension Data – Asset Allocation - % Property
18805 Pension Data – Expected Long-Term Return Rate on Pension Assets
18817 Pension Data – Expected Return on Plan Assets for the Period
18807 Pension Data – Fair Value of Plan Assets
18814 Pension Data – Gains (Losses) from Settlements
18810 Pension Data – Net Periodic Pension (Income)/Expense
18815 Pension Data – Other Net Periodic Pension (Income)/Expense
18806 Pension Data – Pension Discount Rate
18813 Pension Data – Pension Interest Cost
18811 Pension Data – Pension Service Costs
18812 Pension Data – Prior Service Costs
18809 Pension Data – Projected Benefit Obligation (PBO)
18818 Pension Data – Unrecognized Prior Service Cost
18819 Pension Data -Unrecognized Net Actuarial Gain/Loss
18820 Pension Data -Other Adjustments To Funded Status for Net Pension/Post Retirement Assets/Liabilities
18821 Pension Data - Net Pension Liability/(Asset) – Balance Sheet
Other Fields 18223 Order Backlog
18231 Weighted Cost of Debt
03151 Working Capital
03998 Total Capital
18192 Dividends Provided for or Paid - Common
07161 Exports
18199 Net Debt
18322 Stock Option Compensation Expense – Adjustment to Net Income, Net of Tax
18321 Stock Option Compensation Expense, Net of Tax
03995 Total Shareholders’ Equity

Industrial Companies Template
Issue 6
© Thomson Financial 2003-2007 68 Confidential Information of Thomson Financial
5 Year Summary Data
19760 Summary As Reported Year- Current Year
19761 Summary As Reported Revenue – Cur. Yr.
19762 Summary As Reported Net Inc. – Cur Yr
19763 Summary As Reported EPS Basic – Cur Yr
19764 Summary As Reported EPS Dil. – Cur Yr
19765 Summary As Reported Equity – Cur Yr
19766 Summary As Reported Year- -1 Year
19767 Summary As Reported Revenue – -1 Yr
19768 Summary As Reported Net Inc. – - 1 Yr
19769 Summary As Reported EPS Basic – -1 Yr
19770 Summary As Reported EPS Dil. – -1 Yr
19771 Summary As Reported Equity – -1 Yr
19772 Summary As Reported Year- -2 Year
19773 Summary As Reported Revenue – -2 Yr
19774 Summary As Reported Net Inc. – -2 Yr
19775 Summary As Reported EPS Basic – -2 Yr
19776 Summary As Reported EPS Dil. – -2 Yr
19777 Summary As Reported Equity – -2 Yr
19778 Summary As Reported Year- -3 Year
19779 Summary As Reported Revenue – -3Yr
19780 Summary As Reported Net Inc. – -3 Yr
19781 Summary As Reported EPS Basic – -3 Yr
19782 Summary As Reported EPS Dil. – -3 Yr
19783 Summary As Reported Equity – -3 Yr
19784 Summary As Reported Year- -4 Year
19785 Summary As Reported Revenue – -4Yr
19786 Summary As Reported Net Inc. – -4 Yr
19787 Summary As Reported EPS Basic – -4 Yr
19788 Summary As Reported EPS Dil. – -4 Yr
19789 Summary As Reported Equity – -4 Yr
Annual Series Interim Data
Qtr 1 Qtr 2 Qtr 3 Qtr 4
Interim Sales 19101 19102 19103 19104
Interim Pre-tax Income
19105 19106 19107 19108
Interim Net Profit
19109 19110 19111 19112
Number of Months-EPS
05217 05218 05219 05220
Earnings per Share
05221 05222 05223 05224
Earnings per Share – Basic
05211 05212 05213 05214
Fully Diluted EPS
05291 05292 05293 05294
EPS - Report Date
05901 05902 05903 05904
EPS - 12 Months
05251 05252 05253 05254
EPS - 5 yr avg
05261 05262 05263 05264
Dividends per Share
05121 05122 05123 05124
DPS – Gross 05125 05126 05127 05128
DPS - 05910 05911 05912 05913

Industrial Companies Template
Issue 6
© Thomson Financial 2003-2007 69 Confidential Information of Thomson Financial
Declared Date
DPS - Record Date
05917 05918 05919 05920
DPS - Ex-Div Date
05923 05924 05925 05926
DPS - Payable Date
05929 05930 05931 05932
DPS – Extra 05151 05152 05153 05154
DPS - Extra – Gross
05171 05172 05173 05174
DPS - Extra - Dec Date
05935 05936 05937 05938
DPS - Extra - Rec Date
05941 05942 05943 05944
DPS - Extra - Ex-Div Date
05947 05948 05949 05950
DPS - Extra - Pay Date
05953 05954 05955 05956
DPS - Special
05155 05156 05157 05158
DPS - Special - Gross05175
05176 05177 05178
DPS - Special - Dec Date
05965 05966 05968 05969
DPS - Special - Rec Date
05970 05971 05972 05973
DPS - Special - Ex-Div Date
05959 05960 05961 05962
DPS - Special - Payable Date
05976 05977 05978 05979
DPS - 12 Months
05131 05132 05133 05134
DPS - 5 yr avg
05141 05142 05143 05144
Monthly Price Information
Month End Market Price
High Price Low Price
January 05015 05016 05017
February 05020 05021 05022
March 05025 05026 05027
April 05030 05031 05032
May 05035 05036 05037
June 05040 05041 05042
July 05045 05046 05047
August 05050 05051 05052
September 05055 05056 05057
October 05060 05061 05062
November 05065 05066 05067
December 05070 05071 05072
Stock Performance
Current Information 09102 Price/Earnings Ratio - Current
09103 Price/Earnings Ratio - Current High
09105 Price/Earnings Ratio - Current Low
09202 Earnings Yield - Current
09203 Earnings Yield - Current High
09205 Earnings Yield - Current Low
09602 Price/Cash Flow - Current
09302 Price/Book Value Ratio - Current
09402 Dividend Yield - Current
08372 Return on Equity - per Share - Current
08652 Reinvestment Rate - per Share - Current
09502 Dividend Payout - per Share - Current
09001 Price Trend - Last Week
09005 Price Trend - Four Week
09011 Price Trend - Quarter to Date

Industrial Companies Template
Issue 6
© Thomson Financial 2003-2007 70 Confidential Information of Thomson Financial
09016 Price Trend - Previous Quarter
09021 Price Trend - Year to Date
09006 Price Trend - 13 Weeks
09007 Price Trend – 26 Weeks
09026 Price Trend - 52 Weeks
09802 Beta
09803 Alpha
Annual Statistics 09104 Price/Earnings Ratio - Close
09100 Price/Earnings Ratio - High
09101 Price/Earnings Ratio - Low
09106 Price/Earnings Ratio - Avg High-Low
09204 Earnings Yield - Close
09200 Earnings Yield - High
09201 Earnings Yield - Low
09206 Earnings Yield - Avg High-Low
09604 Price/Cash Flow Ratio
09404 Dividend Yield - Close
09400 Dividend Yield - High
09401 Dividend Yield - Low
09406 Dividend Yield - Avg High-Low
09504 Dividend Payout per Share
09304 Price/Book Value Ratio - Close
09300 Price/Book Value Ratio - High
09301 Price/Book Value Ratio - Low
09306 Price/Book Value Ratio - Avg High-Low
09904 Price/Sales per Share Ratio
08801 Total Investment Return
08806 Price Volatility
09704 Market Capitalization/Common Equity
Three Year Averages 08803 Total Investment Return
Five Year Averages
09121 Price/Earnings Ratio – Close
09111 Price/Earnings Ratio - High
09116 Price/Earnings Ratio - Low
09126 Price/Earnings Ratio - Avg High-Low
09221 Earnings Yield - Close
09211 Earnings Yield - High
09216 Earnings Yield - Low
09226 Earnings Yield - Avg High-Low
09621 Price/Cash Flow Ratio
09421 Dividend Yield - Close
09411 Dividend Yield - High
09416 Dividend Yield - Low
09426 Dividend Yield - Avg High-Low
09521 Dividend Payout per Share
09321 Price/Book Value Ratio - Close
09311 Price/Book Value Ratio - High
09316 Price/Book Value Ratio - Low
09326 Price/Book Value Ratio - Avg High-Low
08805 Total Investment Return
09721 Market Capitalization/Common Equity
Growth Rates
Annual Statistics 08631 Net Sales/Revenues Growth
08646 Operating Income Growth
08636 Net Income Growth
08621 Total Assets Growth
08616 Equity Growth
08626 Employees Growth
08601 Earnings per Share Growth
08611 Dividends per Share Growth
08606 Book Value per Share Growth
08676 Net Margin Growth
08579 Market Capitalization Growth
08816 Earnings Per Share Fiscal Growth
08821 Book Value Per Share Fiscal Growth
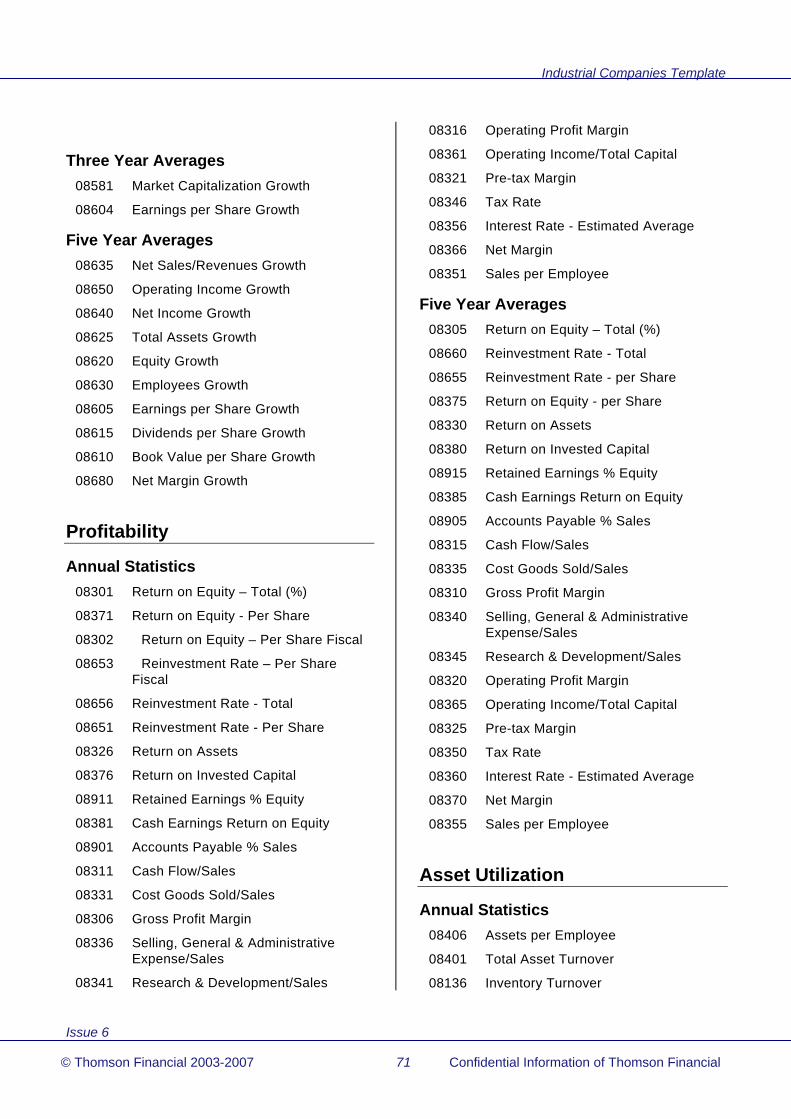
Industrial Companies Template
Issue 6
© Thomson Financial 2003-2007 71 Confidential Information of Thomson Financial
Three Year Averages 08581 Market Capitalization Growth
08604 Earnings per Share Growth
Five Year Averages 08635 Net Sales/Revenues Growth
08650 Operating Income Growth
08640 Net Income Growth
08625 Total Assets Growth
08620 Equity Growth
08630 Employees Growth
08605 Earnings per Share Growth
08615 Dividends per Share Growth
08610 Book Value per Share Growth
08680 Net Margin Growth
Profitability
Annual Statistics 08301 Return on Equity – Total (%)
08371 Return on Equity - Per Share
08302 Return on Equity – Per Share Fiscal
08653 Reinvestment Rate – Per Share Fiscal
08656 Reinvestment Rate - Total
08651 Reinvestment Rate - Per Share
08326 Return on Assets
08376 Return on Invested Capital
08911 Retained Earnings % Equity
08381 Cash Earnings Return on Equity
08901 Accounts Payable % Sales
08311 Cash Flow/Sales
08331 Cost Goods Sold/Sales
08306 Gross Profit Margin
08336 Selling, General & Administrative Expense/Sales
08341 Research & Development/Sales
08316 Operating Profit Margin
08361 Operating Income/Total Capital
08321 Pre-tax Margin
08346 Tax Rate
08356 Interest Rate - Estimated Average
08366 Net Margin
08351 Sales per Employee
Five Year Averages 08305 Return on Equity – Total (%)
08660 Reinvestment Rate - Total
08655 Reinvestment Rate - per Share
08375 Return on Equity - per Share
08330 Return on Assets
08380 Return on Invested Capital
08915 Retained Earnings % Equity
08385 Cash Earnings Return on Equity
08905 Accounts Payable % Sales
08315 Cash Flow/Sales
08335 Cost Goods Sold/Sales
08310 Gross Profit Margin
08340 Selling, General & Administrative Expense/Sales
08345 Research & Development/Sales
08320 Operating Profit Margin
08365 Operating Income/Total Capital
08325 Pre-tax Margin
08350 Tax Rate
08360 Interest Rate - Estimated Average
08370 Net Margin
08355 Sales per Employee
Asset Utilization
Annual Statistics 08406 Assets per Employee
08401 Total Asset Turnover
08136 Inventory Turnover

Industrial Companies Template
Issue 6
© Thomson Financial 2003-2007 72 Confidential Information of Thomson Financial
08431 Net Sales to Gross Fixed Asset
08141 Net Sales % Working Capital
08411 Capital Expenditure % Gross Fixed Assets
08416 Capital Expenditure % Total Assets
08421 Capital Expenditure % Sales
08426 Accumulated Depreciation % Gross Fixed Assets
Five Year Averages 08410 Assets per Employee
08405 Total Asset Turnover
08140 Inventory Turnover
08435 Net Sales to Gross Fixed Asset
08145 Net Sales % Working Capital
08415 Capital Expenditure % Gross Fixed Assets
08420 Capital Expenditure % Total Assets
08425 Capital Expenditure % Sales
08430 Accumulated Depreciation % Gross Fixed Assets
Leverage
Annual Statistics 08231 Total Debt % Common Equity
08226 Long Term Debt % Common Equity
08211 Minority Interest % Total Capital
08221 Total Debt % Total Capital
08216 Long Term Debt % Total Capital
08201 Equity % Total Capital
08206 Preferred Stock % Total Capital
08236 Total Debt % Total Assets
08241 Common Equity % Total Assets
08287 Total Assets / Common Equity Ratio
15121 Total Capital % Assets
08251 Fixed Charge Coverage Ratio
08256 Dividend Payout (% Earnings) - Total Dollar
08906 Cash Dividends % Cash Flow
08246 Cash Dividend Coverage Ratio
08261 Operating Cash/Fixed Charges
08266 Fixed Assets % Common Equity
08291 EBIT / Total Interest Expense Ratio
08271 Working Capital % Total Capital
Five Year Averages 08235 Total Debt % Common Equity
08230 Long Term Debt % Common Equity
08215 Minority Interest % Total Capital
08225 Total Debt % Total Capital
08220 Long Term Debt % Total Capital
08205 Equity % Total Capital
08210 Preferred Stock % Total Capital
08240 Total Debt % Total Assets
08245 Common Equity % Total Assets
15124 Total Capital % Assets
08255 Fixed Charge Coverage Ratio
08260 Dividend Payout (% Earnings) - Total Dollar
08910 Cash Dividends % Cash Flow
08250 Cash Dividend Coverage Ratio
08265 Operating Cash/Fixed Charges
08270 Fixed Assets % Common Equity
08275 Working Capital % Total Capital
Liquidity
Annual Statistics 08101 Quick Ratio
08106 Current Ratio
08111 Cash & Equivalents % Total Current Assets
08121 Receivables % Total Current Assets
08116 Inventories % Total Current Assets
08131 Accounts Receivables Days
08126 Inventories - Days Held

Industrial Companies Template
Issue 6
© Thomson Financial 2003-2007 73 Confidential Information of Thomson Financial
Five Year Averages 08105 Quick Ratio
08110 Current Ratio
08115 Cash & Equivalents % Total Current Assets
08125 Receivables % Total Current Assets
08120 Inventories % Total Current Assets
08135 Accounts Receivables Days
08130 Inventories - Days Held
Foreign Business
Annual Statistics 07151 International Assets
07101 International Sales
07126 International Operating Income
08711 Foreign Return on Assets
08706 Foreign Asset Turnover
08701 Foreign Income Margin
08716 Foreign Assets Growth
08721 Foreign Sales Growth
08726 Foreign Income Growth
08736 Foreign Assets % Total Assets
08731 Foreign Sales % Total Sales
08741 Foreign Income % Total Income
Five Year Averages 08715 Foreign Return on Assets
08710 Foreign Asset Turnover
08705 Foreign Income Margin
08720 Foreign Assets Growth
08725 Foreign Sales Growth
08730 Foreign Income Growth
08740 Foreign Assets % Total Assets
08735 Foreign Sales % Total Sales
08745 Foreign Income % Total Income
Geographic Segment Data 19600 Geographic Segment 1 - Description
19601 Geographic Segment 1 - Sales
19602 Geographic Segment 1 - Operating Income
19603 Geographic Segment 1 - Assets
19604 Geographic Segment 1 - Capital Expenditures
19605 Geographic Segment 1 - Depreciation
19610 Geographic Segment 2 - Description
19611 Geographic Segment 2 - Sales
19612 Geographic Segment 2 - Operating Income
19613 Geographic Segment 2 - Assets
19614 Geographic Segment 2 - Capital Expenditures
19615 Geographic Segment 2 - Depreciation
19620 Geographic Segment 3 - Description
19621 Geographic Segment 3 - Sales
19622 Geographic Segment 3 - Operating Income
19623 Geographic Segment 3 - Assets
19624 Geographic Segment 3 - Capital Expenditures
19625 Geographic Segment 3 - Depreciation
19630 Geographic Segment 4 - Description
19631 Geographic Segment 4 - Sales
19632 Geographic Segment 4 - Operating Income
19633 Geographic Segment 4 - Assets
19634 Geographic Segment 4 - Capital Expenditures
19635 Geographic Segment 4 - Depreciation
19640 Geographic Segment 5 - Description
19641 Geographic Segment 5 - Sales
19642 Geographic Segment 5 - Operating Income
19643 Geographic Segment 5 - Assets

Industrial Companies Template
Issue 6
© Thomson Financial 2003-2007 74 Confidential Information of Thomson Financial
19644 Geographic Segment 5 - Capital Expenditures
19645 Geographic Segment 5 - Depreciation
19650 Geographic Segment 6 - Description
19651 Geographic Segment 6 - Sales
19652 Geographic Segment 6 - Operating Income
19653 Geographic Segment 6 - Assets
19654 Geographic Segment 6 - Capital Expenditures
19655 Geographic Segment 6 - Depreciation
19660 Geographic Segment 7 - Description
19661 Geographic Segment 7 - Sales
19662 Geographic Segment 7 - Operating Income
19663 Geographic Segment 7 - Assets
19664 Geographic Segment 7 - Capital Expenditures
19665 Geographic Segment 7 - Depreciation
19670 Geographic Segment 8 - Description
19671 Geographic Segment 8 - Sales
19672 Geographic Segment 8 - Operating Income
19673 Geographic Segment 8 - Assets
19674 Geographic Segment 8 - Capital Expenditures
19675 Geographic Segment 8 - Depreciation
19680 Geographic Segment 9 - Description
19681 Geographic Segment 9 - Sales
19682 Geographic Segment 9 - Operating Income
19683 Geographic Segment 9 - Assets
19684 Geographic Segment 9 - Capital Expenditures
19685 Geographic Segment 9 - Depreciation
19690 Geographic Segment 10 - Description
19691 Geographic Segment 10 - Sales
19692 Geographic Segment 10 - Operating Income
19693 Geographic Segment 10 - Assets
19694 Geographic Segment 10 – Capital Expenditures
19695 Geographic Segment 10 - Depreciation
Company Specific Accounting Practices
07531 Accounting method for long term investment > 50%
07536 Accounting standards followed
07546 Auditors' opinion
Multiple Share Data 20001 Type of Share - Mult Share 1
20003 Worldscope Identifier - Mult Share 1
20005 SEDOL - Mult Share 1
20006 CUSIP - Mult Share 1
20007 ISIN - Mult Share 1
20008 Ticker Symbol - Mult Share 1
20009 Stock Exchange(s) Listed - Mult Share 1
20011 Inactive Date - Mult Share 1
20020 Common Shares Outstanding - Current - Mult Share 1
20021 Market Price - Current - Mult Share 1
20022 Date of Current Price - Mult Share 1
20023 Market Capitalization - Current - Mult Share 1
20024 Earnings per Share - Last 12 Mos - Mult Share 1
20025 Dividends per Share - Last 12 Mos - Mult Share 1
20026 Price/Earnings Ratio - Current - Mult Share 1
20027 Price/Book Value Ratio - Current - Mult Share 1
20028 Dividend Yield - Current - Mult Share 1
20040 Common Shares Outstanding - Mult Share 1
20002 Par Value - Mult Share 1
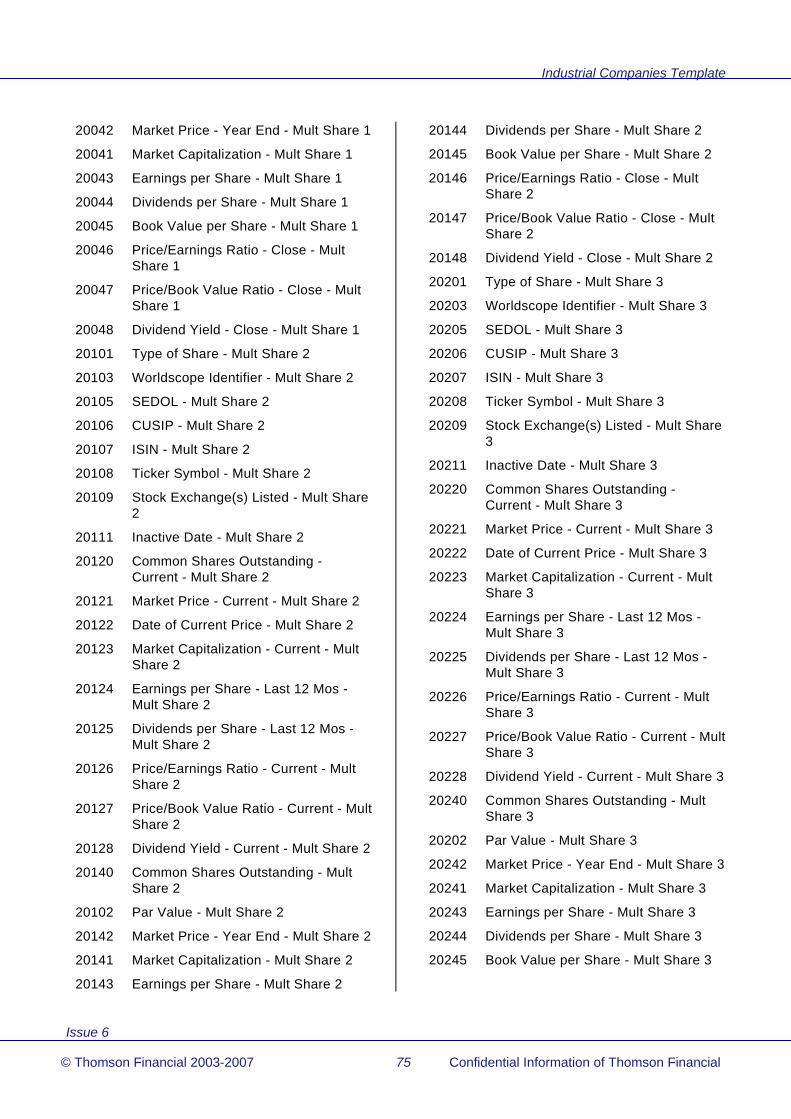
Industrial Companies Template
Issue 6
© Thomson Financial 2003-2007 75 Confidential Information of Thomson Financial
20042 Market Price - Year End - Mult Share 1
20041 Market Capitalization - Mult Share 1
20043 Earnings per Share - Mult Share 1
20044 Dividends per Share - Mult Share 1
20045 Book Value per Share - Mult Share 1
20046 Price/Earnings Ratio - Close - Mult Share 1
20047 Price/Book Value Ratio - Close - Mult Share 1
20048 Dividend Yield - Close - Mult Share 1
20101 Type of Share - Mult Share 2
20103 Worldscope Identifier - Mult Share 2
20105 SEDOL - Mult Share 2
20106 CUSIP - Mult Share 2
20107 ISIN - Mult Share 2
20108 Ticker Symbol - Mult Share 2
20109 Stock Exchange(s) Listed - Mult Share 2
20111 Inactive Date - Mult Share 2
20120 Common Shares Outstanding - Current - Mult Share 2
20121 Market Price - Current - Mult Share 2
20122 Date of Current Price - Mult Share 2
20123 Market Capitalization - Current - Mult Share 2
20124 Earnings per Share - Last 12 Mos - Mult Share 2
20125 Dividends per Share - Last 12 Mos - Mult Share 2
20126 Price/Earnings Ratio - Current - Mult Share 2
20127 Price/Book Value Ratio - Current - Mult Share 2
20128 Dividend Yield - Current - Mult Share 2
20140 Common Shares Outstanding - Mult Share 2
20102 Par Value - Mult Share 2
20142 Market Price - Year End - Mult Share 2
20141 Market Capitalization - Mult Share 2
20143 Earnings per Share - Mult Share 2
20144 Dividends per Share - Mult Share 2
20145 Book Value per Share - Mult Share 2
20146 Price/Earnings Ratio - Close - Mult Share 2
20147 Price/Book Value Ratio - Close - Mult Share 2
20148 Dividend Yield - Close - Mult Share 2
20201 Type of Share - Mult Share 3
20203 Worldscope Identifier - Mult Share 3
20205 SEDOL - Mult Share 3
20206 CUSIP - Mult Share 3
20207 ISIN - Mult Share 3
20208 Ticker Symbol - Mult Share 3
20209 Stock Exchange(s) Listed - Mult Share 3
20211 Inactive Date - Mult Share 3
20220 Common Shares Outstanding - Current - Mult Share 3
20221 Market Price - Current - Mult Share 3
20222 Date of Current Price - Mult Share 3
20223 Market Capitalization - Current - Mult Share 3
20224 Earnings per Share - Last 12 Mos - Mult Share 3
20225 Dividends per Share - Last 12 Mos - Mult Share 3
20226 Price/Earnings Ratio - Current - Mult Share 3
20227 Price/Book Value Ratio - Current - Mult Share 3
20228 Dividend Yield - Current - Mult Share 3
20240 Common Shares Outstanding - Mult Share 3
20202 Par Value - Mult Share 3
20242 Market Price - Year End - Mult Share 3
20241 Market Capitalization - Mult Share 3
20243 Earnings per Share - Mult Share 3
20244 Dividends per Share - Mult Share 3
20245 Book Value per Share - Mult Share 3

Industrial Companies Template
Issue 6
© Thomson Financial 2003-2007 76 Confidential Information of Thomson Financial
20246 Price/Earnings Ratio - Close - Mult Share 3
20247 Price/Book Value Ratio - Close - Mult Share 3
20248 Dividend Yield - Close - Mult Share 3
20301 Type of Share - Mult Share 4
20303 Worldscope Identifier - Mult Share 4
20305 SEDOL - Mult Share 4
20306 CUSIP - Mult Share 4
20307 ISIN - Mult Share 4
20308 Ticker Symbol - Mult Share 4
20309 Stock Exchange(s) Listed - Mult Share 4
20311 Inactive Date - Mult Share 4
20320 Common Shares Outstanding - Current - Mult Share 4
20321 Market Price - Current - Mult Share 4
20322 Date of Current Price - Mult Share 4
20323 Market Capitalization - Current - Mult Share 4
20324 Earnings per Share - Last 12 Mos - Mult Share 4
20325 Dividends per Share - Last 12 Mos - Mult Share 4
20326 Price/Earnings Ratio - Current - Mult Share 4
20327 Price/Book Value Ratio - Current - Mult Share 4
20328 Dividend Yield - Current - Mult Share 4
20340 Common Shares Outstanding - Mult Share 4
20302 Par Value - Mult Share 4
20342 Market Price - Year End - Mult Share 4
20341 Market Capitalization - Mult Share 4
20343 Earnings per Share - Mult Share 4
20344 Dividends per Share - Mult Share 4
20345 Book Value per Share - Mult Share 4
20346 Price/Earnings Ratio - Close - Mult Share 4
20347 Price/Book Value Ratio - Close - Mult Share 4
20348 Dividend Yield - Close - Mult Share 4
20401 Type of Share - Mult Share 5
20403 Worldscope Identifier - Mult Share 5
20405 SEDOL - Mult Share 5
20406 CUSIP - Mult Share 5
20407 ISIN - Mult Share 5
20408 Ticker Symbol - Mult Share 5
20409 Stock Exchange(s) Listed - Mult Share 5
20411 Inactive Date - Mult Share 5
20420 Common Shares Outstanding - Current - Mult Share 5
20421 Market Price - Current - Mult Share 5
20422 Date of Current Price - Mult Share 5
20423 Market Capitalization - Current - Mult Share 5
20424 Earnings per Share - Last 12 Mos - Mult Share 5
20425 Dividends per Share - Last 12 Mos - Mult Share 5
20426 Price/Earnings Ratio - Current - Mult Share 5 20427 Price/Book Value Ratio - Current - Mult Share 5
20428 Dividend Yield - Current - Mult Share 5
20440 Common Shares Outstanding - Mult Share 5
20402 Par Value - Mult Share 5
20442 Market Price - Year End - Mult Share 5
20441 Market Capitalization - Mult Share 5
20443 Earnings per Share - Mult Share 5
20444 Dividends per Share - Mult Share 5
20445 Book Value per Share - Mult Share 5
20446 Price/Earnings Ratio - Close - Mult Share 5
20447 Price/Book Value Ratio - Close - Mult Share 5
20448 Dividend Yield - Close - Mult Share 5
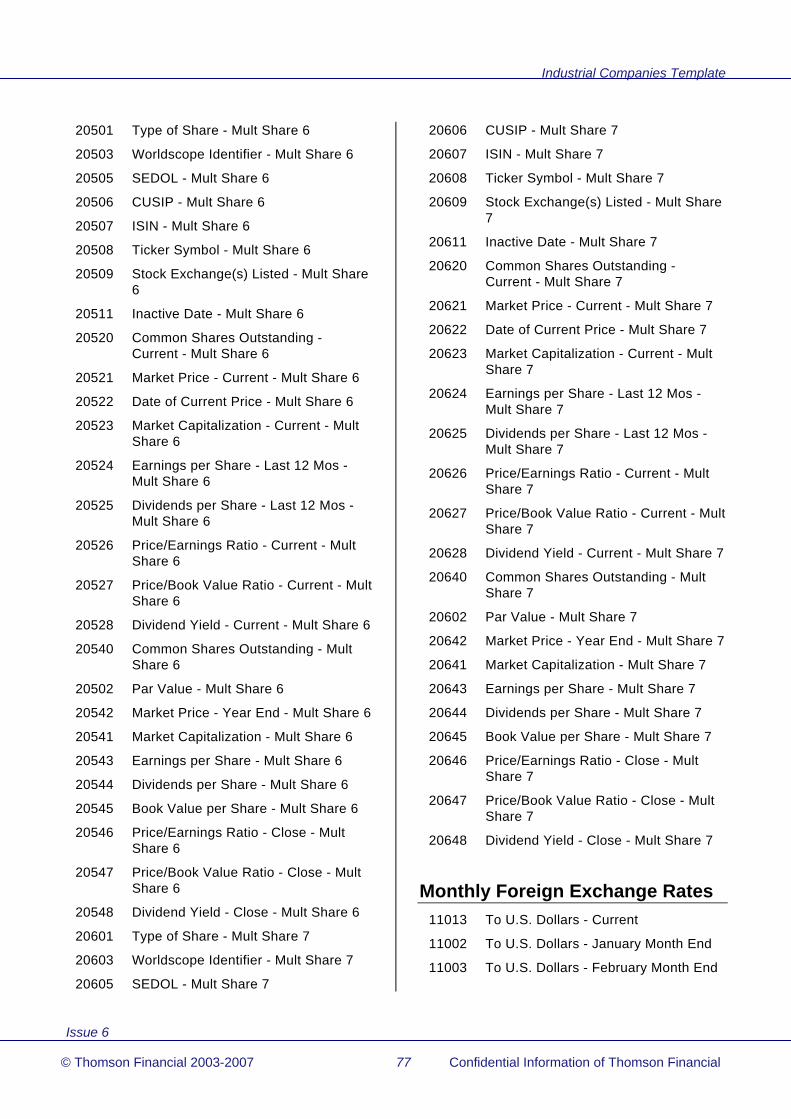
Industrial Companies Template
Issue 6
© Thomson Financial 2003-2007 77 Confidential Information of Thomson Financial
20501 Type of Share - Mult Share 6
20503 Worldscope Identifier - Mult Share 6
20505 SEDOL - Mult Share 6
20506 CUSIP - Mult Share 6
20507 ISIN - Mult Share 6
20508 Ticker Symbol - Mult Share 6
20509 Stock Exchange(s) Listed - Mult Share 6
20511 Inactive Date - Mult Share 6
20520 Common Shares Outstanding - Current - Mult Share 6
20521 Market Price - Current - Mult Share 6
20522 Date of Current Price - Mult Share 6
20523 Market Capitalization - Current - Mult Share 6
20524 Earnings per Share - Last 12 Mos - Mult Share 6
20525 Dividends per Share - Last 12 Mos - Mult Share 6
20526 Price/Earnings Ratio - Current - Mult Share 6
20527 Price/Book Value Ratio - Current - Mult Share 6
20528 Dividend Yield - Current - Mult Share 6
20540 Common Shares Outstanding - Mult Share 6
20502 Par Value - Mult Share 6
20542 Market Price - Year End - Mult Share 6
20541 Market Capitalization - Mult Share 6
20543 Earnings per Share - Mult Share 6
20544 Dividends per Share - Mult Share 6
20545 Book Value per Share - Mult Share 6
20546 Price/Earnings Ratio - Close - Mult Share 6
20547 Price/Book Value Ratio - Close - Mult Share 6
20548 Dividend Yield - Close - Mult Share 6
20601 Type of Share - Mult Share 7
20603 Worldscope Identifier - Mult Share 7
20605 SEDOL - Mult Share 7
20606 CUSIP - Mult Share 7
20607 ISIN - Mult Share 7
20608 Ticker Symbol - Mult Share 7
20609 Stock Exchange(s) Listed - Mult Share 7
20611 Inactive Date - Mult Share 7
20620 Common Shares Outstanding - Current - Mult Share 7
20621 Market Price - Current - Mult Share 7
20622 Date of Current Price - Mult Share 7
20623 Market Capitalization - Current - Mult Share 7
20624 Earnings per Share - Last 12 Mos - Mult Share 7
20625 Dividends per Share - Last 12 Mos - Mult Share 7
20626 Price/Earnings Ratio - Current - Mult Share 7
20627 Price/Book Value Ratio - Current - Mult Share 7
20628 Dividend Yield - Current - Mult Share 7
20640 Common Shares Outstanding - Mult Share 7
20602 Par Value - Mult Share 7
20642 Market Price - Year End - Mult Share 7
20641 Market Capitalization - Mult Share 7
20643 Earnings per Share - Mult Share 7
20644 Dividends per Share - Mult Share 7
20645 Book Value per Share - Mult Share 7
20646 Price/Earnings Ratio - Close - Mult Share 7
20647 Price/Book Value Ratio - Close - Mult Share 7
20648 Dividend Yield - Close - Mult Share 7
Monthly Foreign Exchange Rates 11013 To U.S. Dollars - Current
11002 To U.S. Dollars - January Month End
11003 To U.S. Dollars - February Month End

Industrial Companies Template
Issue 6
© Thomson Financial 2003-2007 78 Confidential Information of Thomson Financial
11004 To U.S. Dollars - March Month End
11005 To U.S. Dollars - April Month End
11006 To U.S. Dollars - May Month End
11007 To U.S. Dollars - June Month End
11008 To U.S. Dollars - July Month End
11009 To U.S. Dollars - August Month End
11010 To U.S. Dollars - September Month End
11011 To U.S. Dollars - October Month End
11012 To U.S. Dollars - November Month End
11001 To U.S. Dollars - December Month End
11113 From Euro Currency to Legacy/Local – Current
11102 From Euro Currency to Legacy/Local – January
11103 From Euro Currency to Legacy/Local – February
11104 From Euro Currency to Legacy/Local – March
11105 From Euro Currency to Legacy/Local – April
11106 From Euro Currency to Legacy/Local – May
11107 From Euro Currency to Legacy/Local – June
11108 From Euro Currency to Legacy/Local – July
11109 From Euro Currency to Legacy/Local – August
11110 From Euro Currency to Legacy/Local – September
11111 From Euro Currency to Legacy/Local – October
11112 From Euro Currency to Legacy/Local – November
11101 From Euro Currency to Legacy/Local – Year End
11202 From ECU Currency to Local – January
11203 From ECU Currency to Local – February
11204 From ECU Currency to Local – March
11205 From ECU Currency to Local – April
11206 From ECU Currency to Local – May
11207 From ECU Currency to Local – June
11208 From ECU Currency to Local – July
11209 From ECU Currency to Local – August
11210 From ECU Currency to Local – September
11211 From ECU Currency to Local – October
11212 From ECU Currency to Local – November
11201 From ECU Currency to Local – Year End
11313 Legacy to U.S. Currency – Current
11302 Legacy to U.S. Currency – January
11303 Legacy to U.S. Currency – February
11304 Legacy to U.S. Currency – March
11305 Legacy to U.S. Currency – April
11306 Legacy to U.S. Currency – May
11307 Legacy to U.S. Currency – June
11308 Legacy to U.S. Currency – July
11309 Legacy to U.S. Currency – August
11310 Legacy to U.S. Currency – September
11311 Legacy to U.S. Currency – October
11312 Legacy to U.S. Currency – November
11301 Legacy to U.S. Currency – Year End
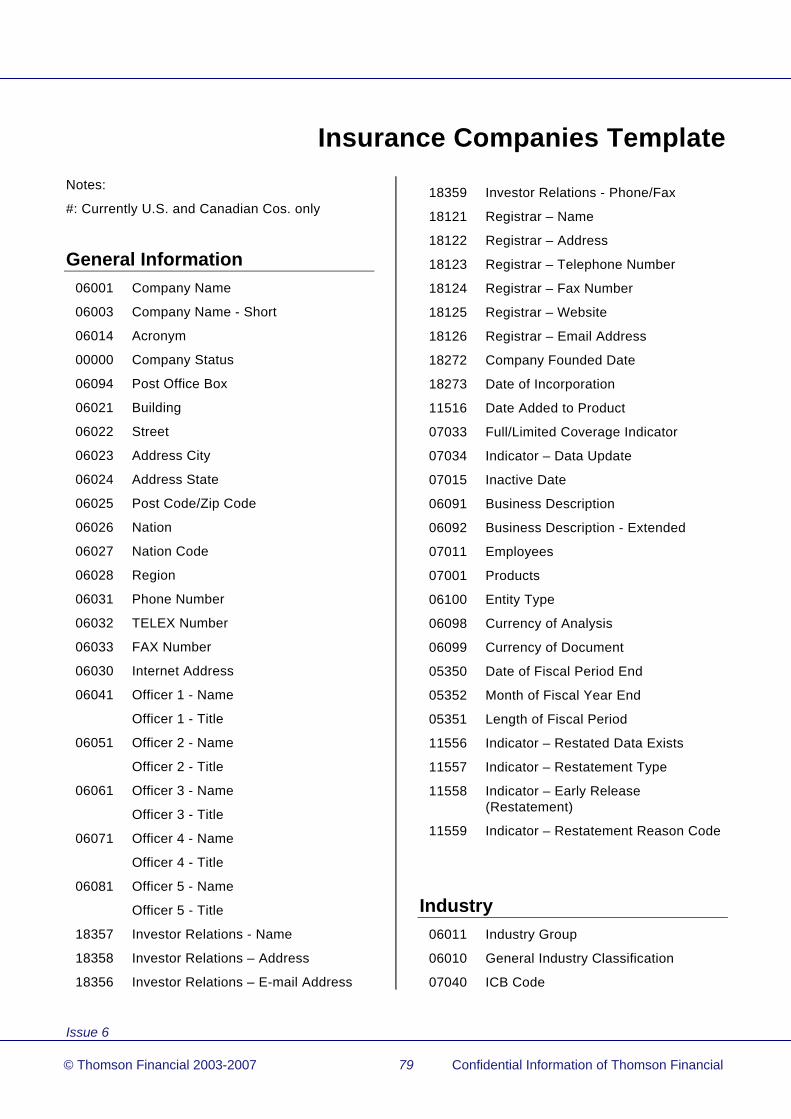
Issue 6
© Thomson Financial 2003-2007 79 Confidential Information of Thomson Financial
Insurance Companies TemplateNotes:
#: Currently U.S. and Canadian Cos. only
General Information 06001 Company Name
06003 Company Name - Short
06014 Acronym
00000 Company Status
06094 Post Office Box
06021 Building
06022 Street
06023 Address City
06024 Address State
06025 Post Code/Zip Code
06026 Nation
06027 Nation Code
06028 Region
06031 Phone Number
06032 TELEX Number
06033 FAX Number
06030 Internet Address
06041 Officer 1 - Name
Officer 1 - Title
06051 Officer 2 - Name
Officer 2 - Title
06061 Officer 3 - Name
Officer 3 - Title
06071 Officer 4 - Name
Officer 4 - Title
06081 Officer 5 - Name
Officer 5 - Title
18357 Investor Relations - Name
18358 Investor Relations – Address
18356 Investor Relations – E-mail Address
18359 Investor Relations - Phone/Fax
18121 Registrar – Name
18122 Registrar – Address
18123 Registrar – Telephone Number
18124 Registrar – Fax Number
18125 Registrar – Website
18126 Registrar – Email Address
18272 Company Founded Date
18273 Date of Incorporation
11516 Date Added to Product
07033 Full/Limited Coverage Indicator
07034 Indicator – Data Update
07015 Inactive Date
06091 Business Description
06092 Business Description - Extended
07011 Employees
07001 Products
06100 Entity Type
06098 Currency of Analysis
06099 Currency of Document
05350 Date of Fiscal Period End
05352 Month of Fiscal Year End
05351 Length of Fiscal Period
11556 Indicator – Restated Data Exists
11557 Indicator – Restatement Type
11558 Indicator – Early Release (Restatement)
11559 Indicator – Restatement Reason Code
Industry 06011 Industry Group
06010 General Industry Classification
07040 ICB Code

Insurance Companies Template
Issue 6
© Thomson Financial 2003-2007 80 Confidential Information of Thomson Financial
07021 SIC Code 1
07022 SIC Code 2
07023 SIC Code 3
07024 SIC Code 4
07025 SIC Code 5
07026 SIC Code 6
07027 SIC Code 7
07028 SIC Code 8
Product Segment Data 19500 Product Segment 1 - Description
19501 Product Segment 1 - Sales
19502 Product Segment 1 - Operating Income
19503 Product Segment 1 - Assets
19504 Product Segment 1 - Capital Expenditures
19505 Product Segment 1 - Depreciation
19506 Product Segment 1 - SIC Code
19510 Product Segment 2 - Description
19511 Product Segment 2 - Sales
19512 Product Segment 2 - Operating Income
19513 Product Segment 2 - Assets
19514 Product Segment 2 - Capital Expenditures
19515 Product Segment 2 - Depreciation
19516 Product Segment 2 - SIC Code
19520 Product Segment 3 - Description
19521 Product Segment 3 - Sales
19522 Product Segment 3 - Operating Income
19523 Product Segment 3 - Assets
19524 Product Segment 3 - Capital Expenditures
19525 Product Segment 3 - Depreciation
19526 Product Segment 3 - SIC Code
19530 Product Segment 4 - Description
19531 Product Segment 4 - Sales
19532 Product Segment 4 - Operating Income
19533 Product Segment 4 - Assets
19534 Product Segment 4 - Capital Expenditures
19535 Product Segment 4 - Depreciation
19536 Product Segment 4 - SIC Code
19540 Product Segment 5 - Description
19541 Product Segment 5 - Sales
19542 Product Segment 5 - Operating Income
19543 Product Segment 5 - Assets
19544 Product Segment 5 - Capital Expenditures
19545 Product Segment 5 - Depreciation
19546 Product Segment 5 - SIC Code
19550 Product Segment 6 - Description
19551 Product Segment 6 - Sales
19552 Product Segment 6 - Operating Income
19553 Product Segment 6 - Assets
19554 Product Segment 6 - Capital Expenditures
19555 Product Segment 6 - Depreciation
19556 Product Segment 6 - SIC Code
19560 Product Segment 7 - Description
19561 Product Segment 7 - Sales
19562 Product Segment 7 - Operating Income
19563 Product Segment 7 - Assets
19564 Product Segment 7 - Capital Expenditures
19565 Product Segment 7 - Depreciation
19566 Product Segment 7 - SIC Code
19570 Product Segment 8 - Description
19571 Product Segment 8 - Sales
19572 Product Segment 8 - Operating Income

Insurance Companies Template
Issue 6
© Thomson Financial 2003-2007 81 Confidential Information of Thomson Financial
19573 Product Segment 8 - Assets
19574 Product Segment 8 - Capital Expenditures
19575 Product Segment 8 - Depreciation
19576 Product Segment 8 - SIC Code
19580 Product Segment 9 - Description
19581 Product Segment 9 - Sales
19582 Product Segment 9 - Operating Income
19583 Product Segment 9 - Assets
19584 Product Segment 9 - Capital Expenditures
19585 Product Segment 9 - Depreciation
19586 Product Segment 9 - SIC Codes
19590 Product Segment 10 - Description
19591 Product Segment 10 - Sales
19592 Product Segment 10 - Operating Income
19593 Product Segment 10 - Assets
19594 Product Segment 10 - Capital Expenditures
19595 Product Segment 10 - Depreciation
19596 Product Segment 10 - SIC Code
Major Shareholders 18370 Major Shareholders
Auditors 07800 Parent Auditor 1
07801 Parent Auditor 1 - Affiliate 1
07802 Parent Auditor 1 - Affiliate 2
07803 Parent Auditor 1 - Affiliate 3
07804 Parent Auditor 1 - Affiliate 4
07805 Parent Auditor 2
07806 Parent Auditor 2 - Affiliate 1
07807 Parent Auditor 2 - Affiliate 2
07808 Parent Auditor 2 - Affiliate 3
07809 Parent Auditor 2 - Affiliate 4
07810 Parent Auditor 3
07811 Parent Auditor 3 - Affiliate 1
07812 Parent Auditor 3 - Affiliate 2
07813 Parent Auditor 3 - Affiliate 3
07814 Parent Auditor 3 - Affiliate 4
07815 Parent Auditor 4
07816 Parent Auditor 4 - Affiliate 1
07817 Parent Auditor 4 - Affiliate 2
07818 Parent Auditor 4 - Affiliate 3
07819 Parent Auditor 4 - Affiliate 4
01801 Auditor Fees
Key Items in US Dollars 07211 Market Capitalization - Current
07210 Market Capitalization
07221 Common Equity - Current
07220 Common Equity
07230 Total Assets
07240 Net Sales or Revenues
07250 Net Income
Stock Data
Current Information 06005 Type of Share
05601 Ticker Symbol
06004 CUSIP
06006 SEDOL
06008 ISIN
06035 Worldscope Identifier
06105 Worldscope Permanent I.D.
06034 Disclosure Company Identifier
06038 I/B/E/S Ticker
06040 Dow Jones Company Symbol
11501 Indicator - Currently a Multiple Share Company

Insurance Companies Template
Issue 6
© Thomson Financial 2003-2007 82 Confidential Information of Thomson Financial
11519 Indicator – Limited Data Set Company
07016 Latest Annual Updated
07013 Year of Fast Update
07035 Latest Interim Date
05427 Stock Exchange(s) Listed
05661 Stock Index Information
11496 Indicator – ADR
05006 Market Price - Current
05009 Date of Current Price
05007 Market Price - Year to Date - High
05008 Market Price - Year to Date - Low
05091 Market Price – 52 Week High
05092 Market Price – 52 Week Low
08003 Market Capitalization (Public) - Current
08005 Market Capitalization - Current
05302 Common Shares Outstanding - Current
05306 Date of Common Shares
05450 Common/Ordinary Shareholders
05449 Date of Common/Ordinary Shareholders
05474 Closely Held Shares - Current
05473 Date of Closely Held Shares
05255 Earnings per Share - Last 12 Months
05256 Date of Last 12 Months EPS
05145 Dividends per Share - Last 12 Months
05190 Indicated Dividend Rate
05480 Book Value per Share - Current
05510 Cash Flow per Share - Current
Annual Statistics 05001 Market Price - Year End
05002 Market Price - High
05003 Market Price - Low
05004 Market Price - 5 yr avg - High
05005 Market Price - 5 yr avg - Low
08001 Market Capitalization
08004 Market Capitalization - Public
05651 Common Shares Traded - Annual #
08006 Trading Volume ($ Amount) #
08010 Trading Volume - Weekly Average #
08011 Turnover Rate #
05201 Earnings per Share
05210 Earnings per Share – Basic – Year
10010 Earnings per Share – Basic – Fiscal #
05290 Fully Diluted Earnings per Share
10030 Earnings per Share – Fully Diluted – Fiscal #
05202 Earnings per Share - Fiscal Year End
18193 Earnings per Share - As Reported
05200 Earnings Report Frequency
18208 Earnings per Share – Continuing Operations - Fiscal
18209 Earnings per Share Including Extraordinary Items - Fiscal
05230 Earnings per Share after Extraordinary Items
05225 Includes Extraordinary Credit/Charge per Share
05226 Extraordinary Credit/Charge per Share
05227 Includes Pre-tax Extraordinary Credit/Charge per Share
05228 Discontinued Operations per Share
18205 Discontinued Operations – Total – per Share
18202 Cumulative Effect of Accounting Change per Share
05240 DVFA Earnings (Germany)
05203 OVFA Earnings per Share (Austria)
05725 Headline Earnings per Share (U.K.)
05260 Earnings per Share - 5 yr avg
05101 Dividends per Share
05140 Dividends per Share - 5 yr avg
05110 Dividends per Share - Fiscal
05102 Dividends per Share - Gross
05100 Dividend Report Frequency
05476 Book Value per Share

Insurance Companies Template
Issue 6
© Thomson Financial 2003-2007 83 Confidential Information of Thomson Financial
05486 Tangible Book Value per Share
05491 Book Value – Outstanding Shares - Fiscal
05501 Cash Flow per Share
05502 Cash Flow per Share - Fiscal
05503 Long Term Liabilities per Share
05508 Sales per Share
05509 Operating Profit per Share
18210 Restructuring Expense per Share
18211 Restructuring Expense per Share - Pre-tax
05506 Working Capital per Share
05505 Capital Expenditure per Share
18100 Enterprise Value
05301 Common Shares Outstanding
05326 Number of Shares Authorized
05303 Treasury Shares
05309 Par Value
05191 Common Shares Used to Calculate EPS
05192 Common Shares Used to Calculate Basic EPS
05194 Common Shares Used to Calculate Fully Diluted EPS
05475 Closely Held Shares
08021 Closely Held Shares %
05576 Stock Split/Dividend Ratio
05575 Stock Split/Dividend Ratio – Fiscal
Weekly Time Series 05652 Common Shares Traded – Weekly
05080 Market Price – Week Close
05081 Market Price – Week High
05082 Market Price – Week Low
Balance Sheet
Assets 02003 Cash
02255 Investments – Total
02215 Fixed Income Securities Investment – Total
02212 Bonds
02214 Redeemable Preferred Stock
02230 Equity Securities Investment – Total
02228 Common Stocks
02229 Non-Redeemable Preferred Stock
02240 Real Estate Assets
02246 Mortgage, Policy & Other Loans
02250 Other Investments
02256 Investments in Associated Companies
02260 Premium Balance Receivables
02501 Property, Plant and Equipment – Net
02652 Other Assets
02290 Separate & Variable Account Assets
02647 Deferred Charges
02648 Tangible Other Assets
02649 Total Intangible Other Assets - Net
02999 Total Assets
Supplementary Asset Fields 18214 Exchange Rate Used in Translating
Balance Sheet
02005 Cash & Equivalents - Generic
18165 Deferred Tax Asset - Current
02245 Policy Loans
02267 Real Estate Mortgage Loans
18280 Goodwill/Cost in Excess of Assets Purchased
02502 Goodwill – Gross
02503 Goodwill – Accumulated Amortization
02504 Development Costs – Net
02505 Development Costs - Gross
02506 Development Costs – Accumulated Amortization
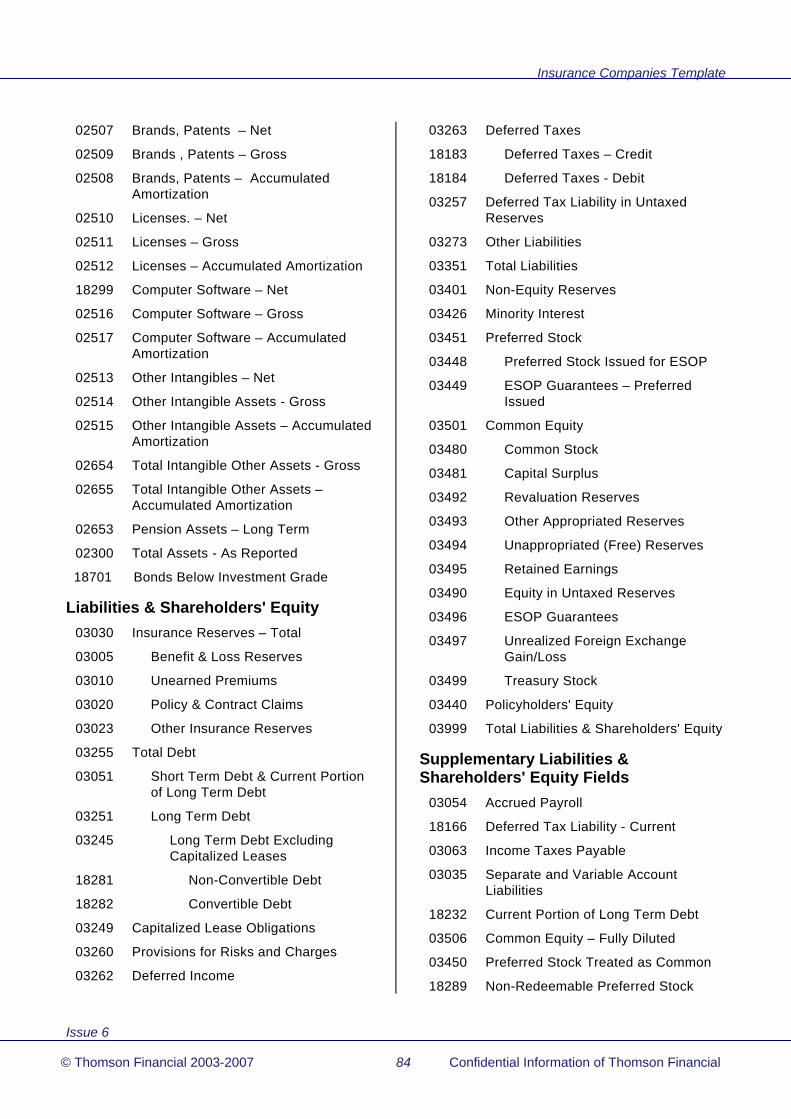
Insurance Companies Template
Issue 6
© Thomson Financial 2003-2007 84 Confidential Information of Thomson Financial
02507 Brands, Patents – Net
02509 Brands , Patents – Gross
02508 Brands, Patents – Accumulated Amortization
02510 Licenses. – Net
02511 Licenses – Gross
02512 Licenses – Accumulated Amortization
18299 Computer Software – Net
02516 Computer Software – Gross
02517 Computer Software – Accumulated Amortization
02513 Other Intangibles – Net
02514 Other Intangible Assets - Gross
02515 Other Intangible Assets – Accumulated Amortization
02654 Total Intangible Other Assets - Gross
02655 Total Intangible Other Assets – Accumulated Amortization
02653 Pension Assets – Long Term
02300 Total Assets - As Reported
18701 Bonds Below Investment Grade
Liabilities & Shareholders' Equity 03030 Insurance Reserves – Total
03005 Benefit & Loss Reserves
03010 Unearned Premiums
03020 Policy & Contract Claims
03023 Other Insurance Reserves
03255 Total Debt
03051 Short Term Debt & Current Portion of Long Term Debt
03251 Long Term Debt
03245 Long Term Debt Excluding Capitalized Leases
18281 Non-Convertible Debt
18282 Convertible Debt
03249 Capitalized Lease Obligations
03260 Provisions for Risks and Charges
03262 Deferred Income
03263 Deferred Taxes
18183 Deferred Taxes – Credit
18184 Deferred Taxes - Debit
03257 Deferred Tax Liability in Untaxed Reserves
03273 Other Liabilities
03351 Total Liabilities
03401 Non-Equity Reserves
03426 Minority Interest
03451 Preferred Stock
03448 Preferred Stock Issued for ESOP
03449 ESOP Guarantees – Preferred Issued
03501 Common Equity
03480 Common Stock
03481 Capital Surplus
03492 Revaluation Reserves
03493 Other Appropriated Reserves
03494 Unappropriated (Free) Reserves
03495 Retained Earnings
03490 Equity in Untaxed Reserves
03496 ESOP Guarantees
03497 Unrealized Foreign Exchange Gain/Loss
03499 Treasury Stock
03440 Policyholders' Equity
03999 Total Liabilities & Shareholders' Equity
Supplementary Liabilities & Shareholders' Equity Fields
03054 Accrued Payroll
18166 Deferred Tax Liability - Current
03063 Income Taxes Payable
03035 Separate and Variable Account Liabilities
18232 Current Portion of Long Term Debt
03506 Common Equity – Fully Diluted
03450 Preferred Stock Treated as Common
18289 Non-Redeemable Preferred Stock

Insurance Companies Template
Issue 6
© Thomson Financial 2003-2007 85 Confidential Information of Thomson Financial
18290 Redeemable Preferred Stock
03491 Goodwill Written Off
18065 Cumulative Goodwill Written Off
03498 Unrealized Gain/Loss on Marketable Securities
18352 Unfunded Pension Liabilities
03261 Pension/Postretirement Benefits
18141 Lease Commitments – Year 1
18142 Lease Commitments – Year 2
18143 Lease Commitments – Year 3
18144 Lease Commitments – Year 4
18145 Lease Commitments – Year 5
18146 Lease Commitments – Over 5 Years
18852 Comprehensive Income – Hedging Gain/Loss
18854 Comprehensive Income – Other
18851 Comprehensive Income – Pension Liability
18853 Comprehensive Income – Unearned Compensation
18168 Mandatorily Redeemable Trust Preferred Securities
18167 Other Mandatory Redeemable Instruments
Income Statement 01001 Net Sales or Revenues
01002 Premiums Earned
01006 Investment Income
01270 Gains/Losses on Sale of Securities - Pre-tax
01020 Other Operating Income
01079 Claim & Loss Expense - Total
01080 Long Term Insurance Reserves
01101 Selling, General & Administrative Expenses
01230 Other Operating Expenses
01249 Operating Expenses - Total
01250 Operating Income
01251 Interest Expense on Debt
01255 Interest Capitalized
01266 Non-Operating Interest Income
01253 Extraordinary Credit - Pre-tax
01254 Extraordinary Charge - Pre-tax
01262 Other Income/Expense - Net
01267 Pre-tax Equity in Earnings
01301 Reserves - Increase/Decrease
01401 Pre-tax Income
01451 Income Taxes
18186 Current Domestic Income Tax
18187 Current Foreign Income Tax
18188 Deferred Domestic Income Tax
18189 Deferred Foreign Income Tax
18185 Income Tax Credits
01501 Minority Interest
01503 Equity in Earnings
01504 After Tax Other Income/Expense
01505 Discontinued Operations
01542 Realized Investment Gain/Loss
01640 Policyholders' Surplus
01551 Net Income before Extraordinary Items/Preferred Dividends
01701 Preferred Dividend Requirements
01706 Net Income after Preferred Dividends (Basic EPS)
01601 Extraordinary Items & Gain/Loss Sale of Assets
Supplementary Income Statement Fields
18215 Exchange Rate Used in Translating Income Statement/Cash Flow
01004 Total Premiums Written
01071 Current Insurance Benefits
01078 Loss Adjustment Expense
01081 Underwriting Expense
01084 Staff Costs
01005 Reinsurance & Adjustment Reserves

Insurance Companies Template
Issue 6
© Thomson Financial 2003-2007 86 Confidential Information of Thomson Financial
18140 Rental/Operating Lease Expense
01302 Operating Provisions
18227 Restructuring Expense
01151 Depreciation, Depletion & Amortization
01149 Amortization of Intangibles
01152 Amortization of Brands
01153 Amortization of Research and Development
01154 Amortization of Licenses
01155 Amortization of Other Intangibles
01156 Amortization of Goodwill
01157 Amortization of Computer Software
18224 Amortization and Impairment of Goodwill
18225 Impairment of Goodwill
18226 Impairment of Other Intangibles
18274 Impairment of Property, Plant & Equipment
18275 Impairment of Financial Fixed Assets
01268 Dividend Income - Non Operating
01269 Discontinued Operations - Pre-tax
01306 Gain/Loss on Disposal of Assets
18191 Earnings before Interest and Taxes (EBIT)
01265 Monetary Correction
01352 Foreign Exchange Transactions
01351 Foreign Currency Translation Gain/Loss
01204 Taxes Other than Income Taxes
18200 Discontinued Operations – Total
18150 Income from Continuing Operations
18175 Ordinary Profit (Japan)
01540 Net Operating Income
01651 Net Income – Bottom Line
01751 Net Income Used to Calculate Earnings per Share
01705 Net Income Used to Calculate Fully Diluted Earnings per Share
18218 Cumulative Effect of Accounting Change
18170 Unconsolidated/Parent Company Sales
18169 Unconsolidated/Parent Company Depreciation
18171 Unconsolidated/Parent Company Pre-tax Income
18172 Unconsolidated/Parent Company Net Profit
18173 Unconsolidated/Parent Company Earnings per Share
Funds Flow Statement - per FASB 95
04201 Funds from Operations
04225 Extraordinary Items
04831 Funds from/for Other Operating Activities
04860 Net Cash Flow - Operating Activities
04601 Capital Expenditures (Additions to Fixed Assets)
04651 Additions to Other Assets
04355 Net Assets from Acquisitions
04760 Increase in Investments
04440 Decrease in Investments
04351 Disposal of Fixed Assets
04797 Other Uses/(Sources) - Investing
04795 Other Uses - Investing
04796 Other Sources - Investing
04870 Net Cash Flow - Investing
04251 Net Proceeds from Sale/Issue of Common & Preferred
04301 Proceeds from Stock Options
04302 Other Proceeds from Sale/Issuance of Stock
04751 Com/Pfd Purchased, Retired, Converted, Redeemed
04821 Increase/Decrease in Short Term Borrowings

Insurance Companies Template
Issue 6
© Thomson Financial 2003-2007 87 Confidential Information of Thomson Financial
04401 Long Term Borrowings
04701 Reduction in Long Term Debt
04551 Cash Dividends Paid - Total
05376 Common Dividends (Cash)
05401 Preferred Dividends (Cash)
04448 Other Sources/(Uses) - Financing
04446 Other Sources - Financing
04447 Other Uses - Financing
04890 Net Cash Flow - Financing
04840 Effect of Exchange Rate on Cash
04851 Increase/Decrease in Cash & Short Term Investments
Funds Flow Statement - Cash 04201 Funds from Operations
04225 Extraordinary Items
04831 Funds from/for Other Operating Activities
04401 Long Term Borrowings
04251 Net Proceeds from Sale/Issue of Common & Preferred
04301 Proceeds from Stock Options
04302 Other Proceeds from Sale/Issuance of Stock
04351 Disposal of Fixed Assets
04440 Decrease in Investments
04821 Increase/Decrease in Short Term Borrowings
04446 Other Sources - Financing
04796 Other Sources - Investing
04450 Other Sources
04551 Cash Dividends Paid - Total
05376 Common Dividends (Cash)
05401 Preferred Dividends (Cash)
04760 Increase in Investments
04701 Reduction in Long Term Debt
04601 Capital Expenditures (Additions to Fixed Assets)
04355 Net Assets from Acquisitions
04751 Com/Pfd Purchased, Retired, Converted, Redeemed
04651 Additions to Other Assets
04795 Other Uses - Investing
04447 Other Uses - Financing
04799 Other Uses
04840 Effect of Exchange Rate on Cash
04452 Changes in Cash and/or Liquid Items
04851 Increase/Decrease in Cash & Short Term Investments
Funds Flow Statement – Total Sources/Total Uses
Sources of Funds 04201 Funds from Operations
04225 Extraordinary Items
04831 Funds from/for Other Operating Activities
04401 Long Term Borrowings
04251 Net Proceeds from Sale/Issue of Common & Preferred
04301 Proceeds from Stock Options
04302 Other Proceeds from Sale/Issuance of Stock
04351 Disposal of Fixed Assets
04440 Decrease in Investments
04821 Increase/Decrease in Short Term Borrowings
04840 Effect of Exchange Rate on Cash
04452 Changes in Cash and/or Liquid Items
04851 Increase/Decrease in Cash & Short Term Investments
04446 Other Sources - Financing
04796 Other Sources - Investing
04450 Other Sources
04501 Total Sources

Insurance Companies Template
Issue 6
© Thomson Financial 2003-2007 88 Confidential Information of Thomson Financial
Uses of Funds 04551 Cash Dividends Paid - Total
05376 Common Dividends (Cash)
05401 Preferred Dividends (Cash)
04355 Net Assets from Acquisitions
04601 Capital Expenditures (Additions to Fixed Assets)
04701 Reduction in Long Term Debt
04751 Com/Pfd Purchased, Retired, Converted, Redeemed
04651 Additions to Other Assets
04760 Increase in Investments
04795 Other Uses - Investing
04447 Other Uses - Financing
04799 Other Uses
04811 Total Uses
Supplementary Cash Flow Fields 04500 External Financing
18216 Format Code – Cash Flow
04891 Net Cash from Continuing Operations
04892 Net Cash from Discontinued Operations
04052 Dividends
04053 Asset Disposal
04054 Discontinued Operations
04055 Minority Interest
04056 Equity In Earnings
04058 Unrealized Gains/Losses From Fair Value Adjustment Of Financial Assets
04148 Interest Paid
04149 Interest Income
04150 Taxation
Pension & Postretirement 18842 Healthcare Data – Actual Return on
Plan Assets
18834 Healthcare Data – Accumulated Benefit Obligation
18838 Healthcare Data – Amortization of Prior Service Costs
18832 Healthcare Data – Discount Rate
18831 Healthcare Data – Expected Long-Term Return Rate on Pension Assets
18843 Healthcare Data – Expected Return on Plan Assets for the Period
18833 Healthcare Data – Fair Value of Plan Assets
18840 Healthcare Data – Gains (Losses) from Settlements
18839 Healthcare Data – Interest Cost
18836 Healthcare Data – Net Periodic Pension (Income)/Expense
18841 Healthcare Data – Other Net Periodic Pension (Income)/Expense
18837 Healthcare Data – Pension Service Costs
18835 Healthcare Data – Projected Benefit Obligation (PBO)
18830 Healthcare Data – Unfunded Healthcare Defined Benefits
18844 Healthcare Data – Unrecognized Prior Service Cost
18845 Healthcare - Unrecognized Net Actuarial Gain/Loss
18846 Healthcare - Other Adjustments To Funded Status For Net Pension/Post Retirement Assets/Liabilities
18847 Healthcare Net Liability/(Asset) – Balance Sheet
18808 Pension Data – Accumulated Benefit Obligation
18816 Pension Data – Actual Return on Plan Assets
18802 Pension Data – Asset Allocation - % Bonds
18801 Pension Data – Asset Allocation - % Equities
18804 Pension Data – Asset Allocation - % Other
18803 Pension Data – Asset Allocation - % Property

Insurance Companies Template
Issue 6
© Thomson Financial 2003-2007 89 Confidential Information of Thomson Financial
18805 Pension Data – Expected Long-Term Return Rate on Pension Assets
18817 Pension Data – Expected Return on Plan Assets for the Period
18807 Pension Data – Fair Value of Plan Assets
18814 Pension Data – Gains (Losses) from Settlements
18810 Pension Data – Net Periodic Pension (Income)/Expense
18815 Pension Data – Other Net Periodic Pension (Income)/Expense
18806 Pension Data – Pension Discount Rate
18813 Pension Data – Pension Interest Cost
18811 Pension Data – Pension Service Costs
18812 Pension Data – Prior Service Costs
18809 Pension Data – Projected Benefit Obligation (PBO)
18818 Pension Data – Unrecognized Prior Service Cost
18819 Pension Data -Unrecognized Net Actuarial Gain/Loss
18820 Pension Data - Other Adjustments To Funded Status for Net Pension/Post Retirement Assets/Liabilities
18821 Net Pension Liability/(Asset) – Balance Sheet
Other Fields 18219 Life Insurance in Force
18231 Weighted Cost of Debt
03998 Total Capital
18192 Dividends Provided for or Paid – Common
18199 Net Debt
18322 Stock Option Compensation Expense – Adjustment to Net Income, Net of Tax
18321 Stock Option Compensation, Net of Tax
03995 Total Shareholders’ Equity
5 Year Summary Data
19760 Summary As Reported Year- Current Year
19761 Summary As Reported Revenue – Cur. Yr.
19762 Summary As Reported Net Inc. – Cur Yr
19763 Summary As Reported EPS Basic – Cur Yr
19764 Summary As Reported EPS Dil. – Cur Yr
19765 Summary As Reported Equity – Cur Yr
19766 Summary As Reported Year- -1 Year
19767 Summary As Reported Revenue – -1 Yr
19768 Summary As Reported Net Inc. – -1 Yr
19769 Summary As Reported EPS Basic – -1 Yr
19770 Summary As Reported EPS Dil. – -1 Yr
19771 Summary As Reported Equity – -1 Yr
19772 Summary As Reported Year- -2 Year
19773 Summary As Reported Revenue – -2 Yr
19774 Summary As Reported Net Inc. – -2 Yr
19775 Summary As Reported EPS Basic – -2 Yr
19776 Summary As Reported EPS Dil. – -2 Yr
19777 Summary As Reported Equity – -2 Yr
19778 Summary As Reported Year- -3 Year
19779 Summary As Reported Revenue – -3Yr
19780 Summary As Reported Net Inc. – -3 Yr
19781 Summary As Reported EPS Basic – -3 Yr
19782 Summary As Reported EPS Dil. – -3 Yr
19783 Summary As Reported Equity – -3 Yr

Insurance Companies Template
Issue 6
© Thomson Financial 2003-2007 90 Confidential Information of Thomson Financial
19784 Summary As Reported Year- -4 Year
19785 Summary As Reported Revenue – -4Yr
19786 Summary As Reported Net Inc. – -4 Yr
19787 Summary As Reported EPS Basic – -4 Yr
19788 Summary As Reported EPS Dil. – -4 Yr
19789 Summary As Reported Equity – -4 Yr
Annual Series Interim Data
Qtr 1 Qtr 2 Qtr 3 Qtr 4
Interim Sales 19101 19102 19103 19104
Interim Pre-tax Income
19105 19106 19107 19108
Interim Net Profit
19109 19110 19111 19112
Number of Months-EPS
05217 05218 05219 05220
Earnings per Share
05221 05222 05223 05224
Earnings per Share – Basic
05211 05212 05213 05214
Fully Diluted EPS
05291 05292 05293 05294
EPS - Report Date
05901 05902 05903 05904
EPS - 12 Months
05251 05252 05253 05254
EPS - 5 yr avg
05261 05262 05263 05264
Dividends per Share
05121 05122 05123 05124
DPS – Gross 05125 05126 05127 05128
DPS - Declared Date
05910 05911 05912 05913
DPS - Record Date
05917 05918 05919 05920
DPS - Ex-Div Date
05923 05924 05925 05926
Qtr 1 Qtr 2 Qtr 3 Qtr 4
DPS - Payable Date
05929 05930 05931 05932
DPS – Extra 05151 05152 05153 05154
DPS - Extra – Gross
05171 05172 05173 05174
DPS - Extra - Dec Date
05935 05936 05937 05938
DPS - Extra - Rec Date
05941 05942 05943 05944
DPS - Extra - Ex-Div Date
05947 05948 05949 05950
DPS - Extra - Pay Date
05953 05954 05955 05956
DPS - Special
05155 05156 05157 05158
DPS - Special - Gross05175
05176 05177 05178
DPS - Special - Dec Date
05965 05966 05968 05969
DPS - Special - Rec Date
05970 05971 05972 05973
DPS - Special - Ex-Div Date
05959 05960 05961 05962
DPS - Special - Payable Date
05976 05977 05978 05979
DPS - 12 Months
05131 05132 05133 05134
DPS - 5 yr avg
05141 05142 05143 05144
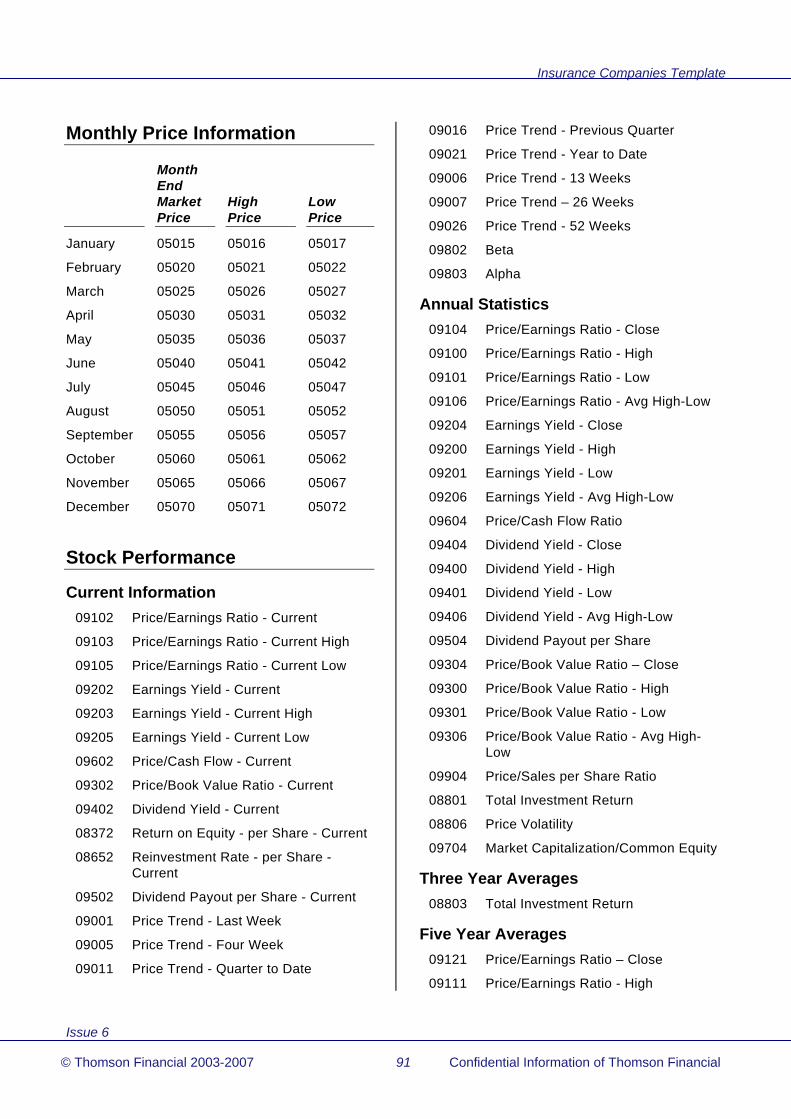
Insurance Companies Template
Issue 6
© Thomson Financial 2003-2007 91 Confidential Information of Thomson Financial
Monthly Price Information
Month End Market Price
High Price
Low Price
January 05015 05016 05017
February 05020 05021 05022
March 05025 05026 05027
April 05030 05031 05032
May 05035 05036 05037
June 05040 05041 05042
July 05045 05046 05047
August 05050 05051 05052
September 05055 05056 05057
October 05060 05061 05062
November 05065 05066 05067
December 05070 05071 05072
Stock Performance
Current Information 09102 Price/Earnings Ratio - Current
09103 Price/Earnings Ratio - Current High
09105 Price/Earnings Ratio - Current Low
09202 Earnings Yield - Current
09203 Earnings Yield - Current High
09205 Earnings Yield - Current Low
09602 Price/Cash Flow - Current
09302 Price/Book Value Ratio - Current
09402 Dividend Yield - Current
08372 Return on Equity - per Share - Current
08652 Reinvestment Rate - per Share - Current
09502 Dividend Payout per Share - Current
09001 Price Trend - Last Week
09005 Price Trend - Four Week
09011 Price Trend - Quarter to Date
09016 Price Trend - Previous Quarter
09021 Price Trend - Year to Date
09006 Price Trend - 13 Weeks
09007 Price Trend – 26 Weeks
09026 Price Trend - 52 Weeks
09802 Beta
09803 Alpha
Annual Statistics 09104 Price/Earnings Ratio - Close
09100 Price/Earnings Ratio - High
09101 Price/Earnings Ratio - Low
09106 Price/Earnings Ratio - Avg High-Low
09204 Earnings Yield - Close
09200 Earnings Yield - High
09201 Earnings Yield - Low
09206 Earnings Yield - Avg High-Low
09604 Price/Cash Flow Ratio
09404 Dividend Yield - Close
09400 Dividend Yield - High
09401 Dividend Yield - Low
09406 Dividend Yield - Avg High-Low
09504 Dividend Payout per Share
09304 Price/Book Value Ratio – Close
09300 Price/Book Value Ratio - High
09301 Price/Book Value Ratio - Low
09306 Price/Book Value Ratio - Avg High-Low
09904 Price/Sales per Share Ratio
08801 Total Investment Return
08806 Price Volatility
09704 Market Capitalization/Common Equity
Three Year Averages 08803 Total Investment Return
Five Year Averages 09121 Price/Earnings Ratio – Close
09111 Price/Earnings Ratio - High

Insurance Companies Template
Issue 6
© Thomson Financial 2003-2007 92 Confidential Information of Thomson Financial
09116 Price/Earnings Ratio - Low
09126 Price/Earnings Ratio - Avg High-Low
09221 Earnings Yield - Close
09211 Earnings Yield - High
09216 Earnings Yield - Low
09226 Earnings Yield - Avg High-Low
09621 Price/Cash Flow Ratio
09421 Dividend Yield - Close
09411 Dividend Yield - High
09416 Dividend Yield - Low
09426 Dividend Yield - Avg High-Low
09521 Dividend Payout per Share
09321 Price/Book Value Ratio - Close
09311 Price/Book Value Ratio - High
09316 Price/Book Value Ratio - Low
09326 Price/Book Value Ratio - Avg High-Low
08805 Total Investment Return
09721 Market Capitalization/Common Equity
Growth Rates
Annual Statistics 08661 Insurance Reserves
08631 Net Sales/Revenues Growth
08646 Operating Income Growth
08636 Net Income Growth
08621 Total Assets Growth
08616 Equity Growth
08626 Employees Growth
08601 Earnings per Share Growth
08611 Dividends per Share Growth
08606 Book Value per Share Growth
08676 Net Margin Growth
08579 Market Capitalization Growth
08816 Earnings Per Share Fiscal Growth
08821 Book Value Per Share Fiscal Growth
Three Year Averages 08581 Market Capitalization Growth
08604 Earnings per Share Growth
Five Year Averages 08665 Insurance Reserves
08635 Net Sales/Revenues Growth
08650 Operating Income Growth
08640 Net Income Growth
08625 Total Assets Growth
08620 Equity Growth
08630 Employees Growth
08605 Earnings per Share Growth
08615 Dividends per Share Growth
08610 Book Value per Share Growth
08680 Net Margin Growth
Profitability
Annual Statistics 08301 Return on Equity – Total (%)
08371 Return on Equity - Per Share
08302 Return on Equity – Per Share Fiscal
08653 Reinvestment Rate – Per Share Fiscal
08656 Reinvestment Rate - Total
08651 Reinvestment Rate - Per Share
08326 Return on Assets
08376 Return on Invested Capital
08911 Retained Earnings % Equity
08381 Cash Earnings Return on Equity
08311 Cash Flow/Sales
08316 Operating Profit Margin
08361 Operating Income Return on Total Capital
08321 Pre-tax Margin
08346 Tax Rate

Insurance Companies Template
Issue 6
© Thomson Financial 2003-2007 93 Confidential Information of Thomson Financial
08356 Interest Rate - Estimated Average
08366 Net Margin
15507 Net Premium Written % Equity
15513 Yield on Investment
15519 Operating Income % Premiums Earned
15543 Operating Income % Total Premium Written
15549 Loss Ratio
15555 Expense Ratio
15561 Combined Ratio
15537 Claims & Claim Expense % Net Premium Written
15575 Investment Income % Invested Assets
08351 Sales per Employee
Five Year Averages
08305 Return on Equity - Total (%)
08375 Return on Equity - per Share
08660 Reinvestment Rate - Total
08655 Reinvestment Rate - per Share
08330 Return on Assets
08380 Return on Invested Capital
08915 Retained Earnings % Equity
08385 Cash Earnings Return on Equity
08315 Cash Flow/Sales
08320 Operating Profit Margin
08365 Operating Income Return on Total Capital
08325 Pre-tax Margin
08350 Tax Rate
08360 Interest Rate - Estimated Average
08370 Net Margin
15507 Net Premium Written % Equity
15516 Yield on Investment
15522 Operating Income % Premiums Earned
15546 Operating Income % Total Premium Written
15552 Loss Ratio
15558 Expense Ratio
15564 Combined Ratio
15540 Claims & Claim Expense % Net Premium Written
15576 Investment Income % Invested Assets
08355 Sales per Employee
Asset Utilization
Annual Statistics 08406 Assets per Employee
08401 Total Asset Turnover
15091 Invested Assets % Assets
Five Year Averages 08410 Assets per Employee
08405 Total Asset Turnover
15094 Invested Assets % Assets
Leverage
Annual Statistics 08231 Total Debt % Common Equity
08226 Long Term Debt % Common Equity
08221 Total Debt % Total Capital
08216 Long Term Debt % Total Capital
08211 Minority Interest % Total Capital
08201 Equity % Total Capital
08206 Preferred Stock % Total Capital
08256 Dividend Payout (% Earnings)
08906 Cash Dividends % Cash Flow
08261 Operating Cash/Fixed Charges
08236 Total Debt % Total Assets
08241 Common Equity % Total Assets
08287 Total Assets / Common Equity Ratio
15121 Total Capital % Total Assets
08266 Fixed Assets % Common Equity

Insurance Companies Template
Issue 6
© Thomson Financial 2003-2007 94 Confidential Information of Thomson Financial
08291 EBIT / Total Interest Expense Ratio
15190 Benefit & Loss Reserve % of Total Capital
15173 Earnings Asset % Total Available Funds
15097 Invested Assets % Liabilities
Five Year Averages 08235 Total Debt % Common Equity
08230 Long Term Debt % Common Equity
08225 Total Debt % Total Capital
08220 Long Term Debt % Total Capital
08215 Minority Interest % Total Capital
08205 Equity % Total Capital
08210 Preferred Stock % Total Capital
08260 Dividend Payout (% Earnings)
08910 Cash Dividends % Cash Flow
08265 Operating Cash/Fixed Charges
08240 Total Debt % Total Assets
08245 Common Equity % Total Assets
15124 Total Capital % Total Assets
08265 Operating Cash/Fixed Charges
08270 Fixed Assets % Common Equity
15193 Benefit & Loss Reserve % of Total Capital
15176 Earnings Asset % Total Available Funds
15100 Invested Assets % Liabilities
Other Ratios
Annual Statistics 15133 Unearned Premium % Total Capital
15580 Total Investments % Total Capital
15103 Equity Securities & Real Estate % Invested Assets
15109 Equity Securities & Real Estate % Capital
Five Year Averages 15136 Unearned Premium % Total Capital
15583 Total Investments % Total Capital
15106 Equity Securities & Real Estate % Invested Assets
15112 Equity Securities & Real Estate % Capital
Foreign Business
Annual Statistics 07151 International Assets
07101 International Sales
07126 International Operating Income
08711 Foreign Return on Assets
08706 Foreign Asset Turnover
08701 Foreign Income Margin
08716 Foreign Assets Growth
08721 Foreign Sales Growth
08726 Foreign Income Growth
08736 Foreign Assets % Total Assets
08731 Foreign Sales % Total Sales
08741 Foreign Income % Total Income
Five Year Averages 08715 Foreign Return on Assets
08710 Foreign Asset Turnover
08705 Foreign Income Margin
08720 Foreign Assets Growth
08725 Foreign Sales Growth
08730 Foreign Income Growth
08740 Foreign Assets % Total Assets
08735 Foreign Sales % Total Sales
08745 Foreign Income % Total Income
Geographic Segment Data 19600 Geographic Segment 1 - Description
19601 Geographic Segment 1 - Sales

Insurance Companies Template
Issue 6
© Thomson Financial 2003-2007 95 Confidential Information of Thomson Financial
19602 Geographic Segment 1 - Operating Income
19603 Geographic Segment 1 - Assets
19604 Geographic Segment 1 - Capital Expenditures
19605 Geographic Segment 1 - Depreciation
19610 Geographic Segment 2 - Description
19611 Geographic Segment 2 - Sales
19612 Geographic Segment 2 - Operating Income
19613 Geographic Segment 2 - Assets
19614 Geographic Segment 2 - Capital Expenditures
19615 Geographic Segment 2 - Depreciation
19620 Geographic Segment 3 - Description
19621 Geographic Segment 3 - Sales
19622 Geographic Segment 3 - Operating Income
19623 Geographic Segment 3 - Assets
19624 Geographic Segment 3 - Capital Expenditures
19625 Geographic Segment 3 - Depreciation
19630 Geographic Segment 4 - Description
19631 Geographic Segment 4 - Sales
19632 Geographic Segment 4 - Operating Income
19633 Geographic Segment 4 - Assets
19634 Geographic Segment 4 - Capital Expenditures
19635 Geographic Segment 4 - Depreciation
19640 Geographic Segment 5 - Description
19641 Geographic Segment 5 - Sales
19642 Geographic Segment 5 - Operating Income
19643 Geographic Segment 5 - Assets
19644 Geographic Segment 5 - Capital Expenditures
19645 Geographic Segment 5 - Depreciation
19650 Geographic Segment 6 - Description
19651 Geographic Segment 6 - Sales
19652 Geographic Segment 6 - Operating Income
19653 Geographic Segment 6 - Assets
19654 Geographic Segment 6 - Capital Expenditures
19655 Geographic Segment 6 - Depreciation
19660 Geographic Segment 7 - Description
19661 Geographic Segment 7 - Sales
19662 Geographic Segment 7 - Operating Income
19663 Geographic Segment 7 - Assets
19664 Geographic Segment 7 - Capital Expenditures
19665 Geographic Segment 7 - Depreciation
19670 Geographic Segment 8 - Description
19671 Geographic Segment 8 - Sales
19672 Geographic Segment 8 - Operating Income
19673 Geographic Segment 8 - Assets
19674 Geographic Segment 8 - Capital Expenditures
19675 Geographic Segment 8 - Depreciation
19680 Geographic Segment 9 - Description
19681 Geographic Segment 9 - Sales
19682 Geographic Segment 9 - Operating Income
19683 Geographic Segment 9 - Assets
19684 Geographic Segment 9 - Capital Expenditures
19685 Geographic Segment 9 - Depreciation
19690 Geographic Segment 10 - Description
19691 Geographic Segment 10 - Sales
19692 Geographic Segment 10 - Operating Income
19693 Geographic Segment 10 - Assets
19694 Geographic Segment 10 – Capital Expenditures
19695 Geographic Segment 10 - Depreciation

Insurance Companies Template
Issue 6
© Thomson Financial 2003-2007 96 Confidential Information of Thomson Financial
Company Specific Accounting Practices
07531 Accounting method for long term investment > 50%
07536 Accounting standards followed
07546 Auditors' opinion
Multiple Share Data 20001 Type of Share - Mult Share 1
20003 Worldscope Identifier - Mult Share 1
20005 SEDOL - Mult Share 1
20006 CUSIP - Mult Share 1
20007 ISIN - Mult Share 1
20008 Ticker Symbol - Mult Share 1
20009 Stock Exchange(s) Listed - Mult Share 1
20011 Inactive Date - Mult Share 1
20020 Common Shares Outstanding - Current - Mult Share 1
20021 Market Price - Current - Mult Share 1
20022 Date of Current Price - Mult Share 1
20023 Market Capitalization - Current - Mult Share 1
20024 Earnings per Share - Last 12 Mos - Mult Share 1
20025 Dividends per Share - Last 12 Mos - Mult Share 1
20026 Price/Earnings Ratio - Current - Mult Share 1
20027 Price/Book Value Ratio - Current - Mult Share 1
20028 Dividend Yield - Current - Mult Share 1
20040 Common Shares Outstanding - Mult Share 1
20002 Par Value - Mult Share 1
20042 Market Price - Year End - Mult Share 1
20041 Market Capitalization - Mult Share 1
20043 Earnings per Share - Mult Share 1
20044 Dividends per Share - Mult Share 1
20045 Book Value per Share - Mult Share 1
20046 Price/Earnings Ratio - Close - Mult Share 1
20047 Price/Book Value Ratio - Close - Mult Share 1
20048 Dividend Yield - Close - Mult Share 1
20101 Type of Share - Mult Share 2
20103 Worldscope Identifier - Mult Share 2
20105 SEDOL - Mult Share 2
20106 CUSIP - Mult Share 2
20107 ISIN - Mult Share 2
20108 Ticker Symbol - Mult Share 2
20109 Stock Exchange(s) Listed - Mult Share 2
20111 Inactive Date - Mult Share 2
20120 Common Shares Outstanding - Current - Mult Share 2
20121 Market Price - Current - Mult Share 2
20122 Date of Current Price - Mult Share 2
20123 Market Capitalization - Current - Mult Share 2
20124 Earnings per Share - Last 12 Mos - Mult Share 2
20125 Dividends per Share - Last 12 Mos - Mult Share 2
20126 Price/Earnings Ratio - Current - Mult Share 2
20127 Price/Book Value Ratio - Current - Mult Share 2
20128 Dividend Yield - Current - Mult Share 2
20140 Common Shares Outstanding - Mult Share 2
20102 Par Value - Mult Share 2
20142 Market Price - Year End - Mult Share 2
20141 Market Capitalization - Mult Share 2
20143 Earnings per Share - Mult Share 2
20144 Dividends per Share - Mult Share 2
20145 Book Value per Share - Mult Share 2
20146 Price/Earnings Ratio - Close - Mult Share 2

Insurance Companies Template
Issue 6
© Thomson Financial 2003-2007 97 Confidential Information of Thomson Financial
20147 Price/Book Value Ratio - Close - Mult Share 2
20148 Dividend Yield - Close - Mult Share 2
20201 Type of Share - Mult Share 3
20203 Worldscope Identifier - Mult Share 3
20205 SEDOL - Mult Share 3
20206 CUSIP - Mult Share 3
20207 ISIN - Mult Share 3
20208 Ticker Symbol - Mult Share 3
20209 Stock Exchange(s) Listed - Mult Share 3
20211 Inactive Date - Mult Share 3
20220 Common Shares Outstanding - Current - Mult Share 3
20221 Market Price - Current - Mult Share 3
20222 Date of Current Price - Mult Share 3
20223 Market Capitalization - Current - Mult Share 3
20224 Earnings per Share - Last 12 Mos - Mult Share 3
20225 Dividends per Share - Last 12 Mos - Mult Share 3
20226 Price/Earnings Ratio - Current - Mult Share 3
20227 Price/Book Value Ratio - Current - Mult Share 3
20228 Dividend Yield - Current - Mult Share 3
20240 Common Shares Outstanding - Mult Share 3
20202 Par Value - Mult Share 3
20242 Market Price - Year End - Mult Share 3
20241 Market Capitalization - Mult Share 3
20243 Earnings per Share - Mult Share 3
20244 Dividends per Share - Mult Share 3
20245 Book Value per Share - Mult Share 3
20246 Price/Earnings Ratio - Close - Mult Share 3
20247 Price/Book Value Ratio - Close - Mult Share 3
20248 Dividend Yield - Close - Mult Share 3
20301 Type of Share - Mult Share 4
20303 Worldscope Identifier - Mult Share 4
20305 SEDOL - Mult Share 4
20306 CUSIP - Mult Share 4
20307 ISIN - Mult Share 4
20308 Ticker Symbol - Mult Share 4
20309 Stock Exchange(s) Listed - Mult Share 4
20311 Inactive Date - Mult Share 4
20320 Common Shares Outstanding - Current - Mult Share 4
20321 Market Price - Current - Mult Share 4
20322 Date of Current Price - Mult Share 4
20323 Market Capitalization - Current - Mult Share 4
20324 Earnings per Share - Last 12 Mos - Mult Share 4
20325 Dividends per Share - Last 12 Mos - Mult Share 4
20326 Price/Earnings Ratio - Current - Mult Share 4
20327 Price/Book Value Ratio - Current - Mult Share 4
20328 Dividend Yield - Current - Mult Share 4
20340 Common Shares Outstanding - Mult Share 4
20302 Par Value - Mult Share 4
20342 Market Price - Year End - Mult Share 4
20341 Market Capitalization - Mult Share 4
20343 Earnings per Share - Mult Share 4
20344 Dividends per Share - Mult Share 4
20345 Book Value per Share - Mult Share 4
20346 Price/Earnings Ratio - Close - Mult Share 4
20347 Price/Book Value Ratio - Close - Mult Share 4
20348 Dividend Yield - Close - Mult Share 4
20401 Type of Share - Mult Share 5
20403 Worldscope Identifier - Mult Share 5
20405 SEDOL - Mult Share 5

Insurance Companies Template
Issue 6
© Thomson Financial 2003-2007 98 Confidential Information of Thomson Financial
20406 CUSIP - Mult Share 5
20407 ISIN - Mult Share 5
20408 Ticker Symbol - Mult Share 5
20409 Stock Exchange(s) Listed - Mult Share 5
20411 Inactive Date - Mult Share 5
20420 Common Shares Outstanding - Current - Mult Share 5
20421 Market Price - Current - Mult Share 5
20422 Date of Current Price - Mult Share 5
20423 Market Capitalization - Current - Mult Share 5
20424 Earnings per Share - Last 12 Mos - Mult Share 5
20425 Dividends per Share - Last 12 Mos - Mult Share 5
20426 Price/Earnings Ratio - Current - Mult Share 5
20427 Price/Book Value Ratio - Current - Mult Share 5
20428 Dividend Yield - Current - Mult Share 5
20440 Common Shares Outstanding - Mult Share 5
20402 Par Value - Mult Share 5
20442 Market Price - Year End - Mult Share 5
20441 Market Capitalization - Mult Share 5
20443 Earnings per Share - Mult Share 5
20444 Dividends per Share - Mult Share 5
20445 Book Value per Share - Mult Share 5
20446 Price/Earnings Ratio - Close - Mult Share 5
20447 Price/Book Value Ratio - Close - Mult Share 5
20448 Dividend Yield - Close - Mult Share 5
20501 Type of Share - Mult Share 6
20503 Worldscope Identifier - Mult Share 6
20505 SEDOL - Mult Share 6
20506 CUSIP - Mult Share 6
20507 ISIN - Mult Share 6
20508 Ticker Symbol - Mult Share 6
20509 Stock Exchange(s) Listed - Mult Share 6
20511 Inactive Date - Mult Share 6
20520 Common Shares Outstanding - Current - Mult Share 6
20521 Market Price - Current - Mult Share 6
20522 Date of Current Price - Mult Share 6
20523 Market Capitalization - Current - Mult Share 6
20524 Earnings per Share - Last 12 Mos - Mult Share 6
20525 Dividends per Share - Last 12 Mos - Mult Share 6
20526 Price/Earnings Ratio - Current - Mult Share 6
20527 Price/Book Value Ratio - Current - Mult Share 6
20528 Dividend Yield - Current - Mult Share 6
20540 Common Shares Outstanding - Mult Share 6
20502 Par Value - Mult Share 6
20542 Market Price - Year End - Mult Share 6
20541 Market Capitalization - Mult Share 6
20543 Earnings per Share - Mult Share 6
20544 Dividends per Share - Mult Share 6
20545 Book Value per Share - Mult Share 6
20546 Price/Earnings Ratio - Close - Mult Share 6
20547 Price/Book Value Ratio - Close - Mult Share 6
20548 Dividend Yield - Close - Mult Share 6
20601 Type of Share - Mult Share 7
20603 Worldscope Identifier - Mult Share 7
20605 SEDOL - Mult Share 7
20606 CUSIP - Mult Share 7
20607 ISIN - Mult Share 7
20608 Ticker Symbol - Mult Share 7
20609 Stock Exchange(s) Listed - Mult Share 7
20611 Inactive Date - Mult Share 7

Insurance Companies Template
Issue 6
© Thomson Financial 2003-2007 99 Confidential Information of Thomson Financial
20620 Common Shares Outstanding - Current - Mult Share 7
20621 Market Price - Current - Mult Share 7
20622 Date of Current Price - Mult Share 7
20623 Market Capitalization - Current - Mult Share 7
20624 Earnings per Share - Last 12 Mos - Mult Share 7
20625 Dividends per Share - Last 12 Mos - Mult Share 7
20626 Price/Earnings Ratio - Current - Mult Share 7
20627 Price/Book Value Ratio - Current - Mult Share 7
20628 Dividend Yield - Current - Mult Share 7
20640 Common Shares Outstanding - Mult Share 7
20602 Par Value - Mult Share 7
20642 Market Price - Year End - Mult Share 7
20641 Market Capitalization - Mult Share 7
20643 Earnings per Share - Mult Share 7
20644 Dividends per Share - Mult Share 7
20645 Book Value per Share - Mult Share 7
20646 Price/Earnings Ratio - Close - Mult Share 7
20647 Price/Book Value Ratio - Close - Mult Share 7
20648 Dividend Yield - Close - Mult Share 7
Monthly Foreign Exchange Rates 11013 To U.S. Dollars – Current
11002 To U.S. Dollars - January Month End
11003 To U.S. Dollars - February Month End
11004 To U.S. Dollars - March Month End
11005 To U.S. Dollars - April Month End
11006 To U.S. Dollars - May Month End
11007 To U.S. Dollars - June Month End
11008 To U.S. Dollars - July Month End
11009 To U.S. Dollars - August Month End
11010 To U.S. Dollars - September Month End
11011 To U.S. Dollars - October Month End
11012 To U.S. Dollars - November Month End
11001 To U.S. Dollars - December Month End
11113 From Euro Currency to Legacy/Local – Current
11102 From Euro Currency to Legacy/Local – January
11103 From Euro Currency to Legacy/Local – February
11104 From Euro Currency to Legacy/Local – March
11105 From Euro Currency to Legacy/Local – April
11106 From Euro Currency to Legacy/Local – May
11107 From Euro Currency to Legacy/Local – June
11108 From Euro Currency to Legacy/Local – July
11109 From Euro Currency to Legacy/Local – August
11110 From Euro Currency to Legacy/Local – September
11111 From Euro Currency to Legacy/Local – October
11112 From Euro Currency to Legacy/Local – November
11101 From Euro Currency to Legacy/Local – Year End
11202 From ECU Currency to Local – January
11203 From ECU Currency to Local – February
11204 From ECU Currency to Local – March
11205 From ECU Currency to Local – April
11206 From ECU Currency to Local – May

Insurance Companies Template
Issue 6
© Thomson Financial 2003-2007 100 Confidential Information of Thomson Financial
11207 From ECU Currency to Local – June
11208 From ECU Currency to Local – July
11209 From ECU Currency to Local – August
11210 From ECU Currency to Local – September
11211 From ECU Currency to Local – October
11212 From ECU Currency to Local – November
11201 From ECU Currency to Local – Year End
11313 Legacy to U.S. Currency – Current
11302 Legacy to U.S. Currency – January
11303 Legacy to U.S. Currency – February
11304 Legacy to U.S. Currency – March
11305 Legacy to U.S. Currency – April
11306 Legacy to U.S. Currency – May
11307 Legacy to U.S. Currency – June
11308 Legacy to U.S. Currency – July
11309 Legacy to U.S. Currency – August
11310 Legacy to U.S. Currency – September
11311 Legacy to U.S. Currency – October
11312 Legacy to U.S. Currency – November
11301 Legacy to U.S. Currency – Year En

Issue 6
© Thomson Financial 2003-2007 101 Confidential Information of Thomson Financial
Other Financial Companies TemplateNotes:
#: Currently U.S. and Canadian companies only.
General Information 06001 Company Name
06003 Company Name - Short
06014 Acronym
00000 Company Status
06092 Post Office Box
06021 Building
06022 Street
06023 Address City
06024 Address State
06025 Post Code/Zip Code
06026 Nation
06027 Nation Code
06028 Region
06031 Phone Number
06032 TELEX Number
06033 FAX Number
06030 Internet Address
06041 Officer 1 - Name
Officer 1 - Title
06051 Officer 2 - Name
Officer 2 - Title
06061 Officer 3 - Name
Officer 3 - Title
06071 Officer 4 - Name
Officer 4 - Title
06081 Officer 5 - Name
Officer 5 - Title
18357 Investor Relations - Name
18358 Investor Relations – Address
18356 Investor Relations – E-mail Address
18359 Investor Relations - Phone/Fax
18121 Registrar – Name
18122 Registrar – Address
18123 Registrar – Telephone Number
18124 Registrar – Fax Number
18125 Registrar – Website
18126 Registrar – Email Address
18272 Company Founded Date
18273 Date of Incorporation
11516 Date Added to Product
07033 Full/Limited Coverage Indicator
07034 Indicator – Data Update
07015 Inactive Date
06091 Business Description
06092 Business Description - Extended
07011 Employees
07001 Products
06100 Entity Type
06098 Currency of Analysis
06099 Currency of Document
05350 Date of Fiscal Period End
05352 Month of Fiscal Year End
05351 Length of Fiscal Period
11556 Indicator – Restated Data Exists
11557 Indicator – Restatement Type
11558 Indicator – Early Release (Restatement)
11559 Indicator – Restatement Reason Code
Industry 06011 Industry Group
06010 General Industry Classification
07040 ICB Code
07021 SIC Code 1

Other Financial Companies Template
Issue 6
© Thomson Financial 2003-2007 102 Confidential Information of Thomson Financial
07022 SIC Code 2
07023 SIC Code 3
07024 SIC Code 4
07025 SIC Code 5
07026 SIC Code 6
07027 SIC Code 7
07028 SIC Code 8
Product Segment Data 19500 Product Segment 1 - Description
19501 Product Segment 1 - Sales
19502 Product Segment 1 - Operating Income
19503 Product Segment 1 - Assets
19504 Product Segment 1 - Capital Expenditures
19505 Product Segment 1 - Depreciation
19506 Product Segment 1 - SIC Code
19510 Product Segment 2 - Description
19511 Product Segment 2 - Sales
19512 Product Segment 2 - Operating Income
19513 Product Segment 2 - Assets
19514 Product Segment 2 - Capital Expenditures
19515 Product Segment 2 - Depreciation
19516 Product Segment 2 - SIC Code
19520 Product Segment 3 - Description
19521 Product Segment 3 - Sales
19522 Product Segment 3 - Operating Income
19523 Product Segment 3 - Assets
19524 Product Segment 3 - Capital Expenditures
19525 Product Segment 3 - Depreciation
19526 Product Segment 3 - SIC Code
19530 Product Segment 4 - Description
19531 Product Segment 4 - Sales
19532 Product Segment 4 - Operating Income
19533 Product Segment 4 - Assets
19534 Product Segment 4 - Capital Expenditures
19535 Product Segment 4 - Depreciation
19536 Product Segment 4 - SIC Code
19540 Product Segment 5 - Description
19541 Product Segment 5 - Sales
19542 Product Segment 5 - Operating Income
19543 Product Segment 5 - Assets
19544 Product Segment 5 - Capital Expenditures
19545 Product Segment 5 - Depreciation
19546 Product Segment 5 - SIC Code
19550 Product Segment 6 - Description
19551 Product Segment 6 - Sales
19552 Product Segment 6 - Operating Income
19553 Product Segment 6 - Assets
19554 Product Segment 6 - Capital Expenditures
19555 Product Segment 6 - Depreciation
19556 Product Segment 6 - SIC Code
19560 Product Segment 7 - Description
19561 Product Segment 7 - Sales
19562 Product Segment 7 - Operating Income
19563 Product Segment 7 - Assets
19564 Product Segment 7 - Capital Expenditures
19565 Product Segment 7 - Depreciation
19566 Product Segment 7 - SIC Code
19570 Product Segment 8 - Description
19571 Product Segment 8 - Sales
19572 Product Segment 8 - Operating Income
19573 Product Segment 8 - Assets
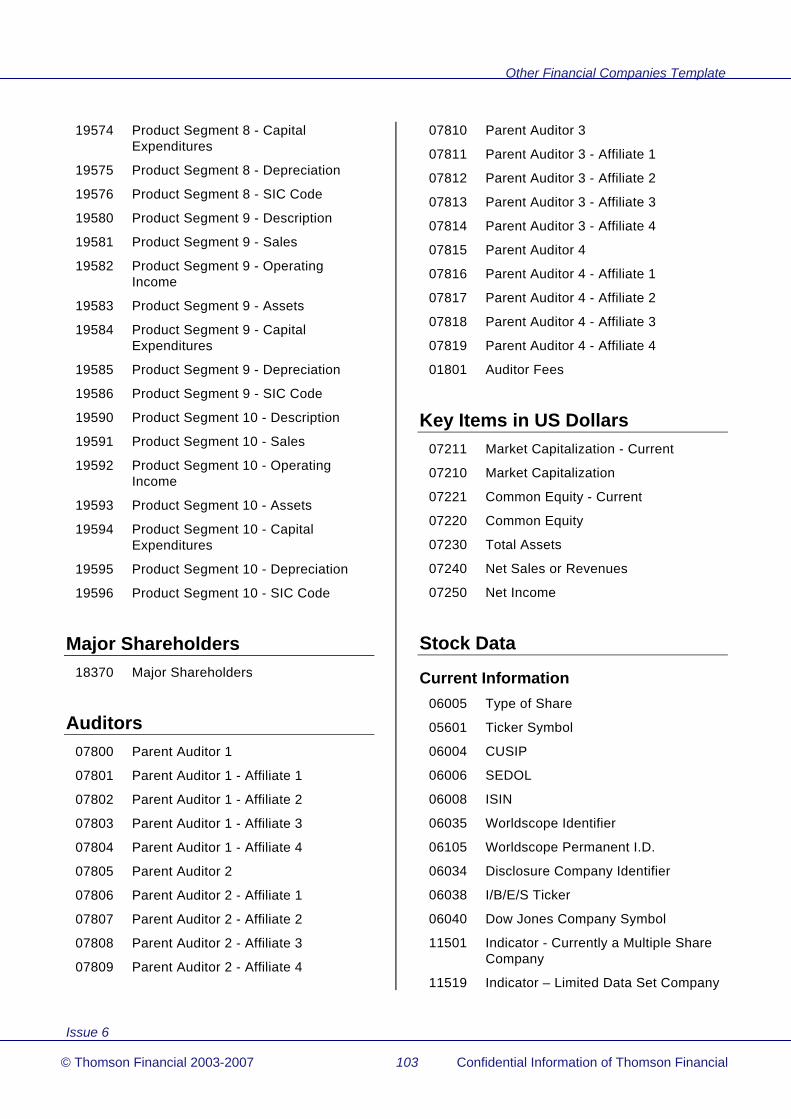
Other Financial Companies Template
Issue 6
© Thomson Financial 2003-2007 103 Confidential Information of Thomson Financial
19574 Product Segment 8 - Capital Expenditures
19575 Product Segment 8 - Depreciation
19576 Product Segment 8 - SIC Code
19580 Product Segment 9 - Description
19581 Product Segment 9 - Sales
19582 Product Segment 9 - Operating Income
19583 Product Segment 9 - Assets
19584 Product Segment 9 - Capital Expenditures
19585 Product Segment 9 - Depreciation
19586 Product Segment 9 - SIC Code
19590 Product Segment 10 - Description
19591 Product Segment 10 - Sales
19592 Product Segment 10 - Operating Income
19593 Product Segment 10 - Assets
19594 Product Segment 10 - Capital Expenditures
19595 Product Segment 10 - Depreciation
19596 Product Segment 10 - SIC Code
Major Shareholders 18370 Major Shareholders
Auditors 07800 Parent Auditor 1
07801 Parent Auditor 1 - Affiliate 1
07802 Parent Auditor 1 - Affiliate 2
07803 Parent Auditor 1 - Affiliate 3
07804 Parent Auditor 1 - Affiliate 4
07805 Parent Auditor 2
07806 Parent Auditor 2 - Affiliate 1
07807 Parent Auditor 2 - Affiliate 2
07808 Parent Auditor 2 - Affiliate 3
07809 Parent Auditor 2 - Affiliate 4
07810 Parent Auditor 3
07811 Parent Auditor 3 - Affiliate 1
07812 Parent Auditor 3 - Affiliate 2
07813 Parent Auditor 3 - Affiliate 3
07814 Parent Auditor 3 - Affiliate 4
07815 Parent Auditor 4
07816 Parent Auditor 4 - Affiliate 1
07817 Parent Auditor 4 - Affiliate 2
07818 Parent Auditor 4 - Affiliate 3
07819 Parent Auditor 4 - Affiliate 4
01801 Auditor Fees
Key Items in US Dollars 07211 Market Capitalization - Current
07210 Market Capitalization
07221 Common Equity - Current
07220 Common Equity
07230 Total Assets
07240 Net Sales or Revenues
07250 Net Income
Stock Data
Current Information 06005 Type of Share
05601 Ticker Symbol
06004 CUSIP
06006 SEDOL
06008 ISIN
06035 Worldscope Identifier
06105 Worldscope Permanent I.D.
06034 Disclosure Company Identifier
06038 I/B/E/S Ticker
06040 Dow Jones Company Symbol
11501 Indicator - Currently a Multiple Share Company
11519 Indicator – Limited Data Set Company

Other Financial Companies Template
Issue 6
© Thomson Financial 2003-2007 104 Confidential Information of Thomson Financial
07016 Latest Annual Updated
07013 Year of Fast Update
07035 Latest Interim Date
05427 Stock Exchange(s) Listed
05661 Stock Index Information
11496 Indicator - ADR
05006 Market Price - Current
05009 Date of Current Price
05007 Market Price - Year to Date - High
05008 Market Price - Year to Date – Low
05091 Market Price – 52 Week High
05092 Market Price – 52 Week Low
08003 Market Capitalization (Public) - Current
08005 Market Capitalization - Current
05302 Common Shares Outstanding - Current
05306 Date of Common Shares
05450 Common/Ordinary Shareholders
05449 Date of Common/Ordinary Shareholders
05474 Closely Held Shares - Current
05473 Date of Closely Held Shares
05255 Earnings per Share - Last 12 Months
05256 Date of Last 12 Months EPS
05145 Dividends per Share - Last 12 Months
05190 Indicated Dividend Rate
05480 Book Value per Share - Current
05510 Cash Flow per Share - Current
Annual Statistics 05001 Market Price - Year End
05002 Market Price - High
05003 Market Price - Low
05004 Market Price - 5 yr avg - High
05005 Market Price - 5 yr avg - Low
08001 Market Capitalization
08004 Market Capitalization - Public
05651 Common Shares Traded - Annual #
08006 Trading Volume ($ Amount) #
08010 Trading Volume - Weekly Average #
08011 Turnover Rate #
05201 Earnings per Share
05210 Earnings per Share – Basic – Year
10010 Earnings per Share – Basic – Fiscal #
05290 Fully Diluted Earnings per Share
10030 Earnings per Share – Fully Diluted – Fiscal #
05202 Earnings per Share - Fiscal Year End
18193 Earnings per Share - As Reported
05200 Earnings Report Frequency
18208 Earnings per Share – Continuing Operations - Fiscal
18209 Earnings per Share Including Extraordinary Items - Fiscal
05230 Earnings per Share after Extraordinary Items
05225 Includes Extraordinary Credit/Charge per Share
05226 Extraordinary Credit/Charge per Share
05227 Includes Pre-tax Extraordinary Credit/Charge per Share
05228 Discontinued Operations per Share
18205 Discontinued Operations – Total – per Share
18202 Cumulative Effect of Accounting per Share
05240 DVFA Earnings (Germany)
05203 OVFA Earnings per Share (Austria)
05725 Headline Earnings per Share (U.K.)
05260 Earnings per Share - 5 yr avg
05101 Dividends per Share
05140 Dividends per Share - 5 yr avg
05110 Dividends per Share - Fiscal
05102 Dividends per Share - Gross
05100 Dividend Report Frequency
05476 Book Value per Share
05486 Tangible Book Value per Share

Other Financial Companies Template
Issue 6
© Thomson Financial 2003-2007 105 Confidential Information of Thomson Financial
05491 Book Value – Outstanding Shares - Fiscal
05501 Cash Flow per Share
05502 Cash Flow per Share - Fiscal
05508 Sales per Share
05509 Operating Profit per Share
18210 Restructuring Expense per Share
18211 Restructuring Expense per Share - Pre-tax
05505 Capital Expenditure per Share
18100 Enterprise Value
05301 Common Shares Outstanding
05326 Number of Shares Authorized
05303 Treasury Shares
05309 Par Value
05191 Common Shares Used to Calculate EPS
05192 Common Shares Used to Calculate Basic EPS
05194 Common Shares Used to Calculate Fully Diluted EPS
05475 Closely Held Shares
08021 Closely Held Shares %
05576 Stock Split/Dividend Ratio
05575 Stock Split/Dividend Ratio - Fiscal
Weekly Time Series 05652 Common Shares Traded – Weekly
05080 Market Price – Week Close
05081 Market Price – Week High
05082 Market Price – Week Low
Balance Sheet
Assets 02001 Cash & Short Term Investments
02003 Cash
02008 Short Term Investments
02051 Receivables (Net)
02130 Securities Inventory
02132 Custody Securities
02255 Investments - Total
02276 Loans - Net
02271 Loans - Total
02275 Reserve for Loan Losses
02240 Real Estate Assets
02257 Investment in Sales and Direct Financing Leases
02250 Other Investments
02256 Investments in Associated Companies
02501 Property, Plant & Equipment - Net
02301 Property, Plant & Equipment - Gross
18375 Land
18376 Buildings
18377 Machinery & Equipment
18378 Rental/Lease Property
18380 Transportation Equipment
18379 Property, Plant & Equipment – Other
18381 Property, Plant & Equipment under Capitalized Leases
02401 Accumulated Depreciation
18383 Accumulated Depreciation - Land
18384 Accumulated Depreciation - Buildings
18385 Accumulated Depreciation - Machinery & Equipment
18386 Accumulated Depreciation - Rental/Leased Property
18388 Accumulated Depreciation - Transportation Equipment
18387 Accumulated Depreciation – Other Property Plant & Equipment
18389 Accumulated Depreciation - PP&E under Capitalized Lease
02652 Other Assets
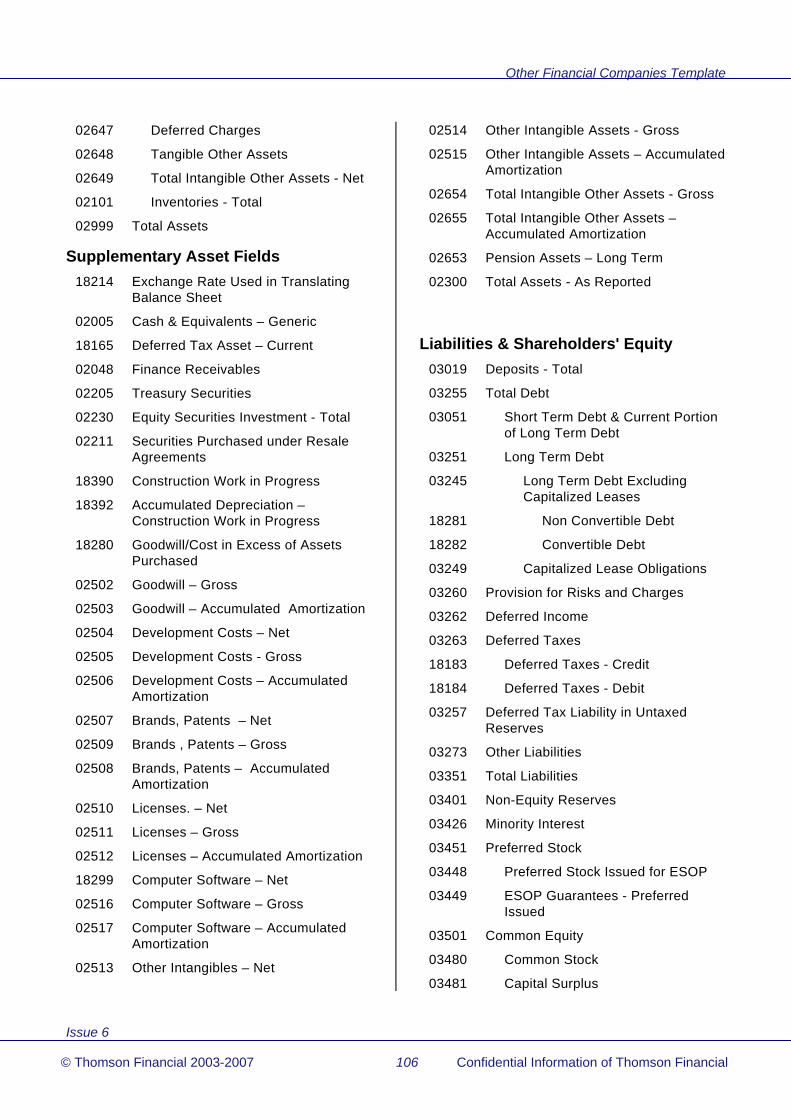
Other Financial Companies Template
Issue 6
© Thomson Financial 2003-2007 106 Confidential Information of Thomson Financial
02647 Deferred Charges
02648 Tangible Other Assets
02649 Total Intangible Other Assets - Net
02101 Inventories - Total
02999 Total Assets
Supplementary Asset Fields 18214 Exchange Rate Used in Translating
Balance Sheet
02005 Cash & Equivalents – Generic
18165 Deferred Tax Asset – Current
02048 Finance Receivables
02205 Treasury Securities
02230 Equity Securities Investment - Total
02211 Securities Purchased under Resale Agreements
18390 Construction Work in Progress
18392 Accumulated Depreciation – Construction Work in Progress
18280 Goodwill/Cost in Excess of Assets Purchased
02502 Goodwill – Gross
02503 Goodwill – Accumulated Amortization
02504 Development Costs – Net
02505 Development Costs - Gross
02506 Development Costs – Accumulated Amortization
02507 Brands, Patents – Net
02509 Brands , Patents – Gross
02508 Brands, Patents – Accumulated Amortization
02510 Licenses. – Net
02511 Licenses – Gross
02512 Licenses – Accumulated Amortization
18299 Computer Software – Net
02516 Computer Software – Gross
02517 Computer Software – Accumulated Amortization
02513 Other Intangibles – Net
02514 Other Intangible Assets - Gross
02515 Other Intangible Assets – Accumulated Amortization
02654 Total Intangible Other Assets - Gross
02655 Total Intangible Other Assets – Accumulated Amortization
02653 Pension Assets – Long Term
02300 Total Assets - As Reported
Liabilities & Shareholders' Equity 03019 Deposits - Total
03255 Total Debt
03051 Short Term Debt & Current Portion of Long Term Debt
03251 Long Term Debt
03245 Long Term Debt Excluding Capitalized Leases
18281 Non Convertible Debt
18282 Convertible Debt
03249 Capitalized Lease Obligations
03260 Provision for Risks and Charges
03262 Deferred Income
03263 Deferred Taxes
18183 Deferred Taxes - Credit
18184 Deferred Taxes - Debit
03257 Deferred Tax Liability in Untaxed Reserves
03273 Other Liabilities
03351 Total Liabilities
03401 Non-Equity Reserves
03426 Minority Interest
03451 Preferred Stock
03448 Preferred Stock Issued for ESOP
03449 ESOP Guarantees - Preferred Issued
03501 Common Equity
03480 Common Stock
03481 Capital Surplus

Other Financial Companies Template
Issue 6
© Thomson Financial 2003-2007 107 Confidential Information of Thomson Financial
03492 Revaluation Reserves
03493 Other Appropriated Reserves
03494 Unappropriated (Free) Reserves
03495 Retained Earnings
03490 Equity in Untaxed Reserves
03496 ESOP Guarantees
03497 Unrealized Foreign Exchange Gain/Loss
03498 Unrealized Gain/Loss on Marketable Securities
03499 Treasury Stock
03999 Total Liabilities & Shareholders' Equity
Supplementary Liabilities & Shareholders’ Equity Fields
03059 Securities Sold but not yet Purchased (Short Call)
18166 Deferred Tax Liability – Current
18232 Current Portion of Long Term Debt
03056 Securities Sold under Repurchase Agreements
03062 Interest Payable
03506 Common Equity – Fully Diluted
03450 Preferred Stock Treated as Common
18289 Non-Redeemable Preferred Stock
18290 Redeemable Preferred Stock
03491 Goodwill Written Off
18065 Cumulative Goodwill Written Off
03261 Pension/Post Retirement Benefits
18352 Unfunded Pension Liabilities
18141 Lease Commitments – Year 1
18142 Lease Commitments – Year 2
18143 Lease Commitments – Year 3
18144 Lease Commitments – Year 4
18145 Lease Commitments – Year 5
18146 Lease Commitments – Over 5 Years
18852 Comprehensive Income – Hedging Gain/Loss
18854 Comprehensive Income – Other
18851 Comprehensive Income – Pension Liability
18853 Comprehensive Income – Unearned Compensation
18168 Mandatorily Redeemable Trust Preferred Securities
18167 Other Mandatory Redeemable Instruments
Income Statement 01001 Net Sales or Revenues
01016 Interest Income - Total
01017 Trading Account Income
01018 Foreign Exchange Income
01019 Trusts & Fiduciary Income/Commission & Fees
01014 Trust Income
01015 Commission & Fees
01006 Investment Income
01020 Other Operating Income
01051 Cost of Goods Sold
01151 Depreciation, Depletion & Amortization
01148 Depreciation
01149 Amortization of Intangibles
01150 Amortization of Deferred Charges
01100 Gross Income
01101 Selling, General & Administrative Expenses
01075 Interest Expense – Total
01271 Provision for Loan Losses
01230 Other Operating Expenses
01249 Operating Expenses - Total
01250 Operating Income
01266 Non-Operating Interest Income
01267 Pre-tax Equity in Earnings
01253 Extraordinary Credit - Pre-tax
01254 Extraordinary Charge - Pre-tax

Other Financial Companies Template
Issue 6
© Thomson Financial 2003-2007 108 Confidential Information of Thomson Financial
01262 Other Income/Expense - Net
01301 Reserves - Increase/Decrease
01401 Pre-tax Income
01451 Income Taxes
18186 Current Domestic Income Tax
18187 Current Foreign Income Tax
18188 Deferred Domestic Income Tax
18189 Deferred Foreign Income Tax
18185 Income Tax Credits
01501 Minority Interest
01503 Equity in Earnings
01504 After Tax Other Income/Expense
01505 Discontinued Operations
01551 Net Income before Extraordinary Items/Preferred Dividends
01701 Preferred Dividend Requirements
01706 Net Income after Preferred Dividends (Basic EPS)
01601 Extraordinary Items & Gain/Loss Sale of Assets
Supplementary Income Statement Fields
18215 Exchange Rate Used in Translating Income Statement/Cash Flow
01024 Rental Income
01251 Interest Expense on Debt
01255 Interest Capitalized
18140 Rental/Operating Lease Expense
01084 Staff Costs
01085 Equipment Expense
01302 Operating Provisions
01204 Taxes other than Income Taxes
01268 Dividend Income - Non-Operating
18227 Restructuring Expense
01152 Amortization of Brands
01153 Amortization of Research and Development
01154 Amortization of Licenses
01155 Amortization of Other Intangibles
01156 Amortization of Goodwill
01157 Amortization of Computer Software
18224 Amortization and Impairment of Goodwill
18225 Impairment of Goodwill
18226 Impairment of Other Intangibles
18274 Impairment of Property, Plant & Equipment
18275 Impairment of Financial Fixed Assets
01265 Monetary Correction
01305 Gain on Sale of Investment
01269 Discontinued Operations - Pre-tax
01306 Gain/loss on Disposal of Assets
01352 Foreign Exchange Transactions
01351 Foreign Currency Translation Gain/Loss
18191 Earnings before Interest and Taxes (EBIT)
18198 Earnings before Interest, Taxes & Depreciation (EBITDA)
18200 Discontinued Operations – Total
18150 Income from Continuing Operations
18175 Ordinary Profit (Japan)
01651 Net Income - Bottom Line
01751 Net Income Used to Calculate Earnings per Share
01705 Net Income Used to Calculate Fully Diluted Earnings per Share
18218 Cumulative Effect of Accounting Change
18170 Unconsolidated/Parent Company Sales
18169 Unconsolidated/Parent Company Depreciation
18171 Unconsolidated/Parent Company Pre-tax Income
18172 Unconsolidated/Parent Company Net Profit
18173 Unconsolidated/Parent Company Earnings per Share
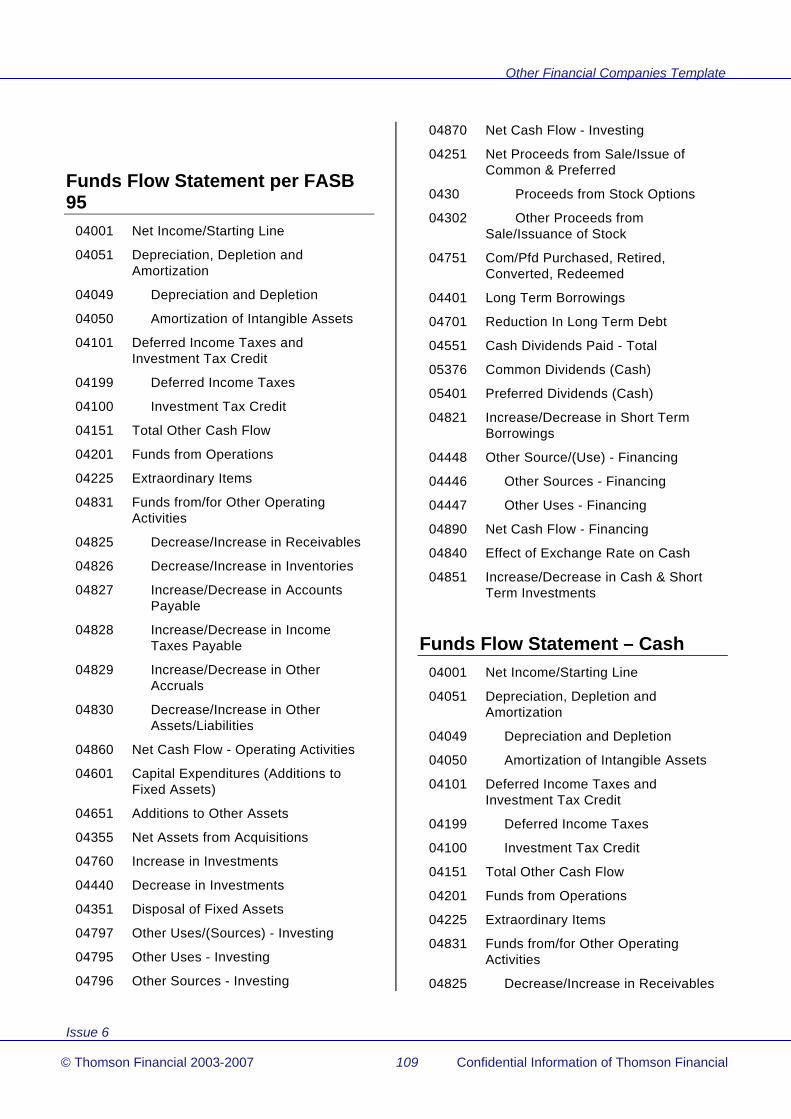
Other Financial Companies Template
Issue 6
© Thomson Financial 2003-2007 109 Confidential Information of Thomson Financial
Funds Flow Statement per FASB 95
04001 Net Income/Starting Line
04051 Depreciation, Depletion and Amortization
04049 Depreciation and Depletion
04050 Amortization of Intangible Assets
04101 Deferred Income Taxes and Investment Tax Credit
04199 Deferred Income Taxes
04100 Investment Tax Credit
04151 Total Other Cash Flow
04201 Funds from Operations
04225 Extraordinary Items
04831 Funds from/for Other Operating Activities
04825 Decrease/Increase in Receivables
04826 Decrease/Increase in Inventories
04827 Increase/Decrease in Accounts Payable
04828 Increase/Decrease in Income Taxes Payable
04829 Increase/Decrease in Other Accruals
04830 Decrease/Increase in Other Assets/Liabilities
04860 Net Cash Flow - Operating Activities
04601 Capital Expenditures (Additions to Fixed Assets)
04651 Additions to Other Assets
04355 Net Assets from Acquisitions
04760 Increase in Investments
04440 Decrease in Investments
04351 Disposal of Fixed Assets
04797 Other Uses/(Sources) - Investing
04795 Other Uses - Investing
04796 Other Sources - Investing
04870 Net Cash Flow - Investing
04251 Net Proceeds from Sale/Issue of Common & Preferred
0430 Proceeds from Stock Options
04302 Other Proceeds from Sale/Issuance of Stock
04751 Com/Pfd Purchased, Retired, Converted, Redeemed
04401 Long Term Borrowings
04701 Reduction In Long Term Debt
04551 Cash Dividends Paid - Total
05376 Common Dividends (Cash)
05401 Preferred Dividends (Cash)
04821 Increase/Decrease in Short Term Borrowings
04448 Other Source/(Use) - Financing
04446 Other Sources - Financing
04447 Other Uses - Financing
04890 Net Cash Flow - Financing
04840 Effect of Exchange Rate on Cash
04851 Increase/Decrease in Cash & Short Term Investments
Funds Flow Statement – Cash 04001 Net Income/Starting Line
04051 Depreciation, Depletion and Amortization
04049 Depreciation and Depletion
04050 Amortization of Intangible Assets
04101 Deferred Income Taxes and Investment Tax Credit
04199 Deferred Income Taxes
04100 Investment Tax Credit
04151 Total Other Cash Flow
04201 Funds from Operations
04225 Extraordinary Items
04831 Funds from/for Other Operating Activities
04825 Decrease/Increase in Receivables

Other Financial Companies Template
Issue 6
© Thomson Financial 2003-2007 110 Confidential Information of Thomson Financial
04826 Decrease/Increase in Inventories
04827 Increase/Decrease in Accounts Payable
04828 Increase/Decrease in Income Taxes Payable
04829 Increase/Decrease in Other Accruals
04830 Decrease/Increase in Other Assets/Liabilities
04401 Long Term Borrowings
04251 Net Proceeds from Sale/Issue of Common & Preferred
04301 Proceeds from Stock Options
04302 Other Proceeds from Sale/Issuance of Stock
04351 Disposal of Fixed Assets
04440 Decrease in Investments
04821 Increase/Decrease in Short Term Borrowings
04446 Other Sources - Financing
04796 Other Sources - Investing
04450 Other Sources
04551 Cash Dividends Paid - Total
05376 Common Dividends (Cash)
05401 Preferred Dividends (Cash)
04760 Increase in Investments
04701 Reduction in Long Term Debt
04601 Capital Expenditures (Additions to Fixed Assets)
04355 Net Assets from Acquisitions
04751 Com/Pfd Purchased, Retired, Converted, Redeemed
04651 Additions to Other Assets
04795 Other Uses - Investing
04447 Other Uses - Financing
04799 Other Uses
04840 Effect of Exchange Rate on Cash
04452 Changes in Cash and/or Liquid Items
04851 Increase/Decrease in Cash & Short Term Investments
Funds Flow Statement – Total Sources/Total Uses
Sources of Funds 04001 Net Income/Starting Line
04051 Depreciation, Depletion and Amortization
04049 Depreciation and Depletion
04050 Amortization of Intangible Assets
04101 Deferred Income Taxes and Investment Tax Credit
04199 Deferred Income Taxes
04100 Investment Tax Credit
04151 Total Other Cash Flow
04201 Funds from Operations
04225 Extraordinary Items
04831 Funds from/for Other Operating Activities
04825 Decrease/Increase in Receivables
04826 Decrease/Increase in Inventories
04827 Increase/Decrease in Accounts Payable
04828 Increase/Decrease in Income Taxes Payable
04829 Increase/Decrease in Other Accruals
04830 Decrease/Increase in Other Assets/Liabilities
04401 Long Term Borrowings
04251 Net Proceeds from Sale/Issue of Common & Preferred
04301 Proceeds from Stock Options
04302 Other Proceeds from Sale/Issuance of Stock
04351 Disposal of Fixed Assets
04440 Decrease in Investments
04821 Increase/Decrease in Short Term Borrowings
04840 Effect of Exchange Rate on Cash
04452 Changes in Cash and/or Liquid Items
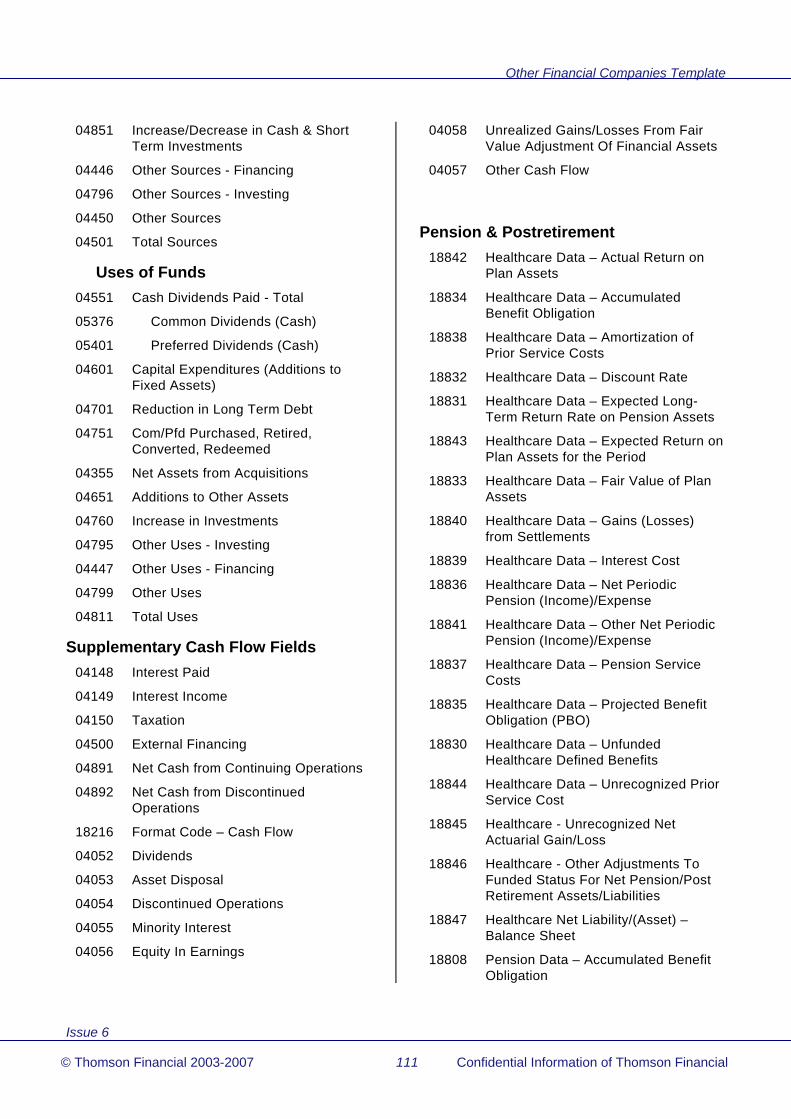
Other Financial Companies Template
Issue 6
© Thomson Financial 2003-2007 111 Confidential Information of Thomson Financial
04851 Increase/Decrease in Cash & Short Term Investments
04446 Other Sources - Financing
04796 Other Sources - Investing
04450 Other Sources
04501 Total Sources
Uses of Funds 04551 Cash Dividends Paid - Total
05376 Common Dividends (Cash)
05401 Preferred Dividends (Cash)
04601 Capital Expenditures (Additions to Fixed Assets)
04701 Reduction in Long Term Debt
04751 Com/Pfd Purchased, Retired, Converted, Redeemed
04355 Net Assets from Acquisitions
04651 Additions to Other Assets
04760 Increase in Investments
04795 Other Uses - Investing
04447 Other Uses - Financing
04799 Other Uses
04811 Total Uses
Supplementary Cash Flow Fields 04148 Interest Paid
04149 Interest Income
04150 Taxation
04500 External Financing
04891 Net Cash from Continuing Operations
04892 Net Cash from Discontinued Operations
18216 Format Code – Cash Flow
04052 Dividends
04053 Asset Disposal
04054 Discontinued Operations
04055 Minority Interest
04056 Equity In Earnings
04058 Unrealized Gains/Losses From Fair Value Adjustment Of Financial Assets
04057 Other Cash Flow
Pension & Postretirement 18842 Healthcare Data – Actual Return on
Plan Assets
18834 Healthcare Data – Accumulated Benefit Obligation
18838 Healthcare Data – Amortization of Prior Service Costs
18832 Healthcare Data – Discount Rate
18831 Healthcare Data – Expected Long-Term Return Rate on Pension Assets
18843 Healthcare Data – Expected Return on Plan Assets for the Period
18833 Healthcare Data – Fair Value of Plan Assets
18840 Healthcare Data – Gains (Losses) from Settlements
18839 Healthcare Data – Interest Cost
18836 Healthcare Data – Net Periodic Pension (Income)/Expense
18841 Healthcare Data – Other Net Periodic Pension (Income)/Expense
18837 Healthcare Data – Pension Service Costs
18835 Healthcare Data – Projected Benefit Obligation (PBO)
18830 Healthcare Data – Unfunded Healthcare Defined Benefits
18844 Healthcare Data – Unrecognized Prior Service Cost
18845 Healthcare - Unrecognized Net Actuarial Gain/Loss
18846 Healthcare - Other Adjustments To Funded Status For Net Pension/Post Retirement Assets/Liabilities
18847 Healthcare Net Liability/(Asset) – Balance Sheet
18808 Pension Data – Accumulated Benefit Obligation

Other Financial Companies Template
Issue 6
© Thomson Financial 2003-2007 112 Confidential Information of Thomson Financial
18816 Pension Data – Actual Return on Plan Assets
18802 Pension Data – Asset Allocation - % Bonds
18801 Pension Data – Asset Allocation - % Equities
18804 Pension Data – Asset Allocation - % Other
18803 Pension Data – Asset Allocation - % Property
18805 Pension Data – Expected Long-Term Return Rate on Pension Assets
18817 Pension Data – Expected Return on Plan Assets for the Period
18807 Pension Data – Fair Value of Plan Assets
18814 Pension Data – Gains (Losses) from Settlements
18810 Pension Data – Net Periodic Pension (Income)/Expense
18815 Pension Data – Other Net Periodic Pension (Income)/Expense
18806 Pension Data – Pension Discount Rate
18813 Pension Data – Pension Interest Cost
18811 Pension Data – Pension Service Costs
18812 Pension Data – Prior Service Costs
18809 Pension Data – Projected Benefit Obligation (PBO)
18818 Pension Data – Unrecognized Prior Service Cost
18819 Pension Data-Unrecognized Net Actuarial Gain/Loss
18820 Pension Data - Other Adjustments To Funded Status for Net Pension/Post Retirement Assets/Liabilities
18821 Pension Data - Net Pension Liability/(Asset) – Balance Sheet
Other Fields 18231 Weighted Cost of Debt
03998 Total Capital
18192 Dividends Provided for or Paid - Common
08015 Net Capital Requirement
18199 Net Debt
18322 Stock Option Compensation Expense – Adjustment to Net Income, Net of Tax
18321 Stock Option Compensation, Net of Tax
03995 Total Shareholders’ Equity
5 Year Summary Data 19760 Summary As Reported Year- Current Yr
19761 Summary As Reported Revenue – Cur. Yr.
19762 Summary As Reported Net Inc. – Cur Yr
19763 Summary As Reported EPS Basic – Cur Yr
19764 Summary As Reported EPS Dil. – Cur Yr
19765 Summary As Reported Equity – Cur Yr
19766 Summary As Reported Year- -1 Year
19767 Summary As Reported Revenue – -1 Yr
19768 Summary As Reported Net Inc. – -1 Yr
19769 Summary As Reported EPS Basic – -1 Yr
19770 Summary As Reported EPS Dil. –
-1 Yr
19771 Summary As Reported Equity – -1 Yr
19772 Summary As Reported Year- -2 Year
19773 Summary As Reported Revenue – -2 Yr
19774 Summary As Reported Net Inc. –
-2 Yr
19775 Summary As Reported EPS Basic – -2 Yr

Other Financial Companies Template
Issue 6
© Thomson Financial 2003-2007 113 Confidential Information of Thomson Financial
19776 Summary As Reported EPS Dil. – -2 Yr
19777 Summary As Reported Equity –
-2 Yr
19778 Summary As Reported Year- -3 Year
19779 Summary As Reported Revenue – -3Yr
19780 Summary As Reported Net Inc. –
-3 Yr
19781 Summary As Reported EPS Basic – -3 Yr
19782 Summary As Reported EPS Dil. –
-3 Yr
19783 Summary As Reported Equity –
-3 Yr
19784 Summary As Reported Year- -4 Year
19785 Summary As Reported Revenue – -4Yr
19786 Summary As Reported Net Inc. –
-4 Yr
19787 Summary As Reported EPS Basic – -4 Yr
19788 Summary As Reported EPS Dil. –
-4 Yr
19789 Summary As Reported Equity –
-4 Yr
Annual Series Interim Data
Qtr 1 Qtr 2 Qtr 3 Qtr 4
Interim Sales 19101 19102 19103 19104
Interim Pre-tax Income
19105 19106 19107 19108
Interim Net Profit
19109 19110 19111 19112
Number of Months-EPS
05217 05218 05219 05220
Earnings per Share
05221 05222 05223 05224
Qtr 1 Qtr 2 Qtr 3 Qtr 4
Earnings per Share – Basic
05211 05212 05213 05214
Fully Diluted EPS
05291 05292 05293 05294
EPS - Report Date
05901 05902 05903 05904
EPS - 12 Months
05251 05252 05253 05254
EPS - 5 yr avg
05261 05262 05263 05264
Dividends per Share
05121 05122 05123 05124
DPS – Gross 05125 05126 05127 05128
DPS - Declared Date
05910 05911 05912 05913
DPS - Record Date
05917 05918 05919 05920
DPS - Ex-Div Date
05923 05924 05925 05926
DPS - Payable Date
05929 05930 05931 05932
DPS – Extra 05151 05152 05153 05154
DPS - Extra – Gross
05171 05172 05173 05174
DPS - Extra - Dec Date
05935 05936 05937 05938
DPS - Extra - Rec Date
05941 05942 05943 05944
DPS - Extra - Ex-Div Date
05947 05948 05949 05950
DPS - Extra - Pay Date
05953 05954 05955 05956
DPS - Special
05155 05156 05157 05158
DPS - Special - Gross05175
05176 05177 05178
DPS - Special - Dec Date
05965 05966 05968 05969

Other Financial Companies Template
Issue 6
© Thomson Financial 2003-2007 114 Confidential Information of Thomson Financial
Qtr 1 Qtr 2 Qtr 3 Qtr 4
DPS - Special - Rec Date
05970 05971 05972 05973
DPS - Special - Ex-Div Date
05959 05960 05961 05962
DPS - Special - Payable Date
05976 05977 05978 05979
DPS - 12 Months
05131 05132 05133 05134
DPS - 5 yr avg
05141 05142 05143 05144
Monthly Price Information
Month End Market Price
High Price
Low Price
January 05015 05016 05017
February 05020 05021 05022
March 05025 05026 05027
April 05030 05031 05032
May 05035 05036 05037
June 05040 05041 05042
July 05045 05046 05047
August 05050 05051 05052
September 05055 05056 05057
October 05060 05061 05062
November 05065 05066 05067
December 05070 05071 05072
Stock Performance
Current Information 09102 Price/Earnings Ratio - Current
09103 Price/Earnings Ratio - Current High
09105 Price/Earnings Ratio - Current Low
09202 Earnings Yield - Current
09203 Earnings Yield - Current High
09205 Earnings Yield - Current Low
09302 Price/Book Value Ratio - Current
09602 Price/Cash Flow - Current
09402 Dividend Yield - Current
08372 Return on Equity - per Share - Current
08652 Reinvestment Rate - per Share - Current
09502 Dividend Payout - per Share - Current
09001 Price Trend - Last Week
09005 Price Trend - Four Week
09011 Price Trend - Quarter to Date
09016 Price Trend - Previous Quarter
09021 Price Trend - Year to Date
09006 Price Trend - 13 Weeks
09007 Price Trend – 26 Weeks
09026 Price Trend - 52 Weeks
09802 Beta
09803 Alpha
Annual Statistics 09104 Price/Earnings Ratio - Close
09100 Price/Earnings Ratio - High
09101 Price/Earnings Ratio - Low
09106 Price/Earnings Ratio - Avg High-Low
09204 Earnings Yield - Close
09200 Earnings Yield - High
09201 Earnings Yield - Low
09206 Earnings Yield - Avg High-Low
09604 Price/Cash Flow Ratio
09404 Dividend Yield - Close
09400 Dividend Yield - High
09401 Dividend Yield - Low
09406 Dividend Yield - Avg High-Low
09504 Dividend Payout per Share
09304 Price/Book Value Ratio - Close

Other Financial Companies Template
Issue 6
© Thomson Financial 2003-2007 115 Confidential Information of Thomson Financial
09300 Price/Book Value Ratio - High
09301 Price/Book Value Ratio - Low
09306 Price/Book Value Ratio - Avg High-Low
09904 Price/Sales per Share Ratio
08801 Total Investment Return
08806 Price Volatility
09704 Market Capitalization/Common Equity
Three Year Averages 08803 Total Investment Return
Five Year Averages 09121 Price/Earnings Ratio – Close
09111 Price/Earnings Ratio - High
09116 Price/Earnings Ratio - Low
09126 Price/Earnings Ratio - Avg High-Low
09221 Earnings Yield - Close
09211 Earnings Yield - High
09216 Earnings Yield - Low
09226 Earnings Yield - Avg High-Low
09621 Price/Cash Flow Ratio
09421 Dividend Yield - Close
09411 Dividend Yield - High
09416 Dividend Yield - Low
09426 Dividend Yield - Avg High-Low
09521 Dividend Payout per Share
09321 Price/Book Value Ratio - Close
09311 Price/Book Value Ratio - High
09316 Price/Book Value Ratio - Low
09326 Price/Book Value Ratio - Avg High-Low
08805 Total Investment Return
09721 Market Capitalization/Common Equity
Growth Rates
Annual Statistics 08631 Net Sales/Revenues Growth
08646 Operating Income Growth
08636 Net Income Growth
08621 Total Assets Growth
08616 Equity Growth
08626 Employees Growth
08601 Earnings per Share Growth
08611 Dividends per Share Growth
08606 Book Value per Share Growth
08666 Loans Growth
08676 Net Margin Growth
08579 Market Capitalization Growth
08816 Earnings Per Share Fiscal Growth
08821 Book Value Per Share Fiscal Growth
Three Year Averages 08581 Market Capitalization Growth
08604 Earnings per Share Growth
Five Year Averages 08635 Net Sales/Revenues Growth
08650 Operating Income Growth
08640 Net Income Growth
08625 Total Assets Growth
08620 Equity Growth
08630 Employees Growth
08605 Earnings per Share Growth
08615 Dividends per Share Growth
08610 Book Value per Share Growth
08670 Loans Growth
08680 Net Margin Growth
Profitability
Annual Statistics 08301 Return on Equity - Total (%)
08371 Return on Equity - Per Share
08302 Return on Equity – Per Share Fiscal

Other Financial Companies Template
Issue 6
© Thomson Financial 2003-2007 116 Confidential Information of Thomson Financial
08653 Reinvestment Rate – Per Share Fiscal
08651 Reinvestment Rate - Per Share
08656 Reinvestment Rate - Total
08326 Return on Assets
08376 Return on Invested Capital
08911 Retained Earnings % Equity
08381 Cash Earnings Return on Equity
08311 Cash Flow/Sales
08331 Cost of Goods Sold/Sales
08306 Gross Profit Margin
08336 Selling, General & Administrative Expenses/Sales
08316 Operating Profit Margin
08361 Operating Income Return on Total Capital
08321 Pre-tax Margin
08346 Tax Rate
08356 Interest Rate - Estimated Average
15611 Efficiency of Earnings Assets
08366 Net Margin
15173 Earning Assets % Total Available Funds
15587 Earning Assets % Total Assets
08351 Sales per Employee
Five Year Averages 08305 Return on Equity – Total (%)
08375 Return on Equity - per Share
08655 Reinvestment Rate - per Share
08660 Reinvestment Rate - Total
08330 Return on Assets
08380 Return on Invested Capital
08915 Retained Earnings % Equity
08385 Cash Earnings Return on Equity
08315 Cash Flow/Sales
08335 Cost of Goods Sold/Sales
08310 Gross Profit Margin
08340 Selling, General & Administrative Expenses/Sales
08320 Operating Profit Margin
08365 Operating Income Return on Total Capital
08325 Pre-tax Margin
08350 Tax Rate
08360 Interest Rate - Estimated Average
08370 Net Margin
15614 Efficiency of Earnings Assets
15176 Earning Assets % Total Available Funds
15590 Earning Assets % Total Assets
08355 Sales per Employee
Loan Loss Ratios
Annual Statistics 15073 Reserves for Loan Losses % Total
Loans
15079 Provision for Loan Losses % Total Loans
15156 Reserves for Loan Losses % Total Assets
Five Year Averages 15076 Reserves for Loan Losses % Total
Loans
15082 Provision for Loan Losses % Total Loans
15159 Reserves for Loan Losses % Total Assets
Asset Utilization
Annual Statistics 08406 Assets per Employee
08401 Total Asset Turnover
15043 Total Loans % Total Assets
15091 Invested Assets % Total Assets
08416 Capital Expenditures % Total Assets
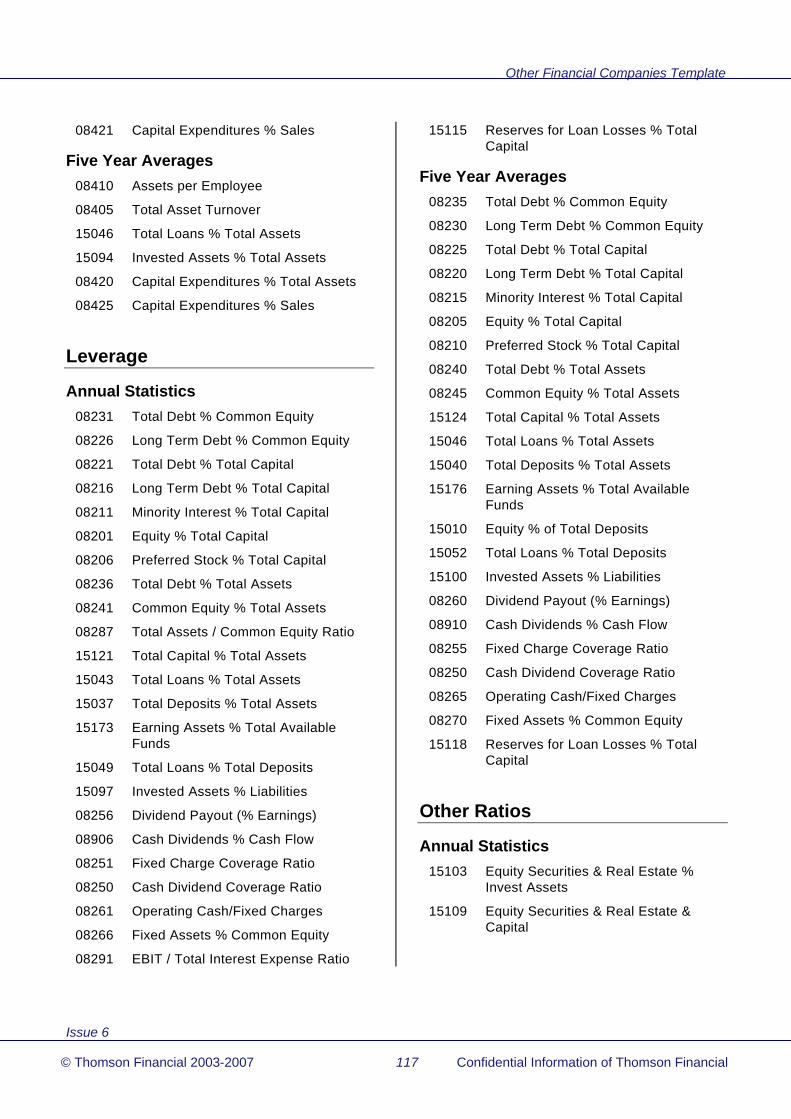
Other Financial Companies Template
Issue 6
© Thomson Financial 2003-2007 117 Confidential Information of Thomson Financial
08421 Capital Expenditures % Sales
Five Year Averages 08410 Assets per Employee
08405 Total Asset Turnover
15046 Total Loans % Total Assets
15094 Invested Assets % Total Assets
08420 Capital Expenditures % Total Assets
08425 Capital Expenditures % Sales
Leverage
Annual Statistics 08231 Total Debt % Common Equity
08226 Long Term Debt % Common Equity
08221 Total Debt % Total Capital
08216 Long Term Debt % Total Capital
08211 Minority Interest % Total Capital
08201 Equity % Total Capital
08206 Preferred Stock % Total Capital
08236 Total Debt % Total Assets
08241 Common Equity % Total Assets
08287 Total Assets / Common Equity Ratio
15121 Total Capital % Total Assets
15043 Total Loans % Total Assets
15037 Total Deposits % Total Assets
15173 Earning Assets % Total Available Funds
15049 Total Loans % Total Deposits
15097 Invested Assets % Liabilities
08256 Dividend Payout (% Earnings)
08906 Cash Dividends % Cash Flow
08251 Fixed Charge Coverage Ratio
08250 Cash Dividend Coverage Ratio
08261 Operating Cash/Fixed Charges
08266 Fixed Assets % Common Equity
08291 EBIT / Total Interest Expense Ratio
15115 Reserves for Loan Losses % Total Capital
Five Year Averages 08235 Total Debt % Common Equity
08230 Long Term Debt % Common Equity
08225 Total Debt % Total Capital
08220 Long Term Debt % Total Capital
08215 Minority Interest % Total Capital
08205 Equity % Total Capital
08210 Preferred Stock % Total Capital
08240 Total Debt % Total Assets
08245 Common Equity % Total Assets
15124 Total Capital % Total Assets
15046 Total Loans % Total Assets
15040 Total Deposits % Total Assets
15176 Earning Assets % Total Available Funds
15010 Equity % of Total Deposits
15052 Total Loans % Total Deposits
15100 Invested Assets % Liabilities
08260 Dividend Payout (% Earnings)
08910 Cash Dividends % Cash Flow
08255 Fixed Charge Coverage Ratio
08250 Cash Dividend Coverage Ratio
08265 Operating Cash/Fixed Charges
08270 Fixed Assets % Common Equity
15118 Reserves for Loan Losses % Total Capital
Other Ratios
Annual Statistics 15103 Equity Securities & Real Estate %
Invest Assets
15109 Equity Securities & Real Estate & Capital

Other Financial Companies Template
Issue 6
© Thomson Financial 2003-2007 118 Confidential Information of Thomson Financial
Five Year Averages 15106 Equity Securities & Real Estate %
Invest Assets
15112 Equity Securities & Real Estate & Capital
Foreign Business
Annual Statistics 07151 International Assets
07101 International Sales
07126 International Operating Income
08711 Foreign Return on Assets
08706 Foreign Asset Turnover
08701 Foreign Income Margin
08716 Foreign Assets Growth
08721 Foreign Sales Growth
08726 Foreign Income Growth
08736 Foreign Assets % Tot Assets
08731 Foreign Sales % Tot Sales
08741 Foreign Income % Total Income
Five Year Averages 08715 Foreign Return on Assets
08710 Foreign Asset Turnover
08705 Foreign Income Margin
08720 Foreign Assets Growth
08725 Foreign Sales Growth
08730 Foreign Income Growth
08740 Foreign Assets % Total Assets
08735 Foreign Sales % Total Sales
08745 Foreign Income % Total Income
Geographic Segment Data 19600 Geographic Segment 1 - Description
19601 Geographic Segment 1 - Sales
19602 Geographic Segment 1 - Operating Income
19603 Geographic Segment 1 - Assets
19604 Geographic Segment 1 - Capital Expenditures
19605 Geographic Segment 1 - Depreciation
19610 Geographic Segment 2 - Description
19611 Geographic Segment 2 - Sales
19612 Geographic Segment 2 - Operating Income
19613 Geographic Segment 2 - Assets
19614 Geographic Segment 2 - Capital Expenditures
19615 Geographic Segment 2 - Depreciation
19620 Geographic Segment 3 - Description
19621 Geographic Segment 3 - Sales
19622 Geographic Segment 3 - Operating Income
19623 Geographic Segment 3 - Assets
19624 Geographic Segment 3 - Capital Expenditures
19625 Geographic Segment 3 - Depreciation
19630 Geographic Segment 4 - Description
19631 Geographic Segment 4 - Sales
19632 Geographic Segment 4 - Operating Income
19633 Geographic Segment 4 - Assets
19634 Geographic Segment 4 - Capital Expenditures
19635 Geographic Segment 4 - Depreciation
19640 Geographic Segment 5 - Description
19641 Geographic Segment 5 - Sales
19642 Geographic Segment 5 - Operating Income
19643 Geographic Segment 5 - Assets
19644 Geographic Segment 5 - Capital Expenditures
19645 Geographic Segment 5 - Depreciation
19650 Geographic Segment 6 - Description
19651 Geographic Segment 6 - Sales
19652 Geographic Segment 6 - Operating Income

Other Financial Companies Template
Issue 6
© Thomson Financial 2003-2007 119 Confidential Information of Thomson Financial
19653 Geographic Segment 6 - Assets
19654 Geographic Segment 6 - Capital Expenditures
19655 Geographic Segment 6 - Depreciation
19660 Geographic Segment 7 - Description
19661 Geographic Segment 7 - Sales
19662 Geographic Segment 7 - Operating Income
19663 Geographic Segment 7 - Assets
19664 Geographic Segment 7 - Capital Expenditures
19665 Geographic Segment 7 - Depreciation
19670 Geographic Segment 8 - Description
19671 Geographic Segment 8 - Sales
19672 Geographic Segment 8 - Operating Income
19673 Geographic Segment 8 - Assets
19674 Geographic Segment 8 - Capital Expenditures
19675 Geographic Segment 8 - Depreciation
19680 Geographic Segment 9 - Description
19681 Geographic Segment 9 - Sales
19682 Geographic Segment 9 - Operating Income
19683 Geographic Segment 9 - Assets
19684 Geographic Segment 9 - Capital Expenditures
19685 Geographic Segment 9 - Depreciation
19690 Geographic Segment 10 - Description
19691 Geographic Segment 10 - Sales
19692 Geographic Segment 10 - Operating Income
19693 Geographic Segment 10 - Assets
19694 Geographic Segment 10 – Capital Expenditures
19695 Geographic Segment 10 - Depreciation
Company Specific Accounting Practices
07531 Accounting method for long term investment > 50%
07536 Accounting standards followed
07546 Auditors' opinion
Multiple Share Data 20001 Type of Share - Mult Share 1
20003 Worldscope Identifier - Mult Share 1
20005 SEDOL - Mult Share 1
20006 CUSIP - Mult Share 1
20007 ISIN - Mult Share 1
20008 Ticker Symbol - Mult Share 1
20009 Stock Exchange(s) Listed - Mult Share 1
20011 Inactive Date - Mult Share 1
20020 Common Shares Outstanding - Current - Mult Share 1
20021 Market Price - Current - Mult Share 1
20022 Date of Current Price - Mult Share 1
20023 Market Capitalization - Current - Mult Share 1
20024 Earnings per Share - Last 12 Mos - Mult Share 1
20025 Dividends per Share - Last 12 Mos - Mult Share 1
20026 Price/Earnings Ratio - Current - Mult Share 1
20027 Price/Book Value Ratio - Current - Mult Share 1
20028 Dividend Yield - Current - Mult Share 1
20040 Common Shares Outstanding - Mult Share 1
20002 Par Value - Mult Share 1
20042 Market Price - Year End - Mult Share 1
20041 Market Capitalization - Mult Share 1
20043 Earnings per Share - Mult Share 1
20044 Dividends per Share - Mult Share 1

Other Financial Companies Template
Issue 6
© Thomson Financial 2003-2007 120 Confidential Information of Thomson Financial
20045 Book Value per Share - Mult Share 1
20046 Price/Earnings Ratio - Close - Mult Share 1
20047 Price/Book Value Ratio - Close - Mult Share 1
20048 Dividend Yield - Close - Mult Share 1
20101 Type of Share - Mult Share 2
20103 Worldscope Identifier - Mult Share 2
20105 SEDOL - Mult Share 2
20106 CUSIP - Mult Share 2
20107 ISIN - Mult Share 2
20108 Ticker Symbol - Mult Share 2
20109 Stock Exchange(s) Listed - Mult Share 2
20111 Inactive Date - Mult Share 2
20120 Common Shares Outstanding - Current - Mult Share 2
20121 Market Price - Current - Mult Share 2
20122 Date of Current Price - Mult Share 2
20123 Market Capitalization - Current - Mult Share 2
20124 Earnings per Share - Last 12 Mos - Mult Share 2
20125 Dividends per Share - Last 12 Mos - Mult Share 2
20126 Price/Earnings Ratio - Current - Mult Share 2
20127 Price/Book Value Ratio - Current - Mult Share 2
20128 Dividend Yield - Current - Mult Share 2
20140 Common Shares Outstanding - Mult Share 2
20102 Par Value - Mult Share 2
20142 Market Price - Year End - Mult Share 2
20141 Market Capitalization - Mult Share 2
20143 Earnings per Share - Mult Share 2
20144 Dividends per Share - Mult Share 2
20145 Book Value per Share - Mult Share 2
20146 Price/Earnings Ratio - Close - Mult Share 2
20147 Price/Book Value Ratio - Close - Mult Share 2
20148 Dividend Yield - Close - Mult Share 2
20201 Type of Share - Mult Share 3
20203 Worldscope Identifier - Mult Share 3
20205 SEDOL - Mult Share 3
20206 CUSIP - Mult Share 3
20207 ISIN - Mult Share 3
20208 Ticker Symbol - Mult Share 3
20209 Stock Exchange(s) Listed - Mult Share 3
20211 Inactive Date - Mult Share 3
20220 Common Shares Outstanding - Current - Mult Share 3
20221 Market Price - Current - Mult Share 3
20222 Date of Current Price - Mult Share 3
20223 Market Capitalization - Current - Mult Share 3
20224 Earnings per Share - Last 12 Mos - Mult Share 3
20225 Dividends per Share - Last 12 Mos - Mult Share 3
20226 Price/Earnings Ratio - Current - Mult Share 3
20227 Price/Book Value Ratio - Current - Mult Share 3
20228 Dividend Yield - Current - Mult Share 3
20240 Common Shares Outstanding - Mult Share 3
20202 Par Value - Mult Share 3
20242 Market Price - Year End - Mult Share 3
20241 Market Capitalization - Mult Share 3
20243 Earnings per Share - Mult Share 3
20244 Dividends per Share - Mult Share 3
20245 Book Value per Share - Mult Share 3
20246 Price/Earnings Ratio - Close - Mult Share 3
20247 Price/Book Value Ratio - Close - Mult Share 3
20248 Dividend Yield - Close - Mult Share 3
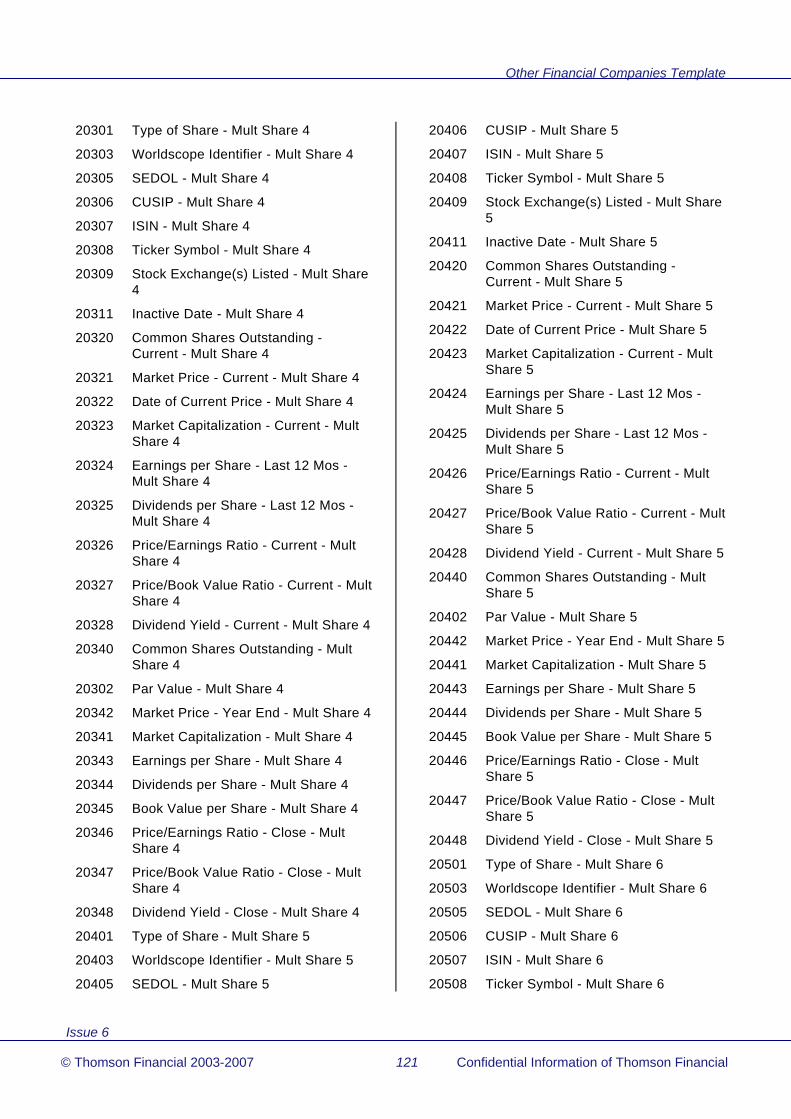
Other Financial Companies Template
Issue 6
© Thomson Financial 2003-2007 121 Confidential Information of Thomson Financial
20301 Type of Share - Mult Share 4
20303 Worldscope Identifier - Mult Share 4
20305 SEDOL - Mult Share 4
20306 CUSIP - Mult Share 4
20307 ISIN - Mult Share 4
20308 Ticker Symbol - Mult Share 4
20309 Stock Exchange(s) Listed - Mult Share 4
20311 Inactive Date - Mult Share 4
20320 Common Shares Outstanding - Current - Mult Share 4
20321 Market Price - Current - Mult Share 4
20322 Date of Current Price - Mult Share 4
20323 Market Capitalization - Current - Mult Share 4
20324 Earnings per Share - Last 12 Mos - Mult Share 4
20325 Dividends per Share - Last 12 Mos - Mult Share 4
20326 Price/Earnings Ratio - Current - Mult Share 4
20327 Price/Book Value Ratio - Current - Mult Share 4
20328 Dividend Yield - Current - Mult Share 4
20340 Common Shares Outstanding - Mult Share 4
20302 Par Value - Mult Share 4
20342 Market Price - Year End - Mult Share 4
20341 Market Capitalization - Mult Share 4
20343 Earnings per Share - Mult Share 4
20344 Dividends per Share - Mult Share 4
20345 Book Value per Share - Mult Share 4
20346 Price/Earnings Ratio - Close - Mult Share 4
20347 Price/Book Value Ratio - Close - Mult Share 4
20348 Dividend Yield - Close - Mult Share 4
20401 Type of Share - Mult Share 5
20403 Worldscope Identifier - Mult Share 5
20405 SEDOL - Mult Share 5
20406 CUSIP - Mult Share 5
20407 ISIN - Mult Share 5
20408 Ticker Symbol - Mult Share 5
20409 Stock Exchange(s) Listed - Mult Share 5
20411 Inactive Date - Mult Share 5
20420 Common Shares Outstanding - Current - Mult Share 5
20421 Market Price - Current - Mult Share 5
20422 Date of Current Price - Mult Share 5
20423 Market Capitalization - Current - Mult Share 5
20424 Earnings per Share - Last 12 Mos - Mult Share 5
20425 Dividends per Share - Last 12 Mos - Mult Share 5
20426 Price/Earnings Ratio - Current - Mult Share 5
20427 Price/Book Value Ratio - Current - Mult Share 5
20428 Dividend Yield - Current - Mult Share 5
20440 Common Shares Outstanding - Mult Share 5
20402 Par Value - Mult Share 5
20442 Market Price - Year End - Mult Share 5
20441 Market Capitalization - Mult Share 5
20443 Earnings per Share - Mult Share 5
20444 Dividends per Share - Mult Share 5
20445 Book Value per Share - Mult Share 5
20446 Price/Earnings Ratio - Close - Mult Share 5
20447 Price/Book Value Ratio - Close - Mult Share 5
20448 Dividend Yield - Close - Mult Share 5
20501 Type of Share - Mult Share 6
20503 Worldscope Identifier - Mult Share 6
20505 SEDOL - Mult Share 6
20506 CUSIP - Mult Share 6
20507 ISIN - Mult Share 6
20508 Ticker Symbol - Mult Share 6

Other Financial Companies Template
Issue 6
© Thomson Financial 2003-2007 122 Confidential Information of Thomson Financial
20509 Stock Exchange(s) Listed - Mult Share 6
20511 Inactive Date - Mult Share 6
20520 Common Shares Outstanding - Current - Mult Share 6
20521 Market Price - Current - Mult Share 6
20522 Date of Current Price - Mult Share 6
20523 Market Capitalization - Current - Mult Share 6
20524 Earnings per Share - Last 12 Mos - Mult Share 6
20525 Dividends per Share - Last 12 Mos - Mult Share 6
20526 Price/Earnings Ratio - Current - Mult Share 6
20527 Price/Book Value Ratio - Current - Mult Share 6
20528 Dividend Yield - Current - Mult Share 6
20540 Common Shares Outstanding - Mult Share 6
20502 Par Value - Mult Share 6
20542 Market Price - Year End - Mult Share 6
20541 Market Capitalization - Mult Share 6
20543 Earnings per Share - Mult Share 6
20544 Dividends per Share - Mult Share 6
20545 Book Value per Share - Mult Share 6
20546 Price/Earnings Ratio - Close - Mult Share 6
20547 Price/Book Value Ratio - Close - Mult Share 6
20548 Dividend Yield - Close - Mult Share 6
20601 Type of Share - Mult Share 7
20603 Worldscope Identifier - Mult Share 7
20605 SEDOL - Mult Share 7
20606 CUSIP - Mult Share 7
20607 ISIN - Mult Share 7
20608 Ticker Symbol - Mult Share 7
20609 Stock Exchange(s) Listed - Mult Share 7
20611 Inactive Date - Mult Share 7
20620 Common Shares Outstanding - Current - Mult Share 7
20621 Market Price - Current - Mult Share 7
20622 Date of Current Price - Mult Share 7
20623 Market Capitalization - Current - Mult Share 7
20624 Earnings per Share - Last 12 Mos - Mult Share 7
20625 Dividends per Share - Last 12 Mos - Mult Share 7
20626 Price/Earnings Ratio - Current - Mult Share 7
20627 Price/Book Value Ratio - Current - Mult Share 7
20628 Dividend Yield - Current - Mult Share 7
20640 Common Shares Outstanding - Mult Share 7
20602 Par Value - Mult Share 7
20642 Market Price - Year End - Mult Share 7
20641 Market Capitalization - Mult Share 7
20643 Earnings per Share - Mult Share 7
20644 Dividends per Share - Mult Share 7
20645 Book Value per Share - Mult Share 7
20646 Price/Earnings Ratio - Close - Mult Share 7
20647 Price/Book Value Ratio - Close - Mult Share 7
20648 Dividend Yield - Close - Mult Share 7
Monthly Foreign Exchange Rates 11013 To U.S. Dollars - Current
11002 To U.S. Dollars - January Month End
11003 To U.S. Dollars - February Month End
11004 To U.S. Dollars - March Month End
11005 To U.S. Dollars - April Month End
11006 To U.S. Dollars - May Month End
11007 To U.S. Dollars - June Month End
11008 To U.S. Dollars - July Month End
11009 To U.S. Dollars - August Month End

Other Financial Companies Template
Issue 6
© Thomson Financial 2003-2007 123 Confidential Information of Thomson Financial
11010 To U.S. Dollars - September Month End
11011 To U.S. Dollars - October Month End
11012 To U.S. Dollars - November Month End
11001 To U.S. Dollars - December Month End
11113 From Euro Currency to Legacy/Local – Current
11102 From Euro Currency to Legacy/Local – January
11103 From Euro Currency to Legacy/Local – February
11104 From Euro Currency to Legacy/Local – March
11105 From Euro Currency to Legacy/Local – April
11106 From Euro Currency to Legacy/Local – May
11107 From Euro Currency to Legacy/Local – June
11108 From Euro Currency to Legacy/Local – July
11109 From Euro Currency to Legacy/Local – August
11110 From Euro Currency to Legacy/Local – September
11111 From Euro Currency to Legacy/Local – October
11112 From Euro Currency to Legacy/Local – November
11101 From Euro Currency to Legacy/Local – Year End
11202 From ECU Currency to Local – January
11203 From ECU Currency to Local – February
11204 From ECU Currency to Local – March
11205 From ECU Currency to Local – April
11206 From ECU Currency to Local – May
11207 From ECU Currency to Local – June
11208 From ECU Currency to Local – July
11209 From ECU Currency to Local – August
11210 From ECU Currency to Local – September
11211 From ECU Currency to Local – October
11212 From ECU Currency to Local – November
11201 From ECU Currency to Local – Year End
11313 Legacy to U.S. Currency – Current
11302 Legacy to U.S. Currency – January
11303 Legacy to U.S. Currency – February
11304 Legacy to U.S. Currency – March
11305 Legacy to U.S. Currency – April
11306 Legacy to U.S. Currency – May
11307 Legacy to U.S. Currency – June
11308 Legacy to U.S. Currency – July
11309 Legacy to U.S. Currency – August
11310 Legacy to U.S. Currency – September
11311 Legacy to U.S. Currency – October
11312 Legacy to U.S. Currency – November
11301 Legacy to U.S. Currency – Y

Issue 6
© Thomson Financial 2003-2007 124 Confidential Information of Thomson Financial
Security Level Information TemplateNotes:
This data items, when historical and unless otherwise stated in the definition, are only available for 1987 and subsequent years
#: Currently U.S. and Canadian companies only.
General Information 06001 Company Name
06003 Company Name - Short
06026 Nation
06027 Nation Code
06028 Region
07015 Inactive Date
07012 Inactive Date - Security
05350 Date of Fiscal Period End
11556 Indicator – Restated Data Exists
11557 Indicator – Restatement Type
Key Items in US Dollars 07211 Market Capitalization - Current
07210 Market Capitalization
Stock Data
Current Information 06005 Type of Share
05601 Ticker Symbol
06004 CUSIP
06006 SEDOL
06008 ISIN
06035 Worldscope Identifier
06105 Worldscope Permanent I.D.
06036 Primary Issue Identifier
11526 Indicator – Primary Issue
05427 Stock Exchange(s) Listed
05006 Market Price - Current
05009 Date of Current Price
05007 Market Price - Year to Date - High
05008 Market Price - Year to Date - Low
05091 Market Price – 52 Week High
05092 Market Price – 52 Weed Low
08005 Market Capitalization - Current
05302 Common Shares Outstanding - Current
05255 Earnings Per Share - Last 12 Months
05256 Date of Last 12 Months EPS
05145 Dividends Per Share - Last 12 Months
05190 Indicated Dividend Rate
05480 Book Value Per Share - Current
05510 Cash Flow Per Share - Current
Annual Statistics 05001 Market Price - Year End
05002 Market Price - High
05003 Market Price - Low
05004 Market Price - 5 yr avg - High
05005 Market Price - 5 yr avg - Low
08001 Market Capitalization
05651 Common Shares Traded - Annual #
08006 Trading Volume ($ Amount) #
08010 Trading Volume - Weekly Average #
08011 Turnover Rate #
05201 Earnings Per Share
05202 Earnings per Share - Fiscal Year End
10010 Earnings per Share – Basic – Fiscal #
10030 Earnings per Share – Fully Diluted – Fiscal #
05260 Earnings Per Share - 5 yr avg

Security Level Information Template
Issue 6
© Thomson Financial 2003-2007 125 Confidential Information of Thomson Financial
05200 Earnings Report Frequency
05101 Dividends Per Share
05140 Dividends Per Share - 5 yr avg
05110 Dividends per Share - Fiscal
05102 Dividends Per Share - Gross
05100 Dividend Report Frequency
05476 Book Value Per Share
05491 Book Value – Outstanding Shares - Fiscal
05501 Cash Flow Per Share
05508 Sales per Share
05301 Common Shares Outstanding
05309 Par Value
05576 Stock Split/Dividend Ratio
05575 Stock Split/Dividend Ratio - Fiscal
Weekly Time Series 05652 Common Shares Traded – Weekly
05080 Market Price – Week Close
05081 Market Price – Week High
05082 Market Price – Week Low
Interim Data
Qtr1 Qtr2 Qtr 3 Qtr 4
Number of Months-EPS
05217 05218 05219 05220
Earnings per Share
05221 05222 05223 05224
EPS - Report Date
05901 05902 05903 05904
EPS - 12 Months
05251 05252 05253 05254
EPS - 5 yr avg
05261 05262 05263 05264
Dividends per Share
05121 05122 05123 05124
DPS – Gross 05125 05126 05127 05128
Qtr1 Qtr2 Qtr 3 Qtr 4
DPS - Declared Date
05910 05911 05912 05913
DPS - Record Date
05917 05918 05919 05920
DPS - Ex-Div Date
05923 05924 05925 05926
DPS - Payable Date
05929 05930 05931 05932
DPS – Extra 05151 05152 05153 05154
DPS - Extra – Gross
05171 05172 05173 05174
DPS - Extra - Dec Date
05935 05936 05937 05938
DPS - Extra - Rec Date
05941 05942 05943 05944
DPS - Extra - Ex-Div Date
05947 05948 05949 05950
DPS - Extra - Pay Date
05953 05954 05955 05956
DPS - Special
05155 05156 05157 05158
DPS - Special – Gross
05175 05176 05177 05178
DPS - Special - Dec Date
05965 05966 05968 05969
DPS - Special - Rec Date
05970 05971 05972 05973
DPS - Special - Ex-Div Date
05959 05960 05961 05962
DPS - Special - Pay Date
05976 05977 05978 05979
DPS - 12 Months
05131 05132 05133 05134
DPS - 5 yr avg
05141 05142 05143 05144

Security Level Information Template
Issue 6
© Thomson Financial 2003-2007 126 Confidential Information of Thomson Financial
Monthly Price Information
Month End Market Price
High Price
Low Price
January 05015 05016 05017
February 05020 05021 05022
March 05025 05026 05027
April 05030 05031 05032
May 05035 05036 05037
June 05040 05041 05042
July 05045 05046 05047
August 05050 05051 05052
September 05055 05056 05057
October 05060 05061 05062
November 05065 05066 05067
December 05070 05071 05072
Stock Performance
Current Information 09102 Price/Earnings Ratio - Current
09103 Price/Earnings Ratio - Current High
09105 Price/Earnings Ratio - Current Low
09202 Earnings Yield - Current
09203 Earnings Yield - Current High
09205 Earnings Yield - Current Low
09602 Price/Cash Flow - Current
09302 Price/Book Value Ratio - Current
09402 Dividend Yield - Current
09502 Dividend Payout - Per Share - Current
09001 Price Trend - Last Week
09005 Price Trend - Four Week
09011 Price Trend - Quarter to Date
09016 Price Trend - Previous Quarter
09021 Price Trend - Year to Date
09006 Price Trend - 13 Weeks
09007 Price Trend – 26 Weeks
09026 Price Trend - 52 Weeks
09802 Beta
09803 Alpha
Annual Statistics 09104 Price/Earnings Ratio - Close
09304 Price/Book Value Ratio - Close
09604 Price/Cash Flow Ratio - Close
09204 Earnings Yield - Close
09404 Dividend Yield - Close
08801 Total Investment Return
09504 Dividend Payout Per Share
08806 Price Volatility
09100 Price/Earnings Ratio - High
09101 Price/Earnings Ratio - Low
09106 Price/Earnings Ratio - Avg High-Low
09200 Earnings Yield - High
09201 Earnings Yield - Low
09206 Earnings Yield - Avg High-Low
09300 Price/Book Value Ratio - High
09301 Price/Book Value Ratio - Low
09306 Price/Book Value Ratio - Avg High-Low
09400 Dividend Yield - High
09401 Dividend Yield - Low
09406 Dividend Yield - Avg High-Low
Three Year Averages 08803 Total Investment Return
Five Year Averages 09121 Price/Earnings Ratio - Close
09321 Price/Book Value Ratio - Close
09621 Price/Cash Flow Ratio - Close
09221 Earnings Yield - Close
09421 Dividend Yield - Close
08805 Total Investment Return
09521 Dividend Payout Per Share

Security Level Information Template
Issue 6
© Thomson Financial 2003-2007 127 Confidential Information of Thomson Financial
09111 Price/Earnings Ratio - High
09116 Price/Earnings Ratio - Low
09126 Price/Earnings Ratio - Avg High-Low
09211 Earnings Yield - High
09216 Earnings Yield - Low
09226 Earnings Yield - Avg High-Low
09311 Price/Book Value Ratio - High
09316 Price/Book Value Ratio - Low
09326 Price/Book Value Ratio - Avg High-Low
09411 Dividend Yield - High
09416 Dividend Yield - Low
09426 Dividend Yield - Avg High-Low
Growth Rates
Annual Statistics: 08601 Earnings Per Share Growth %
08611 Dividends Per Share Growth %
08606 Book Value Per Share Growth %
08579 Market Capitalization Growth %
Three Year Averages 08581 Market Capitalization Growth %
Five Year Averages: 08605 Earnings Per Share Growth %
08615 Dividends Per Share Growth %
08610 Book Value Per Share Growth %

128 Worldscope Datatype Definitions Guide
© 2003 Thomson Financial. All marks herein are used under licence.
ADRs TemplateGeneral Information
06095 Depositary Bank
Stock Data
Current Information 06110 ADR Cusip 1
06111 ADR Cusip 2
06112 ADR Cusip 3
06096 ADR Exchange Ratio
06115 ADR Non-U.S. Security Identifier
11503 Indicator - ADR
11502 Indicator - Sponsored/Unsponsored
05257 Earnings per ADR - GAAP - Last 12 Months
05478 Book Value per ADR - GAAP
Annual Statistics 05204 Earnings per ADR - GAAP
05265 Earnings per ADR - GAAP - 5 YR Avg
05490 Book Value per ADR - GAAP
Supplementary Data
Asset Fields 06615 Current Assets - GAAP
06660 Loans (Net) - GAAP
06640 Investments - GAAP
06620 Property, Plant & Equipment (Net) - GAAP
06695 Other Assets - GAAP
06694 Intangible Other Assets - GAAP
06693 Goodwill - GAAP
06699 Total Assets - GAAP
Liability Fields 06715 Current Liabilities - GAAP
06769 Long Term Debt - GAAP
06730 Deposits - GAAP
06773 Deferred Taxes - GAAP
06740 Insurance Reserves - GAAP
06774 Other Long Term Liabilities - GAAP
06783 Preferred Stock - GAAP
06780 Minority Interest - GAAP
06795 Common Equity - GAAP
06798 Total Equity - GAAP
Income Statement 06802 Premium Income - GAAP
06801 Sales/Revenues - GAAP
06840 Non-Interest Income - GAAP
06830 Net Interest Income - GAAP
06820 Other Operating Income - GAAP
06850 Operating Income - GAAP
06860 Pre-tax Income - GAAP
06895 Net Income - GAAP
Cash Flow Fields 06915 Cash Flow from Operations - GAAP
06920 Cash Flow - Operating Activities - GAAP
06930 Cash Flow - Financing Activities - GAAP
06940 Cash Flow - Investing Activities - GAAP
06970 Increase/Decrease - Cash - GAAP
Stock Performance
Current Information 09142 Price/Earnings Ratio - GAAP - Current
09143 Price/Earnings Ratio - GAAP - Current High

ADRs Template
Issue 6
© Thomson Financial 2003-2007 129 Confidential Information of Thomson Financial
09145 Price/Earnings Ratio - GAAP - Current Low
09342 Price/Book Value - GAAP - Current
09343 Price/Book Value - GAAP - Current High
09345 Price/Book Value - GAAP - Current Low
09242 Earnings Yield - GAAP - Current
09243 Earnings Yield - GAAP - Current High
09245 Earnings Yield - GAAP - Current Low
Annual Statistics 09144 Price/Earnings Ratio - GAAP - Close
09344 Price/Book Value - GAAP - Close
09244 Earnings Yield - GAAP - Close
09146 Price/Earnings Ratio - GAAP - Avg High-Low
09140 Price/Earnings Ratio - GAAP – High
09141 Price/Earnings Ratio - GAAP – Low
09246 Earnings Yield - GAAP - Avg High-Low
09240 Earnings Yield - GAAP – High
09241 Earnings Yield - GAAP - Low
09346 Price/Book Value - GAAP - Avg High-Low
09340 Price/Book Value - GAAP - High
09341 Price/Book Value - GAAP - Low
Three Year Averages 09132 Price/Earnings Ratio - Close
09149 Price/Earnings Ratio - GAAP - Close
09332 Price/Book Value - Close
09349 Price/Book Value - GAAP - Close
09623 Price/Cash Flow Ratio
09232 Earnings Yield - Close
09249 Earnings Yield - GAAP - Close
09432 Dividend Yield - Close
09133 Price/Earnings Ratio - Avg High-Low
09130 Price/Earnings Ratio - High
09131 Price/Earnings Ratio - Low
09150 Price/Earnings Ratio - GAAP - Avg High-Low
09147 Price/Earnings Ratio - GAAP - High
09148 Price/Earnings Ratio - GAAP - Low
09233 Earnings Yield - Avg High-Low
09230 Earnings Yield - High
09231 Earnings Yield - Low
09350 Earnings Yield - GAAP - Avg High-Low
09247 Earnings Yield - GAAP - High
09248 Earnings Yield - GAAP - Low
09333 Price/Book Value - Avg High-Low
09330 Price/Book Value - High
09331 Price/Book Value - Low
09350 Price/Book Value - GAAP - Avg High-Low
09347 Price/Book Value - GAAP - High
09348 Price/Book Value - GAAP - Low
09433 Dividend Yield - Avg High-Low
09430 Dividend Yield - High
09431 Dividend Yield - Low
Five Year Averages 09153 Price/Earnings Ratio - GAAP - Close
09353 Price/Book Value - GAAP - Close
09253 Earnings Yield - GAAP - Close
09154 Price/Earnings Ratio - GAAP - Avg High-Low
09151 Price/Earnings Ratio - GAAP - High
09152 Price/Earnings Ratio - GAAP - Low
09254 Earnings Yield - GAAP - Avg High-Low
09251 Earnings Yield - GAAP - High
09252 Earnings Yield - GAAP - Low
09354 Price/Book Value - GAAP - Avg High-Low
09351 Price/Book Value - GAAP - High
09352 Price/Book Value - GAAP - Low
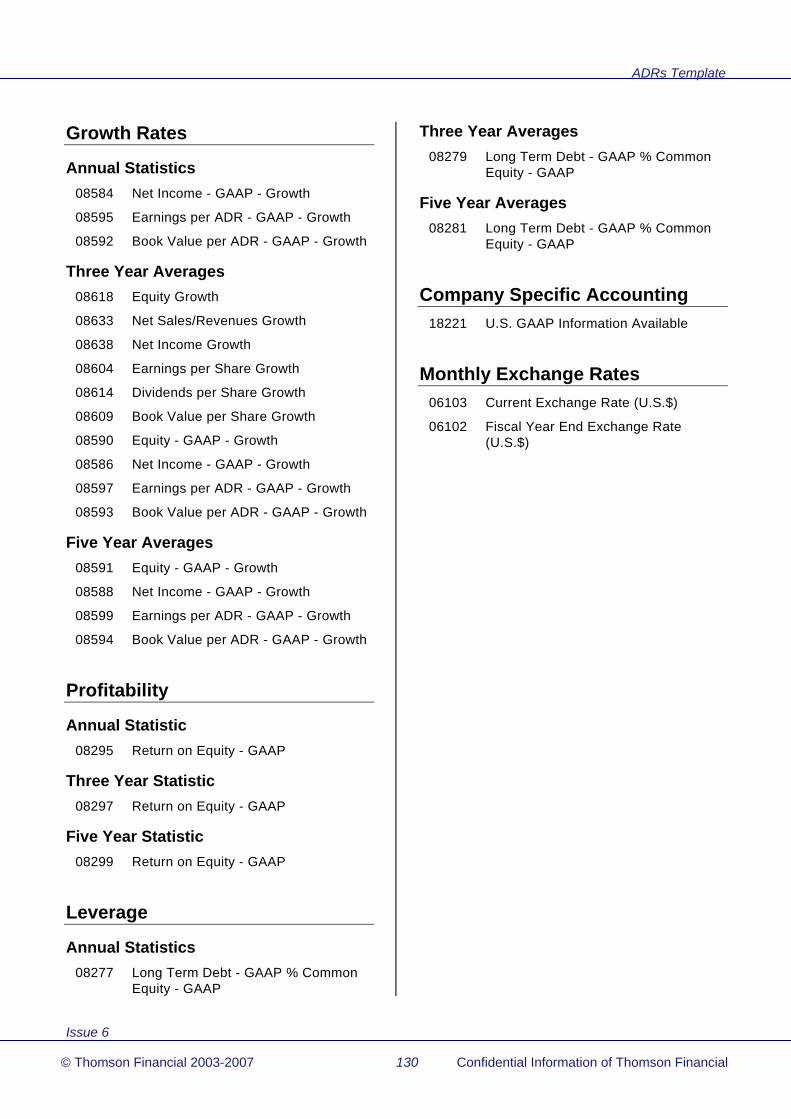
ADRs Template
Issue 6
© Thomson Financial 2003-2007 130 Confidential Information of Thomson Financial
Growth Rates
Annual Statistics 08584 Net Income - GAAP - Growth
08595 Earnings per ADR - GAAP - Growth
08592 Book Value per ADR - GAAP - Growth
Three Year Averages 08618 Equity Growth
08633 Net Sales/Revenues Growth
08638 Net Income Growth
08604 Earnings per Share Growth
08614 Dividends per Share Growth
08609 Book Value per Share Growth
08590 Equity - GAAP - Growth
08586 Net Income - GAAP - Growth
08597 Earnings per ADR - GAAP - Growth
08593 Book Value per ADR - GAAP - Growth
Five Year Averages 08591 Equity - GAAP - Growth
08588 Net Income - GAAP - Growth
08599 Earnings per ADR - GAAP - Growth
08594 Book Value per ADR - GAAP - Growth
Profitability
Annual Statistic 08295 Return on Equity - GAAP
Three Year Statistic 08297 Return on Equity - GAAP
Five Year Statistic 08299 Return on Equity - GAAP
Leverage
Annual Statistics 08277 Long Term Debt - GAAP % Common
Equity - GAAP
Three Year Averages 08279 Long Term Debt - GAAP % Common
Equity - GAAP
Five Year Averages 08281 Long Term Debt - GAAP % Common
Equity - GAAP
Company Specific Accounting 18221 U.S. GAAP Information Available
Monthly Exchange Rates 06103 Current Exchange Rate (U.S.$)
06102 Fiscal Year End Exchange Rate (U.S.$)
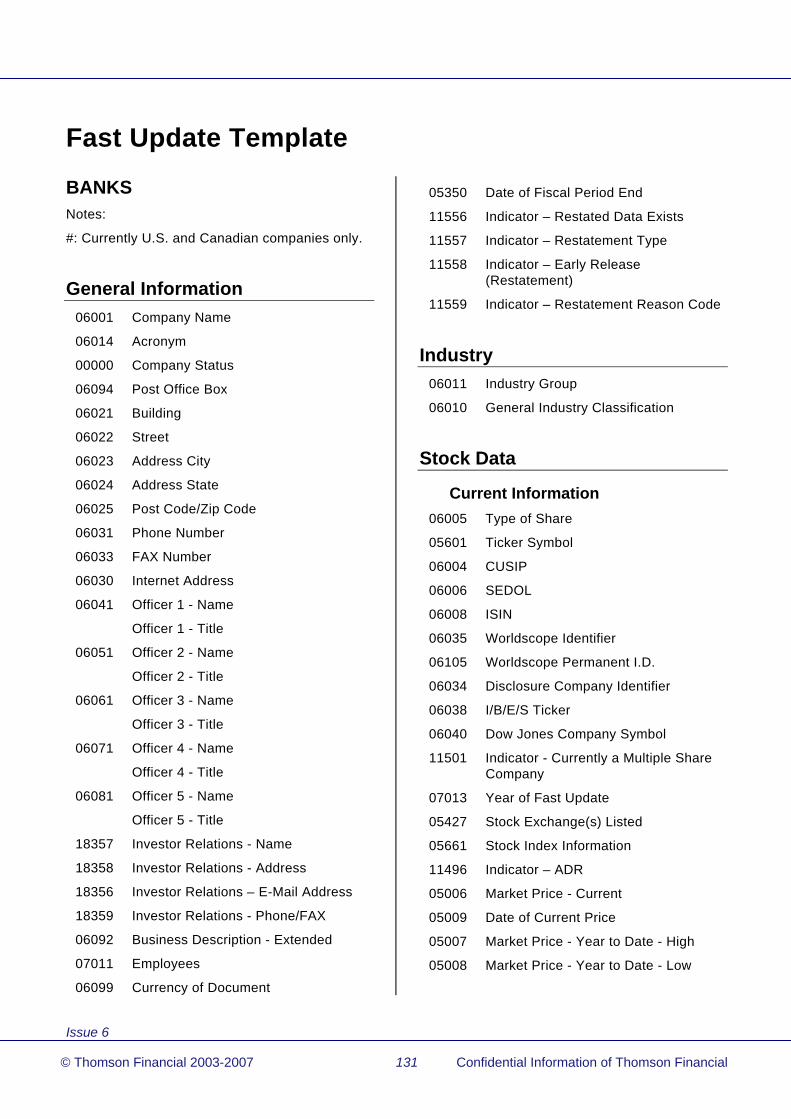
Issue 6
© Thomson Financial 2003-2007 131 Confidential Information of Thomson Financial
Fast Update Template
BANKS Notes:
#: Currently U.S. and Canadian companies only.
General Information 06001 Company Name
06014 Acronym
00000 Company Status
06094 Post Office Box
06021 Building
06022 Street
06023 Address City
06024 Address State
06025 Post Code/Zip Code
06031 Phone Number
06033 FAX Number
06030 Internet Address
06041 Officer 1 - Name
Officer 1 - Title
06051 Officer 2 - Name
Officer 2 - Title
06061 Officer 3 - Name
Officer 3 - Title
06071 Officer 4 - Name
Officer 4 - Title
06081 Officer 5 - Name
Officer 5 - Title
18357 Investor Relations - Name
18358 Investor Relations - Address
18356 Investor Relations – E-Mail Address
18359 Investor Relations - Phone/FAX
06092 Business Description - Extended
07011 Employees
06099 Currency of Document
05350 Date of Fiscal Period End
11556 Indicator – Restated Data Exists
11557 Indicator – Restatement Type
11558 Indicator – Early Release (Restatement)
11559 Indicator – Restatement Reason Code
Industry 06011 Industry Group
06010 General Industry Classification
Stock Data
Current Information 06005 Type of Share
05601 Ticker Symbol
06004 CUSIP
06006 SEDOL
06008 ISIN
06035 Worldscope Identifier
06105 Worldscope Permanent I.D.
06034 Disclosure Company Identifier
06038 I/B/E/S Ticker
06040 Dow Jones Company Symbol
11501 Indicator - Currently a Multiple Share Company
07013 Year of Fast Update
05427 Stock Exchange(s) Listed
05661 Stock Index Information
11496 Indicator – ADR
05006 Market Price - Current
05009 Date of Current Price
05007 Market Price - Year to Date - High
05008 Market Price - Year to Date - Low

Fast Update Template
Issue 6
© Thomson Financial 2003-2007 132 Confidential Information of Thomson Financial
08005 Market Capitalization - Current
05302 Common Shares Outstanding - Current
05306 Date of Common Shares
05255 Earnings per Share - Last 12 Months
05256 Date of Last 12 Months EPS
05145 Dividends per Share - Last 12 Months
05190 Indicated Dividend Rate
05480 Book Value per Share - Current
05510 Cash Flow per Share - Current
Annual Statistics 05001 Market Price - Year End
05002 Market Price - High
05003 Market Price - Low
05004 Market Price - 5 yr avg - High
05005 Market Price - 5 yr avg - Low
08001 Market Capitalization
05651 Common Shares Traded - Annual #
08006 Trading Volume ($ Amount) #
08010 Trading Volume - Weekly Average #
08011 Turnover Rate #
05201 Earnings per Share
05210 Earnings per Share – Basic – Year
10010 Earnings per Share – Basic – Fiscal #
05290 Fully Diluted Earnings per Share
10030 Earnings per Share – Fully Diluted – Fiscal #
05202 Earnings per Share - Fiscal Year End
05200 Earnings Report Frequency
18209 Earnings per Share Including Extraordinary Items – Fiscal
05225 Includes Extraordinary Credit/Charge per Share
05227 Includes Pre-tax Extraordinary Credit/Charge per Share
05240 DVFA Earnings (Germany)
05203 OVFA Earnings per Share (Austria)
05725 Headline Earnings per Share (U.K.)
05260 Earnings per Share - 5 yr avg
05101 Dividends per Share
05140 Dividends per Share - 5 yr avg
05102 Dividends per Share - Gross
05100 Dividend Report Frequency
05476 Book Value per Share
05486 Tangible Book Value per Share
05501 Cash Flow per Share
05508 Sales per Share
05509 Operating Profit per Share
05301 Common Shares Outstanding
05309 Par Value
05191 Common Shares Used to Calculate EPS
05192 Common Shares Used to Calculate Basic EPS
05194 Common Shares Used to Calculate Fully Diluted EPS
05576 Stock Split/Dividend Ratio
Weekly Time Series 05652 Common Shares Traded – Weekly
05080 Market Price – Week Close
05081 Market Price – Week High
05082 Market Price – Week Low
Balance Sheet
Assets 02004 Cash & Due from Banks
02255 Investments – Total
02055 Interbank Loans
02501 Property, Plant & Equipment-Net
02649 Total Intangible Other Assets - Net
02999 Total Assets
Liabilities & Shareholders' Equity 03019 Deposits – Total
03255 Total Debt

Fast Update Template
Issue 6
© Thomson Financial 2003-2007 133 Confidential Information of Thomson Financial
03051 Short Term Debt & Current Portion of Long Term Debt
03251 Long-Term Debt
03245 Long-Term Debt Excluding Capitalized Leases
03249 Capitalized Lease Obligations
03263 Deferred Taxes
03257 Deferred Tax Liability in Untaxed Reserves
03351 Total Liabilities
03401 Non-Equity Reserves
03426 Minority Interest
03451 Preferred Stock
03501 Common Equity
03493 Other Appropriated Reserves
03494 Unappropriated (Free) Reserves
03495 Retained Earnings
03999 Total Liabilities & Shareholders' Equity
Income Statement 01016 Interest Income - Total
01075 Interest Expense - Total
01251 Interest Expense on Debt
01076 Net Interest Income
01271 Provision for Loan Losses
01250 Operating Income
01401 Pre-tax Income
01451 Income Taxes
01501 Minority Interest
01551 Net Income before Extraordinary Items/Preferred Dividends
01701 Preferred Dividend Requirements
01706 Net Income after Preferred Dividends (Basic EPS)
Funds Flow Statement – per FASB 95
04201 Funds from Operations
04551 Cash Dividends Paid - Total
05376 Common Dividends (Cash)
05401 Preferred Dividends (Cash)
Supplementary Data
Asset Fields 02654 Total Intangible Other Assets - Gross
02655 Total Intangible Other Assets – Accumulated Amortization
02300 Total Assets - As Reported
Income Statement Fields 01001 Net Sales or Revenues
18224 Amortization and Impairment of Goodwill
18225 Impairment of Goodwill
18226 Impairment of Other Intangibles
18274 Impairment of Property, Plant & Equipment
18275 Impairment of Financial Fixed Assets
18191 Earnings before Interest and Taxes (EBIT)
18198 Earnings before Interest, Taxes & Depreciation (EBITDA)
18175 Ordinary Profit (Japan)
01651 Net Income - Bottom Line
01751 Net Income Used to Calculate Earnings per Share
01705 Net Income Used to Calculate Fully Diluted Earnings per Share
18170 Unconsolidated/Parent Company Sales
18169 Unconsolidated/Parent Company Depreciation
18171 Unconsolidated/Parent Company Pre-tax Income
18172 Unconsolidated/Parent Company Net Profit
18173 Unconsolidated/Parent Company Earnings per Share

Fast Update Template
Issue 6
© Thomson Financial 2003-2007 134 Confidential Information of Thomson Financial
Other Fields 03998 Total Capital
Stock Performance
Current Information 09102 Price/Earnings Ratio - Current
09103 Price/Earnings Ratio - Current High
09105 Price/Earnings Ratio - Current Low
09202 Earnings Yield - Current
09203 Earnings Yield - Current High
09205 Earnings Yield - Current Low
09602 Price/Cash Flow - Current
09302 Price/Book Value Ratio - Current
09402 Dividend Yield - Current
08372 Return on Equity - per Share - Current
08652 Reinvestment Rate - per Share - Current
09502 Dividend Payout - per Share - Current
Annual Statistics 09104 Price/Earnings Ratio - Close
09304 Price/Book Value Ratio - Close
09604 Price/Cash Flow Ratio
09204 Earnings Yield - Close
09404 Dividend Yield - Close
08801 Total Investment Return
09504 Dividend Payout per Share
08806 Price Volatility
09100 Price/Earnings Ratio - High
09101 Price/Earnings Ratio - Low
09106 Price/Earnings Ratio - Avg High-Low
09200 Earnings Yield - High
09201 Earnings Yield - Low
09206 Earnings Yield - Avg High-Low
09300 Price/Book Value Ratio - High
09301 Price/Book Value Ratio - Low
09306 Price/Book Value Ratio - Avg High-Low
09400 Dividend Yield - High
09401 Dividend Yield - Low
09406 Dividend Yield - Avg High-Low
09704 Market Capitalization/Common Equity
Five Year Averages 09121 Price/Earnings Ratio - Close
09321 Price/Book Value Ratio - Close
09621 Price/Cash Flow Ratio
09221 Earnings Yield - Close
09421 Dividend Yield - Close
08805 Total Investment Return
09521 Dividend Payout per Share
09111 Price/Earnings Ratio - High
09116 Price/Earnings Ratio - Low
09126 Price/Earnings Ratio - Avg High-Low
09211 Earnings Yield - High
09216 Earnings Yield - Low
09226 Earnings Yield - Avg High-Low
09311 Price/Book Value Ratio - High
09316 Price/Book Value Ratio - Low
09326 Price/Book Value Ratio - Avg High-Low
09411 Dividend Yield - High
09416 Dividend Yield - Low
09426 Dividend Yield - Avg High-Low
09721 Market Capitalization/Common Equity
Growth Rates
Annual Statistics 08631 Net Sales/Revenues Growth
08646 Operating Income Growth
08636 Net Income Growth
08621 Total Assets Growth
08616 Equity Growth

Fast Update Template
Issue 6
© Thomson Financial 2003-2007 135 Confidential Information of Thomson Financial
08601 Earnings per Share Growth
08611 Dividends per Share Growth
08606 Book Value per Share Growth
08676 Net Margin Growth
Five Year Averages 08635 Net Sales/Revenues Growth
08650 Operating Income Growth
08640 Net Income Growth
08625 Total Assets Growth
08620 Equity Growth
08605 Earnings per Share Growth
08615 Dividends per Share Growth
08610 Book Value per Share Growth
08680 Net Margin Growth
Profitability
Annual Statistics 08301 Return on Equity – Total (%)
08371 Return on Equity – per Share
08376 Return on Invested Capital
08656 Reinvestment Rate - Total
08651 Reinvestment Rate – per Share
08911 Retained Earnings % Equity
08381 Cash Earnings Return on Equity
08311 Cash Flow/Sales
08316 Operating Profit Margin
08361 Operating Income Return on Total Capital
08321 Pre-tax Margin
08356 Interest Rate - Estimated Average
08366 Net Margin
15593 Non-Interest Income % Total Revenues
Five Year Averages 08305 Return on Equity - Total (%)
08375 Return on Equity – per Share
08380 Return on Invested Capital
08656 Reinvestment Rate - Total
08660 Reinvestment Rate - per Share
08915 Retained Earnings % Equity
08385 Cash Earnings Return on Equity
08315 Cash Flow/Sales
08320 Operating Profit Margin
08365 Operating Income Return on Total Capital
08325 Pre-tax Margin
08360 Interest Rate - Estimated Average
08370 Net Margin
15596 Non-Interest Income % Total Revenues
Leverage
Annual Statistics 08231 Total Debt % Common Equity
08226 Long Term Debt % Common Equity
08221 Total Debt % Total Capital
08216 Long Term Debt % Total Capital
08211 Minority Interest % Total Capital
08201 Equity % Total Capital
08206 Preferred Stock % Total Capital
08236 Total Debt % Total Assets
08241 Common Equity % Total Assets
08287 Total Assets / Common Equity Ratio
15121 Total Capital % Total Assets
08256 Dividend Payout (% Earnings)-Total Dollar
08906 Cash Dividends % Cash Flow
08266 Fixed Assets % Common Equity
Five Year Averages 08235 Total Debt % Common Equity
08230 Long Term Debt % Common Equity
08225 Total Debt % Total Capital
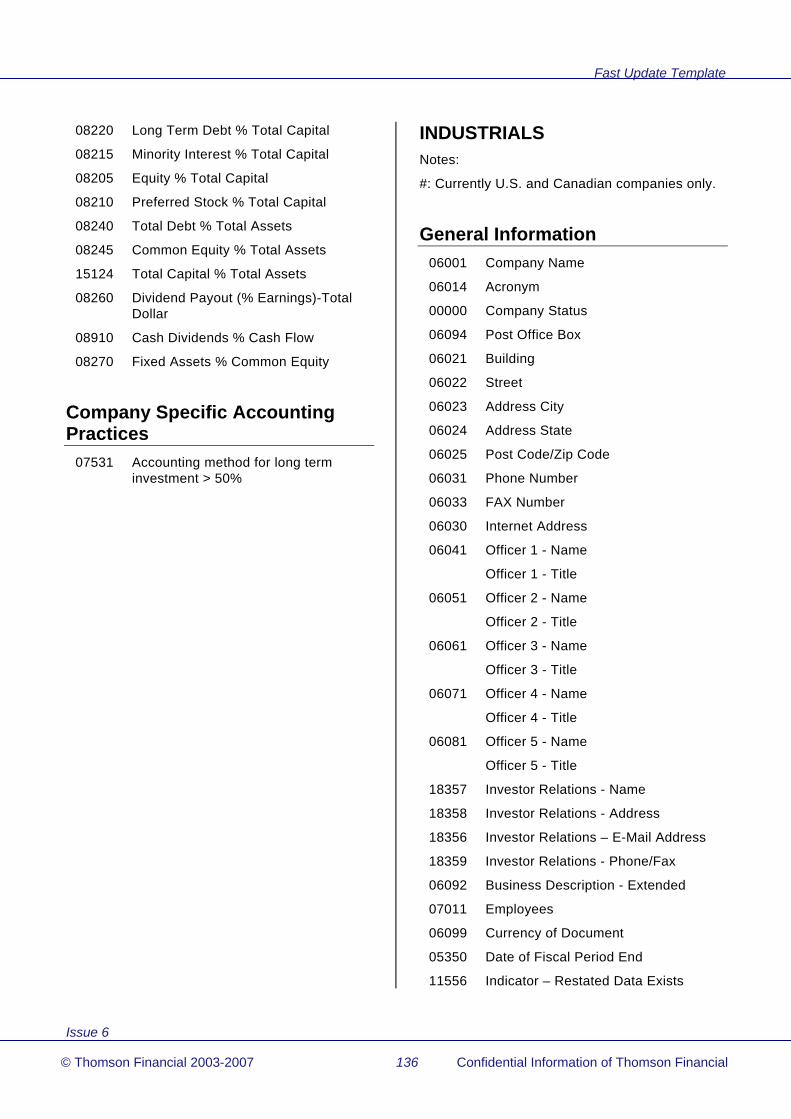
Fast Update Template
Issue 6
© Thomson Financial 2003-2007 136 Confidential Information of Thomson Financial
08220 Long Term Debt % Total Capital
08215 Minority Interest % Total Capital
08205 Equity % Total Capital
08210 Preferred Stock % Total Capital
08240 Total Debt % Total Assets
08245 Common Equity % Total Assets
15124 Total Capital % Total Assets
08260 Dividend Payout (% Earnings)-Total Dollar
08910 Cash Dividends % Cash Flow
08270 Fixed Assets % Common Equity
Company Specific Accounting Practices
07531 Accounting method for long term investment > 50%
INDUSTRIALS Notes:
#: Currently U.S. and Canadian companies only.
General Information 06001 Company Name
06014 Acronym
00000 Company Status
06094 Post Office Box
06021 Building
06022 Street
06023 Address City
06024 Address State
06025 Post Code/Zip Code
06031 Phone Number
06033 FAX Number
06030 Internet Address
06041 Officer 1 - Name
Officer 1 - Title
06051 Officer 2 - Name
Officer 2 - Title
06061 Officer 3 - Name
Officer 3 - Title
06071 Officer 4 - Name
Officer 4 - Title
06081 Officer 5 - Name
Officer 5 - Title
18357 Investor Relations - Name
18358 Investor Relations - Address
18356 Investor Relations – E-Mail Address
18359 Investor Relations - Phone/Fax
06092 Business Description - Extended
07011 Employees
06099 Currency of Document
05350 Date of Fiscal Period End
11556 Indicator – Restated Data Exists
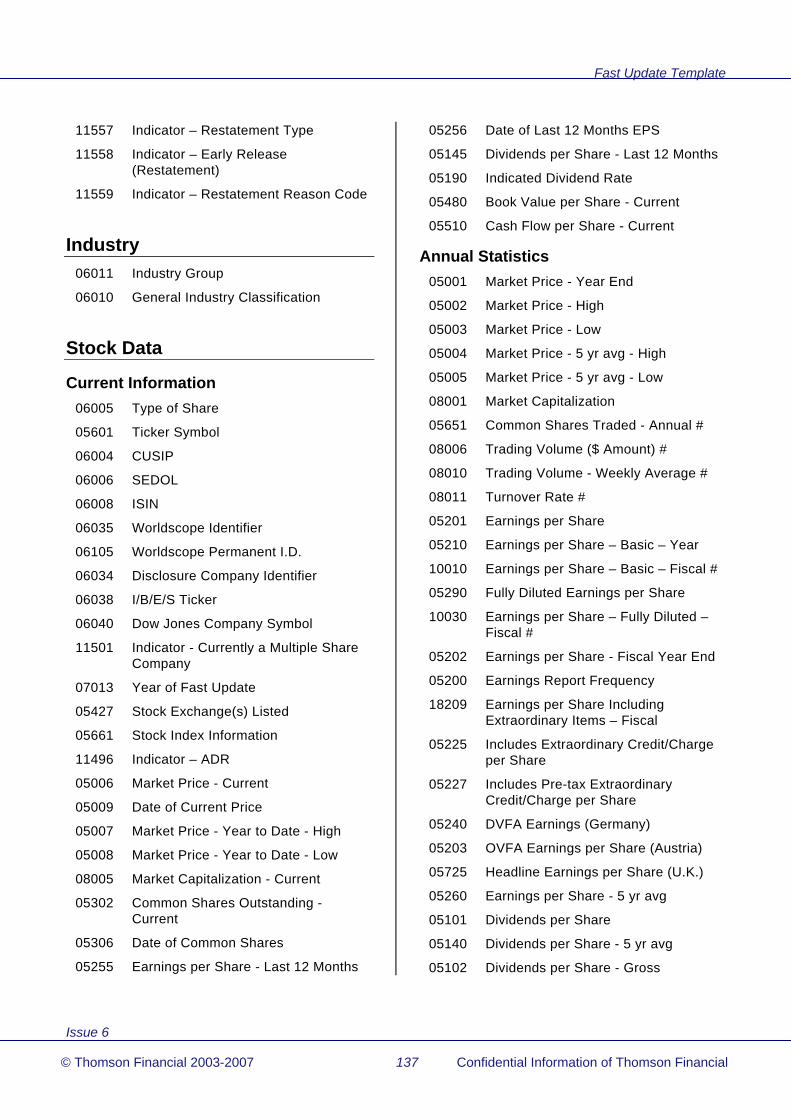
Fast Update Template
Issue 6
© Thomson Financial 2003-2007 137 Confidential Information of Thomson Financial
11557 Indicator – Restatement Type
11558 Indicator – Early Release (Restatement)
11559 Indicator – Restatement Reason Code
Industry 06011 Industry Group
06010 General Industry Classification
Stock Data
Current Information 06005 Type of Share
05601 Ticker Symbol
06004 CUSIP
06006 SEDOL
06008 ISIN
06035 Worldscope Identifier
06105 Worldscope Permanent I.D.
06034 Disclosure Company Identifier
06038 I/B/E/S Ticker
06040 Dow Jones Company Symbol
11501 Indicator - Currently a Multiple Share Company
07013 Year of Fast Update
05427 Stock Exchange(s) Listed
05661 Stock Index Information
11496 Indicator – ADR
05006 Market Price - Current
05009 Date of Current Price
05007 Market Price - Year to Date - High
05008 Market Price - Year to Date - Low
08005 Market Capitalization - Current
05302 Common Shares Outstanding - Current
05306 Date of Common Shares
05255 Earnings per Share - Last 12 Months
05256 Date of Last 12 Months EPS
05145 Dividends per Share - Last 12 Months
05190 Indicated Dividend Rate
05480 Book Value per Share - Current
05510 Cash Flow per Share - Current
Annual Statistics 05001 Market Price - Year End
05002 Market Price - High
05003 Market Price - Low
05004 Market Price - 5 yr avg - High
05005 Market Price - 5 yr avg - Low
08001 Market Capitalization
05651 Common Shares Traded - Annual #
08006 Trading Volume ($ Amount) #
08010 Trading Volume - Weekly Average #
08011 Turnover Rate #
05201 Earnings per Share
05210 Earnings per Share – Basic – Year
10010 Earnings per Share – Basic – Fiscal #
05290 Fully Diluted Earnings per Share
10030 Earnings per Share – Fully Diluted – Fiscal #
05202 Earnings per Share - Fiscal Year End
05200 Earnings Report Frequency
18209 Earnings per Share Including Extraordinary Items – Fiscal
05225 Includes Extraordinary Credit/Charge per Share
05227 Includes Pre-tax Extraordinary Credit/Charge per Share
05240 DVFA Earnings (Germany)
05203 OVFA Earnings per Share (Austria)
05725 Headline Earnings per Share (U.K.)
05260 Earnings per Share - 5 yr avg
05101 Dividends per Share
05140 Dividends per Share - 5 yr avg
05102 Dividends per Share - Gross

Fast Update Template
Issue 6
© Thomson Financial 2003-2007 138 Confidential Information of Thomson Financial
05100 Dividend Report Frequency
05476 Book Value per Share
05486 Tangible Book Value per Share
05501 Cash Flow per Share
05507 Free Cash Flow per Share
05508 Sales per Share
05509 Operating Profit per Share
05506 Working Capital per Share
05301 Common Shares Outstanding
05309 Par Value
05191 Common Shares Used to Calculate EPS
05192 Common Shares Used to Calculate Basic EPS
05194 Common Shares Used to Calculate Fully Diluted EPS
05576 Stock Split/Dividend Ratio
Weekly Time Series 05652 Common Shares Traded – Weekly
05080 Market Price – Week Close
05081 Market Price – Week High
05082 Market Price – Week Low
Balance Sheet
Assets 02001 Cash & Short Term Investments
02051 Receivables (Net)
02101 Inventories – Total
02201 Current Assets - Total
02501 Property Plant and Equipment - Net
02301 Property Plant and Equipment - Gross
02401 Accumulated Depreciation
02649 Total Intangible Other Assets - Net
02999 Total Assets
Liabilities & Shareholders' Equity 03040 Accounts Payable
03051 Short Term Debt & Current Portion of Long Term Debt
03101 Current Liabilities - Total
03251 Long Term Debt
03245 Long term Debt Excluding Capitalized Leases
03249 Capitalized Lease Obligations
03263 Deferred Taxes
03257 Deferred Tax Liability in Untaxed Reserves
03351 Total Liabilities
03401 Non-Equity Reserves
03426 Minority Interest
03451 Preferred Stock
03501 Common Equity
03493 Other Appropriated Reserves
03494 Unappropriated (Free) Reserves
03495 Retained Earnings
03999 Total Liabilities & Shareholders' Equity
Income Statement 01001 Net Sales or Revenues
01051 Costs of Goods Sold
01151 Depreciation, Depletion & Amortization
01101 Selling, General & Administrative Expenses
01250 Operating Income
01251 Interest Expense on Debt
01401 Pre-tax Income
01451 Income Taxes
01501 Minority Interest
01551 Net Income before Extraordinary Items/Preferred Dividends
01701 Preferred Dividend Requirements
01706 Net Income after Preferred Dividends (Basic EPS)
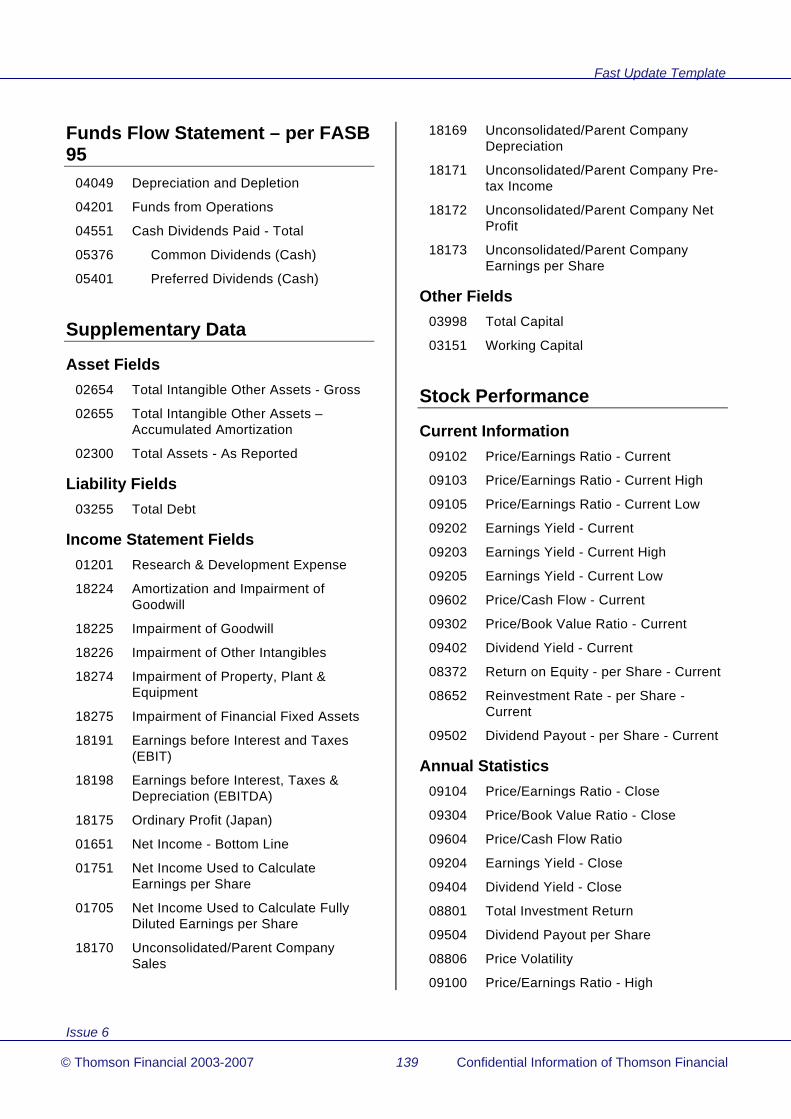
Fast Update Template
Issue 6
© Thomson Financial 2003-2007 139 Confidential Information of Thomson Financial
Funds Flow Statement – per FASB 95
04049 Depreciation and Depletion
04201 Funds from Operations
04551 Cash Dividends Paid - Total
05376 Common Dividends (Cash)
05401 Preferred Dividends (Cash)
Supplementary Data
Asset Fields 02654 Total Intangible Other Assets - Gross
02655 Total Intangible Other Assets – Accumulated Amortization
02300 Total Assets - As Reported
Liability Fields 03255 Total Debt
Income Statement Fields 01201 Research & Development Expense
18224 Amortization and Impairment of Goodwill
18225 Impairment of Goodwill
18226 Impairment of Other Intangibles
18274 Impairment of Property, Plant & Equipment
18275 Impairment of Financial Fixed Assets
18191 Earnings before Interest and Taxes (EBIT)
18198 Earnings before Interest, Taxes & Depreciation (EBITDA)
18175 Ordinary Profit (Japan)
01651 Net Income - Bottom Line
01751 Net Income Used to Calculate Earnings per Share
01705 Net Income Used to Calculate Fully Diluted Earnings per Share
18170 Unconsolidated/Parent Company Sales
18169 Unconsolidated/Parent Company Depreciation
18171 Unconsolidated/Parent Company Pre-tax Income
18172 Unconsolidated/Parent Company Net Profit
18173 Unconsolidated/Parent Company Earnings per Share
Other Fields 03998 Total Capital
03151 Working Capital
Stock Performance
Current Information 09102 Price/Earnings Ratio - Current
09103 Price/Earnings Ratio - Current High
09105 Price/Earnings Ratio - Current Low
09202 Earnings Yield - Current
09203 Earnings Yield - Current High
09205 Earnings Yield - Current Low
09602 Price/Cash Flow - Current
09302 Price/Book Value Ratio - Current
09402 Dividend Yield - Current
08372 Return on Equity - per Share - Current
08652 Reinvestment Rate - per Share - Current
09502 Dividend Payout - per Share - Current
Annual Statistics 09104 Price/Earnings Ratio - Close
09304 Price/Book Value Ratio - Close
09604 Price/Cash Flow Ratio
09204 Earnings Yield - Close
09404 Dividend Yield - Close
08801 Total Investment Return
09504 Dividend Payout per Share
08806 Price Volatility
09100 Price/Earnings Ratio - High

Fast Update Template
Issue 6
© Thomson Financial 2003-2007 140 Confidential Information of Thomson Financial
09101 Price/Earnings Ratio - Low
09106 Price/Earnings Ratio - Avg High-Low
09200 Earnings Yield - High
09201 Earnings Yield - Low
09206 Earnings Yield - Avg High-Low
09300 Price/Book Value Ratio - High
09301 Price/Book Value Ratio - Low
09306 Price/Book Value Ratio - Avg High-Low
09400 Dividend Yield - High
09401 Dividend Yield - Low
09406 Dividend Yield - Avg High-Low
09704 Market Capitalization/Common Equity
Five Year Averages 09121 Price/Earnings Ratio - Close
09321 Price/Book Value Ratio - Close
09621 Price/Cash Flow Ratio
09221 Earnings Yield - Close
09421 Dividend Yield - Close
08805 Total Investment Return
09521 Dividend Payout per Share
09111 Price/Earnings Ratio - High
09116 Price/Earnings Ratio - Low
09126 Price/Earnings Ratio - Avg High-Low
09211 Earnings Yield - High
09216 Earnings Yield - Low
09226 Earnings Yield - Avg High-Low
09311 Price/Book Value Ratio - High
09316 Price/Book Value Ratio - Low
09326 Price/Book Value Ratio - Avg High-Low
09411 Dividend Yield - High
09416 Dividend Yield - Low
09426 Dividend Yield - Avg High-Low
09721 Market Capitalization/Common Equity
Growth Rates
Annual Statistics 08631 Net Sales/Revenues Growth
08646 Operating Income Growth
08636 Net Income Growth
08621 Total Assets Growth
08616 Equity Growth
08601 Earnings per Share Growth
08611 Dividends per Share Growth
08606 Book Value per Share Growth
08676 Net Margin Growth
Five Year Averages 08635 Net Sales/Revenues Growth
08650 Operating Income Growth
08640 Net Income Growth
08625 Total Assets Growth
08620 Equity Growth
08605 Earnings per Share Growth
08615 Dividends per Share Growth
08610 Book Value per Share Growth
08680 Net Margin Growth
Profitability
Annual Statistics 08301 Return on Equity – Total (%)
08371 Return on Equity - per Share
08376 Return on Invested Capital
08656 Reinvestment Rate - Total
08651 Reinvestment Rate - per Share
08911 Retained Earnings % Equity
08381 Cash Earnings Return on Equity
08311 Cash Flow/Sales
08316 Operating Profit Margin
08361 Operating Income/Total Capital
08321 Pre-tax Margin

Fast Update Template
Issue 6
© Thomson Financial 2003-2007 141 Confidential Information of Thomson Financial
08356 Interest Rate - Estimated Average
08366 Net Margin
Five Year Averages 08305 Return on Equity – Total (%)
08375 Return on Equity - per Share
08380 Return on Invested Capital
08660 Reinvestment Rate - Total
08655 Reinvestment Rate - per Share
08915 Retained Earnings % Equity
08385 Cash Earnings Return on Equity
08315 Cash Flow/Sales
08320 Operating Profit Margin
08365 Operating Income/Total Capital
08325 Pre-tax Margin
08360 Interest Rate - Estimated Average
08370 Net Margin
Asset Utilization
Annual Statistics 08401 Total Asset Turnover
08141 Net Sales/Working Capital
Five Year Averages 08405 Total Asset Turnover
08145 Net Sales/Working Capital
Leverage
Annual Statistics 08231 Total Debt % Common Equity
08226 Long Term Debt % Common Equity
08211 Minority Interest % Total Capital
08221 Total Debt % Total Capital
08216 Long Term Debt % Total Capital
08201 Equity % Total Capital
08206 Preferred Stock % Total Capital
08236 Total Debt % Total Assets
08241 Common Equity % Total Assets
08287 Total Assets / Common Equity Ratio
15121 Total Capital % Assets
08256 Dividend Payout (% Earnings) - Total Dollar
08906 Cash Dividends % Cash Flow
08246 Cash Dividend Coverage Ratio
08266 Fixed Assets % Common Equity
08271 Working Capital % Total Capital
Five Year Averages 08235 Total Debt % Common Equity
08230 Long Term Debt % Common Equity
08215 Minority Interest % Total Capital
08225 Total Debt % Total Capital
08220 Long Term Debt % Total Capital
08205 Equity % Total Capital
08210 Preferred Stock % Total Capital
08240 Total Debt % Total Assets
08245 Common Equity % Total Assets
15124 Total Capital % Assets
08260 Dividend Payout (% Earnings) - Total Dollar
08910 Cash Dividends % Cash Flow
08250 Cash Dividend Coverage Ratio
08270 Fixed Assets % Common Equity
08275 Working Capital % Total Capital
Liquidity
Annual Statistics 08106 Current Ratio
08111 Cash & Equivalents % Total Current Assets
Five Year Averages 08110 Current Ratio

Fast Update Template
Issue 6
© Thomson Financial 2003-2007 142 Confidential Information of Thomson Financial
08115 Cash & Equivalents % Total Current Assets
Company Specific Accounting Practices
07531 Accounting method for long term investment > 50%
INSURANCE COMPANIES Notes:
#: Currently U.S. and Canadian Cos. only
General Information 06001 Company Name
06014 Acronym
00000 Company Status
06094 Post Office Box
06021 Building
06022 Street
06023 Address City
06024 Address State
06025 Post Code/Zip Code
06031 Phone Number
06033 FAX Number
06030 Internet Address
06041 Officer 1 - Name
Officer 1 - Title
06051 Officer 2 - Name
Officer 2 - Title
06061 Officer 3 - Name
Officer 3 - Title
06071 Officer 4 - Name
Officer 4 - Title
06081 Officer 5 - Name
Officer 5 - Title
18357 Investor Relations - Name
18358 Investor Relations - Address
18356 Investor Relations – E-Mail Address
18359 Investor Relations - Phone/Fax
06092 Business Description - Extended
07011 Employees
06099 Currency of Document
05350 Date of Fiscal Period End
11556 Indicator – Restated Data Exists

Fast Update Template
Issue 6
© Thomson Financial 2003-2007 143 Confidential Information of Thomson Financial
11557 Indicator – Restatement Type
11558 Indicator – Early Release (Restatement)
11559 Indicator – Restatement Reason Code
Industry 06011 Industry Group
06010 General Industry Classification
Stock Data
Current Information 06005 Type of Share
05601 Ticker Symbol
06004 CUSIP
06006 SEDOL
06008 ISIN
06035 Worldscope Identifier
06105 Worldscope Permanent I.D.
06034 Disclosure Company Identifier
06038 I/B/E/S Ticker
06040 Dow Jones Company Symbol
11501 Indicator - Currently a Multiple Share Company
07013 Year of Fast Update
05427 Stock Exchange(s) Listed
05661 Stock Index Information
11496 Indicator - ADR
05006 Market Price - Current
05009 Date of Current Price
05007 Market Price - Year to Date - High
05008 Market Price - Year to Date - Low
08005 Market Capitalization - Current
05302 Common Shares Outstanding - Current
05306 Date of Common Shares
05255 Earnings per Share - Last 12 Months
05256 Date of Last 12 Months EPS
05145 Dividends per Share - Last 12 Months
05190 Indicated Dividend Rate
05480 Book Value per Share - Current
05510 Cash Flow per Share - Current
Annual Statistics 05001 Market Price - Year End
05002 Market Price - High
05003 Market Price - Low
05004 Market Price - 5 yr avg - High
05005 Market Price - 5 yr avg - Low
08001 Market Capitalization
05651 Common Shares Traded - Annual #
08006 Trading Volume ($ Amount) #
08010 Trading Volume - Weekly Average #
08011 Turnover Rate #
05201 Earnings per Share
05210 Earnings per Share – Basic – Year
10010 Earnings per Share – Basic – Fiscal #
05290 Fully Diluted Earnings per Share
10030 Earnings per Share – Fully Diluted – Fiscal #
05202 Earnings per Share - Fiscal Year End
05200 Earnings Report Frequency
18209 Earnings per Share Including Extraordinary Items – Fiscal
05225 Includes Extraordinary Credit/Charge per Share
05227 Includes Pre-tax Extraordinary Credit/Charge per Share
05240 DVFA Earnings (Germany)
05203 OVFA Earnings per Share (Austria)
05725 Headline Earnings per Share
05260 Earnings per Share - 5 yr avg
05101 Dividends per Share
05140 Dividends per Share - 5 yr avg

Fast Update Template
Issue 6
© Thomson Financial 2003-2007 144 Confidential Information of Thomson Financial
05102 Dividends per Share – Gross
05100 Dividend Report Frequency
05476 Book Value per Share
05486 Tangible Book Value per Share
05501 Cash Flow per Share
05508 Sales per Share
05509 Operating Profit per Share
05301 Common Shares Outstanding
05309 Par Value
05191 Common Shares Used to Calculate EPS
05192 Common Shares Used to Calculate Basic EPS
05194 Common Shares Used to Calculate Fully Diluted EPS
05576 Stock Split/Dividend Ratio
Weekly Time Series 05652 Common Shares Traded – Weekly
05080 Market Price – Week Close
05081 Market Price – Week High
05082 Market Price – Week Low
Balance Sheet
Assets 02003 Cash
02255 Investments – Total
02501 Property, Plant and Equipment - Net
02649 Total Intangible Other Assets - Net
02999 Total Assets
Liabilities & Shareholders' Equity 03005 Benefit and Loss Reserves
03010 Unearned Premiums
03020 Policy & Contract Claims
03023 Other Insurance Reserves
03255 Total Debt
03051 Short Term Debt & Current Portion of Long Term Debt
03251 Long Term Debt
03245 Long Term Debt Excluding Capitalized Leases
03249 Capitalized Lease Obligations
03263 Deferred Taxes
03257 Deferred Tax Liability in Untaxed Reserves
03351 Total Liabilities
03401 Non-Equity Reserves
03426 Minority Interest
03451 Preferred Stock
03501 Common Equity
03493 Other Appropriated Reserves
03494 Unappropriated (Free) Reserves
03495 Retained Earnings
03440 Policyholders' Equity
03999 Total Liabilities & Shareholders' Equity
Income Statement 01002 Premiums Earned
01001 Net Sales or Revenues
01080 Long Term Insurance Reserves
01101 Selling, General & Administrative Expenses
01250 Operating Income
01251 Interest Expense on Debt
01401 Pre-tax Income
01451 Income Taxes
01501 Minority Interest
01640 Policyholders' Surplus
01551 Net Income before Extraordinary Items/Preferred Dividends
01701 Preferred Dividend Requirements
01706 Net Income after Preferred Dividends (Basic EPS)
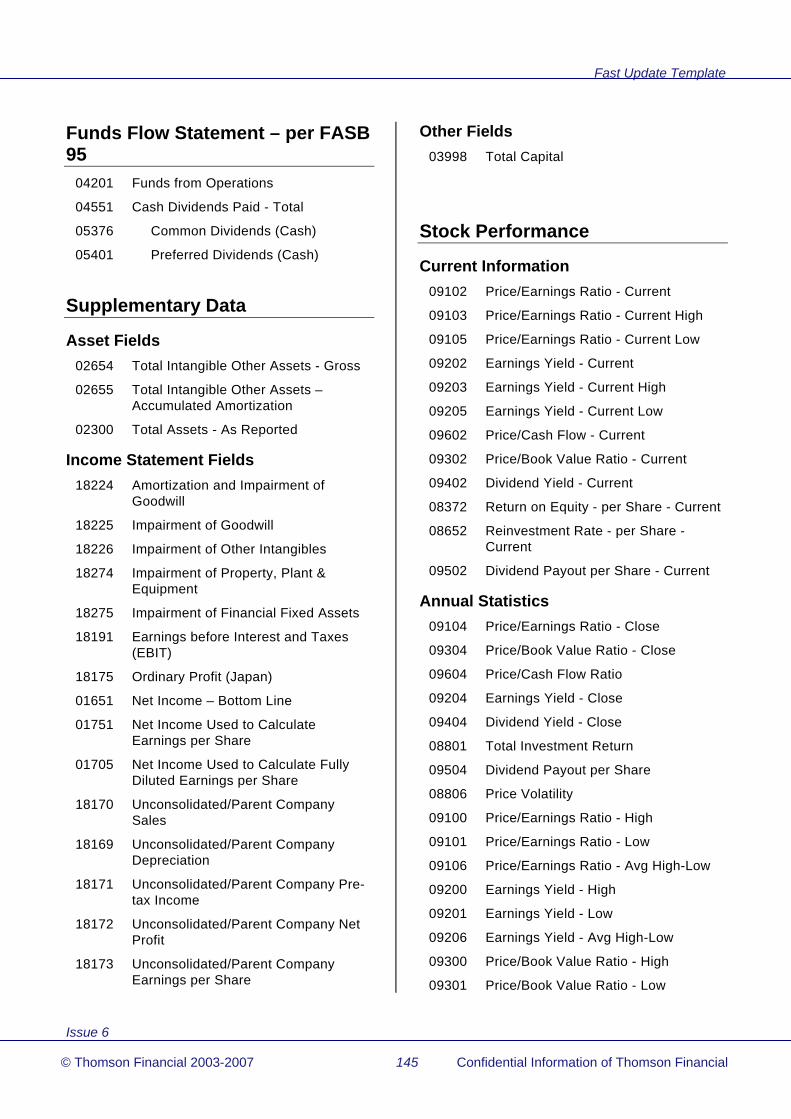
Fast Update Template
Issue 6
© Thomson Financial 2003-2007 145 Confidential Information of Thomson Financial
Funds Flow Statement – per FASB 95
04201 Funds from Operations
04551 Cash Dividends Paid - Total
05376 Common Dividends (Cash)
05401 Preferred Dividends (Cash)
Supplementary Data
Asset Fields 02654 Total Intangible Other Assets - Gross
02655 Total Intangible Other Assets – Accumulated Amortization
02300 Total Assets - As Reported
Income Statement Fields 18224 Amortization and Impairment of
Goodwill
18225 Impairment of Goodwill
18226 Impairment of Other Intangibles
18274 Impairment of Property, Plant & Equipment
18275 Impairment of Financial Fixed Assets
18191 Earnings before Interest and Taxes (EBIT)
18175 Ordinary Profit (Japan)
01651 Net Income – Bottom Line
01751 Net Income Used to Calculate Earnings per Share
01705 Net Income Used to Calculate Fully Diluted Earnings per Share
18170 Unconsolidated/Parent Company Sales
18169 Unconsolidated/Parent Company Depreciation
18171 Unconsolidated/Parent Company Pre-tax Income
18172 Unconsolidated/Parent Company Net Profit
18173 Unconsolidated/Parent Company Earnings per Share
Other Fields 03998 Total Capital
Stock Performance
Current Information 09102 Price/Earnings Ratio - Current
09103 Price/Earnings Ratio - Current High
09105 Price/Earnings Ratio - Current Low
09202 Earnings Yield - Current
09203 Earnings Yield - Current High
09205 Earnings Yield - Current Low
09602 Price/Cash Flow - Current
09302 Price/Book Value Ratio - Current
09402 Dividend Yield - Current
08372 Return on Equity - per Share - Current
08652 Reinvestment Rate - per Share - Current
09502 Dividend Payout per Share - Current
Annual Statistics 09104 Price/Earnings Ratio - Close
09304 Price/Book Value Ratio - Close
09604 Price/Cash Flow Ratio
09204 Earnings Yield - Close
09404 Dividend Yield - Close
08801 Total Investment Return
09504 Dividend Payout per Share
08806 Price Volatility
09100 Price/Earnings Ratio - High
09101 Price/Earnings Ratio - Low
09106 Price/Earnings Ratio - Avg High-Low
09200 Earnings Yield - High
09201 Earnings Yield - Low
09206 Earnings Yield - Avg High-Low
09300 Price/Book Value Ratio - High
09301 Price/Book Value Ratio - Low

Fast Update Template
Issue 6
© Thomson Financial 2003-2007 146 Confidential Information of Thomson Financial
09306 Price/Book Value Ratio - Avg High-Low
09400 Dividend Yield - High
09401 Dividend Yield - Low
09406 Dividend Yield - Avg High-Low
09704 Market Capitalization/Common Equity
Five Year Averages 09121 Price/Earnings Ratio - Close
09321 Price/Book Value Ratio - Close
09621 Price/Cash Flow Ratio
09221 Earnings Yield - Close
09421 Dividend Yield - Close
08805 Total Investment Return
09521 Dividend Payout per Share
09111 Price/Earnings Ratio - High
09116 Price/Earnings Ratio - Low
09126 Price/Earnings Ratio - Avg High-Low
09211 Earnings Yield - High
09216 Earnings Yield - Low
09226 Earnings Yield - Avg High-Low
09311 Price/Book Value Ratio - High
09316 Price/Book Value Ratio - Low
09326 Price/Book Value Ratio - Avg High-Low
09411 Dividend Yield - High
09416 Dividend Yield - Low
09426 Dividend Yield - Avg High-Low
09721 Market Capitalization/Common Equity
Growth Rates
Annual Statistics 08646 Operating Income Growth
08636 Net Income Growth
08621 Total Assets Growth
08616 Equity Growth
08601 Earnings per Share Growth
08611 Dividends per Share Growth
08606 Book Value per Share Growth
Five Year Averages 08650 Operating Income Growth
08640 Net Income Growth
08625 Total Assets Growth
08620 Equity Growth
08605 Earnings per Share Growth
08615 Dividends per Share Growth
08610 Book Value per Share Growth
Profitability
Annual Statistics 08301 Return on Equity – Total (%)
08371 Return on Equity - Per Share
08376 Return on Invested Capital
08656 Reinvestment Rate - Total
08651 Reinvestment Rate - Per Share
08911 Retained Earnings % Equity
08381 Cash Earnings Return on Equity
08311 Cash Flow/Sales
08316 Operating Profit Margin
08361 Operating Income Return on Total Capital
08321 Pre-tax Margin
08356 Interest Rate - Estimated Average
08366 Net Margin
15519 Operating Income % Premiums Earned
Five Year Averages 08305 Return on Equity - Total (%)
08375 Return on Equity - per Share
08380 Return on Invested Capital
08660 Reinvestment Rate - Total
08655 Reinvestment Rate - per Share
08915 Retained Earnings % Equity

Fast Update Template
Issue 6
© Thomson Financial 2003-2007 147 Confidential Information of Thomson Financial
08385 Cash Earnings Return on Equity
08315 Cash Flow/Sales
08320 Operating Profit Margin
08365 Operating Income Return on Total Capital
08325 Pre-tax Margin
08360 Interest Rate - Estimated Average
08370 Net Margin
15522 Operating Income Premiums Earned
Asset Utilization
Annual Statistics 08401 Total Asset Turnover
Five Year Averages 08405 Total Asset Turnover
Leverage
Annual Statistics 08231 Total Debt % Common Equity
08226 Long Term Debt % Common Equity
08221 Total Debt % Total Capital
08216 Long Term Debt % Total Capital
08211 Minority Interest % Total Capital
08201 Equity % Total Capital
08206 Preferred Stock % Total Capital
08256 Dividend Payout (% Earnings)
08906 Cash Dividends % Cash Flow
08236 Total Debt % Total Assets
08241 Common Equity % Total Assets
08287 Total Assets / Common Equity Ratio
15121 Total Capital % Total Assets
08266 Fixed Assets % Common Equity
Five Year Averages 08235 Total Debt % Common Equity
08230 Long Term Debt % Common Equity
08225 Total Debt % Total Capital
08220 Long Term Debt % Total Capital
08215 Minority Interest % Total Capital
08205 Equity % Total Capital
08210 Preferred Stock % Total Capital
08260 Dividend Payout (% Earnings)
08910 Cash Dividends % Cash Flow
08240 Total Debt % Total Assets
08245 Common Equity % Total Assets
15124 Total Capital % Total Assets
08270 Fixed Assets % Common Equity
Company Specific Accounting Practices
07531 Accounting method for long term investment > 50%
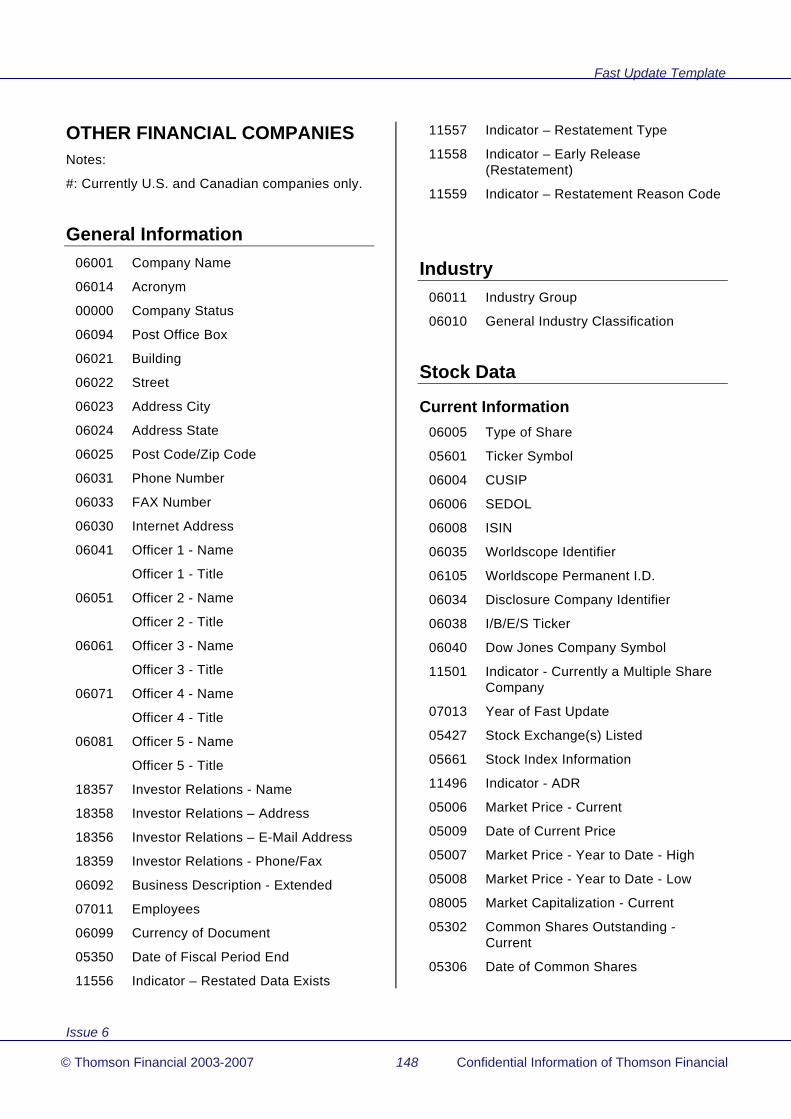
Fast Update Template
Issue 6
© Thomson Financial 2003-2007 148 Confidential Information of Thomson Financial
OTHER FINANCIAL COMPANIES Notes:
#: Currently U.S. and Canadian companies only.
General Information 06001 Company Name
06014 Acronym
00000 Company Status
06094 Post Office Box
06021 Building
06022 Street
06023 Address City
06024 Address State
06025 Post Code/Zip Code
06031 Phone Number
06033 FAX Number
06030 Internet Address
06041 Officer 1 - Name
Officer 1 - Title
06051 Officer 2 - Name
Officer 2 - Title
06061 Officer 3 - Name
Officer 3 - Title
06071 Officer 4 - Name
Officer 4 - Title
06081 Officer 5 - Name
Officer 5 - Title
18357 Investor Relations - Name
18358 Investor Relations – Address
18356 Investor Relations – E-Mail Address
18359 Investor Relations - Phone/Fax
06092 Business Description - Extended
07011 Employees
06099 Currency of Document
05350 Date of Fiscal Period End
11556 Indicator – Restated Data Exists
11557 Indicator – Restatement Type
11558 Indicator – Early Release (Restatement)
11559 Indicator – Restatement Reason Code
Industry 06011 Industry Group
06010 General Industry Classification
Stock Data
Current Information 06005 Type of Share
05601 Ticker Symbol
06004 CUSIP
06006 SEDOL
06008 ISIN
06035 Worldscope Identifier
06105 Worldscope Permanent I.D.
06034 Disclosure Company Identifier
06038 I/B/E/S Ticker
06040 Dow Jones Company Symbol
11501 Indicator - Currently a Multiple Share Company
07013 Year of Fast Update
05427 Stock Exchange(s) Listed
05661 Stock Index Information
11496 Indicator - ADR
05006 Market Price - Current
05009 Date of Current Price
05007 Market Price - Year to Date - High
05008 Market Price - Year to Date - Low
08005 Market Capitalization - Current
05302 Common Shares Outstanding - Current
05306 Date of Common Shares

Fast Update Template
Issue 6
© Thomson Financial 2003-2007 149 Confidential Information of Thomson Financial
05255 Earnings per Share - Last 12 Months
05256 Date of Last 12 Months EPS
05145 Dividends per Share - Last 12 Months
05190 Indicated Dividend Rate
05480 Book Value per Share - Current
05510 Cash Flow per Share - Current
Annual Statistics 05001 Market Price - Year End
05002 Market Price - High
05003 Market Price - Low
05004 Market Price - 5 yr avg - High
05005 Market Price - 5 yr avg - Low
08001 Market Capitalization
05651 Common Shares Traded - Annual #
08006 Trading Volume ($ Amount) #
08010 Trading Volume - Weekly Average #
08011 Turnover Rate #
05201 Earnings per Share
05210 Earnings per Share – Basic – Year
10010 Earnings per Share – Basic – Fiscal #
05290 Fully Diluted Earnings per Share
10030 Earnings per Share – Fully Diluted – Fiscal #
05202 Earnings per Share - Fiscal Year End
05200 Earnings Report Frequency
18209 Earnings per Share Including Extraordinary Items – Fiscal
05225 Includes Extraordinary Credit/Charge per Share
05227 Includes Pre-tax Extraordinary Credit/Charge per Share
05240 DVFA Earnings (Germany)
05203 OVFA Earnings per Share (Austria)
05725 Headline Earnings per Share (U.K.)
05260 Earnings per Share - 5 yr avg
05101 Dividends per Share
05140 Dividends per Share - 5 yr avg
05102 Dividends per Share - Gross
05100 Dividend Report Frequency
05476 Book Value per Share
05486 Tangible Book Value per Share
05501 Cash Flow per Share
05508 Sales per Share
05509 Operating Profit per Share
05301 Common Shares Outstanding
05309 Par Value
05191 Common Shares Used to Calculate EPS
05192 Common Shares Used to Calculate Basic EPS
05194 Common Shares Used to Calculate Fully Diluted EPS
05576 Stock Split/Dividend Ratio
Weekly Time Series 05652 Common Shares Traded – Weekly
05080 Market Price – Week Close
05081 Market Price – Week High
05082 Market Price – Week Low
Balance Sheet
Assets 02001 Cash & Short Term Investments
02051 Receivables (Net)
02255 Investments – Total
02501 Property, Plant & Equipment - Net
02301 Property Plant and Equipment - Gross
02401 Accumulated Depreciation
02649 Total Intangible Other Assets - Net
02101 Inventories – Total
02999 Total Assets
Liabilities & Shareholders' Equity 03255 Total Debt

Fast Update Template
Issue 6
© Thomson Financial 2003-2007 150 Confidential Information of Thomson Financial
03051 Short Term Debt & Current Portion of Long Term Debt
03251 Long Term Debt
03245 Long Term Debt Excluding Capitalized Leases
03249 Capitalized Lease Obligations
03263 Deferred Taxes
03257 Deferred Tax Liability in Untaxed Reserves
03351 Total Liabilities
03401 Non-Equity Reserves
03426 Minority Interest
03451 Preferred Stock
03501 Common Equity
03493 Other Appropriated Reserves
03494 Unappropriated (Free) Reserves
03495 Retained Earnings
03999 Total Liabilities & Shareholders' Equity
Income Statement 01001 Net Sales or Revenues
01051 Cost of Goods Sold
01075 Interest Expense – Total
01101 Selling, General & Administrative Expenses
01151 Depreciation, Depletion & Amortization
01250 Operating Income
01401 Pre-tax Income
01451 Income Taxes
01501 Minority Interest
01551 Net Income before Extraordinary Items/Preferred Dividends
01701 Preferred Dividend Requirements
01706 Net Income after Preferred Dividends (Basic EPS)
Funds Flow Statement – per FASB 95
04051 Depreciation, Depletion and Amortization
04201 Funds from Operations
04551 Cash Dividends Paid - Total
05376 Common Dividends (Cash)
05401 Preferred Dividends (Cash)
Supplementary Data
Asset Fields 02654 Total Intangible Other Assets - Gross
02655 Total Intangible Other Assets – Accumulated Amortization
02300 Total Assets - As Reported
Income Statement Fields 01251 Interest Expense on Debt
18224 Amortization and Impairment of Goodwill
18225 Impairment of Goodwill
18226 Impairment of Other Intangibles
18274 Impairment of Property, Plant & Equipment
18275 Impairment of Financial Fixed Assets
18191 Earnings before Interest and Taxes (EBIT)
18198 Earnings before Interest, Taxes & Depreciation (EBITDA)
18175 Ordinary Profit (Japan)
01651 Net Income - Bottom Line
01751 Net Income Used to Calculate Earnings per Share
01705 Net Income Used to Calculate Fully Diluted Earnings per Share
18170 Unconsolidated/Parent Company Sales 18169 Unconsolidated/Parent Company Depreciation

Fast Update Template
Issue 6
© Thomson Financial 2003-2007 151 Confidential Information of Thomson Financial
18171 Unconsolidated/Parent Company Pre-tax Income
18172 Unconsolidated/Parent Company Net Profit
18173 Unconsolidated/Parent Company Earnings per Share
Other Fields 03998 Total Capital
Stock Performance
Current Information 09102 Price/Earnings Ratio - Current
09103 Price/Earnings Ratio - Current High
09105 Price/Earnings Ratio - Current Low
09202 Earnings Yield - Current
09203 Earnings Yield - Current High
09205 Earnings Yield - Current Low
09302 Price/Book Value Ratio - Current
09602 Price/Cash Flow - Current
09402 Dividend Yield - Current
08372 Return on Equity – per Share - Current
08652 Reinvestment Rate - per Share - Current
09502 Dividend Payout - per Share - Current
Annual Statistics 09104 Price/Earnings Ratio - Close
09304 Price/Book Value Ratio - Close
09604 Price/Cash Flow Ratio
09204 Earnings Yield - Close
09404 Dividend Yield - Close
08801 Total Investment Return
09504 Dividend Payout per Share
08806 Price Volatility
09100 Price/Earnings Ratio - High
09101 Price/Earnings Ratio - Low
09106 Price/Earnings Ratio - Avg High-Low
09200 Earnings Yield - High
09201 Earnings Yield - Low
09206 Earnings Yield - Avg High-Low
09300 Price/Book Value Ratio - High
09301 Price/Book Value Ratio - Low
09306 Price/Book Value Ratio - Avg High-Low
09400 Dividend Yield - High
09401 Dividend Yield - Low
09406 Dividend Yield - Avg High-Low
09704 Market Capitalization/Common Equity
Five Year Averages 09121 Price/Earnings Ratio - Close
09321 Price/Book Value Ratio - Close
09621 Price/Cash Flow Ratio
09221 Earnings Yield - Close
09421 Dividend Yield - Close
08805 Total Investment Return
09521 Dividend Payout per Share
09111 Price/Earnings Ratio - High
09116 Price/Earnings Ratio - Low
09126 Price/Earnings Ratio - Avg High-Low
09211 Earnings Yield - High
09216 Earnings Yield - Low
09226 Earnings Yield - Avg High-Low
09311 Price/Book Value Ratio - High
09316 Price/Book Value Ratio - Low
09326 Price/Book Value Ratio - Avg High-Low
09411 Dividend Yield - High
09416 Dividend Yield - Low
09426 Dividend Yield - Avg High-Low
09721 Market Capitalization/Common Equity

Fast Update Template
Issue 6
© Thomson Financial 2003-2007 152 Confidential Information of Thomson Financial
Growth Rates
Annual Statistics 08631 Net Sales/Revenues Growth
08646 Operating Income Growth
08636 Net Income Growth
08621 Total Assets Growth
08616 Equity Growth
08601 Earnings per Share Growth
08611 Dividends per Share Growth
08606 Book Value per Share Growth
08676 Net Margin Growth
Five Year Averages 08635 Net Sales/Revenues Growth
08650 Operating Income Growth
08640 Net Income Growth
08625 Total Assets Growth
08620 Equity Growth
08605 Earnings per Share Growth
08615 Dividends per Share Growth
08610 Book Value per Share Growth
08680 Net Margin Growth
Profitability
Annual Statistics 08301 Return on Equity - Total (%)
08371 Return on Equity – per Share
08376 Return on Invested Capital
08651 Reinvestment Rate - per Share
08656 Reinvestment Rate - Total
08911 Retained Earnings % Equity
08381 Cash Earnings Return on Equity
08311 Cash Flow/Sales
08316 Operating Profit Margin
08361 Operating Income Return on Total Capital
08321 Pre-tax Margin
08356 Interest Rate - Estimated Average
08366 Net Margin
Five Year Averages 08305 Return on Equity – Total (%)
08375 Return on Equity - per Share
08380 Return on Invested Capital
08655 Reinvestment Rate - per Share
08660 Reinvestment Rate - Total
08915 Retained Earnings % Equity
08385 Cash Earnings Return on Equity
08315 Cash Flow/Sales
08320 Operating Profit Margin
08365 Operating Income Return on Total Capital
08325 Pre-tax Margin
08360 Interest Rate - Estimated Average
08370 Net Margin
Asset Utilization
Annual Statistics 08401 Total Asset Turnover
Five Year Averages 08405 Total Asset Turnover
Leverage
Annual Statistics 08231 Total Debt % Common Equity
08226 Long Term Debt % Common Equity
08221 Total Debt % Total Capital
08216 Long Term Debt % Total Capital
08211 Minority Interest % Total Capital
08201 Equity % Total Capital
08206 Preferred Stock % Total Capital
08236 Total Debt % Total Assets

Fast Update Template
Issue 6
© Thomson Financial 2003-2007 153 Confidential Information of Thomson Financial
08241 Common Equity % Total Assets
08287 Total Assets / Common Equity Ratio
15121 Total Capital % Total Assets
08256 Dividend Payout (% Earnings)
08906 Cash Dividends % Cash Flow
08250 Cash Dividend Coverage Ratio
08266 Fixed Assets % Common Equity
Five Year Averages 08235 Total Debt % Common Equity
08230 Long Term Debt % Common Equity
08225 Total Debt % Total Capital
08220 Long Term Debt % Total Capital
08215 Minority Interest % Total Capital
08205 Equity % Total Capital
08210 Preferred Stock % Total Capital
08240 Total Debt % Total Assets
08245 Common Equity % Total Assets
15124 Total Capital % Total Assets
08260 Dividend Payout (% Earnings)
08910 Cash Dividends % Cash Flow
08250 Cash Dividend Coverage Ratio
08270 Fixed Assets % Common Equity
Company Specific Accounting Practices
07531 Accounting method for long term investment > 50%

Issue 6
© Thomson Financial 2003-2007 154 Confidential Information of Thomson Financial
Limited Data Set Companies Template
BANKS Notes:
#: Only available since May 2003
General Information 06001 Company Name
06003 Company Name - Short
06014 Acronym
00000 Company Status
06094 Post Office Box
06021 Building
06022 Street
06023 Address City
06024 Address State
06025 Post Code/Zip Code
06026 Nation
06027 Nation Code
06028 Region
06031 Phone Number
06033 FAX Number
06030 Internet Address
06041 Officer 1 - Name
Officer 1 - Title
06051 Officer 2 - Name
Officer 2 - Title
18357 Investor Relations - Name
18358 Investor Relations – Address
18356 Investor Relations – E-Mail Address
18359 Investor Relations - Phone/FAX
11516 Date Added to Product
07033 Full/Limited Coverage Indicator
07015 Inactive Date
06092 Business Description - Extended
07011 Employees
06100 Entity Type
06099 Currency of Document
05350 Date of Fiscal Period End
05352 Month of Fiscal Year End
05351 Length of Fiscal Period
11556 Indicator – Restated Data Exists
11557 Indicator – Restatement Type
11558 Indicator – Early Release (Restatement)
11559 Indicator – Restatement Reason Code
Industry 06011 Industry Group
06010 General Industry Classification
07040 ICB Code
07021 SIC Code 1
07022 SIC Code 2
07023 SIC Code 3
Product Segment Data 19500 Product Segment 1 - Description
19501 Product Segment 1 - Sales
19503 Product Segment 1 - Assets
19506 Product Segment 1 - SIC Code
19510 Product Segment 2 - Description
19511 Product Segment 2 - Sales
19513 Product Segment 2 - Assets
19516 Product Segment 2 - SIC Code
19520 Product Segment 3 - Description
19521 Product Segment 3 - Sales
19523 Product Segment 3 - Assets
19526 Product Segment 3 - SIC Code
19530 Product Segment 4 - Description

Limited Data Set Companies Template
Issue 6
© Thomson Financial 2003-2007 155 Confidential Information of Thomson Financial
19531 Product Segment 4 - Sales
19533 Product Segment 4 - Assets
19536 Product Segment 4 - SIC Code
19540 Product Segment 5 - Description
19541 Product Segment 5 - Sales
19543 Product Segment 5 - Assets
19546 Product Segment 5 - SIC Code
19550 Product Segment 6 - Description
19551 Product Segment 6 - Sales
19553 Product Segment 6 - Assets
19556 Product Segment 6 - SIC Code
19560 Product Segment 7 - Description
19561 Product Segment 7 - Sales
19563 Product Segment 7 - Assets
19566 Product Segment 7 - SIC Code
19570 Product Segment 8 - Description
19571 Product Segment 8 - Sales
19573 Product Segment 8 - Assets
19576 Product Segment 8 - SIC Code
19580 Product Segment 9 - Description
19581 Product Segment 9 - Sales
19583 Product Segment 9 - Assets
19586 Product Segment 9 - SIC Code
19590 Product Segment 10 - Description
19591 Product Segment 10 - Sales
19593 Product Segment 10 - Assets
19596 Product Segment 10 - SIC Code
Key Items in US Dollars 07211 Market Capitalization - Current
07210 Market Capitalization
07221 Common Equity - Current
07220 Common Equity
07230 Total Assets
07240 Net Sales or Revenues
07250 Net Income
Stock Data
Current Information 06005 Type of Share
05601 Ticker Symbol
06004 CUSIP
06006 SEDOL
06008 ISIN
06035 Worldscope Identifier
06105 Worldscope Permanent I.D.
06034 Disclosure Company Identifier
06038 I/B/E/S Ticker
06040 Dow Jones Company Symbol
11501 Indicator - Currently a Multiple Share Company
11519 Indicator – Limited Data Set Company
07035 Latest Interim Date
05427 Stock Exchange(s) Listed
05661 Stock Index Information
11496 Indicator – ADR
05006 Market Price - Current
05009 Date of Current Price
05007 Market Price - Year to Date - High
05008 Market Price - Year to Date – Low
05091 Market Price – 52 Week High
05092 Market Price – 52 Week Low
08005 Market Capitalization - Current
05302 Common Shares Outstanding - Current
05306 Date of Common Shares
05255 Earnings per Share - Last 12 Months
05256 Date of Last 12 Months EPS
05145 Dividends per Share - Last 12 Months
05190 Indicated Dividend Rate
05480 Book Value per Share - Current
05510 Cash Flow per Share - Current

Limited Data Set Companies Template
Issue 6
© Thomson Financial 2003-2007 156 Confidential Information of Thomson Financial
Annual Statistics 05001 Market Price - Year End
05002 Market Price - High
05003 Market Price - Low
08001 Market Capitalization
05201 Earnings per Share
05210 Earnings per Share – Basic – Year
05290 Fully Diluted Earnings per Share
05202 Earnings per Share - Fiscal Year End
05200 Earnings Report Frequency
18209 Earnings per Share Including Extraordinary Items – Fiscal #
05230 Earnings per Share after Extraordinary Items
05225 Includes Extraordinary Credit/Charge per Share
05226 Extraordinary Credit/Charge per Share
05227 Includes Pre-tax Extraordinary Credit/Charge per Share
05240 DVFA Earnings (Germany)
05203 OVFA Earnings per Share (Austria)
05725 Headline Earnings per Share (U.K.)
05101 Dividends per Share
05110 Dividends per Share - Fiscal
05102 Dividends per Share - Gross
05100 Dividend Report Frequency
05476 Book Value per Share
05486 Tangible Book Value per Share
05491 Book Value – Outstanding Shares - Fiscal
05501 Cash Flow per Share
05502 Cash Flow per Share - Fiscal
05507 Free Cash Flow per Share
05508 Sales per Share
05509 Operating Profit per Share
05505 Capital Expenditure per Share
05301 Common Shares Outstanding
05309 Par Value #
05191 Common Shares Used to Calculate EPS
05192 Common Shares Used to Calculate Basic EPS
05194 Common Shares Used to Calculate Fully Diluted EPS
05576 Stock Split/Dividend Ratio
05575 Stock Split/Dividend Ratio - Fiscal
Weekly Time Series 05652 Common Shares Traded – Weekly
05080 Market Price – Week Close
05081 Market Price – Week High
05082 Market Price – Week Low
Balance Sheet
Assets 02004 Cash & Due from Banks #
02255 Investments-Total
02276 Loans-Net
02055 Interbank Loans
02501 Property, Plant & Equipment-Net
02649 Total Intangible Other Assets - Net
02999 Total Assets
Liabilities & Shareholders' Equity 03019 Deposits-Total
03255 Total Debt
03051 Short Term Debt & Current Portion of Long Term Debt
03251 Long-Term Debt
03245 Long-Term Debt Excluding Capitalized Leases
03249 Capitalized Lease Obligations
03263 Deferred Taxes
03257 Deferred Tax Liability in Untaxed Reserves
03351 Total Liabilities
03401 Non-Equity Reserves

Limited Data Set Companies Template
Issue 6
© Thomson Financial 2003-2007 157 Confidential Information of Thomson Financial
03426 Minority Interest
03451 Preferred Stock
03501 Common Equity
03493 Other Appropriated Reserves
03494 Unappropriated (Free) Reserves
03495 Retained Earnings
03999 Total Liabilities & Shareholders' Equity
Income Statement 01016 Interest Income - Total
01075 Interest Expense - Total
01251 Interest Expense on Debt
01076 Net Interest Income
04049 Depreciation and Depletion
01271 Provision for Loan Losses
01250 Operating Income
01401 Pre-tax Income
01451 Income Taxes #
01501 Minority Interest #
01551 Net Income before Extraordinary Items/Preferred Dividends
01701 Preferred Dividend Requirements
01706 Net Income after Preferred Dividends (Basic EPS)
Funds Flow Statement – per FASB 95
04201 Funds from Operations
04860 Net Cash Flow - Operating Activities
04601 Capital Expenditures (Additions to Fixed Assets)
04870 Net Cash Flow - Investing
04551 Cash Dividends Paid - Total
05376 Common Dividends (Cash)
05401 Preferred Dividends (Cash)
04890 Net Cash Flow - Financing
04840 Effect of Exchange Rate on Cash
04851 Increase/Decrease in Cash & Short Term Investments
Supplementary Data
Asset Fields 18214 Exchange Rate Used in Translating
Balance Sheet
02654 Total Intangible Other Assets - Gross
02655 Total Intangible Other Assets – Accumulated Amortization
02300 Total Assets - As Reported
Liability & Shareholders' Equity Fields 18228 Tier 1 Capital
Income Statement Fields 18215 Exchange Rate Used in Translating
Income Statement/Cash Flow
01001 Net Sales or Revenues
18224 Amortization and Impairment of Goodwill
18225 Impairment of Goodwill
18226 Impairment of Other Intangibles
18274 Impairment of Property, Plant & Equipment
18275 Impairment of Financial Fixed Assets
18191 Earnings before Interest and Taxes (EBIT)
01651 Net Income - Bottom Line
01751 Net Income Used to Calculate Earnings per Share
01705 Net Income Used to Calculate Fully Diluted Earnings per Share
Other Fields 03998 Total Capital
04500 External Financing

Limited Data Set Companies Template
Issue 6
© Thomson Financial 2003-2007 158 Confidential Information of Thomson Financial
Interim Data
Qtr 1 Qtr 2 Qtr 3 Qtr 4
Interim Sales 19101 19102 19103 19104
Interim Pre-tax Income
19105 19106 19107 19108
Interim Net Profit
19109 19110 19111 19112
Number of Months - EPS
05217 05218 05219 05220
Earnings per Share
05221 05222 05223 05224
Earnings per Share – Basic
05211 05212 05213 05214
Fully Diluted EPS
05291 05292 05293 05294
EPS – Report Date
05901 05902 05903 05904
EPS – 12 Months
05251 05252 05253 05254
Dividends per Share
05121 05122 05123 05124
DPS – Gross 05125 05126 05127 05128
DPS – Declared Date
05910 05911 05912 05913
DPS – Records Date
05917 05918 05919 05920
DPS – Ex Div Date
05923 05924 05925 05926
DPS – Payable Date
05929 05930 05931 05932
DPS – Extra 05151 05152 05153 05154
DPS - Extra – Gross
05171 05172 05173 05174
DPS - Extra - Dec Date
05935 05936 05937 05938
DPS - Extra - Rec Date
05941 05942 05943 05944
DPS - Extra - Ex-Div Date
05947 05948 05949 05950
DPS - Extra - Pay Date
05953 05954 05955 05956
DPS – Special 05155 05156 05157 05158
Qtr 1 Qtr 2 Qtr 3 Qtr 4
DPS - Special – Gross
05175 05176 05177 05178
DPS - Special – Dec Date
05965 05966 05968 05969
DPS - Special - Rec Date
05970 05971 05972 05973
DPS - Special - Ex-Div Date
05959 05960 05961 05962
DPS - Special - Pay Date
05976 05977 05978 05979
DPS - 12 Months
05131 05132 05133 05134
Monthly Price Information
Month End Market Price
High Price
Low Price
January 05015 05016 05017
February 05020 05021 05022
March 05025 05026 05027
April 05030 05031 05032
May 05035 05036 05037
June 05040 05041 05042
July 05045 05046 05047
August 05050 05051 05052
September 05055 05056 05057
October 05060 05061 05062
November 05065 05066 05067
December 05070 05071 05072
Stock Performance
Current Information 09102 Price/Earnings Ratio - Current
09103 Price/Earnings Ratio - Current High
09105 Price/Earnings Ratio - Current Low
09202 Earnings Yield - Current
09203 Earnings Yield - Current High
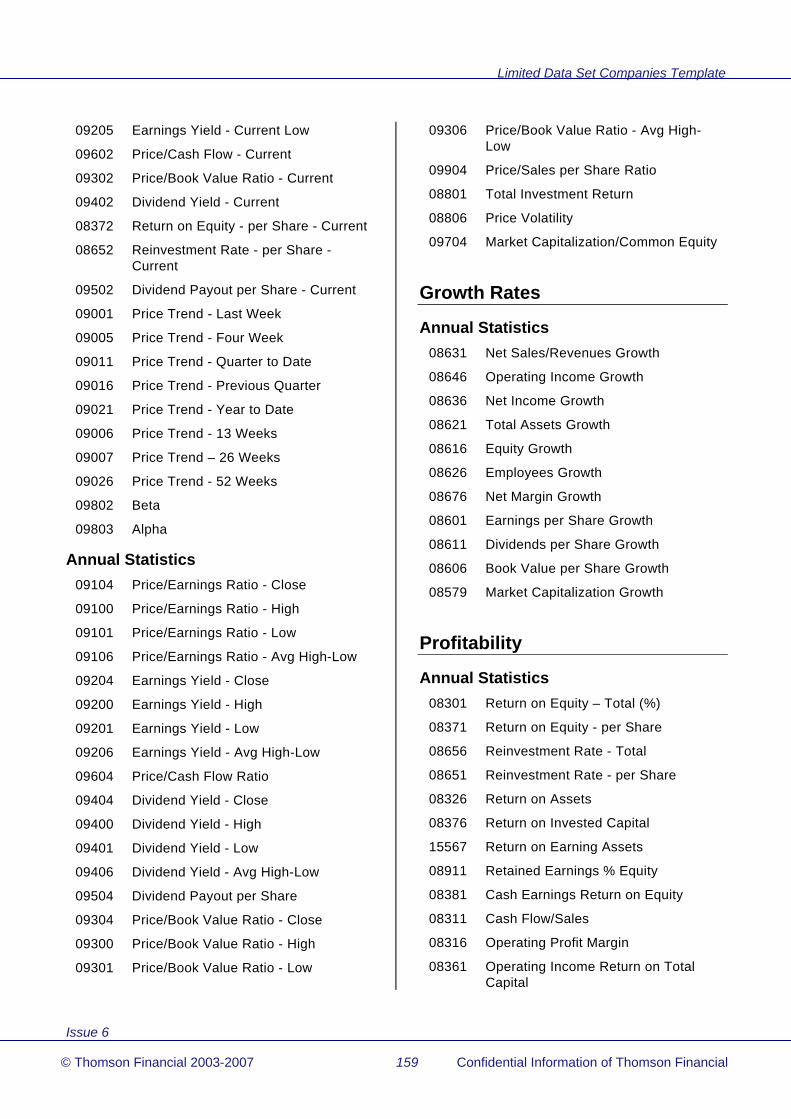
Limited Data Set Companies Template
Issue 6
© Thomson Financial 2003-2007 159 Confidential Information of Thomson Financial
09205 Earnings Yield - Current Low
09602 Price/Cash Flow - Current
09302 Price/Book Value Ratio - Current
09402 Dividend Yield - Current
08372 Return on Equity - per Share - Current
08652 Reinvestment Rate - per Share - Current
09502 Dividend Payout per Share - Current
09001 Price Trend - Last Week
09005 Price Trend - Four Week
09011 Price Trend - Quarter to Date
09016 Price Trend - Previous Quarter
09021 Price Trend - Year to Date
09006 Price Trend - 13 Weeks
09007 Price Trend – 26 Weeks
09026 Price Trend - 52 Weeks
09802 Beta
09803 Alpha
Annual Statistics 09104 Price/Earnings Ratio - Close
09100 Price/Earnings Ratio - High
09101 Price/Earnings Ratio - Low
09106 Price/Earnings Ratio - Avg High-Low
09204 Earnings Yield - Close
09200 Earnings Yield - High
09201 Earnings Yield - Low
09206 Earnings Yield - Avg High-Low
09604 Price/Cash Flow Ratio
09404 Dividend Yield - Close
09400 Dividend Yield - High
09401 Dividend Yield - Low
09406 Dividend Yield - Avg High-Low
09504 Dividend Payout per Share
09304 Price/Book Value Ratio - Close
09300 Price/Book Value Ratio - High
09301 Price/Book Value Ratio - Low
09306 Price/Book Value Ratio - Avg High-Low
09904 Price/Sales per Share Ratio
08801 Total Investment Return
08806 Price Volatility
09704 Market Capitalization/Common Equity
Growth Rates
Annual Statistics 08631 Net Sales/Revenues Growth
08646 Operating Income Growth
08636 Net Income Growth
08621 Total Assets Growth
08616 Equity Growth
08626 Employees Growth
08676 Net Margin Growth
08601 Earnings per Share Growth
08611 Dividends per Share Growth
08606 Book Value per Share Growth
08579 Market Capitalization Growth
Profitability
Annual Statistics 08301 Return on Equity – Total (%)
08371 Return on Equity - per Share
08656 Reinvestment Rate - Total
08651 Reinvestment Rate - per Share
08326 Return on Assets
08376 Return on Invested Capital
15567 Return on Earning Assets
08911 Retained Earnings % Equity
08381 Cash Earnings Return on Equity
08311 Cash Flow/Sales
08316 Operating Profit Margin
08361 Operating Income Return on Total Capital

Limited Data Set Companies Template
Issue 6
© Thomson Financial 2003-2007 160 Confidential Information of Thomson Financial
08321 Pre-tax Margin
08346 Tax Rate % #
08356 Interest Rate - Estimated Average
08366 Net Margin
15144 Net Interest Income % Earning Assets
15150 Net Interest Income % Average Deposits
15611 Efficiency of Earning Assets
15587 Earning Assets % Total Assets
08351 Sales per Employee
15593 Non-Interest Income % Total Revenues
15599 Total Interest Expense % Interest Bearing Liabilities
15605 Total Interest Income % Earning Assets
Asset Utilization
Annual Statistics 08406 Assets per Employee
08401 Total Asset Turnover
15091 Invested Assets % Total Assets
08416 Capital Expenditure % Total Assets
Leverage
Annual Statistics 08231 Total Debt % Common Equity
08226 Long Term Debt % Common Equity
08221 Total Debt % Total Capital
08216 Long Term Debt % Total Capital
08211 Minority Interest % Total Capital
08201 Equity % Total Capital
08206 Preferred Stock % Total Capital
08236 Total Debt % Total Assets
08241 Common Equity % Total Assets
08287 Total Assets / Common Equity Ratio
15121 Total Capital % Total Assets
08261 Operating Cash/Fixed Charges
08256 Dividend Payout (% Earnings)
08906 Cash Dividends % Cash Flow
08266 Fixed Assets % Common Equity
08291 EBIT / Total Interest Expense Ratio
15167 Invested Assets & Loans % Total Deposits
15161 Invested Assets % Total Deposits
15007 Equity % Total Deposits
15025 Total Capital % Total Deposits
15037 Total Deposits % Total Assets
15173 Earning Assets % Total Available funds
15097 Invested Assets % Liabilities
Company Specific Accounting Practices
07531 Accounting method for long term investment > 50%
07546 Auditor’s opinion

Limited Data Set Companies Template
Issue 6
© Thomson Financial 2003-2007 161 Confidential Information of Thomson Financial
INDUSTRIALS Notes:
#: Only available since May 2003
General Information 06001 Company Name
06003 Company Name - Short
06014 Acronym
00000 Company Status
06094 Post Office Box
06021 Building
06022 Street
06023 Address City
06024 Address State
06025 Post Code/Zip Code
06026 Nation
06027 Nation Code
06028 Region
06031 Phone Number
06033 FAX Number
06030 Internet Address
06041 Officer 1 - Name
Officer 1 - Title
06051 Officer 2 - Name
Officer 2 - Title
18357 Investor Relations - Name
18358 Investor Relations - Address
18356 Investor Relations – E-Mail Address
18359 Investor Relations - Phone/Fax
11516 Date Added to Product
07033 Full/Limited Coverage Indicator
07015 Inactive Date
06092 Business Description - Extended
07011 Employees
06100 Entity Type
06099 Currency of Document
05350 Date of Fiscal Period End
05352 Month of Fiscal Year End
05351 Length of Fiscal Period
11556 Indicator – Restated Data Exists
11557 Indicator – Restatement Type
11558 Indicator – Early Release (Restatement)
11559 Indicator – Restatement Reason Code
Industry 06011 Industry Group
06010 General Industry Classification
07040 ICB Code
07021 SIC Code 1
07022 SIC Code 2
07023 SIC Code 3
Product Segment Data 19500 Product Segment 1 - Description
19501 Product Segment 1 - Sales
19503 Product Segment 1 - Assets
19506 Product Segment 1 - SIC Code
19510 Product Segment 2 - Description
19511 Product Segment 2 - Sales
19513 Product Segment 2 - Assets
19516 Product Segment 2 - SIC Code
19520 Product Segment 3 - Description
19521 Product Segment 3 - Sales
19523 Product Segment 3 - Assets
19526 Product Segment 3 - SIC Code
19530 Product Segment 4 - Description
19531 Product Segment 4 - Sales
19533 Product Segment 4 - Assets
19536 Product Segment 4 - SIC Code
19540 Product Segment 5 - Description
19541 Product Segment 5 - Sales

Limited Data Set Companies Template
Issue 6
© Thomson Financial 2003-2007 162 Confidential Information of Thomson Financial
19543 Product Segment 5 - Assets
19546 Product Segment 5 - SIC Code
19550 Product Segment 6 - Description
19551 Product Segment 6 - Sales
19553 Product Segment 6 - Assets
19556 Product Segment 6 - SIC Code
19560 Product Segment 7 - Description
19561 Product Segment 7 - Sales
19563 Product Segment 7 - Assets
19566 Product Segment 7 - SIC Code
19570 Product Segment 8 - Description
19571 Product Segment 8 - Sales
19573 Product Segment 8 - Assets
19576 Product Segment 8 - SIC Code
19580 Product Segment 9 - Description
19581 Product Segment 9 - Sales
19583 Product Segment 9 - Assets
19586 Product Segment 9 - SIC Codes
19590 Product Segment 10 - Description
19591 Product Segment 10 - Sales
19593 Product Segment 10 - Assets
19596 Product Segment 10 - SIC Code
Key Items in US Dollars 07211 Market Capitalization - Current
07210 Market Capitalization
07221 Common Equity - Current
07220 Common Equity
07230 Total Assets
07240 Net Sales or Revenues
07250 Net Income
Stock Data
Current Information 06005 Type of Share
05601 Ticker Symbol
06004 CUSIP
06006 SEDOL
06008 ISIN
06035 Worldscope Identifier
06105 Worldscope Permanent I.D.
06034 Disclosure Company Identifier
06038 I/B/E/S Ticker
06040 Dow Jones Company Symbol
11501 Indicator - Currently a Multiple Share Company
11519 Indicator – Limited Data Set Company
07035 Latest Interim Date
05427 Stock Exchange(s) Listed
05661 Stock Index Information
11496 Indicator – ADR
05006 Market Price - Current
05009 Date of Current Price
05007 Market Price - Year to Date - High
05008 Market Price - Year to Date - Low
05091 Market Price – 52 Week High
05092 Market Price – 52 Week Low
08003 Market Capitalization (Public) - Current
08005 Market Capitalization - Current
05302 Common Shares Outstanding - Current
05306 Date of Common Shares
05255 Earnings per Share - Last 12 Months
05256 Date of Last 12 Months EPS
05145 Dividends per Share - Last 12 Months
05190 Indicated Dividend Rate
05480 Book Value per Share - Current
05510 Cash Flow per Share - Current
Annual Statistics 05001 Market Price - Year End
05002 Market Price - High
05003 Market Price - Low

Limited Data Set Companies Template
Issue 6
© Thomson Financial 2003-2007 163 Confidential Information of Thomson Financial
08001 Market Capitalization
05201 Earnings per Share
05210 Earnings per Share – Basic – Year
05290 Fully Diluted Earnings per Share
05202 Earnings per Share - Fiscal Year End
05200 Earnings Report Frequency
18209 Earnings per Share Including Extraordinary Items – Fiscal #
05230 Earnings per Share after Extraordinary Items
05225 Includes Extraordinary Credit/Charge per Share
05226 Extraordinary Credit/Charge per Share
05227 Includes Pre-tax Extraordinary Credit/Charge per Share
05240 DVFA Earnings (Germany)
05203 OVFA Earnings per Share (Austria)
05725 Headline Earnings per Share (U.K.)
05101 Dividends per Share
05110 Dividends per Share - Fiscal
05102 Dividends per Share - Gross
05100 Dividend Report Frequency
05476 Book Value per Share
05486 Tangible Book Value per Share
05491 Book Value – Outstanding Shares - Fiscal
05501 Cash Flow per Share
05502 Cash Flow per Share - Fiscal
05507 Free Cash Flow per Share
05503 Long Term Liabilities per Share
05508 Sales per Share
05509 Operating Profit per Share
05506 Working Capital per Share
05005 Capital Expenditure per Share
05301 Common Shares Outstanding
05309 Par Value
05191 Common Shares Used to Calculate EPS
05192 Common Shares Used to Calculate Basic EPS
05194 Common Shares Used to Calculate Fully Diluted EPS
05576 Stock Split/Dividend Ratio
05575 Stock Split/Dividend Ratio - Fiscal
Weekly Time Series 05652 Common Shares Traded – Weekly
05080 Market Price – Week Close
05081 Market Price – Week High
05082 Market Price – Week Low
Balance Sheet
Assets 02001 Cash & Short Term Investments
02051 Receivables (Net)
02101 Inventories -Total
02201 Current Assets - Total
02501 Property Plant and Equipment - Net
02301 Property Plant and Equipment – Gross #
02401 Accumulated Depreciation #
02649 Total Intangible Other Assets - Net
02999 Total Assets
Liabilities & Shareholders' Equity 03040 Accounts Payable #
03051 Short Term Debt & Current Portion of Long Term Debt
03101 Current Liabilities - Total
03251 Long Term Debt
03245 Long term Debt Excluding Capitalized Leases
03249 Capitalized Lease Obligations
03263 Deferred Taxes
03257 Deferred Tax Liability in Untaxed Reserves
03273 Other Liabilities

Limited Data Set Companies Template
Issue 6
© Thomson Financial 2003-2007 164 Confidential Information of Thomson Financial
03351 Total Liabilities
03401 Non-Equity Reserves
03426 Minority Interest
03451 Preferred Stock
03501 Common Equity
03493 Other Appropriated Reserves
03494 Unappropriated (Free) Reserves
03495 Retained Earnings
03999 Total Liabilities & Shareholders' Equity
Income Statement 01001 Net Sales or Revenues
01051 Cost of Goods Sold #
01151 Depreciation, Depletion & Amortization
01100 Gross Income #
01101 Selling, General & Administrative Expenses #
01250 Operating Income
01251 Interest Expense on Debt
01401 Pre-tax Income
01451 Income Taxes
01501 Minority Interest
01551 Net Income before Extraordinary Items/Preferred Dividends
01701 Preferred Dividend Requirements
01706 Net Income after Preferred Dividends (Basic EPS)
Funds Flow Statement per FASB 95
04049 Depreciation & Depletion #
04201 Funds from Operations
04860 Net Cash Flow - Operating Activities
04601 Capital Expenditures (Additions to Fixed Assets)
04870 Net Cash Flow - Investing
04551 Cash Dividends Paid - Total
05376 Common Dividends (Cash)
05401 Preferred Dividends (Cash)
04890 Net Cash Flow - Financing
04840 Effect of Exchange Rate on Cash
04851 Increase/Decrease in Cash & Short Term Investments
Supplementary Data
Asset fields 18214 Exchange Rate Used in Translating
Balance Sheet
02654 Total Intangible Other Assets - Gross
02655 Total Intangible Other Assets – Accumulated Amortization
02300 Total Assets - As Reported
Liability Fields 03255 Total Debt
Income Statement Fields 18215 Exchange Rate Used in Translating
Income Statement/Cash Flow
01201 Research & Development Expense #
18224 Amortization and Impairment of Goodwill
18225 Impairment of Goodwill
18226 Impairment of Other Intangibles
18274 Impairment of Property, Plant & Equipment
18275 Impairment of Financial Fixed Assets
18191 Earnings before Interest and Taxes (EBIT)
18198 Earnings before Interest, Taxes & Depreciation (EBITDA)
01651 Net Income - Bottom Line
01751 Net Income Used to Calculate Earnings per Share
01705 Net Income Used to Calculate Fully Diluted Earnings per Share

Limited Data Set Companies Template
Issue 6
© Thomson Financial 2003-2007 165 Confidential Information of Thomson Financial
Other Fields 04500 External Financing
03151 Working Capital
03998 Total Capital
04900 Increase/Decrease in Working Capital
Interim Data
Qtr 1 Qtr 2 Qtr 3 Qtr 4
Interim Sales 19101 19102 19103 19104
Interim Pre-tax Income
19105 19106 19107 19108
Interim Net Profit
19109 19110 19111 19112
Number of Months-EPS
05217 05218 05219 05220
Earnings per Share
05221 05222 05223 05224
Earnings per Share – Basic
05211 05212 05213 05214
Fully Diluted EPS
05291 05292 05293 05294
EPS - Report Date
05901 05902 05903 05904
EPS - 12 Months
05251 05252 05253 05254
Dividends per Share
05121 05122 05123 05124
DPS – Gross 05125 05126 05127 05128
DPS - Declared Date
05910 05911 05912 05913
DPS - Record Date
05917 05918 05919 05920
DPS - Ex-Div Date
05923 05924 05925 05926
DPS - Payable Date05929
05930 05931 05932
DPS – Extra 05151 05152 05153 05154
DPS - Extra – Gross
05171 05172 05173 05174
DPS - Extra - Dec Date
05935 05936 05937 05938
DPS - Extra - Rec Date
05941 05942 05943 05944
DPS – Extra - Ex-Div Date
05947 05948 05949 05950
DPS - Extra - Pay Date
05953 05954 05955 05956
DPS – Special
05155 05156 05157 05158
DPS - Special – Gross
05175 05176 05177 05178
DPS - Special - Dec Date
05965 05966 05968 05969
DPS - Special - Rec Date
05970 05971 05972 05973
DPS - Special - Ex-Div Date
05959 05960 05961 05962
DPS - Special - Pay Date
05976 05977 05978 05979
DPS - 12 Months
05131 05132 05133 05134
Monthly Price Information
Month End Market Price
High Price
Low Price
January 05015 05016 05017
February 05020 05021 05022
March 05025 05026 05027
April 05030 05031 05032
May 05035 05036 05037
June 05040 05041 05042
July 05045 05046 05047
August 05050 05051 05052

Limited Data Set Companies Template
Issue 6
© Thomson Financial 2003-2007 166 Confidential Information of Thomson Financial
Month End Market Price
High Price
Low Price
September 05055 05056 05057
October 05060 05061 05062
November 05065 05066 05067
December 05070 05071 05072
Stock Performance
Current Information 09102 Price/Earnings Ratio - Current
09103 Price/Earnings Ratio - Current High
09105 Price/Earnings Ratio - Current Low
09202 Earnings Yield - Current
09203 Earnings Yield - Current High
09205 Earnings Yield - Current Low
09602 Price/Cash Flow - Current
09302 Price/Book Value Ratio - Current
09402 Dividend Yield - Current
08372 Return on Equity - per Share - Current
08652 Reinvestment Rate - per Share - Current
09502 Dividend Payout per Share - Current
09001 Price Trend - Last Week
09005 Price Trend - Four Week
09011 Price Trend - Quarter to Date
09016 Price Trend - Previous Quarter
09021 Price Trend - Year to Date
09006 Price Trend - 13 Weeks
09007 Price Trend – 26 Weeks
09026 Price Trend - 52 Weeks
09802 Beta
09803 Alpha
Annual Statistics 09104 Price/Earnings Ratio - Close
09100 Price/Earnings Ratio - High
09101 Price/Earnings Ratio - Low
09106 Price/Earnings Ratio - Avg High-Low
09204 Earnings Yield – Close
09200 Earnings Yield - High
09201 Earnings Yield - Low
09206 Earnings Yield - Avg High-Low
09604 Price/Cash Flow Ratio
09404 Dividend Yield - Close
09400 Dividend Yield - High
09401 Dividend Yield - Low
09406 Dividend Yield - Avg High-Low
09504 Dividend Payout per Share
09304 Price/Book Value Ratio - Close
09300 Price/Book Value Ratio - High
09301 Price/Book Value Ratio - Low
09306 Price/Book Value Ratio - Avg High-Low
09904 Price/Sales per Share Ratio
08801 Total Investment Return
08806 Price Volatility
09704 Market Capitalization/Common Equity
Growth Rates
Annual Statistics 08631 Net Sales/Revenues Growth
08646 Operating Income Growth
08636 Net Income Growth
08621 Total Assets Growth
08616 Equity Growth
08626 Employees Growth
08601 Earnings per Share Growth
08611 Dividends per Share Growth
08606 Book Value per Share Growth
08676 Net Margin Growth
08579 Market Capitalization Growth

Limited Data Set Companies Template
Issue 6
© Thomson Financial 2003-2007 167 Confidential Information of Thomson Financial
Profitability
Annual Statistics 08301 Return on Equity – Total (%)
08371 Return on Equity - per Share
08656 Reinvestment Rate - Total
08651 Reinvestment Rate - per Share
08326 Return on Assets
08376 Return on Invested Capital
08911 Retained Earnings % Equity
08381 Cash Earnings Return on Equity
08901 Accounts Payable % Sales #
08311 Cash Flow/Sales
008331 Cost of Goods Sold / Sales #
08306 Gross Profit Margin #
08336 Selling, General & Administrative Expenses / Sales #
08341 Research & Development Expense / Sales #
08316 Operating Profit Margin
08361 Operating Income/Total Capital
08321 Pre-tax Margin
08346 Tax Rate % #
08356 Interest Rate - Estimated Average
08366 Net Margin
08351 Sales per Employee
Asset utilization
Annual Statistics 08406 Assets per Employee
08401 Total Asset Turnover
08136 Inventory Turnover
08141 Net Sales % Working Capital
08416 Capital Expenditure % Total Assets
08421 Capital Expenditure % Sales
Leverage
Annual Statistics 08231 Total Debt % Common Equity
08226 Long Term Debt % Common Equity
08211 Minority Interest % Total Capital
08221 Total Debt % Total Capital
08216 Long Term Debt % Total Capital
08201 Equity % Total Capital
08206 Preferred Stock % Total Capital
08236 Total Debt % Total Assets
08241 Common Equity % Total Assets
08287 Total Assets / Common Equity Ratio
15121 Total Capital % Assets
08251 Fixed Charge Coverage Ratio
08256 Dividend Payout (% Earnings) - Total Dollar
08906 Cash Dividends % Cash Flow
08246 Cash Dividend Coverage Ratio
08261 Operating Cash/Fixed Charges
08266 Fixed Assets % Common Equity
08291 EBIT / Total Interest Expense Ratio
08271 Working Capital % Total Capital
Liquidity
Annual Statistics 08101 Quick Ratio
08106 Current Ratio
08111 Cash & Equivalents % Total Current Assets
08121 Receivables % Total Current Assets
08116 Inventories % Total Current Assets
08131 Accounts Receivables Days
08126 Inventories - Days Held
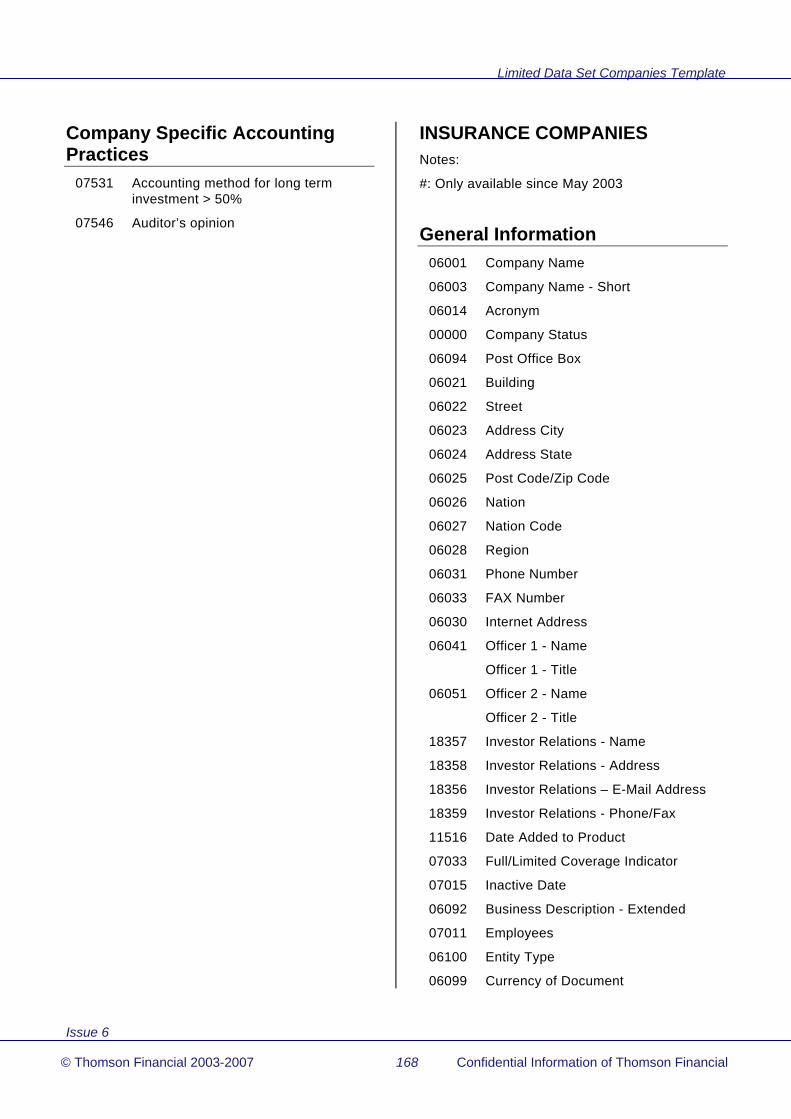
Limited Data Set Companies Template
Issue 6
© Thomson Financial 2003-2007 168 Confidential Information of Thomson Financial
Company Specific Accounting Practices
07531 Accounting method for long term investment > 50%
07546 Auditor’s opinion
INSURANCE COMPANIES Notes:
#: Only available since May 2003
General Information 06001 Company Name
06003 Company Name - Short
06014 Acronym
00000 Company Status
06094 Post Office Box
06021 Building
06022 Street
06023 Address City
06024 Address State
06025 Post Code/Zip Code
06026 Nation
06027 Nation Code
06028 Region
06031 Phone Number
06033 FAX Number
06030 Internet Address
06041 Officer 1 - Name
Officer 1 - Title
06051 Officer 2 - Name
Officer 2 - Title
18357 Investor Relations - Name
18358 Investor Relations - Address
18356 Investor Relations – E-Mail Address
18359 Investor Relations - Phone/Fax
11516 Date Added to Product
07033 Full/Limited Coverage Indicator
07015 Inactive Date
06092 Business Description - Extended
07011 Employees
06100 Entity Type
06099 Currency of Document
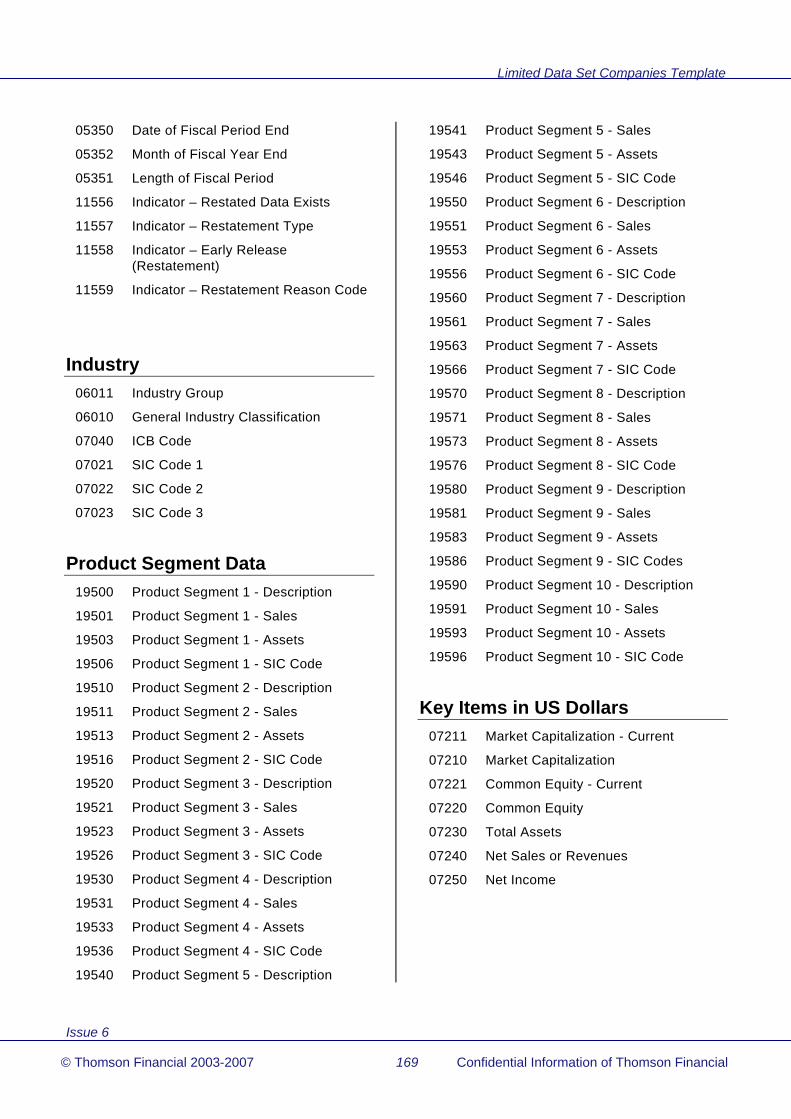
Limited Data Set Companies Template
Issue 6
© Thomson Financial 2003-2007 169 Confidential Information of Thomson Financial
05350 Date of Fiscal Period End
05352 Month of Fiscal Year End
05351 Length of Fiscal Period
11556 Indicator – Restated Data Exists
11557 Indicator – Restatement Type
11558 Indicator – Early Release (Restatement)
11559 Indicator – Restatement Reason Code
Industry 06011 Industry Group
06010 General Industry Classification
07040 ICB Code
07021 SIC Code 1
07022 SIC Code 2
07023 SIC Code 3
Product Segment Data 19500 Product Segment 1 - Description
19501 Product Segment 1 - Sales
19503 Product Segment 1 - Assets
19506 Product Segment 1 - SIC Code
19510 Product Segment 2 - Description
19511 Product Segment 2 - Sales
19513 Product Segment 2 - Assets
19516 Product Segment 2 - SIC Code
19520 Product Segment 3 - Description
19521 Product Segment 3 - Sales
19523 Product Segment 3 - Assets
19526 Product Segment 3 - SIC Code
19530 Product Segment 4 - Description
19531 Product Segment 4 - Sales
19533 Product Segment 4 - Assets
19536 Product Segment 4 - SIC Code
19540 Product Segment 5 - Description
19541 Product Segment 5 - Sales
19543 Product Segment 5 - Assets
19546 Product Segment 5 - SIC Code
19550 Product Segment 6 - Description
19551 Product Segment 6 - Sales
19553 Product Segment 6 - Assets
19556 Product Segment 6 - SIC Code
19560 Product Segment 7 - Description
19561 Product Segment 7 - Sales
19563 Product Segment 7 - Assets
19566 Product Segment 7 - SIC Code
19570 Product Segment 8 - Description
19571 Product Segment 8 - Sales
19573 Product Segment 8 - Assets
19576 Product Segment 8 - SIC Code
19580 Product Segment 9 - Description
19581 Product Segment 9 - Sales
19583 Product Segment 9 - Assets
19586 Product Segment 9 - SIC Codes
19590 Product Segment 10 - Description
19591 Product Segment 10 - Sales
19593 Product Segment 10 - Assets
19596 Product Segment 10 - SIC Code
Key Items in US Dollars 07211 Market Capitalization - Current
07210 Market Capitalization
07221 Common Equity - Current
07220 Common Equity
07230 Total Assets
07240 Net Sales or Revenues
07250 Net Income

Limited Data Set Companies Template
Issue 6
© Thomson Financial 2003-2007 170 Confidential Information of Thomson Financial
Stock Data
Current Information 06005 Type of Share
05601 Ticker Symbol
06004 CUSIP
06006 SEDOL
06008 ISIN
06035 Worldscope Identifier
06105 Worldscope Permanent I.D.
06034 Disclosure Company Identifier
06038 I/B/E/S Ticker
06040 Dow Jones Company Symbol
11501 Indicator - Currently a Multiple Share Company
11519 Indicator – Limited Data Set Company
07035 Latest Interim Date
05427 Stock Exchange(s) Listed
05661 Stock Index Information
11496 Indicator – ADR
05006 Market Price - Current
05009 Date of Current Price
05007 Market Price - Year to Date - High
05008 Market Price - Year to Date - Low
05091 Market Price – 52 Week High
05092 Market Price – 52 Week Low
08003 Market Capitalization (Public) - Current
08005 Market Capitalization - Current
05302 Common Shares Outstanding - Current
05306 Date of Common Shares
05255 Earnings per Share - Last 12 Months
05256 Date of Last 12 Months EPS
05145 Dividends per Share - Last 12 Months
05190 Indicated Dividend Rate
05480 Book Value per Share - Current
05510 Cash Flow per Share - Current
Annual Statistics 05001 Market Price - Year End
05002 Market Price - High
05003 Market Price - Low
08001 Market Capitalization
05201 Earnings per Share
05210 Earnings per Share – Basic – Year
05290 Fully Diluted Earnings per Share
05202 Earnings per Share - Fiscal Year End
05200 Earnings Report Frequency
18209 Earnings per Share Including Extraordinary Items – Fiscal #
05230 Earnings per Share after Extraordinary Items
05225 Includes Extraordinary Credit/Charge per Share
05226 Extraordinary Credit/Charge per Share
05227 Includes Pre-tax Extraordinary Credit/Charge per Share
05240 DVFA Earnings (Germany)
05203 OVFA Earnings per Share (Austria)
05725 Headline Earnings per Share (U.K.)
05101 Dividends per Share
05110 Dividends per Share - Fiscal
05102 Dividends per Share - Gross
05100 Dividend Report Frequency
05476 Book Value per Share
05486 Tangible Book Value per Share
05491 Book Value – Outstanding Shares - Fiscal
05501 Cash Flow per Share
05502 Cash Flow per Share - Fiscal
05507 Free Cash Flow per Share
05503 Long Term Liabilities per Share
05508 Sales per Share
05509 Operating Profit per Share
05506 Working Capital per Share
05005 Capital Expenditure per Share

Limited Data Set Companies Template
Issue 6
© Thomson Financial 2003-2007 171 Confidential Information of Thomson Financial
05301 Common Shares Outstanding
05309 Par Value #
05191 Common Shares Used to Calculate EPS
05192 Common Shares Used to Calculate Basic EPS
05194 Common Shares Used to Calculate Fully Diluted EPS
05576 Stock Split/Dividend Ratio
05575 Stock Split/Dividend Ratio - Fiscal
Weekly Time Series 05652 Common Shares Traded – Weekly
05080 Market Price – Week Close
05081 Market Price – Week High
05082 Market Price – Week Low
Balance Sheet
Assets 02003 Cash #
02255 Investments – Total
02501 Property, Plant and Equipment – Net
02652 Other Assets
02649 Total Intangible Other Assets - Net
02999 Total Assets
Liabilities & Shareholders' Equity 03030 Insurance Reserves – Total
03005 Benefit & Loss Reserves
03010 Unearned Premiums
03020 Policy & Contract Claims
03023 Other Insurance Reserves
03255 Total Debt
03051 Short Term Debt & Current Portion of Long Term Debt
03251 Long Term Debt
03245 Long Term Debt Excluding Capitalized Leases
03249 Capitalized Lease Obligations
03263 Deferred Taxes
03257 Deferred Tax Liability in Untaxed Reserves
03273 Other Liabilities
03351 Total Liabilities
03401 Non-Equity Reserves
03426 Minority Interest
03451 Preferred Stock
03501 Common Equity
03493 Other Appropriated Reserves
03494 Unappropriated (Free) Reserves
03495 Retained Earnings
03440 Policyholders' Equity
03999 Total Liabilities & Shareholders' Equity
Income Statement 01001 Net Sales or Revenues
01002 Premiums Earned
01020 Other Operating Income
01080 Long Term Insurance Reserves
01101 Selling, General & Administrative Expenses #
01250 Operating Income
01251 Interest Expense on Debt
01401 Pre-tax Income
01451 Income Taxes #
01501 Minority Interests #
01551 Net Income before Extraordinary Items/Preferred Dividends
01701 Preferred Dividend Requirements
01706 Net Income after Preferred Dividends (Basic EPS)
Funds Flow Statement - per FASB 95
04201 Funds from Operations
04860 Net Cash Flow - Operating Activities

Limited Data Set Companies Template
Issue 6
© Thomson Financial 2003-2007 172 Confidential Information of Thomson Financial
04601 Capital Expenditures (Additions to Fixed Assets)
04870 Net Cash Flow - Investing
04551 Cash Dividends Paid – Total
05376 Common Dividends (Cash)
05401 Preferred Dividends (Cash)
04890 Net Cash Flow - Financing
04840 Effect of Exchange Rate on Cash
04851 Increase/Decrease in Cash & Short Term Investments
Supplementary Data
Asset Fields 18214 Exchange Rate Used in Translating
Balance Sheet
02654 Total Intangible Other Assets - Gross
02655 Total Intangible Other Assets – Accumulated Amortization
02300 Total Assets - As Reported
Liability Fields 03498 Unrealized Gain/Loss on Marketable
Securities #
Income Statement Fields 18215 Exchange Rate Used in Translating
Income Statement/Cash Flow
18224 Amortization and Impairment of Goodwill
18225 Impairment of Goodwill
18226 Impairment of Other Intangibles
18274 Impairment of Property, Plant & Equipment
18275 Impairment of Financial Fixed Assets
18191 Earnings before Interest and Taxes (EBIT)
01651 Net Income – Bottom Line
01751 Net Income Used to Calculate Earnings per Share
01705 Net Income Used To Calculate Fully Diluted Earnings per Share
Other Fields 04500 External Financing
03998 Total Capital
Interim Data
Qtr 1 Qtr 2 Qtr 3 Qtr 4
Interim Sales 19101 19102 19103 19104
Interim Pre-tax Income
19105 19106 19107 19108
Interim Net Profit
19109 19110 19111 19112
Number of Months-EPS
05217 05218 05219 05220
Earnings per Share
05221 05222 05223 05224
Earnings per Share – Basic
05211 05212 05213 05214
Fully Diluted EPS
05291 05292 05293 05294
EPS - Report Date
05901 05902 05903 05904
EPS - 12 Months
05251 05252 05253 05254
Dividends per Share
05121 05122 05123 05124
DPS – Gross 05125 05126 05127 05128
DPS - Declared Date
05910 05911 05912 05913
DPS - Record Date
05917 05918 05919 05920
DPS - Ex-Div Date
05923 05924 05925 05926
DPS - Payable Date
05929 05930 05931 05932
DPS – Extra 05151 05152 05153 05154
DPS - Extra – Gross
05171 05172 05173 05174
DPS - Extra - Dec Date
05935 05936 05937 05938

Limited Data Set Companies Template
Issue 6
© Thomson Financial 2003-2007 173 Confidential Information of Thomson Financial
Qtr 1 Qtr 2 Qtr 3 Qtr 4
DPS - Extra - Rec Date
05941 05942 05943 05944
DPS - Extra - Ex-Div Date
05947 05948 05949 05950
DPS - Extra - Pay Date
05953 05954 05955 05956
DPS - Special
05155 05156 05157 05158
DPS - Special – Gross
05175 05176 05177 05178
DPS - Special - Dec Date
05965 05966 05968 05969
DPS - Special - Rec Date
05970 05971 05972 05973
DPS - Special - Ex-Div Date
05959 05960 05961 05962
DPS - Special - Payable Date
05976 05977 05978 05979
DPS - 12 Months
05131 05132 05133 05134
Monthly Price Information
Month End Market Price
High Price
Low Price
January 05015 05016 05017
February 05020 05021 05022
March 05025 05026 05027
April 05030 05031 05032
May 05035 05036 05037
June 05040 05041 05042
July 05045 05046 05047
August 05050 05051 05052
September 05055 05056 05057
October 05060 05061 05062
November 05065 05066 05067
December 05070 05071 05072
Stock Performance
Current Information 09102 Price/Earnings Ratio - Current
09103 Price/Earnings Ratio - Current High
09105 Price/Earnings Ratio - Current Low
09202 Earnings Yield - Current
09203 Earnings Yield - Current High
09205 Earnings Yield - Current Low
09602 Price/Cash Flow - Current
09302 Price/Book Value Ratio - Current
09402 Dividend Yield - Current
08372 Return on Equity - per Share - Current
08652 Reinvestment Rate - per Share - Current
09502 Dividend Payout per Share - Current
09001 Price Trend - Last Week
09005 Price Trend - Four Week
09011 Price Trend - Quarter to Date
09016 Price Trend - Previous Quarter
09021 Price Trend - Year to Date
09006 Price Trend - 13 Weeks
09007 Price Trend – 26 Weeks
09026 Price Trend - 52 Weeks
09802 Beta
09803 Alpha
Annual Statistics 09104 Price/Earnings Ratio - Close
09100 Price/Earnings Ratio - High
09101 Price/Earnings Ratio - Low
09106 Price/Earnings Ratio - Avg High-Low
09204 Earnings Yield - Close
09200 Earnings Yield - High

Limited Data Set Companies Template
Issue 6
© Thomson Financial 2003-2007 174 Confidential Information of Thomson Financial
09201 Earnings Yield - Low
09206 Earnings Yield - Avg High-Low
09604 Price/Cash Flow Ratio
09404 Dividend Yield - Close
09400 Dividend Yield - High
09401 Dividend Yield - Low
09406 Dividend Yield - Avg High-Low
09504 Dividend Payout per Share
09304 Price/Book Value Ratio - Close
09300 Price/Book Value Ratio - High
09301 Price/Book Value Ratio - Low
09306 Price/Book Value Ratio - Avg High-Low
09904 Price/Sales per Share Ratio
08801 Total Investment Return
08806 Price Volatility
09704 Market Capitalization/Common Equity
Growth Rates
Annual Statistics 08661 Insurance Reserves
08631 Net Sales/Revenues Growth
08646 Operating Income Growth
08636 Net Income Growth
08621 Total Assets Growth
08616 Equity Growth
08626 Employees Growth
08601 Earnings per Share Growth
08611 Dividends per Share Growth
08606 Book Value per Share Growth
08676 Net Margin Growth
08579 Market Capitalization Growth
Profitability
Annual Statistics 08301 Return on Equity – Total (%)
08371 Return on Equity - per Share
08656 Reinvestment Rate - Total
08651 Reinvestment Rate - per Share
08326 Return on Assets
08376 Return on Invested Capital
08911 Retained Earnings % Equity
08381 Cash Earnings Return on Equity
08311 Cash Flow/Sales
08316 Operating Profit Margin
08361 Operating Income Return on Total Capital
08321 Pre-tax Margin
08346 Tax Rate % #
08356 Interest Rate - Estimated Average
08366 Net Margin
15519 Operating Income % Premiums Earned
15549 Loss Ratio
08351 Sales per Employee
Asset Utilization
Annual Statistics 08406 Assets per Employee
08401 Total Asset Turnover
15091 Invested Assets % Assets
Leverage
Annual Statistics 08231 Total Debt % Common Equity
08226 Long Term Debt % Common Equity
08221 Total Debt % Total Capital
08216 Long Term Debt % Total Capital
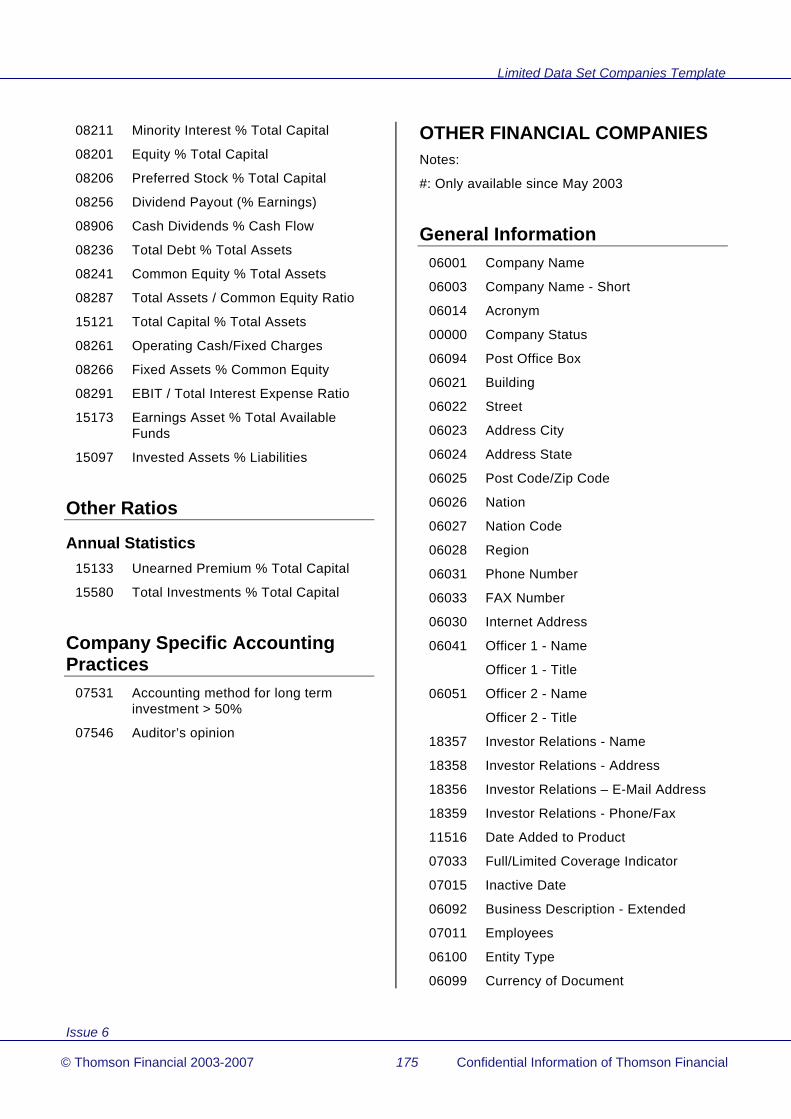
Limited Data Set Companies Template
Issue 6
© Thomson Financial 2003-2007 175 Confidential Information of Thomson Financial
08211 Minority Interest % Total Capital
08201 Equity % Total Capital
08206 Preferred Stock % Total Capital
08256 Dividend Payout (% Earnings)
08906 Cash Dividends % Cash Flow
08236 Total Debt % Total Assets
08241 Common Equity % Total Assets
08287 Total Assets / Common Equity Ratio
15121 Total Capital % Total Assets
08261 Operating Cash/Fixed Charges
08266 Fixed Assets % Common Equity
08291 EBIT / Total Interest Expense Ratio
15173 Earnings Asset % Total Available Funds
15097 Invested Assets % Liabilities
Other Ratios
Annual Statistics 15133 Unearned Premium % Total Capital
15580 Total Investments % Total Capital
Company Specific Accounting Practices
07531 Accounting method for long term investment > 50%
07546 Auditor’s opinion
OTHER FINANCIAL COMPANIES Notes:
#: Only available since May 2003
General Information 06001 Company Name
06003 Company Name - Short
06014 Acronym
00000 Company Status
06094 Post Office Box
06021 Building
06022 Street
06023 Address City
06024 Address State
06025 Post Code/Zip Code
06026 Nation
06027 Nation Code
06028 Region
06031 Phone Number
06033 FAX Number
06030 Internet Address
06041 Officer 1 - Name
Officer 1 - Title
06051 Officer 2 - Name
Officer 2 - Title
18357 Investor Relations - Name
18358 Investor Relations - Address
18356 Investor Relations – E-Mail Address
18359 Investor Relations - Phone/Fax
11516 Date Added to Product
07033 Full/Limited Coverage Indicator
07015 Inactive Date
06092 Business Description - Extended
07011 Employees
06100 Entity Type
06099 Currency of Document

Limited Data Set Companies Template
Issue 6
© Thomson Financial 2003-2007 176 Confidential Information of Thomson Financial
05350 Date of Fiscal Period End
05352 Month of Fiscal Year End
05351 Length of Fiscal Period
11556 Indicator – Restated Data Exists
11557 Indicator – Restatement Type
11558 Indicator – Early Release (Restatement)
11559 Indicator – Restatement Reason Code
Industry 06011 Industry Group
06010 General Industry Classification
07040 ICB Code
07021 SIC Code 1
07022 SIC Code 2
07023 SIC Code 3
Product Segment Data 19500 Product Segment 1 - Description
19501 Product Segment 1 - Sales
19503 Product Segment 1 - Assets
19506 Product Segment 1 - SIC Code
19510 Product Segment 2 - Description
19511 Product Segment 2 - Sales
19513 Product Segment 2 - Assets
19516 Product Segment 2 - SIC Code
19520 Product Segment 3 - Description
19521 Product Segment 3 - Sales
19523 Product Segment 3 - Assets
19526 Product Segment 3 - SIC Code
19530 Product Segment 4 - Description
19531 Product Segment 4 - Sales
19533 Product Segment 4 - Assets
19536 Product Segment 4 - SIC Code
19540 Product Segment 5 - Description
19541 Product Segment 5 - Sales
19543 Product Segment 5 - Assets
19546 Product Segment 5 - SIC Code
19550 Product Segment 6 - Description
19551 Product Segment 6 - Sales
19553 Product Segment 6 - Assets
19556 Product Segment 6 - SIC Code
19560 Product Segment 7 - Description
19561 Product Segment 7 - Sales
19563 Product Segment 7 - Assets
19566 Product Segment 7 - SIC Code
19570 Product Segment 8 - Description
19571 Product Segment 8 - Sales
19573 Product Segment 8 - Assets
19576 Product Segment 8 - SIC Code
19580 Product Segment 9 - Description
19581 Product Segment 9 - Sales
19583 Product Segment 9 - Assets
19586 Product Segment 9 - SIC Code
19590 Product Segment 10 - Description
19591 Product Segment 10 - Sales
19593 Product Segment 10 - Assets
19596 Product Segment 10 - SIC Code
Key Items in US Dollars 07211 Market Capitalization - Current
07210 Market Capitalization
07221 Common Equity - Current
07220 Common Equity
07230 Total Assets
07240 Net Sales or Revenues
07250 Net Income
Stock Data
Current Information 06005 Type of Share

Limited Data Set Companies Template
Issue 6
© Thomson Financial 2003-2007 177 Confidential Information of Thomson Financial
05601 Ticker Symbol
06004 CUSIP
06006 SEDOL
06008 ISIN
06035 Worldscope Identifier
06105 Worldscope Permanent I.D.
06034 Disclosure Company Identifier
06038 I/B/E/S Ticker
06040 Dow Jones Company Symbol
11501 Indicator - Currently a Multiple Share Company
11519 Indicator – Limited Data Set Company
07035 Latest Interim Date
05427 Stock Exchange(s) Listed
05661 Stock Index Information
11496 Indicator - ADR
05006 Market Price - Current
05009 Date of Current Price
05007 Market Price - Year to Date - High
05008 Market Price - Year to Date - Low
05091 Market Price – 52 Week High
05092 Market Price – 52 Week Low
08003 Market Capitalization (Public) - Current
08005 Market Capitalization - Current
05302 Common Shares Outstanding - Current
05306 Date of Common Shares
05255 Earnings per Share - Last 12 Months
05256 Date of Last 12 Months EPS
05145 Dividends per Share - Last 12 Months
05190 Indicated Dividend Rate
05480 Book Value per Share - Current
05510 Cash Flow per Share - Current
Annual Statistics 05001 Market Price - Year End
05002 Market Price - High
05003 Market Price - Low
08001 Market Capitalization
05201 Earnings per Share
05210 Earnings per Share – Basic – Year
05290 Fully Diluted Earnings per Share
05202 Earnings per Share - Fiscal Year End
05200 Earnings Report Frequency
18209 Earnings per Share Including Extraordinary Items – Fiscal #
05230 Earnings per Share after Extraordinary Items
05225 Includes Extraordinary Credit/Charge per Share
05226 Extraordinary Credit/Charge per Share
05227 Includes Pre-tax Extraordinary Credit/Charge per Share
05240 DVFA Earnings (Germany)
05203 OVFA Earnings per Share (Austria)
05725 Headline Earnings per Share (U.K.)
05101 Dividends per Share
05110 Dividends per Share - Fiscal
05102 Dividends per Share - Gross
05100 Dividend Report Frequency
05476 Book Value per Share
05486 Tangible Book Value per Share
05491 Book Value – Outstanding Shares - Fiscal
05501 Cash Flow per Share
05502 Cash Flow per Share - Fiscal
05507 Free Cash Flow per Share
05508 Sales per Share
05509 Operating Profit per Share
05505 Capital Expenditure per Share
05301 Common Shares Outstanding
05309 Par Value
05191 Common Shares Used to Calculate EPS
05192 Common Shares Used to Calculate Basic EPS

Limited Data Set Companies Template
Issue 6
© Thomson Financial 2003-2007 178 Confidential Information of Thomson Financial
05194 Common Shares Used to Calculate Fully Diluted EPS
05576 Stock Split/Dividend Ratio
05575 Stock Split/Dividend Ratio - Fiscal
Weekly Time Series 05652 Common Shares Traded – Weekly
05080 Market Price – Week Close
05081 Market Price – Week High
05082 Market Price – Week Low
Balance Sheet
Assets 02001 Cash & Short Term Investments
02051 Receivables (Net)
02255 Investments - Total
02501 Property, Plant & Equipment - Net
02301 Property Plant and Equipment – Gross #
02401 Accumulated Depreciation #
02652 Other Assets
02649 Total Intangible Other Assets - Net
02101 Inventories - Total
02999 Total Assets
Liabilities & Shareholders' Equity 03255 Total Debt
03051 Short Term Debt & Current Portion of Long Term Debt
03251 Long Term Debt
03245 Long Term Debt Excluding Capitalized Leases
03249 Capitalized Lease Obligations
03263 Deferred Taxes
03257 Deferred Tax Liability in Untaxed Reserves
03273 Other Liabilities
03351 Total Liabilities
03401 Non-Equity Reserves
03426 Minority Interest
03451 Preferred Stock
03501 Common Equity
03493 Other Appropriated Reserves
03494 Unappropriated (Free) Reserves
03495 Retained Earnings
03999 Total Liabilities & Shareholders' Equity
Income Statement 01001 Net Sales or Revenues
01051 Cost of Goods Sold #
01075 Interest Expense – Total
01151 Depreciation, Depletion & Amortization
01101 Selling, General & Administrative Expenses #
01249 Operating Expenses - Total
01250 Operating Income
01401 Pre-tax Income
01451 Income Taxes #
01501 Minority Interest #
01551 Net Income before Extraordinary Items/Preferred Dividends
01701 Preferred Dividend Requirements
01706 Net Income after Preferred Dividends (Basic EPS)
Funds Flow Statement - per FASB 95
04049 Depreciation & Depletion #
04201 Funds from Operations
04860 Net Cash Flow - Operating Activities
04601 Capital Expenditures (Additions to Fixed Assets)
04870 Net Cash Flow - Investing
04551 Cash Dividends Paid - Total
05376 Common Dividends (Cash)
05401 Preferred Dividends (Cash)

Limited Data Set Companies Template
Issue 6
© Thomson Financial 2003-2007 179 Confidential Information of Thomson Financial
04890 Net Cash Flow - Financing
04840 Effect of Exchange Rate on Cash
04851 Increase/Decrease in Cash & Short Term Investments
Supplementary Data
Asset Fields 18214 Exchange Rate Used in Translating
Balance Sheet
02654 Total Intangible Other Assets - Gross
02655 Total Intangible Other Assets – Accumulated Amortization
02300 Total Assets - As Reported
Income Statement Fields 18215 Exchange Rate Used in Translating
Income Statement/Cash Flow
01251 Interest Expense on Debt
18224 Amortization and Impairment of Goodwill
18225 Impairment of Goodwill
18226 Impairment of Other Intangibles
18274 Impairment of Property, Plant & Equipment
18275 Impairment of Financial Fixed Assets
18191 Earnings before Interest and Taxes (EBIT)
18198 Earnings before Interest, Taxes & Depreciation (EBITDA)
01651 Net Income - Bottom Line
01751 Net Income Used to Calculate Earnings per Share
01705 Net Income Used to Calculate Fully Diluted Earnings per Share
Other Fields 04500 External Financing
03998 Total Capital
Interim Data
Qtr 1 Qtr 2 Qtr 3 Qtr 4
Interim Sales 19101 19102 19103 19104
Interim Pre-tax Income
19105 19106 19107 19108
Interim Net Profit
19109 19110 19111 19112
Number of Months-EPS
05217 05218 05219 05220
Earnings per Share
05221 05222 05223 05224
Earnings per Share – Basic
05211 05212 05213 05214
Fully Diluted EPS
05291 05292 05293 05294
EPS - Report Date
05901 05902 05903 05904
EPS - 12 Months
05251 05252 05253 05254
Dividends per Share
05121 05122 05123 05124
DPS - Gross05125
05126 05127 05128
DPS - Declared Date
05910 05911 05912 05913
DPS - Record Date
05917 05918 05919 05920
DPS - Ex-Div Date
05923 05924 05925 05926
DPS - Payable Date
05929 05930 05931 05932
DPS – Extra 05151 05152 05153 05154
DPS - Extra – Gross
05171 05172 05173 05174
DPS - Extra - Dec Date
05935 05936 05937 05938
DPS - Extra - Rec Date
05941 05942 05943 05944
DPS - Extra - Ex-Div Date
05947 05948 05949 05950
DPS - Extra - Pay Date
05953 05954 05955 05956

Limited Data Set Companies Template
Issue 6
© Thomson Financial 2003-2007 180 Confidential Information of Thomson Financial
Qtr 1 Qtr 2 Qtr 3 Qtr 4
DPS - Special 05155 05156 05157 05158
DPS - Special – Gross
05175 05176 05177 05178
DPS - Special - Dec Date
05965 05966 05968 05969
DPS - Special - Rec Date
05970 05971 05972 05973
DPS - Special - Ex-Div Date
05959 05960 05961 05962
DPS - Special - Payable Date
05976 05977 05978 05979
DPS - 12 Months
05131 05132 05133 05134
Monthly Price Information
Month End Market Price
High Price
Low Price
January 05015 05016 05017
February 05020 05021 05022
March 05025 05026 05027
April 05030 05031 05032
May 05035 05036 05037
June 05040 05041 05042
July 05045 05046 05047
August 05050 05051 05052
September 05055 05056 05057
October 05060 05061 05062
November 05065 05066 05067
December 05070 05071 05072
Stock Performance
Current Information 09102 Price/Earnings Ratio - Current
09103 Price/Earnings Ratio - Current High
09105 Price/Earnings Ratio - Current Low
09202 Earnings Yield - Current
09203 Earnings Yield - Current High
09205 Earnings Yield - Current Low
09302 Price/Book Value Ratio - Current
09602 Price/Cash Flow - Current
09402 Dividend Yield - Current
08372 Return on Equity - per Share - Current
08652 Reinvestment Rate - per Share - Current
09502 Dividend Payout - per Share - Current
09001 Price Trend - Last Week
09005 Price Trend - Four Week
09011 Price Trend - Quarter to Date
09016 Price Trend - Previous Quarter
09021 Price Trend - Year to Date
09006 Price Trend - 13 Weeks
09007 Price Trend – 26 Weeks
09026 Price Trend - 52 Weeks
09802 Beta
09803 Alpha
Annual Statistics 09104 Price/Earnings Ratio - Close
09100 Price/Earnings Ratio - High
09101 Price/Earnings Ratio - Low
09106 Price/Earnings Ratio - Avg High-Low
09204 Earnings Yield - Close
09200 Earnings Yield - High
09201 Earnings Yield - Low
09206 Earnings Yield - Avg High-Low
09604 Price/Cash Flow Ratio
09404 Dividend Yield - Close
09400 Dividend Yield - High
09401 Dividend Yield - Low
09406 Dividend Yield - Avg High-Low
09504 Dividend Payout per Share
09304 Price/Book Value Ratio - Close
09300 Price/Book Value Ratio - High

Limited Data Set Companies Template
Issue 6
© Thomson Financial 2003-2007 181 Confidential Information of Thomson Financial
09301 Price/Book Value Ratio - Low
09306 Price/Book Value Ratio - Avg High-Low
09904 Price/Sales per Share Ratio
08801 Total Investment Return
08806 Price Volatility
09704 Market Capitalization/Common Equity
Growth Rates
Annual Statistics 08631 Net Sales/Revenues Growth
08646 Operating Income Growth
08636 Net Income Growth
08621 Total Assets Growth
08616 Equity Growth
08626 Employees Growth
08601 Earnings per Share Growth
08611 Dividends per Share Growth
08606 Book Value per Share Growth
08676 Net Margin Growth
08579 Market Capitalization Growth
Profitability
Annual Statistics 08301 Return on Equity - Total (%)
08371 Return on Equity - per Share
08651 Reinvestment Rate - per Share
08656 Reinvestment Rate - Total
08326 Return on Assets
08376 Return on Invested Capital
08911 Retained Earnings % Equity
08381 Cash Earnings Return on Equity
08311 Cash Flow/Sales
08331 Cost of Goods Sold / Sales #
08336 Selling, General & Administrative Expense / Sales #
08316 Operating Profit Margin
08361 Operating Income Return on Total Capital
08321 Pre-tax Margin
08346 Tax Rate % #
08356 Interest Rate - Estimated Average
08366 Net Margin
15587 Earning Assets % Total Assets
08351 Sales per Employee
Asset Utilization
Annual Statistics 08406 Assets per Employee
08401 Total Asset Turnover
15091 Invested Assets % Total Assets
08416 Capital Expenditures % Total Assets
08421 Capital Expenditures % Sales
Leverage
Annual Statistics 08231 Total Debt % Common Equity
08226 Long Term Debt % Common Equity
08221 Total Debt % Total Capital
08216 Long Term Debt % Total Capital
08211 Minority Interest % Total Capital
08201 Equity % Total Capital
08206 Preferred Stock % Total Capital
08236 Total Debt % Total Assets
08241 Common Equity % Total Assets
08287 Total Assets / Common Equity Ratio
15121 Total Capital % Total Assets
15097 Invested Assets % Liabilities
08256 Dividend Payout (% Earnings)
08906 Cash Dividends % Cash Flow
08251 Fixed Charge Coverage Ratio
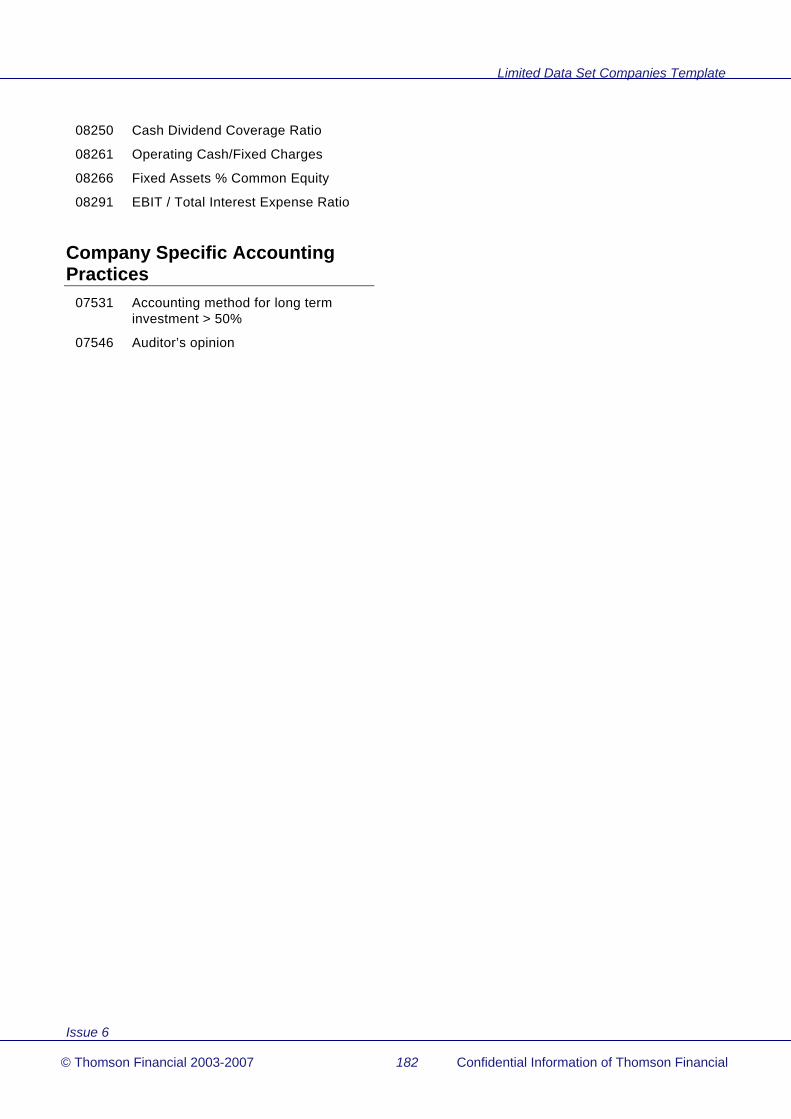
Limited Data Set Companies Template
Issue 6
© Thomson Financial 2003-2007 182 Confidential Information of Thomson Financial
08250 Cash Dividend Coverage Ratio
08261 Operating Cash/Fixed Charges
08266 Fixed Assets % Common Equity
08291 EBIT / Total Interest Expense Ratio
Company Specific Accounting Practices
07531 Accounting method for long term investment > 50%
07546 Auditor’s opinion

Issue 6
© Thomson Financial 2003-2007 183 Confidential Information of Thomson Financial
Interim Time Series Template
BANKS
General Information 06099 Currency of Document
07034 Indicator – Data Update
05350 Date of Fiscal Period End
05351 Length of Fiscal Period
11556 Indicator – Restated Data Exists
11557 Indicator – Restatement Type
11558 Indicator – Early Release (Restatement)
11559 Indicator – Restatement Reason Code
Stock Data 08001 Market Capitalization
07210 Market Capitalization (US$)
05202 Earnings per Share – Fiscal Period Generic
18209 EPS Fiscal Period Generic after Extra Items
18208 Earnings per Share – Continuing Operations
18205 Discontinued Operations – Total – per Share
18264 Trailing Twelve Months Earnings per Share
18420 Earnings per Share – Fiscal Period – Basic
18469 Earnings per Share – Fiscal Period – Basic – Revised
18440 Earnings per Share – Fiscal Period - Fully Diluted
18470 Earnings per Share – Fiscal Period – Fully Diluted – Revised
18426 Earnings per Share – Included Extra Cr/Chg After Tax – Basic
18453 Earnings per Share – Included Extra Cr/Chg After Tax – Basic - Revised
18446 Earnings per Share – Included Extra Cr/Chg After Tax – Fully Diluted
18454 Earnings per Share – Included Extra Cr/Chg After Tax – Fully Diluted - Revised
18428 Earnings per Share – Included Extra Pre-tax Cr/Chg – Basic
18457 Earnings per Share – Included Extra Pre-tax Cr/Chg – Basic – Revised
18448 Earnings per Share – Included Extra Pre-tax Cr/Chg – Fully Diluted
18458 Earnings per Share – Included Extra Pre-tax Cr/Chg – Fully Diluted - Revised
05116 Dividends per Share (Interim)
05112 Dividends Per Share – Extra (Interim)
05114 Dividends per share – Special (Interim)
18266 Trailing Twelve Months Dividends
05486 Tangible Book Value per Share
05491 Book Value – Outstanding Shares
05502 Cash Flow per Share – Fiscal Period
18265 Trailing Twelve Months Cash Flow per Share
18100 Enterprise Value
05301 Common Shares Outstanding
05191 Common Shares Used to Calculate EPS
05192 Common Shares Used to Calculate Basic EPS
05194 Common Shares Used to Calculate Fully Diluted EPS
Balance Sheet
Assets 02004 Cash & Due from Banks

Interim Time Series Template
Issue 6
© Thomson Financial 2003-2007 184 Confidential Information of Thomson Financial
02255 Investments – Total
02276 Loans - Net
02055 Interbank Loans
02501 Property, Plant & Equipment - Net
02652 Other Assets
02649 Total Intangible Other Assets - Net
02999 Total Assets
Liabilities & Shareholders' Equity 03019 Deposits - Total
03255 Total Debt
03051 Short Term Debt & Current Portion of Long Term Debt
03251 Long-Term Debt
03245 Long-Term Debt Excluding Capitalized Leases
03249 Capitalized Lease Obligations
03263 Deferred Taxes
03273 Other Liabilities
03351 Total Liabilities
03426 Minority Interest
03451 Preferred Stock
03501 Common Equity
03999 Total Liabilities & Shareholders' Equity
Income Statement 01016 Interest Income - Total
01075 Interest Expense – Total
01251 Interest Expense on Debt
01076 Net Interest Income
01021 Non-Interest Income - total
01245 Non-Interest Expense - total
04049 Depreciation and Depletion
01271 Provision for Loan Losses
01250 Operating Income
01262 Other Income/Expense - Net
01267 Pre-tax Equity in Earnings
01401 Pre-tax Income
01451 Income Taxes
01501 Minority Interest
01503 Equity in Earnings
01505 Discontinued Operations
01551 Net Income before Extraordinary Items/Pfd Dividends
01601 Extraordinary Items & Gain/Loss Sale of Assets
01651 Net Income before Preferred Dividends
01701 Preferred Dividend Requirements
01706 Net Income used to calculate Basic EPS
01705 Net Income used to calculate Diluted EPS
01751 Net Income available to common
Funds Flow Statement 04201 Funds from Operations
04831 Funds from/for Other Operating Activities
04860 Net Cash Flow - Operating Activities
04601 Capital Expenditures
04870 Net Cash Flow – Investing
04251 Net Proceeds from Sale/Issuance of Common & Preferred
04890 Net Cash Flow - Financing
04840 Effect of Exchange Rate on Cash
04851 Increase/Decrease in Cash & Short Term Investments
Supplementary Data
Balance Sheet 18214 Exchange Rate Used in Translating
Balance Sheet
02005 Cash & Equivalents – Generic
03055 Federal Funds (Liability)
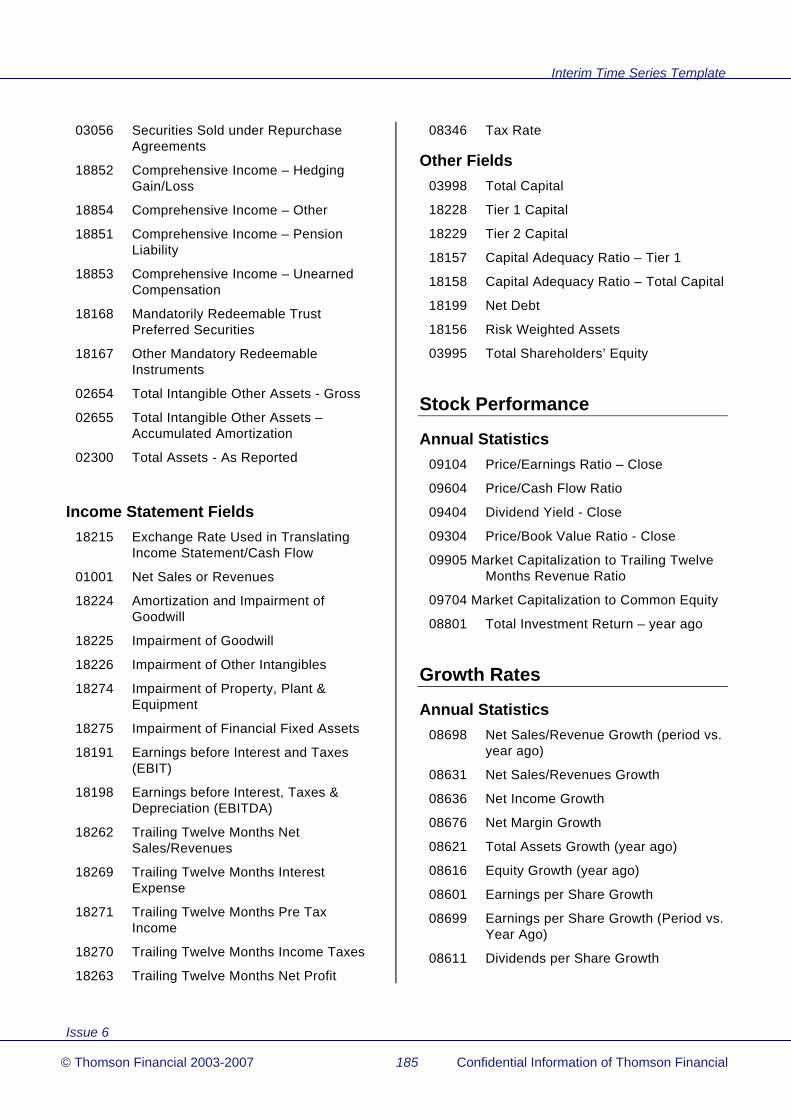
Interim Time Series Template
Issue 6
© Thomson Financial 2003-2007 185 Confidential Information of Thomson Financial
03056 Securities Sold under Repurchase Agreements
18852 Comprehensive Income – Hedging Gain/Loss
18854 Comprehensive Income – Other
18851 Comprehensive Income – Pension Liability
18853 Comprehensive Income – Unearned Compensation
18168 Mandatorily Redeemable Trust Preferred Securities
18167 Other Mandatory Redeemable Instruments
02654 Total Intangible Other Assets - Gross
02655 Total Intangible Other Assets – Accumulated Amortization
02300 Total Assets - As Reported
Income Statement Fields 18215 Exchange Rate Used in Translating
Income Statement/Cash Flow
01001 Net Sales or Revenues
18224 Amortization and Impairment of Goodwill
18225 Impairment of Goodwill
18226 Impairment of Other Intangibles
18274 Impairment of Property, Plant & Equipment
18275 Impairment of Financial Fixed Assets
18191 Earnings before Interest and Taxes (EBIT)
18198 Earnings before Interest, Taxes & Depreciation (EBITDA)
18262 Trailing Twelve Months Net Sales/Revenues
18269 Trailing Twelve Months Interest Expense
18271 Trailing Twelve Months Pre Tax Income
18270 Trailing Twelve Months Income Taxes
18263 Trailing Twelve Months Net Profit
08346 Tax Rate
Other Fields 03998 Total Capital
18228 Tier 1 Capital
18229 Tier 2 Capital
18157 Capital Adequacy Ratio – Tier 1
18158 Capital Adequacy Ratio – Total Capital
18199 Net Debt
18156 Risk Weighted Assets
03995 Total Shareholders’ Equity
Stock Performance
Annual Statistics 09104 Price/Earnings Ratio – Close
09604 Price/Cash Flow Ratio
09404 Dividend Yield - Close
09304 Price/Book Value Ratio - Close
09905 Market Capitalization to Trailing Twelve Months Revenue Ratio
09704 Market Capitalization to Common Equity
08801 Total Investment Return – year ago
Growth Rates
Annual Statistics 08698 Net Sales/Revenue Growth (period vs.
year ago)
08631 Net Sales/Revenues Growth
08636 Net Income Growth
08676 Net Margin Growth
08621 Total Assets Growth (year ago)
08616 Equity Growth (year ago)
08601 Earnings per Share Growth
08699 Earnings per Share Growth (Period vs. Year Ago)
08611 Dividends per Share Growth

Interim Time Series Template
Issue 6
© Thomson Financial 2003-2007 186 Confidential Information of Thomson Financial
08606 Book Value per Share Growth (year ago)
08579 Market Capitalization Growth (year ago)
Profitability
Annual Statistics 08301 Return on Equity – Total (%)
08371 Return on Equity - per Share
08651 Reinvestment Rate - per Share
08326 Return on Assets
08381 Cash Earnings Return on Equity
08311 Cash Flow/Sales
08316 Operating Profit Margin
18306 Trailing Twelve Months Operating Margin
18305 Trailing Twelve Months Operating Profit
08321 Pre-tax Margin
18304 Trailing Twelve Months Pre-tax Margin
08366 Net Margin
18268 Trailing Twelve Months Net Margin
Asset Utilization
Annual Statistics 08401 Total Asset Turnover
Leverage
Annual Statistics 08231 Total Debt % Common Equity
08226 Long Term Debt % Common Equity
08236 Total Debt % Total Assets
08241 Common Equity % Total Assets
08287 Total Assets / Common Equity Ratio
08261 Operating Cash/Fixed Charges
08266 Fixed Assets % Common Equity
INDUSTRIALS
General Information 06099 Currency of Document
07034 Indicator – Data Update
05350 Date of Fiscal Period End
05351 Length of Fiscal Period
11556 Indicator – Restated Data Exists
11557 Indicator – Restatement Type
11558 Indicator – Early Release (Restatement)
11559 Indicator – Restatement Reason Code
Stock Data 08001 Market Capitalization
07210 Market Capitalization (US$)
05202 Earnings per Share – Fiscal Period Generic
18209 EPS Fiscal Period Generic after Extra Items
18208 Earnings per Share – Continuing Operations
18205 Discontinued Operations – Total – per Share
18264 Trailing Twelve Months Earnings per Share
05116 Dividends per Share (Interim)
05112 Dividends Per Share – Extra (Interim)
05114 Dividends per share – Special (Interim)
18266 Trailing Twelve Months Dividends
05486 Tangible Book Value per Share
05491 Book Value – Outstanding Shares
05502 Cash Flow per Share – Fiscal Period
18265 Trailing Twelve Months Cash Flow per Share
18100 Enterprise Value
05301 Common Shares Outstanding

Interim Time Series Template
Issue 6
© Thomson Financial 2003-2007 187 Confidential Information of Thomson Financial
05191 Common Shares Used to Calculate EPS
05192 Common Shares Used to Calculate Basic EPS
05194 Common Shares Used to Calculate Fully Diluted EPS
Balance Sheet
Assets 02001 Cash & Short Term Investments
02051 Receivables (Net)
02101 Inventories –Total
02149 Other Current Assets
02201 Current Assets - Total
02501 Property Plant and Equipment - Net
02652 Other Assets
02649 Total Intangible Other Assets - Net
02999 Total Assets
Liabilities & Shareholders' Equity 03051 Short Term Debt & Current Portion of
Long Term Debt
03066 Other Current Liabilities
03101 Current Liabilities - Total
03251 Long Term Debt
03245 Long Term Debt Excluding Capitalized Leases
03249 Capitalized Lease Obligations
03263 Deferred Taxes
03273 Other Liabilities
03351 Total Liabilities
03426 Minority Interest
03451 Preferred Stock
03501 Common Equity
03480 Common Stock
03999 Total Liabilities & Shareholders' Equity
Income Statement 01001 Net Sales or Revenues
01051 Cost of Goods Sold
01100 Gross Income
01151 Depreciation, Depletion & Amortization
01230 Other Operating Expenses
01250 Operating Income
01251 Interest Expense on Debt
01267 Pre-tax Equity in Earnings
01262 Other Income/Expense - Net
01401 Pre-tax Income
01451 Income Taxes
01501 Minority Interest
01503 Equity in Earnings
01505 Discontinued Operations
01551 Net Income before Extraordinary Items/Preferred Dividends
01701 Preferred Dividend Requirements
01706 Net Income after Preferred Dividends (Basic EPS)
01601 Extraordinary Items & Gain/Loss Sale of Assets
Funds Flow Statement 04049 Depreciation and Depletion
04051 Depreciation, Depletion & Amortization
04201 Funds from Operations
04831 Funds from/for Other Operating Activities
04860 Net Cash Flow - Operating Activities
04601 Capital Expenditures
04870 Net Cash Flow – Investing
04251 Net Proceeds from Sale/Issuance of Common & Preferred
04890 Net Cash Flow - Financing
04840 Effect of Exchange Rate on Cash

Interim Time Series Template
Issue 6
© Thomson Financial 2003-2007 188 Confidential Information of Thomson Financial
04851 Increase/Decrease in Cash & Short Term Investments
Supplementary Data
Asset fields 18214 Exchange Rate Used in Translating
Balance Sheet
02005 Cash & Equivalents - Generic
18299 Computer Software
18390 Construction Work in Progress
18392 Accumulated Depreciation – Construction Work in Progress
02654 Total Intangible Other Assets - Gross
02655 Total Intangible Other Assets – Accumulated Amortization
02300 Total Assets - As Reported
Liability Fields 03255 Total Debt
18852 Comprehensive Income – Hedging Gain/Loss
18854 Comprehensive Income – Other
18851 Comprehensive Income – Pension Liability
18853 Comprehensive Income – Unearned Compensation
18168 Mandatorily Redeemable Trust Preferred Securities
18167 Other Mandatory Redeemable Instruments
Income Statement Fields 18215 Exchange Rate Used in Translating
Income Statement/Cash Flow
18155 Operating Income before Depreciation/Amortization
18224 Amortization and Impairment of Goodwill
18225 Impairment of Goodwill
18226 Impairment of Other Intangibles
18274 Impairment of Property, Plant & Equipment
18275 Impairment of Financial Fixed Assets
18191 Earnings before Interest and Taxes (EBIT)
18198 Earnings before Interest, Taxes & Depreciation (EBITDA)
01651 Net Income - Bottom Line
01751 Net Income Used to Calculate Earnings per Share
01705 Net Income Used to Calculate Fully Diluted Earnings per Share
18262 Trailing Twelve Months Net Sales/Revenues
18269 Trailing Twelve Months Interest Expense
18271 Trailing Twelve Months Pre Tax Income
18270 Trailing Twelve Months Income Taxes
18263 Trailing Twelve Months Net Profit
08346 Tax Rate
18263 Trailing Twelve Months Net Profit
Other Fields 03151 Working Capital
03998 Total Capital
18199 Net Debt
03995 Total Shareholders’ Equity
Stock Performance 09104 Price/Earnings Ratio – Close
09604 Price/Cash Flow Ratio
09404 Dividend Yield - Close
09304 Price/Book Value Ratio - Close
09905 Market Capitalization to Trailing Twelve Months Revenue Ratio
09704 Market Capitalization to Common Equity
08801 Total Investment Return – year ago

Interim Time Series Template
Issue 6
© Thomson Financial 2003-2007 189 Confidential Information of Thomson Financial
Growth Rates 08698 Net Sales/Revenue Growth (period vs.
year ago)
08631 Net Sales/Revenues Growth
08636 Net Income Growth
08676 Net Margin Growth
08621 Total Assets Growth (year ago)
08616 Equity Growth (year ago)
08601 Earnings per Share Growth
08699 Earnings per Share Growth (Period vs. Year Ago)
08611 Dividends per Share Growth
08606 Book Value per Share Growth (year ago)
08579 Market Capitalisation Growth (year ago)
Profitability 08301 Return on Equity – Total (%)
08371 Return on Equity - per Share
08651 Reinvestment Rate - per Share
08326 Return on Assets
08381 Cash Earnings Return on Equity
08311 Cash Flow/Sales
08306 Gross Profit Margin
18267 Trailing Twelve Months Gross Margin
08316 Operating Profit Margin
18306 Trailing Twelve Months Operating Margin
18305 Trailing Twelve Months Operating Profit
08321 Pre-tax Margin
18304 Trailing Twelve Months Pre-tax Margin
08366 Net Margin
18268 Trailing Twelve Months Net Margin
Asset Utilization 08401 Total Asset Turnover
Leverage 08231 Total Debt % Common Equity
08226 Long Term Debt % Common Equity
08236 Total Debt % Total Assets
08241 Common Equity % Total Assets
08287 Total Assets / Common Equity Ratio
08251 Fixed Charge Coverage Ratio
08261 Operating Cash/Fixed Charges
08266 Fixed Assets % Common Equity
Liquidity 08106 Current Ratio
08111 Cash & Equivalents % Total Current Assets

Interim Time Series Template
Issue 6
© Thomson Financial 2003-2007 190 Confidential Information of Thomson Financial
INSURANCE
General Information 06099 Currency of Document
07034 Indicator – Data Update
05350 Date of Fiscal Period End
05351 Length of Fiscal Period
11556 Indicator – Restated Data Exists
11557 Indicator – Restatement Type
11558 Indicator – Early Release (Restatement)
11559 Indicator – Restatement Reason Code
Stock Data 08001 Market Capitalization
07210 Market Capitalization (US$)
05202 Earnings per Share – Fiscal Period Generic
18209 EPS Fiscal Period Generic after Extra Items
18208 Earnings per Share – Continuing Operations
18205 Discontinued Operations – Total – per Share
18264 Trailing Twelve Months Earnings per Share
05116 Dividends per Share (Interim)
05112 Dividends Per Share – Extra (Interim)
05114 Dividends per share – Special (Interim)
18266 Trailing Twelve Months Dividends
05486 Tangible Book Value per Share
05491 Book Value – Outstanding Shares
05502 Cash Flow per Share – Fiscal Period
18265 Trailing Twelve Months Cash Flow per Share
18100 Enterprise Value
05301 Common Shares Outstanding
05191 Common Shares Used to Calculate EPS
05192 Common Shares Used to Calculate Basic EPS
05194 Common Shares Used to Calculate Fully Diluted
Balance Sheet
Assets 02255 Investments – Total
02501 Property, Plant and Equipment – Net
02652 Other Assets
02649 Total Intangible Other Assets - Net
02999 Total Assets
Liabilities & Shareholders' Equity 03030 Insurance Reserves – Total
03005 Benefit & Loss Reserves
03010 Unearned Premiums
03020 Policy & Contract Claims
03023 Other Insurance Reserves
03255 Total Debt
03051 Short Term Debt & Current Portion of Long Term Debt
03251 Long Term Debt
03245 Long Term Debt Excluding Capitalized Leases
03249 Capitalized Lease Obligations
03263 Deferred Taxes
03273 Other Liabilities
03351 Total Liabilities
03426 Minority Interest
03451 Preferred Stock
03501 Common Equity
03480 Common Stock
03440 Policyholders' Equity
03999 Total Liabilities & Shareholders' Equity

Interim Time Series Template
Issue 6
© Thomson Financial 2003-2007 191 Confidential Information of Thomson Financial
Income Statement 01001 Net Sales or Revenues
01002 Premiums Earned
01020 Other Operating Income
01249 Operating Expenses - Total
01250 Operating Income
01251 Interest Expense on Debt
01262 Other Income/Expense - Net
01401 Pre-tax Income
01551 Net Income before Extraordinary Items/Preferred Dividends
01701 Preferred Dividend Requirements
01706 Net Income after Preferred Dividends (Basic EPS)
01601 Extraordinary Items & Gain/Loss Sale of Assets
Funds Flow Statement 04201 Funds from Operations
04831 Funds from/for Other Operating Activities
04860 Net Cash Flow - Operating Activities
04601 Capital Expenditures
04870 Net Cash Flow - Investing
04251 Net Proceeds from Sale/Issuance of Common & Preferred
04890 Net Cash Flow - Financing
04840 Effect of Exchange Rate on Cash
04851 Increase/Decrease in Cash & Short Term Investments
Supplementary Data
Asset Fields 18214 Exchange Rate Used in Translating
Balance Sheet
02005 Cash & Equivalents – Generic
02654 Total Intangible Other Assets - Gross
02655 Total Intangible Other Assets – Accumulated Amortization
02300 Total Assets - As Reported
Liability & Shareholders' Equity Fields 03498 Unrealized Gain/Loss on Marketable
Securities
18852 Comprehensive Income – Hedging Gain/Loss
18854 Comprehensive Income – Other
18851 Comprehensive Income – Pension Liability
18853 Comprehensive Income – Unearned Compensation
18168 Mandatorily Redeemable Trust Preferred Securities
18167 Other Mandatory Redeemable Instruments
Income Statement Fields 18215 Exchange Rate Used in Translating
Income Statement/Cash Flow
01071 Current Insurance Benefits
01078 Loss Adjustment Expense
18224 Amortization and Impairment of Goodwill
18225 Impairment of Goodwill
18226 Impairment of Other Intangibles
18274 Impairment of Property, Plant & Equipment
18275 Impairment of Financial Fixed Assets
18191 Earnings before Interest and Taxes (EBIT)
01651 Net Income – Bottom Line
01751 Net Income Used to Calculate Earnings per Share
01705 Net Income Used to Calculate Fully Diluted Earnings per Share
18262 Trailing Twelve Months Net Sales/Revenues
18269 Trailing Twelve Months Interest Expense

Interim Time Series Template
Issue 6
© Thomson Financial 2003-2007 192 Confidential Information of Thomson Financial
18271 Trailing Twelve Months Pre Tax Income
18270 Trailing Twelve Months Income Taxes
18263 Trailing Twelve Months Net Profit
18263 Trailing Twelve Months Net Profit
08346 Tax Rate
Other Fields 03998 Total Capital
18199 Net Debt
03995 Total Shareholders’ Equity
Stock Performance 09104 Price/Earnings Ratio – Close
09604 Price/Cash Flow Ratio
09404 Dividend Yield - Close
09304 Price/Book Value Ratio - Close
09905 Market Capitalization to Trailing Twelve Months Revenue Ratio
09704 Market Capitalization to Common Equity
08801 Total Investment Return – year ago
Growth Rates 08698 Net Sales/Revenue Growth (period vs.
year ago)
08631 Net Sales/Revenues Growth
08636 Net Income Growth
08676 Net Margin Growth
08621 Total Assets Growth (year ago)
08616 Equity Growth (year ago)
08601 Earnings per Share Growth
08699 Earnings per Share Growth (Period vs. Year Ago)
08611 Dividends per Share Growth
08606 Book Value per Share Growth (year ago)
08579 Market Capitalisation Growth (year ago)
Profitability 08301 Return on Equity – Total (%)
08371 Return on Equity - per Share
08651 Reinvestment Rate - per Share
08326 Return on Assets
08381 Cash Earnings Return on Equity
08316 Operating Profit Margin
18306 Trailing Twelve Months Operating Margin
18305 Trailing Twelve Months Operating Profit
08311 Cash Flow/Sales
08321 Pre-tax Margin
18304 Trailing Twelve Months Pre-tax Margin
08366 Net Margin
18268 Trailing Twelve Months Net Margin
Asset Utilization 08401 Total Asset Turnover
Leverage 08231 Total Debt % Common Equity
08226 Long Term Debt % Common Equity
08236 Total Debt % Total Assets
08241 Common Equity % Total Assets
08287 Total Assets / Common Equity Ratio
08251 Fixed Charge Coverage Ratio
08261 Operating Cash/Fixed Charges
08266 Fixed Assets % Common Equity

Interim Time Series Template
Issue 6
© Thomson Financial 2003-2007 193 Confidential Information of Thomson Financial
OTHER FINANCIALS
General Information 06099 Currency of Document
07034 Indicator – Data Update
05350 Date of Fiscal Period End
05351 Length of Fiscal Period
11556 Indicator – Restated Data Exists
11557 Indicator – Restatement Type
11558 Indicator – Early Release (Restatement)
11559 Indicator – Restatement Reason Code
Stock Data 08001 Market Capitalization
07210 Market Capitalization (US$)
05202 Earnings per Share – Fiscal Period Generic
18209 EPS Fiscal Period Generic after Extra Items
18208 Earnings per Share – Continuing Operations
18205 Discontinued Operations – Total – per Share
18264 Trailing Twelve Months Earnings per Share
05116 Dividends per Share (Interim)
05112 Dividends Per Share – Extra (Interim)
05114 Dividends per share – Special (Interim)
18266 Trailing Twelve Months Dividends
05486 Tangible Book Value per Share
05491 Book Value – Outstanding Shares
05502 Cash Flow per Share – Fiscal Period
18265 Trailing Twelve Months Cash Flow per Share
18100 Enterprise Value
05301 Common Shares Outstanding
05191 Common Shares Used to Calculate EPS
05192 Common Shares Used to Calculate Basic EPS
05194 Common Shares Used to Calculate Fully Diluted
Balance Sheet
Assets 02001 Cash & Short Term Investments
02255 Investments - Total
02501 Property, Plant & Equipment - Net
02652 Other Assets
02649 Total Intangible Other Assets - Net
02999 Total Assets
Liabilities & Shareholders' Equity 03255 Total Debt
03051 Short Term Debt & Current Portion of Long Term Debt
03251 Long Term Debt
03245 Long Term Debt Excluding Capitalized Leases
03249 Capitalized Lease Obligations
03263 Deferred Taxes
03273 Other Liabilities
03351 Total Liabilities
03426 Minority Interest
03451 Preferred Stock
03501 Common Equity
03999 Total Liabilities & Shareholders' Equity
Income Statement 01001 Net Sales or Revenues
01249 Operating Expenses - Total
01250 Operating Income
01262 Other Income/Expense - Net
01401 Pre-tax Income

Interim Time Series Template
Issue 6
© Thomson Financial 2003-2007 194 Confidential Information of Thomson Financial
01551 Net Income before Extraordinary Items/Preferred Dividends
01701 Preferred Dividend Requirements
01706 Net Income after Preferred Dividends (Basic EPS)
01601 Extraordinary Items & Gain/Loss Sale of Assets
Funds Flow Statement 04051 Depreciation, Depletion &
Amortization
04201 Funds from Operations
04831 Funds from/for Other Operating Activities
04860 Net Cash Flow - Operating Activities
04601 Capital Expenditures
04870 Net Cash Flow – Investing
04251 Net Proceeds from Sale/Issuance of Common & Preferred
04890 Net Cash Flow - Financing
04840 Effect of Exchange Rate on Cash
04851 Increase/Decrease in Cash & Short Term Investments
Supplementary Data
Asset Fields 18214 Exchange Rate Used in Translating
Balance Sheet
02005 Cash & Equivalents – Generic
18390 Construction Work in Progress
18392 Accumulated Depreciation – Construction Work in Progress
02654 Total Intangible Other Assets - Gross
02655 Total Intangible Other Assets – Accumulated Amortization
02300 Total Assets - As Reported
Liability Fields 18852 Comprehensive Income – Hedging
Gain/Loss
18854 Comprehensive Income – Other
18851 Comprehensive Income – Pension Liability
18853 Comprehensive Income – Unearned Compensation
18168 Mandatorily Redeemable Trust Preferred Securities
18167 Other Mandatory Redeemable Instruments
Income Statement Fields 18215 Exchange Rate Used in Translating
Income Statement/Cash Flow
01251 Interest Expense on Debt
18224 Amortization and Impairment of Goodwill
18225 Impairment of Goodwill
18226 Impairment of Other Intangibles
18274 Impairment of Property, Plant & Equipment
18275 Impairment of Financial Fixed Assets
01151 Depreciation, Depletion & Amortization
18191 Earnings before Interest and Taxes (EBIT)
18198 Earnings before Interest, Taxes & Depreciation (EBITDA)
01651 Net Income - Bottom Line
01751 Net Income Used to Calculate Earnings per Share
01705 Net Income Used to Calculate Fully Diluted Earnings per Share
18262 Trailing Twelve Months Net Sales/Revenues
18269 Trailing Twelve Months Interest Expense
18271 Trailing Twelve Months Pre Tax Income
18263 Trailing Twelve Months Net Profit

Interim Time Series Template
Issue 6
© Thomson Financial 2003-2007 195 Confidential Information of Thomson Financial
18263 Trailing Twelve Months Net Profit
Other Fields 03998 Total Capital
18199 Net Debt
03995 Total Shareholders’ Equity
Stock Performance 09104 Price/Earnings Ratio – Close
09604 Price/Cash Flow Ratio
09404 Dividend Yield - Close
09304 Price/Book Value Ratio - Close
09905 Market Capitalization to Trailing Twelve Months Revenue Ratio
09704 Market Capitalization to Common Equity
08801 Total Investment Return – year ago
Growth Rates 08698 Net Sales/Revenue Growth (period vs.
year ago)
08631 Net Sales/Revenues Growth
08636 Net Income Growth
08676 Net Margin Growth
08621 Total Assets Growth (year ago)
08616 Equity Growth (year ago)
08601 Earnings per Share Growth
08699 Earnings per Share Growth (Period vs. Year Ago)
08611 Dividends per Share Growth
08606 Book Value per Share Growth (year ago)
08579 Market Capitalisation Growth (year ago)
Profitability 08301 Return on Equity – Total (%)
08371 Return on Equity - per Share
08651 Reinvestment Rate - per Share
08326 Return on Assets
08381 Cash Earnings Return on Equity
08316 Operating Profit Margin
18306 Trailing Twelve Months Operating Margin
18305 Trailing Twelve Months Operating Profit
08311 Cash Flow/Sales
08321 Pre-tax Margin
18304 Trailing Twelve Months Pre-tax Margin
08366 Net Margin
18268 Trailing Twelve Months Net Margin
Asset Utilization 08401 Total Asset Turnover
Leverage 08231 Total Debt % Common Equity
08226 Long Term Debt % Common Equity
08236 Total Debt % Total Assets
08241 Common Equity % Total Assets
08287 Total Assets / Common Equity Ratio
08251 Fixed Charge Coverage Ratio
08261 Operating Cash/Fixed Charges
08266 Fixed Assets % Common Equity

Issue 6
© Thomson Financial 2003-2007 196 Confidential Information of Thomson Financial
Field Definitions - Explanation of Format Standardized definitions are listed alphabetically. The format for these sections is as follows:
Field Name Type of Data, Availability, Field Number Applicable Industries: Definition Footnotes
1. Type of Data: Indicates the type of fundamental data or ratio.
Accounting Standard Descriptive Data
Geographic Data Income Data
Product Data Expense Data
Profitability Ratio Asset Data
Liquidity Ratio Liability Data
Leverage Ratio Shareholders' Equity Data
Asset Utilization Ratio Cash Flow Data
Growth Rate Supplementary Data
Stock Performance Ratio
Stock Data
Other Ratio
2. Availability: Indicates whether a field reflects the current period - Current - or is available historically - Annual.
3. Field Number: Identifies the Worldscope field number. Worldscope fields are five bytes. Whenever a four digit field number is given you can assume a "0" precedes the first digit.
4. Applicable Industries: Lists the general industry classifications for which a field may be available. These are Industrials (includes Utility and Transportation Companies), Banks, Insurance and Other Financial Companies.
5. Definition: Descriptive summary of field. In some cases a list of specific items which are included or excluded will be given. In cases where the definition may differ depending on the industry type they are listed separately.
6. Footnotes: These are an integral part of the database as it allows the analyst to provide additional information. They may be standardized or free in form.

Issue 6
© Thomson Financial 2003-2007 197 Confidential Information of Thomson Financial
Accounting Standards Accounting Method for Long Term Investment Greater than 50% Accounting Standard, Annual Item; Field 07531
All Industries: 01 All subsidiaries are consolidated 02 Domestic subsidiaries consolidated, others on cost basis 06 No consolidation, cost basis (parent company only) 07 No consolidation, equity basis (parent company only) 08 Consolidation for significant subsidiaries, others are on an equity basis 09 Not disclosed 10 Consolidation for significant subsidiaries, others are on cost basis 12 Not applicable 15 Consolidated except for financial services subsidiaries which are on equity basis 17 Consolidation for significant subsidiaries others on equity or proportional
consolidation
Accounting Standards Followed Accounting Standard, Annual Item; Field 07536
All Industries: 01 Local standards 02 International standards 03 U.S. standards (GAAP) 04 Commonwealth countries standards 05 EU standards 06 International standards and some EU guidelines 07 Specific standards set by the group 08 Local standards with EU and IASC guidelines 09 Not disclosed 10 Local standards with some EU guidelines 11 Local standards – inconsistency problems 12 International standards – inconsistency problems 13 US standards – inconsistency problems 14 Commonwealth standards – inconsistency problems 15 EEC standards – inconsistency problems 16 International standards and some EU guidelines – inconsistency problems 17 Local standards with some OECD guidelines 18 Local standards with some IASC guidelines 19 Local standards with OECD and IASC guidelines 20 US GAAP reclassified from local standards 21 Local standards with a certain reclassification for foreign companies 22 Other 23 IFRS

Accounting Standards
Issue 6
© Thomson Financial 2003-2007 198 Confidential Information of Thomson Financial
Auditor’s Opinion Accounting Standard, Annual Item; Field 07546
All Industries: 01 Not audited 02 No audit report in abbreviated version 03 Partial audit (not all statements audited) 04 Consolidated statements appear not to be audited, but parent company statements
audited 05 Qualified 06 Unqualified
U.S. GAAP Information Available Accounting Standard, Annual Item, Field 18221
All Industries: 01 Limited 02 Full Statement 03 None
This item is currently only available for ADRs.

Issue 6
© Thomson Financial 2003-2007 199 Confidential Information of Thomson Financial
Alphabetical List of Field Definitions
A Accounts Payable Liability Data, Annual Item; Field 03040
Industrials: ACCOUNTS PAYABLE represents the claims of trade creditors for unpaid goods or services that are due within the normal operating cycle of the company.
Data for this field is generally not available prior to 1989. It includes but is not restricted to:
Due to factor Bills of Exchange
Footnotes: A. Includes
Accounts Payable % Sales Profitability Ratio, Annual Item; Field 08901
Industrials: Accounts Payable / Sales * 100
Accounts Payable % Sales – 5 Yr Avg Profitability Ratio, Annual Item; Field 08905
Industrials: Arithmetic average of the last five years of Accounts Payable % Sales.
Accounts Receivable Days Liquidity Ratio, Annual Item; Field 08131
Industrials: 365 / (Net Sales or Revenues / Average of Last Year’s and Current Year’s Receivables-Net
This calculation uses restated data for last years values where available
Accounts Receivable Days 5 Yr Avg Liquidity Ratio, Annual Item; Field 08135
Industrials: Arithmetic average of the last five years of Accounts Receivable Days
Accrued Payroll Liability Data, Annual Item; Field 03054
Industrials, Insurance Companies: ACCRUED PAYROLL represents payroll expenses, which are incurred within the normal operating cycle of the company but are not paid.
Data for this field is generally not available prior to 1989.
Alphabetical List of Field Definitions - A
Issue 6
© Thomson Financial 2003-2007 200 Confidential Information of Thomson Financial
It includes but is not restricted to: Commissions Vacation Pay Profit sharing Incentive bonuses Pensions
It excludes: Payroll taxes
Accrued Taxes Supplementary (Liability) Data, Annual Item; Field 03060
Banks: ACCRUED TAXES represent the amount of income taxes accrued but not yet paid to the federal, state, foreign or local government.
Accumulated Depreciation Asset Data, Annual Item; Field 02401
Industrials, Other Financial Companies: ACCUMULATED DEPRECIATION represents the expense related to the fixed assets still carried on the books of the company. Sometimes the term "reserve for depreciation" is used. It includes but is not restricted to:
Accumulated depreciation Accumulated depletion Accumulated amortization Depreciation on leasehold improvements Amortization of Property, Plant & Equipment leased under capitalized lease obligations Excess depreciation (for Non-U.S. corporations)
It excludes: Flexible depreciation used for tax purposes (if shown on the balance sheet)
Footnotes: A. Includes amortization of intangibles B. Includes accumulated excess depreciation/write-downs H. Excessive revaluation of fixed assets J. Includes appropriations for net expenditures on mining assets
Accumulated Depreciation - Buildings Asset Data, Annual Item; Field 18384
Industrials, Other Financial Companies: ACCUMULATED DEPRECIATION - BUILDINGS represents the portion of accumulated depreciation that relates to the reduction in the useful economic life of the plant, office complex or warehouse from the wear and tear on those buildings.
Data for this field is generally not available prior to 1992. Footnotes:
A. No standard text D. Includes other

Alphabetical List of Field Definitions - A
Issue 6
© Thomson Financial 2003-2007 201 Confidential Information of Thomson Financial
Accumulated Depreciation - Land Asset Data, Annual Item; Field 18383
Industrials, Other Financial Companies: ACCUMULATED DEPRECIATION - LAND represents the portion of accumulated depreciation that relates to the reduction in the useful economic life of land.
Data for this field is generally not available prior to 1992. Footnotes:
A. No standard text D. Includes other
Accounts Payable Liability Data, Annual Item; Field 03040
All Industries: ACCOUNTS PAYABLE represents the claims of trade creditors for unpaid goods or services which are due within the normal operating cycle of the company.
Data for this field is generally not available prior to 1989. It includes but is not restricted to:
Due to factor Bills of Exchange
Footnotes: A. Includes other current liabilities
Accounts Payable % Sales Profitability Ratio, Annual Item; Field 08901
All Industries: Accounts Payable / Sales * 100
Accounts Payable % Sales - 5 Yr Avg Profitability Ratio, Annual Item; Field 08905
All Industries: Arithmetic average of the last five years of Accounts Payable % Sales.
Accounts Receivable Days Liquidity Ratio, Annual Item; Field 08131
All Industries: 365 / (Net Sales or Revenues / Average of Last Year’s and Current Year’s Receivables-Net) This calculation uses restated data for last years values where available.
Accounts Receivable Days - 5 Yr Avg Liquidity Ratio, Annual Item; Field 08135
All Industries: Arithmetic average of the last five years of Accounts Receivable Days

Alphabetical List of Field Definitions - A
Issue 6
© Thomson Financial 2003-2007 202 Confidential Information of Thomson Financial
Accrued Payroll Liability Data, Annual Item; Field 03054
All Industries: ACCRUED PAYROLL represents payroll expenses that are incurred within the normal operating cycle of the company but are not paid.
Data for this field is generally not available prior to 1989. It includes but is not restricted to:
Commissions Vacation Pay Profit sharing Incentive bonuses Pensions
It excludes: Payroll taxes
Accrued Taxes Supplementary (Liability) Data, Annual Item; Field 03060
Banks: ACCRUED TAXES represent the amount of income taxes accrued but not yet paid to the federal, state, foreign or local government.
Accumulated Depreciation Asset Data, Annual Item; Field 02401
Industrials, Other Financial Companies: ACCUMULATED DEPRECIATION represents the expense related to the fixed assets still carried on the books of the company. Sometimes the term "reserve for depreciation" is used. It includes but is not restricted to:
Accumulated depreciation Accumulated depletion Accumulated amortization Depreciation on leasehold improvements Amortization of Property, Plant & Equipment leased under capitalized lease obligations Excess depreciation (for Non-U.S. corporations)
It excludes: Flexible depreciation used for tax purposes (if shown on the balance sheet)
Footnotes: A. Includes amortization of intangibles B. Includes accumulated excess depreciation/write-downs H. Excessive revaluation of fixed assets J. Includes appropriations for net expenditures on mining assets
Accumulated Depreciation - Buildings Asset Data, Annual Item; Field 18384
Industrials, Other Financial Companies: ACCUMULATED DEPRECIATION - BUILDINGS represents the portion of accumulated depreciation that relates to the reduction in the useful economic life of the plant, office complex or warehouse from the wear and tear on those buildings.

Alphabetical List of Field Definitions - A
Issue 6
© Thomson Financial 2003-2007 203 Confidential Information of Thomson Financial
Data for this field is generally not available prior to 1992. Footnotes:
A. No standard text D. Includes other
Accumulated Depreciation – Computer Software And Equipment Supplementary (Asset) Data, Annual Item; Field 18391
Industrials: ACCUMULATED DEPRECIATION – COMPUTER SOFTWARE AND EQUIPMENT represents the portion of accumulated depreciation that relates to the reduction in the useful economic life of computer equipment and software. This item is updated when Computer Software and Equipment is included in Property, Plant & Equipment.
This item is only available in the annual time series at the company level.
Accumulated Depreciation – Construction Work In Progress Supplementary (Asset) Data, Annual & Interim Item; Field 18392
Industrials, Other Financial Companies: ACCUMULATED DEPRECIATION – CONSTRUCTION WORK IN PROGRESS represents the portion of accumulated depreciation that relates to the reduction in the useful economic life of construction work in progress.
This item is available in the annual time series. It is also available in the quarterly, semi-annual and trimester interim time series for US companies. It is only available at the company level.
Accumulated Depreciation - Land Asset Data, Annual Item; Field 18383
Industrials, Other Financial Companies: ACCUMULATED DEPRECIATION - LAND represents the portion of accumulated depreciation that relates to the reduction in the useful economic life of land.
Data for this field is generally not available prior to 1992. Footnotes:
A. No standard text D. Includes other
Accumulated Depreciation - Machinery And Equipment Asset Data, Annual Item; Field 18385
Industrials, Other Financial Companies: ACCUMULATED DEPRECIATION - MACHINERY AND EQUIPMENT represents the portion of accumulated depreciation that relates to the reduction in the useful economic life of machinery and equipment.
Data for this field is generally not available prior to 1992. Footnotes:
A. No standard text D. Includes other
Alphabetical List of Field Definitions - A
Issue 6
© Thomson Financial 2003-2007 204 Confidential Information of Thomson Financial
Accumulated Depreciation - Other Property, Plant and Equipment Asset Data, Annual Item; Field 18387
Industrials, Other Financial Companies: ACCUMULATED DEPRECIATION - OTHER PROPERTY, PLANT AND EQUIPMENT represents the portion of accumulated depreciation that relates to the reduction in the useful economic life of any item not included in land, buildings, machinery and equipment, rental/leased equipment, and transportation equipment.
Data for this field is generally not available prior to 1992. Footnotes:
A. No standard text
Accumulated Amortization - Property, Plant and Equipment Under Capitalized Leases Asset Data, Annual Item; Field 18389
Industrials, Other Financial Companies: ACCUMULATED AMORTIZATION - PROPERTY, PLANT AND EQUIPMENT UNDER CAPITALIZED LEASES represents the portion of accumulated amortization that relates to the reduction in the useful economic life of property, plant and equipment under capitalized leases.
Data for this field is generally not available prior to 1992. Footnotes:
A. No standard text D. Includes other
Accumulated Depreciation - Rental/Leased Equipment Asset Data, Annual Item; Field 18386
Industrials, Other Financial Companies: ACCUMULATED DEPRECIATION - RENTAL/LEASED EQUIPMENT represents the portion of accumulated depreciation that relates to the reduction in the useful economic life of rental/leased property.
Data for this field is generally not available prior to 1992. Footnotes:
A. No standard text D. Includes other
Accumulated Depreciation - Transportation Equipment Asset Data, Annual Item; Field 18388
Industrials, Other Financial Companies: ACCUMULATED DEPRECIATION - TRANSPORTATION EQUIPMENT represents the portion of accumulated depreciation that relates to the reduction in the useful economic life of transportation equipment.
Data for this field is generally not available prior to 1992. Footnotes:
A. No standard text D. Includes other

Alphabetical List of Field Definitions - A
Issue 6
© Thomson Financial 2003-2007 205 Confidential Information of Thomson Financial
Accumulated Depreciation % Gross Fixed Assets Asset Utilization Ratio, Annual Item; Field 08426
All Industries: Accumulated Depreciation / Property, Plant & Equipment-Gross * 100
Accumulated Depreciation % Gross Fixed Assets - 5 Yr Avg Asset Utilization Ratio, Annual Item; Field 08430
All Industries: Arithmetic average of the last five years of Accumulated Depreciation % Gross Fixed Assets
Acid-Test Ratio See QUICK RATIO
Acronym Descriptive Data, Current Item; Field 06014
All Industries: ACRONYM represents an abbreviated version of a company's registered name often formed by using the first letter of the words in the name. It could also be a commonly used name for a company.
Actual Loan Losses Supplementary (Asset) Data, Annual Item; Field 01273
Banks: ACTUAL LOAN LOSSES represent the amount of loans that the bank decides are uncollectable and writes off in a given year.
Footnotes: A. Net of recoveries B. Taken from parent company
Actual Loan Losses % Reserve For Loan Losses Other Ratio, Annual Item; Field 15085
Banks: Net Loan Losses / Reserve for Loan Losses * 100
Actual Loan Losses % Reserve For Loan Losses - 5 Yr Avg Other Ratio, Annual Item; Field 15088
Banks: Arithmetic average of the last five years of Actual Loan Losses % Reserve for Loan Losses
Actual Recoveries Supplementary (Asset) Data, Annual Item; Field 01274
Banks: ACTUAL RECOVERIES represent the amount of the loans previously charged off by the bank that were repaid within a given year.

Alphabetical List of Field Definitions - A
Issue 6
© Thomson Financial 2003-2007 206 Confidential Information of Thomson Financial
Additions To Other Assets Cash Flow Data, Annual Item; Field 04651
All Industries: ADDITIONS TO OTHER ASSETS represent the amount used to increase all other assets except fixed assets and net assets from acquisitions. It includes but is not restricted to:
Increase in deferred charges Increase in goodwill/cost in excess of net assets purchased Increase in intangible assets Increase in investments (prior to 1989) Increase in net assets Increase in other assets
Address Descriptive Data, Current Items; Fields 06021, 06022, 06023, 06024, 06025, 06026
All Industries: ADDRESS represents the location of the corporate offices of a company. The fields are defined as follows:
Field 06021: Building Field 06022: Street Address Field 06023: City Field 06024: State, Province, County or District Field 06025: Post Code/Zip Code Field 06026: Nation
Adjustment Factor For Capital Changes See STOCK/SPLIT DIVIDEND RATIO
ADR/U.S. Foreign Filer CUSIP 1, 2, 3 Supplementary Data, Current Items; Fields 06110, 06111, 06112
All Industries: ADR CUSIP 1, 2, 3 represents the CUSIP of the ADR security which is represented on Worldscope. These items are provided on the Worldscope Identifier of the non-U.S. company/security represented by the ADR.
ADR/U.S. Foreign Filer Exchange Factor Supplementary Data, Current Item; Field 05577
All Industries: ADR EXCHANGE FACTOR represents the multiplier used to adjust the shares of the underlying non-U.S. company to arrive at the ADR equivalent shares. It is the reciprocal of the ADR exchange ratio.
ADR Exchange Ratio Supplementary Data, Current Item; Field 06096
All Industries: ADR EXCHANGE RATIO represents the relationship between the American Depositary Receipt and the common share represented by the ADR. For example, an ADR ratio of 1:5 represents that 1 ADR is equivalent to 5 outstanding shares.

Alphabetical List of Field Definitions - A
Issue 6
© Thomson Financial 2003-2007 207 Confidential Information of Thomson Financial
This item is only available for ADRs.
ADR/U.S. Foreign Filer Non-U.S. Company Identifier Descriptive Data, Current Item; Field 06115
All Industries: ADR NON-U.S. COMPANY IDENTIFIER represents the Worldscope Identifier of the underlying company that is represented by the ADR.
ADR/U.S. Foreign Filer Non-U.S. Security Identifier Descriptive Data, Current Item; Field 06116
All Industries: ADR NON-U.S. SECURITY IDENTIFIER represents the Worldscope Identifier of the underlying security that is represented by the ADR.
After Tax Other Income/Expense Income Data, Annual Item; Field 01504
All Industries: AFTER TAX OTHER INCOME/EXPENSE represents miscellaneous items reported net of tax which are included in the company's net income.
Data for this field is generally not available prior to 1989. It includes but is not restricted to:
Tax benefit for common stock ESOP dividends. It excludes:
Tax benefit for preferred stock ESOP dividends Footnotes:
A. No standard text B. Includes ESOP common stock tax benefit C. Includes amortization of consolidation adjustments
Alpha Stock Market Performance Ratio, Current Item; Field 09803
All Industries: A measure of the amount of return produced by a stock's inherent factors rather than market sensitivity factors. This coefficient is based on between 23 and 35 consecutive month end percent changes of the company and a local market index.
This item is also available at the security level. The following indices are used in the calculation of alpha:
Country Stock Index Argentina MERVAL Australia All Ordinaries Austria Credit Aktien Belgium BEL 20 Index Brazil Bovespa Canada TSE300 Chile IGPA General Colombia IBB Index

Alphabetical List of Field Definitions - A
Issue 6
© Thomson Financial 2003-2007 208 Confidential Information of Thomson Financial
Denmark Copenhagen Stock Exchange Finland HEX General France SBF 250 Germany Faz Aktien Greece Athens Stock Exchange Hong Kong Hang Seng Index India BSE Sensitive Index Indonesia Jakarta Composite Index Ireland ISEQ Overall Italy Banca Commerciale Italy Index (B.C.I.) Japan Nikkei 225 Malaysia KLSE Composite Index Mexico IPC Index Netherlands CBS General Index New Zealand NZSE40 Index Norway Oslo Stock Exchange Philippines Philippines S.E. Composite Index Portugal BT&A Index Singapore Straits Times Industrial South Africa JSE Industrials South Korea South Korea Composite Index Spain Madrid Stock Exchange Sweden Affarsvarlden Switzerland Swiss Bank Industrial Taiwan Weighted Price Index Thailand Bangkok Stock Exchange Index Turkey Istanbul Composite Index United Kingdom FT All Share United States S&P 500 Venezuela MERINVEST
Amortization and Impairment Of Goodwill Supplementary (Expense) Data, Historic Item, Annual Time Series; Field 18224
All Industries: AMORTIZATION AND IMPAIRMENT OF GOODWILL represents the total change in positive goodwill, including the amortization change and losses due to impairment of goodwill.
This item is populated for the annual, quarterly, semi-annual, trimester, quarterly-cumulative and trimester-cumulative time series. Data for this field is generally not available prior to 2001.
It includes but is not restricted to: All amortisation/impairment/write-offs/write-downs of goodwill (including any amount described as exceptional/extraordinary) Amortization/impairment of goodwill arising on the acquisition of an equity accounted or associated company Amortization of negative goodwill

Alphabetical List of Field Definitions - A
Issue 6
© Thomson Financial 2003-2007 209 Confidential Information of Thomson Financial
It excludes: Impairment losses for goodwill arising from the initial application of SFAS 142, and resulting from a transitional impairment test, which are reported as a change in accounting principles. Unamortized negative goodwill written off under the provisions of SFAS 142.
Amortization of Brands Supplementary (Expense) Data, Annual Item; Field 01152
All Industries (Supplementary to Amortization of Intangibles): AMORTIZATION OF BRANDS represents amortization of brands, patents and trademarks for the period.
This item is available in the annual original and annual restated time series for detailed companies, full update.
Amortization of Computer Software Supplementary (Expense) Data, Annual Item; Field 01157
All Industries (Supplementary to Amortization of Intangibles): AMORTIZATION OF COMPUTER SOFTWARE represents the amortization value of the information a computer uses to perform tasks; this can be either developed by a company or obtained by a company to perform its business.
This item is available in the annual original and annual restated time series for detailed companies, full update.
Amortization Of Deferred Charges Expense Data, Annual Item; Field 01150
Industrials, Other Financial Companies: AMORTIZATION OF DEFERRED CHARGES represents the cost allocation of expenditure not yet recognized as an expense.
Data for this field is generally not available prior to 1992. It includes but is not restricted to:
Amortization of start-up costs Footnotes:
A. No standard text
Amortization of Goodwill Supplementary (Expense) Data, Annual and U.S. Interim Item; Field 01156
All Industries: AMORTIZATION OF GOODWILL represents amortization of goodwill for the period. Note that this item is supplementary to Amortization of Intangibles.
This item is available in the annual original and annual restated time series for detailed and limited companies and for all update types (fast, full and preliminary). For U.S. companies, it is also available in the interim original and interim restated time series.
Amortization Of Intangibles Expense Data, Annual Item; Field 01149
All Industries: AMORTIZATION OF INTANGIBLES represents the cost allocation for intangible assets such as patents, leasehold improvements, trademarks, bookplates, tools and film costs.

Alphabetical List of Field Definitions - A
Issue 6
© Thomson Financial 2003-2007 210 Confidential Information of Thomson Financial
Data for this field is generally not available prior to 1992. It includes but is not restricted to:
Amortization of goodwill/cost in excess of net assets purchased Amortization of intangible assets
Footnotes: A. No standard text
B. Includes amortization of deferred charges
Amortization Of Intangible Assets Cash Flow Data, Annual Item; Field 04050
Industrials, Other Financial Companies: AMORTIZATION OF INTANGIBLE ASSETS represents the cost allocation for intangible assets such as patents and leasehold improvements, trademarks, book plates, tools and film costs. It is a non-cash charge. It includes but is not restricted to:
Amortization of goodwill/cost in excess of net assets purchased Amortization of intangible assets It excludes: Amortization of discounts or premiums on financial instruments owed or outstanding
Amortization of Licenses Supplementary (Expense) Data, Annual Item; Field 01154
All Industries (Supplementary to Amortization of Intangibles): AMORTIZATION OF LICENSES represents amortization of licenses including franchises and production rights for the period.
This item is available in the annual original and annual restated time series for detailed companies, full update.
Amortization of Other Intangibles Supplementary (Expense) Data, Annual Item; Field 01155
All Industries (Supplementary to Amortization of Intangibles): AMORTIZATION OF OTHER INTANGIBLES represents amortization of intangible assets for the period that is either not specified as relating to goodwill, brands, research and development, or licenses.
This item is available in the annual original and annual restated time series for detailed companies, full update.
Amortization of Research and Development Supplementary (Expense) Data, Annual Item; Field 01153
All Industries (Supplementary to Amortization of Intangibles): AMORTIZATION OF RESEARCH AND DEVELOPMENT represents amortization of research and development expenditure for the period.
This item is available in the annual original and annual restated time series for detailed companies, full update.

Alphabetical List of Field Definitions - A
Issue 6
© Thomson Financial 2003-2007 211 Confidential Information of Thomson Financial
Asset Disposal Supplementary (Cash Flow) Data, Annual and U.S. Interim Item; Field 04053
All Industries: ASSET DISPOSAL represents profit or loss on the disposal of fixed assets. This data is a component of Total Other Cash Flow (field 04151).
This item is available in the annual original and annual restated time series for detailed companies, full update. For U.S. companies, it is also available in the interim original and interim restated time series.
Assets Per Employee Asset Utilization Ratio, Annual Item; Field 08406
All Industries: Total Assets / Employees
Banks: (Total Assets - Customer Liabilities on Acceptances) / Employees Customer Liabilities on Acceptances only subtracted when included in Total Assets
Other Financial Companies: (Total Assets - Custody Securities) / Employees
Assets Per Employee - 5 Yr Avg Asset Utilization Ratio, Annual Item; Field 08410
All Industries: Arithmetic average of the last five years of Assets Per Employee.
Associated Companies (Balance Sheet) See INVESTMENTS IN UNCONSOLIDATED SUBSIDIARIES
Associated Companies (Income Statement) See PRE-TAX EQUITY IN EARNINGS and/or EQUITY IN EARNINGS
Auditor Fees Supplementary Data, Annual Item; Field 01801
All Industries: AUDITOR FEES represent the amount paid by the company for the professional examination and verification of the financial statements for the purpose of rendering an opinion as to their consistency, fairness and conformation to accepted accounting principles. It includes but is not restricted to:
Audit Fees for consultancy Footnotes:
A. Parent company

Issue 6
© Thomson Financial 2003-2007 212 Confidential Information of Thomson Financial
B Benefit & Loss Reserves Liability Data, Annual Item; Field 03005
Insurance Companies: BENEFIT AND LOSS RESERVES represent the present value of future benefits to be paid on behalf of or to policyholders.
Footnotes: A. Premium reserve is included B. Other reserves are included C. Life policy benefit reserves are included D. Includes policy and contract claims
Benefit & Loss Reserves % Total Capital Liquidity Ratio, Annual Item; Field 15190
Insurance Companies: Benefit & Loss Reserves / Total Capital * 100
Benefit & Loss Reserves % Total Capital - 5 Yr Avg Liquidity Ratio, Annual Item; Field 15193
Insurance Companies: Arithmetic average of the last five years of Benefit & Loss Reserves % Total Capital
Benefits, Claims Losses & Settlement Expense See CURRENT INSURANCE BENEFITS
Benefits And Claims See CURRENT INSURANCE BENEFITS
Beta Stock Market Performance Ratio, Current Item; Field 09802
All Industries: A measure of market risk which shows the relationship between the volatility of the stock and the volatility of the market. This coefficient is based on between 23 and 35 consecutive month end price percent changes and their relativity to a local market index.
This item is also available at the security level. The following indices are used in the calculation of beta:
Country Stock Index Argentina Indice MERVAL Argentino Australia All Australia Ordinaries Austria ATX Austrian Traded Index Belgium BEL 20 Index Bermuda BSX Index Brazil BOVESPA

Alphabetical List of Field Definitions - B
Issue 6
© Thomson Financial 2003-2007 213 Confidential Information of Thomson Financial
Canada S&P/TSX Composite Index Chile Santiago Index IPSA China Shanghai B Index Colombia IGBC Index Czech Republic Prague PX 50 Index Denmark Copenhagen KFX Index Egypt IFC Invest Finland All Share Price Index France CAC 40 Index Germany DAX (Performance Index) Ghana GSE All-Share Index Greece Athens Composite Index Hong Kong Hang Seng Index Hungary BUX Index India Mumbai Sensitive Index Indonesia Jakarta Composite Price Index Ireland ISEQ-Overall (Price) Israel TASE 100 Index Italy Milan MIB 30 Japan Nikkei 225 Index Jordan Amman Financial Total Index Korea Korea Composite Index Luxembourg Indice Luxx Returns Malaysia KLSE Composite Index Mexico IPC Index Netherlands AEX Index New Zealand NZSX 40 Cap Index Norway Oslo Bors Benchmark Index Pakistan KSE 100 Index Peru Indice General Bolsa de Valore Philippines Philippines Composite Index Poland Warsaw WIG Index Portugal Portugal PSI 20 Russia RTS Index Singapore Straits Times Index Slovakia SAX Index Slovenia SBI 20 Index South Africa Africa All Shares Index Spain IBEX 35 Sri Lanka Colombo Index All Shares Sweden OMX Stock Index Switzerland Swiss Market Index Taiwan Taiwan Stock Exchange Weighted Index Thailand Bangkok Stock Exchange SET Index
Alphabetical List of Field Definitions - B
Issue 6
© Thomson Financial 2003-2007 214 Confidential Information of Thomson Financial
Turkey ISE National 100 United Kingdom FT All Share United States S&P 500 Venezuela Indice General
Bonds Asset Data, Annual Item; Field 02212
Insurance Companies: BONDS represent the insurance company's investment in certificates of debt issued by a corporation, municipality or a government and its agencies. It bears a stated interest rate and matures at a stated future date. It includes but is not restricted to:
Long term bond investments Treasury Notes Convertible bonds of a corporation Non-convertible bonds of a corporation Government bonds State, county & municipal bonds Subordinated debentures of a company Bonds below investment grade (field 18701)
Bonds Below Investment Grade Supplementary (Asset) Data, Annual Item; Field 18701
Insurance Companies: BONDS BELOW INVESTMENT GRADE represent those bonds with an investment rating of BB or lower. This type of bond usually pays higher yields but it is extremely volatile. Also referred to as junk bonds or high-yield bonds.
Data for this field is generally not available prior to 1991.
Book Value – Outstanding Shares – Fiscal Stock Data, Annual Item; Field 05491
All Industries: BOOK VALUE – OUTSTANDING SHARES – FISCAL represents the book value (proportioned common equity divided by outstanding shares) at the company’s fiscal year end.
This item is also available at the security level for 1987 and subsequent years and is shown per 1,000 shares for Brazilian companies.
Book Value Per ADR – GAAP Stock Data, Annual Item; Field 05490
All Industries: BOOK VALUE PER ADR – GAAP represents the book value per share of a non-U.S. company adapted to conform to U.S. Generally Accepted Accounting Principles. It is calculated by dividing Common Equity – GAAP (converted to U.S. dollars at the fiscal year end exchange rate) by shares outstanding adjusted by the ADR ratio.
This item is only available for ADRs trading on the NYSE, ASE or NASDAQ and is generally not available prior to 1994.

Alphabetical List of Field Definitions - B
Issue 6
© Thomson Financial 2003-2007 215 Confidential Information of Thomson Financial
Book Value Per ADR – GAAP – Current Stock Data, Current Item; Field 05478
All Industries: BOOK VALUE PER ADR – GAAP – CURRENT represents the most recent Book Value per ADR – GAAP available in our database. It is based on retained earnings and reflects the most recent Earnings Per ADR – GAAP and dividends (for the same time period as the earnings) reported by the company. When interim data is not available it is the most recent Book Value Per ADR – GAAP reported in the last two years.
Book Value Per ADR - GAAP – 1 Yr Annual Growth Growth Rate, Annual Item; Field 08592
All Industries: (Current Year's Book Value Per ADR-GAAP / Last Year's Book Value Per ADR-GAAP – 1) * 100
This item is only available for ADRs trading on the NYSE, ASE or NASDAQ and is generally not available prior to 1995.
Book Value Per ADR - GAAP – 3 Yr Annual Growth Growth Rate, Annual Item; Field 08593
All Industries: ((Current Year's Book Value Per ADR-GAAP / Book Value Per ADR-GAAP four years ago, reduced to a compound annual rate) – 1) * 100
This item is only available for ADRs trading on the NYSE, ASE or NASDAQ and is generally not available prior to 1997.
Book Value Per ADR - GAAP – 5 Yr Annual Growth Growth Rate, Annual Item; Field 08594
All Industries: ((Current Year's Book Value Per ADR-GAAP / Book Value Per ADR-GAAP six years ago, reduced to a compound annual rate) – 1) * 100
This item is only available for ADRs trading on the NYSE, ASE or NASDAQ and will not be available until 1999.
Book Value Per Share Stock Data, Annual Item; Field 05476
All Industries: BOOK VALUE PER SHARE represents the book value (proportioned common equity divided by outstanding shares) at the company's fiscal year end for non-U.S. corporations and at the end of the last calendar quarter for U.S. corporations. Preference stock has been included in equity and the calculation of book value per share where it participates with common/ordinary shares in the profits of the company. It is excluded in all other cases, deducted at liquidation value for U.S. companies and at par value for all others. In Germany, special (tax-allowed) reserves have been excluded. In Finland, 100% of untaxed reserves are included prior to 1994 and are being phased out over subsequent years. Norway includes 100% of untaxed reserves prior to 1992. In Sweden, untaxed reserves adjusted by the reciprocal of the standard tax rate are included in the calculation of book value prior to 1991. For U.S. corporations, common and common equivalent and fully diluted book values are shown, when available. For companies with more than one type of common/ordinary share, the book value is based on combined shares adjusted for the par value of the share type identified in field 06005 -Type of Share.

Alphabetical List of Field Definitions - B
Issue 6
© Thomson Financial 2003-2007 216 Confidential Information of Thomson Financial
This item is also available at the security level for 1987 and subsequent years and is shown per 1,000 shares for Brazilian companies. Footnotes:
A. Based on combined multiple shares B. No standard text C. No standard text D. No standard text F. No standard text G. No standard text H. Restated, to include acquisition or change in accounting policies K. Increase/decrease due to revaluation of assets M. Increase or decrease due to issuance of stock, redemption of debt/preferred stock or purchase of
treasury stock P. Based on common & common equivalent shares Q. Based on fully diluted shares
Book Value Per Share - Current Stock Data, Current Item, Field 05480
All Industries: BOOK VALUE PER SHARE - CURRENT represents the most recent book value available in our database. It is based on retained earnings and reflects the most recent earnings and dividends (for the same time period as the earnings) reported by the company. When interim data is not available it is the most recent book value reported in the last two years. For companies with more than one type of common/ordinary share, the book value is based on combined shares adjusted for the par value of the share type identified in field 6005 -Type of Share.
This item is also available at the security level and is shown per 1,000 shares for Brazilian companies.
Book Value - Mult Share 1, 2, 3, 4, 5, 6, 7 Stock Data, Annual Item; Fields 20045, 20145, 20245, 20345, 20445, 20545, 20645, respectively
All Industries: BOOK VALUE PER SHARE - MULT SHARE 1, 2, 3, 4, 5, 6, 7 represents the book value (proportioned common equity divided by outstanding shares) for each class of common/ordinary share. These items are shown per 1,000 shares for Brazilian companies. Refer to the definition for BOOK VALUE PER SHARE for specific information regarding the calculation of this item and applicable footnotes.
Book Value Per Share - 1 Yr Annual Growth Growth Rate, Annual Item; Field 08606
All Industries: (Current Year's Book Value Per Share / Last Year's Book Value Per Share - 1) * 100
This calculation uses restated data for last years values where available This item is also available at the security level for 1987 and subsequent years. Book Value Per Share Fiscal – 1 Yr Annual Growth Growth Rate, Annual Item; Field 08821 All Industries: ((Current Year’s Book Value Per Share Fiscal / Last Year’s Book Value Per Share Fiscal) - 1) * 100
This calculation is based on Worldscope field 05491 Book Value Per Share-Fiscal. When a restated time series exists for a prior year, last year’s book value per share is the restated rather than the original disclosed value. This item is also available at the security level and is only available in the annual original time series.

Alphabetical List of Field Definitions - B
Issue 6
© Thomson Financial 2003-2007 217 Confidential Information of Thomson Financial
Book Value Per Share – 3 Yr Annual Growth Growth Rate, Annual Item; Field 08609
All Industries: ((Current Year's Book Value Per Share / Book Value Per Share four years ago, reduced to a compound annual rate) – 1) * 100
This item is only available for ADRs and is generally not available prior to 1994.
Book Value Per Share - 5 Yr Annual Growth Growth Rate, Annual Item; Field 08610
All Industries: (Book Value Per Share / Book Value Per Share six years ago; reduced to compound annual rate) -1) * 100;
This item is also available at the security level for 1987 and subsequent years.
Brands, Patents – Accumulated Amortization Supplementary (Asset) Data, Annual Item; Field 02508
All Industries: BRANDS, PATENTS - ACCUMULATED AMORTIZATION represents the total accumulated amortization of brand names, trademarks and patents.
This item is available in the annual original and annual restated time series for detailed companies, full update.
Brands, Patents - Gross Supplementary (Asset) Data, Annual Item; Field 02509
All Industries: BRANDS, PATENTS - GROSS represents the gross value of brands, patents and trademarks.
This item is available in the annual original and annual restated time series for detailed companies, full update.
Brands, Patents - Net Supplementary (Asset) Data, Annual Item; Field 02507
All Industries: BRANDS, PATENTS - NET represents the net book value of brands, patents and trademarks.
This item is available in the annual original and annual restated time series for detailed companies, full update.
Broker & Financial Institution Loans Asset Data, Annual Item; Field 02269
Banks: BROKER & FINANCIAL INSTITUTION LOANS represent loans made to brokers and financial institutions.

Alphabetical List of Field Definitions - B
Issue 6
© Thomson Financial 2003-2007 218 Confidential Information of Thomson Financial
Buildings Asset Data, Annual Item; Field 18376
Industrials, Other Financials: BUILDINGS represent the architectural structure used in a business such as a factory, office complex or warehouse. It includes but is not restricted to:
Oil/drilling rigs Houses Revaluation of buildings
Footnotes: A. No standard text B. Includes land C. Net of Depreciation D. Includes Other
Business Description Descriptive Data, Current Item; Field 06091
All Industries: BUSINESS DESCRIPTION represents a short and concise description of a company's operations.
Business Description - Extended Descriptive Data, Current Item; Field 06092
All Industries: BUSINESS DESCRIPTION - EXTENDED represents a detailed description of a company's operations. It may include any or all of the following items:
1. A general comment concerning the company's type of business 2. The size of the company, if relevant 4. Number of offices, stores, restaurants, etc. 5. For a multi-bank holding company, the banks held 6. For a manufacturer, products and brands 7. For a retailer, store names 8. Sales breakdown, if available

Issue 6
© Thomson Financial 2003-2007 219 Confidential Information of Thomson Financial
C Capital Adequacy Ratio – Tier 1 Supplementary Data, Annual & Interim Item; Field 18157
Banks: CAPITAL ADEQUACY RATIO – TIER 1 represents the ratio of Tier 1 Capital to total risk-weighted assets, calculated in accordance with banking regulations and expressed as a percentage. Tier 1 Capital includes common shareholders’ equity and qualifying preferred stock, less goodwill and other adjustments.
This item is available in the annual time series and the quarterly, semi-annual and trimester interim time series. It is only available at the company level.
Capital Adequacy Ratio – Total Capital Supplementary Data, Annual & Interim Item; Field 18158
Banks: CAPITAL ADEQUACY RATIO – TOTAL CAPITAL represents the ratio of Total Capital to total risk-weighted assets, calculated in accordance with banking regulations and expressed as a percentage.
This item is available in the annual time series and the quarterly, semi-annual and trimester interim time series. It is only available at the company level.
Capital Changes See STOCK SPLIT/DIVIDEND RATIO
Capital Expenditures (Additions To Fixed Assets) Cash Flow Data, Annual Item; Field 04601
All Industries: CAPITAL EXPENDITURES represent the funds used to acquire fixed assets other than those associated with acquisitions. It includes but is not restricted to:
Additions to property, plant and equipment Investments in machinery and equipment
Footnotes: A. Worldwide B. Domestic companies C. Parent Company D. Worldwide (net) F. Parent Company (net) G. Domestic companies (net) H. Includes investment in shares I. Includes financial investments J Intangibles/ Other Assets cannot be separated K. Extracted from the Statement of Changes in Financial Position L. Taken from the Statement of Changes in Financial Position and includes investments M. Net figure (worldwide) taken from the Statement of Changes in Financial Position. N. Includes acquisitions P. Net of disposal

Alphabetical List of Field Definitions - C
Issue 6
© Thomson Financial 2003-2007 220 Confidential Information of Thomson Financial
Capital Expenditures Per Share Stock Data, Annual Item; Field 05505
All Industries: CAPITAL EXPENDITURES PER SHARE represent capital expenditures divided by the shares used to calculate earnings.
This item is shown per 1,000 shares for Brazilian companies.
Capital Expenditures % Gross Fixed Assets Asset Utilization Ratio, Annual item; Field 08411
All Industries: Capital Expenditures / Last Year’s Property, Plant and Equipment-Gross * 100
This calculation uses restated data for last year’s values where available
Capital Expenditures % Gross Fixed Assets - 5 Yr Avg Asset Utilization Ratio, Annual Item; Field 08415
All Industries: Arithmetic average of the last five years of Capital Expenditures % Gross Fixed Assets
Capital Expenditures % Sales Asset Utilization, Annual Item; Field 08421
Industrials, Other Financial Companies: Capital Expenditures / Net Sales or Revenues * 100
Capital Expenditures % Sales - 5 Yr Avg Asset Utilization, Annual Item; Field 08425
Industrials, Other Financial Companies: Arithmetic average of the last five years of Capital Expenditures % Sales
Capital Expenditures % Total Assets Asset Utilization Ratio, Annual Item; Field 08416
Banks: Capital Expenditures / Last Year’s (Total Assets - Customer Liabilities on Acceptances) * 100 Customer Liabilities on Acceptances only subtracted when included in Total Assets.
All Industries: Capital Expenditures / Last Year’s Total Assets * 100
Other Financial Companies: Capital Expenditures / Last Year’s (Total Assets - Custody Securities) * 100
This calculation uses restated data for last year’s values where available
Capital Expenditures % Total Assets - 5 Yr Avg Asset Utilization Ratio, Annual Item; Field 08420
Banks, Industrials, Other Financial Companies: Arithmetic average of the last five years of Capital Expenditures % Total Assets

Alphabetical List of Field Definitions - C
Issue 6
© Thomson Financial 2003-2007 221 Confidential Information of Thomson Financial
Capital Surplus Shareholders' Equity Data, Annual Item; Field 03481
All Industries: CAPITAL SURPLUS represents the amount received in excess of par value from the sale of common stock. Along with common stock it is the equity capital received from parties outside the company. For data updated subsequent to 11/15/91 excess of involuntary liquidation value over stated value of preferred stock is deducted. If there is not sufficient funds in the capital surplus account the remaining excess liquidation value is deducted from retained earnings. Prior to 11/15/91 excess of involuntary liquidation value over stated value of preferred stock was deducted from retained earnings.
Data for this field is generally not available prior to 1989. It includes but is not restricted to:
Monetary correction due to the revaluation of currencies for hyperinflation Footnotes:
C. Net of excess liquidation value of preferred stock
Capitalized Costs Supplementary (Income) Data, Annual Item; Field 18197
All Industries: CAPITALIZED COSTS represent expenses that are deferred and capitalized.
Data for this field is generally not available prior to 1992. It includes but is not restricted to:
Production capitalized Own work capitalized
Footnotes: A. No standard text
Capitalized Lease Obligations Liability Data, Annual Item; Field 03249
All Industries: CAPITALIZED LEASE OBLIGATIONS imply ownership. The leaseholder acquires essentially all the economic benefits as well as the risks of the leased property. In order to qualify as a capital lease it must meet the following criteria:
1. The lease transfers ownership to the lessee at the end of the lease term. 2. A bargain price option should exist. 3. The lease term is for 75% or more of the life of the property. 4. The present value equals or exceeds the fair market value of the property by 90%.
Industrial Revenue Bonds are included in capitalized lease obligations when it is clear that they are backed by a specific piece of property. If this is not clear then they are included in Long Term Debt Excluding Leases.
Footnotes: A. Includes current portion
Cash Asset Data, Annual Item; Field 02003
Industrials, Insurance, Other Financial Companies: CASH represents money available for use in the normal operations of the company. It is the most liquid of all of the company's assets.

Alphabetical List of Field Definitions - C
Issue 6
© Thomson Financial 2003-2007 222 Confidential Information of Thomson Financial
It includes but is not restricted to: Cash on hand Undeposited checks Cash in banks Checks in transit Cash in escrow Restricted cash Money orders Letters of credit Demand deposits (non-interest bearing) Mortgage bond proceeds held in escrow Drafts Post office checking/GIRO accounts Post office savings accounts Central bank deposits Bullion, bullion in transit Cashiers checks Credit card sales
Footnotes: A. Marketable securities are included B. Includes cash equivalents
Cash & Due From Banks Asset Data, Annual Item; Field 02004
Banks: CASH AND DUE FROM BANKS represents amounts due to the bank from other banks. It includes but is not restricted to:
Deposits (non-interest bearing) made by the bank in other banks for services rendered. Checks not yet cleared by the Federal Reserve Board Promissory notes Deposits in the Federal Reserve Bank
It includes for non-U.S. corporations: Vault cash Collections and exchanges Checks on matured bonds Postal Checking accounts Bills for Collection Reserves maintained with the central bank Recovery claims of federal and state authorities under the Currency Reform Act (Germany) Items in the course of collection Bills discounted
Footnotes: A. Includes assets due from banks
Cash & Equivalents See CASH & SHORT TERM INVESTMENTS
Alphabetical List of Field Definitions - C
Issue 6
© Thomson Financial 2003-2007 223 Confidential Information of Thomson Financial
Cash & Equivalents - Generic Supplementary (Asset) Data, Annual & Interim Item; Field 02005
All Industries: CASH & EQUIVALENTS – GENERIC represents Cash & Due from Banks for Banks, Cash for Insurance companies and Cash & Short Term Investments for all other industries.
This item is available in the annual time series and the quarterly, semi-annual and trimester interim time series. It is only available at the company level.
Cash & Securities % Total Deposits Liquidity Ratio, Annual Item; Field 15013
Banks: (Cash and Due from Banks + Investments-Total) / Deposits-Total * 100
Cash & Securities % Total Deposits- 5 Yr Avg Liquidity Ratio, Annual Item; Field 15016
Banks: Arithmetic average of the last five years of Cash & Securities % Deposits-Total
Cash & Short Term Investments Asset Data, Annual Item; Field 02001
Industrials, Other Financial Companies: CASH AND SHORT TERM INVESTMENTS represents the sum of cash and short term investments. It includes but is not restricted to:
Cash on hand Undeposited checks Cash in banks Checks in transit Cashier's checks Credit card sales Drafts Cash in escrow Restricted cash Money orders Letters of credit Demand deposits (non-interest bearing) Mortgage bond proceeds held in escrow Bullion, bullion in transit Short-term obligations of the U.S. Government Stocks, bonds, or other marketable securities listed as Short-Term Investments Time Certificates of Deposit Time deposits Eurodollar bank time deposits U.S. Government treasury bills Corporate Securities - stocks, bonds Municipal securities Commercial Paper

Alphabetical List of Field Definitions - C
Issue 6
© Thomson Financial 2003-2007 224 Confidential Information of Thomson Financial
Money market mutual fund shares Post Office checking/GIRO accounts (non-U.S. corporations only) Post Office savings accounts (non-U.S. corporations only) Post Office time deposits (non-U.S. corporations only) Central Bank Deposits Temporary Investments
It excludes: Commercial Paper issued by unconsolidated subsidiaries to Parent company (included in receivables) Amount due from sale of debentures (included in receivables) Checks written by the company but not yet deposited and charged to the company's bank account Promissory Notes
Footnotes: A. Includes non-liquid current assets D. Includes cash and securities held for regulatory purposes
Cash & Short Term Investments % Total Current Assets Liquidity Ratio, Annual Item; Field 08111
All Industries: (Cash & Equivalents / Current Assets-Total) * 100
Cash & Short Term Investments % Total Current Assets - 5 Yr Avg Liquidity Ratio, Annual Item; Field 08115
All Industries: Arithmetic average of the last five years of Cash & Equivalents % Current Assets-Total
Cash Dividend Coverage Ratio Leverage Ratio, Annual Item; Field 08246
Industrials, Other Financials: Funds from Operations / Common Dividends (Cash)
Cash Dividend Coverage Ratio - 5 Yr Avg Leverage Ratio, Annual Item; Field 08250
Industrials, Other Financials: Arithmetic average of the last five years of Cash Dividend Coverage Ratios
Cash Dividends Paid - Total Cash Flow Data, Annual Item; Field 04551
All Industries: CASH DIVIDENDS PAID - TOTAL represent the total common and preferred dividends paid to shareholders of the company. It excludes:
Dividends paid to minority shareholders Footnotes:
A. Included in other sources or uses B. Includes bonuses to directors C. Prior year's proposed dividend
Alphabetical List of Field Definitions - C
Issue 6
© Thomson Financial 2003-2007 225 Confidential Information of Thomson Financial
Cash Dividends % Cash Flow Leverage Ratio, Annual Item; Field 08906
All Industries: Cash Dividends Paid / Funds from Operations * 100
Cash Dividends % Cash Flow - 5 Yr Avg Leverage Ratio, Annual Item; Field 08910
All Industries: Arithmetic average of the last five years Cash Dividends % Cash Flow
Cash Earnings Return On Equity Profitability Ratio, Annual/Interim Item; Field 08381 Annual Time Series:
All Industries: Funds from Operations /Average of Last Year's and Current Year’s Common Equity * 100
Insurance Companies: If Common Equity is not available, Policyholders Equity is substituted
Exceptions:
Finland (95 and prior years) and Norway (93 and prior years): All Industries:
Funds from Operations /Average of Last Year’s and Current Year’s (Common Equity + Non-Equity Reserves) * 100
Sweden (88 and prior years): All Industries:
Funds from Operations / Average of Last Year’s and Current Year’s (Common Equity + Non-Equity Reserves * .5) * 100
Sweden (89): All Industries:
Funds from Operations / (Average of Last Year’s and Current Year’s Common Equity + Average of (Last Year’s Non Equity Reserve *.5 and Current Year’s Non-Equity Reserves * .7)) * 100
Sweden (90-92): All Industries:
Funds from Operations / Average of Last Year’s and Current Year’s (Common Equity + Non-Equity Reserves * .7) * 100
Sweden (93): All Industries:
Funds from Operations / Average of Last Year’s and Current Year’s Common Equity + Average of (Last Year’s Non-Equity Reserves * .7 and Current Year’s Non Equity Reserve) * 100
Sweden (94 and subsequent years): All Industries:
Funds from Operations / Average of Last Year's and Current Year’s Common Equity * 100 Interim Time Series:
All Industries: Funds from Operations / Average of Last Year's and Current Year’s Common Equity * 100

Alphabetical List of Field Definitions - C
Issue 6
© Thomson Financial 2003-2007 226 Confidential Information of Thomson Financial
Cash Earnings Return On Equity - 5 Yr Avg Profitability Ratio, Annual Item; Field 08385
All Industries: Arithmetic average of the last five years of Cash Earnings Return on Equity
Cash Flow See FUNDS FROM OPERATIONS
Cash Flow – Financing Activities – GAAP Supplementary (Cash Flow) Data, Annual Item; Field 06930
All Industries: CASH FLOW – FINANCING ACTIVITIES – GAAP represents the net cash receipts and disbursements resulting from reduction and/or increase in financing activities of a non-U.S. company adjusted to conform to U.S. Generally Accepted Accounting Principles. See definition for NET CASH FLOW – FINANCING for additional information.
This item is presented in U.S. dollars (converted at the company's fiscal year twelve month average exchange rate). It is only available for ADRs trading on the NYSE, ASE or NASDAQ and is generally not available prior to 1994.
Cash Flow – Investing Activities – GAAP Supplementary (Cash Flow) Data, Annual Item; Field 06940
All Industries: CASH FLOW – INVESTING ACTIVITIES – GAAP represents the net cash receipts and disbursements resulting from the investment activities of a non-U.S. company adjusted to conform to U.S. Generally Accepted Accounting Principles. See definition for NET CASH FLOW – INVESTING for additional information.
This item is presented in U.S. dollars (converted at the company's fiscal year twelve month average exchange rate). It is only available for ADRs trading on the NYSE, ASE or NASDAQ and is generally not available prior to 1994.
Cash Flow – Operating Activities – GAAP Supplementary (Cash Flow) Data, Annual Item; Field 06920
All Industries: CASH FLOW – OPERATING ACTIVITIES – GAAP represents the net cash receipts and disbursements resulting from the operations of a non-U.S. company adjusted to conform to U.S. Generally Accepted Accounting Principles. See definition for NET CASH FLOW – OPERATING ACTIVITIES for additional information.
This item is presented in U.S. dollars (converted at the company's fiscal year twelve month average exchange rate). It is only available for ADRs trading on the NYSE, ASE or NASDAQ and is generally not available prior to 1994.
Cash Flow From Operations – GAAP Supplementary (Cash Flow) Data, Annual Item; Field 06915
All Industries: CASH FLOW FROM OPERATIONS – GAAP represents the sum of net income and all non-cash charges or credits of a non-U.S. company adjusted to conform to U.S. Generally Accepted Accounting Principles. See definition for FUNDS FROM OPERATIONS for additional information.

Alphabetical List of Field Definitions - C
Issue 6
© Thomson Financial 2003-2007 227 Confidential Information of Thomson Financial
This item is presented in U.S. dollars (converted at the company's fiscal year twelve month average exchange rate). It is only available for ADRs trading on the NYSE, ASE or NASDAQ and is generally not available prior to 1994.
Cash Flow Per Share Stock Data, Annual Item; Field 05501
All Industries: CASH FLOW PER SHARE represents the cash earnings per share of the company. The numerator used for this calculation is Funds from Operations (Field 04201).
This item is also available at the security level for 1987 and subsequent years and is shown per 1,000 shares for Brazilian companies.
Cash Flow Per Share – Fiscal Stock Data, Annual Item; Field 05502
All Industries: CASH FLOW PER SHARE – FISCAL represents the cash earnings per share of the company at the end of the fiscal period. The numerator used in this calculation is Funds from Operations (Field 04201).
This item is populated for the quarterly, semi-annual, trimester, quarterly cumulative and trimester cumulative time series (for 1998 and subsequent years) and annual time series based on the availability of underlying data. It is shown per 1,000 shares for Brazilian companies.
Cash Flow Per Share - Current Stock Data, Current Item; Field 05510
All Industries: CASH FLOW PER SHARE - CURRENT represents the current cash earnings per share of the company. When interim earnings are available beyond the latest fiscal year Cash Flow Per Share-Current is estimated.
This item is also available at the security level and is shown per 1,000 shares for Brazilian companies.
Cash Flow/Sales (%) Profitability Ratio, Annual Item; Field 08311
All Industries: Funds from Operations / Net Sales or Revenues * 100
Cash Flow/Sales (%) - 5 Yr Avg Profitability Ratio, Annual Item; Field 08315
All Industries: Arithmetic average of the last five years of Cash Flow/Sales
Change In Inventory Supplementary (Expense) Data, Annual Item; Field 18196
All Industries: CHANGE IN INVENTORY represents the changes between the beginning and ending inventories that is charged to the cost of goods sold account.
Data for this field is generally not available prior to 1992 It includes but is not restricted to:

Alphabetical List of Field Definitions - C
Issue 6
© Thomson Financial 2003-2007 228 Confidential Information of Thomson Financial
Production for stock Footnotes:
A. No standard text
Changes In Cash and/Or Liquid Items Cash Flow Data, Annual Item; Field 04452
All Industries: CHANGES IN CASH AND/OR LIQUID ITEMS represents the change in cash and liquid assets from one year to the next. It is updated for foreign companies whose cash flow information is collected on the basis of Total Sources equal Total Uses. This item is always a component of Total Sources.
Data for this field is generally not available prior to 1989.
Claim & Loss Expense - Total Expense Data, Annual Item; Field 01079
Insurance Companies: CLAIM AND LOSS EXPENSE - TOTAL represents all expenses relating to the payment of policy benefits, including adjusters' fees, investigating expenses and other costs associated with settling claims.
Footnotes: A. Includes underwriting, policy acquisition costs and netted by claims recovered from reinsurers. B. Changes in long term insurance funds are included C. Includes some other reserve movement D. Maturity refund & dividend to policyholders reduced premium income and claims & loss expense
Claims & Claim Expense % Net Premiums Written Profitability Ratio, Annual Item; Field 15537
Insurance Companies: Claims & Loss Expense / Total Premiums Written * 100
Claims & Claims Expense % Net Premiums Written - 5 Yr Avg Profitability Ratio, Annual Item; Field 15540
Insurance Companies: Arithmetic average of the last five years of Claims & Claim Expense % Net Premiums Written
Claims Expense See CURRENT INSURANCE BENEFITS
Closely Held Shares Stock Data, Annual Item, Field 05475
All Industries: CLOSELY HELD SHARES represents shares held by insiders. For Japanese companies closely held represents the holdings of the ten largest shareholders. For companies with more than one class of common stock, closely held shares for each class is added together. It includes but is not restricted to:
Shares held by officers, directors and their immediate families Shares held in trust

Alphabetical List of Field Definitions - C
Issue 6
© Thomson Financial 2003-2007 229 Confidential Information of Thomson Financial
Shares of the company held by any other corporation (except shares held in a fiduciary capacity by banks or other financial institutions) Shares held by pension/benefit plans Shares held by individuals who hold 5% or more of the outstanding shares
It excludes: Shares under option exercisable within sixty days Shares held in a fiduciary capacity Preferred stock or debentures that are convertible into common shares
Footnotes: A. Includes options exercisable within 60 days B. Minimum number of closely held shares C. Maximum number of closely held shares D. Estimate based on listing of major shareholders F. No standard text
Closely Held Shares - Current Stock Data, Current Item; Field 05474
All Industries: CLOSELY HELD SHARES - CURRENT represents shares held by insiders. For Japanese companies closely held represents the holdings of the ten largest shareholders. For companies with more than one class of common stock, closely held shares for each class is added together. It includes but is not restricted to:
Shares held by officers, directors and their immediate families Shares held in trust Shares of the company held by any other corporation (besides shares held in a fiduciary capacity by banks or other financial institutions) Shares held by pension/benefit plans Shares held by individuals who hold more than 5% or more of the outstanding shares
It excludes: Shares under option exercisable within sixty days Shares held in a fiduciary capacity Shares held by insurance companies Preferred stock or debentures that are convertible into common shares
Footnotes: A. Includes options exercisable within 60 days B. Minimum number of closely held shares C. Maximum number of closely held shares D. Estimate based on listing of major shareholders F. No standard text
Closely Held Shares (%) Marketability Ratio, Annual Item; Field 08021
All Industries: (Number of Closely Held Shares / Common Shares Outstanding) * 100

Alphabetical List of Field Definitions - C
Issue 6
© Thomson Financial 2003-2007 230 Confidential Information of Thomson Financial
Combined Ratio Profitability Ratio, Annual Item; Field 15561
Insurance Companies: Loss Ratio + Expense Ratio
Combined Ratio - 5 Yr Avg Profitability Ratio, Annual Item; Field 15564
Insurance Companies: Arithmetic average of the last five years of Combined Ratios
Footnotes: A. Three year average B. Four year average
Commercial & Industrial Loans Asset Data, Annual Item; Field 02265
Banks: COMMERCIAL & INDUSTRIAL LOANS represent loans made to business and industry.
It includes but is not restricted to: Loan bills discounted (Japan) Commercial bills (Spain)
Footnotes: A. Includes consumer and instalment loans B. Includes financial and institutional loans
Commission and Fees Income Data, Annual Item; Field 01015
Banks, Other Financial Companies: COMMISSION AND FEES represent income generated from service charges to maintain a client's account. It includes but is not restricted to:
Checking account fees Service charges on deposit accounts Business service fees Processing service fees Credit card fees Loan servicing other fees Fees on guarantees and other securities (Spain) Commission/Fees for banking and related services
Footnotes: A. Net of provisions B. Other operating income is not delineated C. Includes commission from foreign exchange D. Net of expenses F. Net of expenses including tax
Alphabetical List of Field Definitions - C
Issue 6
© Thomson Financial 2003-2007 231 Confidential Information of Thomson Financial
Common/Ordinary Shareholders Stock Data, Current Item; Field 05450
All Industries: COMMON SHAREHOLDERS represent the number of common shareholders of the company at the date specified in field 05449 Date of Common Shareholders.
This field replaces the historic field 05451 Shareholders – Common.
Common Dividends (Cash) Cash Flow Data, Annual Item; Field 05376
All Industries: COMMON DIVIDENDS (CASH) represent the total cash common dividends paid on the company's common stock during the fiscal year, including extra and special dividends. If the company has ESOP preferred stock, the dividends paid will be the full amount shown on the cash flow. It excludes:
Dividends paid to minority shareholders Footnotes:
C. Includes dividend on treasury stock D. Cash preferred dividend may be included F. Dividend not paid on all shares G. Includes tax credit on common dividend
Common Equity Shareholders' Equity Data, Annual Item; Field 03501
All Industries: COMMON EQUITY represents common shareholders' investment in a company. It includes but is not restricted to:
Common stock value Retained earnings Capital surplus Capital stock premium Cumulative gain or loss of foreign currency translation, if included in equity per FASB 52 treatment Goodwill written off (field 03491) For Non-U.S. Corporations preference stock which participates with the common/ordinary shares in the profits of the company For Non-U.S. Corporations, if shareholders equity section is not delineated then the following additional accounts are included: Appropriated and unappropriated retained earnings Net income for the year, if not included in retained earnings (majority share of income is only included) Compulsory statutory/legal reserves without specific purpose Discretionary Reserves if other companies in that country include in their delineated shareholders' equity Negative Goodwill
It excludes: Common treasury stocks ESOP Guarantees Accumulated unpaid preferred dividends

Alphabetical List of Field Definitions - C
Issue 6
© Thomson Financial 2003-2007 232 Confidential Information of Thomson Financial
For U.S. Corporations, excess of involuntary liquidating value for outstanding preferred stock over stated value is deducted Redeemable common stock (treated as preferred) For Insurance companies, Unrealized gain/loss on marketable securities (field 03498)
Footnotes: A. Common shareholders' equity is not delineated B. Preferred stock cannot be separated C. Treasury stock appears on asset side and cannot be separated D. Minority interest in current year's income and/or the entire minority interest cannot be separated F. A small amount of special reserves cannot be separated (Germany) G. Common shareholders' equity is not delineated and is not comparable H. Policyholders equity cannot be separated I. Includes non-equity reserves and/or other provisions which cannot be separated J. Before appropriation on net income for the year K. Increase/Decrease due to revaluation of assets L. No standard text M. No standard text N. Adjusted to include foreign currency translation gains/losses O. Adjusted to exclude treasury stock P. Adjusted to include unappropriated net loss Q. Adjusted to include unrealized gain/loss on marketable securities R. Includes equity portion of untaxed reserves T. Includes consolidation adjustments
Common Equity (U.S.$) Supplementary Data, Annual Item; Field 07220
All Industries: COMMON EQUITY (U.S.$) represents the common equity of the company expressed in U.S. dollars. It is calculated by multiplying common equity by the fiscal year end exchange rate of the country the company is domiciled in. Refer to the definition of COMMON EQUITY for details regarding the equity used in this calculation.
Common Equity (U.S.$) - Current Supplementary Data, Annual Item; Field 07221
All Industries: COMMON EQUITY (U.S.$) - CURRENT represents the common equity of the company expressed in U.S. dollars. It is calculated by multiplying common equity by the most recent month end exchange rate of the country the company is domiciled in. Refer to the definition of COMMON EQUITY for details regarding the equity used in this calculation.
Common Equity – Fully Diluted Supplementary (Liability) Data, Annual Item; Field 03506
All Industries: COMMON EQUITY – FULLY DILUTED represents common shareholders investment in a company assuming all common stock equivalent values have been converted or exercised.
This item is generally available for 1997 and subsequent years.

Alphabetical List of Field Definitions - C
Issue 6
© Thomson Financial 2003-2007 233 Confidential Information of Thomson Financial
Common Equity – GAAP Supplementary (Liability) Data, Annual Item; Field 06795
All Industries: COMMON EQUITY – GAAP represents the common equity of a non-U.S. company adjusted to conform to U.S. Generally Accepted Accounting Principles. See definition for COMMON EQUITY for additional information.
This item is presented in U.S. dollars (converted at the company's fiscal year end exchange rate). It is only available for ADRs trading on the NYSE, ASE or NASDAQ and is generally not available prior to 1994.
Common Equity % Total Assets Leverage Ratio, Annual Item; Field 08241
All Industries: Common Equity / Total Assets * 100
Banks: Common Equity / (Total Assets - Customer Liabilities on Acceptances) * 100 Customer Liabilities on Acceptances only subtracted when included in Total Assets.
Insurance Companies: (Common Equity + Policyholders' Equity) / Total Assets * 100
Other Financial Companies: Common Equity / (Total Assets - Custody Securities) * 100
Exceptions: Finland (95 and prior years) and Norway (93 and prior years):
All Industries: (Common Equity + Non-Equity Reserves) / Total Assets * 100
Banks: (Common Equity + Non-Equity Reserves) / (Total Assets -Customer Liabilities on Acceptances) * 100 Customer Liabilities on Acceptances only subtracted when included in Total Assets.
Insurance: (Common Equity + Policyholders' Equity + Non-Equity Reserves) / Total Assets * 100
Other Financial Companies: (Common Equity + Non-Equity Reserves) / (Total Assets - Custody Securities) * 100
Sweden (88 and prior years): All Industries:
(Common Equity + Non-Equity Reserves * .5) / Total Assets *100 Banks:
(Common Equity + Non-Equity Reserves * .5) / (Total Assets - Customer Liabilities on Acceptances) * 100 Customer Liabilities on Acceptances only subtracted when included in Total Assets.
Insurance: (Common Equity + Policyholders' Equity +Non-Equity Re-serves *.5) / Total Assets * 100
Other Financial Companies: (Common Equity + Non-Equity Reserves * .5) / (Total Assets - Custody Securities) * 100
Sweden (89 to 93): All Industries:
(Common Equity + Non-Equity Reserves * .7) / Total Assets *100
Alphabetical List of Field Definitions - C
Issue 6
© Thomson Financial 2003-2007 234 Confidential Information of Thomson Financial
Banks: (Common Equity + Non-Equity Reserves * .7) / (Total Assets - Customer Liabilities on Acceptances) * 100 Customer Liabilities on Acceptances only subtracted when included in Total Assets.
Insurance: (Common Equity + Policyholders' Equity + Non-Equity Reserves * .7) / Total Assets * 100
Other Financial Companies: (Common Equity + Non-Equity Reserves * .7) / (Total Assets - Custody Securities) * 100
Sweden (94 and subsequent years): All Industries:
Common Equity / Assets * 100 Banks:
Common Equity / (Total Assets - Customer Liabilities on Acceptances) * 100 Customer Liabilities on Acceptances only subtracted when included in Total Assets.
Insurance: (Common Equity + Policyholders' Equity) / Total Assets * 100Other Financial Companies: Common Equity / (Total Assets - Custody Securities) * 100
Common Equity % Total Assets - 5 Yr Avg Leverage Ratio, Annual Item; Field 08245
All Industries: Arithmetic average of the last five years of Common Equity % Total Assets
Common Shares Outstanding Stock Data, Annual Item; Field 05301
All Industries: COMMON SHARES OUTSTANDING represent the number of shares outstanding at the company's year end. It is the difference between issued shares and treasury shares. For companies with more than one type of common/ordinary share, common shares outstanding represents the combined shares adjusted to reflect the par value of the share type identified in field 6005 - Type of Share.
This item is also available at the security level for 1987 and subsequent years. Footnotes:
A. Average number of shares outstanding in year AA. No standard text B. Equivalent number of shares based on par value C. Breakdown not available D. A small amount of treasury stock could not be separated F. Privately owned company G. Cooperative company/consortium/partnership H. ADS equivalent shares I. Stock data not specified in annual report J. Government owned company or majority owned by government K. Shares owned by government/institutions are not included L. Preferred shares may be included M. Increase/decrease due to reorganization of share capital N. Increase in shares is partially or totally due to new issues O. Equivalent number of shares based on par value and increase in shares is due to new issue P. Estimated based on uniform par value
Alphabetical List of Field Definitions - C
Issue 6
© Thomson Financial 2003-2007 235 Confidential Information of Thomson Financial
Q. Share capital has been changed not increasing/decreasing the number of shares R. Change of incorporation without affecting number of shares or share capital S. Number of shares represents parent company share capital which is different than group equity T. Trading units are at present 100 for all common shares and 1000 for all preferred shares V. Share capital has been changed not increasing/decreasing the number of shares and new issue W. Company is a mutual insurance company X. Registered and bearer shares cannot be separated Z. Combined multiple shares based on equivalent par value
Common Shares Outstanding - Current Stock Data, Current Item; Field 05302
All Industries: COMMON SHARES OUTSTANDING - CURRENT represents the most recent common shares outstanding available in the database. It is the difference between issued shares and treasury shares. For companies with more than one type of common/ordinary share, common shares represents the combined shares adjusted to reflect the par value of the share type identified in field 06005 -Type of Share.
This item is also available at the security level. Refer to the definition of COMMON SHARES OUTSTANDING for applicable footnotes.
Common Shares Outstanding - Current - Mult Share 1, 2, 3, 4, 5, 6, 7 Stock Data, Current Items; Fields 20020, 20120, 20220, 20320, 20420, 20520. 20620, respectively
All Industries: COMMON SHARES OUTSTANDING - MULT SHARE 1, 2, 3, 4, 5, 6, 7 represent the most recent common shares available in the database for each type of common/ordinary share of a company. It is the difference between issue shares and treasury shares. Refer to the definition of COMMON SHARES OUTSTANDING for applicable footnotes.
Common Shares Outstanding - Mult Share 1, 2, 3, 4, 5, 6, 7 Stock Data, Current Items; Fields 20040, 20140, 20240, 20340, 20440, 20540, 20640, respectively
All Industries: COMMON SHARES OUTSTANDING - MULT SHARE 1, 2, 3, 4, 5, 6, 7 represents the number of shares outstanding for each type of common/ordinary share at the company's fiscal year end. It is the difference between issued shares and treasury shares.
Data for these fields are generally not available prior to 1987. Refer to the definition of COMMON SHARES OUTSTANDING for applicable footnotes.
Common Shares Traded - Annual Stock Data, Annual Item; Field 05651
All Industries: COMMON SHARES TRADED - ANNUAL represents the number of shares of the company traded during the year. For the most recent year it is an annualized number of shares traded to date. This data is only available for U.S. and Canadian companies.
This item is also available at the security level for 1987 and subsequent years.

Alphabetical List of Field Definitions - C
Issue 6
© Thomson Financial 2003-2007 236 Confidential Information of Thomson Financial
Common Shares Traded – Weekly Stock Data, Annual Item; Weekly Time Series, Field 05652
All Industries: COMMON SHARES TRATED – WEEKLY represents the number of shares traded during the week represented by the weekly time series code/frequency on the record. Week 1 (W001 time series code/frequency) represents the first week of the calendar year that ends on a Friday (for example, W024 time series code/frequency in the year 2000 represents the week ending on Friday 06/16/2000.
This item is available at the security level and is available for 1999 and subsequent years.
Common Shares Used To Calculate Basic Earnings Per Share Stock Data, Annual Item; Field 05192
All Industries: COMMON SHARES USED TO CALCULATE BASIC EARNINGS PER SHARE represent the number of shares used by the company in computing its basic earnings per share, if reported by the company.
Common Shares Used To Calculate Earnings Per Share Stock Data, Annual Item; Field 05191
All Industries: COMMON SHARES USED TO CALCULATE EARNINGS PER SHARE represent the number of shares used by the company in computing its primary earnings per share, if reported by the company.
Common Shares Used To Calculate Fully Diluted Earnings Per Share Stock Data, Annual Item; Field 05194
All Industries: COMMON SHARES USED TO CALCULATE FULLY DILUTED EARNINGS PER SHARE represent the number of shares used by the company in computing its fully diluted earnings per share, if reported by the company.
Footnotes: A. No standard Text
Common Stock Shareholders' Equity Data, Annual Item; Field 03480
All Industries: COMMON STOCK represents the par or stated value of the issued common shares of the company. It includes the value of all multiple shares. Along with capital surplus it is the equity capital received from parties outside the company. It excludes excess involuntary liquidation value of preferred stock over stated value when common stock value and capital surplus are reported combined.
Data for this field is generally not available prior to 1989. Footnotes:
A. Includes capital surplus B. Includes monetarily correct capital C. Net of excess liquidation value of preferred stock
Alphabetical List of Field Definitions - C
Issue 6
© Thomson Financial 2003-2007 237 Confidential Information of Thomson Financial
Common Stocks Asset Data, Annual Item; Field 02228
Insurance Companies: COMMON STOCKS represent the insurance company's investment in common or ordinary shares of other corporations.
Common/Preferred Redeemed, Retired, Converted, Etc. Cash Flow Data, Annual Item; Field 04751
All Industries: COMMON & PREFERRED REDEEMED, RETIRED, CONVERTED, ETC. represents funds used to decrease the outstanding shares of common and/or preferred stock. It includes but is not restricted to:
Purchase of treasury shares Repurchase of stock Conversion of preferred stock into common stock Retirement of preferred stock Exchange of common stock for debentures
Company Founded Date Descriptive Date, Current Item; Field 18272
All Industries: COMPANY FOUNDED DATE represents the date the company was founded.
Company Name Descriptive Data, Current Item; Field 06001
All Industries: COMPANY NAME represents the legal name of the company as reported in the 10-K for U.S. companies and the annual report for non-U.S. companies.
This item is also available at the security level.
Company Name - Short Descriptive Data, Current Item; Field 06003
All Industries: COMPANY NAME - SHORT represents an abbreviated company name no longer than twenty characters.
This item is also available at the security level.
Company Status Descriptive Data, Current Item; Field 00000
All Industries: COMPANY STATUS provides the new CUSIP in the case of a CUSIP change for U.S. companies. Footnotes associated with this field may be available for any company, not just companies that have had CUSIP change. Specific information regarding the reason for inactive status, old company name for name changes, the date when the company became publicly held, treatment of multiple shares or other relevant information related to a company’s status is available as note link attached to this field.

Alphabetical List of Field Definitions - C
Issue 6
© Thomson Financial 2003-2007 238 Confidential Information of Thomson Financial
Footnotes: A. No standard text B. No standard text C. Name changed to D. No standard text N. Company Inactive
Comprehensive Income – Hedging Gain/Loss Supplementary (Equity) Data, Annual & Interim Item; Field 18852
All Industries: COMPREHENSIVE INCOME – HEDGING GAIN/LOSS represents accumulated gains/losses from hedges disclosed as comprehensive income.
This item is available in the annual time series and the quarterly, semi-annual and trimester interim time series. It is only available at the company level.
Comprehensive Income – Other Supplementary (Equity) Data, Annual & Interim Item; Field 18854
All Industries: COMPREHENSIVE INCOME – OTHER represents the cumulative amount of all the other comprehensive income accounts not otherwise defined.
This item is available in the annual time series and the quarterly, semi-annual and trimester interim time series. It is only available at the company level.
Comprehensive Income – Pension Liability Supplementary (Equity) Data, Annual & Interim Item; Field 18851
All Industries: COMPREHENSIVE INCOME – PENSION LIABILITY represents accumulated pension liabilities disclosed as comprehensive income.
This item is available in the annual time series and the quarterly, semi-annual and trimester interim time series. It is only available at the company level.
Comprehensive Income – Unearned Compensation Supplementary (Equity) Data, Annual & Interim Item; Field 18853
All Industries: COMPREHENSIVE INCOME – UNEARNED COMPENSATION represents accumulated unearned deferred compensation disclosed as comprehensive income.
This item is available in the annual time series and the quarterly, semi-annual and trimester interim time series. It is only available at the company level.
Computer Software Supplementary (Asset) Data, Annual & Interim Item; Field 18299
All Industries: COMPUTER SOFTWARE represents the capitalized costs of computer software under development. This item is updated when Computer Software is included within Other intangible assets, not within Property, plant & equipment.
This item is available in the annual time series and the quarterly, semi-annual and trimester interim time series. It is only available at the company level.
Alphabetical List of Field Definitions - C
Issue 6
© Thomson Financial 2003-2007 239 Confidential Information of Thomson Financial
Computer Software - Accumulated Amortization Supplementary (Asset) Data, Annual Item; Field 02517
All Industries: COMPUTER SOFTWARE - ACCUMULATED AMORTIZATION represents the total accumulated amortization of software.
This item is available in the annual original and annual restated time series for detailed companies, full update.
Computer Software - Gross Supplementary (Asset) Data, Annual Item; Field 02516
All Industries: COMPUTER SOFTWARE - GROSS represents the gross value of software.
This item is available in the annual original and annual restated time series for detailed companies, full update.
Computer Software And Equipment, Net Supplementary (Asset) Data, Annual Item; Field 18382
Industrials: COMPUTER SOFTWARE AND EQUIPMENT represents computer equipment and the information a computer uses to perform tasks; this can be either developed by a company or obtained by a company to perform its business. This item is updated when Computer Software and Equipment is included in Property, Plant & Equipment.
This item is only available in the annual time series at the company level.
Construction Work In Progress Supplementary (Asset) Data, Annual & Interim Item; Field 18390
Industrials, Other Financial Companies: CONSTRUCTION WORK IN PROGRESS represents the gross amount carried forward of capital work in progress and other tangible fixed assets under construction. This item is updated when Computer Software is included within Other intangible assets, not within Property, plant & equipment. It includes but is not restricted to:
Fixed assets installation in progress and in transit Prepayments and advances made for purchase of fixed assets
This item is available in the annual time series. It is also available in the quarterly, semi-annual and trimester interim time series for US companies. It is only available at the company level.
Consumer & Instalment Loans Asset Data, Annual Item; Field 02266
Banks: CONSUMER & INSTALLMENT LOANS represent loans made to consumers. It includes but is not restricted to:
Auto loans Home improvement loans Credit cards Home equity loans

Alphabetical List of Field Definitions - C
Issue 6
© Thomson Financial 2003-2007 240 Confidential Information of Thomson Financial
Personal Loans Debt consolidation loans Education loans Collateral loans (passbook and secured stock loans) Time sharing loans Public Sector notes (Spain)
Convertible Debt Liability Data, Annual Item; Field 18282
All Industries: CONVERTIBLE DEBT represents the total amount of a company's long term debt which can be converted into common or preferred stock at a set rate and at a set date.
Data for this field is generally not available prior to 1991.
Corporate Action See STOCK SPLIT/DIVIDEND RATIO
Corporate Stock Available For Sale Supplementary (Asset) Data, Annual Item; Field 18091
Banks: CORPORATE STOCK AVAILABLE FOR SALE represents the amount of common and preferred securities that cannot be classified as marketable equity securities.
Reporting required by U.S. FASB 115. Updated where available in 1993 and subsequent years. Footnotes:
A. No standard text
Cost Of Goods Sold Expense Data, Annual Item; Field 01051
Industrials, Other Financial Companies: For manufacturing companies, cost of goods sold represents specific or direct manufacturing cost of material and labor entering in the production of finished goods. Excise taxes and windfall profits taxes are not included. Most non-U.S. corporations do not disclose cost of goods sold. For merchandise companies, cost of goods sold represents the purchase price of items sold, as well as indirect overhead such as freight, inspecting, and warehouse costs. If a breakdown of total operating cost of non-manufacturing companies is not available then it is treated as cost of goods sold. For Utilities and Service Organizations, if there is no clear breakdown between cost of goods sold and Selling, General and Administrative Expenses, the total amount is updated to Cost of Goods Sold and noted that Selling General and Administrative Expenses are included. Service Organizations may refer to this as Cost of Services. It includes but is not restricted to:
Exploration expenses for extractive companies. Dry hole costs and impairment of unproved properties, when they cannot be included in depreciation. Employee benefits and other labor expenses such as salaries, pension expense, profit-sharing expense, insurance, etc. (If a company does not buy or make goods to sell, this expense is included in selling, general and administrative expense.) (field 01084) Engineering expense, if the company engages in engineering operations Cost of department lease income Cost of franchise sales

Alphabetical List of Field Definitions - C
Issue 6
© Thomson Financial 2003-2007 241 Confidential Information of Thomson Financial
Cost of rent & royalty income included in revenues For non-U.S. corporations, materials expense (field 18195), changes in inventory (field 18196), capitalized costs (field 18197) and that portion of salaries and benefits expense which are direct production costs
It excludes: Depreciation and amortization of intangibles charged to cost of goods sold. (If this amount is not available, then the total amount of depreciation and amortization is deducted) Directors' fees and remuneration Idle plant expense Moving expense Purchase discounts Value-added taxes General and service taxes For restaurants and fast food companies, other operating expenses like franchise, direct personnel and restaurant operating costs Excise taxes Windfall profit taxes
Footnotes: A. Includes depreciation (for U.S. corporations) B. Includes excise, windfall profit or value added tax C. Includes selling, general and administrative expense D. No standard text
Cost Of Goods Sold/Sales (%) Profitability Ratio, Annual Item; Field 08331
Industrials, Other Financial Companies: Cost of Goods Sold (excl Depreciation) / Net Sales or Revenues * 100
Cost Of Goods Sold/Sales (%) - 5 Yr Avg Profitability Ratio, Annual Item; Field 08335
Industrials, Other Financial Companies: Arithmetic average of the last five years of Cost of Goods Sold/Sales
Creditors (Trade) See ACCOUNTS PAYABLE
Cumulative Effect Of Accounting Change Supplementary (Income) Data, Annual Item; Field 18218
All Industries: CUMULATIVE EFFECT OF ACCOUNTING CHANGE represents the income statement account which shows the net of tax effect of changing from one accounting principle to another. It is the difference between the actual retained earnings using the old method at the beginning of the year and the retained earnings that would have been reported at the beginning of the year if the new method had been used in prior years.
Data for this field is generally not available prior to 1996 for non-U.S. companies, 1991 for U.S. companies and is shown per 1,000 shares for Brazilian companies. Footnotes:
A. No standard text

Alphabetical List of Field Definitions - C
Issue 6
© Thomson Financial 2003-2007 242 Confidential Information of Thomson Financial
Cumulative Effect Of Accounting Change Per Share Stock Data, Annual Item; Field 18202
All Industries: CUMULATIVE EFFECT OF ACCOUNTING CHANGE PER SHARE represents the per share amount of the cumulative effect of an accounting change reported on the income statement.
Data for this field is generally not available prior to 1996 for non-U.S. companies, 1991 for U.S. companies and is shown per 1,000 shares for Brazilian companies. Footnotes:
No standard text
Cumulative Goodwill Written Off Supplementary (Liability) Data; Annual Item; Field 18065
All Industries: CUMULATIVE GOODWILL WRITTEN OFF represents the total amount of goodwill written off against equity over a number of years.
Data for this field is generally not available prior to 1997. It includes but is not restricted to:
Negative goodwill Goodwill written back
Currency Of Analysis Supplementary Data; Annual Item; Field 06098
All Industries: CURRENCY OF ANALYSIS represents the ISO currency code of the Worldscope data of the company. This currency will always correspond to the currency of the country in which the company is followed on Worldscope (as indicated by Field 06027 Nation Code).
Currency Of Document Supplementary Data, Annual Item; Field 06099
All Industries: CURRENCY OF DOCUMENT represents the ISO currency code which corresponds to the currency in which the company's financial statements are presented. Currency of Document will usually coincide with the Currency of Analysis of the update. Currency of Analysis on Worldscope will always reflect the currency of country under which the company is followed on Worldscope as indicated by Field 06027 Nation Code.
Current Assets – GAAP Supplementary (Asset) Data, Annual Item; Field 06615
All Industrials: CURRENT ASSETS – GAAP represents the Current Assets of a non-U.S. company adjusted to conform to U.S. Generally Accepted Accounting Principles. See definition for CURRENT ASSETS – TOTAL for additional information.
This item is presented in U.S. dollars (converted at the company's fiscal year end exchange rate). It is only available for ADRs trading on the NYSE, ASE or NASDAQ and is generally not available prior to 1994.
Alphabetical List of Field Definitions - C
Issue 6
© Thomson Financial 2003-2007 243 Confidential Information of Thomson Financial
Current Assets - Total Asset Data, Annual Item; Field 02201
Industrials: CURRENT ASSETS - TOTAL represents cash and other assets that are reasonably expected to be realized in cash, sold or consumed within one year or one operating cycle. Generally, it is the sum of cash and equivalents, receivables, inventories, prepaid expenses and other current assets. For non-U.S. corporations, long term receivables are excluded from current assets even though included in net receivables.
Footnotes: A. Company does not report current assets; calculated C. Includes long term receivables D. Adjusted to exclude provision for bad debt F. Adjusted to excluded long term receivables G. Adjusted to excluded treasury stock J. Adjusted to exclude foreign currency translation gains/losses, deferred charges and/or debenture
redemption premiums K. Increased by prepayments on work in progress that has been treated as a current liability M. Adjusted to exclude deferred taxes N. Adjusted to include accrued income
Current Domestic Income Tax Expense Data, Annual Item; Field 18186
All Industries: CURRENT DOMESTIC INCOME TAX represents the total amount of tax liability due to the government where the company is domiciled. For U.K. companies relief for overseas taxation is netted against the tax expense.
Data for this field is generally not available prior to 1991. Footnotes:
A. May include foreign taxes
Current Exchange Rate (U.S. $) Supplementary Data, Current Item; Field 06103
All Industries: CURRENT EXCHANGE RATE (U.S. $) represents the exchange rate used to convert applicable current items into U.S. dollars.
This item is only available for ADRs.
Current Foreign Income Tax Expense Data, Annual Item; Field 18187
All Industries: CURRENT FOREIGN INCOME TAX represents the total amount of tax liability due to the governments of other countries where the company generates income but is not domiciled.
Data for this field is generally not available prior to 1991.

Alphabetical List of Field Definitions - C
Issue 6
© Thomson Financial 2003-2007 244 Confidential Information of Thomson Financial
Current Insurance Benefits Supplementary (Expense) Data, Annual & Interim Item; Field 01071
Insurance Companies: CURRENT INSURANCE BENEFITS represents the claims made by policyholders in settlement of losses incurred. For example, policy claims related to accident, health, property and casualty policies. This item is also referred to as Benefits and Claims, Benefits, Claims Losses & Settlement Expense or Claims Expense.
This item available in the annual time series and the quarterly, cumulative quarterly, semi-annual, trimester and cumulative trimester interim time series. It is only available at the company level.
Current Liabilities – GAAP Supplementary (Liability) Data, Annual Item; Field 06715
Industrials: CURRENT LIABILITIES – GAAP represents the Current Liabilities of a non-U.S. company adjusted to conform to U.S. Generally Accepted Accounting Principles. See definition for CURRENT LIABILITIES – TOTAL for additional information.
This item is presented in U.S. dollars (converted at the company's fiscal year end exchange rate). It is only available for ADRs trading on the NYSE, ASE or NASDAQ and is generally not available prior to 1994.
Current Liabilities - Total Liability Data, Annual Item; Field 03101
Industrials: CURRENT LIABILITIES - TOTAL represent debt or other obligations that the company expects to satisfy within one year. It includes but is not restricted to:
Accounts payable Short term debt Notes payable Current portion of long term debt All accrued expenses Other current liabilities Income taxes payable Dividends payable State franchise taxes Deferred credits Negative inventories (non-U.S. corporations) Obligations expected to be satisfied within four years (Germany)
Footnotes: A. Includes liabilities due in four years or less for Germany B. Company does not report current liabilities; calculated C. May include some long term debt F. Includes liabilities due in four years or less, may also include some long term debt G. No standard text O. Adjusted to include accrued expenses

Alphabetical List of Field Definitions - C
Issue 6
© Thomson Financial 2003-2007 245 Confidential Information of Thomson Financial
Current Portion Of Long Term Debt Supplementary (Liability) Data, Annual Item; Field 18232
All Industries: CURRENT PORTION OF LONG TERM DEBT represents the amount of long term debt due within the next twelve months.
Data for this field is generally not available prior to 1996 for non-U.S. companies and 1991 for U.S. companies. It includes but is not restricted to:
Current portion of capitalized leases It excludes:
Notes payable, arising from short term borrowings Current maturities of participation and entertainment obligation Contracts payable for broadcast rights Current portion of advances and production payments Bank overdrafts Advances from subsidiaries/associated companies (if the term of the loan is not known it is assumed that it is long term and is treated accordingly) Current portion of preferred stock of a subsidiary
Footnotes: A. No standard text C. Includes interest on capitalized leases
Current Ratio Liquidity Ratio, Annual Item; Field 08106
Industrials: Current Assets-Total / Current Liabilities-Total
Current Ratio - 5 Yr Avg Liquidity Ratio, Annual Item; Field 08110
All Industrials: Arithmetic average of the last five years of Current Ratios
CUSIP Descriptive Data, Current Item; Field 06004
All Industries: CUSIP represents the national security identification number for U.S. and Canadian companies. The first six digits of this number represent the company. The next two digits represent the security and the last digit is a check digit. CUSIPs are assigned by Standard and Poor's Corporation. For companies with more than one type of common/ordinary shares the CUSIP shown is for the share identified in field 06005 - Type of Share.
This item is also available at the security level.
CUSIP - Mult Share 1, 2, 3, 4, 5, 6, 7 Descriptive Data, Current Items; Fields 20006, 20106, 20206, 20306, 20406, 20506, 20606, respectively.
All Industries: CUSIP represents the national security identification number for U.S. and Canadian companies. The first six digits of this number represent the company. The next two digits represent the security and the last digit is a check digit. CUSIPs are assigned by Standard and Poor's Corporation.

Alphabetical List of Field Definitions - C
Issue 6
© Thomson Financial 2003-2007 246 Confidential Information of Thomson Financial
Custody Securities Asset Data, Annual Item; Field 02132
Other Financial Companies: CUSTODY SECURITIES represents securities borrowed from other financial institutions to be used as temporary collateral for loans. It is also securities deposited by the customers as collateral for margin transactions.
Footnotes: A. Includes acceptances and/or guarantees
Customer Liabilities On Acceptances (Assets) Asset Data, Annual Item; Field 02018
Banks: CUSTOMER LIABILITIES ON ACCEPTANCES, represents funds from customers (usually borrowed from the bank), which by agreement are deposited in the bank. The agreement is supported by a letter of credit, which allows the funds to be used only for a specific purpose. Upon accepting the letter of credit for payment the bank becomes liable for payment under the terms negotiated, while expecting the customer to supply funds for payment. This amount appears both on the asset & liability side of the balance sheet.
It includes but is not restricted to: Banker acceptances Letters of credit Bills of exchange Undrawn balances in third party credit accounts (Spain) Guarantees, acceptances, endorsements and other items serving as direct client substitutes Documentary credits and other short term trade related contingent obligations
Footnotes: A. Includes other guarantees B. Only a fraction of the customers liabilities for acceptances is disclosed
Customer Liabilities On Acceptances (Liabilities) Supplementary (Liability) Data, Annual Item; Field 03058
Banks: CUSTOMER LIABILITIES ON ACCEPTANCES represent the money the bank is expected to pay out under
terms negotiated in its bills of exchange and unmatured debt.
Issue 6
© Thomson Financial 2003-2007 247 Confidential Information of Thomson Financial
D Date Added To Product Supplementary Data, Annual Item; Field 11516
All Industries: DATE ADDED TO PRODUCT represents the date the company or security was added to the database. This field is in YYYYMMDD format. Companies added to the product prior to 6/10/92 have 19920609 in this field.
Date Of Common/Ordinary Shareholders Stock Data, Current Item; Field 05449
All Industries: DATE OF COMMON SHAREHOLDERS represents the date of the Common Shareholders.
Date Of Closely Held Shares Stock Data, Current Item; Field 05473
All Industries: DATE OF CLOSELY HELD SHARES represents the date of the Closely Held Shares - Current. This field is in YYYYMMDD format.
Date Of Common Shares Stock Data, Current Item; Field 05306
All Industries: DATE OF COMMON SHARES represents the date of the most recent Common Shares Outstanding - Current. This field is in YYYYMMDD format.
Date Of Current Price Stock Data, Current Item; Field 05009
All Industries: DATE OF CURRENT PRICE represents the date on which Market Price-Current was reported. This field is in YYYYMMDD format.
This item is also available at the security level.
Date Of Current Price - Mult Share 1, 2, 3, 4, 5, 6, 7 Stock Data, Current Items; Fields 20022, 20122, 20222, 20322, 20422, 20522, 20622, respectively
All Industries: DATE OF CURRENT PRICE - MULT SHARE 1, 2, 3, 4, 5, 6, 7 represents the date on which the current price was reported for each type of common/ordinary share of the company. This field is in YYYYMMDD format.
Alphabetical List of Field Definitions - D
Issue 6
© Thomson Financial 2003-2007 248 Confidential Information of Thomson Financial
Date Of Fiscal Period End (Formerly Date Of Fiscal Year End) Descriptive Data, Annual Item; Field 05350
All Industries: DATE OF FISCAL PERIOD END represents the year, month and day the company closes its books at the end of its fiscal period. E.G. On the annual time series this is the Fiscal year end date while on the quarterly time series this represents the Quarter period end date and similarly for other Time Series. This field is in YYYYMMDD format.
This item is also available at the security level for 1987 and subsequent years.
Date Of Incorporation Descriptive Date, Current Item; Field 18273
All Industries: DATE OF INCORPORATION represents the date the company was incorporated.
Date Of Last 12 Months Earnings Per Share Stock Data, Current Item; Field 05256
All Industries: DATE OF LAST TWELVE MONTHS EARNINGS represents the data date through which the last twelve months earnings is reflected. This field is in YYYYMMDD format.
Debt See TOTAL DEBT and/or SHORT TERM DEBT & CURRENT PORTION OF LONG TERM DEBT and/or LONG TERM DEBT
Decrease In Deposits Cash Flow Data, Annual Item; Field 04752
Banks: DECREASE IN DEPOSITS represents the decrease in deposits from one year to the next.
Data for this field is generally not available prior to 1991. It includes but is not restricted to: Net changes in deposits if a decrease Payments for maturing certificates of deposits Payments for maturing public fund deposits
Footnotes: A. Net of increase B. No standard text
Decrease In Investments Cash Flow Data, Annual Item; Field 04440
All Industries: DECREASE IN INVESTMENTS represents the investments sold during the accounting period of the company.
Data for this field is generally not available prior to 1989. It includes but is not restricted to: Proceeds from sale of portfolio investments Decrease in short term investments
Alphabetical List of Field Definitions - D
Issue 6
© Thomson Financial 2003-2007 249 Confidential Information of Thomson Financial
Decrease in marketable securities (if using FASB 95) Proceeds from maturities of investment securities
Footnotes: A. Decrease in investments, net of increases B. No standard text
Decrease In Loans Cash Flow Data, Annual Item; Field 04442
Banks: DECREASE IN LOANS represent the decrease in loans from one year to the next.
Data for this field is generally not available prior to 1991. It includes but is not restricted to:
Principal collected on loans and leases Proceeds from loan sales Net increase in customer loans if a decrease
Decrease/Increase In Inventories Cash Flow Data, Annual Item; Field 04826
Industrials, Other Financial Companies: DECREASE/INCREASE IN INVENTORIES represents the change in the amount of inventories from one year to the next as reported in the cash flow statement.
Data for this field is generally not available prior to 1992. Footnotes:
A. No standard text
Decrease/Increase In Other Assets/Liabilities Cash Flow Data, Annual Item; Field 04830
Industrials, Other Financial Companies: DECREASE/INCREASE IN OTHER ASSETS/LIABILITIES represents the change from one year to the next in balance sheet items related to operations besides decrease/increase in receivables, decrease/increase in inventories, increase/decrease in accounts payable, increase/decrease in income taxes payable and increase/decrease in accruals as reported in the cash flow statement.
Data for this field is generally not available prior to 1992. Footnotes:
A. No standard text
Decrease/Increase In Receivables Cash Flow Data, Annual Item; Field 04825
Industrials, Other Financial Companies: DECREASE/INCREASE IN RECEIVABLES represents the change in the amount of receivables net of allowances from one year to the next as reported in the cash flow statements.
Data for this field is generally not available prior to 1992. Footnotes:
A. No standard text
Alphabetical List of Field Definitions - D
Issue 6
© Thomson Financial 2003-2007 250 Confidential Information of Thomson Financial
Deferred Charges Asset Data, Annual Item; Field 02647
All Industries: DEFERRED CHARGES represent expenditures not recognized as a cost of doing business in the period in which it is incurred, but is carried forward to be written off in subsequent periods. This charge has been deferred because of an anticipated future benefit or it is an appropriated allocation of costs to future operations. A deferred charge has no physical substance and is a non-current asset because its life extends beyond one year.
Data for this field is generally not available prior to 1991. It includes but is not restricted to:
Start-up costs of putting into operation new, improved, or more efficient facilities Plant rearrangement and reinstallation costs Moving Costs Prepaid pension expense - long term Expenses for loans received Reorganization costs Other deferred charges Debt/Bond issuance costs Prepaid expenses - long term
It excludes: Tax loss carry forward Long term deferred or future tax benefits
Deferred Domestic Income Tax Expense Data, Annual Item; Field 18188
All Industries: DEFERRED DOMESTIC INCOME TAX represents the portion of deferred taxes due to the government of the country where the company is domiciled that have been expensed during the year.
Data for this field is generally not available prior to 1991. Footnotes:
A. May include foreign taxes
Deferred Foreign Income Tax Expense Data, Annual Item; Field 18189
All Industries: DEFERRED FOREIGN INCOME TAX represents the portion of deferred taxes that are due to the government of the country where the company generates income but is not domiciled that have been expensed during the year.
Data for this field is generally not available prior to 1991.
Deferred Income Liability Data, Annual Item; Field 03262
All Industries: DEFERRED INCOME represents income received but not yet reported as income. As the income is earned the deferred income is debited and the revenue is credited. Deferred income may also be referred to as deferred credit or deferred revenue.
Data for this field is generally not available prior to 1991.
Alphabetical List of Field Definitions - D
Issue 6
© Thomson Financial 2003-2007 251 Confidential Information of Thomson Financial
It includes but is not restricted to: Fees received but not yet earned (e.g. advertising fees) Revenue normally included in income but deferred until earned and matched with expenses (e.g. long term magazine subscriptions) Prepaid income
Deferred Income Taxes (Cash Flow) Cash Flow Data, Annual Item; Field 04199
Industrials, Other Financial Companies: DEFERRED TAXES represent the increase or decrease in the deferred tax liability from one year to the next resulting from timing differences in recognition of revenue and expenses for tax and financial reporting purposes. It is a non-cash charge.
Deferred Income Taxes & Investment Tax Credit Cash Flow Data, Annual Item; Field 04101
Industrials, Other Financial Companies: DEFERRED INCOME TAXES & INVESTMENT TAX CREDIT represent the increase or decrease in the deferred tax liability from one year to the next resulting from timing differences in recognition of revenues and expenses for tax and financial reporting purposes. Deferred taxes are shown net of investment tax credits.
Deferred Tax Asset - Current Supplementary (Asset) Data, Annual Item; Field 18165
All Industries: DEFERRED TAX ASSET – CURRENT represents all deferred tax disclosed as a current asset.
This item is only available in the annual time series at the company level.
Deferred Tax Liability - Current Supplementary (Liability) Data, Annual Item; Field 18166
All Industries: DEFERRED TAX LIABILITY – CURRENT represents all deferred tax disclosed as a current liability.
This item is only available in the annual time series at the company level.
Deferred Tax Liability In Untaxed Reserves Liability Data, Annual Item; Field 03257
All Industries: DEFERRED TAX LIABILITY IN UNTAXED RESERVES represents the portion of untaxed reserves that is allocable to deferred taxation. It is only applicable to Finnish, Norwegian and Swedish consolidated results for comparison purposes with other countries.
Data for this field is generally not available prior to 1990.
Deferred Taxes Liability Data, Annual Item; Field 03263
All Industries: DEFERRED TAXES represent the accumulation of taxes which are deferred as a result of timing differences between reporting sales and expenses for tax and financial reporting purposes.

Alphabetical List of Field Definitions - D
Issue 6
© Thomson Financial 2003-2007 252 Confidential Information of Thomson Financial
Data for this field is generally not available prior to 1989. It includes but is not restricted to: Investment tax credits
It excludes: Ad Valero taxes Taxes other than income taxes Tax loss carry forward reported as an asset General and service taxes
Footnotes: A. No standard text B. Adjusted to include deferred tax debits.
Deferred Taxes - Credit Liability Data, Annual Item; Field 18183
All Industries: DEFERRED TAXES - CREDIT represent the credit balance of the deferred tax account. It is the amount of tax charge that has been deferred to some future period.
Data for this field is generally not available prior to 1993. Footnotes:
A. No standard text
Deferred Taxes - DEBIT Asset Data, Annual Item; Field 18184
All Industries: DEFERRED TAXES - DEBIT represent the debit balance of the deferred tax account. It is the amount of tax benefit that has been deferred to some future period.
Data for this field is generally not available prior to 1993. Footnotes:
A. No standard text
Deferred Taxes – GAAP Supplementary (Liability) Data, Annual Item; Field 06773
All Industries: DEFERRED TAXES – GAAP represents the Deferred Taxes of a non-U.S. company adjusted to conform to U.S. Generally Accepted Accounting Principles. See definition for DEFERRED TAXES for additional information.
This item is presented in U.S. dollars (converted at the company's fiscal year end exchange rate). It is only available for ADRs trading on the NYSE, ASE or NASDAQ and is generally not available prior to 1994.
Demand Deposits Liability Data, Annual Item; Field 03011
Banks: DEMAND DEPOSITS represent non-interest bearing deposits in the bank that can be withdrawn without notice.
It includes but is not restricted to: Checking accounts Non-interest bearing deposits
Alphabetical List of Field Definitions - D
Issue 6
© Thomson Financial 2003-2007 253 Confidential Information of Thomson Financial
Negotiable Orders of Withdrawal (NOW accounts) Non-interest bearing negotiable orders of withdrawal (NINOW accts) Super NOW accounts Current and demand accounts - interest bearing (U.K.) Current and demand accounts - interest free (U.K.)
Footnotes: A. Includes some interbank deposits B. Includes time deposits
Demand Deposits % Total Deposits Other Ratio, Annual Item; Field 15179
Banks: Demand Deposits / Total Deposits * 100
Demand Deposits % Total Deposits - 5 Yr Avg Other Ratio, Annual Item; Field 15181
Banks: Arithmetic average of the last five years Demand Deposits % Total Deposits
Depositary Bank Supplementary Data, Current Item; Field 06095
All Industries: DEPOSITARY BANK represents the bank or other financial institution that keeps custody of the stock certificates represented by the ADR. This variable is alphanumeric. Each byte from left to right corresponds to an index in this list from the top down. An "X" in a given byte indicates that the bank is a depositary for the ADR.
BYTE BANK 1 BankAmerica International Trust 2 Bank of New York 3 Bankers Trust 4 Chase Manhattan Bank 5 Citibank 6 J.P. Morgan 7 Morgan Stanley Trust 8 Other
This item is only available for ADRs Footnotes:
A. No standard text
Deposits – GAAP Supplementary (Liability) Data, Annual Item; Field 06730
Banks, Other Financial Companies: DEPOSITS – GAAP represent total deposits of a non-U.S. company adjusted to conform to U.S. Generally Accepted Accounting Policies. See definition for DEPOSITS – TOTAL for additional information.
Alphabetical List of Field Definitions - D
Issue 6
© Thomson Financial 2003-2007 254 Confidential Information of Thomson Financial
This item is presented in U.S. dollars (converted at the company's fiscal year end exchange rate). It is only available for ADRs trading on the NYSE, ASE or NASDAQ and is generally not available prior to 1994.
Deposits - Total Liability Data, Annual Item; Field 03019
Banks, Other Financial Companies: DEPOSITS - TOTAL represent the value of money held by the bank or financial company on behalf of its customers.
For Banks: It includes but is not restricted to: Securities sold under resale agreement (field 03056)
Footnotes: A. Other short term liabilities included B. May include borrowings C. Includes due to banks
Depreciation Expense Data, Annual Item; Field 01148
Industrials, Other Financial Companies: DEPRECIATION represents the process of allocating the cost of a depreciable asset to the accounting periods covered during its expected useful life to a business. It is a non-cash charge for use and obsolescence of an asset.
Data for this field is generally not available prior to 1992. It includes but is not restricted to:
Depletion It excludes:
Amortization of intangible assets Amortization of deferred charges Write down of financial fixed assets or investments
Footnotes: A. No standard text
Depreciation (Balance Sheet) See ACCUMULATED DEPRECIATION
Depreciation and Depletion (Cash Flow) Cash Flow Data, Annual Item; Field 04049
All Industries: DEPRECIATION represents the process of allocating the cost of a depreciable asset to the accounting periods covered during its expected useful life to a business. It is a non-cash charge. DEPLETION represents the cost allocation for natural resources such as oil and mineral deposits. It includes dry-hole expense, abandonments and oil and gas property valuation provision for extractive companies. It is a non-cash charge. It excludes:
Depreciation on discontinued operations Footnotes:
A. Includes other items not requiring movement of funds B. Includes allocations to reserves/provisions

Alphabetical List of Field Definitions - D
Issue 6
© Thomson Financial 2003-2007 255 Confidential Information of Thomson Financial
C. Disposal of fixed assets may be included D. Amortization of discounts or premiums on financial instruments which cannot be separated F. Taken from the income statement G. Includes deferred taxes H. Includes depreciation on leased vehicles
Depreciation, Depletion and Amortization Expense Data, Annual Item; Field 01151
All Industries: DEPRECIATION represents the process of allocating the cost of a depreciable asset to the accounting periods covered during its expected useful life to a business. It is a non-cash charge for use and obsolescence of an asset. DEPLETION refers to cost allocation for natural resources such as oil and mineral deposits. AMORTIZATION relates to cost allocation for intangible assets such as patents and leasehold improvements, trademarks, bookplates, tools and film cost. Dry-hole Expense and Abandonments for extractive companies are included in Depreciation, Depletion & Amortization. If exploration expenses include dry-hole costs and impairment of unproved properties then it is included in Cost of Goods Sold. It excludes depreciation of discontinued operation It includes oil & gas property valuation provision If depreciation is not available from the income statement it is taken from the Statement in Changes in Financial Position.
Footnotes: A. Includes other items not requiring movement of funds. B. Includes allocation to reserves/provisions C. Disposal of fixed assets may be included D. Amortization of discounts or premiums on financial instruments cannot be separated G. Includes deferred taxes H. Includes depreciation on leased vehicles I. Excludes depreciation included in Cost of Goods Sold J. May include similar items
Depreciation, Depletion and Amortization (Cash Flow) Cash Flow Data, Annual Item; Field 04051
Industrials, Other Financial Companies: DEPRECIATION represents the process of allocating the cost of a depreciable asset to the accounting periods covered during its expected useful life to a business. DEPLETION refers to cost allocation for natural resources such as oil and mineral deposits. AMORTIZATION relates to cost allocation for intangible assets such as patents and leasehold improvements, trademarks, book plates, tools & film costs. This item includes dry-hole expense, abandonments and oil and gas property valuation provision for extractive companies. This item excludes amortization of discounts or premiums on financial instruments owned or outstanding and depreciation on discontinued operations.
This item is available in the annual time series and the quarterly, cumulative quarterly, semi-annual, trimester and cumulative trimester interim time series. It is only available at the company level. Footnotes:
A. Includes other items not requiring movement of funds B. Includes allocations to reserves C. Disposal of fixed assets may be included

Alphabetical List of Field Definitions - D
Issue 6
© Thomson Financial 2003-2007 256 Confidential Information of Thomson Financial
D. Amortization of discounts or premiums on financial instruments cannot be separated F. Taken from the income statement G. Includes deferred taxes H. Includes depreciation on leased vehicles
Development Costs – Accumulated Amortization Supplementary (Asset) Data, Annual Item; Field 02506
All Industries: DEVELOPMENT COSTS – ACCUMULATED AMORTIZATION represent total accumulated amortization of development costs.
This item is available in the annual original and annual restated time series for detailed companies, full update.
Development Costs - Gross Supplementary (Asset) Data, Annual Item; Field 02505
All Industries: DEVELOPMENT COSTS - GROSS represent the gross value of capitalized expenditure relating to development, including the development of new products. It includes capitalized research and development expenditures.
This item is available in the annual original and annual restated time series for detailed companies, full update.
Development Costs - Net Supplementary (Asset) Data, Annual Item; Field 02504
All Industries: DEVELOPMENT COSTS - NET represent the net book value of expenses related to the development of new products, for example, research and development expenditure.
This item is available in the annual original and annual restated time series for detailed companies, full update.
Disclosure Company Identifier Descriptive Data, Current Item; Field 06034
All Industries: DISCLOSURE COMPANY IDENTIFIER represents the identifier used by Disclosure to identify companies on their database. This item provides a link between Worldscope and Disclosure databases.
Discontinued Operations Income Data, Annual Item; Field 01505
All Industries: DISCONTINUED OPERATIONS represent the earnings of a division or segment of business that the company wants to discontinue or dispose of in the near future. Discontinued operations is treated as an extraordinary charge or credit when the per share amount includes disposal.
Footnotes: A. Includes disposal, treated as an extraordinary item B. Company reported only one per share figure for discontinued operations and disposal, therefore treated
as an extraordinary charge or credit
Alphabetical List of Field Definitions - D
Issue 6
© Thomson Financial 2003-2007 257 Confidential Information of Thomson Financial
Discontinued Operations Supplementary (Cash Flow) Data, Annual and U.S. Interim Item; Field 04054
All Industries: DISCONTINUED OPERATIONS represent cash flows from discontinued operations shown after tax outflows. This data is a component of Total Other Cash Flow (field 04151) in Operating Activities.
This item is available in the annual original and annual restated time series for detailed companies, full update. For U.S. companies, it is also available in the interim original and interim restated time series.
Discontinued Operations - Total Supplementary (Income) Data, Annual Item; Field 18200
All Industries: DISCONTINUED OPERATIONS - TOTAL represents the after tax gain or loss resulting from a company discontinuing a segment of its business.
Data for this field is generally not available prior to 1996 for non-U.S. companies and 1991 for U.S. companies. It includes but is not restricted to: After tax gain/loss from disposal of discontinued operations
Footnotes: A. No standard text
Discontinued Operations Per Share Stock Data, Annual Item; Field 05228
All Industries: DISCONTINUED OPERATIONS PER SHARE represents the after tax per share amount of the gain or loss from the portion of a company's operations that have been discontinued.
This item is shown per 1,000 shares for Brazilian companies. Data for this field is generally not available prior to 1992.
It excludes: Gain/Loss on disposal
Footnotes: A. No standard text
Discontinued Operations - Pre-tax Supplementary (Income) Data, Annual Item; Field 01269
All Industries: DISCONTINUED OPERATIONS - PRE-TAX represents the pre-tax gain or loss from a company's operations that have been discontinued.
Data for this field is generally not available prior to 1992. Footnotes:
A. No standard text B. Includes disposal
Discontinued Operations - Total (Per Share) Stock Data, Annual Item; Field 18205
All Industries: DISCONTINUED OPERATIONS - TOTAL (PER SHARE) represents the total after tax per share gain or loss resulting from a company discontinuing a segment of its business.

Alphabetical List of Field Definitions - D
Issue 6
© Thomson Financial 2003-2007 258 Confidential Information of Thomson Financial
Data for this field is generally not available prior to 1996 for non-U.S. companies, 1991 for U.S. companies and is shown per 1,000 shares for Brazilian companies.
It includes but is not restricted to: After tax per share gain/loss from disposal of discontinued operations
Footnotes: A. No standard text
Disposal Of Fixed Assets Cash Flow Data, Annual Item; Field 04351
All Industries: DISPOSAL OF FIXED ASSETS represent the amount a company received from the sale of property, plant and equipment.
It includes but is not restricted to: Net long term assets from discontinued operations Book value of property disposals Sale of property Proceeds from businesses sold Proceeds from significant asset dispositions Sale/leaseback of property, plant or equipment Liquidation of net assets of discontinued operations Retirements of property, plant and equipment
Footnotes: A. Includes sale of investments B. Net of additions
Dividend Income - Non-Operating Supplementary (Income) Item, Annual Item; Field 01268
All Industries: DIVIDEND INCOME represents the earnings received by the company from its investments.
Data for this field is generally not available prior to 1992. It includes but is not restricted to: Dividends from associates if shown on the income statement (i.e. subsidiaries on cost basis)
Footnotes: A. No standard text
Dividend Payout (% Earnings) – Total Dollar Leverage Ratio, Annual Item; Field 08256
All Industries: Common Dividends (Cash) / (Net Income before Preferred Dividends - Preferred Dividend Requirement) * 100
Footnotes: T. Dividends in excess of earnings

Alphabetical List of Field Definitions - D
Issue 6
© Thomson Financial 2003-2007 259 Confidential Information of Thomson Financial
Dividend Payout (% Earnings) – Total Dollar - 5 Yr Avg Leverage Ratio, Annual Item; Field 08260
All Industries: Sum of Common Dividends (Cash) for the last 5 years / (Sum of Net Income before Preferred Dividends - Preferred Dividend Requirement for the last five years) * 100
Footnotes: T. Dividends in excess of earnings
Dividend Payout Per Share (%) Stock Performance Ratio, Annual Item; Field 09504
All Industries: Dividends Per Share / Earnings Per Share * 100
This item is also available at the security level for 1987 and subsequent years.
Dividend Payout Per Share (%) - Current Stock Performance Ratio, Current Item; Field 09502
All Industries: Dividends Per Share-Last 12 months / Earnings Per Share-Last 12 months * 100
This item is also available at the security level.
Dividend Payout Per Share (%) - 5 Yr Avg Stock Performance Ratio, Annual Item; Field 09521
All Industries: Arithmetic average of the last five years of Dividends Per Share / Arithmetic average of the last five years of Earnings Per Share
This item is also available at the security level for 1987 and subsequent years.
Dividend Report Frequency Stock Data, Annual Item; Field 05100
All Industries: DIVIDEND REPORT FREQUENCY represents how often interim dividends are reported by the company during its fiscal year. This field contains the following codes, each representing a different reporting frequency:
Code Reporting Frequency 0 Irregular 1 Quarterly 2 Semi-Annual 4 Annual
Note: If there is no data in this field, a quarterly reporting frequency can be assumed. This item is also available at the security level for 1987 and subsequent years.
Dividend Yield - Avg High-Low Stock Performance Ratio, Annual Item; Field 09406
All Industries: Dividends Per Share / (Market Price-High + Market Price-Low / 2) * 100

Alphabetical List of Field Definitions - D
Issue 6
© Thomson Financial 2003-2007 260 Confidential Information of Thomson Financial
This item is also available at the security level for 1987 and subsequent years.
Dividend Yield - Close Stock Performance Ratio, Annual Item; Field 09404
All Industries: Dividends Per Share / Market Price-Year End * 100
This item is also available at the security level for 1987 and subsequent years.
Dividend Yield - Close - Mult Share 1, 2, 3, 4, 5, 6, 7 Stock Performance Ratio, Annual Items; Fields 20048, 20148, 20248, 20348,20448, 20548, 20648, respectively
All Industries: Dividends Per Share/Market Price-Year End * 100; for each type of common/ordinary share
Data for these fields is generally not available prior to 1987.
Dividend Yield - Current Stock Performance Ratio, Current Item; Field 09402
All Industries: Dividends Per Share-Last 12 Months / Market Price-Current * 100
Exceptions: U.S. and Canadian Companies:
Indicated Dividend Rate / Market Price-Current * 100 This item is also available at the security level.
Dividend Yield - Current - Mult Share 1, 2, 3, 4, 5, 6, 7 Stock Performance Ratio, Current Items; Fields 20028, 20128, 20228, 20328,20428, 20528, 20628, respectively
All Industries: Dividends Per Share-Last 12 Months/Market Price-Current * 100; for each type of common/ordinary share
Exceptions: U.S./Canadian Companies:
Indicated Dividend Rate/Market Price-Current * 100; for each type of common/ordinary share
Dividend Yield - High Stock Performance Ratio, Annual Item; Field 09400
All Industries: Dividends Per Share / Market Price-High * 100
This item is also available at the security level for 1987 and subsequent years.
Dividend Yield - Low Stock Performance Ratio, Annual Item; Field 09401
All Industries: Dividends Per Share / Market Price-Low * 100
This item is also available at the security level for 1987 and subsequent years.
Alphabetical List of Field Definitions - D
Issue 6
© Thomson Financial 2003-2007 261 Confidential Information of Thomson Financial
Dividend Yield – 3 Yr Avg –Close Stock Performance Ratio, Annual Item; Field 09432
All Industries: Sum of the last three years of Dividends Per Share / Sum of the last three years of Market Price-Year End * 100
This item is only available for ADRs and is generally not available prior to 1994.
Dividend Yield – 3 Yr Avg – Avg High - Low Stock Performance Ratio, Annual Item; Field 09433
All Industries: Sum of the last three years of Dividends Per Share / ((Sum of the last three years of Market Price-High + Sum of the last three years of Market Price-Low) /2) * 100
This item is only available for ADRs and is generally not available prior to 1994.
Dividend Yield – 3 Yr Avg – High Stock Performance Ratio, Annual Item; Field 09430
All Industries: Sum of the last three years of Dividends Per Share / Sum of the last three years of Market Price-High * 100
This item is only available for ADRs and is generally not available prior to 1994.
Dividend Yield – 3 Yr Avg – Low Stock Performance Ratio, Annual Item; Field 09431
All Industries: Sum of the last three years of Dividends Per Share / Sum of the last three years of Market Price-Low * 100
This item is only available for ADRs and is generally not available prior to 1994.
Dividend Yield - 5 Yr Avg - Close Stock Performance Ratio, Annual Item; Field 09421
All Industries: Dividends Per Share-Five Year Average / Market Price-Five Year Average Close * 100
This item is also available at the security level for 1987 and subsequent years.
Dividend Yield - 5 Yr Avg - High Stock Performance Ratio, Annual Item; Field 09411
All Industries: Dividends Per Share-Five Year Average / Market Price-Five Year Average High * 100
This item is also available at the security level for 1987 and subsequent years.
Dividend Yield - 5 Yr Avg - High-Low Stock Performance Ratio, Annual Item; Field 09426
All Industries: Dividends Per Share - Five Year / (Market Price-High 5 Year Average + Market Price-Low 5 Yr Average / 2) * 100
Alphabetical List of Field Definitions - D
Issue 6
© Thomson Financial 2003-2007 262 Confidential Information of Thomson Financial
This item is also available at the security level for 1987 and subsequent years.
Dividend Yield - 5 Yr Avg - Low Stock Performance Ratio, Annual Item; Field 09416
All Industries: Dividends Per Share-Five Year Average / Market Price-Five Year Average Low * 100
This item is also available at the security level for 1987 and subsequent years.
Dividends Supplementary (Cash Flow) Data, Annual and U.S. Interim Item; Field 04052
All Industries: DIVIDENDS represent dividends received from investments, including those received by the company from equity accounted investments. This data is a component of Total Other Cash Flow (field 04151) in Operating Activities.
This item is available in the annual original and annual restated time series for detailed companies, full update. For U.S. companies, it is also available in the interim original and interim restated time series.
Dividends (Cash) See CASH DIVIDENDS PAID - TOTAL and/or COMMON DIVIDENDS (CASH) and/or PREFERRED DIVIDENDS (CASH)
Dividends Payable Liability Data, Annual Item; Field 03061
All Industries: DIVIDENDS PAYABLE represents a dividend that has been declared but not yet paid.
Data for this field is generally not available prior to 1989. It excludes:
Dividends to minority shareholders of subsidiaries
Dividends Per Share Stock Data, Annual Item; Field 05101
All Industries: DIVIDENDS PER SHARE represents the total dividends per share declared during the calendar year for U.S. corporations and fiscal year for Non-U.S. corporations. It includes extra dividends declared during the year. Dividends Per Share is based on the "gross" dividend of a security, before normal withholding tax is deducted at a country's basic rate, but excluding the special tax credit available in some countries. This tax credit is due to the imputation system of corporate income tax under which shareholders are entitled to credit a certain proportion of the corporate income tax on distributed profits against the income tax imposed on the dividends received. For companies with more than one type of common/ordinary share, dividends per share is shown for the share type identified in field 6005 - Type of Share.
This item is also available at the security level for 1987 and subsequent years and is shown per 1,000 shares for Brazilian companies. Footnotes:
A. All items adjusted for stock splits or dividends B. Calculation based on average number of shares

Alphabetical List of Field Definitions - D
Issue 6
© Thomson Financial 2003-2007 263 Confidential Information of Thomson Financial
C. Derived per share figure from block figure D. Includes tax credit on common dividend F. Parent company data H. Cash preferred dividend may be included I. Alternate numbers given for gross dividend per share J. Gross dividend K. Includes extra cash dividends L. No standard text M. No standard text N. No standard text P. No standard text Q. No standard text R. Company does not disclose dividends per share, estimated based on company's definition S. Dividends not paid on all shares T. Twelve month dividends reflects revaluation of interim dividends to year end rate Y. Multiple shares exist - see type of shares Z. Dividends per share estimated using the total cash dividend divided by the number of shares
outstanding at year end
Dividends Per Share - Declaration Date - First, Second, Third and Fourth Quarter Stock Data, Annual Items; Fields 05910, 05911, 05912, 05913, respectively
All Industries: DIVIDENDS PER SHARE - DECLARATION DATE - FIRST, SECOND, THIRD AND FOURTH QUARTER represent the updating source and source date for the dividend.
Data for these fields is generally not available prior to 1992. This item is also available at the security level for 1992 and subsequent years.
Dividends Per Share - Ex-Dividend Date - First, Second, Third and Fourth Quarter Stock Data, Annual Items; Fields 05923, 05924, 05925, 05926, respectively
All Industries: DIVIDENDS PER SHARE - EX-DIVIDEND DATE - FIRST, SECOND, THIRD AND FOURTH QUARTER represent the date on or after which a buyer will no longer be entitled to the dividend declared on a share.
Data for these fields is generally not available prior to 1992. This item is also available at the security level for 1992 and subsequent years.
Dividends Per Share - Extra - First, Second, Third and Fourth Quarter Stock Data, Annual Items; Fields 05151, 05152, 05153, 05154, respectively
All Industries: DIVIDENDS PER SHARE - EXTRA - FIRST, SECOND, THIRD AND FOURTH QUARTER represents any extra dividends declared in each of the respective quarters. When a company declares five dividends in one year, the fourth quarter dividend is shown as an extra dividend - fourth quarter and the fifth dividend is shown as dividends per share - fourth quarter. Interim periods are determined on a calendar basis for U.S. corporations and on a fiscal basis for non-U.S. corporations. For companies with more than one type of common/ordinary share, dividends per share is shown for the share type identified in field 6005 - Type of Share.
This item is also available at the security level for 1987 and subsequent years and is shown per 1,000 shares for Brazilian companies.
Alphabetical List of Field Definitions - D
Issue 6
© Thomson Financial 2003-2007 264 Confidential Information of Thomson Financial
Dividends Per Share - Extra - Declaration Date - First, Second, Third and Fourth Quarter Stock Data, Annual Items; Fields 05935, 05936, 05937, 05938, respectively
All Industries: DIVIDENDS PER SHARE - EXTRA - DECLARATION DATE - FIRST, SECOND, THIRD AND FOURTH QUARTER represent the updating source and source date for extra dividends declared by the company.
Data for these fields is generally not available prior to 1992. This item is also available at the security level for 1992 and subsequent years.
Refer to the definition of DIVIDENDS PER SHARE - DECLARATION DATE - FIRST SECOND, THIRD AND FOURTH QUARTER for a list of source codes and sources.
Dividends Per Share - Extra - Ex-Dividend Date - First, Second, Third and Fourth Quarter Stock Data, Annual Items; Fields 05947, 05948, 05949, 05950, respectively
All Industries: DIVIDENDS PER SHARE - EXTRA - EX-DIVIDEND DATE - FIRST, SECOND, THIRD AND FOURTH QUARTER represent the date on or after which a buyer will no longer be entitled to the extra dividend declared on a share.
Data for these fields is generally not available prior to 1992. This item is also available at the security level for 1992 and subsequent years.
Dividends Per Share - Extra - Payable Date - First, Second, Third and Fourth Quarter Stock Data, Annual Items; Fields 05953, 05954, 05955, 05956, respectively
All Industries: DIVIDENDS PER SHARE - EXTRA - PAYABLE DATE - FIRST, SECOND THIRD AND FOURTH QUARTER represent the date the declared extra dividend is scheduled to be paid.
Data for these fields is generally not available prior to 1992. This item is also available at the security level for 1992 and subsequent years.
Dividends Per Share - Extra - Record Date - First, Second, Third and Fourth Quarter Stock Data, Annual Items; Fields 05941, 05942, 05943, 05944, respectively
All Industries: DIVIDENDS PER SHARE - EXTRA - RECORD DATE - FIRST, SECOND, THIRD AND FOURTH QUARTER represent the date on which a stockholder must officially own the shares in order to be entitled to the extra dividend.
Data for these fields is generally not available prior to 1992. This item is also available at the security level for 1992 and subsequent years.
Dividends Per Share - First, Second, Third and Fourth Quarter Stock Data, Annual Items; Fields 05121, 05122, 05123, 05124, respectively
All Industries: DIVIDENDS PER SHARE - FIRST, SECOND, THIRD AND FOURTH QUARTER represent dividends per share declared in each of the respective four quarters during the year. Interim periods are determined on a calendar basis for U.S. corporations and on a fiscal basis for non-U.S. corporations. For companies with more than one type of common/ordinary share, dividends per share is shown for the share type identified in field 6005 - Type of Share.
Alphabetical List of Field Definitions - D
Issue 6
© Thomson Financial 2003-2007 265 Confidential Information of Thomson Financial
These items are also available at the security level for 1987 and subsequent years and are shown per 1,000 shares for Brazilian companies. Footnotes:
L. No standard text M. No standard text N. No standard text P. No standard text Q. No standard text R. Indicated Rate T. Revalued to year end rates
Dividends Per Share – Fiscal Stock Data, Annual Item; Field 05110
All Industries: DIVIDENDS PER SHARE – FISCAL represents the total dividends per share declared during a company’s fiscal year. It includes extra dividends declared during the fiscal year but excludes special dividends.
This item is only available for U.S. companies. This item is also available at the security level for 1987 and subsequent years.
Dividends Per Share - Gross Stock Data, Annual Item; Field 05102
All Industries: DIVIDENDS PER SHARE - GROSS represent the total dividend, before normal withholding tax is deducted at a county's basic tax rate and including the special tax credit available in some countries. This tax credit is due to the imputation system of corporate income tax under which shareholders are entitled to credit a certain proportion of the corporate income tax on distributed profits against the income tax imposed on the dividends declared. This data is on a calendar year basis for U.S. corporations and a fiscal year basis for non-U.S. corporations. For companies with more than one type of common/ordinary share, dividends per share is shown for the share type identified in field 06005 - Type of Share.
Data for this field is generally not available prior to 1993. This item is also available at the security level for 1987 and subsequent years and is shown per 1,000 shares for Brazilian companies.
Dividends Per Share - Gross - First, Second, Third and Fourth Quarter Stock Data, Annual Items; Fields 05125, 05126, 05127, 05128, respectively
All Industries: DIVIDENDS PER SHARE - GROSS - FIRST, SECOND, THIRD AND FOURTH QUARTER represent the gross dividends declared in each of the respective interim periods during the year. Interim periods are determined on a calendar basis for U.S. corporations and on a fiscal basis for non-U.S. corporations.
Data for these fields are generally not available prior to 1993. These items are also available at the security level for 1987 and subsequent years and are shown per 1,000 shares for Brazilian companies.

Alphabetical List of Field Definitions - D
Issue 6
© Thomson Financial 2003-2007 266 Confidential Information of Thomson Financial
Dividends Per Share - Gross - Extra - First, Second, Third and Fourth Quarter Stock Data, Annual Items; Fields 05171, 05172, 05173, 05174, respectively
All Industries: DIVIDENDS PER SHARE - GROSS - EXTRA - FIRST, SECOND, THIRD AND FOURTH QUARTER represent the extra gross dividends declared in each of the respective interim periods during the year. Interim periods are determined on a calendar basis for U.S. corporations and on a fiscal basis for non-U.S. corporations. For companies with more than one type of common/ordinary share, dividends per share is shown for the share type identified in field 06005 - Type of Share.
Data for these fields are generally not available prior to 1993. These items are also available at the security level for 1987 and subsequent years and are shown per 1,000 shares for Brazilian companies.
Dividends Per Share - Gross - Special - First, Second, Third and Fourth Quarter Stock Data, Annual Items; Fields 05175, 05176, 05177, 05178, respectively
All Industries: DIVIDENDS PER SHARE - SPECIAL - EXTRA - FIRST, SECOND, THIRD AND FOURTH QUARTER represents the special gross dividends declared in each of the respective interim periods during the year. Interim periods are determined on a calendar basis for U.S. corporations and on a fiscal basis for non-U.S. corporations. For companies with more than one type of common/ordinary share, dividends per share is shown for the share type identified in field 06005 - Type of Share.
Data for these fields are generally not available prior to 1993. These items are also available at the security level for 1987 and subsequent years and are shown per 1,000 shares for Brazilian companies.
Dividends Per Share - Interim Stock Data; Annual Item; Field 05116
All Industries: DIVIDENDS PER SHARE (INTERIM) represents the regular dividends declared during a specific fiscal interim time period. It is based on the “gross” dividend of a security, before withholding tax is deducted at a country’s basic rate, but excluding the special tax credit available in some countries. This tax credit is due to the imputation system of corporate income tax under which shareholders are entitled to credit a certain proportion of the corporate income tax on distributed profits against the income tax imposed on the dividends received. For companies with more than one type of common ordinary share, dividends per share are shown for the share type identified in field 06005 Type of Share.
This item is populated for the quarterly, semi-annual and trimester time series. It is not available prior to 1998 and is shown per 1,000 shares for Brazilian companies. It is also available at the security level for 1998 and subsequent years.
Dividends Per Share - Interim – Extra Stock Data; Annual Item; Field 05112
All Industries: DIVIDENDS PER SHARE (INTERIM) – EXTRA represents any extra dividend declared during a specific fiscal interim time period. For companies with more than one type of common ordinary share, dividends per share are shown for the share type identified in field 06005 Type of Share.

Alphabetical List of Field Definitions - D
Issue 6
© Thomson Financial 2003-2007 267 Confidential Information of Thomson Financial
This item is populated for the quarterly, semi-annual and trimester time series. It is not available prior to 1998 and is shown per 1,000 shares for Brazilian companies. It is also available at the security level for 1998 and subsequent years.
Dividends Per Share - Interim – Special Stock Data; Annual Item; Field 05114
All Industries: DIVIDENDS PER SHARE (INTERIM) – SPECIAL represents unusual and infrequent distributions to shareholders that were declared during a specific fiscal interim time period. For companies with more than one type of common ordinary share, dividends per share are shown for the share type identified in field 06005 Type of Share.
This item is populated for the quarterly, semi-annual and trimester time series. It is not available prior to 1998 and is shown per 1,000 shares for Brazilian companies. It is also available at the security level for 1998 and subsequent years.
Dividends Per Share - Last 12 Months Stock Data, Current Item; Field 05145
All Industries: DIVIDENDS PER SHARE - LAST 12 MONTHS represents the sum of the interim dividends per share, including extras, declared by the company in the last twelve months. If interim data is not available it is the most recent dividends per share reported by the company in the last two years. For companies with more than one type of common/ordinary share, dividends per share is shown for the share type identified in field 06005 - Type of Share.
This item is also available at the security level and is shown per 1,000 shares for Brazilian companies.
Dividends Per Share - Last 12 Months - Mult Share 1, 2, 3, 4, 5, 6, 7 Stock Data, Current Items; Fields 20025, 20125, 20225, 20325, 20425, 20525, 20625, respectively
All Industries: DIVIDENDS PER SHARE - LAST 12 MONTHS - MULT SHARE 1, 2, 3, 4, 5, 6, 7 represents the sum of the interim dividends per share, including extras, declared by the company for each type of common/ordinary share in the last twelve months. If interim data is not available it is the most recent dividends per share reported by the company in the last two years.
This item is shown per 1,000 shares for Brazilian companies.
Dividends Per Share - Mult Share 1, 2, 3, 4, 5, 6, 7 Stock Data, Annual Items; Fields 20044, 20144, 20244, 20344, 20444, 20544, 20644, respectively
All Industries: DIVIDENDS PER SHARE - MULT SHARE 1, 2, 3, 4, 5, 6, 7 represents the total dividends per share declared for each type of common/ordinary share during the calendar year for U.S. corporations and fiscal year for non-U.S. corporations. It includes extra dividends declared during the year. These items are shown per 1,000 shares for Brazilian companies.
Data for these fields are generally not available prior to 1987. Refer to the definition of DIVIDENDS PER SHARE for more details and applicable footnotes.

Alphabetical List of Field Definitions - D
Issue 6
© Thomson Financial 2003-2007 268 Confidential Information of Thomson Financial
Dividends Per Share - Payable Date - First, Second, Third and Fourth Quarter Stock Data, Annual Items; Fields 05929, 05930, 05931, 05932, respectively
All Industries: DIVIDENDS PER SHARE - PAYABLE DATE - FIRST, SECOND THIRD AND FOURTH QUARTER represent the date the declared dividend is scheduled to be paid.
Data for these fields is generally not available prior to 1992. This item is also available at the security level for 1992 and subsequent years.
Dividends Per Share - Record Date - First, Second, Third and Fourth Quarter Stock Data, Annual Items, Fields 05917, 05918, 05919, 05920, respectively
All Industries: DIVIDENDS PER SHARE - RECORD DATE - FIRST, SECOND, THIRD AND FOURTH QUARTER represent the date on which a stockholder must officially own the shares in order to be entitled to the dividend.
Data for these fields is generally not available prior to 1992. This item is also available at the security level for 1992 and subsequent years.
Dividends Per Share - Special - Declaration Date - First, Second, Third and Fourth Quarter Stock Data, Annual Items; Fields 05965, 05966, 05967, 05968, respectively
All Industries: DIVIDENDS PER SHARE - SPECIAL - DECLARATION DATE - FIRST, SECOND, THIRD AND FOURTH QUARTER represent the updating source and source date for special dividends declared by the company.
Data for these fields is generally not available prior to 1992. This item is also available at the security level for 1992 and subsequent years.
Refer to the definition of DIVIDENDS PER SHARE - DECLARATION DATE - FIRST SECOND, THIRD AND FOURTH QUARTER for a list of source codes and sources.
Dividends Per Share - Special - Ex-Dividend Date - First, Second, Third and Fourth Quarter Stock Data, Annual Items; Fields 05959, 05960, 05961, 05962, respectively
All Industries: DIVIDENDS PER SHARE - SPECIAL - EX-DIVIDEND DATE - FIRST, SECOND, THIRD AND FOURTH QUARTER represent the date on or after which a buyer will no longer be entitled to the special dividend declared on a share.
Data for these fields is generally not available prior to 1992. This item is also available at the security level for 1992 and subsequent years.
Dividends Per Share - Special - Payable Date - First, Second, Third and Fourth Quarter Stock Data, Annual Items; Fields 05976, 05977, 05978, 05979, respectively
All Industries: DIVIDENDS PER SHARE - SPECIAL - PAYABLE DATE - FIRST, SECOND THIRD AND FOURTH QUARTER represent the date the declared special dividend is scheduled to be paid.
Data for these fields is generally not available prior to 1992. This item is also available at the security level for 1992 and subsequent years.

Alphabetical List of Field Definitions - D
Issue 6
© Thomson Financial 2003-2007 269 Confidential Information of Thomson Financial
Dividends Per Share - Special - Record Date - First, Second, Third and Fourth Quarter Stock Data, Annual Items; Fields 05970, 05971, 05972, 05973, respectively
All Industries: DIVIDENDS PER SHARE - SPECIAL - RECORD DATE - FIRST, SECOND, THIRD AND FOURTH QUARTER represent the date on which a stockholder must officially own the shares in order to be entitled to the special dividend.
Data for these fields is generally not available prior to 1992. This item is also available at the security level for 1992 and subsequent years.
Dividends Per Share - Special - First, Second, Third and Fourth Quarter Stock Data, Annual Item; Field 05155, 05156, 05157, 05158, respectively
All Industries: DIVIDENDS PER SHARE - SPECIAL - FIRST, SECOND, THIRD AND FOURTH QUARTER represents unusual and infrequent distributions to shareholders declared in each of the respective quarters. Interim periods are determined on a calendar basis for U.S. corporations and on a fiscal basis for non-U.S. corporations. For companies with more than one type of common/ordinary share, dividends per share is shown for the share type identified in field 06005 - Type of Share.
These items are also available at the security level for 1987 and subsequent years and are shown per 1,000 shares for Brazilian companies.
It includes but is not restricted to: Cash equivalent of a stock or debenture distribution Extra dividend payment if not the usual policy of the company Unusually high cash distributions Spin-off dividends Liquidating dividends
Footnotes: A. Special cash distribution B. Cash equivalent of spin-off C. Cash equivalent of right distribution, debentures or other
Dividends Per Share - 1 Yr Annual Growth Growth Rate, Annual/Interim Item; Field 08611
All Industries: Annual Time Series: (Current Year's Dividends Per Share / Last Year's Dividends Per Share - 1) * 100
This item is also available at the security level for 1987 and subsequent years. Interim Time Series:
(Current Year's Trailing 12 Months Dividends Per Share / Last Year's Trailing 12 Months Dividends Per Share - 1) * 100
This item is available in the Interim time series at the company and security level for 1998 and subsequent years.

Alphabetical List of Field Definitions - D
Issue 6
© Thomson Financial 2003-2007 270 Confidential Information of Thomson Financial
Dividends Per Share – 3 Yr Annual Growth Growth Rate, Annual Item; Field 08614
All Industries: ((Current Year's Dividends Per Share / Dividends Per Share four years ago, reduced to a compound annual rate) – 1) * 100
This item is only available for ADRs and is generally not available prior to 1994.
Dividends Per Share - 5 Yr Annual Growth Growth Rate, Annual Item; Field 08615
All Industries: ((Current Year's Dividends Per Share/Dividends Per Share six years ago, reduced to a compound annual rate) -1) *100
This item is also available at the security level for 1987 and subsequent years.
Dividends Per Share - 5 Yr Avg Stock Data, Annual Item; Field 05140
All Industries: DIVIDENDS PER SHARE - FIVE YEAR AVERAGE represents the average of the dividends declared in each of the last five years, including extras, if any. For U.S. corporations, five year average dividends are shown on a calendar basis. For non-U.S. corporations it is shown on a fiscal basis.
This item are also available at the security level for 1987 and subsequent years and is shown per 1,000 shares for Brazilian companies.
Dividends Per Share - 5 Yr Average - First, Second, Third and Fourth Quarters Stock Data, Annual Item; Fields 05141, 05142, 05143, 05144, respectively
All Industries: DIVIDENDS PER SHARE - 5 YR AVERAGE - FIRST, SECOND, THIRD AND FOURTH QUARTERS represent the average of the dividends declared in each respective quarter for the last five years including extras if any. Interim periods are determined on a calendar basis for U.S. corporations and on a fiscal basis for non-U.S. corporations.
These items are also available at the security level for 1987 and subsequent years and are shown per 1,000 shares for Brazilian companies.
Dividends Per Share - 12 Months - First, Second, Third and Fourth Quarter Stock Data, Annual Items; Fields 05131,05132,05133,05134, respectively
All Industries: DIVIDENDS PER SHARE - 12 MONTHS - FIRST, SECOND, THIRD AND FOURTH QUARTER represent the sum of the dividends declared in the last four quarters ending the respective quarter. Interim periods are determined on a calendar basis for U.S. corporations and on a fiscal basis for non-U.S. corporations.
These items are also shown at the security level for 1987 and subsequent years and are shown per 1,000 shares for Brazilian companies.

Alphabetical List of Field Definitions - D
Issue 6
© Thomson Financial 2003-2007 271 Confidential Information of Thomson Financial
Dividends Provided For Or Paid - Common Supplementary Data, Annual Item; Field 18192
All Industries: DIVIDENDS PROVIDED FOR OR PAID - COMMON represents the total value of the common dividends declared for the year. For most countries outside of the U.S. and Canada it includes the interim paid, if any, plus the proposed final dividend declared after the year end. If not reported separately, it is the dividend charged to retained earnings.
Data for this field is generally not available prior to 1992. Footnotes:
A. No standard text
Dow Jones Company Symbol Descriptive Data, Current Item; Field 06040
All Industries: DOW JONES COMPANY SYMBOL represents a unique symbol used to retrieve company profile and financial information within the Dow Jones News Retrieval informational databases.
DVFA Earnings Per Share Stock Data, Annual Item; Field 05240
All Industries: DVFA EARNINGS PER SHARE represent earnings per share as calculated in accordance with the formula laid down by the German Society of Investment Analysts. These earnings are calculated under the "DVFA method" which makes uniform adjustments to the published net profit of the company, allowing for better company comparisons.
Data for this field is only available for German companies.

Issue 6
© Thomson Financial 2003-2007 272 Confidential Information of Thomson Financial
E Earning Assets % Total Assets Profitability Ratio, Annual Item; Field 15587
Banks: (Total Investments + Loans-Net) / (Total Assets - Customer Liabilities on Acceptances) * 100 Customer Liabilities on Acceptances only subtracted when included in Total Assets
Other Financial Companies: (Total Investments + Loans-Net) / (Total Assets - Custody Securities) * 100
Earning Assets % Total Assets - 5 Yr Avg Profitability Ratio, Annual Item; Field 15590
Banks, Other Financial Companies: Arithmetic Average of the last five years Earnings Assets % Total Assets
Earning Assets % Total Available Funds Leverage Ratio, Annual Item; Field 15173
Banks: (Total Investments + Loans-Net) / (Total Capital + Deposits-Total) * 100
Insurance Companies: Total Investments / Total Capital * 100
Other Financial Companies: (Total Investments + Loans-Net + Receivables-Net) / (Deposits-Total + Total Capital) * 100
Earning Assets % Total Available Funds - 5 Yr Avg Leverage Ratio, Annual Item; Field 15176
Banks, Insurance, Other Financial Companies: Arithmetic average of the last five years Earning Assets % Total Available Funds
Earnings See NET INCOME
Earnings Before Interest and Taxes (EBIT) Supplementary (Income) Data, Annual Item; Field 18191
All Industries: EARNINGS BEFORE INTEREST AND TAXES (EBIT) represent the earnings of a company before interest expense and income taxes. It is calculated by taking the pre-tax income and adding back interest expense on debt and subtracting interest capitalized.

Alphabetical List of Field Definitions - E
Issue 6
© Thomson Financial 2003-2007 273 Confidential Information of Thomson Financial
Earnings Before Interest, Taxes and Depreciation (EBITDA) Supplementary (Income) Data, Annual Item; Field 18198
Banks, Industrials & Other Financial Companies: EARNINGS BEFORE INTEREST, TAXES AND DEPRECIATION (EBITDA) represent the earnings of a company before interest expense, income taxes and depreciation. It is calculated by taking the pre-tax income and adding back interest expense on debt and depreciation, depletion and amortization and subtracting interest capitalized.
Earnings Per ADR – GAAP Share Data, Annual Item; Field 05204
All Industries: EARNINGS PER ADR – GAAP represents the Earnings Per American Depositary Share of a non-U.S. company adapted to conform to U.S. Generally Accepted Accounting Principles. It is calculated by dividing Net Income – GAAP (converted to U.S. dollars at the fiscal year average exchange rate) by the shares used to calculate the company's earnings per share adjusted by the ADR ratio.
This item is presented in U.S. dollars (converted at the company's fiscal year average exchange rate). It is only available for ADRs trading on the NYSE, ASE or NASDAQ and is generally not available prior to 1994.
Earnings Per ADR – GAAP – Last 12 Months Stock Data, Current Item; Field 05257
All Industries: EARNINGS PER ADR – GAAP – LAST 12 MONTHS represents the sum of the interim Earnings Per Share – GAAP reported in the latest twelve months by the company. If interim data is not available it is the most recent Earnings Per Share - GAAP reported by the company in the last two years.
Earnings Per ADR – GAAP – 5 Yr Avg Stock Data, Annual Item; Field 05265
All Industries: EARNINGS PER ADR – GAAP – 5 YR AVG represent the average of the Earnings Per ADR – GAAP in each of the last five years. This item will not be available until 1998.
Earnings Per ADR – GAAP – 1 Yr Annual Growth Growth Rate, Annual Item; Field 08595
All Industries: (Current Year's Earnings Per ADR-GAAP / Last Year's Earnings Per ADR-GAAP – 1) * 100
This item is only available for ADRs trading on the NYSE, ASE or NASDAQ and is generally not available prior to 1995.
Earnings Per ADR – GAAP – 3 Yr Annual Growth Growth Rate, Annual Item; Field 08597
All Industries: ((Current Year's Earnings Per ADR-GAAP / Earnings Per ADR-GAAP four years ago, reduced to a compound annual rate) – 1) * 100
This item is only available for ADRs trading on the NYSE, ASE or NASDAQ and is generally not available prior to 1997.

Alphabetical List of Field Definitions - E
Issue 6
© Thomson Financial 2003-2007 274 Confidential Information of Thomson Financial
Earnings Per ADR – GAAP – 5 Yr Annual Growth Growth Rate, Annual Item; Field 08599
All Industries: ((Current Year's Earnings Per ADR-GAAP / Earnings Per ADR-GAAP six years ago, reduced to a compound annual rate) – 1) * 100
This item is only available for ADRs trading on the NYSE, ASE or NASDAQ and will not be available until 1999.
Earnings Per Share Stock Data, Annual Item; Field 05201
All Industries: EARNINGS PER SHARE represents the earnings for the 12 months ended the last calendar quarter of the year for U.S. corporations and the fiscal year for non-U.S. corporations. It is as reported by the company except for Sweden where the Standard Tax Method has been used where not reported by the company. Where earnings per share is reported for Swedish companies it may be after standard or actual tax. If earnings per share is not reported by the company, an estimate based on the respective country's generic definition has been computed. Preference stock has been included in the share base where it participates with the common/ordinary shares in the profits of the company. The following indicates the net earnings base used for earnings per share in each country. In Austria, earnings per share are based on profit after tax and minority interest but before transfers to equity reserves. Per share earnings for Belgium, Denmark, France, Germany, Italy, Japan, Netherlands, Switzerland and the United Kingdom reflect profit after tax, minority interest, and preferred dividends (except where preferred is included in share base), generally including pre-tax extraordinary items. United Kingdom earnings per share exclude extraordinary items prior to 1993. However with the adoption of FRS3 they are now included. Finland and Norway are based on profit before allocations to untaxed reserves (Finland all years; Norway prior to 1992 only) and before extraordinary items, after actual taxes, minority interest and preferred dividends. In Sweden profit before special adjustments and allocations to untaxed reserves but after an assumed 28% tax rate, (30% prior to 1994 and 50% in 1988 and previous years) and after minority interest and preferred dividends is used. Per share earnings in Spain are based on profit after Corporation tax and are generally after extraordinary items. Where Corporation tax is not reported it has been estimated. All other countries base earnings per share on profit after tax, minority interest and preferred dividends but before extraordinary items. For companies with more than one type of common/ordinary share, earnings per share is based on combined shares adjusted to reflect the par value of the share type identified in field 06005 - Type of Share.
This item is also available at the security level for 1987 and subsequent years and is shown per 1,000 shares for Brazilian companies. Footnotes:
AA. Earnings per share after full tax B. Includes or excludes extraordinary charge or credit D. No standard text F. Period includes strike G. Includes the effects of a change in accounting policies or tax laws M. Calculation based on year end outstanding shares O. No standard text P. Based on common and common equivalent shares Q. Based on fully diluted shares S. No standard text U. Based on average shares outstanding V. No standard text W. No standard text X. Estimated based on standard tax basis
Alphabetical List of Field Definitions - E
Issue 6
© Thomson Financial 2003-2007 275 Confidential Information of Thomson Financial
Y. Based on combined multiple shares Z. Earnings per share estimated using net income after preferred dividends divided by year end shares or
latest shares available
Earnings Per Share After Extraordinary Items Stock Data, Annual Item; Field 05230
All Industries: EARNINGS PER SHARE AFTER EXTRAORDINARY ITEMS represent earnings per share including extraordinary charges and credits. See definition for Earnings Per Share (field 05201) in the Worldscope Data Definition Guide for additional information.
Data for this field is available for 1992 and subsequent years and is per 1,000 shares for Brazilian companies.
Earnings Per Share - As Reported Stock Data, Annual Item; Field 18193
All Industries: EARNINGS PER SHARE - AS REPORTED represents the per share earnings amount reported by the company at the end of the fiscal period prior to any adjustments or recalculations.
This item is shown per 1,000 shares for Brazilian companies. Data for this field is generally not available prior to 1992. Footnotes:
A. No standard text
Earnings Per Share – Basic – Year Stock Data, Annual Item; Field 05210
All Industries: EARNINGS PER SHARE - BASIC - YEAR represents earnings based on average common shares for the 12 months ended the last calendar quarter for U.S. corporations and the fiscal year for non-U.S. corporations. For companies with more than one type of common/ordinary share, earnings per share is based on combined shares adjusted to reflect the par value of the share type identified in field 06005 Type of share.
This item is also available at the security level for 1987 and subsequent years and is shown per 1,000 shares for Brazilian companies. Refer to the definition of EARNINGS PER SHARE for additional information and applicable footnotes.
Earnings Per Share – Basic – First, Second, Third, and Fourth Quarter Stock Data, Annual Items; Fields 05211, 05212, 05213, 05214, respectively
All Industries: EARNINGS PER SHARE - BASIC - FIRST, SECOND, THIRD, AND FOURTH QUARTER represent earnings per share based on average shares reported by the company in each of the respective interim periods. Interim periods are determined on a calendar basis for U.S. corporations and on a fiscal basis for non-U.S. corporations. For companies with more than one type of common/ordinary share, basic earnings per share is based on combined shares adjusted to reflect the par value of the share type identified in field 06005 Type of share.
This item is also available at the security level for 1987 and subsequent years and is shown per 1,000 shares for Brazilian companies.
Alphabetical List of Field Definitions - E
Issue 6
© Thomson Financial 2003-2007 276 Confidential Information of Thomson Financial
Refer to the definition of EARNINGS PER SHARE - FIRST, SECOND, THIRD AND FOURTH QUARTER for applicable footnotes.
Earnings Per Share – Basic – Fiscal Stock Data, Annual Item; Field 10010
All Industries: EARNINGS PER SHARE - BASIC - FISCAL represents earnings based on average common shares for the 12 months ended the fiscal year end of a company. For companies with more than one type of common/ordinary share, earnings per share is based on combined shares adjusted to reflect the par value of the share type identified in field 06005 Type of share.
This item is only available for U.S. companies and securities. For securities, the history is back to 1987. For non-U.S. companies and securities please continue to use 05210.
Earnings Per Share – Continuing Operations – Fiscal Stock Data, Annual Item; Field 18208
All Industries: EARNINGS PER SHARE - CONTINUING OPERATIONS – FISCAL represents the per share amount earned by a company before any gain/loss adjustment for discontinued operations and extraordinary items but after preferred dividends are deducted.
Data for this field is generally not available prior to 1996 for non-U.S. companies, 1991 for U.S. companies and is shown per 1,000 shares for Brazilian companies. Footnotes:
A. No standard text
Earnings Per Share – First, Second, Third and Fourth Quarter Stock Data, Annual Items; Fields 05221,05222, 05223, 05224, respectively
All Industries: EARNINGS PER SHARE - FIRST, SECOND, THIRD AND FOURTH QUARTER represent the earnings reported by the company in each of the respective interim periods. Interim periods are determined on a calendar basis for U.S. corporations and on a fiscal basis for non-U.S. corporations. For companies with more than one type of common/ordinary share, earnings per share is based on combined shares adjusted to reflect the par value of the share type identified in field 06005 - Type of Share.
This item is also available at the security level for 1987 and subsequent years and is shown per 1,000 shares for Brazilian companies. Footnotes:
A. Estimate based on net profit before minority interest divided by latest shares available AA. Earnings per share after full tax B. Includes or Excludes extraordinary charge or credit C. Estimate based on pre-tax profit before minority interest adjusted for standard tax rate divided by latest
shares available D. No standard text F. Period includes strike G. Includes the effects of a change in accounting policies or tax laws O. No standard text S. No standard text T. Based on profits after transfer to reserves V. No standard text
Alphabetical List of Field Definitions - E
Issue 6
© Thomson Financial 2003-2007 277 Confidential Information of Thomson Financial
W No standard text
Earnings Per Share – Fiscal Period End Stock Data, Annual Item; Field 05202
All Industries: EARNINGS PER SHARE - FISCAL PERIOD END represent the earnings for the 12 months ending the fiscal year of the company.
This item is also available at the security level for 1987 and subsequent years and is shown per 1,000 shares for Brazilian companies.
Refer to the definition of EARNINGS PER SHARE for more details.
Earnings Per Share (EPS) – Fiscal Period – Basic Stock Data, Annual Item; Field 18420
All Industries: EARNINGS PER SHARE (EPS) - FISCAL PERIOD - BASIC represents net income after preferred dividends divided by average common shares outstanding for the period. Net income is stated before extraordinary items disclosed by the company after tax. Exceptional/extraordinary items reported pre-tax are included. The equivalent annual time series item is 05210- Earnings Per Share (EPS) – Basic. Please note, for US companies, field 05210 is presented on a calendar basis.
This item is populated for quarterly, semi-annual and trimester time series only. It is not available prior to 1998 and is shown per 1,000 shares for Brazilian companies. It is also available at the security level.
Earnings Per Share (EPS) – Fiscal Period – Basic – Revised Stock Data, Annual Item; Field 18469
All Industries: EARNINGS PER SHARE (EPS) - FISCAL PERIOD - BASIC – REVISED represents revised net income after preferred dividends divided by average common shares outstanding for the period or revised shares where applicable. Net income is stated before extraordinary items disclosed by the company after tax. Exceptional/extraordinary items reported pre-tax are included. Revised fields are use to account for the restatement of values due to changes that occur during the year or if, for example, reported Q1 and reported Q2 do not add to the reported 6 months value. These fields are also used for hyper-inflationary countries such as Mexico, where the reported interim amounts will not add to the annual figures.
This item is populated for quarterly, semi-annual and trimester time series only. It is not available prior to 2001 and is shown per 1,000 shares for Brazilian companies. It is also available at the security level.
Earnings Per Share (EPS) – Fiscal Period – Fully Diluted Stock Data, Historic Item, Interim Time Series; Field 18440
All Industries:
EARNINGS PER SHARE (EPS) - FISCAL PERIOD - FULLY DILUTED represents net income after preferred dividends adjusted to reflect conversion of common stock equivalents divided by average common shares and common share equivalents for the period. Net income is stated before extraordinary items disclosed by the company after tax. Exceptional/extraordinary items reported pre-tax are included. The equivalent annual time series item is 05290- Earnings Per Share (EPS) –Fully Diluted Year. Please note, for US companies, field 05290 is presented on a calendar basis.
This item is populated for quarterly, semi-annual and trimester time series only. It is not available prior to 1998 and is shown per 1,000 shares for Brazilian companies. It is also available at the security level.

Alphabetical List of Field Definitions - E
Issue 6
© Thomson Financial 2003-2007 278 Confidential Information of Thomson Financial
Earnings Per Share (EPS) – Fiscal Period – Fully Diluted – Revised Stock Data, Annual Item; Field 18470
All Industries:
EARNINGS PER SHARE (EPS) - FISCAL PERIOD - FULLY DILUTED – REVISED represents revised net income after preferred dividends adjusted to reflect conversion of common stock equivalents divided by revised average common shares and common share equivalents shares outstanding for the period or revised shares where applicable. Net income is stated before extraordinary items disclosed by the company after tax. Exceptional/extraordinary items reported pre-tax are included. Revised fields are use to account for the restatement of values due to changes that occur during the year or if, for example, reported Q1 and reported Q2 do not add to the reported 6 months value. These fields are also used for hyper-inflationary countries such as Mexico, where the reported interim amounts will not add to the annual figures.
This item is populated for quarterly, semi-annual and trimester time series only. It is not available prior to 2001 and is shown per 1,000 shares for Brazilian companies. It is also available at the security level.
Earnings Per Share – Fully Diluted – Fiscal Stock Data, Annual Item; Field 10030
All Industries: EARNINGS PER SHARE – FULLY DILUTED - FISCAL represents earnings based on average common shares for the 12 months ended the fiscal year end of a company. For companies with more than one type of common/ordinary share, earnings per share is based on combined shares adjusted to reflect the par value of the share type identified in field 06005 Type of share.
This item is only available for U.S. companies and securities. For securities, the history is back to 1987. For non-U.S. companies and securities please continue to use 05290.
Earnings Per Share Growth (Period Vs. Year Ago) Growth Rate, Annual Item; Field 08699
All Industries: (Earnings Per Share for the fiscal period / Last Year’s Earnings Per Share for the same time period – 1) * 100.
This item is populated for the quarterly, semi-annual, trimester, quarterly cumulative and trimester cumulative time series based on the availability of underlying data. It is not available prior to 1998.
Earnings Per Share (EPS) – Included Extra Cr/Chg After Tax – Basic Stock Data, Annual Item; Field 18426
All Industries: EARNINGS PER SHARE (EPS) - INCLUDED EXTRA CR/CHG AFTER TAX – BASIC represents the after tax per share amount of an as reported pre-tax non-recurring gain/loss included in EPS- Fiscal-Basic (field 18420). If not reported, it is calculated based on average basic shares for the period.
This item is populated for quarterly, semi-annual and trimester time series only. It is not available prior to 1998 and is shown per 1,000 shares for Brazilian companies. It is also available at the security level.
Earnings Per Share (EPS) Included Extra Cr/Chg After Tax – Basic - Revised Stock Data, Annual Item; Field 18453
All Industries: EARNINGS PER SHARE (EPS) INCLUDED EXTRA CR/CHG AFTER TAX - BASIC – REVISED represents the after tax per share amount of an as reported non-recurring gain/loss net of taxes included

Alphabetical List of Field Definitions - E
Issue 6
© Thomson Financial 2003-2007 279 Confidential Information of Thomson Financial
in EPS- Fiscal-Basic (18469). If not reported, it is calculated based on average basic shares for the period or revised shares where applicable. Revised fields are use to account for the restatement of values due to changes that occur during the year or if, for example, reported Q1 and reported Q2 do not add to the reported 6 months value. These fields are also used for hyper-inflationary countries such as Mexico, where the reported interim amounts will not add to the annual figures.
This item is populated for quarterly, semi-annual and trimester time series only. It is not available prior to 2001 and is shown per 1,000 shares for Brazilian companies. It is also available at the security level.
Earnings Per Share (EPS) – Included Extra Cr/Chg After Tax – Fully Diluted Stock Data, Annual Item; Field 18446
All Industries: EARNINGS PER SHARE (EPS) - INCLUDED EXTRA CR/CHG AFTER TAX - FULLY DILUTED represents the fully diluted after tax per share amount of an as reported pre-tax non-recurring gain/loss net of taxes included in EPS- Fiscal-Fully Diluted (field 18440). If not reported, it is calculated based on average fully diluted shares for the period.
This item is populated for quarterly, semi-annual and trimester time series only. It is not available prior to 1998 and is shown per 1,000 shares for Brazilian companies. It is also available at the security level.
Earnings Per Share (EPS) Included Extra Cr/Chg After Tax – Fully Diluted - Revised Stock Data, Annual Item; Field 18454
All Industries: EARNINGS PER SHARE (EPS) INCLUDED EXTRA CR/CHG AFTER TAX - FULLY DILUTED – REVISED represents the fully diluted after tax per share amount of an as reported pre-tax non-recurring gain/loss net of taxes included in EPS- Fiscal-Fully Diluted-Revised (item 18470). If not reported, it is calculated based on average fully diluted shares for the period or revised shares where applicable. Revised fields are use to account for the restatement of values due to changes that occur during the year or if, for example, reported Q1 and reported Q2 do not add to the reported 6 months value. These fields are also used for hyper-inflationary countries such as Mexico, where the reported interim amounts will not add to the annual figures.
This item is populated for quarterly, semi-annual and trimester time series only. It is not available prior to 2001 and is shown per 1,000 shares for Brazilian companies. It is also available at the security level.
Earnings per share (EPS) – included extra pre-tax cr/chg – basic Stock Data, Annual Item; Field 18428
All Industries: EARNINGS PER SHARE (EPS) - INCLUDED EXTRA PRE-TAX CR/CHG – BASIC represents the pre-tax per share amount of non-recurring gain/loss included in EPS- Fiscal- Basic (field 18420). If not reported, it is calculated based on average basic shares for the period. This field is only updated if the company has not disclosed the associated tax amount of exceptional gain/loss and as such field 18426 could not be populated.
This item is populated for quarterly, semi-annual and trimester time series only. It is not available prior to 1998 and is shown per 1,000 shares for Brazilian companies. It is also available at the security level.
Earnings Per Share (EPS) Included Extra Pre-tax Cr/Chg – Basic - Revised Stock Data, Annual Item; Field 18457
All Industries: EARNINGS PER SHARE (EPS) INCLUDED EXTRA PRE-TAX CR/CHG - BASIC – REVISED represents the pre-tax per share amount of an as reported pre-tax non-recurring gain/loss included in EPS- Fiscal- Basic (18469). If not reported, it is calculated based on average basic shares or revised shares where

Alphabetical List of Field Definitions - E
Issue 6
© Thomson Financial 2003-2007 280 Confidential Information of Thomson Financial
applicable for the period. Only updated if the associated tax amount of an exceptional profit/loss has not been disclosed. Revised fields are use to account for the restatement of values due to changes that occur during the year or if, for example, reported Q1 and reported Q2 do not add to the reported 6 months values. These fields are also used for hyper-inflationary countries such as Mexico, where the reported interim amounts will not add to the annual figures.
This item is populated for quarterly, semi-annual and trimester time series only. It is not available prior to 2001 and is shown per 1,000 shares for Brazilian companies. It is also available at the security level.
Earnings Per Share (EPS) Included Extra Pre-tax Cr/Chg – Fully Diluted Stock Data, Annual Item; Field 18448
All Industries: EARNINGS PER SHARE (EPS) INCLUDED EXTRA PRE-TAX CR/CHG - FULLY DILUTED represents the pre-tax fully diluted per share amount of nonrecurring gain/loss included in EPS- Fiscal- Fully Diluted (field 18440). If not reported, it is calculated based on average diluted shares for the period. This field is only updated if the company has not disclosed the associated tax amount of exceptional gain/loss and as such field 18446 could not be populated.
This item is populated for quarterly, semi-annual and trimester time series only. It is not available prior to 1998 and is shown per 1,000 shares for Brazilian companies. It is also available at the security level.
Earnings Per Share (EPS) Included Extra Pre-tax Cr/Chg – Fully Diluted - Revised Stock Data, Annual Item; Field 18458
All Industries: EARNINGS PER SHARE (EPS) INCLUDED EXTRA PRE-TAX CR/CHG - FULLY DILUTED – REVISED represents the pre-tax per share amount of non-recurring gain/loss included in EPS- Fiscal- Fully Diluted revised (18470). If not reported, it is calculated based on average diluted shares for the period or revised shares where applicable. Only updated if the associated tax amount of an exceptional profit/loss has not been disclosed. Revised fields are use to account for the restatement figures or if, for example, reported Q1 and reported Q2 do not add to the reported 6 months. These fields are also used for hyper-inflationary countries such as Mexico, where the reported interim amounts will not add to the annual figures.
This item is populated for quarterly, semi-annual and trimester time series only. It is not available prior to 2001 and is shown per 1,000 shares for Brazilian companies. It is also available at the security level.
Earnings Per Share Including Extraordinary Items - Fiscal Stock Data, Annual Item; Field 18209
All Industries: EARNINGS PER SHARE INCLUDING EXTRAORDINARY ITEMS - FISCAL represents the per share amount of net income earned by a company including any gain or loss from extraordinary items.
Data for this field is generally not available prior to 1996 for non-U.S. companies, 1991 for U.S. companies and is shown per 1,000 shares for Brazilian companies.
It includes but is not restricted to: Gain/Loss from cumulative effect of accounting change Gain/Loss from early extinguishment of debt Gain/Loss from discontinued operations when it is treated as an extraordinary item
Earnings Per Share - Last 12 Months Stock Data, Current Item; Field 05255
All Industries: EARNINGS PER SHARE - LAST 12 MONTHS represents the sum of the interim earnings reported in the latest twelve months by the company. If interim data in not available it is the most recent earnings per share reported by the company in the last two years.

Alphabetical List of Field Definitions - E
Issue 6
© Thomson Financial 2003-2007 281 Confidential Information of Thomson Financial
For companies with more than one type of common/ordinary share, earnings per share is adjusted to reflect the par value of the share type identified in field 06005 - Type of Share.
This item is also available at the security level and is shown per 1,000 shares for Brazilian companies.
Earnings Per Share - Last 12 Months - Mult Share 1, 2, 3, 4, 5, 6, 7 Stock Data, Current Items; Fields 20024, 20124, 20224, 20324, 20424, 20524, 20624, respectively
All Industries: EARNINGS PER SHARE - LAST 12 MONTHS - MULT SHARE 1, 2, 3, 4, 5, 6, 7 represents the sum of the interim earnings reported for each type of common/ordinary share in the latest twelve months. If interim data is not available it is the most recent earnings per share reported in the last two years.
This item is shown per 1,000 shares for Brazilian companies.
Earnings Per Share - Mult Share 1, 2, 3, 4, 5, 6, 7 Stock Data, Annual Items; Fields 20043, 20143, 20243, 20343, 20443, 20543, 20643, respectively
All Industries: EARNINGS PER SHARE - MULT SHARE 1, 2, 3, 4, 5, 6, 7 represent the earnings for each type of common/ordinary share for the 12 months ended the last calendar quarter of the year for U.S. corporations and the fiscal year for non-U.S. corporations.
Data for these fields are generally not available prior to 1987 and are shown per 1,000 shares for Brazilian companies Refer to the definition of EARNINGS PER SHARE for more details and applicable footnotes.
Earnings Per Share - Report Date - First, Second, Third and Fourth Quarter Stock Data, Annual Items; Fields 05901, 05902, 05903, 05904, respectively
All Industries: EARNINGS PER SHARE - REPORT DATE - FIRST, SECOND, THIRD AND FOURTH QUARTER represents the source date for the earnings reported by the company.
Data for these fields is generally not available prior to 1992. This item is also available at the security level for 1992 and subsequent years.
Earnings Per Share - 12 Months - First, Second, Third and Fourth Quarter Stock Data, Annual Items; Fields 05251, 05252, 05253, 05254, respectively
All Industries: EARNINGS PER SHARE - 12 MONTHS - FIRST, SECOND, THIRD AND FOURTH QUARTER represent the sum of the earnings reported for the last four quarters, ending the respective quarter. Interim periods are determined on a calendar basis for U.S. corporations and on a fiscal basis for non-U.S. corporations.
This item is also available at the security level for 1987 and subsequent years and is shown per 1,000 shares for Brazilian companies.
Earnings Per Share - 1 Yr Annual Growth Growth Rate, Annual/Interim Item; Field 08601
All Industries: Annual Time Series: (Current Earnings Per Share / Last Year's Earnings Per Share - 1) * 100

Alphabetical List of Field Definitions - E
Issue 6
© Thomson Financial 2003-2007 282 Confidential Information of Thomson Financial
This calculation uses restated data for last years values where available It is available at the security level for 1987 and subsequent years.
Interim Time Series: (Current Trailing 12 Months Earnings Per Share / Last Year's Trailing 12 Months Earnings Per Share - 1) * 100
This calculation uses restated data for last years values where available It is available in the Interim time series at the company and security level for 1998 and subsequent years. Earnings Per Share Fiscal – 1 Yr Annual Growth Growth Rate, Annual Item; Field 08816 All Industries: ((Current Year’s EPS fiscal / Last Year’s EPS fiscal) - 1) * 100 This calculation is based on Worldscope field 05202 Earnings per Share – Fiscal and uses restated data for last years values where available This item is also available at the security level and is only available in the annual original time series.
Earnings Per Share – 3 Yr Annual Growth Growth Rate, Annual Item; Field 08604
All Industries: ((Current Year's Earnings Per Share / Earnings Per Share four years ago, reduced to a compound annual rate) – 1) * 100
Earnings Per Share - 5 Yr Annual Growth Growth Rate, Annual Item; Field 08605
All Industries: ((Current Year's Earnings Per Share / Earnings Per Share six years ago, reduced to a compound annual rate) - 1) * 100
This item is also available at the security level for 1987 and subsequent years.
Earnings Per Share - 5 Yr Avg Stock Data, Annual Item; Field 05260
All Industries: EARNINGS PER SHARE - 5 YR AVG represents the average of the earnings per share reported by the company in each of the last five years. For U.S. corporations five year average earnings are shown on a calendar basis. For non-U.S. corporations they are shown on a fiscal basis.
This item is available at the security level for 1987 and subsequent years and is shown per 1,000 shares for Brazilian companies.
Earnings Per Share - 5 Yr Avg - First, Second, Third and Fourth Quarter Stock Data, Annual Items; Fields 05261, 05262, 05263, 05264, respectively
All Industries: EARNINGS PER SHARE - 5 YR AVG - FIRST, SECOND, THIRD AND FOURTH QUARTER represent the average of the earnings per share reported for each respective quarter for the last five years. Interim periods are determined on a calendar basis for U.S. corporations and on a fiscal basis for non-U.S. corporations.

Alphabetical List of Field Definitions - E
Issue 6
© Thomson Financial 2003-2007 283 Confidential Information of Thomson Financial
These items are also available at the security level for 1987 and subsequent years and are shown per 1,000 shares for Brazilian companies.
Earnings Report Frequency Stock Data, Annual Item; Field 05200
All Industries: EARNINGS REPORT FREQUENCY represents how often interim earnings are reported by the company during its fiscal year. This field contains the following codes, each representing a different reporting frequency:
Code Reporting Frequency 1 Quarterly 2 Semi-Annual 3 Three fixed interims 4 Annual 0 Missing Quarter/Quarters
Note: If there is no data in this field, a quarterly reporting frequency can be assumed. If the reporting frequency is 3 or 0 refer to NUMBER OF MONTHS for the number of months that the earnings are reported for. This item is also available at the security level for 1987 and subsequent years.
Earnings Yield - Avg High-Low Stock Performance Ratio, Annual Item; Field 09206
All Industries: Earnings Per Share / (Market Price-High + Market Price-Low / 2) * 100
This item is also available at the security level for 1987 and subsequent years.
Earnings Yield - Close Stock Performance Ratio, Annual Item; Field 09204
All Industries: Earnings Per Share / Market Price-Year End * 100
This item is also available at the security level for 1987 and subsequent years.
Earnings Yield - Current Stock Performance Ratio, Current Item; Field 09202
All Industries: Earnings Per Share-Last 12 Months / Market Price-Current * 100
This item is also available at the security level.
Earnings Yield - Current High Stock Performance Ratio, Current Item; Field 09203
All Industries: Earnings Per Share-Last 12 Months / Market Price-Year to Date High *100
This item is also available at the security level.

Alphabetical List of Field Definitions - E
Issue 6
© Thomson Financial 2003-2007 284 Confidential Information of Thomson Financial
Earnings Yield - Current Low Stock Performance Ratio, Current Item; Field 09205
All Industries: Earnings Per Share-Last 12 Months / Market Price-Year to Date Low *100
This item is also available at the security level for 1987 and subsequent years.
Earnings Yield – GAAP – Avg High-Low Stock Performance Ratio, Annual Item; Field 09246
All Industries: Earnings Per ADR-GAAP / ((Market Price–High + Market Price-Low) / 2) * 100
This item is only available for ADRs trading on the NYSE, ASE and NASDAQ and is generally not available prior to 1994.
Earnings Yield – GAAP - Close Stock Performance Ratio; Annual Item, Field 09244
All Industries: Earnings Per ADR-GAAP / Market Price-Year End * 100
This item is only available for ADRs trading on the NYSE, ASE and NASDAQ and is generally not available prior to 1994.
Earnings Yield – GAAP – Current Stock Performance Ratio, Current Item; Field 09242
All Industries: Earnings Per ADR-GAAP-Last 12 Months / Market Price-Current * 100
This item is only available for ADRs trading on the NYSE, ASE and NASDAQ.
Earnings Yield – GAAP – Current High Stock Performance Ratio, Current Item; Field 09243
All Industries: Earnings Per ADR-GAAP-Last 12 Months / Market Price-Year to Date High * 100
This item is only available for ADRs trading on the NYSE, ASE and NASDAQ.
Earnings Yield – GAAP – Current Low Stock Performance Ratio, Current Item; Field 09245
All Industries: Earnings Per ADR-GAAP-Last 12 Months / Market Price-Year to Date Low * 100
This item is only available for ADRs trading on the NYSE, ASE and NASDAQ.
Earnings Yield – GAAP – High Stock Performance Ratio, Annual Item; Field 09240
All Industries: Earnings Per ADR-GAAP / Market Price–High * 100
This item is only available for ADRs trading on the NYSE, ASE and NASDAQ and is generally not available prior to 1994.

Alphabetical List of Field Definitions - E
Issue 6
© Thomson Financial 2003-2007 285 Confidential Information of Thomson Financial
Earnings Yield – GAAP – Low Stock Performance Ratio, Annual Item; Field 09241
All Industries: Earnings Per ADR-GAAP / Market Price–Year Low * 100
This item is only available for ADRs trading on the NYSE, ASE and NASDAQ and is generally not available prior to 1994.
Earnings Yield – GAAP - 3 Yr Avg – Avg High-Low Stock Performance Ratio, Annual Item; Field 09250
All Industries: Sum of the last 3 years Earnings Per ADR-GAAP / ((Sum of the last 3 years Market Price-High + Sum of the last 3 years Market Price-Low) / 2)* 100
This item is only available for ADRs trading on the NYSE, ASE, NASDAQ and is generally not available prior to 1996.
Earnings Yield - GAAP – 3 Yr Avg – Close Stock Performance Ratio, Annual Item; Field 09249
All Industries: Sum of the last 3 years Earnings Per ADR-GAAP / Sum of the last 3 years Market Price-Year End * 100
This item is only available for ADRs trading on the NYSE, ASE, NASDAQ and is generally not available prior to 1996.
Earnings Yield – GAAP - 3 Yr Avg – High Stock Performance Ratio, Annual Item; Field 09247
All Industries: Sum of the last 3 years Earnings Per ADR-GAAP / Sum of the last 3 years Market Price–High * 100
This item is only available for ADRs trading on the NYSE, ASE, NASDAQ and is generally not available prior to 1996.
Earnings Yield - GAAP – 3 Yr Avg – Low Stock Performance Ratio, Annual Item; Field 09248
All Industries: Sum of the last 3 years Earnings Per ADR / Sum of the last 3 years Market Price-Low * 100
This item is only available for ADRs trading on the NYSE, ASE, NASDAQ and is generally not available prior to 1996.
Earnings Yield – GAAP - 5 Yr Avg – Avg High-Low Stock Performance Ratio, Annual Item; Field 09254
All Industries: Earnings Per ADR-GAAP-5 Yr Avg / ((Market Price-5 Yr Avg High + Market Price-5 Yr Avg Low) / 2)* 100
This item is only available for ADRs trading on the NYSE, ASE, NASDAQ and will not be available until 1998.

Alphabetical List of Field Definitions - E
Issue 6
© Thomson Financial 2003-2007 286 Confidential Information of Thomson Financial
Earnings Yield - GAAP – 5 Yr Avg – Close Stock Performance Ratio, Annual Item; Field 09253
All Industries: Earnings Per ADR-GAAP–5 Yr Avg / Market Price–Year End-5 Yr Avg * 100
This item is only available for ADRs trading on the NYSE, ASE, NASDAQ and will not be available until 1998.
Earnings Yield – GAAP - 5 Yr Avg – High Stock Performance Ratio, Annual Item; Field 09251
All Industries: Earnings Per ADR-GAAP-5 Yr Avg / Market Price–5 Yr Avg High * 100
This item is only available for ADRs trading on the NYSE, ASE, NASDAQ and will not be available until 1998.
Earnings Yield – GAAP - 5 Yr Avg – Low Stock Performance Ratio, Annual Item; Field 09252
All Industries: Earnings Per ADR-GAAP-5 Yr Avg / Market Price-5 Yr Avg Low * 100
This item is only available for ADRs and will not be available until 1998.
Earnings Yield - High Stock Performance Ratio, Annual Item; Field 09200
All Industries: Earnings Per Share / Market Price-High * 100
This item is also available at the security level for 1987 and subsequent years.
Earnings Yield - Low Stock Performance Ratio, Annual Item; Field 09201
All Industries: Earnings Per Share / Market Price-Low * 100
This item is also available at the security level for 1987 and subsequent years.
Earnings Yield – 3 Yr Avg – Avg High-Low Stock Performance Ratio, Annual Item; Field 09233
All Industries: Sum of the last 3 years Earnings Per Share / ((Sum of the last 3 years Market Price-High + Sum of the last 3 years Market Price-Low) / 2)* 100
This item is only available for ADRs is generally not available prior to 1994.
Earnings Yield – 3 Yr Avg – Close Stock Performance Ratio; Annual Item; Field 09232
All Industries: Sum of the last 3 years of Earnings Per Share / Sum of the last three years of Market Price-Year End * 100
This item is only available for ADRs and is generally not available prior to 1994.

Alphabetical List of Field Definitions - E
Issue 6
© Thomson Financial 2003-2007 287 Confidential Information of Thomson Financial
Earnings Yield – 3 Yr Avg – High Stock Performance Ratio, Annual Item; Field 09230
All Industries: Sum of the last 3 years Earnings Per Share / Sum of the last 3 years Market Price-High * 100
This item is only available for ADRs and is generally not available prior to 1994.
Earnings Yield – 3 Yr Avg – Low Stock Performance Ratio, Annual Item; Field 09231
All Industries: Sum of the last 3 years Earnings Per Share / Sum of the last 3 years Market Price-Low * 100
This item is only available for ADRs and is generally not available prior to 1994.
Earnings Yield - 5 Yr Avg - Close Stock Performance Ratio, Annual Item; Field 09221
All Industries: Arithmetic average of the last 5 years of Earnings Per Share / Market Price-Five Year Average Close * 100
This item is also available at the security level for 1987 and subsequent years.
Earnings Yield - 5 Yr Avg - High Stock Performance Ratio, Annual Item; Field 09211
All Industries: Arithmetic average of the last 5 years of Earnings Per Share / Market Price-Five Year Average High * 100
This item is also available at the security level for 1987 and subsequent years.
Earnings Yield - 5 Yr Avg - High-Low Stock Performance Ratio, Annual Item; Field 09226
All Industries: Arithmetic average of the last 5 years of Earnings Per Share / (Market Price - 5-Yr Avg-High + Market Price - Five Yr Avg-Low/2)*100
This item is also available at the security level for 1987 and subsequent years.
Earnings Yield - 5 Yr Avg - Low Stock Performance Ratio, Annual Item; Field 09216
All Industries: Arithmetic average of the last 5 years of Earnings Per Share/ Market Price-Five Year Average Low * 100
This item is also available at the security level for 1987 and subsequent years.
EBIT See EARNINGS BEFORE INTEREST AND TAXES (EBIT)

Alphabetical List of Field Definitions - E
Issue 6
© Thomson Financial 2003-2007 288 Confidential Information of Thomson Financial
EBIT/Total Interest Expense Ratio Leverage Ratio, Annual Item; Field 08291
All Industries: Earnings Before Interest and Taxes / Interest Expense
Data for this field is only available for 1989 and subsequent years.
EBITDA See EARNINGS BEFORE INTEREST, TAXES & DEPRECIATION (EBITDA)
Effect Of Exchange Rate On Cash Cash Flow Data, Annual Item; Field 04840
All Industries: EFFECT OF EXCHANGE RATE ON CASH represents the effect of translating from one currency to another on the cash flow of the company.
Data for this field is generally not available prior to 1989.
Efficiency Of Earning Assets Profitability Ratio, Annual Item; Field 15611
Banks, Other Financial Companies: (Interest Income-Total + Trading Account Income + Foreign Exchange Income + Investment Income + Gain/Loss on Sale of Securities-Pre-tax)/ Average of Last Year’s and Current Year’s (Investments-Total + Loans-Net) * 100
This calculation uses restated data for last years values where available
Efficiency Of Earning Assets - 5 Yr Avg Profitability Ratio, Annual Item; Field 15614
Banks, Other Financial Companies: Arithmetic average of the last five years of Efficiency of Earning Assets
Employees Descriptive Data, Annual Item; Field 07011
All Industries: EMPLOYEES represent the number of both full and part time employees of the company. It excludes:
Seasonal employees Emergency employees
Footnotes: A. Worldwide B. Domestic companies C. Parent company D. Average employees G. As of March of the following year H. Company leases the employees J. Includes full time equivalent for part time employees K. Decrease due to redundancies/layoffs L. As of June the following year O. Includes employees of associated companies

Alphabetical List of Field Definitions - E
Issue 6
© Thomson Financial 2003-2007 289 Confidential Information of Thomson Financial
Employees - 1 Yr Annual Growth Growth Rate, Annual Item; Field 08626
All Industries: (Current Year's Total Employees / Last Year's Total Employees - 1) * 100
Employees - 5 Yr Annual Growth Growth Rate, Annual Item; Field 08630
All Industries: ((Current Year's Employees / Employees six years ago, reduced to a compound annual rate) - 1) * 100
Enterprise Value Stock Data, Annual & Interim Item; Field 18100
All Industries: Market Capitalization at fiscal year end date + Preferred Stock + Minority Interest + Total Debt minus Cash. Cash represents Cash & Due from Banks for Banks, Cash for Insurance Companies and Cash & Short Term Investments for all other industries.
This item is available in the annual time series and the quarterly, semi-annual and trimester interim time series. It is only available at the company level. For companies with more than one type of ordinary shares, Market Capitalisation represents the total market value of the company calculated as total number of listed and unlisted common equivalent shares multiplied by the price of the primary issue at fiscal year end date.
Entity Type Descriptive Data, Current Item; Field 06100
All Industries: ENTITY TYPE represents a code used to indicate that the Worldscope Identifier represents either an average, company, exchange rate, ADR, security or a stock index.
Code Description A ADR/Foreign Filer C Company E Exchange Rate F Country Average G Industry Average I Index S Security
EPS See EARNINGS PER SHARE
Equipment Expense Supplementary (Expense) Data, Annual Item; Field 01085
Banks, Other Financial Companies: EQUIPMENT EXPENSE represents rental and maintenance expenses, furniture repairs, interest on mortgages on bank premises, real estate taxes and all other equipment or occupancy expenses.
Alphabetical List of Field Definitions - E
Issue 6
© Thomson Financial 2003-2007 290 Confidential Information of Thomson Financial
It includes but is not restricted to: Other property and equipment expense Property rental (U.K.) Hire equipment (U.K.)
It excludes: Depreciation expense
Equity See COMMON EQUITY
Equity Per Share See BOOK VALUE PER SHARE
Equity - GAAP – 1 Yr Annual Growth Growth Rate, Annual Item; Field 08589
All Industries: (Current Year's Common Equity-GAAP / Last Year's Common Equity-GAAP – 1) * 100
This item is only available for ADRs trading on the NYSE, ASE or NASDAQ and is generally not available prior to 1995.
Equity - GAAP – 3 Yr Annual Growth Growth Rate, Annual Item; Field 08590
All Industries: ((Current Year's Common Equity-GAAP / Common Equity-GAAP four years ago, reduced to a compound annual rate) – 1) * 100
This item is only available for ADRs trading on the NYSE, ASE or NASDAQ and is generally not available prior to 1997.
Equity - GAAP – 5 Yr Annual Growth Growth Rate, Annual Item; Field 08591
All Industries: ((Current Year's Common Equity-GAAP / Common Equity-GAAP six years ago, reduced to a compound annual rate) – 1) * 100
This item is only available for ADRs trading on the NYSE, ASE or NASDAQ and will not be available until 1999.
Equity - 1 Yr Annual Growth Growth Rate, Annual Item; Field 08616
All Industries: (Current Year's Common Shareholders' Equity / Last Year's Common Equity - 1) * 100
Insurance Companies: If Common Equity is not available, Policyholders Equity is substituted
This calculation uses restated data for last year’s values where available

Alphabetical List of Field Definitions - E
Issue 6
© Thomson Financial 2003-2007 291 Confidential Information of Thomson Financial
Exceptions:
Finland (95 and prior years) and Norway (93 and prior years): All Industries:
((Current Year's Common Equity + Current Year's Non-Equity Reserves) / (Last Year's Common Equity + Last Year's Non-Equity Reserves) - 1) * 100
Sweden (88 and prior years): All Industries:
((Current Year's Common Equity + Current Year's Non-Equity Reserves * .5) / (Last Year's Common Equity + Last Year's Non-Equity Reserves * .5) - 1) * 100
Sweden (89) All Industries:
((Current Year's Common Equity + Current Year's Non-Equity Reserves * .7) / (Last Year's Common Equity + Last Year's Non-Equity Reserves * .5) - 1) * 100
Sweden (90-92) All Industries:
((Current Year's Common Equity + Current Year's Non-Equity Reserves * .7) / (Last Year's Common Equity + Last Year's Non-Equity Reserves * .7) - 1) * 100
Sweden (93) All Industries:
((Current Year's Common Equity + Current Year's Non-Equity Reserves ) / (Last Year's Common Equity + Last Year's Non-Equity Reserves * .7) - 1) * 100
Sweden (94 and subsequent years): All Industries:
(Current Year's Common Equity / Last Year's Common Equity - 1) * 100
Equity– 3 Yr Annual Growth Growth Rate, Annual Item; Field 08618
All Industries: ((Current Year's Common Equity / Common Equity four years ago, reduced to a compound annual rate) – 1) * 100
This item is only available for ADRs and is generally not available prior to 1994.
Equity - 5 Yr Annual Growth Growth Rate, Annual Item; Field 08620
All Industries: ((Current Year's Common Equity / Common Equity six years ago, reduced to a compound annual rate) - 1) * 100
Insurance Companies: If Common Equity is not available, Policyholders Equity is substituted
Exceptions:
Finland (95 and prior years) and Norway (93 and prior years: All Industries:
(((Current Year's Common Equity + Non-Equity Reserves) / (Common Equity + Non-Equity Reserves six years ago), reduced to a compound annual rate) - 1) * 100

Alphabetical List of Field Definitions - E
Issue 6
© Thomson Financial 2003-2007 292 Confidential Information of Thomson Financial
Sweden (88 and prior years): All Industries:
(((Current Year's Common Equity + Non-Equity Reserves * .5) / (Common Equity + Non-Equity Reserves * .5 six years ago), reduced to a compound annual rate) - 1) *100
Sweden (89 to 92) All Industries:
(((Current Year's Common Equity + Non-Equity Reserves * .7) / (Common Equity + Non-Equity Reserves * .5 six years ago), reduced to a compound annual rate) - 1) * 100
Sweden (93 to 97) All Industries:
(((Current Year's Common Equity + Non-Equity Reserves ) / (Common Equity + Non-Equity Reserves * .7 six years ago), reduced to a compound annual rate) - 1) * 100
Sweden (98 and subsequent years) All Industries:
((Current Year's Common Equity / Common Equity six years ago), reduced to a compound annual rate) - 1) * 100
Equity % Total Capital Leverage Ratio, Annual Item; Field 08201
All Industries: (Common Equity / Total Capital) * 100
Insurance Companies: If Common Equity is not available, Policyholders Equity is substituted
Exceptions:
Finland (95 and prior years) and Norway (93 and prior years: All Industries:
(Non-Equity Reserves + Common Equity) / Total Capital * 100 Sweden (88 and prior years):
All Industries: (Non-Equity Reserves *.5 + Common Equity) / Total Capital *100
Sweden (89 to 93): subsequent years): All Industries:
(Non-Equity Reserves * .7 + Common Equity) / Total Capita l* 100 Sweden (94 and subsequent years):
All Industries: Common Equity / Total Capital * 100
Equity % Total Capital - 5 Yr Avg Leverage Ratio, Annual Item; Field 08205
All Industries: Arithmetic average of the last five years of Equity % Total Capital
Alphabetical List of Field Definitions - E
Issue 6
© Thomson Financial 2003-2007 293 Confidential Information of Thomson Financial
Equity % Total Deposits Leverage Ratio, Annual Item; Field 15007
Banks: Common Equity / Deposits-Total * 100
Exceptions: Finland (95 and prior years) and Norway (93 and prior years:
(Common Equity + Non-Equity Reserves) / Deposits-Total * 100 Sweden (88 and prior years):
(Common Equity + Non-Equity Reserves * .5) / Deposits-Total * 100 Sweden (89 to 93):
(Common Equity + Non-Equity Reserves * .7) / Deposits-Total * 100 Sweden (94 and subsequent years):
Common Equity / Deposits-Total * 100
Equity % Total Deposits - 5 Yr Avg Leverage Ratio, Annual Item; Field 15010
Banks: Arithmetic average of the last five years Equity % Deposits-Total
Equity In Earnings Income Data, Annual Item; Field 01503
All Industries: EQUITY IN EARNINGS represent that portion of the earnings or losses of a subsidiary whose financial accounts are not consolidated with the controlling company's assets.
Footnotes: A. Equity in earnings is pre-tax and included in pre-tax income
Equity in Earnings Supplementary (Cash Flow) Data, Annual and U.S. Interim Item; Field 04056
All Industries: EQUITY IN EARNINGS represent the non cash adjustment to income for share of profit/loss of associated companies and other equity accounted companies such as unconsolidated subsidiaries, affiliated companies and joint ventures. This data is a component of Total Other Cash Flow (field 04151).
This item is available in the annual original and annual restated time series for detailed companies, full update. For U.S. companies, it is also available in the interim original and interim restated time series.
Equity In Untaxed Reserves Shareholders' Equity Data, Annual Item; Field 03490
All Industries: EQUITY IN UNTAXED RESERVES represents the portion of the reserve that is allocated to equity. It is only applicable to Finnish, Norwegian and Swedish consolidated results for comparison purposes with other countries.
Data for this field is generally not available prior to 1990.

Alphabetical List of Field Definitions - E
Issue 6
© Thomson Financial 2003-2007 294 Confidential Information of Thomson Financial
Equity Securities & Real Estate % Capital Other Ratio, Annual Item; Field 15109
Insurance, Other Financial Companies: (Total Equity Securities Investment + Real Estate Assets) / Total Capital * 100
Equity Securities & Real Estate % Capital - 5 Yr Avg Other Ratio, Annual Item; Field 15112
Insurance, Other Financial Companies: Arithmetic average of the last five years of Equity Securities and Real Estate % Capital
Equity Securities & Real Estate % Invested Assets Other Ratio, Annual Item; Field 15103
Insurance, Other Financial Companies: (Total Equity Securities Investment + Real Estate Assets) / Investments -Total * 100
Equity Securities & Real Estate % Invested Assets - 5 Yr Avg Other Ratio, Annual Item; Field 15106
Insurance, Other Financial Companies: Arithmetic average of the last five years of Equity Securities and Real Estate % Invested Assets
Equity Securities Investment - Total Supplementary (Asset) Data, Annual Item; Field 02230
Insurance Companies, Other Financial Companies: EQUITY SECURITIES INVESTMENT - TOTAL represents the total investment of the company in common and non-redeemable preferred stock.
Footnotes: A. Fixed income securities are included B. Includes other securities
ESOP Guarantees Shareholders' Equity Data, Annual Item; Field 03496
All Industries: ESOP GUARANTEES represents guarantees made by the company for loans incurred by Employee Stock Option Plans for the purchase of common shares. The company holds the stock as collateral for the loan.
Data for this field is generally not available prior to 1990.
ESOP Guarantees - Preferred Issued Liability Data, Annual Item; Field 03449
All Industries: ESOP GUARANTEES - PREFERRED ISSUED represents a pledge by the company to insure a loan incurred by the employee stock option plan (ESOP) for the purchase of preferred shares. The company holds the stock as collateral for the loan. It is similar to treasury stock in that the preferred equity is reduced by the amount of the ESOP guarantee.
Data for this field is generally not available prior to 1989.

Alphabetical List of Field Definitions - E
Issue 6
© Thomson Financial 2003-2007 295 Confidential Information of Thomson Financial
Exchange Rate Used In Translating Balance Sheet Supplementary Data, Annual Item; Field 18214
All Industries: EXCHANGE RATE USED IN TRANSLATING BALANCE SHEET represents the exchange rate used to convert data from the reported currency to the currency of the country in which the company is domiciled. This data is only available if the financial accounts of the company are not reported in the local currency.
Data for this field is generally not available prior to 1996 for non-U.S. companies and 1991 for U.S. companies. Footnotes:
A. No standard text
Exchange Rate Used In Translating Income Statement/Cash Flow Supplementary Data, Annual Item; Field 18215
All Industries: EXCHANGE RATE USED IN TRANSLATING INCOME STATEMENT/CASH FLOW represents the exchange rate used to convert data from the reported currency to the currency of the country in which the company is domiciled. This data is only available if the financial accounts of the company are not reported in the local currency.
Data for this field is generally not available prior to 1996 for non-U.S. companies and 1991 for U.S. companies.
Excise/Windfall Profit Tax Supplementary Data, Annual Item; Field 18063
All Industries: EXCISE/WINDFALL PROFIT TAX represents taxes that are levied on specific products or services or for a specific purpose. These taxes are usually a percentage of the price and are not considered part of the company's revenue. It is deducted from sales/revenues if included in the breakdown of expenses.
Data for this field is generally not available prior to 1993. Footnotes:
A. No standard text
Excludes Extraordinary Credit/Charge Per Share Stock Data; Annual Item; Field 18260
All Industries: EXCLUDES EXTRAORDINARY CREDIT/CHARGE PER SHARE represents the per share amount of the gain/loss net of taxes resulting from nonrecurring or unusual events that is excluded from the net income of a company.
This item is only populated for the interim time series. It is not available prior to 1998 and is shown per 1,000 shares for Brazilian companies.
Expense Ratio (%) Profitability Ratio, Annual Item; Field 15555
Insurance Companies: Underwriting Expense / Total Premiums Written * 100

Alphabetical List of Field Definitions - E
Issue 6
© Thomson Financial 2003-2007 296 Confidential Information of Thomson Financial
Expense Ratio (%) - 5 Yr Avg Profitability Ratio, Annual Item; Field 15558
Insurance Companies: Arithmetic average of the last five years of Expense Ratios
Exports Supplementary (Income) Data, Annual Item; Field 07161
All Industries: EXPORTS represents the revenues generated from the shipment of merchandise to another country for sale.
Footnotes: A. Parent Company B. Includes Excise Taxes C. No standard text
External Financing Supplementary (Cash Flow) Data, Annual Item; Field 04500
All Industries: EXTERNAL FINANCING represents company financing from outside sources. It includes the issuance and retirement of stock and debt. This item is calculated from available data.
Footnotes: A. May reflect changes due to acquisitions and accounting policies
Extraordinary Items & Gain/Loss Sale Of Assets Income Data, Annual Item; Field 01601
All Industries: EXTRAORDINARY ITEMS & GAIN/LOSS SALE OF ASSETS represent gains and losses resulting from nonrecurring or unusual events. There are two types:
1. Those that occur in the current accounting period 2. Those that relate to past years' transactions
For Non-U.S. corporations, this item is as reported by the company. Differences in accounting definitions would exist between countries.
It includes but is not restricted to: Discontinued operations when disposal of assets is not stated separately
Footnotes: C. Other charges are included D. Includes discontinued operations
Extraordinary Charge - Pre-tax Expense Data, Annual Data; Field 01254
All Industries: EXTRAORDINARY CHARGE - PRE-TAX represents any pre-tax extraordinary charge which is infrequent or unusual included in the net income of a company. For non-U.S. companies it is as defined by the company.
Data for this field is generally not available prior to 1989. It includes but is not restricted to:

Alphabetical List of Field Definitions - E
Issue 6
© Thomson Financial 2003-2007 297 Confidential Information of Thomson Financial
Major casualties such as earthquakes and floods, if rare in the area Expropriation of assets by foreign governments Effects of a prohibition under a newly enacted law or regulation Prior effects of an accounting change Reorganization (Wsc field 18227) Exceptional Items (United Kingdom) Write-down or write-off of inventories or other write-downs that are normally a part of operations if they exceed 25% of earnings Special items (Japan)
It excludes: Write-down or write-off of receivables, inventories or tangible assets if less than 25% of earnings Effects of labor strikes Shortages of raw materials Changes in estimates of accumulated depreciation, accrued expenses and profit or loss on long term construction contracts
Footnotes: A. Net of income taxes B. Net of extraordinary income
Extraordinary Credit - Pre-tax Income Data, Annual Data; Field 01253
All Industries: EXTRAORDINARY CREDIT - PRE-TAX represents any pre-tax extraordinary credit which is infrequent or unusual included in the net income of a company. For non-U.S. companies it is as defined by the company.
Data for this field is generally not available prior to 1989. It includes but is not restricted to:
Major casualties such as earthquakes and floods, if rare in the area Expropriation of assets by foreign governments Effects of a prohibition under a newly enacted law or regulation Prior effects of an accounting change Reorganization Exceptional Items (United Kingdom) Write-down or write-off of inventories or other write-downs that are normally a part of operations if they exceed 25% of earnings Special items (Japan)
It excludes: Effects of labor strikes Shortages of raw materials Changes in estimates of accumulated depreciation, accrued expenses and profit or loss on long term construction contracts
Footnotes: A. Net of income taxes B. Net of extraordinary charge

Alphabetical List of Field Definitions - E
Issue 6
© Thomson Financial 2003-2007 298 Confidential Information of Thomson Financial
Extraordinary Credit/Charge Per Share Stock Data, Annual Item; Field 05226
All Industries: EXTRAORDINARY CREDIT/CHARGE PER SHARE represents the per share amount of the gain/loss resulting from nonrecurring or unusual events.
This item is shown per 1,000 shares for Brazilian companies. Data for this field is generally not available prior to 1992. Footnotes:
A. No standard text C. Other charges are included D. Includes discontinued operations.
Extraordinary Items Cash Flow Data, Annual Item; Field 04225
All Industries: EXTRAORDINARY ITEMS represent gains and losses resulting from nonrecurring unusual events. There are two types:
1. Those that occur in the current accounting period 2. Those that relate to past years' transactions
For Non-U.S. corporations, this item is as reported by the company. Differences in accounting definitions would exist between countries.
Issue 6
© Thomson Financial 2003-2007 299 Confidential Information of Thomson Financial
F Fax Number Descriptive Data, Current Item; Field 06033
All Industries: FAX NUMBER represents the number used by the company to electronically transmit written information via a facsimile machine.
Federal Agency Securities Asset Data, Annual Item; Field 02206
Banks: FEDERAL AGENCY SECURITIES represent the purchase of securities that would create an indirect loan to the government through its federal agencies. These securities are not general obligations of the Treasury. They are, however, sponsored by the government and therefore are looked upon as safe investments. It includes but is not restricted to:
Federal securities available for sale (field 18088) It excludes:
U.S. agency mortgage-backed securities Footnotes:
A. Included in U.S. Treasury Securities
Federal Agency Securities Available For Sale Supplementary (Asset) Data, Annual Item; Field 18088
Banks: FEDERAL AGENCY SECURITIES AVAILABLE FOR SALE represent the amount of federal agency securities that cannot be classified as either investment securities or trading account securities.
Reporting required by U.S. FASB 115. Updated where available in 1993 and subsequent years. It excludes:
U.S. Agency mortgage backed securities available for sale Footnotes:
A. Included in U.S. treasury securities available for sale
Federal Funds Asset Data, Annual Item; Field 02210
Banks: FEDERAL FUNDS represent short term loans from the Federal Reserve Bank made to the bank from their excess balances. For 1989 and prior years it includes securities purchased under resale agreements.
Footnotes: A. Includes securities purchased under resale agreements
Alphabetical List of Field Definitions - F
Issue 6
© Thomson Financial 2003-2007 300 Confidential Information of Thomson Financial
Federal Funds (Liability) Supplementary (Liability) Data, Annual Item; Field 03055
Banks: FEDERAL FUNDS represent funds bought by the bank from the excess reserve funds of other banks that are maintained in the Federal Reserve Bank. These funds are purchased by the bank when their reserves temporarily go below their reserve requirements.
Footnotes: A. Includes securities sold under repurchase agreements
Finance Receivables Supplementary (Asset) Data, Annual Item; Field 02048
Other Financial Companies: FINANCE RECEIVABLES represent the amounts due to the company as a result of its financial operations. It is shown net of unearned finance charges and allowances for credit losses. It includes but is not restricted to:
Loans - secured/unsecured Sales finance contracts Notes receivable Receivables from trusts Accrued rents Due from factor Due from finance subsidiary Unbilled lease revenue Accrued interest Current portion of net investment in sales-type leases Deferred billings to contracts.
Finished Goods Asset Data, Annual Item; Field 02099
All Industries: FINISHED GOODS represent the inventory of goods which are ready for sale.
Data for this field is generally not available prior to 1989. Footnotes:
A. Includes work in progress
Fiscal Year End Period See DATE OF FISCAL PERIOD END
Fiscal Year End Exchange Rate (U.S. $) Supplementary Data, Annual Item; Field 06102
All Industries: FISCAL YEAR END EXCHANGE RATE (U.S. $) represents the fiscal year end exchange rate used to convert balance sheet items into U.S. dollars.
This item is only available for ADRs.
Alphabetical List of Field Definitions - F
Issue 6
© Thomson Financial 2003-2007 301 Confidential Information of Thomson Financial
Fiscal Year 12 Month Average Exchange Rate (U.S. $) Supplementary Data, Annual Item; Field 06101
All Industries: FISCAL YEAR 12 MONTH AVERAGE EXCHANGE RATE (U.S. $) represents the 12 month average exchange rate used to convert income statement and cash flow items into U.S. dollars.
This item is only available for ADRs.
Fixed Assets % Common Equity Leverage Ratio, Annual Item; Field 08266
All Industries: Property, Plant & Equipment-Net / Common Equity * 100
Insurance Companies: If Common Equity is not available, Policyholders Equity is substituted
Exceptions:
Finland (95 and prior years) and Norway (93 and prior years): All Industries:
Property, Plant & Equipment-Net / (Non-Equity Reserves + Common Equity) * 100 Sweden (88 and prior years):
All Industries: Property, Plant & Equipment-Net / (Non-Equity Reserves * .5 + Common Equity) * 100
Sweden (89 to 93): All Industries:
Property, Plant & Equipment-Net / (Non-Equity Reserves * .7 + Common Equity) * 100 Sweden (94 and subsequent years):
All Industries: Property, Plant & Equipment-Net /Common Equity * 100
Fixed Assets % Common Equity - 5 Yr Avg Leverage Ratio, Annual Item; Field 08270
All Industries: Arithmetic average of the last five years of Fixed Assets % Common Equity
Fixed Charge Coverage Ratio Leverage Ratio, Annual Item; Field 08251
Industrials, Other Financial Companies: Earnings before Interest and Taxes / (Interest Expense on Debt + (Preferred Dividends (Cash) / (1 - Tax Rate / 100))) If the Tax rate is negative or not available or if preferred dividends are 0: Earnings before Interest and Taxes / (Interest Expense on Debt + Preferred Dividends (Cash))
Exceptions: U.S. Companies:
Standard Tax Rate Used in Calculations: 86 and prior years: 46% 87 to 94: 34%

Alphabetical List of Field Definitions - F
Issue 6
© Thomson Financial 2003-2007 302 Confidential Information of Thomson Financial
95 and subsequent years: 35%
Fixed Charge Coverage Ratio - 5 Yr Avg Leverage Ratio, Annual Item; Field 08255
Industrials, Other Financial Companies: Arithmetic average of the last five years of Fixed Charge Coverage Ratios
Fixed Income Securities Investment - Total Asset Data, Annual Item; Field 02215
Insurance Companies: FIXED INCOME SECURITIES INVESTMENT - TOTAL represents the total investment of the insurance company in fixed income securities such as bonds and redeemable preferred stocks.
Footnotes: A. Loans are included B. Equity securities are included C. Loans and equity securities are included
Foreign Asset Turnover Asset Utilization Ratio, Annual Item; Field 08706
All Industries: Foreign Assets / Foreign Sales
Foreign Asset Turnover - 5 Yr Avg Asset Utilization Ratio, Annual Item; Field 08710
All Industries: Arithmetic average of the last five years of Foreign Asset Turnover
Foreign Assets Growth - 1 Yr Annual Growth Growth Rate, Annual Item; Field 08716
All Industries: (International Assets / Last Year's International Assets - 1) * 100
This calculation uses restated data for last years values where available
Foreign Assets Growth - 5 Yr Annual Growth Growth Rate, Annual Item; Field 08720
All Industries: ((International Assets / International Assets 6 years ago, reduced to a compound annual rate) -1) * 100
Foreign Assets % Total Assets Leverage Ratio, Annual Item; Field 08736
All Industries: International Assets / Total Assets * 100
Banks: International Assets / (Total Assets - Customer Liabilities on Acceptances) * 100 Customer Liabilities on Acceptances only subtracted when included in Total Assets

Alphabetical List of Field Definitions - F
Issue 6
© Thomson Financial 2003-2007 303 Confidential Information of Thomson Financial
Other Financial Companies: International Assets / (Total Assets - Custody Securities) * 100
Foreign Assets % Total Assets - 5 Yr Avg Leverage Ratio, Annual Item; Field 08740
All Industries: Arithmetic average of the last five years of Foreign Assets % Total Assets
Foreign Currency Translation Gain/Loss Supplementary (Income) Data, Annual Item; Field 01351
All Industries: FOREIGN EXCHANGE TRANSLATION GAIN/LOSS represents gains or losses from holding foreign monetary items during a period of fluctuating exchange rates used in determination of net income. For U.S. corporations, this is usually reported after taxes.
Footnotes: A. Includes other financial charges B. Before taxes for U.S. Corporations C. Includes realized gains/losses
Foreign Exchange Income Income Data, Annual Item; Field 01018
Banks, Other Financial Companies: FOREIGN EXCHANGE INCOME represents income received from foreign currency transactions. It includes but is not restricted to:
Foreign currency translation gains or losses, if not reported separately Foreign exchange trading income
Footnotes: A. Some other financial charges are included B. Includes foreign currency translation gain/loss
Foreign Exchange Transactions Supplementary (Income) Data, Annual Item; Field 01352
All Industries: FOREIGN EXCHANGE TRANSACTIONS represents realized foreign currency gains and losses. Transaction gains or losses happen when the exchange rate changes between the date of purchase and the date of sale.
Data for this field is generally not available prior to 1992. It includes but is not restricted to:
Currency trading gain/loss Footnotes:
A. No standard text B. May include foreign currency translation

Alphabetical List of Field Definitions - F
Issue 6
© Thomson Financial 2003-2007 304 Confidential Information of Thomson Financial
Foreign Income Growth - 1 Yr Annual Growth Growth Rate, Annual Item; Field 08726
All Industries: (International Operating Income or Net Income / Last Year's International Operating Income or Net Income - 1) * 100
This calculation uses restated data for last years values where available
Foreign Income Growth - 5 Yr Annual Growth Growth Rate, Annual Item; Field 08730
All Industries: ((International Operating Income or Net Income / International Operating Income or Net Income 6 years ago, reduced to a compound annual rate) - 1) * 100
Foreign Income Margin Profitability Ratio, Annual Item; Field 08701
All Industries: International Operating Income / International Sales * 100
Foreign Income Margin - 5 Yr Avg Profitability Ratio, Annual Item; Field 08705
All Industries: Arithmetic average of the last five years of Foreign Income Margin
Foreign Income % Total Income Profitability Ratio, Annual Item; Field 08741
All Industries: International Operating Income / Operating Income * 100
Foreign Income % Total Income - 5 Yr Avg Profitability Ratio, Annual Item; Field 08745
All Industries: Arithmetic average of the last five years of Foreign Income % Total Income
Foreign Loans Asset Data, Annual Item; Field 02268
Banks: FOREIGN LOANS represent loans made to foreign customers.
Foreign Office Deposits Liability Data, Annual Item; Field 03017
Banks: FOREIGN OFFICE DEPOSITS represent deposits in foreign offices of the bank. It includes but is not restricted to:
Deposits of nonresidents

Alphabetical List of Field Definitions - F
Issue 6
© Thomson Financial 2003-2007 305 Confidential Information of Thomson Financial
Foreign Office Deposits % Total Deposits Other Ratio, Annual Item; Field 15573
Banks: Foreign Deposits / Deposits-Total * 100
Foreign Office Deposits % Total Deposits - 5 Yr Avg Other Ratio, Annual Item; Field 15577
Banks: Arithmetic average of the last five years of Foreign Office Deposits % Total Deposits
Foreign Return On Assets Profitability Ratio, Annual Item; Field 08711
All Industries: International Operating Income / International Assets * 100
Foreign Return On Assets - 5 Yr Avg Profitability Ratio, Annual Item; Field 08715
All Industries: Arithmetic average of the last five years of Foreign Return on Assets
Foreign Sales Growth - 1 Yr Annual Growth Growth Rate, Annual Item; Field 08721
All Industries: (International Sales / Last Year's International Sales - 1) * 100
This calculation uses restated data for last years values where available
Foreign Sales Growth - 5 Yr Annual Growth Growth Rate, Annual Item; Field 08725
All Industries: ((International Sales / International Sales 6 years ago, reduced to a compound annual rate) -1) * 100
Foreign Sales % Total Sales Profitability Ratio, Annual Item; Field 08731
All Industries: International Sales / Net Sales or Revenues * 100
Foreign Sales % Total Sales - 5 Yr Avg Profitability Ratio, Annual Item; Field 08735
All Industries: Arithmetic average of the last five years of Foreign Sales % Total Sales

Alphabetical List of Field Definitions - F
Issue 6
© Thomson Financial 2003-2007 306 Confidential Information of Thomson Financial
Format Code - Cash Flow Supplementary (Cash Flow) Data, Annual Item; Field 18216
All Industries: FORMAT CODE - CASH FLOW represents the method used by the company for reporting its Cash Flow Statement.
Code Method 01 FASB 95 02 Sources & Uses 03 Limited
Data for this field is generally not available prior to 1996 for non-U.S. companies and 1991 for U.S. companies.
Free Cash Flow Per Share Stock Data, Annual Item; Field 05507
All Industries: FREE CASH FLOW PER SHARE represents the cash earnings per share, net of capital expenditures and total dividends paid of the company. The numerator used in this calculation is Funds from Operations (field 04201) - Capital Expenditures (field 04601) - Cash Dividends Paid (field 04551).
This item is shown per 1,000 shares for Brazilian companies.
Free Reserves See UNAPPROPRIATED (FREE) RESERVES
Full/Limited Coverage Indicator Supplementary Data, Annual Item; Field 07033
All Industries: FULL/LIMITED COVERAGE INDICATOR indicates whether or not a full set or a limited set of company data is available for a specific year. An “F” in this fields indicates that a full set is available, an “L” indicates that a limited set is available.
Fully Diluted Average Shares See COMMON SHARES USED TO CALCULATE FULLY DILUTED EARNINGS PER SHARE.
Fully Diluted Earnings Per Share Stock Data, Annual Item; Field 05290
All Industries: FULLY DILUTED EARNINGS PER SHARE represents the net income per share assuming the conversion of all convertible securities including convertible preferred stock and convertible debentures and the exercise of all outstanding stock options and warrants. It represents earnings for the 12 months ended the last calendar quarter for U.S. companies and the fiscal year for non-U.S. companies.
Data for this field is generally not available prior to 1996 for non-U.S. companies, 1991 for U.S. companies and is shown per 1,000 shares for Brazilian companies. Footnotes:
AA. Earnings per share after full tax B. Includes or excludes extraordinary charge or credit D. No standard text F. Period includes strike G. Includes the effects of a change in accounting policies or tax laws

Alphabetical List of Field Definitions - F
Issue 6
© Thomson Financial 2003-2007 307 Confidential Information of Thomson Financial
M. Calculation based on year end outstanding shares 0. No standard text Q. Based on fully diluted shares S. No standard text V. No standard text W. No standard text X. Estimated based on standard tax basis Y. Based on combined multiple shares Z. Earnings per share estimated using net income after preferred dividends divided by year end shares or
latest shares available
Fully Diluted Earnings Per Share - First, Second, Third and Fourth Quarter Stock Data, Annual Item; Fields 05291, 05292, 05293, 05294, respectively All Industries-
FULLY DILUTED EARNINGS PER SHARE represents the net income per share assuming the conversion of all convertible securities including convertible preferred stock and convertible debentures and the exercise of all outstanding stock options and warrants reported by the company in each of the respective interim periods. Interim periods are determined on a calendar basis for U.S. companies and on a fiscal basis for non-U.S. companies.
Data for this field is generally not available prior to 1996 for non-U.S. companies, 1991 for U.S. companies and is shown per 1,000 shares for Brazilian companies. Footnotes:
A. Estimate based on net profit before minority interest divided by latest shares available AA. Earnings per share after full tax B. Includes or Excludes extraordinary charge or credit C. Estimate based on pre-tax profit before minority interest adjusted for standard tax rate divided by latest
shares available D. No standard text F. Period includes strike G. Includes the effects of a change in accounting policies or tax laws O. No standard text S. No standard text T. Based on profits after transfer to reserves V. No standard text W. No standard text
Funds From/For Other Operating Activities Cash Flow Data, Annual Item; Field 04831
All Industries: FUNDS FROM/FOR OTHER OPERATING ACTIVITIES represent the net change in working capital apart from the increase/decrease in short term borrowings and increase/decrease in cash & equivalents.
Data for this item is generally not available prior to 1989. Footnotes:
A. Funds provided from other current assets or other current liabilities are included in other sources or uses
B. Includes increase/decrease in short term borrowings

Alphabetical List of Field Definitions - F
Issue 6
© Thomson Financial 2003-2007 308 Confidential Information of Thomson Financial
Funds From Operations Cash Flow Data, Annual Item; Field 04201
All Industries: FUNDS FROM OPERATIONS represents the sum of net income and all non-cash charges or credits. It is the cash flow of the company. If a Statement of Changes in Financial Position has not been provided, but the company discloses an aggregate cash flow, this amount has been used. Where cash flow has not been disclosed in any manner, it is estimated based on net profit before preferred dividends plus depreciation, reserves charges, provision for loan losses for banks, and provision for future benefits for insurance companies. It includes but is not restricted to:
Depreciation Amortization of Intangibles Deferred Taxes
It excludes: Extraordinary items Changes in working capital
Footnotes: A. Using cash flow figure per financial statements when statement of changes in financial position is not
given B. Defined by company F. Taken from English Report G. Includes funds from other operating activities L. No standard text

Issue 6
© Thomson Financial 2003-2007 309 Confidential Information of Thomson Financial
G Gain On Sale Of Investment Supplementary (Income) Data, Annual Item; Field 01305
Other Financial Companies: GAIN ON SALE OF INVESTMENT represents the profit made on the disposal of securities.
Gain/Loss On Disposal Of Assets Supplementary (Income) Data, Annual Item; Field 01306
All Industries: GAIN/LOSS ON DISPOSAL OF ASSETS represents the funds earned from the sale of assets.
Data for this field is generally not available prior to 1992. Footnotes:
A. No standard text B. Disposal of fixed assets C. Disposal of investments D. Disposal of intangible assets F. Disposal of fixed assets and investments G. Disposal of fixed assets and intangible assets H. Disposal of investments and intangible assets I. Disposal of fixed assets, investments and intangible assets J. Extraordinary
Gains/Losses On Sale Of Securities - Pre-tax Income Data, Annual Item; Field 01270
Banks, Insurance Companies: GAINS/LOSSES ON SALE OF SECURITIES - PRE-TAX represent the difference between the amount received from the sale or disposal of an asset and its carrying value. Realized investment loss can also be caused by the write-down of the asset when it has a permanent decline in its value or by moving the investment to short term investments when the market value has dropped below cost.
Data for this field is generally not available prior to 1991. It includes but is not restricted to:
Marketable securities gain/loss Gain on government and other bonds sold and redeemed minus loss on government and other bonds sold and redeemed Loss on devaluation of bonds Profit/Loss on realization of government securities
General Industry Classification Descriptive Data, Current Item; Field 06010
All Industries: This item represents the company's general industry classification.
It is defined as follows: 01 Industrial 02 Utility 03 Transportation

Alphabetical List of Field Definitions - G
Issue 6
© Thomson Financial 2003-2007 310 Confidential Information of Thomson Financial
04 Bank/Savings & Loan 05 Insurance 06 Other Financial
Geographic Segment Data Geographic Data, Annual Items; Fields 19600-19695
All Industries: The following information is given for up to ten geographic segments of a company. For companies that have only domestic operations data is found in Geographic Segment 1 fields. If a company has more than ten geographic segments the remaining segments are included in Geographic Segment 10 fields.
Data for these fields are generally not available prior to 1990.
GEOGRAPHIC SEGMENT 1-10 - DESCRIPTION - Fields 19600, 19610, 19620, 19630, 19640, 19650, 19660, 19670, 19680, 19690, respectively
DESCRIPTION represents the geographic region as reported by the company. GEOGRAPHIC SEGMENT 1-10 - SALES - Fields 19601, 19611, 19621,19631, 19641, 19651, 19661, 19671, 19681, 19691, respectively
SALES represents the total revenues from the geographic region updated in the respective description. Footnotes:
A. Includes non-domestic operations which cannot be separated B. Includes excise taxes, windfall profit taxes and/or other income C. No standard text D. No standard text F. Includes other income G. Reflects Market Segment Breakdown H. Includes share of associate companies I. May include export sales which cannot be subtracted out J. Includes discontinued operations K. Based on premiums only
GEOGRAPHIC SEGMENT 1-10 - ASSETS - Fields 19603, 19613, 19623, 19633, 19643, 19653, 19663, 19673, 19683, 19693, respectively
ASSETS represents the total assets from the geographic region updated in the respective description. Footnotes: A. Includes non-domestic operations which cannot be separated B. Reflects net-operating assets C. No standard text D. No standard text F. Net assets H. Includes share of associate companies J. Includes discontinued operations L. Reflects capital employed
GEOGRAPHIC SEGMENT 1-10 - OPERATING INCOME - Fields 19602, 19612, 19622, 19632, 19642, 19652, 19662, 19672, 19682, 19692, respectively
OPERATING INCOME represents the operating income generated from the geographic region updated in the respective description.
Footnotes: A. Includes non-domestic operations which cannot be separated B. Reflects pre-tax income C. No standard text D. No standard text H. Includes share of associate companies

Alphabetical List of Field Definitions - G
Issue 6
© Thomson Financial 2003-2007 311 Confidential Information of Thomson Financial
J. Includes discontinued operations K. As reported N. Net income before interest and tax
GEOGRAPHIC SEGMENT 1-10 - CAPITAL EXPENDITURES - Fields 19604, 19614, 19624, 19634, 19644, 19654, 19664, 19674, 19684, 19694, respectively
CAPITAL EXPENDITURES represents the capital expenditures resulting from the geographic region updated in the respective description.
Footnotes: A. Includes non-domestic operations which cannot be separated C. No standard text D. No standard text H. Includes share of associate companies J. Includes discontinued operations
GEOGRAPHIC SEGMENT 1-10 - DEPRECIATION - Fields 19605, 19615, 19625, 19635, 19645, 19655, 19665, 19675, 19685, 19695, respectively
DEPRECIATION represents the depreciation expense resulting from the geographic segment updated in the respective description.
Footnotes: A. Includes non-domestic operations that cannot be separated C. No standard text D. No standard text H. Includes share of associate companies J. Includes discontinued operations
Goodwill - Accumulated Amortization Supplementary (Asset) Data; Annual Item; Field 02503
All Industries: GOODWILL – ACCUMULATED AMORTIZATION represents the accumulated amortization of the difference between the cost of an acquired entity and the aggregate value of its identifiable assets
This item is available in the annual original and annual restated time series for detailed companies, full update.
Goodwill - Gross Supplementary (Asset) Data; Annual Item; Field 02502
All Industries: GOODWILL - GROSS represents the gross value of the difference between the cost of an acquired entity and the aggregate value of its identifiable assets
This item is available in the annual original and annual restated time series for detailed companies, full update.
Goodwill – GAAP Supplementary (Asset) Data, Annual Item; Field 06693
All Industries: GOODWILL – GAAP represents the goodwill of a non-U.S. company adjusted to conform to U.S. Generally Accepted Accounting Principles. See definition for GOODWILL/COST IN EXCESS OF ASSETS PURCHASED for additional information.
This item is presented in U.S. dollars (converted at the company's fiscal year end exchange rate). It is only available for ADRs trading on the NYSE, ASE or NASDAQ and is generally not available prior to 1994.

Alphabetical List of Field Definitions - G
Issue 6
© Thomson Financial 2003-2007 312 Confidential Information of Thomson Financial
Goodwill Written Off Supplementary (Liability) Data, Annual Item; Field 03491
All Industries: GOODWILL WRITTEN OFF represents goodwill written off directly to the reserve account in the equity of a company.
Data for this field is generally not available prior to 1989. It includes but is not restricted to:
Current year's negative goodwill Goodwill written back
Footnotes: A. No standard text B. Includes negative goodwill
Goodwill/Cost In Excess Of Assets Purchased, Net Supplementary (Asset) Data, Annual Item; Field 18280
All Industries: GOODWILL/COST IN EXCESS OF ASSETS PURCHASED represents the excess cost over the fair market value of the net assets purchased. It is included in other intangible assets.
Data for this field is generally not available prior to 1992. Footnotes:
A. No standard text
Gross Income Income Data, Annual Item; Field 01100
Industrials, Other Financial Companies: Gross Income represents the difference between sales or revenues and cost of goods sold and depreciation/depletion , and amortization
Gross Profit Margin Profitability Ratio, Annual Item; Field 08306
Industrials, Other Financial Companies : Gross Income / Net Sales or Revenues * 100
Gross Profit Margin - 5 Yr Avg Profitability Ratio, Annual Item; Field 08310
Industrials, Other Financial Companies : Arithmetic average of the last five years of Gross Margin

Issue 6
© Thomson Financial 2003-2007 313 Confidential Information of Thomson Financial
H Headline Earnings Per Share Stock Data, Annual Item; Field 05725
All Industries: HEADLINE EARNINGS PER SHARE represent the reported earnings per share based on the trading profits and losses for the year. These earnings conform to the standards set by the Institute of United Kingdom Society of Investment Professionals (UKSIP) to create an unambiguous earnings figure for users, the press and statistical companies.
This item is generally only available for UK type reporting companies and is generally not available prior to 1994.
Healthcare Data – Actual Return On Plan Assets Supplementary Data, Annual Item; Field 18842
All Industries: HEALTHCARE DATA – ACTUAL RETURN ON PLAN ASSETS represents the difference in the fair value of fund assets at the beginning and the end of the period adjusted for contributions made to the fund and benefits payments made by the fund during the period.
This item is usually only provided by those companies that follow IAS or US GAAP accounting. This item is only available in the annual time series at the company level.
Healthcare Data – Accumulated Benefit Obligation Supplementary Data, Annual Item; Field 18834
All Industries: HEALTHCARE DATA – ACCUMULATED BENEFIT OBLIGATION represents an approximate measure of the liability of a plan in the event of a termination at the date the calculation is performed.
This item is usually only provided by those companies that follow IAS or US GAAP accounting. This item is only available in the annual time series at the company level.
Healthcare Data – Amortization Of Prior Service Costs Supplementary Data, Annual Item; Field 18838
All Industries: HEALTHCARE DATA – AMORTIZATION OF PRIOR SERVICE COSTS represents costs related to employee service in years preceding the adoption or amendment of a pension plan; these are referred to as prior service costs. These costs are amortized over future expected service periods of the employees.
This item is usually only provided by those companies that follow IAS or US GAAP accounting. This item is only available in the annual time series at the company level.
Healthcare Data – Discount Rate Supplementary Data, Annual Item; Field 18832
All Industries: HEALTHCARE DATA – DISCOUNT RATE represents the annual rate at which the projected future liabilities are discounted back to the present date.
This item is usually only provided by those companies that follow IAS or US GAAP accounting. This item is only available in the annual time series at the company level.
Alphabetical List of Field Definitions - H
Issue 6
© Thomson Financial 2003-2007 314 Confidential Information of Thomson Financial
Healthcare Data – Expected Long-Term Return Rate On Pension Assets Supplementary Data, Annual Item; Field 18831
All Industries: HEALTHCARE DATA – EXPECTED LONG-TERM RETURN RATE ON PENSION ASSETS represents an estimate of the rate of return to be earned over the period until all benefits under the plan have been paid.
This item is usually only provided by those companies that follow IAS or US GAAP accounting. This item is only available in the annual time series at the company level.
Healthcare Data – Expected Return On Plan Assets For The Period Supplementary Data, Annual Item; Field 18843
All Industries: HEALTHCARE DATA – EXPECTED RETURN ON PLAN ASSETS FOR THE PERIOD represents the expected return on the pension plan investments plus the change in the carrying value of the plan assets used in operations.
This item is usually only provided by those companies that follow IAS or US GAAP accounting. This item is only available in the annual time series at the company level.
Healthcare Data – Fair Value Of Plan Assets Supplementary Data, Annual Item; Field 18833
All Industries: HEALTHCARE DATA – FAIR VALUE OF PLAN ASSETS represents the value of the investments in the pension plan at a particular point in time.
This item is usually only provided by those companies that follow IAS or US GAAP accounting. This item is only available in the annual time series at the company level.
Healthcare Data – Gains (Losses) From Settlements Supplementary Data, Annual Item; Field 18840
All Industries: HEALTHCARE DATA – GAINS (LOSSES) FROM SETTLEMENTS represents an irrevocable transaction that relieves the employer (or the plan) of primary responsibility for a defined benefit pension obligation.
This item is usually only provided by those companies that follow IAS or US GAAP accounting. This item is only available in the annual time series at the company level.
Healthcare Data – Interest Cost Supplementary Data, Annual Item; Field 18839
All Industries: HEALTHCARE DATA – INTEREST COST represents annual interest costs, which reflect the financing costs in a pension plan. Interest expense accrues each year on the projected benefit obligation based on a selected interest rate.
This item is usually only provided by those companies that follow IAS or US GAAP accounting. This item is only available in the annual time series at the company level.

Alphabetical List of Field Definitions - H
Issue 6
© Thomson Financial 2003-2007 315 Confidential Information of Thomson Financial
Healthcare Data – Net Periodic Pension (Income)/Expense Supplementary Data, Annual Item; Field 18836
All Industries: HEALTHCARE DATA – NET PERIODIC PENSION (INCOME)/EXPENSE represents the amount recognized in an employer’s financial statements as the cost of a pension plan for a period.
This item is usually only provided by those companies that follow IAS or US GAAP accounting. This item is only available in the annual time series at the company level.
Healthcare Data – Other Net Periodic Pension (Income)/Expense Supplementary Data, Annual Item; Field 18841
All Industries: HEALTHCARE DATA – OTHER NET PERIODIC PENSION (INCOME)/EXPENSE represents a component of Net Periodic Pension (Income)/Expense.
This item is usually only provided by those companies that follow IAS or US GAAP accounting. This item is only available in the annual time series at the company level.
Healthcare Data – Pension Service Costs Supplementary Data, Annual Item; Field 18837
All Industries: HEALTHCARE DATA – PENSION SERVICE COSTS represents the expense caused by the increase in pension benefits payable (the projected benefit obligation) to employees due to services rendered during the current year. (Present value of new benefits earned by employees during the year). For example, when an employee is covered by a defined-benefit pension plan, the annual Service Cost is the increase in the present value of the future pension obligations due to an added year of service and salary.
This item is usually only provided by those companies that follow IAS or US GAAP accounting. This item is only available in the annual time series at the company level.
Healthcare Data – Projected Benefit Obligation (PBO) Supplementary Data, Annual Item; Field 18835
All Industries: HEALTHCARE DATA – PROJECTED BENEFIT OBLIGATION represents a measure of a pension plan’s liability at the calculation date assuming that the plan is ongoing and will not terminate in the foreseeable future.
This item is usually only provided by those companies that follow IAS or US GAAP accounting. This item is only available in the annual time series at the company level.
Healthcare Data – Unfunded Healthcare Defined Benefits Supplementary Data, Annual Item; Field 18830
All Industries: HEALTHCARE DATA – UNFUNDED HEALTHCARE DEFINED BENEFITS represents the difference between the accumulated benefit obligation and the fair value of plan assets when the accumulated obligation exceeds the fair value.
This item is usually only provided by those companies that follow IAS or US GAAP accounting. This item is only available in the annual time series at the company level.
Alphabetical List of Field Definitions - H
Issue 6
© Thomson Financial 2003-2007 316 Confidential Information of Thomson Financial
Healthcare Data – Unrecognized Prior Service Cost Supplementary Data, Annual Item; Field 18844
All Industries: HEALTHCARE DATA – UNRECOGNIZED PRIOR SERVICE COST represents costs when a pension plan is initially adopted or amended to provide increased benefits, employees are granted additional benefits for services performed in years prior to the plan’s adoption or amendment.
This item is usually only provided by those companies that follow IAS or US GAAP accounting. This item is only available in the annual time series at the company level.
Healthcare - Net Healthcare Liability/(Asset) – Balance Sheet Supplementary (Pension) Data, Annual Item; Field 18847
All Industries: HEALTHCARE - NET HEALTHCARE LIABILITY/(ASSET) – BALANCE SHEET represents the amount of the post-retirement liability or asset to be reported on the balance sheet. It is Healthcare Plan-Projected Benefit Obligation (WS 18835) – Healthcare-Fair Value of Plan Assets (WS 18833) - Healthcare Plan-Unrecognized Prior Service Cost (WS 18844) + Healthcare–Unrecognized Actuarial Gains/Losses (18845) – Healthcare-Other Adjustments to Funded Status (WS 18846)
This item is available in the annual original and annual restated time series for detailed non-U.S. companies, full update.
Healthcare - Other Adjustments to Funded Status for Net Pension/Post Retirement Assets/Liabilities Supplementary (Pension) Data, Annual Item; Field 18846
All Industries: HEALTHCARE - OTHER ADJUSTMENTS TO FUNDED STATUS FOR NET PENISON/POST RETIREMENT ASSETS/LIABILITIES represents any miscellaneous items used in the adjustment to the funded status for net pensions assets/liabilities recognized in the Balance Sheet.
This item is available in the annual original and annual restated time series for detailed Non-U.S. companies, full update.
Healthcare - Unrecognized Net Actuarial Gain/Loss Supplementary (Pension) Data, Annual Item; Field 18845
All Industries: HEALTHCARE - UNRECOGNIZED NET ACTUARIAL GAIN/LOSS represents a measure of the difference between the actual experience and that expected based upon the actuarial assumptions, between two actuarial valuation dates.
This item is available in the annual original and annual restated time series for detailed companies, full update.

Issue 6
© Thomson Financial 2003-2007 317 Confidential Information of Thomson Financial
I I/B/E/S Ticker Descriptive Data, Current Item; Field 06038
All Industries: I/B/E/S TICKER represents the symbol used by I/B/E/S to identify companies for which they track earnings estimates. This item provides a link between the I/B/E/S and Worldscope databases.
ICB Code Descriptive Data, Current Item; Field 07040
All Industries: ICB CODE represents an industry code within the Industrial Classification Benchmark (ICB) which was implemented as a result of a merger of the industrial classification of Dow Jones and FTSE. This benchmark allows for the comparison of companies through four hierarchical levels of industry classification. The ICB Code provided is the subsector code, the lowest level in the hierarchical structure.
Industry Supersector Sector Subsector
0001 Oil & Gas 0500 Oil & Gas 0530 Oil & Gas Producers 0533 Exploration & Production 0537 Integrated Oil & Gas 0570 Oil Equipment &
Services 0573 Oil Equipment & Services
0577 Pipelines 1000 Basic Materials 1300 Chemicals 1350 Chemicals 1353 Commodity Chemicals 1357 Specialty Chemicals 1700 Basic
Resources 1730 Forestry & Paper 1733 Forestry
1737 Paper 1750 Industrial Metals 1753 Aluminium 1755 Nonferrous Metals 1757 Steel 1770 Mining 1771 Coal 1773 Diamonds & Gemstones 1775 General Mining 1777 Gold Mining 1779 Platinum & Precious
Metals 2000 Industrials 2300 Construction &
Materials 2350 Construction & Materials
2353 Building Materials & Fixtures
2357 Heavy Construction 2700 Industrial
Goods & Services 2710 Aerospace & Defense 2713 Aerospace
2717 Defense 2720 General Industrials 2723 Containers & Packaging 2727 Diversified Industrials 2730 Electronic & Electrical
Equipment 2733 Electrical Components & Equipment
2737 Electronic Equipment 2750 Industrial Engineering 2753 Commercial Vehicles &
Trucks 2757 Industrial Machinery

Alphabetical List of Field Definitions - I
Issue 6
© Thomson Financial 2003-2007 318 Confidential Information of Thomson Financial
2770 Industrial Transportation
2771 Delivery Services
2773 Marine Transportation 2775 Railroads 2777 Transportation Services 2779 Trucking 2790 Support Services 2791 Business Support
Services 2793 Business Training &
Employment Agencies 2795 Financial Administration 2797 Industrial Suppliers 2799 Waste & Disposal
Services 3000 Consumer Goods
3300 Automobiles & Parts
3350 Automobiles & Parts 3353 Automobiles
3355 Auto Parts 3357 Tires 3500 Food &
Beverage 3530 Beverages 3533 Brewers
3535 Distilleries & Vintners 3537 Soft Drinks 3570 Food Producers 3573 Farming & Fishing 3577 Food Products 3700 Personal &
Household Goods 3720 Household Goods 3722 Durable Household
Products 3724 Nondurable Household
Products 3726 Furnishings 3728 Home Construction 3740 Leisure Goods 3743 Consumer Electronics 3745 Recreational Products 3747 Toys 3760 Personal Goods 3763 Clothing & Accessories 3765 Footwear 3767 Personal Products 3780 Tobacco 3785 Tobacco 4000 Healthcare 4500 Healthcare 4530 Healthcare Equipment
& Services 4533 Healthcare Providers
4535 Medical Equipment 4537 Medical Supplies 4570 Pharmaceuticals &
Biotechnology 4573 Biotechnology
4577 Pharmaceuticals 5000 Consumer Services
5300 Retail 5330 Food & Drug Retailers 5333 Drug Retailers
5337 Food Retailers & Wholesalers
5370 General Retailers 5371 Apparel Retailers 5373 Broadline Retailers 5375 Home Improvement
Retailers 5377 Specialized Consumer
Services

Alphabetical List of Field Definitions - I
Issue 6
© Thomson Financial 2003-2007 319 Confidential Information of Thomson Financial
5379 Specialty Retailers 5500 Media 5550 Media 5553 Broadcasting &
Entertainment 5555 Media Agencies 5557 Publishing 5700 Travel &
Leisure 5750 Travel & Leisure 5751 Airlines
5752 Gambling 5753 Hotels 5755 Recreational Services 5757 Restaurants & Bars 5759 Travel & Tourism 6000 Telecommunications
6500 Telecommunications
6530 Fixed Line Telecommunications
6535 Fixed Line Telecommunications
6570 Mobile Telecommunications
6575 Mobile Telecommunications
7000 Utilities 7500 Utilities 7530 Electricity 7535 Electricity 7570 Gas, Water &
Multiutilities 7573 Gas Distribution
7575 Multiutilities 7577 Water 8000 Financials 8300 Banks 8350 Banks 8355 Banks 8500 Insurance 8530 Non-life Insurance 8532 Full Line Insurance 8534 Insurance Brokers 8536 Property & Casualty
Insurance 8538 Reinsurance 8570 Life Insurance 8575 Life Insurance 8700 Financial
Services 8730 Real Estate 8733 Real Estate Holding &
Development 8737 Real Estate Investment
Trusts 8770 General Financial 8771 Asset Managers 8773 Consumer Finance 8775 Specialty Finance 8777 Investment Services 8779 Mortgage Finance 8980 Equity Investment
Instruments 8985 Equity Investment Instruments
8990 Non-equity Investment Instruments
8995 Non-equity Investment Instruments
9000 Technology 9500 Technology 9530 Software & Computer Services
9533 Computer Services
9535 Internet 9537 Software 9570 Technology Hardware
& Equipment 9572 Computer Hardware
9574 Electronic Office Equipment
9576 Semiconductors 9578 Telecommunications
Equipment

Alphabetical List of Field Definitions - I
Issue 6
© Thomson Financial 2003-2007 320 Confidential Information of Thomson Financial
Impairment Of Goodwill Supplementary (Expense) Data, Historic Item, Annual Time Series; Field 18225
All Industries: IMPAIRMENT OF GOODWILL represents the loss due to the impairment of goodwill.
This item is populated for the annual, quarterly, semi-annual, trimester, quarterly-cumulative and trimester-cumulative time series. Data for this field is generally not available prior to 2001.
It includes but is not restricted to: All impairment/write-offs or write-downs of goodwill (including any amount described as exceptional/extraordinary) Amortization/impairment of goodwill arising on the acquisition of an equity accounted or associated company
It excludes: Impairment losses for goodwill arising from the initial application of SFAS 142, and resulting from a transitional impairment test, which are reported as a change in accounting principles. Unamortized negative goodwill written off under the provisions of SFAS 142.
Impairment Of Other Intangibles Supplementary (Expense) Data, Historic Item, Annual Time Series; Field 18226
All Industries: IMPAIRMENT OF OTHER INTANGIBLES represents the loss due to impairment of intangible assets, other than goodwill.
This item is populated for the annual, quarterly, semi-annual, trimester, quarterly-cumulative and trimester-cumulative time series. Data for this field is generally not available prior to 2002.
It includes but is not restricted to: All impairment/write-offs or write-downs of other intangibles (including any amount described as exceptional/extraordinary)
Impairment Of Property, Plant & Equipment Supplementary (Expense) Data, Historic Item, Annual Time Series; Field 18274
All Industries: IMPAIRMENT OF PROPERTY, PLANT & EQUIPMENT represents the loss due to impairment of property, plant and equipment.
This item is populated for the annual, quarterly, semi-annual, trimester, quarterly-cumulative and trimester-cumulative time series. Data for this field is generally not available prior to 2002.
It includes but is not restricted to: All impairment/write-offs or write-downs of property, plant and equipment (including any amount described as exceptional/extraordinary)
Impairment Of Financial Fixed Assets Supplementary (Expense) Data, Historic Item, Annual Time Series; Field 18275
All Industries: IMPAIRMENT OF FINANCIAL FIXED ASSETS represents the loss due to impairment/write-downs or write-offs of the company’s financial fixed assets investments.

Alphabetical List of Field Definitions - I
Issue 6
© Thomson Financial 2003-2007 321 Confidential Information of Thomson Financial
This item is populated for the annual, quarterly, semi-annual, trimester, quarterly-cumulative and trimester-cumulative time series. Data for this field is generally not available prior to 2001.
It includes but is not restricted to: All impairment/write-offs or write-downs of the company’s financial fixed assets investments (including any amount described as exceptional/extraordinary)
Inactive Date Descriptive Data, Current Item; Field 07015
All Industries: INACTIVE DATE represents the day on which a company became privately held, merged, liquidated, or otherwise became inactive.
This item is also available at the security level.
Inactive Date (Security) Descriptive Data, Current Item; Field 07012
All Industries: INACTIVE DATE (SECURITY) represents the date that the share of a company ceases to exist.
Footnotes: AB. Exchange/Cancellation of shares AC. Merger of shares, multiple share information no longer provided
Inactive Date (Security) - Mult Share 1, 2, 3, 4, 5, 6, 7 Descriptive Data, Current Items; Fields 20011, 20111, 20211, 20311, 20411, 20511, 20611
All Industries: INACTIVE DATE (SECURITY) - MULT SHARE 1, 2, 3, 4, 5, 6, 7 represents the date that the share of a company ceases to exist.
Footnotes: AB. Exchange/cancellation shares AC. Merger of shares, multiple share information. Information no longer provided.
Includes Extraordinary Credit/Charge Per Share Stock Data, Annual Item; Field 05225
All Industries: INCLUDES EXTRAORDINARY CREDIT/CHARGE PER SHARE represents the per share amount of the gain/loss net of taxes resulting from nonrecurring or unusual events.
This data is on a calendar year basis for U.S. corporations and a fiscal year basis for non-U.S. corporations. Data for this field is generally not available prior to 1993.
Includes Extraordinary Credit/Charge Per Share Stock Data; Annual Item; Field 18259
All Industries: INCLUDES EXTRAORDINARY CREDIT/CHARGE PER SHARE represents the per share amount of the gain/loss net of taxes resulting from nonrecurring or unusual events included in the net income of a company.
Alphabetical List of Field Definitions - I
Issue 6
© Thomson Financial 2003-2007 322 Confidential Information of Thomson Financial
This item is only populated for the interim time series. It is not available prior to 1998 and is shown per 1,000 shares for Brazilian companies.
Includes Pre-tax Extraordinary Credit/Charge Per Share Stock Data, Annual Item; Field 05227
All Industries: INCLUDES PRE-TAX EXTRAORDINARY CREDIT/CHARGE PER SHARE represents the per share amount of the pre-tax gain/loss resulting from nonrecurring or unusual events.
This data is on a calendar year basis for U.S. corporations and a fiscal year basis for non-U.S. corporations. Data for this field is generally not available prior to 1993.
Includes Pre-tax Extraordinary Credit/Charge Per Share Stock Data; Annual Item; Field 18261
All Industries: INCLUDES PRE-TAX EXTRAORDINARY CREDIT/CHARGE PER SHARE represents the per share amount of the pre-tax gain/loss resulting from nonrecurring or unusual events included in the net income of a company.
This item is only populated for the interim time series based on the availability of underlying data. It is not available prior to 1998 and is shown per 1,000 shares for Brazilian companies.
Income From Continuing Operations Supplementary (Income) Data, Annual Item; Field 18150
All Industries: INCOME FROM CONTINUING OPERATIONS represents the amount earned by a company before any adjustment for preferred dividends, discontinued operations and extraordinary items. Data for this field is generally not available prior to 1996 for non-U.S. companies and 1991 for U.S. companies.
Footnotes: A. No standard text
Income Tax Credits Income Data, Annual Item; Field 18185
All Industries: INCOME TAX CREDITS represent a direct dollar-for-dollar reduction in tax liability. It is not a tax credit as a result of deficit earnings where a company would have no tax liability.
Data for this field is generally not available prior to 1991. It includes but is not restricted to:
Tax losses carryforward/carrybackward Royalty tax credits Research and development tax credits
Income Taxes Expense Data, Annual Item; Field 01451
All Industries: INCOME TAXES represent all income taxes levied on the income of a company by federal, state and foreign governments. It includes but is not restricted to:

Alphabetical List of Field Definitions - I
Issue 6
© Thomson Financial 2003-2007 323 Confidential Information of Thomson Financial
Federal income taxes State income taxes Foreign income taxes Charges in lieu of income taxes Charges equivalent to investment tax credit Income taxes on dividends or earnings of unconsolidated subsidiaries or minority interest, if reported before taxes Deferred taxation charges
It excludes: Domestic International Sales Corporation taxes Ad Valorem taxes Excise taxes Windfall profit taxes Taxes other than income General and services taxes
Footnotes: A. Includes other taxes B. Not comparable and includes other taxes C. Includes only domestic tax D. Includes employee profit sharing F. Exempt of income taxes G. Includes minority interests
Income Taxes Payable Liability Data, Annual Item; Field 03063 Industrials, Insurance:
INCOME TAXES PAYABLE represents an accrued tax liability which is due within the normal operating cycle of the company.
Data for this field is generally not available prior to 1989. It excludes:
Taxes other than income Ad Valorem taxes Value Added taxes General and Services taxes Excise taxes Windfall profit taxes
Footnotes: A. Includes other taxes B. Includes employee profit sharing
Increase/Decrease In Accounts Payable Cash Flow Data, Annual Item; Field 04827
Industrials, Other Financial Companies: INCREASE/DECREASE IN ACCOUNTS PAYABLE represents the change in the amount of accounts payable from one year to the next as reported in the cash flow statement.
Data for this field is generally not available prior to 1992. Footnotes:
A. No standard text
Alphabetical List of Field Definitions - I
Issue 6
© Thomson Financial 2003-2007 324 Confidential Information of Thomson Financial
Increase/Decrease – Cash – GAAP Supplementary (Cash Flow) Data, Annual Item; Field 06970
All Industries: INCREASE/DECREASE – CASH – GAAP represents the change in cash and short term investments from one year to the next for non-U.S. companies adjusted to conform to U.S. Generally Accepted Accounting Principles.
This item is presented in U.S. dollars (converted at the company's fiscal year twelve month average exchange rate). It is only available for ADRs trading on the NYSE, ASE or NASDAQ and is generally not available prior to 1994.
Increase/Decrease In Cash and Short Term Investments Cash Flow Data, Annual Item; Field 04851
All Industries: INCREASE/DECREASE IN CASH AND SHORT TERM INVESTMENTS represent the change in cash and short term investments from one year to the next. This item is available only when the Statement of Changes in Financial Position is based on cash and short term investments.
Increase/Decrease In Federal Home Loan Advances Cash Flow Data, Annual Item; Field 04443
Banks: INCREASE/DECREASE IN FEDERAL HOME LOAN ADVANCES represents the increase or decrease in federal home loan advances from one year to the next as reported in the cash flow statement.
Data for this field is generally not available prior to 1991.
Increase/Decrease In Income Tax Payable Cash Flow Data, Annual Item; Field 04828
Industrials, Other Financial Companies: INCREASE/DECREASE IN INCOME TAX PAYABLE represents the change in the amount of income taxes payable from one year to the next as reported in the cash flow statement.
Data in this field is generally not available prior to 1992. Footnotes:
A. No standard text
Increase/Decrease In Other Accruals Cash Flow Data, Annual Item; Field 04829
Industrials, Other Financial Companies: INCREASE/DECREASE IN OTHER ACCRUALS represents the change in the amount of accruals from one year to the next as reported in the cash flow statement.
Data in this field is generally not available prior to 1992. Footnotes:
A. No standard text

Alphabetical List of Field Definitions - I
Issue 6
© Thomson Financial 2003-2007 325 Confidential Information of Thomson Financial
Increase/Decrease In Short Term Borrowings Cash Flow Data, Annual Item; Field 04821
All Industries: INCREASE/DECREASE IN SHORT TERM BORROWINGS represent the increase or decrease in short term borrowings from one year to the next as reported in the cash flow statement.
Footnotes: A. Included in funds from/for other operating activities or long term debt
Increase/Decrease In Working Capital Supplementary (Cash Flow) Data, Annual Item; Field 04900
All Industries: INCREASE/DECREASE IN WORKING CAPITAL represents the change in working capital from one year to the next year.
Increase In Deposits Cash Flow Data, Annual Item; Field 04441
Banks: INCREASE IN DEPOSITS represents the increase in deposits from one year to the next.
Data for this field is generally not available prior to 1991. It includes but is not restricted to:
Net changes in deposits if an increase Transferred deposits Proceeds from the issuance of certificates of deposits Proceeds from receipt of public fund deposits
Footnotes: A. Net of decrease B. No standard text
Increase In Investments Cash Flow Data, Annual Item; Field 04760
All Industries: INCREASE IN INVESTMENTS represents the investments bought during the accounting period of the company.
Data for this field is generally not available prior to 1989. It includes but is not restricted to:
Purchase of portfolio investments Increase in short term investments Increase in marketable securities (if using FASB 95) Increase in short term investments when disclosed with investing activities
Footnotes: A. Increase in investments, net of decrease B. No standard text

Alphabetical List of Field Definitions - I
Issue 6
© Thomson Financial 2003-2007 326 Confidential Information of Thomson Financial
Increase In Loans Cash Flow Data, Annual Item; Field 04753
Banks: INCREASE IN LOANS represents the increase in loans from one year to the next.
Data for this field is generally not available prior to 1991. It includes but is not restricted to:
Loans originated or acquired Leases made to customers Purchase of loan portfolios Net increase in customer loans (if an increase)
Index Information See STOCK INDEX INFORMATION
Indicated Dividend Rate Stock Data, Current Item; Field 05190
All Industries: INDICATED DIVIDEND RATE represents the last dividend declared times four and includes any extras declared in the last twelve months for U.S. and Canadian companies. This is the dividends expected to be paid by the company during the next twelve months. For non U.S./Canadian companies, it is the last twelve months dividends.
This item is available at the security level and is shown per 1,000 shares for Brazilian companies.
Indicator – ADR/U.S. Foreign Filer Descriptive Data, Current Item; Field 11503
All Industries: INDICATOR – ADR indicates that the Worldscope Identifier represents an ADR (A) or a Foreign Filer (F).
Indicator - Currently A Multiple Share Company Descriptive Data, Current Item; Field 11501
All Industries: INDICATOR - CURRENTLY A MULTIPLE SHARE COMPANY indicates which companies currently have more than one type of common/ordinary share. If a company has more than one type of share an "X" would be provided in this field. If a company had more than one type of common/ordinary share in the past and all but one is currently inactive, the data will still be provided in this field.
Indicator – Data Update Descriptive Data, Annual & Interim Item; Field 07034
All Industries: INDICATOR – DATA UPDATE indicates the status of data provided in the annual and interim time series. The following indicators are provided:
Indicator Definition 1 Preliminary 2 FAST 3 Final

Alphabetical List of Field Definitions - I
Issue 6
© Thomson Financial 2003-2007 327 Confidential Information of Thomson Financial
Preliminary indicates data sourced from News. It may be used for all time series. A Fast indicator may be provided for annual time series data where key data is provided from final documents. See Fast Template on page XX for content. The Final indicator is used for all time series when updates are complete from final sources.
This item is only available at the company level.
Indicator – Limited Data Set Company Supplementary Data, Current Item; Field 11519
All Industries: INDICATOR – LIMITED DATA SET COMPANY when available indicates that only a limited set of data items is available for the company.
Indicator – Primary Issue Security Data, Current Item; Field 11526
All Industries: INDICATOR – PRIMARY ISSUE is provided on the security level identifier for the share type selected as the primary issue of the company. The prices and dividends for this share type are shown at the company level. An “X” is provided in this field on the security identifier selected as the primary issue.
Indicator – Restated Data Exists Descriptive Data, Historic Item; Annual & Interim Item; Field 11556
All Industries Indicator – Restated Data Exists indicates that Restated Time series content is available for a period. This indicator is populated on the original accounts data (content contained in Time Series Frequency codes A, Q, R, S, T, U) for the period restated data has been provided. If 11556 = 1, restated data exists If 11556 = 2, restated data exists and is now provided in the quarterly (Q & R) series
Example: If year 2004 Time Series Frequency A001 has a value of 1 in field 11556, then year 2004 Time Series Frequency B001 will contain restated content. If year 2004 S001 has a value of 2 in field 11556, then year 2004 Time Series Frequency C001 and C002 will contain restated accounts. This is the case where a company has switched from semi-annual to quarterly reporting.
Indicator – Restatement Type Descriptive Data, Historic Item; Annual & Interim Item; Field 11557
All Industries Indicator – Restatement Type indicates if the restated data provided is Restated or Revised. Restated is defined as a change/event that occurred subsequent to the annual period for which the interim or annual restatement is provided. Revised is defined as a change/event which occurred within the annual period in which the interim is a part of. This indicator is provided on the Restated Times Series Frequency codes(B,C,E,F,K,L) If 11557 = 1, data is restated If 11557 = 2, data is revised

Alphabetical List of Field Definitions - I
Issue 6
© Thomson Financial 2003-2007 328 Confidential Information of Thomson Financial
Example 1: A company switches to a new accounting standard from the first interim period for fiscal year 2005. Field 11557 on the restated annual and interim time series for 2004 is then 1. Example 2: A company switches to a new accounting standard with the publication of the annual report for fiscal year 2005. Value for field 11557 on the restated interim time series for 2004 is then 2. Example 3: A company restates its first quarter when releasing second quarter results for 2005. Value for field 11557 on the 2005 restated quarter for 2005 is then 2.
Indicator – Early Restatement Release Descriptive Data, Historic Item; Annual & Interim Item; Field 11558
All Industries Indicator – Early Release indicates if the company has announced restated data early i.e. prior to the publication of comparative data in the next period financial report. Data may be unaudited. The existing accounting standard field (07546) can be used to identify if the restated data is audited. In some cases, only key data may be provided. This indicator was added to support the transition period for IFRS changes. If 11558 = 1, only a selection of key items have been provided by the company on a restated basis If 11558 = 2, a company has released a full detail restatement prior to publication of comparative data in the next period financial report
Indicator – Restatement Reason Code Descriptive Data, Historic Item; Annual & Interim Item; Field 11559
All Industries Restatement Reason Code provides standardized coding for identifying the general reason restated accounts have been provided. Only one code is provided. If a company adopted a Change in GAAP followed and also discontinued operations, a code would be given for Change in GAAP followed only. 1 – Where the accounts are restated due to Discontinued Operations, Spin-offs or de-mergers. 2 – Where the accounts are restated due to the adoption of a new accounting policy or policies related to specific item or items 3 – Where the accounts are restated due to Acquisition/Mergers 4 – Where the accounts are restated due to a change in accounting GAAP followed by the company 5 – Where the accounts are restated due to change in accounting GAAP followed together with other events 6 – Where the accounts are restated due to multiple events 7 – Where the accounts are restated due to reasons other than those noted above Existing field 07536 (accounting standards followed) can be used to identify the GAAP standard followed. Code 23 identifies if a company has adapted IFRS. Example: If 11559 =4 and 07536 = 23, the Restatement is for a company which has adopted IFRS. A company can also issue restated data to correct for accounting irregularities. This is when a company has made a material error in the application of existing accounting standards or even has committed fraud. The Worldscope treatment of accounting irregularities remains the same: the figures will be amended within the original time series.

Alphabetical List of Field Definitions - I
Issue 6
© Thomson Financial 2003-2007 329 Confidential Information of Thomson Financial
Indicator – Sponsored/Unsponsored Descriptive Data, Current Item; Field 11502
All Industries: INDICATOR – SPONSORED/UNSPONSORED indicates whether or not the ADR is a sponsored or unsponsored program. An "S" in this field indicates sponsored, a "U" indicates unsponsored.
This item is only available for ADRs.
Indicator – Trades ADR Descriptive Data, Current Item; Field 11496
All Industries: INDICATOR - ADR indicates companies which have American Depository Receipts trading on a U.S. exchange. If a company has ADRs and the ADRs record is available on Worldscope, an "X" would be provided in this field.
Industry Group Descriptive Data, Current Item; Field 06011
All Industries: INDUSTRY GROUP represents a four digit numeric code assigned to the company to represent its industry group. Each company is classified into a major industry group, represented by the first two digits of the code. In addition each company is further classified within its major group into a subordinated industry group. The following is the definition of the industry codes:
1300 AEROSPACE 1310 Engines, Components & Parts Manufacturers 1320 Military & Commercial Aircraft Manufacturers 1330 Missile & Missile Parts Manufacturers 1340 Private & Business Aircraft Manufacturers 1350 Miscellaneous Aerospace 1600 APPAREL 1610 Apparel Manufacturers 1620 Diversified Apparel Manufacturers 1630 Hosiery Manufacturers 1640 Shoe Manufacturers
1900 AUTOMOTIVE 1910 Diversified Automotive Manufacturers 1920 Original Parts & Accessories Manufacturers 1930 Replacement Parts & Accessories Manufacturers 1940 Truck & Trailer Manufacturers 2200 BEVERAGES 2210 Brewers 2220 Distillers 2230 Soft Drink Producers & Bottlers

Alphabetical List of Field Definitions - I
Issue 6
© Thomson Financial 2003-2007 330 Confidential Information of Thomson Financial
2500 CHEMICALS 2510 Diversified Chemical Manufacturers 2520 Household Chemicals 2530 Industrial Chemicals & Gases Manufacturers 2540 Paint & Resin Manufacturers 2550 Rubber & Tire Manufacturers 2560 Sulphur Producers 2570 Synthetic Fibers 2580 Miscellaneous Chemicals 2800 CONSTRUCTION 2810 Diversified Construction Companies 2820 Brick, Clay & Refractory Products 2830 Builders' Metal Products 2840 Cement Products 2850 Construction Aggregates 2860 Construction Machinery 2870 Engineering & Contracting Services 2880 Home Builders 2890 Gypsum, Lumber & Building Supplies 2891 Plumbing, Heating & Air Conditioning 2892 Prefabricated & Mobile Home Builders 2893 Miscellaneous Construction 3100 DIVERSIFIED 3110 General Diversified 3400 DRUGS, COSMETICS & HEALTH CARE 3410 Diversified 3420 Cosmetics & Toiletries 3430 Ethical Drug Manufacturers 3440 Medical, Surgical & Dental Suppliers 3700 ELECTRICAL 3710 Diversified Electrical Manufacturers 3720 Appliances & Consumer Products 3730 Industrial & Commercial Electrical Equipment 3740 Power Transmission Equipment 3750 Miscellaneous Electrical 4000 ELECTRONICS 4010 Diversified 4020 Automatic Controls 4030 Electronic Data Processing Equipment

Alphabetical List of Field Definitions - I
Issue 6
© Thomson Financial 2003-2007 331 Confidential Information of Thomson Financial
4040 Government & Defense Electronic Systems 4050 Instruments, Gauges & Meters 4060 Parts & Components 4070 Radio, T.V. & Phonograph Manufacturers 4080 Systems & Subsystems 4090 Miscellaneous Electronics 4300 FINANCIAL 4310 Commercial Banks - Multi-Bank Holding Companies 4320 Commercial Banks - One Bank Holding Companies 4350 Investment Companies 4360 Commercial Finance Companies 4370 Insurance Companies 4380 Land and Real Estate 4390 Personal Loan Company 4391 Real Estate Investment Trust Companies, including Business Trusts 4392 Rental & Leasing 4393 Savings & Loan Holding Companies 4394 Securities Brokerage Firms 4395 Miscellaneous Financial 4600 FOOD 4610 Diversified 4620 Bakers 4630 Canners & Processors 4640 Confectionery Goods 4650 Dairy Products 4660 Grain, Flour & Cereal 4670 Meat Packers 4680 Sugar Producer 4690 Miscellaneous Food 4900 MACHINERY & EQUIPMENT 4910 Diversified Machinery 4920 Agricultural Machinery 4930 Business Machines & Office Equipment 4940 Construction Machinery 4950 Engines 4960 Gauges & Meters Manufacturers 4970 Industrial Machinery 4980 Machine Tools 4990 Portable Tools 4991 Transportation Equipment 4992 Miscellaneous Machinery & Equipment
Alphabetical List of Field Definitions - I
Issue 6
© Thomson Financial 2003-2007 332 Confidential Information of Thomson Financial
5200 METAL PRODUCERS 5210 Diversified 5220 Aluminum Producers 5230 Copper Producers 5240 Gold Producers 5250 Iron Ore Producers 5260 Lead & Zinc Producers 5270 Silver Producers 5280 Steel Producers - Integrated 5290 Steel Producers - Non-Integrated 5291 Steel Producers - Specialty 5292 Miscellaneous Metal Producers 5500 METAL PRODUCT MANUFACTURERS 5510 Diversified 5520 Bearing Manufacturers 5530 Metal Containers 5540 Metal Fasteners 5550 Supplies & Distributors 5560 Wire, Chain & Spring 5570 Miscellaneous Metal Products Manufacturers 5800 OIL, GAS, COAL & RELATED SERVICES 5810 Coal Producers 5820 Crude Oil & Natural Gas Producers 5830 Holding Companies 5840 Integrated Domestic Oil Producers 5850 Integrated International Oil Producers 5860 Liquefied Petroleum Gas Distributors 5870 Exploration, Drilling Service & Equipment 5880 Oil Refiners & Distributors 5890 Miscellaneous Oil, Gas & Coal 6100 PAPER 6110 Diversified 6120 Packaging Products 6130 Printing & Writing Paper 6140 Miscellaneous Paper 6400 PRINTING & PUBLISHING 6410 Book Publishers 6420 Magazine Publishers 6430 Newspaper Publishers
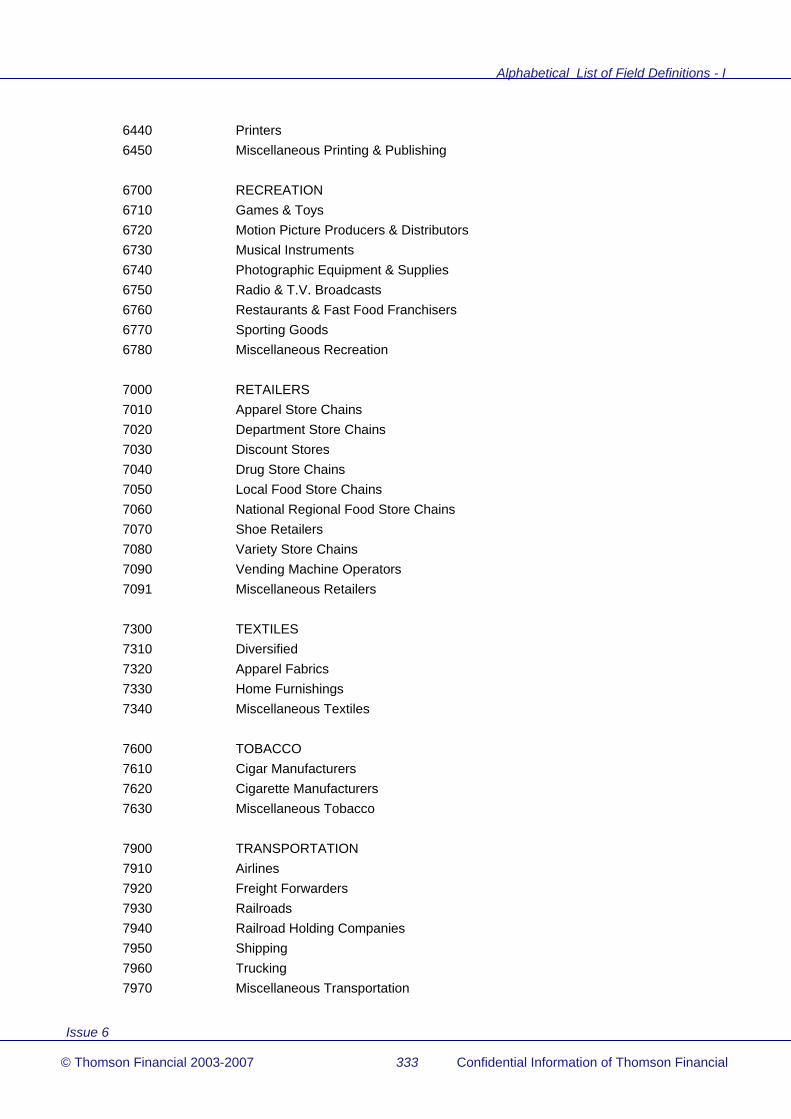
Alphabetical List of Field Definitions - I
Issue 6
© Thomson Financial 2003-2007 333 Confidential Information of Thomson Financial
6440 Printers 6450 Miscellaneous Printing & Publishing 6700 RECREATION 6710 Games & Toys 6720 Motion Picture Producers & Distributors 6730 Musical Instruments 6740 Photographic Equipment & Supplies 6750 Radio & T.V. Broadcasts 6760 Restaurants & Fast Food Franchisers 6770 Sporting Goods 6780 Miscellaneous Recreation 7000 RETAILERS 7010 Apparel Store Chains 7020 Department Store Chains 7030 Discount Stores 7040 Drug Store Chains 7050 Local Food Store Chains 7060 National Regional Food Store Chains 7070 Shoe Retailers 7080 Variety Store Chains 7090 Vending Machine Operators 7091 Miscellaneous Retailers 7300 TEXTILES 7310 Diversified 7320 Apparel Fabrics 7330 Home Furnishings 7340 Miscellaneous Textiles 7600 TOBACCO 7610 Cigar Manufacturers 7620 Cigarette Manufacturers 7630 Miscellaneous Tobacco 7900 TRANSPORTATION 7910 Airlines 7920 Freight Forwarders 7930 Railroads 7940 Railroad Holding Companies 7950 Shipping 7960 Trucking 7970 Miscellaneous Transportation

Alphabetical List of Field Definitions - I
Issue 6
© Thomson Financial 2003-2007 334 Confidential Information of Thomson Financial
8200 UTILITIES 8210 Communications 8220 Electric Power Companies 8230 Electric Power Holding Companies 8240 Electric Power & Gas Companies 8250 Natural Gas Distributors 8260 Natural Gas Holding Companies 8270 Natural Gas Pipelines 8280 Water Companies 8500 MISCELLANEOUS 8510 Advertising Agencies 8520 Furnishings 8530 Glass 8540 Hotel & Motel Chains 8550 Medical Services 8560 Industrial Abrasives 8570 Scientific Equipment & Supplies 8580 Service Organizations 8590 Shipbuilding 8591 Wholesalers 8592 Miscellaneous Companies
Insurance Reserves – GAAP Supplementary (Liability) Data, Annual Item; Field 06740
Insurance Companies: INSURANCE RESERVES – GAAP represents the insurance reserves of a non-U.S. company adjusted to conform to U.S. Generally Accepted Accounting Principles. See definition for INSURANCE RESERVES – TOTAL for additional information.
This item is presented in U.S. dollars (converted at the company's fiscal year end exchange rate). It is only available for ADRs trading on the NYSE, ASE or NASDAQ and is generally not available prior to 1994.
Insurance Reserves - Total Liability Data, Annual Item; Field 03030
Insurance Companies: INSURANCE RESERVES - TOTAL represent the sum of benefit and loss reserves, unearned premiums, policy and contract claims and other reserves.
Insurance Reserves - 1 Yr Annual Growth Growth Rate, Annual Item; Field 08661
Insurance Companies: (Current Year's Total Insurance Reserves / Last Year's Total Insurance Reserves - 1) * 100
This calculation uses restated data for last years values where available

Alphabetical List of Field Definitions - I
Issue 6
© Thomson Financial 2003-2007 335 Confidential Information of Thomson Financial
Insurance Reserves - 5 Yr Annual Growth Growth Rate, Annual Item; Field 08665
Insurance Companies: ((Current Year's Total Insurance Reserves / Total Insurance Reserves six years ago, reduced to a compound annual rate) - 1) * 100
Intangible Other Assets – GAAP Supplementary (Asset) Data, Annual Item; Field 06694
All Industries: INTANGIBLE OTHER ASSETS – GAAP represents all other intangible assets except for Goodwill adjusted to conform to U.S. Generally Accepted Accounting Principles. See definition for INTANGIBLE OTHER ASSETS for additional information.
This item is presented in U.S. dollars (converted at the company's fiscal year end exchange rate). It is only available for ADRs trading on the NYSE, ASE or NASDAQ and is generally not available prior to 1994.
Interbank Loans Asset Data, Annual Item; Field 02055
Banks: INTERBANK LOANS represent transactions between banks that are not classified as cash. This item is only available for non-U.S. banks. It includes but is not restricted to:
Claims on banks Amounts due from credit/financial institutions Placings for banks Overdrafts from banks Deposits with Banks (other than Central Banks) Call Loans Due from banks Commercial papers and other debt purchased (Japan) Money at call and short notice
Footnotes: F. Includes some type of loans G. Includes near cash items I. Includes short term investments
Interest & Fees On Loans Income Data, Annual Item; Field 01007
Banks: INTEREST & FEES ON LOANS represent the amount that a borrower must pay the bank for the use of its depositors' money and other charges on loans such as loan origination fees. It includes but is not restricted to:
Lending to customers (U.K.) Lease Receivables (U.K.) Interest on Loans and discounts (Spain)
Footnotes: A. Includes interest income on bank deposits B. No standard text

Alphabetical List of Field Definitions - I
Issue 6
© Thomson Financial 2003-2007 336 Confidential Information of Thomson Financial
Interest Capitalized Income Data, Annual Item; Field 01255
All Industries: INTEREST CAPITALIZED represents an allowance on borrowed funds used for long term projects or construction.
For Utilities, it includes allowance for funds used during construction that are related to borrowed monies. It excludes allowance for borrowed funds used during construction that are not interest related.
Interest Coverage See FIXED CHARGE COVERAGE RATIO
Interest Expense - Total Expense Data, Annual Item; Field 01075
Banks, Other Financial Companies: INTEREST EXPENSE - TOTAL represents the total amount of interest paid by a bank or other financial company. It includes but is not restricted to:
Interest expense on deposits Interest expense on federal funds Interest expense on commercial paper Interest expense on short term borrowing Interest expense on long term debt Interest expense on securities purchased under resale agreements
For Other Financial Companies: It includes but is not restricted to:
Interest expense on debt (field 01251) Interest capitalized (field 01255)
Footnotes: A. Includes commissions and fees paid B. Includes interest expense on debt
Interest Expense On Bank Deposits Expense Data, Annual Item; Field 01072
Banks: INTEREST EXPENSE ON BANK DEPOSITS represents the total interest paid by the bank on their savings and other time deposits. It includes but is not restricted to:
Interest on deposits, current accounts and other borrowings Interest on current and demand accounts Interest on savings accounts Interest on other time deposits

Alphabetical List of Field Definitions - I
Issue 6
© Thomson Financial 2003-2007 337 Confidential Information of Thomson Financial
Interest Expense On Debt Expense Data, Annual Item; Field 01251
All Industries: INTEREST EXPENSE ON DEBT represents the service charge for the use of capital before the reduction for interest capitalized. If interest expense is reported net of interest income, and interest income cannot be found the net figure is shown. It includes but is not restricted to:
Interest expense on short term debt Interest expense on long term debt and capitalized lease obligations Amortization expense associated with the issuance of debt Similar charges
Footnotes: A. Net expense B. Similar charges are included C. Other financial charges may be included D. Net interest expense and similar charges may be included J. Includes other income or expense L. Includes income taxes
Interest Expense On Federal Funds Expense Data, Annual Item; Field 01073
Banks: INTEREST EXPENSE ON FEDERAL FUNDS represents the interest paid by the bank on federal funds bought from other banks. It includes but is not restricted to:
Interest expense on securities purchased under resale agreements Footnotes:
A. Included in interest expense on other borrowed funds
Interest Expense On Other Borrowed Funds Expense Data, Annual Item; Field 01074
Banks: INTEREST EXPENSE ON OTHER BORROWED FUNDS represents interest paid on all short term borrowings except federal funds and securities purchased under resale agreements. It includes but is not restricted to:
Interest on short term debt Interest on commercial paper Interest on due to banks (Spain)
Footnotes: A. Includes interest expense on federal funds purchased/securities purchased under resale agreements
Interest Income See NON-OPERATING INTEREST INCOME

Alphabetical List of Field Definitions - I
Issue 6
© Thomson Financial 2003-2007 338 Confidential Information of Thomson Financial
Interest Income (Cash Flow) Supplementary (Cash Flow) Data, Annual Item; Field 04149
All Industries: INTEREST INCOME represents the amount of interest received during the year as shown on the cash flow statement.
Data for this field is generally not available prior to 1992. Footnotes:
A. No standard text B. Net income C. May include other financial income
Interest Income - Total Income Data, Annual Item; Field 01016
Banks, Other Financial Companies: INTEREST INCOME - TOTAL represents income received from all earning assets such as loans and investment securities. It includes but is not restricted to:
Interest and fees on loans Interest on federal funds Interest on bank deposits Interest on state, county and municipalities funds Interest on U.S. government and federal agencies securities Federal funds sold and securities purchased under resale agreements Lease financing Net leasing revenues Other interest or dividend income Interest on investments - listed (U.K.) Interest on investments - unlisted (U.K.) Interest on government debt securities Interest on equity investments Placings with banks (U. K.) Short term funds (U.K.) Interest on funds at central bank Interest on funds from banks (Spain) Lending to customers (U.K.) Lease receivables (U.K) Interest on loans and discounts (Spain) Interest on investment securities Interest on mortgage-backed securities Dividend income
Footnotes: A. Includes commissions and fees B. Net of interest expenses C. Includes foreign exchange gain/loss D. Includes investment income F. Includes other income
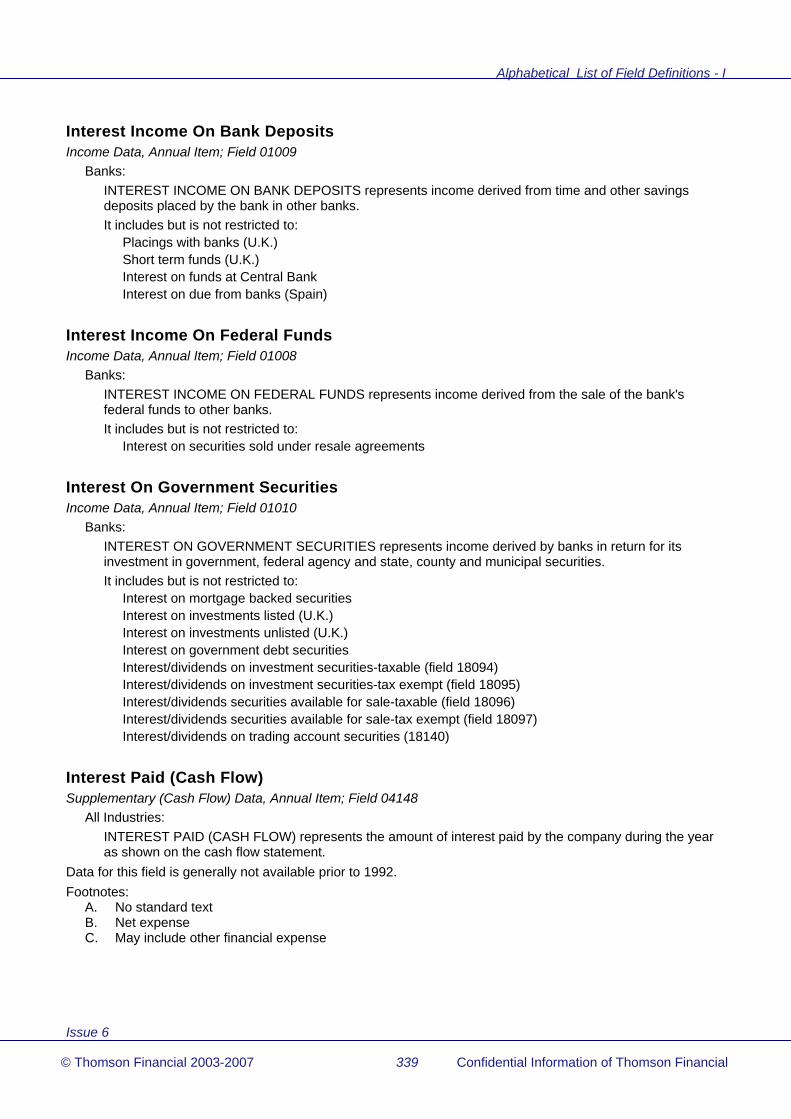
Alphabetical List of Field Definitions - I
Issue 6
© Thomson Financial 2003-2007 339 Confidential Information of Thomson Financial
Interest Income On Bank Deposits Income Data, Annual Item; Field 01009
Banks: INTEREST INCOME ON BANK DEPOSITS represents income derived from time and other savings deposits placed by the bank in other banks. It includes but is not restricted to:
Placings with banks (U.K.) Short term funds (U.K.) Interest on funds at Central Bank Interest on due from banks (Spain)
Interest Income On Federal Funds Income Data, Annual Item; Field 01008
Banks: INTEREST INCOME ON FEDERAL FUNDS represents income derived from the sale of the bank's federal funds to other banks. It includes but is not restricted to:
Interest on securities sold under resale agreements
Interest On Government Securities Income Data, Annual Item; Field 01010
Banks: INTEREST ON GOVERNMENT SECURITIES represents income derived by banks in return for its investment in government, federal agency and state, county and municipal securities. It includes but is not restricted to:
Interest on mortgage backed securities Interest on investments listed (U.K.) Interest on investments unlisted (U.K.) Interest on government debt securities Interest/dividends on investment securities-taxable (field 18094) Interest/dividends on investment securities-tax exempt (field 18095) Interest/dividends securities available for sale-taxable (field 18096) Interest/dividends securities available for sale-tax exempt (field 18097) Interest/dividends on trading account securities (18140)
Interest Paid (Cash Flow) Supplementary (Cash Flow) Data, Annual Item; Field 04148
All Industries: INTEREST PAID (CASH FLOW) represents the amount of interest paid by the company during the year as shown on the cash flow statement.
Data for this field is generally not available prior to 1992. Footnotes:
A. No standard text B. Net expense C. May include other financial expense

Alphabetical List of Field Definitions - I
Issue 6
© Thomson Financial 2003-2007 340 Confidential Information of Thomson Financial
Interest Payable Supplementary (Liability) Data, Annual Item; Field 03062
Industrials, Other Financial Companies: INTEREST PAYABLE represents the amount of interest that is due to be paid within one year.
Data for this field is generally not available prior to 1992. Footnotes:
A. No standard text
Interest Rate - Estimated Average Profitability Ratio, Annual Item; Field 08356
All Industries: Interest Expense on Debt / (Short Term Debt & Current Portion of Long Term Debt + Long Term Debt) * 100
Interest Rate - Estimated Average - 5 Yr Avg Profitability Ratio, Annual Item; Field 08360
All Industries: Arithmetic average of the last five years of Interest Rates - Estimated Average.
Interest/Dividends On Investment Securities - Taxable Supplementary (Income) Data, Annual Item; Field 18094
Banks: INTEREST/DIVIDENDS ON INVESTMENT SECURITIES - TAXABLE represent the income derived by banks on its taxable investment securities.
Data for this field is generally not available prior to 1993. It includes but is not restricted to:
Interest on mortgage-backed securities Interest on investments - listed Interest on investments - unlisted Interest on government debt securities
Footnotes: A. No standard text
Interest/Dividends On Investment Securities - Tax Exempt Supplementary (Income) Data, Annual Item: Field 18095
Banks: INTEREST/DIVIDENDS ON SECURITIES AVAILABLE FOR SALE - TAX EXEMPT represents the income derived by banks on its tax exempt investment securities available for sale.
Data for this field is generally not available prior to 1993. Footnotes:
A. No standard text

Alphabetical List of Field Definitions - I
Issue 6
© Thomson Financial 2003-2007 341 Confidential Information of Thomson Financial
Interest/Dividends On Securities Available For Sale - Taxable Supplementary (Income) Data, Annual Item; Field 18096
Banks: INTEREST/DIVIDENDS ON SECURITIES AVAILABLE FOR SALE - TAXABLE represents the income derived by banks on its taxable investment securities available for sale.
Data for this field is generally not available prior to 1993. It includes but is not restricted to:
Interest on mortgage-backed securities Interest on investments - listed Interest on investments - unlisted Interest on government debt securities
Footnotes: A. No standard text
Interest/Dividends On Securities Available For Sale - Tax Exempt Supplementary (Income) Data, Annual Item; Field 18097
Banks: INTEREST/DIVIDENDS ON SECURITIES AVAILABLE FOR SALE - TAX EXEMPT represents the income derived by banks on its tax exempt investment securities available for sale.
Data for this field is generally not available prior to 1993. Footnotes:
A. No standard text
Interest/Dividends On Trading Account Securities Supplementary (Income) Data, Annual Item; Field 18098
Banks: INTEREST/DIVIDENDS ON TRADING ACCOUNT SECURITIES represent the income derived by banks on its trading account securities.
Data for this field is generally not available prior to 1993. Footnotes:
A. No standard text
Interest Receivables Asset Data, Annual Item; Field 02280
Banks: INTEREST RECEIVABLES represents all the interest income due but not yet collected.
Interim Net Profit - Quarter 1, 2, 3, 4 Supplementary (Income) Data, Annual Item; Fields 19109, 19110, 19111, 19112, respectively
All Industries: INTERIM NET PROFIT - QUARTER 1, 2, 3, 4 represents the quarterly income/loss before extraordinary items and preferred and common dividends, but after operating and non-operating income and expenses, minority interest and equity in earnings. Interim periods are determined on a calendar basis for U.S. corporations and a fiscal basis for non-U.S. corporations.
Data for these fields are generally not available prior to 1992.

Alphabetical List of Field Definitions - I
Issue 6
© Thomson Financial 2003-2007 342 Confidential Information of Thomson Financial
Footnotes: A. Net income is before the effect of minority interest C. Before capital contribution and state guarantees by government or interest on same D. Profit before appropriations and tax F. Profit before tax G. Six months H. Changed reporting practice to exclude the effect of allocations to untaxed reserves I. No standard text J. Includes extraordinary item K. Eight months L. Four months N. Nine months
Interim Pre-tax Income - Quarter 1, 2, 3, 4 Supplementary (Income) Data, Annual Item; Fields 19105, 19106, 19107, 19108 respectively
All Industries: INTERIM PRE-TAX EARNINGS - QUARTER 1, 2, 3, 4 represent the income/loss before any federal, state or local taxes generated during each quarter. It is total revenue minus both operating and non-operating expenses. Interim periods are determined on a calendar basis for U.S. corporations and a fiscal basis for non-U.S. corporations.
Data for these fields are generally not available prior to 1992. Footnotes:
A. Net of income taxes B. No standard text G. Six months K. Eight months L. Four months N. Nine months
Interim Sales - Quarter 1, 2, 3, 4 Supplementary (Income) Data, Annual Item; Fields 19101, 19102, 19103, 19104 respectively
All Industries: INTERIM SALES - QUARTER 1, 2, 3, 4 represent the amount of net sales/revenues generated during the quarter as reported by the company. Interim periods are determined on a calendar basis for U.S. corporations and a fiscal basis for non-U.S. corporations.
Data for these fields are generally not available prior to 1992. It excludes:
Excise taxes Windfall profit taxes Value added taxes General and service taxes
Footnotes: A. Gross total sales or revenue B. Net sales include value-added, excise, windfall profit or sales tax BA. Major accounting standards switch BB. Change from unconsolidated to consolidated reports BC. Major reorganization BD. Change from domestic consolidation to worldwide consolidation BE. Major accounting standards switch and major reorganization BF. Change from domestic consolidation and one other country to worldwide consolidation BG. Change from domestic consolidation and one other country to worldwide consolidation BH. Change from worldwide consolidation to domestic consolidation

Alphabetical List of Field Definitions - I
Issue 6
© Thomson Financial 2003-2007 343 Confidential Information of Thomson Financial
BI. Major accounting standards switch and change from domestic consolidation to worldwide consolidation BJ. Change from domestic consolidation to unconsolidated reports BK. Includes investment income BL. Change from worldwide consolidation to unconsolidated reports BN. Major reorganization - change in perimeter of consolidation BP. Change in accounting method for domestic companies to full consolidation to equity method. BQ. Substantial change in forms of financial statements C. Includes deferred profit on installment sales G. Six months I. Value-added, excise, windfall profit or sales tax has been subtracted along with an undeterminable
amount of other taxes which could not be separated J. Four month sales K. Eight month sales L. No standard text M. Includes equity in pre-tax income which cannot be separated N. Nine months Q. Revenue attributable to banking business is not disclosed R. Net of interest expense W. Includes other income Z. Holding company
International Assets Geographic Data, Annual Item; Field 07151
All Industries: INTERNATIONAL ASSETS represent total or identifiable assets of foreign operations before adjustments and eliminations.
Footnotes: A. Includes foreign currency translation AA. No standard text B. Excludes European countries C. After adjustments and eliminations of inter-company transfers D. Net assets F. Excludes research products H. Transfers between geographic areas are immaterial and not separately stated J. Excludes a geographic area K. Average assets M. Tobacco operations only N. Foreign operations not consolidated O. Includes assets of associate companies Q. Segment reporting for international operations which appear substantial are not provided S. Excludes EEC Countries T. Net operating assets V. Before inter-company eliminations Z. Appears to be a domestic company or has very little foreign operations
International Auditors & Affiliates See PARENT AUDITORS & AFFILIATES

Alphabetical List of Field Definitions - I
Issue 6
© Thomson Financial 2003-2007 344 Confidential Information of Thomson Financial
International Operating Income Geographic Data, Annual Item; Field 07126
All Industries: INTERNATIONAL OPERATING INCOME represents operating income generated from operations in foreign countries before adjustments and eliminations.
Footnotes: A. Pre-tax Income AA. No standard text B. Net Income C. Before Extraordinary Items D. Parent company figures F. Excludes research products G. After adjustments and eliminations of inter-company sales H. Transfers between geographic areas are immaterial and not separately stated I. After tax operating income J. Excludes a geographic area K. Prior data not comparable due to an accounting change L. Before extraordinary items and excludes a geographic area M. Tobacco operations only N. Net income before interest and taxes O. Includes income of associate companies P. Excludes European Countries Q. Segment reporting for international operations which appear substantial are not provided S. Excludes EEC Countries V. Before inter-company eliminations Z. Appears to be a domestic company or has very little foreign operations
International Sales Geographic Data, Annual Item; Field 07101
All Industries: INTERNATIONAL SALES represent sales generated from operations in foreign countries. It excludes:
Export sales Excise taxes Windfall profit taxes Value Added taxes (VAT) General and Services taxes (GST)
Footnotes: A. After adjustments and eliminations of inter-company transfers AA. No standard text B. Includes export sales which cannot be subtracted out C. Excludes European Countries D. Parent company figures F. Excludes Research Products G. Includes shares of sales of associated companies H. Transfers between geographic areas are immaterial & not separately stated I. Includes interest and other income J. Excludes a geographic area K. Includes excise taxes L. Includes inter-company eliminations M. Tobacco operations only N. Foreign operations not consolidated Q. Segment reporting for international operations which appear substantial are not provided

Alphabetical List of Field Definitions - I
Issue 6
© Thomson Financial 2003-2007 345 Confidential Information of Thomson Financial
R. Includes discontinued operations S. Excludes EEC Countries T. Includes other income V. Before inter-company eliminations Z. Appears to be a domestic company with a little foreign operations
Internet Address Descriptive Data, Current Item; Field 06030
All Industries: INTERNET ADDRESS represents the address where the company can be contacted on the World Wide Web.
Inventories - Days Held Liquidity Data, Annual Item; Field 08126
Industrials: 365 / (Cost of Goods Sold (excl Depreciation) / (Average of Last Year’s and Current Year’s Inventories ) This calculation uses restated data for last years values where available.
If Cost of Goods Sold (excl Depreciation) is not available, Net Sales or Revenues is used.
Inventories - Days Held - 5 Yr Avg Liquidity Data, Annual Item; Field 08130
Industrials: Arithmetic Average of the last five years of Inventories-Days Held
Inventories - Total Asset Data, Annual Item; Field 02101 Industrials:
INVENTORIES - TOTAL represent tangible items or merchandise net of advances and obsolescence acquired for either (1) resale directly or (2) included in the production of finished goods manufactured for sale in the normal course of operation. In manufacturing companies this item is classified as follows (depending upon the stage of completion in the manufacturing process):
A. Finished goods, consisting of products ready for sale. B. Work in process, consisting of products in various stages of production. C. Raw materials and supplies, consisting of items that will enter directly or indirectly
into the production of finished goods. In non-manufacturing companies finished goods bought for resale is the major portion of the inventories.
It includes but is not restricted to: Advances and deposits to subcontractors and purchase of materials and other manufacturing costs Revenue stamps Unbilled costs on contracts Contracts in Progress Supplies (usually office supplies) For U.S. corporations, reserve for LIFO Film and program exhibition rights, if part of current assets Deferred fuel costs
It excludes:

Alphabetical List of Field Definitions - I
Issue 6
© Thomson Financial 2003-2007 346 Confidential Information of Thomson Financial
Tools that are listed in current asset section Supplies and prepaid expenses for companies that lump these items together Advances from customers Contract Billings For non-U.S. companies, negative inventories which arise from advances from customers greater than costs on long-term contracts. It is reclassified to current liabilities.
Footnotes: C. Includes other current assets D. Net of prepayments on work in process F. Before adjustment for prepayment of work in progress that has been treated as liability H. Includes advances to suppliers I. No standard text
Inventories % Total Current Assets Liquidity Ratio, Annual Item; Field 08116
Industrials : Inventories / Current Assets-Total * 100
Inventories % Total Current Assets - 5 Yr Avg Liquidity Ratio, Annual Item; Field 08120
Industrials : Arithmetic average of the last five years of Inventories % Total Current Assets
Inventory Turnover Liquidity Ratio, Annual Item; Field 08136
Industrials : Cost of Goods Sold (excl Depreciation) / Average of Last Year’s and Current Year’s Inventories This calculation uses restated data for last years values where available If Cost of Goods Sold (excl Depreciation) is not available or zero, then Net Sales or Revenues is used.
Inventory Turnover - 5 Yr Avg Liquidity Ratio, Annual Item; Field 08140
Industrials : Arithmetic average of the last five years of Inventory Turnover
Invested Assets % Liabilities Leverage Ratio, Annual Item; Field 15097
Banks: Investments-Total / (Total Liabilities - Customer Liabilities on Acceptances) * 100 Customer Liabilities on Acceptances only subtracted when included in Total Liabilities
Insurance Companies: Investments-Total / Total Liabilities * 100
Other Financial Companies: Investments-Total / (Total Liabilities - Custody Securities) * 100

Alphabetical List of Field Definitions - I
Issue 6
© Thomson Financial 2003-2007 347 Confidential Information of Thomson Financial
Invested Assets % Liabilities - 5 Yr Avg Leverage Ratio, Annual Item; Field 15100
Banks, Insurance, Other Financial Companies: Arithmetic average of the last five years of Invested Assets % Liabilities
Invested Assets % Total Assets Asset Utilization Ratio, Annual Item; Field 15091
Banks: Investments-Total / (Total Assets - Customer Liabilities on Acceptances) *100 Customer Liabilities on Acceptances only subtracted when included in Total Assets
Insurance Companies: Investments-Total / Total Assets * 100
Other Financial Companies: Investments-Total / (Total Assets - Custody Securities) * 100
Invested Assets % Total Assets - 5 Yr Avg Asset Utilization Ratio, Annual Item; Field 15094
Banks, Insurance, Other Financial Companies: Arithmetic average of the last five years of Invested Assets % Total Assets
Invested Assets % Total Deposits Leverage Ratio, Annual Item; Field 15161
Banks: Investments-Total / Deposits-Total * 100
Invested Assets % Total Deposits - 5 Yr Avg Leverage Ratio, Annual Item; Field 15164
Banks: Arithmetic average of the last five years of Invested Assets % Total Deposits
Invested Assets & Loans % Total Deposits Leverage Ratio, Annual Item; Field 15167
Banks: (Investments-Total + Loans-Net) / Deposits-Total * 100
Invested Assets & Loans % Total Deposits - 5 Yr Avg Leverage Ratio, Annual Item; Field 15170
Banks: Arithmetic average of the last five years of Invested Assets and Loans % Total Deposits
Investment Income Income Data, Annual Item; Field 01006
Banks, Other Financial Companies: INVESTMENT INCOME represents the realized gain or loss from the sale of investment securities.
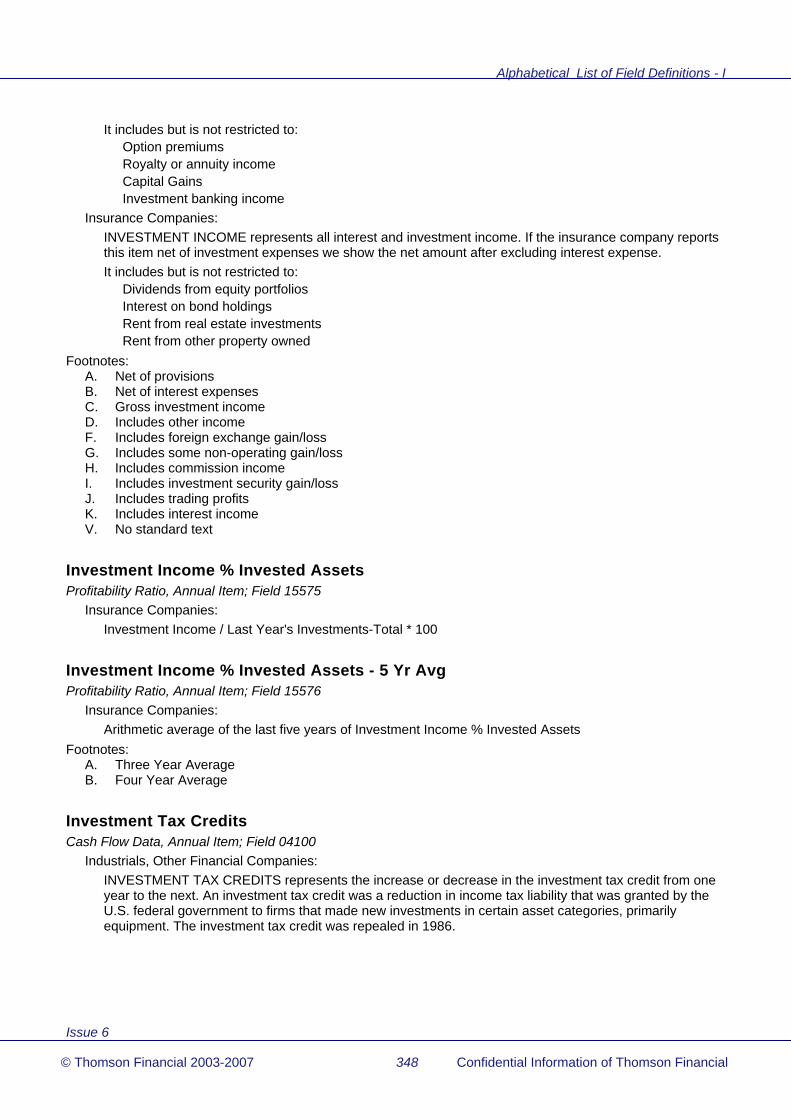
Alphabetical List of Field Definitions - I
Issue 6
© Thomson Financial 2003-2007 348 Confidential Information of Thomson Financial
It includes but is not restricted to: Option premiums Royalty or annuity income Capital Gains Investment banking income
Insurance Companies: INVESTMENT INCOME represents all interest and investment income. If the insurance company reports this item net of investment expenses we show the net amount after excluding interest expense. It includes but is not restricted to:
Dividends from equity portfolios Interest on bond holdings Rent from real estate investments Rent from other property owned
Footnotes: A. Net of provisions B. Net of interest expenses C. Gross investment income D. Includes other income F. Includes foreign exchange gain/loss G. Includes some non-operating gain/loss H. Includes commission income I. Includes investment security gain/loss J. Includes trading profits K. Includes interest income V. No standard text
Investment Income % Invested Assets Profitability Ratio, Annual Item; Field 15575
Insurance Companies: Investment Income / Last Year's Investments-Total * 100
Investment Income % Invested Assets - 5 Yr Avg Profitability Ratio, Annual Item; Field 15576
Insurance Companies: Arithmetic average of the last five years of Investment Income % Invested Assets
Footnotes: A. Three Year Average B. Four Year Average
Investment Tax Credits Cash Flow Data, Annual Item; Field 04100
Industrials, Other Financial Companies: INVESTMENT TAX CREDITS represents the increase or decrease in the investment tax credit from one year to the next. An investment tax credit was a reduction in income tax liability that was granted by the U.S. federal government to firms that made new investments in certain asset categories, primarily equipment. The investment tax credit was repealed in 1986.
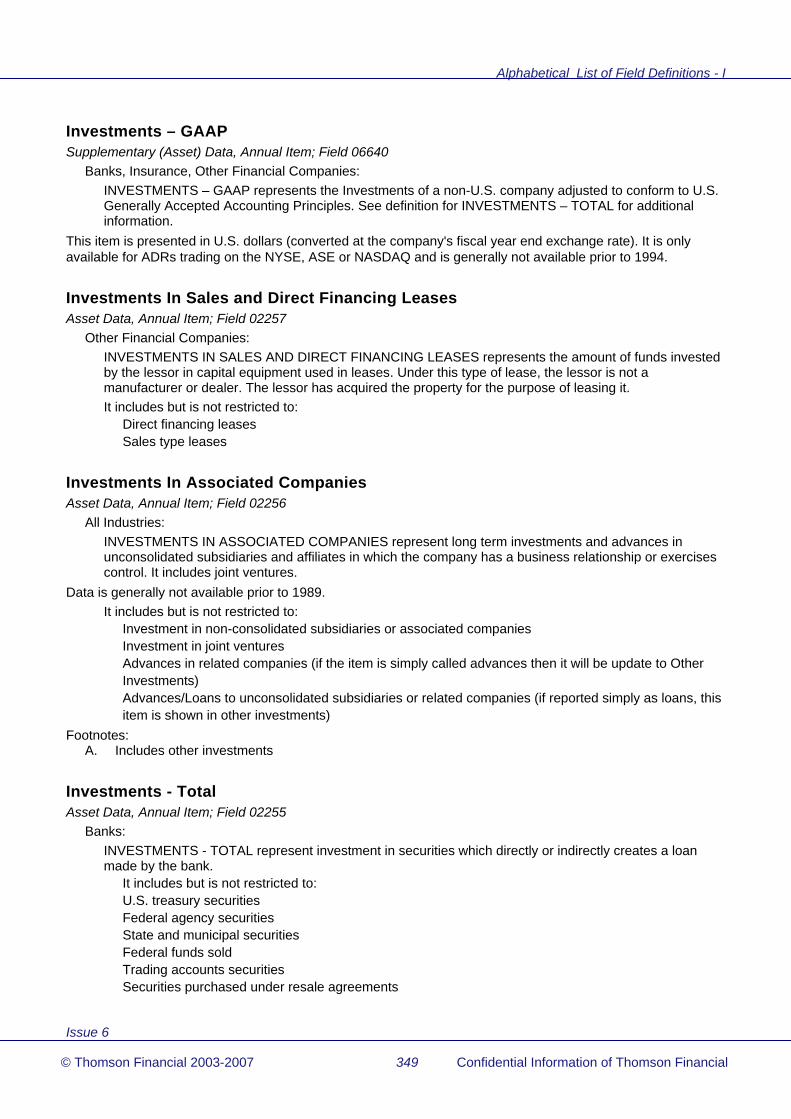
Alphabetical List of Field Definitions - I
Issue 6
© Thomson Financial 2003-2007 349 Confidential Information of Thomson Financial
Investments – GAAP Supplementary (Asset) Data, Annual Item; Field 06640
Banks, Insurance, Other Financial Companies: INVESTMENTS – GAAP represents the Investments of a non-U.S. company adjusted to conform to U.S. Generally Accepted Accounting Principles. See definition for INVESTMENTS – TOTAL for additional information.
This item is presented in U.S. dollars (converted at the company's fiscal year end exchange rate). It is only available for ADRs trading on the NYSE, ASE or NASDAQ and is generally not available prior to 1994.
Investments In Sales and Direct Financing Leases Asset Data, Annual Item; Field 02257
Other Financial Companies: INVESTMENTS IN SALES AND DIRECT FINANCING LEASES represents the amount of funds invested by the lessor in capital equipment used in leases. Under this type of lease, the lessor is not a manufacturer or dealer. The lessor has acquired the property for the purpose of leasing it. It includes but is not restricted to:
Direct financing leases Sales type leases
Investments In Associated Companies Asset Data, Annual Item; Field 02256
All Industries: INVESTMENTS IN ASSOCIATED COMPANIES represent long term investments and advances in unconsolidated subsidiaries and affiliates in which the company has a business relationship or exercises control. It includes joint ventures.
Data is generally not available prior to 1989. It includes but is not restricted to:
Investment in non-consolidated subsidiaries or associated companies Investment in joint ventures Advances in related companies (if the item is simply called advances then it will be update to Other Investments) Advances/Loans to unconsolidated subsidiaries or related companies (if reported simply as loans, this item is shown in other investments)
Footnotes: A. Includes other investments
Investments - Total Asset Data, Annual Item; Field 02255
Banks: INVESTMENTS - TOTAL represent investment in securities which directly or indirectly creates a loan made by the bank.
It includes but is not restricted to: U.S. treasury securities Federal agency securities State and municipal securities Federal funds sold Trading accounts securities Securities purchased under resale agreements

Alphabetical List of Field Definitions - I
Issue 6
© Thomson Financial 2003-2007 350 Confidential Information of Thomson Financial
Mortgage backed securities Federal funds Other securities Other investments Total securities available for sale (field 18093)
Insurance and Other Financial Companies: INVESTMENTS - TOTAL represent the interest earning assets of the company. It includes but is not restricted to:
For Insurance Companies: Fixed income securities Equity securities Real estate assets Mortgage & Policy loans Other Investments For Other Financial Companies: Loans Real estate assets Finance Receivables Other Investments
Investor Relations - Address Descriptive Data, Current Item; Field 18358
All Industries: INVESTOR RELATIONS - ADDRESS represents the location of the investor relations office. If the address is the same as the company then this field will not be available. If the company employs an outside public relations firm this firm's address is shown in this field.
Footnotes: A. See company address
Investor Relations – E-mail Address Descriptive Data, Current Item; Field 18356
All Industries: INVESTOR RELATIONS – E-MAIL ADDRESS represents the e-mail address of the investor relations contact.
Investor Relations - Name Descriptive Data, Current Item; Field 18357
All Industries: INVESTOR RELATIONS - NAME represents the person who is responsible for the maintenance of relations between the company and the investment community. The investor relations officer is responsible for supplying reports and information requested by shareholders, professional investors, brokers, and the financial media.

Alphabetical List of Field Definitions - I
Issue 6
© Thomson Financial 2003-2007 351 Confidential Information of Thomson Financial
Investor Relations - Phone/Fax Descriptive Data, Current Item; Field 18359
All Industries: INVESTOR RELATIONS - PHONE/FAX represents the phone number/fax number at which the investor relations officer can be reached.
Footnote: A. See company phone company
ISIN Number Descriptive Data, Current Item; Field 06008
All Industries: ISIN NUMBER represents a 12 digit alphanumeric identifier assigned to the company by the International Standards Organization (ISO) in order to provide standardization of securities identification. For companies with more than one type of common/ordinary share, the ISIN shown is for the share type identified in field 6005 - Type of Share.
This item is also available at the security level.
ISIN Number - Mult Share 1, 2, 3, 4, 5, 6, 7 Descriptive Data, Current Items; Fields 20007, 20107, 20207, 20307, 20407, 20507, 20607, respectively
All Industries: ISIN NUMBER - MULT SHARE 1, 2, 3, 4, 5, 6, 7 represents a 12 digit alphanumeric identifier assigned to each type of common/ordinary share by the International Standards Organization (ISO) in order to provide worldwide standardization of securities identification.
Issue 6
© Thomson Financial 2003-2007 352 Confidential Information of Thomson Financial
L Land Asset Data, Annual Item; Field 18375
Industrials, Other Financial Companies: LAND represents the real estate without buildings held for productive use. Land is recorded at its purchase price plus any costs related to its purchase such as lawyer's fees, escrow fees, title and recording fees.
Data for this field is generally not available prior to 1992. Footnotes:
A. No standard text C. Net of depreciation D. Includes other
Latest Annual Updated Descriptive Data, Current Item; Field 07016
All Industries: LATEST ANNUAL UPDATED represents the most recent year where complete annual information reported by a company is available. This item is also updated for companies followed as a Limited Data Set company.
Latest Interim Date Descriptive Data, Current Item; Field 07035
All Industries: LATEST INTERIM DATE represents the fiscal period end date for the most recent interim period updated.
This item is only available at the company level.
Lease Financing Asset Data, Annual Item; Field 02264
Banks: LEASE FINANCING represent loans made by the bank in order to finance leases. It includes but is not restricted to:
Finance lease receivables
Lease Commitments - Year 1, Year 2, Year 3, Year 4, Year 5, Over 5 Years Supplementary (Liability) Data, Annual Items; Fields 18141, 18142, 18143,18144,18145, 18146, respectively
All Industries: LEASE COMMITMENTS - YEAR 1, YEAR 2, YEAR 3, YEAR 4, YEAR 5, OVER 5 YEARS represents the minimum lease commitments for operating leases that have been initialized or remaining lease terms in excess of one year, two years, three years, four years, five years and over five years; respectively.
Data for this field is generally not available prior to 1996 for non-U.S. companies and 1991 for U.S. companies.
Alphabetical List of Field Definitions - L
Issue 6
© Thomson Financial 2003-2007 353 Confidential Information of Thomson Financial
Length Of Fiscal Period Descriptive Data, Annual Item; Field 05351
All Industries: LENGTH OF FISCAL YEAR represents the number of days in the company's fiscal year.
Licenses - Accumulated Amortization Supplementary (Asset) Data, Annual Item; Field 02512
All Industries: LICENSES - ACCUMULATED AMORTIZATION represent the total accumulated amortization of licenses, franchises and production rights.
This item is available in the annual original and annual restated time series for detailed companies, full update.
Licenses - Gross Supplementary (Asset) Data, Annual Item; Field 02511
All Industries: LICENSES - GROSS represent the gross value of licenses, franchises and production rights.
This item is available in the annual original and annual restated time series for detailed companies, full update.
Licenses - Net Supplementary (Asset) Data, Annual Item; Field 02510
All Industries: LICENSES - NET represent the net book value of licenses, franchises and production rights.
This item is available in the annual original and annual restated time series for detailed companies, full update.
Life Insurance In Force Supplementary Data, Annual Item; Field 18219
Insurance Companies: LIFE INSURANCE IN FORCE represent the aggregate of the face amount of coverage paid up, or on which premiums are still being paid, as issued by a life insurance company.
Data for this field is generally not available prior to 1996 for non-U.S. companies and 1991 for U.S. companies. Footnotes:
A. No standard text
Loan Loss Coverage Ratio Other Ratio, Annual Item; Field 15139
Banks: (Pre-tax Income + Provision for Loan Losses) / Net Loan Losses
Loan Loss Coverage Ratio - 5 Yr Avg Other Ratio, Annual Item; Field 15141
Banks: Arithmetic average of the last five years of Loan Loss Coverage Ratios

Alphabetical List of Field Definitions - L
Issue 6
© Thomson Financial 2003-2007 354 Confidential Information of Thomson Financial
Loans (Net) – GAAP Supplementary (Asset) Data, Annual Item; Field 06660
Banks, Other Financial Companies: LOANS (NET) – GAAP represents the net loans of a non-U.S. company adjusted to conform to U.S. Generally Accepted Accounting Principles. See definition for LOANS - NET for additional information.
This item is presented in U.S. dollars (converted at the company's fiscal year end exchange rate). It is only available for ADRs trading on the NYSE, ASE or NASDAQ and is generally not available prior to 1994.
Loans - Net Asset Data, Annual Item; Field 02276
Banks, Other Financial Companies: LOANS - NET represent the total amount of money loaned to customers after deducting reserves for loan losses.
For Banks: It includes but is not restricted to:
Lease Financing Total non-performing assets (field 02287)
For Other Financial Companies: It includes but is not restricted to:
Lease Financing Finance Receivables (field 02048)
Footnotes: A. Includes reserve for loan losses B. Gross loans C. Includes investment assets D. Includes interbank loans
Loans - Total Asset Data, Annual Item; Field 02271
Banks, Other Financial Companies: LOANS - TOTAL represent the total amount of money loaned to customers before reserves for loan losses but after unearned income. It includes but is not restricted to:
Lease financing Finance Receivables
Footnotes: A. Net of provisions for loan losses B. Includes investment assets C. Includes interbank loans D. Net of unearned income
Loans - 1 Year Annual Growth Growth Rate; Annual Item; Field 08666
Banks, Other Financial Companies: (Current Year's Loans-Total / Last Year's Loans-Total - 1) * 100
This calculation uses restated data for last years values where available

Alphabetical List of Field Definitions - L
Issue 6
© Thomson Financial 2003-2007 355 Confidential Information of Thomson Financial
Loans - 5 Yr Annual Growth Growth Rate, Annual Item; Field 08670
Banks, Other Financial Companies: ((Current Year's Loans-Total / Loans-Total six years ago, reduced to a compound annual rate) - 1) * 100
Long Term Borrowings Cash Flow Data, Annual Item; Field 04401
All Industries: LONG TERM BORROWINGS represent the amount received by the company from the issuance of long term debt, (convertible and non-convertible), increase in capitalized lease obligations, and debt acquired from acquisitions.
Footnotes: A. Includes reduction in long term debt B. Includes increase in short term borrowings C. Includes proceeds from stock D. Includes other long term liabilities
Long Term Debt Liability Data, Annual Item; Field 03251
All Industries: LONG TERM DEBT represents all interest bearing financial obligations, excluding amounts due within one year. It is shown net of premium or discount. It includes but is not restricted to:
Mortgages Bonds Debentures Convertible debt Sinking fund debentures Long term bank overdrafts Long term notes Long term bills Medium term loans Long term royalties Long term contracts Industrial revenue bonds Notes payable, due within one year and to be refunded by long term debt when carried as non-current liability Long term prepaid contracts Advances and production payments Talent and broadcasting rights Capitalized lease obligations Revolving credit Long term advances from subsidiaries/associated companies Compulsory convertible debt (South Africa) Eurodollar borrowing Long term liability in connection with ESOP Federal Home Loan advances
It excludes: Current portion of long term debt

Alphabetical List of Field Definitions - L
Issue 6
© Thomson Financial 2003-2007 356 Confidential Information of Thomson Financial
Pensions Deferred taxes Minority interest
Footnotes: A. Includes current portion C. Includes some long term provisions and/or other long term liabilities D. Includes current portion of long term debt and is not comparable F. Includes short term borrowings G. No standard text H. Adjusted to exclude long term liabilities and/or provisions
Long Term Debt – GAAP Supplementary (Liability) Data, Annual Item; Field 06769
All Industries: LONG TERM DEBT – GAAP represents the total long term debt of a non-U.S. company adjusted to conform to U.S. Generally Accepted Accounting Principles. See definition for LONG TERM DEBT for additional information.
This item is presented in U.S. dollars (converted at the company's fiscal year end exchange rate). It is only available for ADRs trading on the NYSE, ASE or NASDAQ and is generally not available prior to 1994.
Long Term Debt – GAAP % Common Equity - GAAP Leverage Ratio, Annual Item; Field 08277
All Industries: Long Term Debt-GAAP / Last Year's Common Equity-GAAP * 100
This item is only available for ADRs trading on the NYSE, ASE or NASDAQ and is generally not available prior to 1994.
Long Term Debt – GAAP % Common Equity – GAAP – 3 Yr Avg Leverage Ratio, Annual Item; Field 08279
All Industries: Arithmetic average of the last three years Long Term Debt % Common Equity-GAAP
This item is only available for ADRs trading on the NYSE, ASE or NASDAQ and is generally not available prior to 1996.
Long Term Debt – GAAP % Common Equity – GAAP – 5yr Avg Leverage Ratio, Annual Item; Field 08281
All Industries: Arithmetic average of the last five years Long Term Debt % Common Equity-GAAP
This item is only available for ADRs trading on the NYSE, ASE or NASDAQ and will not be available until 1998.
Long Term Debt Excluding Capitalized Leases Liability Data, Annual Item; Field 03245
All Industries: LONG TERM DEBT EXCLUDING CAPITALIZED LEASES represents all interest bearing financial obligations of the company due after twelve months or the normal operating cycle of the company. It is shown net of premiums or discounts.
It includes but is not restricted to:

Alphabetical List of Field Definitions - L
Issue 6
© Thomson Financial 2003-2007 357 Confidential Information of Thomson Financial
Mortgages Bonds Debentures Convertible debt Sinking fund debentures Long term bank overdrafts Long term notes Long term bills Medium term loans Long term contracts Long term royalties Industrial Revenue Bond, if not clearly defined as a capitalized lease Revolving credit Long term advances from subsidiaries/associated companies Long Term Prepaid Contracts Advances and Production Payments Talent and Broadcasting Rights Notes Payable due within one year and to be refunded by long term debt when carried as a non-current liability Compulsory convertible debt (South Africa) Eurodollar borrowings Long term liability in connection with ESOP Federal Home Loan advances
It excludes: Capitalized Lease Obligations Current portion of Long Term Debt Pensions Deferred taxes Minority Interest
Footnotes: A. Includes current portion C. Includes some long term provisions and/or other long term liabilities D. Includes current portion of long term debt and is not comparable F. Includes short term borrowings G. No standard text H. Adjusted to exclude long term liabilities and/or borrowings
Long Term Debt % Common Equity Leverage Ratio, Annual Item; Field 08226
All Industries: Long Term Debt / Common Equity * 100
Insurance Companies: If Common Equity is not available, Policyholders Equity is substituted
Long Term Debt % Common Equity - 5 Yr Avg Leverage Ratio, Annual Item; Field 08230
All Industries: Arithmetic average of the last five years of Long Term Debt % Common Equity

Alphabetical List of Field Definitions - L
Issue 6
© Thomson Financial 2003-2007 358 Confidential Information of Thomson Financial
Long Term Debt % Total Capital Leverage Ratio, Annual Item; Field 08216
All Industries: Long Term Debt / Total Capital * 100
Long Term Debt % Total Capital - Current Leverage Ratio, Current Item; Field 08217
All Industries: Current Long Term Debt / Current Total Capital * 100
Long Term Debt % Total Capital - 5 Yr Avg Leverage Ratio, Annual Item; Field 08220
All Industries: Arithmetic average of the last five years of Long Term Debt % Total Capital
Long Term Insurance Reserves Expense Data, Annual Item; Field 01080
Insurance Companies: LONG TERM INSURANCE RESERVES represent the expected discounted future payments for long term policies usually determined by regulatory agencies in each country. It includes but is not restricted to:
Interest to policy holders Experience refunds on long term policies
Footnotes: A. Includes part of losses and claims expense
Long Term Liabilities Per Share Stock Data, Annual Item; Field 05503
All Industries: LONG TERM LIABILITIES PER SHARE represents the per share amount of the obligations of the company due after one year.
This item is shown per 1,000 shares for Brazilian companies.
Long Term Receivables Asset Data, Annual Item; Field 02258
All Industries: LONG TERM RECEIVABLES represent amounts due from customers that will not be collected within the normal operating cycle of the company.
Data for this field is generally not available prior to 1989. It includes but is not restricted to:
Loans to other companies Investment in sale type leases Finance Receivables for industrial companies whose financial subsidiaries are consolidated
Footnotes: A. Includes other assets B. Includes long term loans to related companies

Alphabetical List of Field Definitions - L
Issue 6
© Thomson Financial 2003-2007 359 Confidential Information of Thomson Financial
Loss Adjustment Expense Supplementary (Expense) Data, Annual & Interim Item; Field 01078
Insurance Companies: LOSS ADJUSTMENT EXPENSE represents the cost involved in an insurance company’s adjustment of losses under a policy.
This item is available in the annual time series and the quarterly, cumulative quarterly, semi-annual, trimester and cumulative trimester interim time series. It is only available at the company level.
Loss Ratio Profitability Ratio, Annual Item; Field 15549
Insurance Companies: (Claim & Loss Expense + Long Term Insurance Reserves) / Premiums Earned * 100
Loss Ratio - 5 Yr Avg Profitability Ratio, Annual Item; Field 15552
Insurance Companies: Arithmetic average of the last five years of Loss Ratios
Issue 6
© Thomson Financial 2003-2007 360 Confidential Information of Thomson Financial
M Machinery and Equipment Asset Data, Annual Item; Field 18377
Industrials, Other Financial Companies: MACHINERY AND EQUIPMENT represents the machines and machine parts needed by the company to produce its products.
Data for this field is generally not available prior to 1992. It includes but is not restricted to:
Tools Footnotes:
A. No standard text C. Net of depreciation D. Includes other
Major Shareholders Stock Data, Current Item; Field 18370
All Industries: MAJOR SHAREHOLDERS represent any individual or company that owns more than the local legal disclosure requirement of the outstanding shares of a company. The name of the individual or group along with the percent of outstanding shares held are shown in this fields. This is a free text field; shareholders are separated by a semi-colon.
This field replaces historic fields 18360 – 18369 Major Shareholders 1 – 10, which restricted collection to ten shareholders.
Mandatorily Redeemable Trust Preferred Securities Supplementary (Liability) Data, Annual & Interim Item; Field 18168
All Industries: MANDATORILY REDEEMABLE TRUST PREFERRED SECURITIES represents mandatory redeemable preferred securities of subsidiary trusts created for the purpose of holding solely debt securities of the parent company. This item is included in Long Term Debt.
This item is available in the annual time series and the quarterly, semi-annual and trimester interim time series. It is only available at the company level.
Market Capitalization Stock Data, Annual Item; Field 08001
All Industries: Market Price-Year End * Common Shares Outstanding If Common Shares Outstanding is not available for the current year or prior year, then Common Shares Outstanding-Current is used. For companies with more than one type of common/ordinary share, market capitalization represents the total market value of the company.
This item is also available at the security level for 1987 and subsequent years.

Alphabetical List of Field Definitions - M
Issue 6
© Thomson Financial 2003-2007 361 Confidential Information of Thomson Financial
Market Capitalization - Current Stock Data, Current Item; Field 08005
All Industries: Market Price-Current * Common Shares Outstanding-Current For companies with more than one type of common/ordinary share, market capitalization represents the total market value of the company.
This item is also available at the security level.
Market Capitalization - Current (U.S.$) Supplementary Data, Current Item; Field 07211
All Industries: MARKET CAPITALIZATION - CURRENT (U.S.$) represents the current total market value of a company based on current price and current shares outstanding converted to U.S. dollars using the current exchange rate. For companies with more than one type of common/ordinary share, market capitalization represents the total market value of the company.
This item is also available at the security level.
Market Capitalization - Current - Mult Share 1, 2, 3, 4, 5, 6, 7 Stock Data, Current Items; Fields 20023, 20123, 20223, 20323, 20423, 20523, 20623, respectively
All Industries: Market Price-Current * Common Shares Outstanding-Current; for each type of common/ordinary share
Market Capitalization - Mult Share 1, 2, 3, 4, 5, 6, 7 Stock Data, Annual Items; Fields 20041, 20141, 20241, 20341, 20441, 20541, 20641, respectively
All Industries: Market Price-Year End * Common Shares Outstanding; for each type of common/ordinary share If Common Shares Outstanding is not available for the current year or prior year, then Common Shares Outstanding-Current is used.
Data for these fields is generally not available prior to 1987.
Market Capitalization – 1 Year Growth % Growth Ratio, Annual Item; Field 08579
All Industries: (Current Year’s Market Capitalization / Last Year’s Market Capitalization – 1) * 100
Data for this field is only available for 1989 and subsequent years and is also available at the security level.
Market Capitalization – 3 Year Growth Growth Ratio, Annual Item; Field 08581
All Industries: ((Current Year’s Market Capitalization / Market Capitalization four years ago, reduced to a compound annual rate) – 1) * 100.
Data for this field is only available for 1989 and subsequent years and is also available at the security level.

Alphabetical List of Field Definitions - M
Issue 6
© Thomson Financial 2003-2007 362 Confidential Information of Thomson Financial
Market Capitalization (Public) Stock Data, Annual Item; Field 08004
All Industries: Market Price-Year End * (Common Shares Outstanding - Closely Held Shares) For companies with more than one type of common/ordinary share, market capitalization represents the total market value of the company.
Market Capitalization (Public) - Current Stock Data, Current Item; Field 08003
All Industries: Market Price-Current * (Common Shares Outstanding-Current - Closely Held Shares-Current) For companies with more than one type of common/ordinary share, market capitalization represents the total market value of the company.
Market Capitalization (U.S.$) Supplementary Data, Annual Item; Field 07210
All Industries: MARKET CAPITALIZATION (U.S.$) represents the total market value of the company based on year end price and number of shares outstanding converted to U.S. dollars using the year end exchange rate. For companies with more than one type of common/ordinary share, market capitalization represents the total market value of the company.
This item is also available at the security level for 1987 and subsequent years.
Market Capitalization/Common Equity Stock Performance Ratio, Annual Item; Field 09704
All Industries: Market Capitalization / Common Equity
Exceptions: Finland (95 and prior years) and Norway (93 and prior years):
All Industries: Market Capitalization / (Common Equity + Non-Equity Reserves)
Sweden (88 and prior years): All Industries:
Market Capitalization / (Common Equity + Non-Equity Reserves * .5) Sweden (89 to 93):
All Industries: Market Capitalization / (Common Equity + Non-Equity Reserves * .7)
Sweden (94 and subsequent years): All Industries:
Market Capitalization / Common Equity
Market Capitalization/Common Equity - 5 Yr Avg Stock Performance Ratio, Annual Item; Field 09721
All Industries: Arithmetic average of the last five years of Market Capitalization/Common Equity

Alphabetical List of Field Definitions - M
Issue 6
© Thomson Financial 2003-2007 363 Confidential Information of Thomson Financial
Market Capitalization/Trailing Twelve Months Sales Or Revenues Stock Performance Ratio; Annual Item; Field 09905
All Industries: Market Capitalization / Trailing Twelve Months Net Sales/Revenue
This item is populated for the quarterly, semi-annual and trimester time series based on the availability of underlying data. It is not available prior to 1998.
Market Price - Current Stock Data, Current Item; Field 05006
All Industries: MARKET PRICE - CURRENT represents the most recent price within the last sixty days available in the database. Where trade prices are not available bid prices are taken. For companies with more than one type of common/ordinary share, Market Price - Current represents the price of the share identified in field 6005 - Type of Share.
This item is also available at the security level and is shown per 1,000 shares for Brazilian companies. Footnotes:
A. Trading temporarily suspended NL. Not Listed
Market Price - Current - Mult Share 1, 2, 3, 4, 5, 6, 7 Stock Data, Current Items; Fields 20021, 20121, 20221, 20321, 20421, 20521, 20621, respectively
All Industries: MARKET PRICE - CURRENT - MULT SHARE 1, 2, 3, 4, 5, 6, 7 represents the most recent price within the last sixty days for each type of common/ordinary share of the company. Where trade prices are not available bid prices are taken.
This item is shown per 1,000 shares for Brazilian companies. Footnotes:
A. Trading temporarily suspended NL. Not Listed
Market Price - High Stock Data, Annual Item; Field 05002
All Industries: MARKET PRICE - HIGH represents the highest price in the calendar year for U.S. corporations and fiscal year for non-U.S. corporations. For companies with more than one type of common/ordinary share, Market Price - High represents the price of the share identified in field 06005 - Type of Share.
This item is also available at the security level for 1987 and subsequent years and is shown per 1,000 shares for Brazilian companies. Footnotes:
A. All highs based on daily close
Market Price - Low Stock Data, Annual Item; Field 05003
All Industries: MARKET PRICE - LOW represents the lowest price in the calendar year for U.S. corporations and fiscal year for non-U.S. corporations.

Alphabetical List of Field Definitions - M
Issue 6
© Thomson Financial 2003-2007 364 Confidential Information of Thomson Financial
For companies with more than one type of common/ordinary share, Market Price - Low represents the price of the share identified in field 06005 - Type of Share.
This item is also available at the security level for 1987 and subsequent years and is shown per 1,000 shares for Brazilian companies. Footnotes:
A. All lows based on daily close
Market Prices - Monthly Close Stock Data, Annual Items; Fields 05015 January, 05020 February, 05025 March, 05030 April, 05035 May, 05040 June, 05045 July, 05050 August, 05055 September, 05060 October, 05065 November, 05070 December
All Industries: MARKET PRICE - MONTHLY CLOSE represents the closing price of the stock at its respective month end. For companies with more than one type of common/ordinary share, Market Price - Monthly Close represents the price of the share identified in field 06005 - Type of Share.
These items are also available at the security level for 1987 and subsequent year and are shown per 1,000 shares for Brazilian companies. Footnotes:
A. No price available B. No price available - trading suspending
Market Prices - Monthly High Stock Data, Annual Items; Fields 05016 January, 05021 February, 05026 March, 05031 April, 05036 May, 05041 June, 05046 July, 05051 August, 05056 September, 05061 October, 05066 November, 05071 December
All Industries: MARKET PRICE - MONTHLY HIGH represents the high price of the stock for its respective month. For companies with more than one type of common/ordinary share, Market Price - Monthly High represents the price of the share identified in field 06005 - Type of Share.
These items are also available at the security level for 1987 and subsequent years and are shown per 1,000 shares for Brazilian companies.
Market Price - Monthly Low Stock Data, Annual Items; Fields 05017 January, 05022 February, 05027 March, 05032 April, 05037 May, 05042 June, 05047 July, 05052 August, 05057 September, 05062 October, 05067 November, 05072 December
All Industries: MARKET PRICE - MONTHLY LOW represents the low price of the stock for its respective month. For companies with more than one type of common/ordinary share, Market Price - Monthly Low represents the price of the share identified in field 06005 - Type of Share.
These items are also available at the security level for 1987 and subsequent years and are shown per 1,000 shares for Brazilian companies.
Market Price – Week Close Stock Data, Annual Item, Weekly Time Series; Field 05080
All Industries: MARKET PRICE – WEEK CLOSE represents the closing price for the week represented by the weekly time series code/frequency on the record. Week 1 (W001 Time series code/frequency) represent the first week of the calendar year that ends on a Friday (for example, W024 time series code/frequency in the year 2000 represents the week ending Friday, 06/16/2000.
Alphabetical List of Field Definitions - M
Issue 6
© Thomson Financial 2003-2007 365 Confidential Information of Thomson Financial
This item is available at the security level and is only available for 1999 and subsequent years.
Market Price – Week High Stock Data, Annual Item, Weekly Time Series; Field 05081
All Industries: MARKET PRICE – WEEK HIGH represents the high price for the week represented by the weekly time series code/frequency on the record. Week 1 (W001 Time series code/frequency) represent the first week of the calendar year that ends on a Friday (for example, W024 time series code/frequency in the year 2000 represents the week ending Friday, 06/16/2000.
This item is available at the security level and is only available for 1999 and subsequent years.
Market Price – Week Low Stock Data, Annual Item, Weekly Time Series; Field 05082
All Industries: MARKET PRICE – WEEK LOW represents the low price for the week represented by the weekly time series code/frequency on the record. Week 1 (W001 Time series code/frequency) represent the first week of the calendar year that ends on a Friday (for example, W024 time series code/frequency in the year 2000 represents the week ending Friday, 06/16/2000.
This item is available at the security level and is only available for 1999 and subsequent years.
Market Price - Year End Stock Data, Annual Item; Field 05001
All Industries: MARKET PRICE - YEAR END represents the closing price of the company's stock at December 31 for U.S. Corporations. For non-U.S. corporations, this item represents the closing price of the company's stock at their fiscal year end. For companies with more than one type of common/ordinary share, Market Price - Year End represents the price of the share identified in field 06005 - Type of Share.
This item is also available at the security level for 1987 and subsequent years and is shown per 1,000 shares for Brazilian companies. Footnotes:
AA. No price available B. Price taken as of the closest available date BB. No price available - trading suspended N. Monthly prices currently not available on Worldscope NL. Shares not listed on the stock exchange
Market Price - Year End - Mult Share 1, 2, 3, 4, 5, 6, 7 Stock Data, Annual Item; Fields 20042, 20142, 20242, 20342, 20442, 20542, 20642, respectively
All Industries: MARKET PRICE - YEAR END - MULT SHARE 1, 2, 3, 4, 5, 6, 7 represents the closing price of each type of common/ordinary share at December 31 for U.S. Corporations. For non-U.S. corporations, this item represents the closing price for each type of common/ordinary share at company's fiscal year end. Where trade prices are not available bid prices are taken.
Data for these fields are generally not available prior to 1987. These items are shown per 1,000 shares for Brazilian companies.
See definition for MARKET PRICE - YEAR END for a list of available footnotes for this item.

Alphabetical List of Field Definitions - M
Issue 6
© Thomson Financial 2003-2007 366 Confidential Information of Thomson Financial
Market Price - Year To Date - High Stock Data, Current Item; Field 05007
All Industries: MARKET PRICE - YEAR TO DATE - HIGH represents the highest price of the company in the current calendar year for U.S. corporations and fiscal year for non-U.S. corporations. For companies with more than one type of common/ordinary share, Market Price - Year To Date - High represents the price of the share identified in field 6005 - Type of Share.
This item is also available at the security level and is shown per 1,000 shares for Brazilian companies.
Market Price - Year To Date - Low Stock Data, Current Item; Field 05008
All Industries: MARKET PRICE - YEAR TO DATE - LOW represents the lowest price of the company in the current calendar year for U.S. corporations and fiscal year for non-U.S. corporations. For companies with more than one type of common/ordinary share, Market Price - Year To Date - Low represents the price of the share identified in field 06005 - Type of Share.
This item is also available at the security level and is shown per 1,000 shares for Brazilian companies.
Market Price - 5 Year Average - High Stock Data, Annual Item; Field 05004
All Industries: MARKET PRICE - 5 YEAR AVERAGE - HIGH represents the average of the company's high price for the last five calendar years for U.S. corporations and the last five fiscal years for non-U.S. corporations.
This item is also available at the security level for 1987 and subsequent years and is shown per 1,000 shares for Brazilian companies.
Market Price - 5 Year Average - Low Stock Data, Annual Item; Field 05005
All Industries: MARKET PRICE - 5 YEAR AVERAGE - LOW represents the average of the company's low price for the last five calendar years for U.S. corporations and the last five fiscal years for non-U.S. corporations.
This item is also available at the security level for 1987 and subsequent years and is shown per 1,000 shares for Brazilian companies.
Market Price - 52 Week High Stock Data, Current Item; Field 05091
All Industries: MARKET PRICE - 52 WEEK HIGH represents the highest price of a security in the last 52 weeks.
This item is also available at the security level.
Market Price - 52 Week Low Stock Data, Current Item; Field 05092
All Industries: MARKET PRICE - 52 WEEK LOW represents the lowest price of a security in the last 52 weeks.
This item is also available at the security level.
Alphabetical List of Field Definitions - M
Issue 6
© Thomson Financial 2003-2007 367 Confidential Information of Thomson Financial
Market Value See MARKET CAPITALIZATION
Material Expense Supplementary (Expense) Data, Annual Item; Field 18195
All Industries: MATERIAL EXPENSE represents the cost directly related to the purchase of raw materials and supplies used in the manufacture of a company's product.
Data for this field is generally not available prior to 1992. Footnotes:
A. No standard text
Minority Interest (Income Statement) Expense Data, Annual Item; Field 01501
All Industries: MINORITY INTEREST represents the portion of earnings/losses of a subsidiary pertaining to common stock not owned by the controlling company or other members of the consolidated group.
Footnotes: A. Includes preference dividends B. Minority Interest is pre-tax and included in pre-tax income C. Included in other income/expense, no breakdown available D. Includes policyholders surplus
Minority Interest (Balance Sheet) Liability Data, Annual Item; Field 03426
All Industries: MINORITY INTEREST represents the portion of the net worth (at par or stated value) of a subsidiary pertaining to shares not owned by the controlling company and its consolidated subsidiaries. If minority interest is shown on the asset side, it is updated as a negative and the total assets are adjusted to exclude it. It includes but is not restricted to:
Minority interest in preferred stock Dividends in arrears on a subsidiary's preferred stock not owned by the parent company
Footnotes: A. Included in other long term liabilities B. Includes policyholders equity
Minority Interest Supplementary (Cash Flow) Data, Annual and U.S. Interim Item; Field 04055
All Industries: MINORITY INTEREST represents the non-cash adjustment to income for profits attributable to interests in subsidiaries held outside the group. This data is a component of Total Other Cash Flow (field 04151) in Operating Activities.
This item is available in the annual original and annual restated time series for detailed companies, full update. For U.S. companies, it is also available in the interim original and interim restated time series.

Alphabetical List of Field Definitions - M
Issue 6
© Thomson Financial 2003-2007 368 Confidential Information of Thomson Financial
Minority Interest – GAAP Supplementary (Liability) Data, Annual Item; Field 06780
All Industries: MINORITY INTEREST – GAAP represents the minority interest of a non-U.S. company adjusted to conform to U.S. Generally Accepted Accounting Principles. See definition for MINORITY INTEREST (BALANCE SHEET) for additional information.
This item is presented in U.S. dollars (converted at the company's fiscal year end exchange rate). It is only available for ADRs trading on the NYSE, ASE or NASDAQ and is generally not available prior to 1994.
Minority Interest % Total Capital Leverage Ratio, Annual Item; Field 08211
All Industries: Minority Interest / Total Capital * 100
Minority Interest % Total Capital - 5 Yr Avg Leverage Ratio, Annual Item; Field 08215
All Industries: Arithmetic average of the last five years of Minority Interest % Total Capital.
Monetary Correction Supplementary (Income) Data, Annual Item; Field 01265
All Industries: MONETARY CORRECTION represents the year-to-year difference of the effect on shareholders' capital investment and fixed assets resulting from currency revaluations to counter effects of a hyperinflationary economy.
Month Of Fiscal Year End Descriptive Data, Current Item; Field 05352
All Industries: MONTH OF FISCAL YEAR END represents the month that the company closes its books at the end of its
financial year.
Mortgage Backed Securities Asset Data, Annual Item; Field 02262
Banks: MORTGAGE BACKED SECURITIES represent an investment grade security backed by a pool of mortgage or trust deeds. These securities are secured by conventional mortgages and are guaranteed as to interest and principal.
Data for this field is generally not available prior to 1991. It includes but is not restricted to:
Securities of the Federal National Mortgage Associations (Fannie Mae) Collateralized mortgaged obligations such as those issued by the Federal Home Loan Mortgage Corporation (Freddie Mac) Real estate mortgage conduits such as those issued by the Government National Mortgage Association (Ginnie Mae) U.S. agency mortgage backed securities

Alphabetical List of Field Definitions - M
Issue 6
© Thomson Financial 2003-2007 369 Confidential Information of Thomson Financial
Mortgage backed securities available for sale (field 18090)
Mortgage Backed Securities Available For Sale Supplementary (Asset) Data, Annual Item; Field 18090
Banks: MORTGAGE BACKED SECURITIES AVAILABLE FOR SALE represent the amount of mortgage backed securities that cannot be classified as either investment securities or trading account securities.
Reporting required by U.S. FASB 115. Updated where available in 1993 and subsequent years. It includes but is not restricted to:
U.S. Agency mortgage backed securities Footnotes:
A. No standard text
Mortgage, Policy & Other Loans Asset Data, Annual Item; Field 02246
Insurance Companies: MORTGAGE, POLICY & OTHER LOANS represent loans made, acquired or purchased by the insurance company. It includes but is not restricted to:
Loans made to policyholders Mortgage loans (including those purchased or acquired) Other loans Policy loans (field 02245) Real estate mortgage loans (field 02267)
Footnotes: A. Fixed income securities are included B. Includes some short term investments

Issue 6
© Thomson Financial 2003-2007 370 Confidential Information of Thomson Financial
N Nation Descriptive Data, Current Item; Field 06026
All Industries: NATION represents the country in which the company is domiciled. NATION will generally correspond with the country under which the company is followed on Worldscope, indicated by NATION CODE, with a small number of exceptions (see NATION CODE).
Nation Code Descriptive Data, Current Item; Field 06027
All Industries: NATION CODE represents the country under which the company is followed on Worldscope. The currency of analysis is the currency of the nation indicated by NATION CODE. NATION CODE usually corresponds to the country of domicile as shown in NATION, but there are some exceptions. For example, the NATION CODE for an ADR record is 840 (United States) and currency of analysis is USD while NATION shows the non-US country of domicile. See ADR Frequently Asked Questions for further details.
025 Argentina 442 Luxembourg 036 Australia 458 Malaysia 040 Austria 484 Mexico 056 Belgium 504 Morocco 060 Bermuda 528 Netherlands 076 Brazil 554 New Zealand 092 Virgin Islands
(British) 578 Norway
124 Canada 586 Pakistan 152 Chile 597 Peru 156 China 608 Philippines 175 Colombia 617 Poland 203 Czech Republic 620 Portugal 208 Denmark 643 Russia 220 Egypt 702 Singapore 246 Finland 703 Slovakia 250 France 705 Slovenia 280 Germany 710 South Africa 300 Greece 724 Spain 344 Hong Kong 730 Sri Lanka 350 Hungary 752 Sweden 352 Iceland 756 Switzerland 356 India 760 Taiwan 366 Indonesia 764 Thailand 372 Ireland 796 Turkey

Alphabetical List of Field Definitions - N
Issue 6
© Thomson Financial 2003-2007 371 Confidential Information of Thomson Financial
376 Israel 826 United Kingdom 380 Italy 840 United States 392 Japan 862 Venezuela 400 Jordan 897 Zimbabwe 410 South Korea
This item is also available at the security level.
Net Asset Value See BOOK VALUE PER SHARE
Net Assets From Acquisitions Cash Flow Data, Annual Item; Field 04355
All Industries: NET ASSETS FROM ACQUISITIONS represent assets acquired through pooling of interests or mergers. It does not include capital expenditures of acquired companies.
Data for this field is generally not available prior to 1989. It includes but is not restricted to:
Net assets of acquired companies Additions to fixed assets from acquisitions Working capital of companies acquired (if shown as both a source and a use, both numbers are netted against each other) Excess of cost of acquired companies Discount on acquisitions
Net Capital Requirement Supplementary Data, Annual Item; Field 08015
Other Financial Companies: Securities brokers are subject to the "Uniform Net Capital Rule" of the Securities and Exchange Commission. Under the alternate method permitted by the rule, required net capital shall not be less than two percent of aggregate debit items arising from client transactions. The New York Stock Exchange, Inc. may also require a member organization to reduce its business if its net capital is less than four percent of aggregate debit items and may prohibit a member firm from expanding its business and declaring cash dividends if its net capital is less than five percent of aggregate debit balances.
Net Cash Flow - Financing Cash Flow Data, Annual Item; Field 04890
All Industries: NET CASH FLOW - FINANCING represents the net cash receipts and disbursements resulting from reduction and/or increase in long or short term debt, proceeds from sale of stock, stock repurchased/redeemed/retired, dividends paid and other financing activities.
Data for this field is generally not available prior to 1989.

Alphabetical List of Field Definitions - N
Issue 6
© Thomson Financial 2003-2007 372 Confidential Information of Thomson Financial
Net Cash Flow - Investing Cash Flow Data, Annual Item; Field 04870
All Industries: NET CASH FLOW - INVESTING represents the net cash receipts and disbursements resulting from capital expenditures, decrease/increase from investments, disposal of fixed assets, increase in other assets and other investing activities.
A positive value in this field represents an outflow (use) of funds. A negative value in this field represents an inflow (source) of funds. Data for this field is generally not available prior to 1989.
Net Cash Flow - Operating Activities Cash Flow Data, Annual Item; Field 04860
All Industries: NET CASH FLOW - OPERATING ACTIVITIES represent the net cash receipts and disbursements resulting from the operations of the company. It is the sum of Funds from Operations, Funds From/Used for Other Operating Activities and Extraordinary Items.
Data for this field is generally not available prior to 1989. It includes but is not restricted to:
Funds from operations Funds from/for working capital Extraordinary items
Net Cash From Continuing Operations Supplementary (Cash Flow) Data, Annual Item; Field 04891
All Industries: NET CASH FROM CONTINUING OPERATIONS represents total net cash received from continuing operations. This item reflects the change in cash allocable to continuing operations after the effects of exchange rates on cash.
This item is only available in the annual time series at the company level.
Net Cash From Discontinued Operations Supplementary (Cash Flow) Data, Annual Item; Field 04892
All Industries: NET CASH FROM DISCONTINUED OPERATIONS represents total net cash received from discontinued operations. This item reflects the change in cash allocable to discontinued operations after the effects of exchange rates on cash.
This item is only available in the annual time series at the company level.
Net Debt Supplementary Data, Annual & Interim Item; Field 18199
All Industries: NET DEBT represents Total Debt minus Cash. Cash represents Cash & Due from Banks for Banks, Cash for Insurance companies and Cash & Short Term Investments for all other industries.
This item is available in the annual time series and the quarterly, semi-annual and trimester interim time series. It is only available at the company level.

Alphabetical List of Field Definitions - N
Issue 6
© Thomson Financial 2003-2007 373 Confidential Information of Thomson Financial
Net Income (U.S.$) Supplementary Data, Annual Item; Field 07250
All Industries: NET INCOME (U.S.$) represents the net income of the company converted to U.S. dollars using the fiscal year end exchange rate. See the definition for NET INCOME BEFORE PREFERRED DIVIDENDS for information regarding the net income used in this calculation.
Net Income – GAAP Supplementary (Income) Data, Annual Item; Field 06895
All Industries: NET INCOME – GAAP represents the income after all operating and non-operating income and expense, reserves, income taxes, minority interest and extraordinary items of a non-U.S. company adjusted to conform to U.S. Generally Accepted Accounting Principles.
This item is presented in U.S. dollars (converted at the company's year end exchange rate). It is only available for ADRs trading on the NYSE, ASE or NASDAQ and is generally not available prior to 1994.
Net Income - GAAP – 1 Yr Annual Growth Growth Rate, Annual Item; Field 08584
All Industries: (Current Year's Net income-GAAP / Last Year's Net income-GAAP – 1) * 100
This item is only available for ADRs trading on the NYSE, ASE or NASDAQ and is generally not available prior to 1995.
Net Income - GAAP – 3 Yr Annual Growth Growth Rate, Annual Item; Field 08586
All Industries: ((Current Year's Net income-GAAP / Net income-GAAP four years ago, reduced to a compound annual rate) – 1) * 100
This item is only available for ADRs trading on the NYSE, ASE or NASDAQ and is generally not available prior to 1997.
Net Income - GAAP – 5 Yr Annual Growth Growth Rate, Annual Item; Field 08588
All Industries: ((Current Year's Net income-GAAP / Net income-GAAP six years ago, reduced to a compound annual rate) – 1) * 100
This item is only available for ADRs trading on the NYSE, ASE or NASDAQ and will not be available until 1999.
Net Income - 1 Yr Annual Growth Growth Rate, Annual/Interim Item; Field 08636
All Industries: Annual Time Series: (Current Year's Net Income before Preferred Dividends / Last Year's Net Income before Preferred Dividends - 1) * 100
Interim Time Series: (Current Year's Trailing 12 Months Net Profit / Last Year's Trailing 12 Months Net Profit - 1) * 100

Alphabetical List of Field Definitions - N
Issue 6
© Thomson Financial 2003-2007 374 Confidential Information of Thomson Financial
Insurance Companies: Annual Time Series: ((Current Year's Net Income before Preferred Dividends + Current Year's Policyholders' Surplus) / (Last Year's Net Income before Preferred Dividends + Last Year's Policyholders' Surplus) - 1) * 100
Interim Time Series: (Current Year's Trailing 12 Months Net Profit / Last Year's Trailing 12 Months Net Profit - 1) * 100
This calculation uses restated data for last years values where available
Net Income – 3 Yr Annual Growth Growth Rate, Annual Item; Field 08638
All Industries: ((Current Year's Net income / Net income four years ago, reduced to a compound annual rate) – 1) * 100
This item is only available for ADRs and is generally not available prior to 1996.
Net Income - 5 Yr Annual Growth Growth Rate, Annual Item; Field 08640
All Industries: ((Current Year's Net Income before Preferred Dividends / Net Income before Preferred Dividends six years ago, reduced to a compound annual rate) - 1) * 100
Insurance Companies: ((Current Year's Net Income before Preferred Dividends + Policyholders' Surplus) / (Net Income before Preferred Dividends + Policyholders' Surplus six years ago, reduced to a compound annual rate) - 1) * 100
Net Income – Bottom Line (Formerly Net Income Before Preferred Dividends) Supplementary (Income) Data, Annual Item; Field 01651
All Industries: NET INCOME - BOTTOM LINE represents income after all operating and non-operating income and expense, reserves, income taxes, minority interest and extraordinary items.
Footnotes: A. Net income is before the effect of minority interests C. Before capital contribution and state guarantees by government or interest on same D. Profit before appropriations and tax F. Profit before tax G. Taxes and other expenses cannot be separated H. Changed reporting practice to exclude effect of allocations to untaxed reserves I. Excludes extraordinary charge or credit J. Net income accounted for in the insurance reserve fund K. Policyholders' surplus cannot be separated L. Before provision for loan losses which cannot be separated from equity reserves
Net Income After Preferred Dividends (Basic EPS) (Formerly Net Income Used To Calculate Basic Earnings Per Share) Income Data, Annual Item; Field 01706
All Industries: NET INCOME AFTER PREFERRED DIVIDENDS represents the net income after preferred dividends that the company uses to calculate its basic earnings per share.

Alphabetical List of Field Definitions - N
Issue 6
© Thomson Financial 2003-2007 375 Confidential Information of Thomson Financial
Footnotes: A. No standard text C. Change reporting practice to excluded effect of allocations to reserves D. Net income before effects of minority interest
Net Income Before Extraordinary Items/Preferred Dividends Income Data, Annual Item; Field 01551
All Industries: NET INCOME BEFORE EXTRAORDINARY ITEMS/PREFERRED DIVIDENDS represents income before extraordinary items and preferred and common dividends, but after operating and non-operating income and expense, reserves, income taxes, minority interest and equity in earnings. If a company reports discontinued operations it is treated as follows: a. If the discontinued operations are purely an operating gain or loss on a business segment the
company is discontinuing, income including the discontinued operations will be shown. b. If the discontinued operations include disposal (gain or loss on a sale), then earnings per share is
examined. If a separate per share amount is shown for discontinued operations and a separate per share amount is shown for disposal, the discontinued operations portion is included in net income and the disposal portion is treated as an extraordinary charge or credit. If one per share amount for discontinued operations is reported and it includes disposal, then net income before discontinued operations is shown and the discontinued operations is treated as an extraordinary item.
Footnotes: A. Net income is before the effect of minority interest C. Before capital contribution and state guarantees by government or interest on same D. Profit before appropriations and tax F. Profit before tax G. Taxes and other expenses cannot be separated H. Changed reporting practice to exclude effect of allocations to untaxed reserves J. Net income accounted for in the insurance reserve fund K. Policyholders' Equity cannot be separated L. Before provision for loan losses which cannot be separated from equity reserves
Net Income Used To Calculate Earnings Per Share (Formerly Net Income Available To Common) Supplementary (Income) Data, Annual Item; Field 01751
All Industries: NET INCOME USED TO CALCULATE EARNINGS PER SHARE represents the net income the company uses to calculate its earnings per share. It is before extraordinary items. For U.S. corporations, it is one of the following: a. Net income after preferred dividends b. Common and common equivalent net income (includes effect of those securities considered common
equivalent) c. Fully diluted net income (includes the effects of all convertible securities and the exercise of stock
options and warrants) For Non-U.S. corporations, it is generally net income after preferred dividends. It is not necessarily the numerator for the earnings per share calculation.
Footnotes: A. No standard text C. Changed reporting practice to exclude effect of allocations to untaxed reserves D. Net income is before the effect of minority interest
Alphabetical List of Field Definitions - N
Issue 6
© Thomson Financial 2003-2007 376 Confidential Information of Thomson Financial
Net Income Used To Calculate Fully Diluted Earnings Per Share Supplementary (Income) Data, Annual Item; Field 01705
All Industries: NET INCOME USED TO CALCULATE FULLY DILUTED EARNINGS PER SHARE represents the net income the company uses to calculate its fully diluted earnings per share. It is the net income adjusted to add back dividends on convertible preferred stock and/or the after tax amount of interest recognized for convertible debt.
Net Income/Starting Line Cash Flow Data, Annual Item; Field 04001
Industrials, Other Financial Companies: NET INCOME/STARTING LINE represents the beginning figure of the sources and uses statement as defined by the company. For U.S. corporations it is usually the net income reported by the company before discontinued operations, extraordinary items and provision for preferred and common dividends.
Footnotes: A. Some non-operational charges cannot be separated B. Net income is after preferred dividends C. Pre-tax Income D. Operating Income F. As reported G. No standard text
Net Interest Income Income Data, Annual Item; Field 01076
Banks: NET INTEREST INCOME represents the difference between the total interest income and total interest expense of the bank.
Net Interest Income – GAAP Supplementary (Income) Data, Annual Item; Field 06830
Banks: NET INTEREST INCOME – GAAP represents the difference between the total interest income and total interest expense of a non-U.S. bank adjusted to conform to U.S. Generally Accepted Accounting Principles.
This item is presented in U.S. dollars (converted at the company's fiscal year twelve month average exchange rate). It is only available for ADRs trading on the NYSE, ASE or NASDAQ and is generally not available prior to 1994.
Net Interest Income % Average Deposits Profitability Ratio, Annual Item; Field 15150
Banks: Net Interest Income / Average of Last Year’s and Current Year’s Deposits * 100
This calculation uses restated data for last years values where available
Alphabetical List of Field Definitions - N
Issue 6
© Thomson Financial 2003-2007 377 Confidential Information of Thomson Financial
Net Interest Income % Average Deposits - 5 Yr Avg Profitability Ratio, Annual Item; Field 15153
Banks: Arithmetic average of the last five years of Net Interest Income % Average Deposits
Net Interest Income % Earning Assets Profitability Ratio, Annual Item; Field 15144
Banks: Net Interest Income / Average of Last Year’s and Current Year’s (Investment-Total + Loans-Net) * 100
This calculation uses restated data for last years values where available
Net Interest Income % Earning Assets - 5 Yr Avg Profitability Ratio, Annual Item; Field 15147
Banks: Arithmetic average of the last five years of Interest Income % Earning Assets
Net Interest Income/Net Interest Spread See NET INTEREST MARGIN (NIM)
Net Interest Margin (NIM) Supplementary Data, Annual Item; Field 18220
Banks: NET INTEREST MARGIN (NIM) measures the difference between Interest income and Interest expense, both based on earnings assets, either total or average earnings assets. This item is expressed as a percentage. This item may also be referred to as Net Interest Yield, Net Yield on Average Interest-Earning Assets, Net Average Yield on Interest-Earning Assets or Net Interest Income as a Percentage of Average Interest-Earning Assets..
Data for this field is generally not available prior to 1996 for non-U.S. companies and 1991 for U.S. companies. Footnotes:
A. No standard text
Net Interest Yield See NET INTEREST MARGIN (NIM)
Net Loan Losses Supplementary (Asset) Data, Annual Item; Field 01275
Banks: NET LOAN LOSSES represent the actual amount the bank lost during the year from uncollectable loans. It is calculated by subtracting recoveries from the amount of loans charged off.
Net Loan Losses % Total Loans Other Ratio, Annual Item; Field 15019
Banks: Net Loan Losses / (Loans-Total - Interbank Loans) * 100
Alphabetical List of Field Definitions - N
Issue 6
© Thomson Financial 2003-2007 378 Confidential Information of Thomson Financial
Net Loan Losses % Total Loans - 5 Yr Avg Other Ratio, Annual Item; Field 15022
Banks: Arithmetic average of the last five years of Net Loan Losses % Total Loans
Net Margin Profitability Ratio, Annual Item; Field 08366
All Industries: Net Income before Preferred Dividends / Net Sales or Revenues * 100
Insurance Companies: If Net Income before Preferred Dividends is not available, Policyholder’s Surplus is substituted.
Net Margin - 5 Yr Avg Profitability Ratio, Annual Item; Field 08370
All Industries: Arithmetic average of the last five years of Net Margin
Net Margin - 1 Year Annual Growth Growth Rate, Annual/Interim Item; Field 08676
All Industries: Annual Time Series: (Current Year's Net Margin / Last Year's Net Margin - 1) * 100 Interim Time Series: (Current Year's Trailing 12 Months Net Margin / Last Year's Trailing 12 Months Net Margin - 1) * 100
This calculation uses restated data for last years values where available
Net Margin - 5 Yr Annual Growth Growth Rate, Annual Item; Field 08680
All Industries: ((Current Year's Net Margin / Net Margin six years ago, reduced to a compound annual rate) - 1) * 100
Net Operating Income Supplementary (Income) Data, Annual Item; Field 01540
Insurance Companies: NET OPERATING INCOME represents income before realized investment gain or loss.
Net Premiums Written % Equity Profitability Ratio, Annual Item; Field 15507
Insurance Companies: Total Premiums Written / Average of Last Year’s and Current Year’s ( Common Equity + Policyholders' Equity) * 100
This calculation uses restated data for last years values where available
Alphabetical List of Field Definitions - N
Issue 6
© Thomson Financial 2003-2007 379 Confidential Information of Thomson Financial
Exceptions: Finland (95 and prior years) and Norway (93 and prior years):
Total Premiums Written / Average of Last Year’s and Current Year’s (Common Equity + Policyholders' Equity + Non-Equity Reserves) * 100
Sweden (88 and prior years): Total Premiums Written / Average of Last Year’s and Current Year’s (Common Equity + Policyholders' Equity + Non-Equity Reserves * .5) * 100
Sweden (89): Total Premiums Written / (Average of Last Year’s and Current Year’s Common Equity + Policyholders' Equity + (Average of Last Year’s Non Equity Reserves *.5 and Current Year’s Non-Equity Reserves * .7)) * 100
Sweden (90-92): Total Premiums Written / Average of Last Year’s and Current Year’s (Common Equity + Policyholders' Equity + Non-Equity Reserves * .7) * 100
Sweden (93): Total Premiums Written / (Average of Last Year’s and Current Year’s Common Equity + Policyholders' Equity + (Average of Last Year’s Non Equity Reserves *.7 and Current Year’s Non-Equity Reserves)) * 100
Sweden (94 and subsequent years): Total Premiums Written / Average of Last Year’s and Current Year’s (Common Equity + Policyholders' Equity) * 100
Net Premiums Written % Equity - 5 Yr Avg Profitability Ratio, Annual Item; Field 15510
Insurance Companies: Arithmetic average of the last five years of Net Premiums Written % Equity
Net Proceeds From Sale/Issue Of Common & Preferred Cash Flow Data, Annual Item; Field 04251
All Industries: NET PROCEEDS FROM SALE/ISSUE OF COMMON & PREFERRED represents the amount a company received from the sale of common and/or preferred stock. It includes amounts received from the conversion of debentures or preferred stock into common stock, exchange of common stock for debentures, sale of treasury shares, shares issued for acquisitions and proceeds from stock options.
This item is available in the annual time series and the cumulative quarterly, semi-annual and cumulative trimester interim time series. It is only available at the company level. Footnotes:
A. Includes proceeds from stock options B. Includes long term borrowings
Net Sales Or Revenues Income Data, Annual Item; Field 01001
Industrial Companies: NET SALES OR REVENUES represent gross sales and other operating revenue less discounts, returns and allowances. It includes but is not restricted to:
Franchise sales when corresponding costs are available and included in expenses. Consulting fees

Alphabetical List of Field Definitions - N
Issue 6
© Thomson Financial 2003-2007 380 Confidential Information of Thomson Financial
Service income Royalty income when included in revenues by the company. Contracts-in-progress income Licensing and franchise fees Income derived from equipment lease or rental when considered part of operating revenue Commissions earned (not gross billings) for advertising companies Income from leased departments
It excludes: Non-operating income Interest income Interest capitalized Equity in earnings of unconsolidated subsidiaries Rental income Dividend income Foreign exchange adjustment Gain on debt retired Sale of land or natural resources Sale of plant and equipment Sale of investment Sales from discontinued operations Security transactions Income on reserve fund securities when shown separately Operating differential subsidies for shipping companies Net mutual aid assistance for airlines companies General and Service Taxes Value-Added taxes Excise taxes Windfall Profit Taxes
Banks, Insurance and Other Financial Companies: REVENUES represent the total operating revenue of the company. It includes but is not restricted to:
For Banks: Interest and fees on loans Interest on Federal Funds Interest on Bank Deposits Interest on State, County and Municipalities Funds Interest on U.S. Government and Federal Agencies Securities Federal Funds sold and securities purchased under resale agreements Lease Financing Net leasing revenue Income from Trading Accounts Foreign Exchange Income Investment Securities gains/losses Service Charges on Deposits Other Service Fees Trust Income Commissions and Fees For Insurance Companies: Premiums Earned

Alphabetical List of Field Definitions - N
Issue 6
© Thomson Financial 2003-2007 381 Confidential Information of Thomson Financial
Investment income (if the company reports this item net of expenses then the net amount is shown after excluding interest expense) Other operating income Gains/Losses on sale of securities (pre-tax) For Other Financial Companies: Investment income/loss Interest income Income from trading accounts Trust income Commission and fees Rental Income Securities purchased under resale agreements Investment Banking income Principal Transactions
Footnotes: A. Gross total sales or revenue AA. Length of fiscal period is 18 months AB. Length of fiscal period is 15 months AC. Length of fiscal period is 9 months AD. Length of fiscal period is 6 months AF. Length of fiscal period is 5 months AG. Length of fiscal period is 13 months AH. Length of fiscal period is 14 months AI. Length of fiscal period is 7 months AJ. Length of fiscal period is 8 months AK. Length of fiscal period is 48 weeks AL. Length of fiscal period is 3 months AM. Length of fiscal period is 11 months AN. Length of fiscal period is 53 weeks AP. Length of fiscal period is 16 months AQ. Length of fiscal period is 10 months AR. Length of fiscal period is 20 months AS. Length of fiscal period is 2 months AT. Length of fiscal period is 17 months AU. Length of fiscal period is 4 months AV. Length of fiscal period is 21 months AX. Length of fiscal period is 22 months B. Net sales includes value-added, excise, windfall profit or sales tax BA. Major accounting standards switch BB. Change from unconsolidated to consolidated reports BC. Major reorganization BD. Change from domestic consolidation to worldwide consolidation BE. Major accounting standards switch and major reorganization BF. Change from domestic consolidation to domestic consolidation and one other country BG. Change from domestic consolidation and one other country to worldwide consolidation BH. Change from worldwide consolidation to domestic consolidation BI. Major accounting standards switch and change from domestic consolidation to worldwide consolidation BJ. Change from domestic consolidation to unconsolidated reports BK. Includes investment income BL. Change from worldwide consolidation to unconsolidated reports BN. Major reorganization. Changes in perimeter of consolidation BP. Change in accounting method for domestic companies from full consolidation to equity method BQ. Substantial changes in forms of financial statements BS. Company's financial statements are based on INPC (National Consumer Price Index). Prior data is not
comparable.

Alphabetical List of Field Definitions - N
Issue 6
© Thomson Financial 2003-2007 382 Confidential Information of Thomson Financial
BT. Based on monetary adjusted statements C. Includes deferred profit on installment sales D. Includes inter-company sales (Non-U.S. companies only) F. Combined interim reports for the periods G. Limited income statement given H. Includes services, but no sales are disclosed I. Value-added, excise, windfall profit or sales tax has been subtracted along with an undeterminable
amount of other taxes which could not be separated J. Includes only main component K. Acq'd L. No standard text M. Includes equity in pre-tax income which cannot be separated. N. No standard text P. Not balancing with components of income due to lack of disclosure of each operating item. Q. Revenue attributable to the banking business is not disclosed R. Net of interest expenses S. Net of operating expenses SP. Preliminary – as reported by the company T. Net of expenses U. No standard text V. No standard text W. Includes other income Y. Net of expenses and tax Z. Holding company
Net Sales Or Revenues (U.S.$) Supplementary Data, Annual Item; Field 07240
All Industries: NET SALES OR REVENUES (U.S.$) represents the net sales or revenues of the company converted to U.S. dollars using the fiscal year end exchange rate. See the definition for NET SALES OR REVENUES for information regarding the net sales or revenues used in this calculation
Net Sales / Working Capital Asset Utilization Ratio, Annual Item; Field 08141
All Industries: Net Sales or Revenues / (Current Assets-Total - Current Liabilities-Total)
Net Sales / Working Capital - 5 Yr Avg Asset Utilization Ratio, Annual Item; Field 08145
All Industries: Arithmetic average of the last five years of Net Sales or Revenues / Working Capital
Net Sales Growth (Period Vs. Year Ago) Growth Rate, Historic Item, Interim Time Series; Field 08698
All Industries: (Net Sales or Revenue / Last Year’s Net Sales or Revenues for the same period –1) * 100
This item is populated for the quarterly, semi-annual, trimester, quarterly cumulative and trimester cumulative time series based on the availability of underlying data. It is not available prior to 1999.

Alphabetical List of Field Definitions - N
Issue 6
© Thomson Financial 2003-2007 383 Confidential Information of Thomson Financial
Net Sales/Revenues - 1 Yr Annual Growth Growth Rate, Annual/Interim Item; Field 08631
All Industries: Annual Time Series: (Current Year's Net Sales or Revenues / Last Year's Total Net Sales or Revenues - 1) * 100 Interim Time Series: (Current Year's Trailing 12 Months Net Sales or Revenues / Last Year's Trailing 12 Months Total Net Sales or Revenues - 1) * 100
This calculation uses restated data for last years values where available
Net Sales/Revenues – 3 Yr Annual Growth Growth Rate, Annual Item; Field 08633
All Industries: ((Current Year's Net Sales or Revenues / Net Sales or Revenues four years ago, reduced to a compound annual rate) – 1) * 100
This item is only available for ADRs and is generally not available prior to 1996.
Net Sales/Revenues - 5 Yr Annual Growth Growth Rate, Annual Item; Field 08635
All Industries: ((Current Year's Net Sales or Revenues / Net Sales or Revenues six years ago, reduced to a compound annual rate) - 1) * 100
Net Sales To Gross Fixed Assets Asset Utilization Ratio, Annual Item; Field 08431
All Industries: Net Sales or Revenues / Property, Plant and Equipment-Gross
Net Sales To Gross Fixed Assets - 5 Yr Avg Asset Utilization Ratio, Annual Item; Field 08435
All Industries: Arithmetic average of the last five years of Net Sales to Gross Fixed Assets Ratios.
NIM See Net Interest Margin (NIM)
Non-Convertible Debt Liability Data, Annual Item; Field 18281
All Industries: NON-CONVERTIBLE DEBT represents the total amount of a company's long term debt that is not convertible into common or preferred stock.
Data for this field is generally not available prior to 1991.
Alphabetical List of Field Definitions - N
Issue 6
© Thomson Financial 2003-2007 384 Confidential Information of Thomson Financial
Non-Equity Reserves Liability Data, Annual Item; Field 03401
All Industries: NON-EQUITY RESERVES represent a reserve set aside from shareholders' equity with no designated payee. This item is only applicable to non-U.S. corporations. It includes but is not restricted to:
Specific reserves (includes untaxed reserves) Government/Investment grants (capital subsidies) Revaluation reserves as well as current cost reserves unless clearly placed in shareholders' equity Electricity supply funds
Footnotes: F. See equity in untaxed reserves and deferred tax liability in untaxed reserves G. Adjusted to excluded loan loss reserves H. No standard text
Non-Interest Expense Expense Data, Annual Item; Field 01245
Banks: NON-INTEREST EXPENSE represents all expenses of the bank except interest expense and provision for loan losses. It includes but is not restricted to:
Salaries and benefits Equipment expense Occupancy expense Depreciation and depletion Taxes other than income tax Other operating expenses
Non-Interest Income Income Data, Annual Item; Field 01021
Banks: NON-INTEREST INCOME represents all other operating revenues of the bank besides interest income. It includes but is not restricted to:
Investment securities gains/losses Trust & fiduciary income Commission & fees Income from trading accounts Foreign exchange income
Non-Interest Income – GAAP Supplementary (Income) Data, Annual Item; Field 06840
Banks: NON-INTEREST INCOME – GAAP represents all other operating revenues of a non-U.S. bank besides interest income adjusted to conform to U.S. Generally Accepted Accounting Principles. See definition for NON-INTEREST INCOME for additional information.
This item is presented in U.S. dollars (converted at the company's fiscal year twelve month average exchange rate). It is only available for ADRs trading on the NYSE, ASE or NASDAQ and is generally not available prior to 1994.

Alphabetical List of Field Definitions - N
Issue 6
© Thomson Financial 2003-2007 385 Confidential Information of Thomson Financial
Non-Interest Income % Total Revenues Profitability Ratio, Annual Item; Field 15593
Banks: Non-Interest Income / Net Sales or Revenues * 100
Non-Interest Income % Total Revenues - 5 Yr Avg Profitability Ratio, Annual Item; Field 15596
Banks: Arithmetic average of the last five years of Non-Interest Income % Total Revenues
Non-Operating Interest Income Income Data, Annual Item; Field 01266
All Industries: NON-OPERATING INTEREST INCOME represents income generated from interest bearing investments not related to the operating activities of the company.
Data for this field is generally not available prior to 1990. It includes but is not restricted to:
Interest on savings Interest on Investments
Footnotes: A. Net of interest expense B. Includes other income C. Similar income included
Non-Performing Loans Supplementary (Asset) Data, Annual Item; Field 02285
Banks: NON-PERFORMING LOANS represent the amount of loans that the bank foresees difficulty in collecting.
It includes but is not restricted to: Non-accrual loans Reduced rate loans Renegotiated loans Loans past due 90 days or more
It excludes: Assets acquired in foreclosures Repossessed personal property
Non-Performing Loans % Equity Other Ratio, Annual Item; Field 15067
Banks: Non-Performing Loans / Common Shareholders' Equity * 100
Exceptions: Finland (95 and prior years) and Norway (93 and prior years):
Non-Performing Loans / (Common Shareholders' Equity + Non-Equity Reserves) * 100 Sweden (88 and prior years):
Non-Performing Loans / (Common Shareholders' Equity + Non-Equity Reserves * .5) * 100

Alphabetical List of Field Definitions - N
Issue 6
© Thomson Financial 2003-2007 386 Confidential Information of Thomson Financial
Sweden (89 to 93): Non-Performing Loans / (Common Shareholders' Equity + Non-Equity Reserves * .7) * 100
Sweden (94 and subsequent years): Non-Performing Loans / Common Shareholders' Equity * 100
Non-Performing Loans % Equity - 5 Yr Avg Other Ratio, Annual Item; Field 15070
Banks: Arithmetic average of the last five years of Non-Performing Loans % Equity
Non-Performing Loans % Reserve For Loan Losses Other Ratio, Annual Item; Field 15001
Banks: Non-Performing Loans / Reserve for Loan Losses * 100
Non-Performing Loans % Reserve For Loan Losses - 5 Yr Avg Other Ratio, Annual Item; Field 15004
Banks: Arithmetic average of the five years of Non-Performing Loans % Reserve Loan Losses
Non-Performing Loans % Total Loans Other Ratio, Annual Item; Field 15061
Banks: Non-Performing Loans / Loans-Total * 100
Non-Performing Loans % Total Loans - 5 Yr Avg Other Ratio, Annual Item; Field 15064
Banks: Arithmetic average of the last five years Non-Performing Loans % Total Loans
Non-Redeemable Preferred Stock Supplementary (Liability) Data, Annual Item; Field 18289
All Industries: NON-REDEEMABLE PREFERRED STOCK represents a security of a company which cannot be paid off before maturity even if the company can afford to do so. This stock is not subject to call and is shown at involuntary liquidation value.
Data for this field is generally not available prior to 1996 for non-U.S. companies and 1991 for U.S. companies. Footnotes:
A. No standard text

Alphabetical List of Field Definitions - N
Issue 6
© Thomson Financial 2003-2007 387 Confidential Information of Thomson Financial
Non-Redeemable Preferred Stock Asset Data, Annual Item; Field 02229
Insurance Companies: NON-REDEEMABLE PREFERRED STOCK represents the insurance company's investment in securities which cannot be paid off before maturity even if the company can afford to do so. These securities are not subject to recall.
Number Of Months - Earnings Per Share - Quarters 1 - 4 Stock Data, Annual Items; Fields 05217, 05218, 05219, 05220, respectively
All Industries: NUMBER OF MONTHS - QUARTERS 1-4 represent the number of months that the earnings are reported for. These fields are only available when the EARNINGS REPORT FREQUENCY has a code of 3 (three fixed interim periods) or a code of 0 (missing quarters/quarter). If there is no data in these fields and the company has a code of 0 in EARNINGS REPORT FREQUENCY, then the number of months is assumed to be three.
Data for these fields is generally not available prior to 1992. These items are also available at the security level from 1992 and subsequent years.
Number Of Shares Authorized Stock Data, Annual Item; Field 05326
All Industries: NUMBER OF SHARES AUTHORIZED represents the maximum number of shares that can be issued by a company. If the company is publicly traded then the SEC and the company's state of incorporation must approve it. The number of shares issued is usually smaller than the authorized shares.
Data for this field is generally not available prior to 1996 for non-U.S. companies and 1991 for U.S. companies. Footnotes:
A. No standard text

Issue 6
© Thomson Financial 2003-2007 388 Confidential Information of Thomson Financial
O Officers Descriptive Data, Current Items; Fields 06041, 06051, 06061, 06071, 06081
All Industries: OFFICERS represent the principal officers of the company. The most senior ranking officer is updated in Field 06041, the least senior officer is updated in Field 06081.
Footnotes: CT. Officer's Title
Operating Cash / Fixed Charges Leverage Ratio, Annual Item; Field 08261
All Industries: Funds from Operations / (Interest Expense on Debt + (Preferred Dividends (Cash) / 1- (Tax Rate / 100)) If the Tax rate is negative or not available or if preferred dividends are 0: Funds from Operations / (Interest Expense on Debt + Preferred Dividends (Cash))
Exceptions: U.S. Companies:
Standard Tax Rate Used in Calculations: 86 and prior years: 46% 87 and subsequent years: 34% 95 and subsequent years: 35%
Operating Cash/Fixed Charges - 5 Yr Avg Leverage Ratio, Annual Item; Field 08265
All Industries: Arithmetic average of Operating Cash/Fixed Charges for the last five years
Operating Expenses - Total Expense Data, Annual Item; Field 01249
All Industries: OPERATING EXPENSES - TOTAL represents the sum of all expenses related to operations.
Operating Income Income Data, Annual Item; Field 01250
All Industries: OPERATING INCOME represents the difference between sales and total operating expenses
Footnotes: B. Net of income taxes
Alphabetical List of Field Definitions - O
Issue 6
© Thomson Financial 2003-2007 389 Confidential Information of Thomson Financial
Operating Income Before Depreciation and Amortization Supplementary (Income) Data, Historic Item; Annual and Interim Time Series; Field 18155
All Industries: OPERATING INCOME DEPRECIATION AND AMORTIZATION represents the operating income of a company before depreciation and amortization expenses have been deducted.
This item is populated for the quarterly, semi-annual, trimester, cumulative quarterly, cumulative trimester and annual time series based on the availability of underlying data. It is not available prior to 1998.
Operating Income Return On Total Capital (%) Profitability Ratio, Annual Item; Field 08361
All Industries: Operating Income / Average of Last Year's and Current Year’s Total Capital * 100 This calculation uses restated data for last years values where available.
Operating Income Return On Total Capital (%) - 5 Yr Avg Profitability Ratio, Annual Item; Field 08365
All Industries: Arithmetic average of the last five years of Operating Income/ Total Capital
Operating Income – GAAP Supplementary (Income) Data, Annual Item; Field 06850
All Industries: OPERATING INCOME – GAAP represents the difference between sales/revenues and total operating expenses of a non-U.S. company adjusted to conform to U.S. Generally Accepted Accounting Principles.
This item is presented in U.S. dollars (converted at the company's fiscal year twelve month average exchange rate). It is only available for ADRs trading on the NYSE, ASE or NASDAQ and is generally not available prior to 1994.
Operating Income % Premiums Earned Profitability Ratio, Annual Item; Field 15519
Insurance Companies: Operating Income / Premiums Earned * 100
Operating Income % Premiums Earned - 5 Yr Avg Profitability Ratio, Annual Item; Field 15522
Insurance Companies: Arithmetic average of the last five years of Operating Income % Premiums Earned
Footnotes: A. Three Year Average B. Four Year Average
Alphabetical List of Field Definitions - O
Issue 6
© Thomson Financial 2003-2007 390 Confidential Information of Thomson Financial
Operating Income % Total Premiums Written Profitability Ratio, Annual Item; Field 15543
Insurance Companies: Operating Income / Total Premiums Written * 100
Operating Income % Total Premiums Written - 5 Yr Avg Profitability Ratio, Annual Item; Field 15546
Insurance Companies: Arithmetic average of the last five years of Operating Income % Total Premiums Written
Operating Income - 1 Yr Annual Growth Growth Rate, Annual Item; Field 08646
All Industries: (Current Year's Operating Income / Last Year's Operating Income - 1) * 100
This calculation uses restated data for last years values where available
Operating Income - 5 Yr Annual Growth Growth Rate, Annual Item; Field 08650
All Industries: ((Current Year's Operating Income / Operating Income six years ago, reduced to a compound annual rate) - 1) * 100
Operating Profit Margin Profitability Ratio, Annual Item; Field 08316
All Industries: Operating Income / Net Sales or Revenues * 100
Operating Profit Margin - 5 Yr Avg Profitability Ratio, Annual Item; Field 08320
All Industries: Arithmetic Average of the last five years of Operating Profit Margin
Operating Profit Per Share Stock Data, Annual Item; Field 05509
All Industries: OPERATING PROFIT PER SHARE represents the per share amount of the operating profit of a company.
This item is shown per 1,000 shares for Brazilian companies.
Operating Provisions Supplementary (Expense) Data, Annual Item; Field 01302
All Industries: OPERATING PROVISIONS represent any operating provision such as maintenance expenses and provisions for risks and charges.
Alphabetical List of Field Definitions - O
Issue 6
© Thomson Financial 2003-2007 391 Confidential Information of Thomson Financial
Data for this field is generally not available prior to 1992. It includes but is not restricted to:
Provisions for risk and charges Provisions for maintenance expense Provisions for other operating expenses
It excludes: Provision for bad debts Provision for non-equity reserves
Footnotes: A. No standard text
Order Backlog Supplementary Data, Annual Item; Field 18223
All Industries: ORDER BACKLOG represents a customer's order that cannot be filled at the present time. This is due to the fact that the merchandise is not presently in stock. Excessive backlog can be an indication of poor inventory management.
Data for this field is generally not available prior to 1996 for non-U.S. companies and 1991 for U.S. companies. Footnotes:
A. No standard text
Ordinary Profit Supplementary (Income) Data, Annual Item; Field 18175
All Industries: ORDINARY PROFIT represents the operating profit plus any non-operating income minus any non-operating expense before any extraordinary items. This item is only available for Japanese companies.
Data for this field is generally not available prior to 1994.
Other Accrued Expenses Supplementary (Liability) Data, Annual Item; Field 03069
All Industries: OTHER ACCRUED EXPENSES represent those accrued expenses not included in accrued payroll, interest payable, dividends payable or income taxes payable.
Data for this field is generally not available prior to 1992. Footnotes:
A. No standard text B. Includes deferred income
Other Appropriated Reserves Shareholders' Equity Data, Annual Item; Field 03493
All Industries: OTHER APPROPRIATED RESERVES represent reserves which are identified for a specific purpose other than revaluation.
Data for this field is generally not available prior to 1989. It includes but is not restricted to:
Capital redemption reserves Funds set aside for the issuance of common stock warrants.

Alphabetical List of Field Definitions - O
Issue 6
© Thomson Financial 2003-2007 392 Confidential Information of Thomson Financial
Footnotes: A. Includes unappropriated reserves B. No standard text C. No standard text T. Includes consolidation adjustments
Other Assets Asset Data, Annual Item; Field 02652
All Industries: OTHER ASSETS represent all other assets of the company besides current assets, long term receivables, investment in unconsolidated subsidiaries, other investments and net property, plant and equipment.
For years prior to 1989 it represents all other assets of the company besides current assets and net property, plant and equipment
Banks: OTHER ASSETS represent all other assets of the bank besides cash and due from banks, total investments, net loans, investment in unconsolidated subsidiaries, customer liability on acceptances (if included in total assets), real estate assets and net property, plant & equipment. For years prior to 1989 it represents all other assets besides cash and due from banks, customer liabilities on acceptances (if included in total assets), total investments, net loans, real estate assets and net property, plant and equipment.
Insurance Companies: OTHER ASSETS represent all other assets of the company besides total investments, investment in unconsolidated subsidiaries, cash, premium balance receivables and net property, plant and equipment. For years prior to 1989 it represents all other assets of the company besides total investments, cash, premium balance receivables and net property, plant and equipment.
Other Financial Companies: OTHER ASSETS represent all other assets of the company besides cash and equivalents, receivables, securities inventories, custody securities, total investments, investment in associated companies and net property, plant and equipment. For years prior to 1989 it represents all other assets of the company besides cash and equivalents, receivables, securities inventory, custody securities, total investments and net property, plant and equipment.
Footnotes: A. Includes net fixed assets B. Includes some cash items C. Includes other investments
Other Assets – GAAP Supplementary (Asset) Data, Annual Item; Field 06695
All Industries: OTHER ASSETS – GAAP represents all other assets of a non-U.S. company not included in Current Assets, Property, Plant and Equipment (Net), Investments, Loans, Goodwill and Other Intangibles adjusted to conform to U.S. Generally Accepted Accounting Principles.
This item is presented in U.S. dollars (converted at the company's fiscal year end exchange rate). It is only available for ADRs trading on the NYSE, ASE or NASDAQ and is generally not available prior to 1994.

Alphabetical List of Field Definitions - O
Issue 6
© Thomson Financial 2003-2007 393 Confidential Information of Thomson Financial
Other Cash Flow Supplementary (Cash Flow) Data, Annual and U.S. Interim Item; Field 04057
Industrials, Other Financial Companies: OTHER CASH FLOW represents any unspecified trading cash flows or combination of trading inflows not shown separately under WS fields 04052, 04053, 04054, 04055, 04056, 04058. For non-U.S. companies, it may include interest received, interest paid and taxation paid which are shown by Worldscope under the supplementary cash flow fields 04149, 04148 and 04150. This data is a component of Total Other Cash Flow (field 04151).
This item is available in the annual original and annual restated time series for detailed companies, full update. For U.S. companies it is also available in the interim original and interim restated time series.
Other Current Assets Asset Data, Annual Item; Field 02149
Industrials: OTHER CURRENT ASSETS represents all other current assets besides cash and equivalents, receivables, inventories and prepaid expenses.
For years prior to 1989 it represents all other current assets besides cash and equivalents, receivables and inventories.
It includes but is not restricted to: Deferred expenses included in current assets Property and assets held for disposal Deposits and advances to others Program rights Accrued Ad Valorem taxes Felling Rights (if shown as a current asset) Deferred or future income tax benefits (if shown as current asset)
Footnotes: A. Includes prepaid expenses
Other Current Liabilities Liability Data, Annual Item; Field 03066
Industrials: OTHER CURRENT LIABILITIES represents all other current liabilities besides accounts payable, short term debt, accrued payroll, income taxes payable and dividends payable.
For years prior to 1989 it represents all other current liabilities besides short term debt. It includes but is not restricted to:
Product guarantees and warranties Contingency reserves Taxes other than income taxes Payroll taxes Ad Valorem taxes Restructuring expenses Pensions Dividends to minority shareholders of subsidiaries Interest Payable (field 03062) Other Accrued Expenses (field 03069)

Alphabetical List of Field Definitions - O
Issue 6
© Thomson Financial 2003-2007 394 Confidential Information of Thomson Financial
Other Income/Expense - Net Income Data, Annual Item; Field 01262
All Industries: OTHER INCOME/EXPENSE - NET represents other pre-tax income and expenses besides operating income, non-operating interest income, interest expense on debt, interest capitalized, pre-tax extraordinary charge, pre-tax extraordinary credit and increase/decrease in reserves. For years prior to 1989 it represents other pre-tax income and expenses besides operating income, interest expense on debt, interest capitalized and increase/decrease in reserves. It includes but is not restricted to:
Gain/Loss on disposal of assets (field 01306) Dividend income - non-operating (field 01268) Foreign exchange transactions (field 01352) Monetary correction (field 01265) Discontinued operations-pre-tax (field 01269) Foreign currency translation gain/loss (field 01351) Allowance for funds used during construction if not interest related (utilities only) Gain on sale of investment (Other financial companies only) (field 01305)
It excludes: Allowance for borrowed funds used during construction which are interest related (utilities only)
Footnotes: A. Some operating expenses are included B. Includes non-equity reserve charges (credits) C. Includes extraordinary gain/loss D. Includes government grants and government supports F. Includes interest expense J. Includes foreign exchange loss/gain
Other Insurance Reserves Liability Data, Annual Item; Field 03023
Insurance Companies: OTHER RESERVES represent all other reserves except benefit and loss reserves, unearned premiums and policy and contract claims.
Other Intangible Assets – Accumulated Amortization Supplementary (Asset) Data, Annual Item; Field 02515
All Industries: OTHER INTANGIBLE ASSETS - ACCUMULATED AMORTIZATION represent the total accumulated amortization on intangible fixed assets which are either not specified as being goodwill, development costs, brands and patents, licenses, or software..
This item is available in the annual original and annual restated time series for detailed companies, full update.
Other Intangible Assets - Gross Supplementary (Asset) Data, Annual Item; Field 02514
All Industries: OTHER INTANGIBLE ASSETS - GROSS represent the gross value of intangible fixed assets which are either not included in goodwill, development costs, brands and patents, software, or licenses.
This item is available in the annual original and annual restated time series for detailed companies, full update.

Alphabetical List of Field Definitions - O
Issue 6
© Thomson Financial 2003-2007 395 Confidential Information of Thomson Financial
Other Intangibles - Net Supplementary (Asset) Data, Annual Item; Field 02513
All Industries: OTHER INTANGIBLES - NET represent intangible fixed assets which are either not specified as being goodwill, development costs, brands and patents or licenses, or which may represent a combination of some or all of these items.
This item is available in the annual original and annual restated time series for detailed companies, full update.
Other Interest Or Dividend Income Income Data, Annual Item; Field 01011
Banks: OTHER INTEREST OR DIVIDEND INCOME represents other interest income besides interest and fees on loans, interest on federal funds and government securities. It includes but is not restricted to:
Interest on equity investments
Other Investments Asset Data, Annual Item; Field 02250
All Industries: OTHER INVESTMENTS represent any other long term investment except for investments in unconsolidated subsidiaries
Banks: Annual - OTHER INVESTMENTS generally represent time deposits, interest bearing deposits and other short term investments Interim - OTHER INVESTMENTS at the interim level is a balancing item. It represents all investments included in Investments- Total (Field 02255) except Trading Account Securities (field 02208) and Federal Funds ( field 02210).
Insurance Companies: OTHER INVESTMENTS represent all other investments of the insurance company besides fixed income and equity securities, real estate investments and mortgage and policy loans.
Other Financial Companies: OTHER INVESTMENTS represent all investments except real estate assets and loans. It includes but is not restricted to:
Treasury securities (field 02205) Equity securities investment-total (field 02230) Securities purchased under resale agreements (field 02211) Long term bond investments Advances (if called advances in related companies then it is updated to Investments in Associated Companies) Assets held for resale Mortgages held for resale Money held in trust (Japan) Gold collectible (France) Construction projects under development Condominium projects under development Investments in leveraged leases Construction projects under development
Alphabetical List of Field Definitions - O
Issue 6
© Thomson Financial 2003-2007 396 Confidential Information of Thomson Financial
Footnotes: A. Net assets of non-major business when combination or consolidation is impossible B. Includes real estate investment C. Cash on hand is included F. May include long term receivables G. No standard text H. Includes investments in associated/subsidiary companies
Other Liabilities Liability Data, Annual Item; Field 03273
All Industries: OTHER LIABILITIES represent all other liabilities of the company besides current liabilities, long term debt, provision for risk and charges and deferred taxes. For years prior to 1989 it represents all other liabilities of the company besides current liabilities and long term debt.
Banks; Other Financial Companies: OTHER LIABILITIES represent all other liabilities of the bank besides total deposits, short and long term debt, provision for risks and charges and deferred taxes. For years prior to 1989 it represents all other liabilities of the bank besides total deposits and short and long term debt.
For Banks: It includes but is not restricted to:
Accrued taxes (field 03060) Customer liabilities on acceptances (liabilities) (field 03058)
For Other Financial Companies: It includes but is not restricted to:
Securities sold but not yet purchased (Short call) (field 03059) Interest payable (field 03062)
Insurance Companies: OTHER LIABILITIES represent all other liabilities of the company besides insurance reserves, short and long term debt, provision for risk and charges and deferred taxes. For years prior to 1989 it represents all other liabilities of the company besides insurance reserves and short and long term debt. It includes but is not restricted to:
Reserves for contingencies Pensions Ad Valorem taxes Taxes other than income taxes (long term) Foreign exchange on the liability side (Japan) Pre-need funeral plans Trade payables (long term) Separate & variable account liabilities (field 03035) Unrealized gain/loss on marketable securities (field 03498)
It excludes: Minority Interest Preferred stock equity Common stock equity Non-Equity reserves

Alphabetical List of Field Definitions - O
Issue 6
© Thomson Financial 2003-2007 397 Confidential Information of Thomson Financial
Footnotes: A. Includes other provisions B. Includes due to trust options C. Includes some non-equity reserves D. Includes short term liabilities F. Includes some interest bearing borrowings G. No standard text
Other Long Term Liabilities – GAAP Supplementary (Liability) Data, Annual Item; Field 06774
All Industries: OTHER LONG TERM LIABILITIES – GAAP represents all other Long Term Liabilities of a non-U.S. company not included in Current Liabilities, Deposits, Insurance Reserves, Long Term Debt and Deferred Taxes adjusted to conform to U.S. Generally Accepted Accounting Principles.
This item is presented in U.S. dollars (converted at the company's fiscal year end exchange rate). It is only available for ADRs trading on the NYSE, ASE or NASDAQ and is generally not available prior to 1994.
Other Mandatory Redeemable Instruments Supplementary (Liability) Data, Annual & Interim Item; Field 18167
All Industries: OTHER MANDATORY REDEEMABLE INSTRUMENTS represents mandatory redeemable securities disclosed within liabilities. This item would be utilized to support US GAAP SFAS150 – “Accounting for Certain Financial Instruments with Characteristics of both Liability and Equity” or similar items. This item is included in Long Term Debt.
This item is available in the annual time series and the quarterly, semi-annual and trimester interim time series. It is only available at the company level.
Other Non-Performing Assets Supplementary (Asset) Data, Annual Item; Field 02286
Banks: OTHER NON-PERFORMING ASSETS represent those assets other than loans which have been designated by the bank as having a status of nonperformance.
Data for this field is generally not available prior to 1991. It includes but is not restricted to:
Assets acquired in foreclosure Repossessed personal property
Other Operating Expenses Expense Data, Annual Item; Field 01230
Banks: OTHER OPERATING EXPENSES represents all other operating expenses besides interest expense, salaries and benefits expense, equipment expense and provision for loan losses.
All Industries: OTHER OPERATING EXPENSES represents all other operating expenses besides cost of goods sold, depreciation, depletion and amortization and selling, general and administrative expense.
Insurance Companies: OTHER OPERATING EXPENSES represents all other operating expenses besides selling, general and administrative expense, long term insurance reserves and total claims expense.

Alphabetical List of Field Definitions - O
Issue 6
© Thomson Financial 2003-2007 398 Confidential Information of Thomson Financial
Other Financial Companies: OTHER OPERATING EXPENSES represents all other operating expenses besides selling, general and administrative expense, cost of goods sold, interest expense and depreciation, depletion & amortization. It includes but is not restricted to:
Operating provisions (all industries except banks)( field 01302) Taxes other than income taxes (all industries except banks) (field 01204) Ad Valorem Taxes Underwriting expense (Insurance only) (field 01081) (when field 1101 SG&A is blank) Staff costs (Other financial companies only) (field 01084) (when field 01051 Cost of Goods Sold is blank) Equipment expenses (Other financial companies only) (field 01085)
It excludes: Excise Taxes Windfall Profit Taxes Value-Added Taxes General and Service Taxes
Other Operating Income Income Data, Annual Item; Field 01020
Banks: OTHER OPERATING INCOME represents all other non-interest income of the bank except interest income, investment income, income from trading accounts, foreign exchange income, trust and fiduciary income and commission and fees. It includes but is not restricted to:
Gain on sale of assets Other charges and fees
Insurance Companies: OTHER OPERATING INCOME represents all other revenue of the company besides premiums earned, investment income and foreign exchange income.
Other Financial Companies: OTHER OPERATING INCOME represents all other revenue of the company besides investment income, commission & fees, interest income and foreign exchange income.
Footnotes: A. Includes write-offs of loan losses B. Includes leasing transactions C. Includes interest revenue reduced by operating expenses D. Includes gain/loss on disposal of fixed assets F. Includes some investment income G. Includes some non-operating gain/loss H. Net of operating expenses
Other Operating Income – GAAP Supplementary (Income) Data, Annual Item; Field 06820
Insurance Companies: OTHER OPERATING INCOME – GAAP represents other operating income of a non-U.S. insurance company not included in premium income adjusted to conform to U.S. Generally Accepted Accounting Principles.

Alphabetical List of Field Definitions - O
Issue 6
© Thomson Financial 2003-2007 399 Confidential Information of Thomson Financial
This item is presented in U.S. dollars (converted at the company's fiscal year twelve month average exchange rate). It is only available for ADRs trading on the NYSE, ASE or NASDAQ and is generally not available prior to 1994.
Other Proceeds From Sale/Issuance Of Stock Cash Flow Data, Annual Item; Field 04302
All Industries: OTHER PROCEEDS FROM SALE/ISSUANCE OF STOCK represent the amount a company received from the sale of common and/or preferred stock. It includes amounts received from the conversion of debentures or preferred stock into common stock, sale of treasury shares and shares issued for acquisitions.
Footnotes: A. Includes proceeds from stock options B. Includes long term borrowings
Other Securities Asset Data, Annual Item; Field 02209
Banks: OTHER SECURITIES represent all other securities besides Treasury, Federal Agency, State, Municipal and Trading Account Securities. It includes but is not restricted to:
Due from stockbrokers and other stock exchange intermediaries (France) Subscription of newly issued bonds (France) Other bills (U.K.) Unlisted investments (U.K) Other fixed income securities (Spain) Other investments listed in the country (U.K.) Other investments listed outside the country (U.K.) Corporate stock available for sale (field 18091) Other securities available for sale (field 18092)
Other Securities Available For Sale Supplementary (Asset) Data, Annual Item; Field 18092
Banks: OTHER SECURITIES AVAILABLE FOR SALE represents the amount of other securities available for sale besides treasury securities, federal agency securities, state/municipal securities, mortgage backed securities and corporate stock.
Reporting required by U.S. FASB 115. Updated where available in 1993 and subsequent years. It includes but is not restricted to:
Due from stock brokers and other stock exchange intermediaries Subscription of newly issued bonds Subscription of bonds already issued Other bills Other investments listed in the country Other investment listed outside the country Unlisted investments Other fixed income securities Bills discounted

Alphabetical List of Field Definitions - O
Issue 6
© Thomson Financial 2003-2007 400 Confidential Information of Thomson Financial
Footnotes: A. No standard text
Other Sources Cash Flow Data, Annual Item; Field 04450
All Industries: OTHER SOURCES represents all other sources besides funds from operations, extraordinary items, net proceeds from sale/issue of common and preferred, disposal of fixed assets, long term borrowing, decrease in investments, increase in deposits (banks, savings and loan companies only), decrease in loans (banks, savings and loan companies only), increase/decrease in federal home loan advances (banks, savings and loan companies only), changes in cash and/or liquid assets and funds for/from other operating activities.
For years prior to 1989 other sources generally represents all other sources besides funds from operations, extraordinary items, net proceeds from sales/issue of common and preferred, disposal of fixed assets and long term borrowing.
Other Sources - Financing Cash Flow Data, Annual Item; Field 04446
All Industries: OTHER SOURCES - FINANCING represents any other funds derived from financing activities not included in additions to stock, proceeds from stock options, long term borrowings, increase/decrease of short term debt, reduction of long term debt, total cash dividends paid or common/preferred redeemed, retired, converted or purchased.
Data for this field is generally not available prior to 1992. It includes but is not restricted to:
Dividends paid to minorities Footnotes:
A. No standard text B. Includes other sources - financing
Other Sources - Investing Cash Flow Data, Annual Item; Field 04796
All Industries: OTHER SOURCES - INVESTING represents any other funds derived from the investing activities and not included in capital expenditures, net assets from acquisitions, increase in investments or additions to property.
Data for this field is generally not available prior to 1992. It includes but is not restricted to:
Decrease in federal funds sold Decrease in securities purchased under agreements to resell Increase in bank card receivables Collection of longer-term loans
Footnotes: A. No standard text B. Includes other uses - investing
Alphabetical List of Field Definitions - O
Issue 6
© Thomson Financial 2003-2007 401 Confidential Information of Thomson Financial
Other Sources/(Uses) - Financing Cash Flow Data, Annual Item; Field 04448
All Industries: OTHER SOURCES/(USES) - FINANCING represents cash flow from financing activities other than reduction in long term debt, increase in long term debt, increase/decrease in short term borrowings, proceeds from the sale of stock, stocks purchased or redeemed and total dividends paid. It is used when items are not delineated.
Data for this field is generally not available prior to 1989. It includes but is not restricted to:
Dividends paid to minorities
Other Uses Cash Flow Data, Annual Item; Field 04799
All Industries: OTHER USES represents all other uses besides total dividends paid, capital expenditures, net assets from acquisitions, additions to other assets, reduction in long term debt, common/preferred redeemed, retired, converted, etc., decrease in deposits (banks, savings and loan companies only), increase in loans (banks, savings and loan companies only), and increase in investments.
For years prior to 1989 other uses generally represents all other uses besides total dividends paid, capital expenditures, additions to other assets, reduction in long term debt, common/preferred redeemed, retired, converted, etc.
Other Uses - Financing Cash Flow Data, Annual Item; Field 04447
All Industries: OTHER USES - FINANCING represents any other funds employed in financing activities and not include in additions to stock, proceeds from stock options, long term borrowings, increase/decrease in short term debt, reduction of long term debt, total cash dividends paid or common/preferred redeemed, retired, converted or purchased.
Data for this field is generally not available prior to 1992. Footnotes:
A. No standard text B. Includes other sources - financing
Other Uses - Investing Cash Flow Data, Annual Item; Field 04795
All Industries: OTHER USES - INVESTING represents any other funds employed in investing activities and not included in capital expenditures, net assets from acquisitions, increase in investments, decrease in investments or additions to property.
Data for this field is generally not available prior to 1992. It includes but is not restricted to:
Purchase of other assets Increase in federal funds sold Increase in securities purchased under agreements to resell Origination of longer-term loans
Footnotes: A. No standard text
Alphabetical List of Field Definitions - O
Issue 6
© Thomson Financial 2003-2007 402 Confidential Information of Thomson Financial
B. Includes other sources - investing
Other Uses/(Sources) Investing Cash Flow Data, Annual Item; Field 04797
All Industries: OTHER USES/(SOURCES) INVESTING represents increases or decreases from investing activities other than capital expenditures, net assets from acquisitions, decrease from investments, increase from investments, fixed asset disposal and increase in other assets. It is used when items are not delineated.
Data for this field is generally not available prior to 1989.
OVFA Earnings Per Share Stock Data, Annual Item; Field 05203
All Industries: OVFA EARNINGS PER SHARE represent earnings per share as calculated in accordance with the formula laid down by the Austrian Society of Investment Analysts. These earnings are calculated under the "OVFA method" which makes uniform adjustments to the published net profit of the company, allowing for better company comparisons.
This field is only available for Austrian companies and is generally not available prior to 1994.
Own Shares See TREASURY STOCK

Issue 6
© Thomson Financial 2003-2007 403 Confidential Information of Thomson Financial
P Par Value Stock Data, Annual Item; Field 05309
All Industries: PAR VALUE represents the per share value that is arbitrarily assigned to the stock by the company issuing the stock. It is the nominal or face value of a security. For companies with more than one type of common/ordinary share, the par value shown is for the share type identified in field 6005 - Type of Share.
Data for this field is generally not available prior to 1991. This item is also available at the security level for 1991 and subsequent years.
Par Value - Mult Share 1, 2, 3, 4, 5, 6, 7 Stock Data, Annual Item, Fields 20002, 20102, 20202, 20302, 20402, 20502,20602, respectively
All Industries: PAR VALUE - MULT SHARE 1, 2, 3, 4, 5, 6, 7 represents the per share value that is arbitrarily assigned to each class of common/ordinary shares of a company. It is the nominal or face value of a security.
Data for these fields is generally not available prior to 1991.
Parent Auditors & Affiliates (Formerly International Auditors & Affiliates) Descriptive Data, Current Items
All Industries: PARENT AUDITORS & AFFILIATES represent the names of the auditor or auditors and their affiliate(s), employed by a company to examine its financial records. The Affiliate fields show the name of the local auditor or auditors who examined the company’s books. The Parent Auditor fields show the name of the international accounting firm or firms to which the local auditor or auditors are affiliated. The fields are defined as follows:
07800 Parent Auditor 1 07801 Parent Auditor 1 - Affiliate 1 07802 Parent Auditor 1 - Affiliate 2 07803 Parent Auditor 1 - Affiliate 3 07804 Parent Auditor 1 - Affiliate 4 07805 Parent Auditor 2 07806 Parent Auditor 2 - Affiliate 1 07807 Parent Auditor 2 - Affiliate 2 07808 Parent Auditor 2 - Affiliate 3 07809 Parent Auditor 2 - Affiliate 4 07810 Parent Auditor 3 07811 Parent Auditor 3 - Affiliate 1 07812 Parent Auditor 3 - Affiliate 2 07813 Parent Auditor 3 - Affiliate 3 07814 Parent Auditor 3 - Affiliate 4 07815 Parent Auditor 4
Alphabetical List of Field Definitions - P
Issue 6
© Thomson Financial 2003-2007 404 Confidential Information of Thomson Financial
07816 Parent Auditor 4 - Affiliate 1 07817 Parent Auditor 4 - Affiliate 2 07818 Parent Auditor 4 - Affiliate 3 07819 Parent Auditor 4 - Affiliate 4
Data for these fields are generally not available prior to 1990. The following codes are used for the Parent Auditors:
AA Arthur Andersen AY Arthur Young BDO BDO Binder CL Coopers & Lybrand DHS Deloitte Haskins & Sells DRMP Dunwoody Robson McGladrey & Pullen DT Deloitte & Touche EW Ernst & Whinney EY Ernst & Young GOV Audited by Government Agency GTI Grant Thornton International HHI Horwath & Horwath International HLB Hodgson Landau Brands International INDV Audited by an Individual KPMG Klynveld Peat Marwick Goerdeler MRI Moores Rowland International NADT No Auditors Found NAFF Not affiliated with an international firm NDIS Not disclosed OTH Other PC PricewaterhouseCoopers PKF Pannell Kerr Forster PM&M Peat, Marwick & Mitchell PMM Peat, Marwick & Main PW Price Waterhouse SO Spicer & Oppenheim TR Touche Ross UNAT Unaudited
Pension Assets – Long-Term Supplementary (Asset) Data, Annual Item; Field 02653
All Industries: PENSION ASSETS – LONG-TERM represent the assets in a pension plan where the fair value of plan assets are in excess of Projected Benefit Liabilities.
This item is available in the annual original and annual restated time series for detailed companies, full update.

Alphabetical List of Field Definitions - P
Issue 6
© Thomson Financial 2003-2007 405 Confidential Information of Thomson Financial
Pension/Post Retirement Benefits Supplementary (Liability) Data, Annual Item; Field 03261
All Industries: PENSION/POST RETIREMENT BENEFITS represent obligations or provisions by a company for future employee annuity payments. A pension plan is an agreement whereby the employer provides benefits to employees upon retirement. Funds are set aside by the employer and/or the employee. The funds will be invested in order to generate sufficient funds to meet the benefit requirements.
Data for this field is generally not available prior to 1992. It includes but is not restricted to:
Accrued pension liabilities Accrued post-retirement benefit cost Pension reserves Early retirement funds Post retirement health and life insurance benefits Provision for retirement bonuses
Footnotes: A. No standard text
Pension Data – Accumulated Benefit Obligation Supplementary Data, Annual Item; Field 18808
All Industries: PENSION DATA – ACCUMULATED BENEFIT OBLIGATION represents an approximate measure of the liability of a plan in the event of a termination at the date the calculation is performed. It reflects combined plans data where multiple plans exist.
This item is usually only provided by those companies that follow IAS or US GAAP accounting. This item is only available in the annual time series at the company level.
Pension Data – Actual Return On Plan Assets Supplementary Data, Annual Item; Field 18816
All Industries: PENSION DATA – ACTUAL RETURN ON PLAN ASSETS represents the difference in the fair value of fund assets at the beginning and the end of the period adjusted for contributions made to the fund and benefit payments made by the fund during the year. . It reflects combined plans data where multiple plans exist.
This item is usually only provided by those companies that follow IAS or US GAAP accounting. This item is only available in the annual time series at the company level.
Pension Data – Asset Allocation - % Bonds Supplementary Data, Annual Item; Field 18802
All Industries: PENSION DATA – ASSET ALLOCATION - % BONDS represents the percentage of funds that are distributed in bonds. . It reflects combined plans data where multiple plans exist.
This item is usually only provided by those companies that follow IAS or US GAAP accounting. This item is only available in the annual time series at the company level.
Alphabetical List of Field Definitions - P
Issue 6
© Thomson Financial 2003-2007 406 Confidential Information of Thomson Financial
Pension Data – Asset Allocation - % Equities Supplementary Data, Annual Item; Field 18801
All Industries: PENSION DATA – ASSET ALLOCATION - % EQUITIES represents the percentage of funds that are distributed in equities. . It reflects combined plans data where multiple plans exist.
This item is usually only provided by those companies that follow IAS or US GAAP accounting. This item is only available in the annual time series at the company level.
Pension Data – Asset Allocation - % Other Supplementary Data, Annual Item; Field 18804
All Industries: PENSION DATA – ASSET ALLOCATION - % OTHER represents the percentage of funds that are distributed in other investments. . It reflects combined plans data where multiple plans exist.
This item is usually only provided by those companies that follow IAS or US GAAP accounting. This item is only available in the annual time series at the company level.
Pension Data – Asset Allocation - % Property Supplementary Data, Annual Item; Field 18803
All Industries: PENSION DATA – ASSET ALLOCATION - % Property represents the percentage of funds that are distributed in property. . It reflects combined plans data where multiple plans exist.
This item is usually only provided by those companies that follow IAS or US GAAP accounting. This item is only available in the annual time series at the company level.
Pension Data – Expected Long-Term Return Rate On Pension Assets Supplementary Data, Annual Item; Field 18805
All Industries: PENSION DATA – EXPECTED LONG-TERM RETURN RATE ON PENSION ASSETS represents an estimate of the rate of return to be earned over the period until all benefits under the plan have been paid. . It reflects combined plans data where multiple plans exist.
This item is usually only provided by those companies that follow IAS or US GAAP accounting. This item is only available in the annual time series at the company level.
Pension Data – Expected Return On Plan Assets For The Period Supplementary Data, Annual Item; Field 18817
All Industries: PENSION DATA – EXPECTED RETURN ON PLAN ASSETS FOR THE PERRIOD represents the expected return on the pension plan investments plus the change in the carrying value of the plan assets used in operations. It reflects combined plans data where multiple plans exist.
This item is usually only provided by those companies that follow IAS or US GAAP accounting.

Alphabetical List of Field Definitions - P
Issue 6
© Thomson Financial 2003-2007 407 Confidential Information of Thomson Financial
This item is only available in the annual time series at the company level.
Pension Data – Fair Value Of Plan Assets Supplementary Data, Annual Item; Field 18807
All Industries: PENSION DATA – FAIR VALUE OF PLAN ASSETS represents the value of the investments in the pension plan at a particular point in time. . It reflects combined plans data where multiple plans exist.
This item is usually only provided by those companies that follow IAS or US GAAP accounting. This item is only available in the annual time series at the company level.
Pension Data – Gains (Losses) From Settlements Supplementary Data, Annual Item; Field 18814
All Industries: PENSION DATA – GAINS (LOSSES) FROM SETTLEMENTS represents an irrevocable transaction that relieves the employer (or the plan) of primary responsibility for a defined benefit pension obligation. . It reflects combined plans data where multiple plans exist.
This item is usually only provided by those companies that follow IAS or US GAAP accounting. This item is only available in the annual time series at the company level.
Pension Data - Net Pension Liability/(Asset) - Balance Sheet Supplementary (Pension) Data, Annual Item; Field 18821
All Industries: PENSION DATA - NET PENSION LIABILITY/(ASSET) represents the net amount of pension liability or asset included in the balance sheet. It is Pension-Projected Benefit Obligation (WS 18809) – Pension-Fair Value of Plan Assets (WS 18807) - Pension-Unrecognized Prior Service Cost (WS 18818)+ Pension-Unrecognized Actuarial Gain/Loss (WS 18819) – Pension-Adjustments to Funded Status for Net Pension/Post Retirement Assets/Liabilities (WS 18820).
This item is available in the annual original and annual restated time series for detailed Non-U.S. companies, full update.
Pension Data – Net Periodic Pension (Income)/Expense Supplementary Data, Annual Item; Field 18810
All Industries: PENSION DATA – NET PERIODIC PENSION (INCOME)/EXPENSE represents the amount recognized in an employer’s financial statements as the cost of a pension plan for a period. . It reflects combined plans data where multiple plans exist.
This item is usually only provided by those companies that follow IAS or US GAAP accounting. This item is only available in the annual time series at the company level.
Alphabetical List of Field Definitions - P
Issue 6
© Thomson Financial 2003-2007 408 Confidential Information of Thomson Financial
Pension Data - Other Adjustments to Funded Status for Net Pension/Post Retirement Assets/Liabilities Supplementary (Pension) Data, Annual Item; Field 18820
All Industries: PENSIONDATA - OTHER ADJUSTMENTS TO FUNDED STATUS FOR NET PENSION/POST RETIREMENT ASSETS/LIABILITIES represent any miscellaneous items used in the adjustment to the funded status for net pensions assets/liabilities recognized in the Balance Sheet.
This item is available in the annual original and annual restated time series for detailed companies, full update.
Pension Data – Other Net Periodic Pension (Income)/Expense Supplementary Data, Annual Item; Field 18815
All Industries: PENSION DATA – OTHER NET PERIODIC PENSION (INCOME)/EXPENSE represents a component of Net Periodic Pension Income/Expense. . It reflects combined plans data where multiple plans exist.
This item is usually only provided by those companies that follow IAS or US GAAP accounting. This item is only available in the annual time series at the company level.
Pension Data – Pension Discount Rate Supplementary Data, Annual Item; Field 18806
All Industries: PENSION DATA – PENSION DISCOUNT RATE represents the annual rate at which the projected future liabilities are discounted back to the present date. . It reflects combined plans data where multiple plans exist.
This item is usually only provided by those companies that follow IAS or US GAAP accounting. This item is only available in the annual time series at the company level.
Pension Data – Pension Interest Cost Supplementary Data, Annual Item; Field 18813
All Industries: PENSION DATA – PENSION INTEREST COST represents annual interest costs which reflect the financing costs in a pension plan. Interest expense accrues each year on the projected benefit obligation based on a selected interest rate. . It reflects combined plans data where multiple plans exist.
This item is usually only provided by those companies that follow IAS or US GAAP accounting. This item is only available in the annual time series at the company level.
Pension Data – Pension Service Costs Supplementary Data, Annual Item; Field 18811
All Industries: PENSION DATA – PENSION SERVICE COSTS represents the expense caused by the increase in pension benefits payable (the projected benefit obligation) to employees due to services rendered during the current year. (Present value of new benefits earned by employees during the year). For example, when an employee is covered by a defined-benefit pension plan the annual Service Cost is the increase in the present value of the future pension obligations due to an added year of service and salary. . It reflects combined plans data where multiple plans exist.
This item is usually only provided by those companies that follow IAS or US GAAP accounting. This item is only available in the annual time series at the company level.

Alphabetical List of Field Definitions - P
Issue 6
© Thomson Financial 2003-2007 409 Confidential Information of Thomson Financial
Pension Data – Prior Service Costs Supplementary Data, Annual Item; Field 18812
All Industries: PENSION DATA – PRIOR SERVICE COSTS represents costs related to employee service in years preceding the adoption or amendment of a pension plan, these are referred to as prior service costs. These costs may reflect value (as under UK GAAP FRS17) or amortized over future expected service periods of the employees (as under US GAAP SFAS87). . It reflects combined plans data where multiple plans exist.
This item is usually only provided by those companies that follow IAS or US GAAP accounting. This item is only available in the annual time series at the company level.
Pension Data – Projected Benefit Obligation (PBO) Supplementary Data, Annual Item; Field 18809
All Industries: PENSION DATA – PROJECTED BENEFIT OBLIGATION represents a measure of a pension plan’s liability at the calculation date assuming that the plan is ongoing and will not terminate in the foreseeable future. . It reflects combined plans data where multiple plans exist.
This item is usually only provided by those companies that follow IAS or US GAAP accounting. This item is only available in the annual time series at the company level.
Pension Data – Unrecognized Net Actuarial Gain/Loss Supplementary (Pension) Data, Annual Item; Field 18819
All Industries: PENSIONDATA - UNRECOGNIZED ACTUARIAL GAIN/LOSS represents a measure of the difference between the actual experience and that expected based upon the actuarial assumptions that have not yet been recognized as a component of net periodic benefit cost.
This item is available in the annual original and annual restated time series for detailed companies, full update.
Pension Data – Unrecognized Prior Service Cost Supplementary Data, Annual Item; Field 18818
All Industries: PENSION DATA – UNRECOGNIZED PRIOR SERVICE COST represents costs when a pension plan is initially adopted or amended to provide increased benefits, employees are granted additional benefits for services performed in years prior to the plan’s adoption or amendment. . It reflects combined plans data where multiple plans exist.
This item is usually only provided by those companies that follow IAS or US GAAP accounting. This item is only available in the annual time series at the company level.
Period Close Price Stock Data; Annual Item; Field 05085
All Industries: PERIOD CLOSE PRICE represents the closing price of a security at the end of a specific fiscal interim time period.
This item is not available prior to 1988 and is shown per 1,000 shares for Brazilian companies. This item is also populated for the interim time series where it is not available prior to 1998 and is shown per 1,000 shares for Brazilian companies. It is also available at the security level for 1998 and subsequent years.

Alphabetical List of Field Definitions - P
Issue 6
© Thomson Financial 2003-2007 410 Confidential Information of Thomson Financial
Phone Number Descriptive Data, Current Item; Field 06031
All Industries: PHONE NUMBER represents the telephone number of the company.
Policy & Contract Claims Liability Data, Annual Item; Field 03020
Insurance Companies: POLICY & CONTRACT CLAIMS represent the present value of claims to be paid on behalf of or to policyholders.
Footnotes: A. Includes unearned premium reserves B. Includes policyholder funds left with company
Policy Loans Supplementary (Asset) Data, Annual Item; Field 02245
Insurance Companies: POLICY LOANS represent advances made to policyholders against their life insurance policies. Such loans are secured by the cash surrender value of these policies.
Footnotes: A. Includes other loans
Policyholders' Equity Shareholders' Equity Data, Annual Item; Field 03440
Insurance Companies: POLICYHOLDERS' EQUITY represents the net worth of the insurance company belonging to policyholders.
Policyholders' Surplus Income Data, Annual Item; Field 01640
Insurance Companies: POLICYHOLDERS' SURPLUS represents all surplus attributable to policyholders. It is the excess earnings after netting out expenses and required reserve charges.
Post Office Box Descriptive Data, Current Item; Field 06094
All Industries: POST OFFICE BOX represents the mailbox used by the company to receive mail.
Preferred Dividend Requirements Expense Data, Annual Item; Field 01701
All Industries: PREFERRED DIVIDEND REQUIREMENTS represent actual cash dividend payment on preferred stock or the provision for preferred dividends, if in arrears. It also includes accretion on preferred stock.
If the company has ESOP preferred stock, the dividend will be shown net of the tax benefit.
Alphabetical List of Field Definitions - P
Issue 6
© Thomson Financial 2003-2007 411 Confidential Information of Thomson Financial
Footnotes: D. Net of ESOP tax benefit
Preferred Dividends (Cash) Stock Data, Annual Item; Field 05401
All Industries: PREFERRED DIVIDENDS (CASH) represent the total cash preferred dividends paid on the company's preferred stock during the year.
Preferred Stock Shareholders' Equity Data, Annual Item; Field 03451
All Industries: PREFERRED STOCK represents a claim prior to the common shareholders on the earnings of a company and on the assets in the event of liquidation. For U.S. corporations, its value is shown at the total involuntary liquidation value of the number of preferred shares outstanding at year end. If preferred stock is redeemable at anytime by the shareholder it is shown at redemption value, or if the company carries it at a higher value than the involuntary liquidation value, the stated value. Preferred stock of subsidiary and premium on preferred stock is included in preferred stock. It excludes minority interest in preferred stock. For Non-U.S. Corporations, the stated value of preferred stock is shown and it includes all preferred stock related accounts. For Non-U.S. Corporations preference stock which participates with the common/ordinary shares in the profits of the company is included in common equity. It includes but is not restricted to:
Redeemable preferred stock (field 18290) Non-redeemable preferred stock (field 18289)
Footnotes: A. Included in long term debt B. Profit-participating preferred stock included in common equity C. Net of ESOP guarantee D. No standard text
Preferred Stock – GAAP Supplementary (Liability) Data, Annual Item; Field 06783
All Industries: PREFERRED STOCK – GAAP represents the preferred stock of a non-U.S. company adjusted to conform to U.S. Generally Accepted Accounting Principles. See definition for PREFERRED STOCK for additional information.
This item is presented in U.S. dollars (converted at the company's fiscal year end exchange rate). It is only available for ADRs trading on the NYSE, ASE or NASDAQ and is generally not available prior to 1994.
Preferred Stock Issued For ESOP Liability Data, Annual Item; Field 03448
All Industries: PREFERRED STOCK ISSUED FOR ESOP represents the total number of preferred shares issued to the employee stock option plan. This field would include all the shares that are fully paid for as well as those

Alphabetical List of Field Definitions - P
Issue 6
© Thomson Financial 2003-2007 412 Confidential Information of Thomson Financial
covered by a pledge made by the company to insure a loan incurred by the employee stock option plan (ESOP) for the purchase of preferred shares.
Data for this field is generally not available prior to 1990.
Preferred Stock Treated as Common Supplementary (Liability) Data, Annual Item; Field 03450
All Industries: PREFERRED STOCK TREATED AS COMMON represents preferred stock and preference shares with the right to a fixed dividend, payable in priority to the dividend on common/ordinary shares, but with additional rights to participate in the remaining profits of the company together with the common/ordinary shares.
It is generally available for 1990 and subsequent years.
It includes but is not restricted to: Azioni di Risparmo and Azioni Priviligiate in Italy Actions a Droits Priorities (ADP) in France and Belgium Actions de Preference in France Vorzugsaktie in Germany and Austria
Preferred Stock % Total Capital Leverage Ratio, Annual Item; Field 08206
All Industries: Preferred Stock / Total Capital * 100
Preferred Stock % Total Capital - 5 Yr Avg Leverage Ratio, Annual Item; Field 08210
All Industries: Arithmetic average of the last five years of Preferred Stock % Total Capital
Premium Balance Receivables Asset Data, Annual Item; Field 02260
Insurance Companies: PREMIUM BALANCE RECEIVABLES represent unpaid premiums due from policyholders.
Footnotes: A. Gross figure (not netted by allowances) B. Includes other receivables
Premium Income – GAAP Supplementary (Income) Data, Annual Item; Field 06802 Insurance Company:
PREMIUM INCOME – GAAP represents the portion of total premiums written needed to cover all expenses and benefits.
This item is presented in U.S. dollars (converted at the company's fiscal year twelve month average exchange rate). It is only available for ADRs trading on the NYSE, ASE or NASDAQ and is generally not available prior to 1994.

Alphabetical List of Field Definitions - P
Issue 6
© Thomson Financial 2003-2007 413 Confidential Information of Thomson Financial
Premiums Earned Income Data, Annual Item; Field 01002
Insurance Companies: PREMIUMS EARNED represents the portion of total premiums written needed to cover all expenses and benefits. It includes but is not restricted to:
Total premiums written (field 01004) Reinsurance & adjustment reserves (field 01005)
Footnotes: A. Gross premiums
Prepaid Expenses Asset Data, Annual Item; Field 02140
All Industries: PREPAID EXPENSES represent payments made in advance for services to be received within the normal operating cycle of the company.
Data for this field is generally not available prior to 1989. It includes but is not restricted to:
Prepaid insurance expenses Prepaid property taxes Prepaid rent Prepaid income taxes Prepaid supplies Prepaid employee benefits Advance Corporation Tax recoverable within 1 year (United Kingdom)
Pre-tax Equity In Earnings Income Data, Annual Item; Field 01267
All Industries: PRE-TAX EQUITY IN EARNINGS represents the pre-tax portion of the earnings or losses of a subsidiary whose financial accounts are not consolidated with the controlling company's accounts. This field is available only when a company reports their equity in earnings pre-tax and the net of tax amount is not reported or cannot be calculated.
Data for this field is generally not available prior to 1991. It includes but is not restricted to:
Profit sharing agreements (Germany)
Pre-tax Income Income Data, Annual Item; Field 01401
All Industries: PRE-TAX INCOME represents all income/loss before any federal, state or local taxes. Extraordinary items reported net of taxes are excluded. For U.S. corporations, equity in earnings of unconsolidated subsidiaries and minority interest are not included, unless the company specifically states that they are pre-tax. For non-U.S. corporations, this item is usually reported before taxes.
Footnotes: A. Net of income taxes
Alphabetical List of Field Definitions - P
Issue 6
© Thomson Financial 2003-2007 414 Confidential Information of Thomson Financial
Pre-tax Income – GAAP Supplementary (Income) Data, Annual Item; Field 06860
All Industries: PRE-TAX INCOME – GAAP represents income before taxes of a non-U.S. company adjusted to conform to U.S. Generally Accepted Accounting Principles. See definition for PRE-TAX INCOME for additional information.
This item is presented in U.S. dollars (converted at the company's fiscal year twelve month average exchange rate). It is only available for ADRs trading on the NYSE, ASE or NASDAQ and is generally not available prior to 1994.
Pre-tax Margin Profitability Ratio, Annual Item; Field 08321
All Industries: Pre-tax Income / Net Sales or Revenues * 100
Pre-tax Margin - 5 Yr Avg Profitability Ratio, Annual Item; Field 08325
All Industries: Arithmetic average of the last five years of Pre-tax Margin
Price See MARKET PRICE
Price Trend - Four Week Stock Performance Ratio, Current Item; Field 09005
All Industries: (Current Price / Closing Price four weeks ago - 1) * 100
This item is also available at the security level.
Price Trend - Last Week Stock Performance Ratio, Current Item; Field 09001
All Industries: (Current Price / Last Week’s Closing Price - 1) * 100
This item is also available at the security level.
Price Trend - Previous Quarter Stock Performance Ratio, Current Item; Field 09016
All Industries: (Most Recent Quarter End Price / Previous Quarter End Price - 1) * 100
This item is also available at the security level.

Alphabetical List of Field Definitions - P
Issue 6
© Thomson Financial 2003-2007 415 Confidential Information of Thomson Financial
Price Trend - Quarter To Date Stock Performance Ratio; Current Item; Field 09011
All Industries: (Current Price / Most Recent Quarter End Price - 1) * 100
This item is also available at the security level.
Price Trend - Year To Date Stock Performance Ratio, Current Item; Field 09021
All Industries: (Current Price / Most Recent Year End Price - 1) * 100
This item is also available at the security level.
Price Trend - 13 Weeks Stock Performance Ratio, Current Item; Field 09006
All Industries: (Current Price / Closing Price thirteen weeks ago - 1) * 100
This item is also available at the security level.
Price Trend – 26 Weeks Stock Performance Ratio, Current Item; Field 09007
All Industries: (Current Price / Closing Price twenty six weeks ago – 1) * 100
This item is also available at the security level.
Price Trend - 52 Weeks Stock Performance Ratio, Current Item; Field 09026
All Industries: (Current Price / Closing Price fifty-two weeks ago - 1) * 100
This item is also available at the security level.
Price Volatility Stock Performance Ratio, Annual Item; Field 08806
All Industries: A measure of a stock's average annual price movement to a high and low from a mean price for each year. For example, a stock's price volatility of 20% indicates that the stock's annual high and low price has shown a historical variation of +20% to -20% from its annual average price.
This item is also available at the security level for 1987 and subsequent years.
Price/Book Value Ratio - Avg High-Low Stock Performance Ratio, Annual Item; Field 09306
All Industries: (Market Price-High + Market Price-Low / 2) / Book Value Per Share
This item is also available at the security level for 1987 and subsequent years.

Alphabetical List of Field Definitions - P
Issue 6
© Thomson Financial 2003-2007 416 Confidential Information of Thomson Financial
Price/Book Value Ratio - Close Stock Performance Ratio, Annual Item; Field 09304
All Industries: Market Price-Year End / Book Value Per Share
This item is also available at the security level for 1987 and subsequent years.
Price/Book Value Ratio - Close - Mult Share 1, 2, 3, 4, 5, 6, 7 Stock Performance Ratio, Annual Items; Fields 20047, 20147, 20247, 20347, 20447, 20547, 20647, respectively
All Industries: Market Price-Year End / Book Value Per Share; for each type of common/ordinary share
Data for these fields is generally not available prior to 1987.
Price/Book Value Ratio - Current Stock Performance Ratio, Current Item; Field 09302
All Industries: Market Price-Current / Book Value Per Share-Current
This item is also available at the security level.
Price/Book Value Ratio - Current - Mult Share 1, 2, 3, 4, 5, 6, 7 Stock Performance Ratio, Current Items; Fields 20027, 20127, 20227, 20327, 20427, 20527, 20627, respectively
All Industries: Market Price-Current / Book Value Per Share-Current; for each type of common/ordinary share
Price/Book Value Ratio – GAAP – Avg High-Low Stock Performance Ratio, Annual Item; Field 09346
All Industries: ((Market Price-High + Market Price-Low) / 2) / Book Value Per ADR-GAAP
This item is only available for ADRs trading on the NYSE, ASE, NASDAQ and is generally not available prior to 1994.
Price/Book Value Ratio – GAAP – Close Stock Performance Ratio, Annual Item; Field 09344
All Industries: Market Price-Year End / Book Value Per ADR-GAAP
This item is only available for ADRs trading on the NYSE, ASE, NASDAQ and is generally not available prior to 1994.
Price/Book Value Ratio – GAAP – Current Stock Performance Ratio, Current Item; Field 09342
All Industries: Market Price-Current / Book Value Per ADR-GAAP-Current
This item is only available for ADRs trading on the NYSE, ASE, NASDAQ.

Alphabetical List of Field Definitions - P
Issue 6
© Thomson Financial 2003-2007 417 Confidential Information of Thomson Financial
Price/Book Value Ratio – GAAP – Current High Stock Performance Ratio, Current Item; Field 09343
All Industries: Market Price-Yr to Date-High / Book Value Per ADR-GAAP-Current
This item is only available for ADRs trading on the NYSE, ASE, NASDAQ.
Price/Book Value Ratio – GAAP – Current Low Stock Performance Ratio, Current Item; Field 09345
All Industries: Market Price-Yr to Date-Low / Book Value Per ADR-GAAP-Current
This item is only available for ADRs trading on the NYSE, ASE, NASDAQ.
Price/Book Value Ratio – GAAP – High Stock Performance Ratio, Annual Item; Field 09340
All Industries: Market Price-High / Book Value Per ADR-GAAP
This item is only available for ADRs trading on the NYSE, ASE, NASDAQ and is generally not available prior to 1994.
Price/Book Value Ratio – GAAP – Low Stock Performance Ratio, Annual Item; Field 09341
All Industries: Market Price-Low / Book Value Per ADR-GAAP
This item is only available for ADRs trading on the NYSE, ASE, NASDAQ and is generally not available prior to 1994.
Price/Book Value Ratio - GAAP – Avg High-Low – 3 Yr Avg Stock Performance Ratio, Annual Item; Field 09350
All Industries: ((Sum of the last three years Market Price-Year High + Sum of the last three years Market Price-Year Low) / 2) / Sum of the last three years Book Value Per ADR-GAAP
This item is only available for ADRs trading on the NYSE, ASE, NASDAQ and is generally not available prior to 1996.
Price/Book Value Ratio - GAAP – Close – 3 Yr Avg Stock Performance Ratio, Annual Item; Field 09349
All Industries: Sum of the last three years Market Price-Year End / Sum of the last three years Book Value Per ADR-GAAP
This item is only available for ADRs trading on the NYSE, ASE, NASDAQ and is generally not available prior to 1996.

Alphabetical List of Field Definitions - P
Issue 6
© Thomson Financial 2003-2007 418 Confidential Information of Thomson Financial
Price/Book Value Ratio - GAAP – High – 3 Yr Avg Stock Performance Ratio, Annual Item; Field 09347
All Industries: Sum of the last three years Market Price-High / Sum of the last three years Book Value Per ADR-GAAP
This item is only available for ADRs trading on the NYSE, ASE, NASDAQ and is generally not available prior to 1996.
Price/Book Value Ratio - GAAP – Low – 3 Yr Avg Stock Performance Ratio, Annual Item; Field 09348
All Industries: Sum of the last three years Market Price-Low / Sum of the last three years Book Value Per ADR-GAAP
This item is only available for ADRs trading on the NYSE, ASE, NASDAQ and is generally not available prior to 1996.
Price/Book Value Ratio - GAAP – Avg High-Low – 5 Yr Avg Stock Performance Ratio, Annual Item; Field 09354
All Industries: ((Market Price- Five Yr Avg High + Market Price-Five Yr Avg Low) / 2) / (Sum of the last five years Book Value Per ADR–GAAP / 5)
This item is only available for ADRs trading on the NYSE, ASE, NASDAQ and will not be available until 1998.
Price/Book Value Ratio - GAAP – Close – 5 Yr Avg Stock Performance Ratio, Annual Item; Field 09353
All Industries: Market Price-Year End-Five Yr Avg Close / (Sum of the last five years Book Value Per ADR–GAAP / 5)
This item is only available for ADRs trading on the NYSE, ASE, NASDAQ and will not be available until 1998.
Price/Book Value Ratio - GAAP – High – 5 Yr Avg Stock Performance Ratio, Annual Item; Field 09351
All Industries: Market Price-Five Yr Avg High / (Sum of the last five years Book Value-GAAP / 5)
This item is only available for ADRs trading on the NYSE, ASE, NASDAQ and will not be available until 1998.
Price/Book Value Ratio - GAAP – Low – 5 Yr Avg Stock Performance Ratio, Annual Item; Field 09352
All Industries: Market Price-Five Yr Avg Low / (Sum of the last three years Book Value-GAAP / 5)
This item is only available for ADRs trading on the NYSE, ASE, NASDAQ and will not be available until 1998.
Price/Book Value Ratio - High Stock Performance Ratio, Annual Item; Field 09300
All Industries: Market Price-High / Book Value Per Share-Annual
This item is also available at the security level for 1987 and subsequent years.

Alphabetical List of Field Definitions - P
Issue 6
© Thomson Financial 2003-2007 419 Confidential Information of Thomson Financial
Price/Book Value Ratio - Low Stock Performance Ratio, Annual Item; Field 09301
All Industries: Market Price-Low / Book Value Per Share
This item is also available at the security level for 1987 and subsequent years.
Price/Book Value Ratio – 3 Yr Avg – Avg High-Low Stock Performance Ratio, Annual Item; Field 09333
All Industries: ((Sum of the last three years Market Price-High + Sum of the last three years Market Price-Low) / 2) / Sum of the last three years Book Value
This item is only available for ADRs and is generally not available prior to 1994.
Price/Book Value Ratio – 3 Yr Avg – Close Stock Performance Ratio, Annual Item; Field 09332
All Industries: Sum of the last three years Market Price-Year End / Sum of the last three years Book Value
This item is only available for ADRs and is generally not available prior to 1994.
Price/Book Value Ratio – 3 Yr Avg – High Stock Performance Ratio, Annual Item; Field 09330
All Industries: Sum of the last three years Market Price-Year High / Sum of the last three years Book Value
This item is only available for ADRs and is generally not available prior to 1994.
Price/Book Value Ratio – 3 Yr Avg – Low Stock Performance Ratio, Annual Item; Field 09331
All Industries: Sum of the last three years Market Price-Year Low / Sum of the last three years Book Value
This item is only available for ADRs and is generally not available prior to 1994.
Price/Book Value Ratio - 5 Yr Avg - Close Stock Performance Ratio, Annual Item; Field 09321
All Industries: Market Price-5 Year Average / Arithmetic Average of the last five years of Book Value Per Share
This item is also available at the security level for 1987 and subsequent years.
Price/Book Value Ratio - 5 Yr Avg - High Stock Performance Ratio, Annual Item; Field 09311
All Industries: Market Price-5 Year Average High / Arithmetic Average of the last five years of Book Value Per Share
This item is also available at the security level for 1987 and subsequent years.
Alphabetical List of Field Definitions - P
Issue 6
© Thomson Financial 2003-2007 420 Confidential Information of Thomson Financial
Price/Book Value Ratio - 5 Yr Avg - High-Low Stock Performance Ratio, Annual Item; Field 09326
All Industries: Market Price-5 Year Average High-Low / Arithmetic Average of the last five years of Book Value Per Share
This item is also available at the security level for 1987 and subsequent years.
Price/Book Value Ratio - 5 Yr Avg - Low Stock Performance Ratio, Annual Item; Field 09316
All Industries: Market Price-5 Year Average Low / Arithmetic Average of the last five years of Book Value Per Share
This item is also available at the security level for 1987 and subsequent years.
Price/Cash Flow Ratio Stock Performance Ratio, Annual/Interim Item; Field 09604
All Industries: Annual Time Series: Market Price-Year End / Cash Flow Per Share
This item is also available at the security level for 1987 and subsequent years. Interim Time Series:
Market Price-Period End / Trailing 12 Months Cash Flow per Share This item is available in the Interim time series at the company and security level for 1998 and subsequent years.
Price/Cash Flow - Current Stock Performance Ratio, Current Item; Field 09602
All Industries: Market Price-Current/Cash Flow Per Share-Current
This item is also available at the security level.
Price/Cash Flow Ratio – 3 Yr Avg Stock Performance Ratio, Annual Item; Field 09623
All Industries: Sum of the last 3 years of Market Price-Year End / Sum of the last three years of Cash Flow Per Share
This item is only available for ADRs and is generally not available prior to 1994.
Price/Cash Flow Ratio - 5 Yr Avg Stock Performance Ratio, Annual Item; Field 09621
All Industries: Arithmetic average of the last five years of Market Price-Year End / Arithmetic average of the last five years of Cash Flow Per Share
This item is also available at the security level for 1987 and subsequent years.

Alphabetical List of Field Definitions - P
Issue 6
© Thomson Financial 2003-2007 421 Confidential Information of Thomson Financial
Price/Earnings Ratio - Avg High-Low Stock Performance Ratio, Annual Item; Field 09106
All Industries: (Market Price-High + Market Price-Low / 2) / Earnings Per Share
This item is also available at the security level for 1987 and subsequent years.
Price/Earnings Ratio - Close Stock Performance Ratio, Annual/Interim Item; Field 09104
All Industries: Annual Time Series: Market Price-Year End / Earnings Per Share
This item is also available at the security level for 1987 and subsequent years. Interim Time Series: Market Price-Period End / Trailing 12 Month Earnings per Share
This item is available in the Interim time series at the company and security level for 1998 and subsequent years.
Price/Earnings Ratio - Close - Mult Share 1, 2, 3, 4, 5, 6, 7 Stock Performance Ratio, Annual Items; Fields 20046, 20146, 20246, 20346, 20446, 20546, 20646, respectively
All Industries: Market Price-Year End / Earnings Per Share; for each type of common/ordinary share
Data for these fields are generally not available prior to 1987.
Price/Earnings Ratio - Current Stock Performance Ratio, Current Item; Field 09102
All Industries: Market Price-Current / Earnings Per Share-Last 12 Months
This item is also available at the security level.
Price/Earnings Ratio - Current - Mult Share 1, 2, 3, 4, 5, 6, 7 Stock Performance Ratio, Current Items; Fields 20026, 20126, 20226, 20326, 20426, 20526, 20626, respectively
All Industries: Market Price-Current / Earnings Per Share-Last 12 Months; for each type of common/ordinary share
Price/Earnings Ratio - Current High Stock Performance Ratio, Current Item; Field 09103
All Industries: Market Price-Year to Date High / Earnings Per Share-Last 12 Months
This item is also available at the security level.

Alphabetical List of Field Definitions - P
Issue 6
© Thomson Financial 2003-2007 422 Confidential Information of Thomson Financial
Price/Earnings Ratio - Current Low Stock Performance Ratio, Current Item; Field 09105
All Industries: Market Price-Year to Date Low / Earnings Per Share-Last 12 Months
This item is also available at the security level.
Price/Earnings Ratio – GAAP – Avg High-Low Stock Performance Ratio, Annual Item; Field 09146
All Industries: ((Market Price-High + Market Price-Low) / 2) / Earnings Per ADR-GAAP
This item is only available for ADRs trading on the NYSE, ASE and NASDAQ and is generally not available prior to 1994.
Price/Earnings Ratio – GAAP – Close Stock Performance Ratio, Annual Item; Field 09144
All Industries: Market Price-Year End / Earnings Per ADR-GAAP
This item is only available for ADRs trading on the NYSE, ASE and NASDAQ and is generally not available prior to 1994.
Price/Earnings Ratio – GAAP – Current Stock Performance Ratio, Current Item; Field 09142
All Industries: Market Price-Current / Earnings Per ADR-GAAP-Last 12 Months
This item is only available for ADRs trading on the NYSE, ASE and NASDAQ.
Price/Earnings Ratio – GAAP – Current High Stock Performance Ratio, Current Item; Field 09143
All Industries: Market Price-Yr to Date-High / Earnings Per ADR-GAAP-Last 12 Months
This item is only available for ADRs trading on the NYSE, ASE and NASDAQ
Price/Earnings Ratio – GAAP – Current Low Stock Performance Ratio, Current Item; Field 09145
All Industries: Market Price-Yr to Date-Low / Earnings Per ADR-GAAP-Last 12 Months
This item is only available for ADRs trading on the NYSE, ASE and NASDAQ.
Price/Earnings Ratio – GAAP – High Stock Performance Ratio, Annual Item; Field 09140
All Industries: Market Price-High / Earnings Per ADR-GAAP
This item is only available for ADRs trading on the NYSE, ASE and NASDAQ and is generally not available prior to 1994.

Alphabetical List of Field Definitions - P
Issue 6
© Thomson Financial 2003-2007 423 Confidential Information of Thomson Financial
Price/Earnings Ratio – GAAP – Low Stock Performance Ratio, Annual Item; Field 09141
All Industries: Market Price-Low / Earnings Per ADR-GAAP
This item is only available for ADRs trading on the NYSE, ASE and NASDAQ and is generally not available prior to 1994.
Price/Earnings Ratio – GAAP - 3 Yr Avg – Avg High-Low Stock Performance Ratio, Annual Item; Field 09150
All Industries: 1/ (Sum of the last 3 years Earnings Per ADR-GAAP / ((Sum of the last 3 years Market Price–High + Sum of the last 3 years of Market Price-Low) / 2)
This item is only available for ADRs trading on the NYSE, ASE, NASDAQ and is generally not available prior to 1996.
Price/Earnings Ratio - GAAP – 3 Yr Avg – Close Stock Performance Ratio, Annual Item; Field 09149
All Industries: 1/ (Sum of the last 3 years Earnings Per ADR-GAAP / Sum of the last 3 years Market Price–Year End)
This item is only available for ADRs trading on the NYSE, ASE, NASDAQ and is generally not available prior to 1996.
Price/Earnings Ratio – GAAP - 3 Yr Avg – High Stock Performance Ratio, Annual Item; Field 09147
All Industries: 1/ (Sum of the last 3 years Earnings Per ADR-GAAP / Sum of the last 3 years Market Price–High)
This item is only available for ADRs trading on the NYSE, ASE, NASDAQ and is generally not available prior to 1996.
Price/Earnings Ratio – GAAP - 3 Yr Avg – Low Stock Performance Ratio, Annual Item; Field 09148
All Industries: 1/ (Sum of the last 3 years Earnings Per ADR-GAAP / Sum of the last 3 years Market Price–Low)
This item is only available for ADRs and is generally not available prior to 1996.
Price/Earnings Ratio - GAAP – 5 Yr Avg – Avg High-Low Stock Performance Ratio, Annual Item; Field 09154
All Industries: 1/ (Earnings Per Share-GAAP–5 Yr Avg / Market Price–Year End-5 Yr Avg High-Low)
This item is only available for ADRs trading on the NYSE, ASE, NASDAQ and will not be available until 1998.

Alphabetical List of Field Definitions - P
Issue 6
© Thomson Financial 2003-2007 424 Confidential Information of Thomson Financial
Price/Earnings Ratio - GAAP – 5 Yr Avg – Close Stock Performance Ratio, Annual Item; Field 09153
All Industries: 1/ (Earnings Per Share-GAAP–5 Yr Avg / Market Price–Year End-5 Yr Avg)
This item is only available for ADRs trading on the NYSE, ASE, NASDAQ and is generally not available prior to 1996.
Price/Earnings Ratio – GAAP - 5 Yr Avg – High Stock Performance Ratio, Annual Item; Field 09151
All Industries: 1/ (Earnings Per Share-GAAP–5 Yr Avg / Market Price–Year End-5 Yr Avg High)
This item is only available for ADRs trading on the NYSE, ASE, NASDAQ and will not be available until 1998.
Price/Earnings Ratio - GAAP – 5 Yr Avg – Low Stock Performance Ratio, Annual Item; Field 09152
All Industries: 1/ (Earnings Per Share-GAAP–5 Yr Avg / Market Price–Year End-5 Yr Avg Low)
This item is only available for ADRs trading on the NYSE, ASE, NASDAQ and will not be available until 1998.
Price/Earnings Ratio - High Stock Performance Ratio, Annual Item; Field 09100
All Industries: Market Price-High / Earnings Per Share
This item is also available at the security level for 1987 and subsequent years.
Price/Earnings Ratio - Low Stock Performance Ratio, Annual Item; Field 09101
All Industries: Market Price-Low / Earnings Per Share
This item is also available at the security level for 1987 and subsequent years.
Price/Earnings Ratio – 3 Yr Avg – Avg High-Low Stock Performance Ratio, Annual Item; Field 09133
All Industries: 1/ (Sum of the last 3 years Earnings Per Share / ((Sum of the last 3 years of Market Price–High + Sum of the last 3 years of Market Price-Low) / 2)
This item is only available for ADRs and is generally not available prior to 1994.
Price/Earnings Ratio – 3 Yr Avg – Close Stock Performance Ratio, Annual Item; Field 09132
All Industries: 1/ (Sum of the last 3 years of Earnings Per Share / Sum of the last 3 years of Market Price–Year End)
This item is only available for ADRs and is generally not available prior to 1994.

Alphabetical List of Field Definitions - P
Issue 6
© Thomson Financial 2003-2007 425 Confidential Information of Thomson Financial
Price/Earnings Ratio – 3 Yr Avg – High Stock Performance Ratio, Annual Item; Field 09130
All Industries: 1/ (Sum of the last 3 years of Earnings Per Share / Sum of the last 3 years of Market Price–High)
This item is only available for ADRs and is generally not available prior to 1994.
Price/Earnings Ratio – 3 Yr Avg – Low Stock Performance Ratio, Annual Item; Field 09131
All Industries: 1/ (Sum of the last 3 years of Earnings Per Share / Sum of the last 3 years Market Price– Low)
This item is only available for ADRs and is generally not available prior to 1994.
Price/Earnings Ratio - 5 Yr Avg - Close Stock Performance Ratio, Annual Item; Field 09121
All Industries: 1 / (Earnings Per Share-5 Year Average / Market Price-Year End-5 Year Average)
This item is also available at the security level for 1987 and subsequent years.
Price/Earnings Ratio - 5 Yr Avg - High Stock Performance Ratio, Annual Item; Field 09111
All Industries: 1 / (Earnings Per Share-5 Year Average / Market Price-5 Year Average High)
This item is also available at the security level for 1987 and subsequent years.
Price/Earnings Ratio - 5 Yr Avg - High-Low Stock Performance Ratio, Annual Item; Field 09126
All Industries: 1 / (Earnings Per Share-5 Year Average / (Market Price-5 Year Average-High + Market Price-5 Year Average-Low / 2)
This item is also available at the security level for 1987 and subsequent years.
Price/Earnings Ratio - 5 Yr Avg - Low Stock Performance Ratio, Annual Item; Field 09116
All Industries: 1 / (Earnings Per Share-5 Year Average / Market Price-5 Year Average Low)
This item is also available at the security level for 1987 and subsequent years.
Price/Sales Per Share Ratio Stock Performance Ratio, Annual Item; Field 09904
All Industries: Market Price–Year End / Sales Per Share
Alphabetical List of Field Definitions - P
Issue 6
© Thomson Financial 2003-2007 426 Confidential Information of Thomson Financial
Primary Issue Identifier Descriptive Data, Current Item; Field 06036
All Industries: PRIMARY ISSUE IDENTIFIER is provided at the security level for companies with more than one type of common/ordinary share. It is the Worldscope company identifier for the security identified in Field 6005 - Type of Share. It provides a link between the security information and the fundamental data of the company.
Proceeds From Stock Options Cash Flow Data, Annual Item; Field 04301
All Industries: PROCEEDS FROM STOCK OPTIONS represent the amount a company receives from employee stock options, benefit plans, performance share awards, warrants and employee stock purchases. When no breakdown is available this item is included in net proceeds from sale of stock.
Product Segment Data Product Data, Annual Items; Fields 19500-19596
All Industries: The following information is given for up to ten product segments of a company. If a company has only one product line data is updated to the product segment 1 fields. If a company has more than ten product segments the remaining segments are included with the Product Segment 10 data.
PRODUCT SEGMENT 1-10 - DESCRIPTION - Fields 19500, 19510, 19520, 19530, 19540, 19550, 19560, 19570, 19580, 19590, respectively
DESCRIPTION represents the product line as reported by the company. A description of the product is added if necessary.
PRODUCT SEGMENT 1-10 - SALES - Fields 19501, 19511, 19521, 19531, 19541, 19551, 19561, 19571, 19581, 19591, respectively
SALES represents the total revenues from the product line updated in the respective description. Footnotes:
A. Includes other income B. Includes excise taxes, windfall profit taxes and/or other income C. No standard text D. No standard text G. Reflects market segment breakdown H. Includes share of associate companies J. Includes discontinued operations K. Based on premiums only
PRODUCT SEGMENT 1-10 - OPERATING INCOME -Fields 19502, 19512, 19522, 19532, 19542, 19552, 19562, 19572, 19582, 19592, respectively
OPERATING INCOME represents the operating income generated from the product line updated in the respective description.
Footnotes: A. Reflects pre-tax income C. No standard text D. No standard text H. Includes share of associate companies J. Includes discontinued operations K. As reported N. Net income before interest and taxes

Alphabetical List of Field Definitions - P
Issue 6
© Thomson Financial 2003-2007 427 Confidential Information of Thomson Financial
PRODUCT SEGMENT 1-10 - ASSETS - Fields 19503, 19513, 19523, 19533, 19543, 19553, 19563, 19573, 19583, 19593, respectively
ASSETS represents the total assets from the product line updated in the respective description. Footnotes:
A. Reflects net operating assets C. No standard text D. No standard text F. Net Assets H. Includes share of associate companies J. Includes discontinued operations L. Reflects capital employed
PRODUCT SEGMENT 1-10 - CAPITAL EXPENDITURES - Fields 19504, 19514, 19524, 19534, 19544, 19554, 19564, 19574, 19584, 19594, respectively
CAPITAL EXPENDITURES represents the capital expenditures resulting from the product line updated in the respective description.
Footnotes: C. No standard text D. No standard text H. Includes share of associate companies J. Includes discontinued operations
PRODUCT SEGMENT 1-10 - DEPRECIATION - Fields 19505, 19515, 19525, 19535, 19545, 19555, 19565, 19575, 19585, 19595, respectively
DEPRECIATION represents the depreciation expense resulting from the product line updated in the respective description.
Footnotes: C. No standard text D. No standard text H. Includes share of associate companies J. Includes discontinued operations
PRODUCT SEGMENT 1-10 - SIC CODE - Fields 19506, 19516, 19526, 19536, 19546, 19556, 19566, 19576, 19586, 19596, respectively
SIC CODES represents the Standard Industry Classification of the product line updated in the respective description.
Data for these fields are generally not available prior to 1990.
Products Descriptive Data, Current Item; Field 07001
All Industries: PRODUCTS represent the type of products or services the company provides. Choices include: Industrial Materials (includes supplies) Industrial Equipment Industrial Construction Industrial Services (including commercial services) Industrial Packaging Consumer Expendables Consumer Durables Consumer Construction Consumer Services

Alphabetical List of Field Definitions - P
Issue 6
© Thomson Financial 2003-2007 428 Confidential Information of Thomson Financial
Consumer Distribution Financial Services
Profit/Loss See NET INCOME
Progress Payments and Other Asset Data, Annual Item; Field 02100
All Industries: PROGRESS PAYMENTS AND OTHER represents other inventories effecting Total Inventories but not included in Finished goods, Work in Process or Raw Materials.
Data is generally not available prior to 1989. It includes but is not restricted to:
Excess of FIFO cost over LIFO inventory value
Property, Plant And Equipment - Gross Asset Data, Annual Item; Field 02301
Industrials, Other Financial Companies: PROPERTY, PLANT AND EQUIPMENT (GROSS) represents tangible assets with an expected useful life of over one year which are expected to be used to produce goods for sale or for distribution of services. It includes but is not restricted to:
Land Buildings Machinery Equipment Construction work in progress Minerals Oil Autos & trucks Timberland and timber rights Leasehold improvements Rented equipment, if depreciated Furniture and fixtures Property, Plant and Equipment leased under capitalized lease obligations Book plates Non-current film costs and inventory Broadcasting rights and licenses Franchise rights and licenses Publishing rights and licenses Funds held for construction Long term power purchase contacts Software products
It excludes: Tools and dies amortized over less than two years Excess carrying value over cost of property Copyrights, trademarks, patents and goodwill Property not used in operations or used in operations to be discontinued Property held for sale for companies other than Real Estate (treated as investment and advances)

Alphabetical List of Field Definitions - P
Issue 6
© Thomson Financial 2003-2007 429 Confidential Information of Thomson Financial
Footnotes: A. Includes intangibles G. Included in other assets H. Excessive revaluation on fixed assets
Property, Plant And Equipment - Net Asset Data, Annual Item; Field 02501
All Industries: PROPERTY, PLANT AND EQUIPMENT (NET) represents Gross Property, Plant and Equipment less accumulated reserves for depreciation, depletion and amortization. It includes but is not restricted to:
Land Buildings - Net Machinery- Net Equipment - Net Construction work in progress Minerals - Net Oil - Net Autos and trucks - Net Timberland and timber rights - Net Leasehold improvements - Net Rented equipment - Net Furniture and fixture - Net Property, Plant and Equipment leased under capitalized lease obligations - Net Book plates - Net Non-current film costs and inventory Broadcasting rights and licenses Franchise rights and licenses Long term power purchase contracts Publishing rights and licenses Funds held for construction Long term power purchase contracts Software products
It excludes: Tools and dies amortized over less than two years Excess carrying value over cost of property Copyrights, trademarks, and goodwill Property not used in operations or used in operations to be discontinued Property held for sale for companies other than Real Estate companies (treated as investment and advances)
Footnotes: A. Includes intangibles D. Includes long term investments, intangibles and other assets F. Decrease due to decentralization of parent company G. Included in other assets H. Excessive revaluation of fixed assets J. After appropriations for net expenditures on mining assets K. Before appropriations for net expenditures on mining assets L. Includes financial investments M. Equipment only N. Includes some real estate investments

Alphabetical List of Field Definitions - P
Issue 6
© Thomson Financial 2003-2007 430 Confidential Information of Thomson Financial
Property, Plant And Equipment (Net) – GAAP Supplementary (Asset) Data, Annual Item; Field 06620
All Industries: PROPERTY, PLANT AND EQUIPMENT (NET) – GAAP represents Net Property, Plant and Equipment of a non-U.S. company adjusted to conform to U.S. Generally Accepted Accounting Principles. See definition for PROPERTY, PLANT AND EQUIPMENT – NET for additional information.
This item is presented in U.S. dollars (converted at the company's fiscal year end exchange rate). It is only available for ADRs trading on the NYSE, ASE or NASDAQ and is generally not available prior to 1994.
Property, Plant & Equipment - Other Asset Data, Annual Item; Field 18379
Industrials, Other Financial Companies: PROPERTY, PLANT & EQUIPMENT - OTHER represents all other property, plant and equipment besides land, buildings, machinery & equipment, rental/lease property, transportation equipment and property, plant & equipment under capital leases.
Data for this field is generally not available prior to 1992. It includes but is not restricted to:
Leasehold improvements Footnotes:
A. No standard text C. Net of depreciation
Property, Plant & Equipment Under Capital Leases Asset Data, Annual Item; Field 18381
Industrials, Other Financial Companies: PROPERTY, PLANT & EQUIPMENT UNDER CAPITAL LEASES represents the property, plant and equipment leased by the company for use in its operations.
Data for this field is generally not available prior to 1992. Footnotes:
A. No standard text C. Net of depreciation D. Includes other
Provision For Bad Debt Supplementary (Asset) Data, Annual Item; Field 18298
All Industries: PROVISION FOR BAD DEBT represents the provision for possible uncollectable accounts receivable. This item may also be referred to as the allowance for doubtful accounts.
Data for this field is generally not available prior to 1992. Footnotes:
A. No standard text
Provision For Loan Losses Expense Data, Annual Item; Field 01271
Banks, Other Financial Companies: PROVISION FOR LOAN LOSSES represents losses that the bank or the company expects to take as a result of uncollectable or troubled loans.
Alphabetical List of Field Definitions - P
Issue 6
© Thomson Financial 2003-2007 431 Confidential Information of Thomson Financial
It includes but is not restricted to: Transfer to bad debt reserves (Japan) Amortization of loans (Japan)
Footnotes: A. Loans given net of provisions B. Net of interest expense C. Includes some other provisions
Provision For Loan Losses % Total Loans Other Ratio, Annual Item; Field 15079
Banks: Provision for Loan Losses / (Loans-Total - Interbank Loans) * 100
Provision For Loan Losses % Total Loans - 5 Yr Avg Other Ratio, Annual Item; Field 15082
Banks: Arithmetic average of the last five years Provision for Loan Losses % Total Loans
Provision For Risks And Charges Liability Data, Annual Item; Field 03260
All Industries: PROVISION FOR RISKS AND CHARGES found in non-U.S. corporations includes provisions for pension funds (field 03261), repairs and maintenance, litigation claims, etc.
Data for this field is generally not available prior to 1989.

Issue 6
© Thomson Financial 2003-2007 432 Confidential Information of Thomson Financial
Q Quick Ratio Liquidity Ratio, Annual Item; Field 08101
Industrials, Other Financial Companies : (Cash & Equivalents + Receivables (Net)) / Current Liabilities-Total
Quick Ratio - 5 Yr Avg Liquidity Ratio, Annual Item; Field 08105
Industrials, Other Financial Companies : Arithmetic average of the last five years of Quick Ratios

Issue 6
© Thomson Financial 2003-2007 433 Confidential Information of Thomson Financial
R Ratio Of Total Loans To Total Capital Liquidity Ratio, Annual Item; Field 15055
Banks: Loans-Total / Total Capital
Ratio Of Total Loans To Total Capital - 5 Yr Avg Liquidity Ratio, Annual Item; Field 15058
Banks: Arithmetic average of the last five years of Ratio of Total Loans to Total Capital
Raw Materials Asset Data, Annual Item; Field 02097
All Industries: RAW MATERIALS represent the inventory of raw materials or supplies which indirectly or directly enter into the production of finished goods.
Data for this field is generally not available prior to 1989. Footnotes:
A. Includes work in progress
Real Estate Assets Asset Data, Annual Item; Field 02240
Banks: REAL ESTATE ASSETS represents property owned by the bank but not classified as part of premises or equipment. It includes but is not restricted to:
Real estate acquired from foreclosures Lands held for resale Lands held for future branch expansion
Insurance and Other Financial Companies: REAL ESTATE ASSETS represents the company's investment in real estate. This item does not include real estate used in the operation of the company.
Footnotes: A. Properties used for operations are included
Real Estate Mortgage Loans Supplementary (Asset) Data, Annual Item; Field 02267
Banks, Insurance Companies: REAL ESTATE MORTGAGE LOANS represent loans made to finance construction or the purchase of real estate. It includes but is not restricted to:
Residential mortgages Veteran Administration (VA) mortgages Conventional mortgages

Alphabetical List of Field Definitions - R
Issue 6
© Thomson Financial 2003-2007 434 Confidential Information of Thomson Financial
Second mortgages Commercial mortgages Construction mortgages Loans on deed (Japan) Federal Housing Administration (FHA) Loans
Footnotes: A. Fixed income securities are included B. Includes some short term investments
Realized Investment Gains/Loss Income Data, Annual Item; Field 01542
Insurance Companies: REALIZED INVESTMENT GAINS/LOSS represents the after tax gain or loss on the sale of securities.
This item is generally not available subsequent to 1989. Footnotes:
A. Includes unrealized gains/losses
Receivables (Net) Asset Data, Annual Item; Field 02051
Industrials, Other Financial Companies: RECEIVABLES (NET) represent the amounts due to the company resulting from the sale of goods and services on credit to customers (after applicable reserves). These assets should reasonably be expected to be collected within a year or within the normal operating cycle of a business. It includes but is not restricted to:
Trade accounts (field 18297) Installment sales account receivables and notes Trade notes and receivables Charge account Due from factor Equity in accounts receivable sold to financial subsidiaries Due from finance subsidiary Unbilled shipments received by customers Unbilled lease revenue Accrued Interest Receivables of discontinued operations Current portion of net investment in sales-type leases Deferred billings on contracts Earned and unbilled costs of contracts to be billed within one year Due from unconsolidated subsidiaries, affiliates or associated companies Current portion of long-term receivables (includes mortgage and notes receivable) U.S. government contract billing Income tax recoverable or refund Unbilled sources Receivable from sale of assets Litigation claims receivable Due from officers and employees (within one year) Dividend receivable Stock subscription receivables Salary & Pension Funds

Alphabetical List of Field Definitions - R
Issue 6
© Thomson Financial 2003-2007 435 Confidential Information of Thomson Financial
Banker's trade acceptances for non-financial institutions or corporations Costs recoverable through rate adjustments Bills of Exchange Provision for bad debt (field 18298)
It excludes: For non-U.S. corporations, long term receivables are excluded from current assets even though included in net receivables Due to factor
Footnotes: A. Includes other current non-trade receivables and/or other current assets B. Includes current and/or non-current non-trade receivables C. Gross receivables; provision for bad debts is on liability side, but cannot be determined D. Adjusted to excluded long term receivables F. Includes some types of loans G. Includes near cash items H. Long term receivables cannot be separated I. Includes short-term investments J. Long term receivables cannot be separated and gross receivables K. Long Term Receivables cannot be separated and includes other current non-trade receivables and/or
other current assets L. Adjusted to exclude bad debt M. Includes prepaid expenses
Receivables % Total Current Assets Liquidity Ratio, Annual Item; Field 08121
All Industries: (Receivables (Net) / Current Assets-Total) * 100
Receivables % Total Current Assets - 5 Yr Avg Liquidity Ratio, Annual Item; Field 08125
All Industries: Arithmetic average of the last five years of Receivables % Current Assets
Redeemable Preferred Stock Supplementary (Liability) Data, Annual Item; Field 18290
All Industries: REDEEMABLE PREFERRED STOCK represents stock which carries a higher dividend rate than other preferred and is callable by the company at a stated call or redemption price. The call price is usually higher than the par value. This is done in order to compensate the owner for the involuntary loss of his investment. The redemption provision may merely establish the right to call the stock or may require the establishment of a sinking fund for the redemption of a specified amount of the stock each year. This item is shown at involuntary liquidation value.
Data for this field is generally not available prior to 1996 for non-U.S. companies and 1991 for U.S. companies. Footnotes:
A. No standard text

Alphabetical List of Field Definitions - R
Issue 6
© Thomson Financial 2003-2007 436 Confidential Information of Thomson Financial
Redeemable Preferred Stock Asset Data, Annual Item; Field 02214
Insurance Companies: REDEEMABLE PREFERRED STOCK represents the insurance company's' investment in stock which carries a higher dividend rate and is callable by the company at a stated redemption price.
Reduction In Long Term Debt Cash Flow Data, Annual Item; Field 04701
All Industries: REDUCTION IN LONG TERM DEBT represents funds used to reduce long term debt, capitalized lease obligations and includes decrease in debt from the conversion of debentures into common stock.
Footnotes: A. Includes common and preferred, redeemed, retired or converted B. Includes reduction of short term debt C. Includes other long term liabilities D. Includes increase in long term debt
Region Descriptive Data, Current Item; Field 06028
All Industries: REGION represents the region of the world that the company is domiciled in. This variable is alphanumeric and 80 bytes in length. Each byte from left to right corresponds to a region in this list from the top down. An "X" in a given byte indicates that the company belongs in that region.
BYTE REGION 1 Americas 2 Europe/Africa 3 Asia Pacific 4 Emerging Market 5 Worldscope International (all non-US) 6 U.S. Financial (US & Canada)
This item is also available at the security level.
Registrar Details Descriptive Data, Current Items; Fields 18121, 18122, 18123, 18124, 18125, 18126
All Industries: Available for only U.K. and Ireland, REGISTRAR represents the agency that is responsible for tracking and maintaining the current owners of bond issues and the stockholders of a company. The registrar also insures that the stock in circulation does not exceed the authorized amount and in the case of bonds certifies that the bond is a company’s genuine debt obligation. The fields are defined as follows:
Field 18121 Registrar Name Field 18122 Registrar Address Field 18123 Registrar Telephone Number Field 18124 Registrar Fax Number Field 18125 Registrar Website Field 18126 Email Address

Alphabetical List of Field Definitions - R
Issue 6
© Thomson Financial 2003-2007 437 Confidential Information of Thomson Financial
Reinsurance & Adjustment Reserves Supplementary (Expense) Data, Annual Item; Field 01005
Insurance Companies: REINSURANCE & ADJUSTMENT RESERVES represent the difference between the premiums for the amount of insurance that the company has transferred (ceded) to another insurance company and the amount of reinsurance risk that the company has assumed from other insurance companies.
Reinvestment Rate - Per Share Profitability Ratio, Annual/Interim Item; Field 08651
All Industries: Annual Time Series:
(Earnings Per Share - Dividends Per Share) / Average of Last Year's and Current Year’s Book Value Per Share * 100
Interim Time Series: (Trailing 12 Months Earnings Per Share – Trailing 12 Months Dividends Per Share) / Average of Last Year's and Current Year’s Book Value Per Share * 100
This calculation uses restated data for last years values where available.
Reinvestment Rate Per Share – Fiscal Profitability Ratio, Annual Item; Field 08653 All industries
((Current year EPS fiscal – Dividends per share) /Average of Last Year’s and Current Year’s Book Value Per Share Fiscal) * 100
The calculation is based on Worldscope field 05491 Book Value Per Share-Fiscal, field 05202 Earnings Per Share-Fiscal and field 05110 Dividends Per Share-Fiscal. This calculation uses restated data for last years values where available.
This item is also available at the security level and is only available in the annual original time series.
Reinvestment Rate - Per Share - Current Profitability Ratio, Current Item; Field 08652
All Industries: (Earnings Per Share-Last 12 Mos. - Dividends Per Share-Last 12 Mos.) / Book Value Per Share a year ago * 100
Reinvestment Rate - Per Share - 5 Yr Avg Profitability Ratio, Annual Item; Field 08655
All Industries: Arithmetic average of the last five years of Reinvestment Rate - Per Share
Reinvestment Rate - Total (%) Profitability Ratio, Annual Item; Field 08656
All Industries: (Net Income before Preferred Dividends - Preferred Dividends (Cash) - Common Dividends (Cash) / Average of Last Year's and Current Year’s Common Equity * 100

Alphabetical List of Field Definitions - R
Issue 6
© Thomson Financial 2003-2007 438 Confidential Information of Thomson Financial
Exceptions: Finland (95 and prior years) and Norway (93 and prior years):
All Industries: (Net Income before Preferred Dividends + Reserves-Increase/Decrease - Preferred Dividends (Cash) - Common Dividends (Cash)) / Average of Last Year's and Current Year’s (Common Equity + Last Year's Non-Equity Reserves) * 100
Sweden (88 and prior years): All Industries:
(Net Income before Preferred Dividends + Reserves-Increase/Decrease *.5 - Preferred Dividends (Cash) - Common Dividends (Cash)) / Average of Last Year's and Current Year’s (Common Equity + (Last Year's Non-Equity Reserves * .5)) * 100
Sweden (89): All Industries:
(Net Income before Preferred Dividends + Reserves-Increase/Decrease *.7 - Preferred Dividends (Cash) - Common Dividends (Cash)) / (Average of Last Year's and Current Year’s Common Equity + Average of (Last Year’s Non Equity Reserve *.5 and Current Year's Non-Equity Reserves * .7))) * 100
Sweden (90-92): All Industries:
(Net Income before Preferred Dividends + Reserves-Increase/Decrease *.7 - Preferred Dividends (Cash) - Common Dividends (Cash)) / Average of Last Year's and Current Year’s (Common Equity + (Last Year's Non-Equity Reserves * .7)) * 100
Sweden (93): All Industries:
(Net Income before Preferred Dividends + Reserves-Increase/Decrease - Preferred Dividends (Cash) - Common Dividends (Cash)) / Average of Last Year's and Current Year’s Common Equity + Average of (Last Year's Non-Equity Reserves * .7 and Current Year’s Non Equity Reserve))) * 100
Sweden (94 and subsequent years): All Industries:
(Net Income before Preferred Dividends - Preferred Dividends (Cash) - Common Dividends (Cash)) / Average of Last Year's and Current Year’s Common Equity * 100
This calculation uses restated data for last year’s values where available.
Reinvestment Rate - Total (%) - 5 Yr Avg Profitability Ratio, Annual Item; Field 08660
All Industries: Arithmetic average of the last five years of Reinvestment Rate
Rental Income Supplementary (Income) Data, Annual Item; Field 01024
Other Financial Companies: RENTAL INCOME represents the income earned from the use of property and equipment by a lessee.
Data for this field is generally not available prior to 1991.

Alphabetical List of Field Definitions - R
Issue 6
© Thomson Financial 2003-2007 439 Confidential Information of Thomson Financial
Rental Income Supplementary (Income) Data, Annual Item; Field 18276
Industrials: RENTAL INCOME represents non-operating income from rental of assets. This item is supplementary to Net Other Income/Expense (WS 01262).
This item is available in the annual original and annual restated time series for detailed and limited companies, full and fast updates.
Rental/Leased Property Asset Data, Annual Item; Field 18378
Industrials, Other Financial Companies: RENTAL/LEASED PROPERTY represents assets that the company owns and rents or leases to others.
Data for this field is generally not available prior to 1989. It excludes:
Equipment under capitalized leases Footnotes:
A. No standard text C. Net of depreciation D. Includes other
Rental/Operating Lease Expense Supplementary (Expense) Data, Annual Item; Field 18140
All Industries: RENTAL/OPERATING LEASE EXPENSE represents the amount of rental expense paid for operating leases during the year.
Data for this field is generally not available prior to 1996 for non-U.S. companies and 1991 for U.S. companies. Footnotes:
A. No standard text
Research And Development Expense Supplementary (Expense) Data, Annual Item; Field 01201
All Industries: RESEARCH AND DEVELOPMENT EXPENSE represents all direct and indirect costs related to the creation and development of new processes, techniques, applications and products with commercial possibilities. These costs can be categorized as:
1. Basic research 2. Applied research 3. Development costs of new products
It includes but is not restricted to: Software Expense Design and Development Expense
It excludes: Customer or government sponsored research amortization For oil, gas, coal, drilling and mining companies, purchase of mineral rights Engineering Expense
Alphabetical List of Field Definitions - R
Issue 6
© Thomson Financial 2003-2007 440 Confidential Information of Thomson Financial
Contributions by government, customers, partnerships or other corporations to the company's research and development expense
Footnotes: A. Worldwide B. Domestic companies C. Parent company D. Includes contributions from government, customers, partnerships or other corporations F. Includes science or technology expense H. Excludes cost of plant research and development I. Includes engineering expense J. Included in Cost of Goods Sold K. Includes market testing & research L. Includes exploration expense M. No standard text
Research And Development/Sales Profitability Ratio, Annual Item; Field 08341
All Industries: Research and Development Expense / Net Sales or Revenues * 100
Research And Development/Sales - 5 Yr Avg Profitability Ratio, Annual Item; Field 08345
All Industries: Arithmetic average of the last five years of Research and Development Sales
Reserve For Loan Losses Asset Data, Annual Item; Field 02275
Banks, Other Financial Companies: RESERVE FOR LOAN LOSSES represent a reserve set aside by the bank or financial company to cover possible loan losses. It includes (for Banks):
Net loan losses (field 01275) Footnotes:
A. Includes other provisions B. No standard text
Reserve For Loan Losses % Total Assets Other Ratio, Annual Item; Field 15156
Banks: Reserve for Loan Losses / (Total Assets - Customer Liabilities on Acceptances) * 100
Other Financial Companies: Reserve for Loan Losses / (Total Assets - Custody Securities) * 100
Customer Liabilities on Acceptances only subtracted when included in Total Assets

Alphabetical List of Field Definitions - R
Issue 6
© Thomson Financial 2003-2007 441 Confidential Information of Thomson Financial
Reserve For Loan Losses % Total Assets - 5 Yr Avg Other Ratio, Annual Item; Field 15159
Banks, Other Financial Companies: Arithmetic average of the last five years of Reserve for Loan Losses % Total Assets
Reserve For Loan Losses % Total Capital Leverage Ratio, Annual Item; Field 15115
Banks, Other Financial Companies: Reserve for Loan Losses / Total Capital * 100
Reserve For Loan Losses % Total Capital - 5 Yr Avg Leverage Ratio, Annual Item; Field 15118
Banks, Other Financial Companies: Arithmetic average of the last five years Reserve for Loan Losses % Total Capital
Reserve For Loan Losses % Total Loans Other Ratio, Annual Item; Field 15073
Banks, Other Financial Companies: Reserve for Loan Losses / (Loans-Total - Interbank Loans) * 100
Other Financial Companies: Reserve for Loan Losses / Loans-Total * 100
Reserve For Loan Losses % Total Loans - 5 Yr Avg Other Ratio, Annual Item; Field 15076
Banks, Other Financial Companies: Arithmetic average of the last five years Reserve for Loan Losses % Total Loans
Reserves - Increase/Decrease Expense Data, Annual Item; Field 01301
All Industries: RESERVES - INCREASE/DECREASE represents allocations to and/or from discretionary reserves and is most common in European countries. Only allocations to reserves included in net income apply. This item is not available for U.S. Corporations.
Footnotes: A. Includes depreciation expense B. Not comparable and includes depreciation expense C. Includes other charges D. Includes provision for loan losses F. Includes minority interest
Restructuring Expense Supplementary (Expense) Data, Annual Item; Field 18227
All Industries: RESTRUCTURING EXPENSE represents the pre-tax cost of reorganizing a company's operations. This item includes Restructuring Provisions.
Alphabetical List of Field Definitions - R
Issue 6
© Thomson Financial 2003-2007 442 Confidential Information of Thomson Financial
Data for this field is generally not available prior to 1996 for non-U.S. companies and 1991 for U.S. companies. Footnotes:
A. No standard text
Restructuring Expense Per Share Stock Data, Annual Item; Field 18210
All Industries: RESTRUCTURING EXPENSE PER SHARE represents the after tax per share cost of the reorganization of a company.
Data for this field is generally not available prior to 1996 for non-U.S. companies, 1991 for U.S. companies and is shown per 1,000 shares for Brazilian companies. Footnotes:
A. No standard text
Restructuring Expense Per Share - Pre-tax Stock Data, Annual Item; Field 18211
All Industries: RESTRUCTURING EXPENSE PER SHARE - PRE-TAX represents the pre-tax per share cost of the reorganization of a company.
Data for this field is generally not available prior to 1996 for non-U.S. companies, 1991 for U.S. companies and is shown per 1,000 shares for Brazilian companies.
Retained Earnings Shareholders' Equity Data, Annual Item; Field 03495
All Industries: RETAINED EARNINGS represent the accumulated after tax earnings of the company which have not been distributed as dividends to shareholders or allocated to a reserve account. Excess involuntary liquidation value over stated value of preferred stock is deducted if there is an insufficient amount in the capital surplus account.
Data for this field is generally not available prior to 1989. It includes but is not restricted to:
Merger Reserves Reserves for associated undertakings
Footnotes: A. Current year's net income
Retained Earnings % Equity Profitability Ratio, Annual Item; Field 08911
All Industries: Retained Earnings / Common Equity * 100
This field is generally not available prior to 1989.
Retained Earnings % Equity - 5 Yr Avg Profitability Ratio, Annual Item; Field 08915
All Industries: Arithmetic average of the last five years Retained Earnings % Equity.

Alphabetical List of Field Definitions - R
Issue 6
© Thomson Financial 2003-2007 443 Confidential Information of Thomson Financial
Return On Assets Profitability Ratio, Annual/Interim Item; Field 08326
Industrial Companies: Annual Time Series:
(Net Income before Preferred Dividends + ((Interest Expense on Debt-Interest Capitalized) * (1-Tax Rate))) / Average of Last Year's and Current Year’s Total Assets * 100
Banks: Net Income before Preferred Dividends + ((Interest Expense on Debt-Interest Capitalized) * (1-Tax Rate))) / Average of Last Year's (Total Assets - Customer Liabilities on Acceptances) and Current Year’s (Total Assets - Customer Liabilities on Acceptances) * 100. Customer Liabilities on Acceptances only subtracted when included in Total Assets
Insurance Companies: (Net Income before Preferred Dividends + ((Interest Expense on Debt-Interest Capitalized) *(1-Tax Rate))) + Policyholders' Surplus) / Average of Last Year's and Current Year’s Total Assets * 100
Other Financial Companies: (Net Income before Preferred Dividends + ((Interest Expense on Debt-Interest Capitalized) * (1-Tax Rate))) / Average of Last Year's (Total Assets - Custody Securities) and Current Year’s (Total Assets - Custody Securities) * 100
Exceptions: U.S. Companies:
Standard Tax Rate Used in Calculations: 86 and prior years: 46% 87 to 94: 34% 95 and subsequent years: 35%
All Industries: Interim Time Series:
((Trailing 12 Months Net Profit + (Trailing 12 Months Interest Expense On Debt * (1-Tax Rate / 100)))) / Average of Last Year's and Current Year’s Total Assets * 100
These calculations use restated data for last years values where available. If current year tax is > 1, no adjustment is made; if NA, prior period rate is used..
Return On Assets - 5 Yr Avg Profitability Ratio, Annual Item; Field 08330
All Industries: Arithmetic average of the last five years of Return on Assets
Return On Capital Employed See RETURN ON INVESTED CAPITAL
Return On Earning Assets Profitability Ratio, Annual Item; Field 15567
Banks: Net Income before Preferred Dividends / Average of Last Year’s and Current Years ( Investments-Total + Last Year's Loans-Net) * 100

Alphabetical List of Field Definitions - R
Issue 6
© Thomson Financial 2003-2007 444 Confidential Information of Thomson Financial
Return On Earning Assets - 5 Yr Avg Profitability Ratio, Annual Item; Field 15570
Banks: Arithmetic average of the last five years Return on Earning Assets
Return On Equity – GAAP Profitability Ratio, Annual Item; Field 08295
All Industries: Net Income-GAAP / Last Year's Common Equity-GAAP * 100
This item is only available for ADRs trading on the NYSE, ASE or NASDAQ and is generally not available prior to 1995.
Return On Equity – GAAP – 3 Yr Avg Profitability Ratio, Annual Item; Field 08297
All Industries: Arithmetic average of the last three years Return on Equity GAAP
This item is only available for ADRs trading on the NYSE, ASE or NASDAQ and is generally not available prior to 1997.
Return On Equity – GAAP – 5yr Avg Profitability Ratio, Annual Item; Field 08299
All Industries: Arithmetic average of the last five years Return on Equity GAAP
This item is only available for ADRs trading on the NYSE, ASE or NASDAQ and will not be available until 1999.
Return On Equity - Per Share Profitability Ratio, Annual/Interim Item; Field 08371
All Industries: Annual Time Series:
Earnings Per Share / Average of Last Year's and Current Year’s Book Value Per Share * 100 Interim Time Series:
Trailing 12 Months Earnings Per Share / Average of Last Year's and Current Year’s Book Value Per Share * 100
This calculation uses restated data for last years values where available. Return On Equity Per Share - Fiscal Profitability Ratio, Annual item; Field 08302
All industries: (Current Year’s EPS fiscal / Average of Last Year’s and Current Year’s Book Value Per Share Fiscal) * 100 The calculation is based on Worldscope field 05491 Book Value Per Share-Fiscal and field 05202 Earnings Per Share-Fiscal. It uses restated data for last years values where available.
This item is also available at the security level and is only available in the annual original time series).

Alphabetical List of Field Definitions - R
Issue 6
© Thomson Financial 2003-2007 445 Confidential Information of Thomson Financial
Return On Equity - Per Share - Current Profitability Ratio, Current Item; Field 08372
All Industries: Earnings Per Share-Last 12 Months / Prorated Book Value Per Share * 100
Return On Equity - Per Share - 5 Yr Avg Profitability Ratio, Annual Item; Field 08375
All Industries: Arithmetic Average of the last five years of Return on Equity Per-Share
Return On Equity - Total (%) Profitability Ratio, Annual/Interim Item; Field 08301
All Industries: (Net Income before Preferred Dividends - Preferred Dividend Requirement) / Average of Last Year's and Current Year’s Common Equity * 100 For Insurance companies, Policyholders’ Surplus is substituted where Net Income before Preferred Dividends is not available and Policyholders’ Equity where Common Equity is not available.
Exceptions: Finland (95 and prior years) and Norway (93 and prior years):
All Industries: (Net Income before Preferred Dividends - Preferred Dividend Requirement + Reserves-Increase/Decrease) / (Average of Last Year's and Current Year’s Non-Equity Reserves + Average of Last Year's and Current Year’s Common Equity) * 100
Sweden (88 and prior years): All Industries:
(Net Income before Preferred Dividends - Preferred Dividend Requirement + Reserves-Increase/Decrease * .5) / (Average of Last Year's and Current Year’s( Non-Equity Reserves * .5) + Average of Last Year's and Current Year’s Common Equity) * 100
Sweden (89): All Industries:
(Net Income before Preferred Dividends - Preferred Dividend Requirement + Reserves-Increase/Decrease * .7) / (Average of (Last Year's Non Equity Reserve *.5 and Current Year’s Non-Equity Reserves * .7)+ Average of Last Year's and Current Year’s Common Equity) * 100
Sweden (90-92): All Industries:
(Net Income before Preferred Dividends - Preferred Dividend Requirement + Reserves-Increase/Decrease * .7) / (Average of Last Year's and Current Year’s ( Non-Equity Reserves * .7)+ Average of Last Year's and Current Year’s Common Equity) * 100
Sweden (93): All Industries:
(Net Income before Preferred Dividends - Preferred Dividend Requirement + Reserves Increase/Decrease) / (Average of (Last Year's Non Equity Reserve *.7 and Current Year’s Non-Equity Reserves )+ Average of Last Year's and Current Year’s Common Equity) * 100
Sweden (94 and subsequent years): All Industries:
(Net Income before Preferred Dividends - Preferred Dividend Requirement / Average of Last Year's and Current Years Common Equity * 100

Alphabetical List of Field Definitions - R
Issue 6
© Thomson Financial 2003-2007 446 Confidential Information of Thomson Financial
Interim Time Series: Trailing 12 Months Net Profit / Average of Last Year's and Current Year’s Common Equity * 100
This calculation uses restated data for last year’s values where available.
Return On Equity - Total (%) - 5 Yr Avg Profitability Ratio, Annual Item; Field 08305
All Industries: Arithmetic average of the last five years of Return on Equity
Return On Invested Capital Profitability Ratio, Annual Item; Field 08376
All Industries: (Net Income before Preferred Dividends + ((Interest Expense on Debt - Interest Capitalized) * (1-Tax Rate))) / Average of Last Year's and Current Year’s (Total Capital + Last Year's Short Term Debt & Current Portion of Long Term Debt) * 100
This calculation uses restated data for last years values where available.
Exceptions: U.S. Companies:
Standard Tax Rate Used in Calculations: 86 and prior years: 46% 87 to 94: 34% 95 and subsequent years: 35%
Return On Invested Capital - 5 Yr Avg Profitability Ratio, Annual Item; Field 08380
All Industries: Arithmetic average of the last five years of Return on Invested Capital
Return On Net Assets See RETURN ON EQUITY.
Revaluation Reserve Shareholders' Equity Data, Annual Item; Field 03492
All Industries: REVALUATION RESERVE represents a reserve created by the revaluation of assets.
Data for this field is generally not available prior to 1989.
Revenues See NET SALES OR REVENUES
Risk Adjusted Assets See RISK WEIGHTED ASSETS
Alphabetical List of Field Definitions - R
Issue 6
© Thomson Financial 2003-2007 447 Confidential Information of Thomson Financial
Risk Weighted Assets Supplementary Data, Annual & Interim Item; Field 18156
Banks: RISK WEIGHTED ASSETS represents the total of the carrying value of each asset class multiplied by their assigned risk weighting, as defined by banking regulations. This item may also be referred to as risk adjusted assets and may be abbreviated as RWA. f this item is not reported then it is calculated by taking the dollar value of Total Capital (as reported by the bank) and dividing it by the Capital Ratio (as reported by the bank). If only the dollar value of Tier1 Capital and Tier1 Ratio are reported then these items would be substituted for Total Capital and Capital Ratio in the calculation (as reported by the bank).
This item is available in the annual time series and the quarterly, semi-annual and trimester interim time series. It is only available at the company level.
RWA See RISK WEIGHTED ASSETS

Issue 6
© Thomson Financial 2003-2007 448 Confidential Information of Thomson Financial
S Salaries And Benefits Expense See STAFF COSTS
Sales See NET SALES OR REVENUES
Sales/Revenues – GAAP Supplementary (Income) Data, Annual Item; Field 06801
All Industries: SALES/REVENUES – GAAP represents the sales/revenues of a non-U.S. company adjusted to conform to U.S. Generally Accepted Accounting Principles. See definition for NET SALES OR REVENUES for additional information.
This item is presented in U.S. dollar (converted at the fiscal year twelve month average exchange rate). It is only available for ADRs trading on the NYSE, ASE or NASDAQ and is generally not available prior to 1994.
Sales Per Employee Profitability Ratio, Annual Item; Field 08351
All Industries: Net Sales or Revenues / Employees
Sales Per Employee - 5 Yr Avg Profitability Ratio, Annual Item; Field 08355
All Industries: Arithmetic average of the last five years of Sales Per Employee
Sales Per Share Stock Data, Annual Item; Field 05508
All Industries: SALES PER SHARE represents the per share amount of the company's sales or revenues.
This item is also available at the security level for 1987 and subsequent years and is shown per 1,000 shares for Brazilian companies.
Savings Deposits % Total Deposits Other Ratio, Annual Item; Field 15184
Banks: Savings and Other Time Deposits / Deposits-Total * 100
Savings Deposits % Total Deposits - 5 Yr Avg Other Ratio, Annual Item; Field 15187
Banks: Arithmetic average of the last five years of Savings Deposits % Total Deposits

Alphabetical List of Field Definitions - S
Issue 6
© Thomson Financial 2003-2007 449 Confidential Information of Thomson Financial
Savings/Other Time Deposits Liability Data, Annual Item; Field 03015
Banks: SAVINGS/OTHER TIME DEPOSITS represent interest bearing deposits in the bank. It includes but is not restricted to:
Interest bearing deposits Money Market deposits Term Certificates Certificates of Deposits greater than $100,000 Consumer Certificates of Deposits Time Deposits Savings Deposits Negotiable certificates of deposits Other time deposits - retail (U.K.) Other time deposits - wholesale (U.K.)
Footnotes: A. Other short term liabilities included B. May include borrowings C. Includes due to banks D. May include some demand deposits
Securities Inventory Asset Data, Annual Item; Field 02130
Other Financial Companies: SECURITIES INVENTORY represents securities owned by the firm as part of their portfolio. It includes but is not restricted to:
Corporate securities Government and agency securities Mortgages and mortgaged backed securities Money Market instruments Municipal securities Bull position (U.K. term)
Footnotes: A. May include investments B. Includes cash or near cash items
Securities Purchased Under Resale Agreements Supplementary (Asset) Data, Annual Item; Field 02211
Banks, Other Financial Companies: SECURITIES PURCHASED UNDER RESALE AGREEMENTS represents the purchase of government securities on a temporary basis, normally fifteen days or less. These securities are usually sold back at stated price and by a given date. This is done through the Federal Reserve.
Data for this field is generally not available prior to 1990. Footnotes:
A. Included in federal funds
Alphabetical List of Field Definitions - S
Issue 6
© Thomson Financial 2003-2007 450 Confidential Information of Thomson Financial
Securities Sold But Not Yet Purchased (Short Call) Supplementary (Liability) Data, Annual Item; Field 03059
Other Financial Companies: SECURITIES SOLD BUT NOT YET PURCHASED (SHORT CALL) represents the selling of a security which the seller does not own but will have to purchase so that the shares can be delivered to the buyer. This is usually done when the seller believes that the value of the stock will decline. The seller hopes to be able to purchase the shares needed to fulfil the sale at a lower price than he sold them for thus making a profit. It includes but is not restricted to:
Bear positions (U.K. term) Margin accounts
Securities Sold Under Repurchase Agreements Supplementary (Liability) Data, Annual Item; Field 03056
Banks, Other Financial Companies: SECURITIES SOLD UNDER REPURCHASE AGREEMENTS represent securities sold on a short term basis that are bought back by the bank. Repurchase agreements usually call for the securities to be bought back by a certain date at a stated price. Banks also use repurchase agreements to maximize earnings on treasury issues on a short term basis.
Footnotes: A. Included in federal funds
SEDOL Number Descriptive Data, Current Item; Field 06006
All Industries: SEDOL NUMBER represents the seven digit security identifier assigned by the London Stock Exchange.
This item also available at the security level.
SEDOL Number - Mult Share 1, 2, 3, 4, 5, 6, 7 Descriptive Data, Current Items; Fields 20005, 20105, 20205, 20305, 20405, 20505, 20605, respectively
All Industries: SEDOL NUMBER - MULT SHARE 1, 2, 3, 4, 5, 6, 7 represents the seven digit security identifier assigned for each type of common/ordinary security by the London Stock Exchange.
For companies with more than one type of common/ordinary share, the SEDOL shown is for the share identified in field 6005 - Type of Share.
Selling, General & Administrative Expenses Expense Data, Annual Item; Field 01101
Industrials, Insurance, Other Financials: SELLING, GENERAL & ADMINISTRATIVE EXPENSES represents expenses not directly attributable to the production process but relating to selling, general and administrative functions. It includes but is not restricted to:
Marketing expense Strike expense Pension costs, and other employee benefits if a company does not buy or make goods to sell Parent company charges for administrative services For motion picture and entertainment companies, amortization of film costs

Alphabetical List of Field Definitions - S
Issue 6
© Thomson Financial 2003-2007 451 Confidential Information of Thomson Financial
Amortization of tools and dies where the usable life is two years or less (i.e., automobile industry, aircraft manufacturing, etc.)f Payroll taxes Social Security taxes Other operating expenses if a company does not buy or make goods to sell Other operating expenses when no selling, general & administrative expense is reported but cost of goods sold is Commissions Advertising expense Product promotion expense Engineering expense, when the company has no operating revenues derived from engineering activities Directors' fees & remuneration Delivery expense Bad debt expense (provision for doubtful accounts) Research and Development Expense (field 01201) Lease expense Petition expense For software companies, related expense of software development Depreciation and amortization of intangibles charged to selling, general and administrative expenses
It excludes: For U.S. corporations, depreciation and amortization charged to selling, general and administrative expenses when reported by the company Moving expense Foreign currency translation gains or losses Idle plant expense Profit on sales of properties (except for securities, etc.) for companies in the oil, coal, airline and other industries where these transactions are considered a normal part of doing business Supplies Taxes other than income taxes Amortization of deferred costs Cost of franchise sales Improvement to leased property Geological and geophysical expense Discontinued operations or extraordinary charges or credits Amortization of Goodwill
Insurance, Other Financial Companies: SELLING, GENERAL & ADMINISTRATIVE EXPENSES represents all expenses relating to selling & administration expenses of the company. It includes but is not restricted to:
For Insurance Companies: Pension costs Employee benefits Payroll taxes Social Security taxes Parent company charges for administrative services Commissions Advertising expense Directors fees & remuneration Bad debt expense

Alphabetical List of Field Definitions - S
Issue 6
© Thomson Financial 2003-2007 452 Confidential Information of Thomson Financial
Underwriting expenses (Insurance only) (field 01081) Insurance taxes For Other Financial Companies: Pension costs Employee benefits Payroll taxes Social Security taxes Parent company charges for administrative services Commissions Advertising expense Directors fees & remuneration
Footnotes: A. No standard text B. Included in Cost of Goods Sold and/or other Operating Expense C. Includes other income D. Includes provisions for loan loss F. Foreign currency translation differences are included G. All or part of underwriting expenses are included H. Income taxes are included I. Includes some interest expense J. Includes some long term insurance reserve charges K. Includes some non-operating expense (income) L. Interest expense is included as operating expense M. Includes income tax expense N. Includes a portion of depreciation
Selling, General And Administrative Expenses/Sales Profitability Ratio, Annual Item; Field 08336
Industrials, Other Financial Companies: (Selling, General and Administrative Expenses - Research and Development Expense) / Net Sales or Revenues * 100
Selling, General And Administrative Expenses/Sales - 5 Yr Avg Profitability Ratio, Annual Item; Field 08340
Industrials, Other Financial Companies: Arithmetic average of the last five years of Selling, General and Administrative Expense / Net Sales
Separate And Variable Account Assets Asset Data, Annual Item; Field 02290
Insurance Companies: SEPARATE AND VARIABLE ACCOUNT ASSETS represent funds for which investment income and investment gains and losses accrue directly to, and investment risk is borne by, the policyholders. Separate accounts are legally segregated and are not subject to the claims which may arise out of any other business of the insurance company. Deposits and investment income of such separate accounts are included in the revenues with the corresponding liability increases included in benefits and expenses.

Alphabetical List of Field Definitions - S
Issue 6
© Thomson Financial 2003-2007 453 Confidential Information of Thomson Financial
Separate And Variable Account Liabilities Supplementary (Liability) Data, Annual Item; Field 03035
Insurance Companies: SEPARATE AND VARIABLE ACCOUNT LIABILITIES represent funds for which investment income and investment gains and losses accrue directly to, and investment risk is borne by, the policyholders. Separate accounts are legally segregated and are not subject to the claims that may arise out of any other business of the insurance company. Deposits and investment income of such separate accounts are included in the revenues with the corresponding liability increases included in benefits and expenses.
Share Type See TYPE OF SHARE
Shareholders - Common See COMMON SHAREHOLDERS
Shares Outstanding See COMMON SHARES OUTSTANDING
Short Term Debt & Current Portion Of Long Term Debt Liability Data, Annual Item; Field 03051
All Industries: SHORT TERM DEBT & CURRENT PORTION OF LONG TERM DEBT represents that portion of debt payable within one year including current portion of long term debt and sinking fund requirements of preferred stock or debentures. It includes but is not restricted to:
Current portion of long-term debt (field 18232) Notes payable, arising from short-term borrowings Current maturities of participation and entertainment obligations Contracts payable for broadcast rights Current portion of advances and production payments Current portion of long term debt that must be paid back during the next twelve months and included in long term debt Bank Overdrafts Advances from subsidiaries/associated companies, if the term of the loan is not known it is assumed to be long term debt Current portion of preferred stock of a subsidiary Treasury tax and loan demand notes Short sales of U.S. government securities Eurodollar borrowings, if not reported separately and the amount cannot be separated
For Banks: It includes but is not restricted to:
Federal Funds (liability) securities sold under repurchase agreements (field 03055) For Other Financial Companies:
It includes but is not restricted to: Securities sold under repurchase agreements (field 03056)
For All Industries: It excludes:

Alphabetical List of Field Definitions - S
Issue 6
© Thomson Financial 2003-2007 454 Confidential Information of Thomson Financial
Securities loaned Footnotes:
A. Notes payable included in accounts payable B. May include long term borrowings C. Includes debts due in four years or less for Germany D. Non-Operational borrowings are included F. No standard text
Short Term Investments Asset Data, Annual Item; Field 02008
Industrials, Other Financial Companies: SHORT TERM INVESTMENTS represent temporary investments of excess cash in marketable securities that can be readily converted into cash. It includes but is not restricted to:
Short-term obligations of the U.S. government Stocks, bonds, or other marketable securities listed as short-term investments Time certificates of deposit Time deposits Eurodollar bank time deposits U.S. government treasury bills Corporate securities - stocks, bonds Municipal securities Commercial paper Money market mutual fund shares Post office time deposits (non-U.S.) Short-term investments Temporary investments
It excludes: Commercial paper issued by unconsolidated subsidiaries to parent company (this is included in receivables) Amount due from sale of debentures (this is included in receivables) Checks written by the company but not yet deposited and charged to the company's bank account Promissory notes
Footnotes: A. Includes long term investments B. Includes securities due four years or less for Germany C. Cash on hand is included D. Includes cash and securities held for regulatory purposes
SIC Codes Descriptive Data, Current Items; Fields 07021, 07022, 07023, 07024, 07025, 07026, 07027, 07028
All Industries: SIC CODES were developed by the U.S. government to provide a standard industry classification that covers all the economic activities of the United States. They are derived from the 1987 edition of the Standard Industrial Classification Manual compiled by the Executive Office of the President of the United States, Office of Management and Budget. These SIC codes are assigned to both U.S. and non-U.S. companies according to the type of business in which they are engaged. A company may have up to eight SIC codes assigned to it or as little as one depending on the number of business segments that make up the company's revenue. If a sales breakdown for segments is available SIC Code 1 would represent the business segment which provided the most revenue. SIC Code 8 would represent the

Alphabetical List of Field Definitions - S
Issue 6
© Thomson Financial 2003-2007 455 Confidential Information of Thomson Financial
segment that provided the least revenue. If a sales breakdown is not available the SIC Code is assigned according to the best judgement of Worldscope.
Staff Costs Supplementary (Expense) Data, Annual Item; Field 01084
All Industries: STAFF COSTS represents wages paid to employees and officers of the company. It includes but is not restricted to:
All employee benefits such as health insurance and contributions to pension plans Footnotes:
A. No standard text
State And Municipal Securities Asset Data, Annual Item; Field 02207
Banks: STATE AND MUNICIPAL SECURITIES represents the purchase of securities that would create a loan to a state and/or a municipal government. These bonds are usually long term. Most of these bonds are exempt from federal taxes on interest. It includes but is not restricted to:
General obligation bonds Revenue bonds Industrial revenue bonds Mortgage revenue bonds Municipal bonds Municipal notes State/municipal securities available for sale (field 18089)
State/Municipal Securities Available For Sale Supplementary (Asset) Data, Annual Item; Field 18089
Banks: STATE/MUNICIPAL SECURITIES AVAILABLE FOR SALE represent the amount of state/municipal securities that cannot be classified as either investment securities or trading account securities.
Reporting required by U.S. FASB 115. Updated where available in 1993 and subsequent years. It includes but is not restricted to:
General obligation bonds Revenue bonds Industrial revenue bonds Mortgage revenue bonds Municipal bonds Municipal notes
Footnotes: A. No standard text

Alphabetical List of Field Definitions - S
Issue 6
© Thomson Financial 2003-2007 456 Confidential Information of Thomson Financial
Stock Exchange(s) Listed Stock Data, Current Item; Field 05427
All Industries: STOCK EXCHANGE(S) LISTED represents the stock exchange(s) the company is traded on. For companies with more than one type of common/ordinary share, the stock exchange shown is for the share type identified in field 6005-Type of Share. This variable is alphanumeric, and 80 bytes in length. Each byte from left to right corresponds to an exchange in this list from the top down. An "X" in a given byte indicates that the company is traded on that exchange.
This item is also available at the security level.
BYTE ABBREVIATION EXCHANGE 1 NYSE New York 2 BSE Boston 3 CIN Cincinnati 4 SHG Shanghai 5 MSE Midwest 6 PBW Philadelphia, Baltimore,
Washington 7 PCS Pacific 8 NAS NASDAQ 9 ASE American 10 MON Montreal 11 TOR Toronto 12 AMS Amsterdam 13 BCN Barcelona 14 BRU Brussels 15 CPH Copenhagen 16 DUS Düsseldorf 17 FRA Frankfurt 18 GVA Geneva 19 HEL Helsinki 20 HKG Hong Kong 21 JNB Johannesburg 22 KUL Kuala Lumpur 23 LON London 24 MAD Madrid 25 MBE Melbourne 26 *** Not Used 27 MXK Mexico City 28 NZL New Zealand 29 OSA Osaka 30 OSL Oslo 31 PAR Paris 32 ISE Italian 33 SEO Seoul
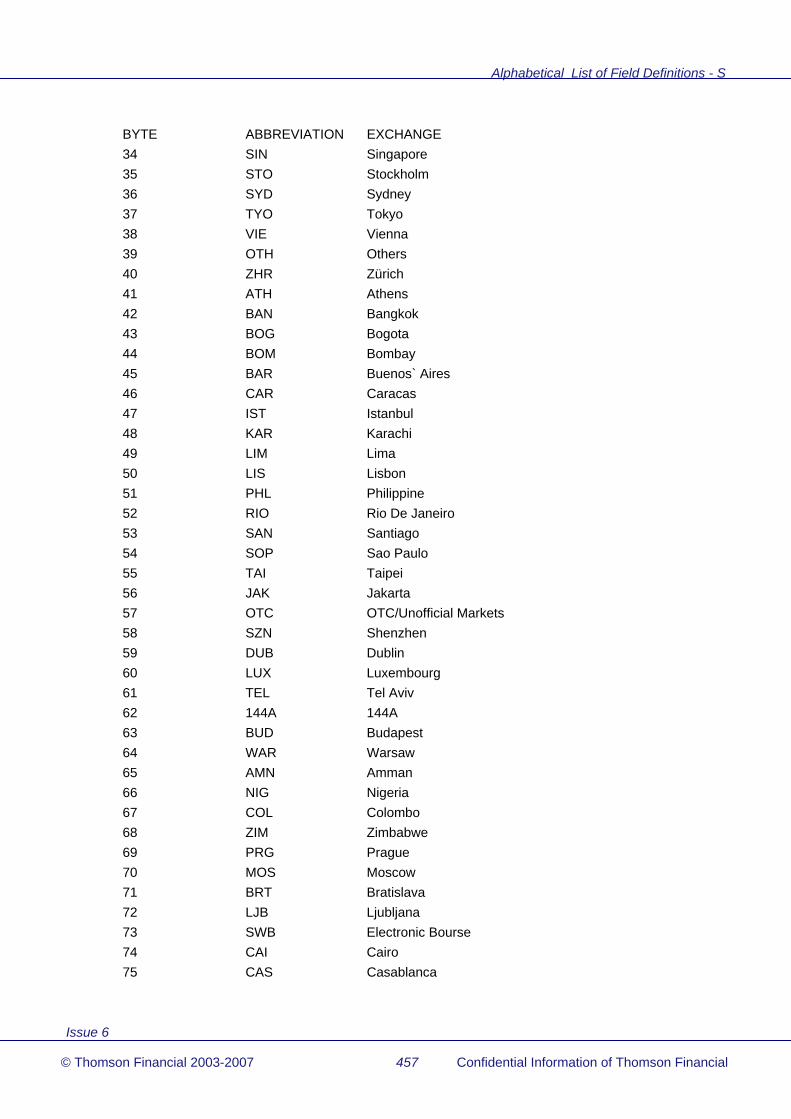
Alphabetical List of Field Definitions - S
Issue 6
© Thomson Financial 2003-2007 457 Confidential Information of Thomson Financial
BYTE ABBREVIATION EXCHANGE 34 SIN Singapore 35 STO Stockholm 36 SYD Sydney 37 TYO Tokyo 38 VIE Vienna 39 OTH Others 40 ZHR Zürich 41 ATH Athens 42 BAN Bangkok 43 BOG Bogota 44 BOM Bombay 45 BAR Buenos` Aires 46 CAR Caracas 47 IST Istanbul 48 KAR Karachi 49 LIM Lima 50 LIS Lisbon 51 PHL Philippine 52 RIO Rio De Janeiro 53 SAN Santiago 54 SOP Sao Paulo 55 TAI Taipei 56 JAK Jakarta 57 OTC OTC/Unofficial Markets 58 SZN Shenzhen 59 DUB Dublin 60 LUX Luxembourg 61 TEL Tel Aviv 62 144A 144A 63 BUD Budapest 64 WAR Warsaw 65 AMN Amman 66 NIG Nigeria 67 COL Colombo 68 ZIM Zimbabwe 69 PRG Prague 70 MOS Moscow 71 BRT Bratislava 72 LJB Ljubljana 73 SWB Electronic Bourse 74 CAI Cairo 75 CAS Casablanca

Alphabetical List of Field Definitions - S
Issue 6
© Thomson Financial 2003-2007 458 Confidential Information of Thomson Financial
BYTE ABBREVIATION EXCHANGE 76 ESQ EASDAQ 77 HAM Hamilton 78 VEN TSX Ventures 79 *** Not Used 80 LGO Lagos
Stock Exchange(s) Listed - Mult Share 1, 2, 3, 4, 5, 6, 7 Stock Data, Current Item; Fields 20009, 20109, 20209, 20309, 20409, 20509, 20609, respectively
All Industries: STOCK EXCHANGE(S) LISTED - MULT SHARE 1, 2, 3, 4, 5, 6, 7 represents the stock exchange(s) that each common/ordinary share of a company. See the definition of STOCK EXCHANGE(S) LISTED for more information about this field.
Stock Index Information Stock Data, Current Item; Field 05661
All Industries: STOCK INDEX INFORMATION represents the stock market indices the company is a constituent of. This variable is alphanumeric, and 80 bytes in length. Each byte, from left to right corresponds to an index in this list from the top down. An "X" in a given byte indicates that the company is included in that index.
BYTE INDEX COUNTRY 1 S&P 500 United States 2 DJ 65 Composite 3 FTSE World Index 4 *** Not Used *** 5 FT-SE 100 United Kingdom 6 Nikkei 225 Japan 7 S&P/TSX Composite Canada 8 All Ordinaries Australia 9 Austrian Traded Austria 10 BEL 20 Belgium 11 KFX Index Denmark 12 HEX 25 Finland 13 CAC 40 France 14 *** Not Used *** 15 Hang Seng Hong Kong 16 ISEQ Overall Index Ireland 17 MIB 30 Italy 18 KLSE Composite Malaysia 19 AEX All Share Netherlands 20 NZX 50 New Zealand 21 OBX 25 Norway 22 Strait Times Industrial Singapore

Alphabetical List of Field Definitions - S
Issue 6
© Thomson Financial 2003-2007 459 Confidential Information of Thomson Financial
BYTE INDEX COUNTRY 23 FTSE/JSE 40 South Africa 24 IBEX 35 Spain 25 OMX Sweden 26 Swiss Market Index Switzerland 27 All Share United Kingdom 28 MERVAL Argentina 29 BOVESPA Brazil 30 IPSA Chile 31 IGBC Index Colombia 32 FTSE/ASE.20 Greece 33 Mumbai Sensitive India 34 IGSG Index Indonesia 35 TOPIX Index Japan 36 LuxX Index Luxembourg 37 IPC (Bolsa) Index Mexico 38 KSE 100 Index Pakistan 39 IGBVL Index Peru 40 Philippine S.E. Composite
Index Philippines
41 PSI 20 Index Portugal 42 KOSPI Index South Korea 43 Taiwan Weighted Stock Index Taiwan 44 SET 50 Thailand 45 ISE National 100 Turkey 46 FT-SE Mid 250 United Kingdom 47 FT-SE Mid 350 United Kingdom 48 Caracas General Index Venezuela 49 DAX Germany 50 *** Not Used *** 51 *** Not Used *** 52 *** Not Used *** 53 SBF 250 France 54 DJ Global Index 55 DJ STOXX 56 DJ EURO STOXX 57 DJ STOXX 50 58 DJ EURO STOXX 50 59 HDAX Germany 60 SBF 120 France 61 TSE 60 Canada 62 WIG 20 Poland

Alphabetical List of Field Definitions - S
Issue 6
© Thomson Financial 2003-2007 460 Confidential Information of Thomson Financial
Stock Option Compensation Expense – Adjustment To Net Income, Net Of Tax Supplementary Data, Annual Item; Field 18322
All Industries: STOCK OPTION COMPENSATION EXPENSE – ADJUSTMENT TO NET INCOME, NET OF TAX represents the adjustments to Net Income for estimated fair value provision for stock option compensation, net of tax for companies that have not recognised the fair value of option compensation in the Income Statement.
This item is only available in the annual time series at the company level.
Stock Option Compensation Expense, Net Of Tax Supplementary Data, Annual Item; Field 18321
All Industries: STOCK OPTION COMPENSATION EXPENSE, NET OF TAX represents the provision for stock option compensation when reflected in the Income Statement. This would apply to the nominal charge recognised by some companies or the fair value provision for companies who have adopted US GAAP SFAS123 or other similar GAAP practices. If this item is not reported net of taxes, the relevant standard tax rate will be applied to the reported pre-tax amount.
This item is only available in the annual time series at the company level.
Stock Premium See CAPITAL SURPLUS
Stock Split/Dividend Ratio Stock Data, Annual Item; Field 05576
All Industries: STOCK SPLI/DIVIDEND RATIO reflects the reciprocal of subsequent years accumulated stock splits/stock dividends (i.e. 2:1 stock split in 1992 would result in a .5000 ratio for 1991) at the company’s fiscal year end for non-U.S. corporations and at the end of the last calendar year for U.S. corporations. It includes but is not restricted to:
Rights Issues Scrip Issues Capital Increases Reverse Splits
This item is also available at the security level for 1987 and subsequent years. See also Notes to DIVIDENDS PER SHARE
Stock Split/Dividend Ratio – Fiscal Stock Data, Annual Item; Field 05575
All Industries: STOCK SPLIT/DIVIDEND RATIO – FISCAL is the reciprocal of subsequent fiscal years accumulated stock splits/stock dividends (i.e. a 2:1 stock split in 1999 would result in a .5000 ratio in 1998).
This item is also available at the security level for 1987 and subsequent years. It includes but is not restricted to:
Rights Issues Scrip Issues Capital Increases
Alphabetical List of Field Definitions - S
Issue 6
© Thomson Financial 2003-2007 461 Confidential Information of Thomson Financial
Reverse Splits
Stocks (Current Assets) See INVENTORIES – TOTAL
Summary Data As Reported EPS - Basic: Current Year, Year Minus 1, Year Minus 2, Year Minus 3, Year Minus 4 Stock Data, Annual Items; Fields 19763, 19769, 19775, 19781, 19787, respectively
All Industries SUMMARY DATA AS REPORTED EPS – BASIC represents earnings based on average common shares as reported by the company in the summary table adjusted for subsequent stock splits.
This item is reported on a fiscal basis for both U.S. and non-U.S. companies and securities. If disclosed by the company, these items are also provided at the security level. These items are only available in the annual original time series and are not available for fiscal years prior to 31 March 2005. Summary Data As Reported EPS –Diluted: Current Year, Year Minus 1, Year Minus 2, Year Minus 3, Year Minus 4 Stock Data, Annual Items 19764, 19770, 19776, 19782, 19788, respectively
All Industries AS REPORTED EPS - DILUTED represents earnings based on average diluted shares as reported by the company in the summary table adjusted for subsequent stock splits.
This item is reported on a fiscal basis for both U.S. and non-U.S. companies and securities. If disclosed by the company, these items are also provided at the security level. These items are only available in the annual original time series and are not available for fiscal years prior to 31 March 2005. Summary Data As Reported Equity: Current Year, Year Minus 1, Year Minus 2, Year Minus 3, Year Minus 4 Shareholders Equity data, Annual Items 19765, 19771, 19777, 19783, 19789, respectively
All Industries SUMMARY DATA AS REPORTED EQUITY represents common and preferred shareholders’ investment in a company or common equity if that is what is disclosed by the company in the summary table.
These items are only available in the annual original time series and are not available for fiscal years prior to 31 March 2005. Summary Data As Reported Net Income: Current Year, Year Minus 1, Year Minus 2, Year Minus 3, Year Minus 4 Income Data, Annual Items 19762, 19768, 19774, 19780, 19786, respectively
All Industries SUMMARY DATA AS REPORTED NET INCOME represents bottom line net income as disclosed by the company in the summary table.
These items are only available in the annual original time series and are not available for fiscal years prior to 31 March 2005.

Alphabetical List of Field Definitions - S
Issue 6
© Thomson Financial 2003-2007 462 Confidential Information of Thomson Financial
Summary Data As Reported Revenue: Current Year, Year Minus 1, Year Minus 2, Year Minus 3, Year Minus 4 Income Data, Annual Items 19761, 19767, 19773, 19779, 19785, respectively
All Industries SUMMARY DATA AS REPORTED REVENUE represents gross sales and other operating revenue as disclosed by the company in the summary table. For Banks - Revenue represents the total Interest income and Non-Interest Income reported within the summary table For Insurance Companies – Revenue represents premiums earned, investment income and other operating income reported within the summary table For Financial Companies – Revenue represents the as reported revenue within the summary table
These items are only available in the annual original time series and are not available for fiscal years prior to 31 March 2005. Summary Data As Reported Year: Current Year, Year Minus 1, Year Minus 2, Year Minus 3, Year Minus 4 Stock Data, Annual Items; Fields 19760, 19766, 19772, 19778, 19784, respectively
All Industries: SUMMARY DATA AS REPORTED YEAR represents the four digit year that the summary data belongs to.
These items are only available in the annual original time series (time series code “A”) and are not available for fiscal years prior to 31 March 2005.

Issue 6
© Thomson Financial 2003-2007 463 Confidential Information of Thomson Financial
T Tangible Book Value Per Share Stock Data, Annual Item; Field 05486
All Industries: TANGIBLE BOOK VALUE PER SHARE represents the fiscal year end book value of a company excluding intangible other assets.
This item is shown per 1,000 shares for Brazilian companies and is generally not available prior to 1989.
Tangible Other Assets Asset Data, Annual Item; Field 02648
All Industries: TANGIBLE OTHER ASSETS represent other assets not delineated other than intangibles.
Data for this field is generally not available prior to 1989. It includes but is not restricted to:
Assets from discontinued operations Claims in litigation Franchises of a specific duration Advances to suppliers which are not part of fixed assets Tooling costs Licenses of a specific duration Exploration permits Import/Export permits Fuel Security supplies (U.K.) Inventories not utilized within 1 year (except film industry) Advance corporation tax (due after 1 year)
Footnotes: A. May include intangible assets and/or deferred charges B. No standard text
Tax Rate Profitability Ratio, Annual Item; Field 08346
All Industries: Income Taxes / Pre-tax Income * 100
Footnotes: A. No standard text B. No standard text C. No standard text D. No standard text F. Not computed G. Company is not a separate taxable entity for income tax purposes
Tax Rate - 5 Yr Avg Profitability Ratio, Annual Item; Field 08350
All Industries: Arithmetic average of the last five years of Tax Rates

Alphabetical List of Field Definitions - T
Issue 6
© Thomson Financial 2003-2007 464 Confidential Information of Thomson Financial
Taxation (Cash Flow) Supplementary (Cash Flow) Data, Annual Item; Field 04150
All Industries: TAXATION (CASH FLOW) represents the amount of income taxes paid as reported on the cash flow statement.
Data for this field is generally not available prior to 1992. Footnotes:
A. No standard text
Taxes Other Than Income Taxes Supplementary (Expense) Data, Annual Item; Field 01204
All Industries: TAXES OTHER THAN INCOME TAXES represent any other operating tax that is not a tax on income.
Data for this field is generally not available prior to 1993. It includes but is not restricted to:
Property Tax Taxes on production Import duties Ad Valorem taxes
It excludes: Excise taxes Windfall profits taxes Value added taxes General and service taxes Payroll Taxes
Footnotes: A. No standard text
Telex Number Descriptive Data, Current Item; Field 06032
All Industries: TELEX NUMBER represents the number used to transmit written messages electronically to the company via a teletype machine.
Ticker Symbol Stock Data, Current Item; Field 05601
All Industries: TICKER SYMBOL represents a symbol used to identify the company on the stock exchanges where it is listed. Local Ticker symbols are used for non-US corporations. Quick Code is used for Japanese companies.
This item is also available at the security level.

Alphabetical List of Field Definitions - T
Issue 6
© Thomson Financial 2003-2007 465 Confidential Information of Thomson Financial
Ticker Symbol - Mult Share 1, 2, 3, 4, 5, 6, 7 Descriptive Data, Current Item; Fields 20008, 20108, 20208, 20308, 20408, 20508, 20608, respectively
All Industries: TICKER SYMBOL - MULT SHARE 1, 2, 3, 4, 5, 6, 7 represents a symbol used to identify each type of common/ordinary share on the stock exchanges where it is listed. Local Ticker symbols are used for non-US corporations. Quick Code is used for Japanese companies. For companies with more than one type of common/ordinary shares, the ticker shown is for the share identified in field 06005 - Type of Share.
Tier 1 Capital Supplementary (Liability) Data, Annual Item; Field 18228
Banks: TIER 1 CAPITAL represents the primary capital supporting the lending and deposit activities of a bank.
Data for this field is generally not available prior to 1996 for non-U.S. companies and 1991 for U.S. companies. It includes but is not restricted to:
Common Stock Retained Earnings Perpetual preferred stock Goodwill acquired before March 1988
Footnotes: A. No standard text
Tier 2 Capital Supplementary (Liability) Data, Annual Item; Field 18229
Banks: TIER 2 CAPITAL represents the supplemental capital supporting the lending and deposit activities of a bank.
Data for this field is generally not available prior to 1996 for non-U.S. companies and 1991 for U.S. companies. It includes but is not restricted to:
Limited life preferred stock Subordinated debt Loan loss reserves
Footnotes: A. No standard text
Total Asset Turnover Asset Utilization Ratio, Annual Item; Field 08401
All Industries: Net Sales or Revenues / Total Assets
Banks: Net Sales or Revenues / (Total Assets - Customer Liabilities on Acceptances) Customer Liabilities on Acceptances only subtracted when included in Total Assets
Other Financial Companies: Net Sales or Revenues / (Total Assets - Custody Securities)

Alphabetical List of Field Definitions - T
Issue 6
© Thomson Financial 2003-2007 466 Confidential Information of Thomson Financial
Total Asset Turnover - 5 Yr Avg Asset Utilization Ratio, Annual Item; Field 08405
All Industries: Arithmetic average of the last five years Total Asset Turnover
Total Assets Asset Data, Annual Item; Field 02999
All Industries: TOTAL ASSETS represent the sum of total current assets, long term receivables, investment in unconsolidated subsidiaries, other investments, net property plant and equipment and other assets.
Banks: TOTAL ASSETS represent the sum of cash & due from banks, total investments, net loans, customer liability on acceptances (if included in total assets), investment in unconsolidated subsidiaries, real estate assets, net property, plant and equipment and other assets.
Insurance Companies: TOTAL ASSETS represent the sum of cash, total investments, premium balance receivables, investments in unconsolidated subsidiaries, net property, plant and equipment and other assets.
Other Financial Companies: TOTAL ASSETS represent the sum of cash & equivalents, receivables, securities inventory, custody securities, total investments, net loans, net property, plant and equipment, investments in unconsolidated subsidiaries and other assets.
Footnotes: B. Excludes contra items (contingent liabilities) C. Includes trust business assets D. Adjusted to exclude foreign currency translation gains/losses F. Adjusted to exclude provision for bad debt/loan losses G. Adjusted to exclude treasury stock H. Adjusted to exclude investment in own bonds I. Adjusted to exclude foreign currency translation losses and provision for bad debts J. Adjusted to excluded treasury stock and investment in own bonds K. Adjusted to excluded unappropriated net loss L. No standard text M. No standard text N. Increased by payments on work in progress that has been treated as a current liability O. Adjusted to exclude deferred taxes
Total Assets – GAAP Supplementary (Asset) Data, Annual Item; Field 06699
All Industries: TOTAL ASSETS – GAAP represents the sum Current Assets, Property, Plant and Equipment (Net), Investments, Loans, Goodwill, Other Intangibles and Other Assets of a non-U.S. company adjusted to conform to U.S. Generally Accepted Accounting Principles.
This item is presented in U.S. dollars (converted at the company's fiscal year end exchange rate). It is only available for ADRs trading on the NYSE, ASE or NASDAQ and is generally not available prior to 1994.

Alphabetical List of Field Definitions - T
Issue 6
© Thomson Financial 2003-2007 467 Confidential Information of Thomson Financial
Total Assets (U.S.$) Supplementary Data, Annual Item; field 07230
All Industries: TOTAL ASSETS (U.S.$) represent the total assets of the company converted to U.S. dollars using the fiscal year end exchange rate. See the definition for TOTAL ASSETS for information about the total assets used in this calculation.
Total Assets - 1 Yr Annual Growth Growth Rate, Annual Item; Field 08621
All Industries: (Current Year's Total Assets / Last Year's Total Assets - 1) * 100
Banks: ((Current Year's Total Assets - Current Year's Customer Liabilities on Acceptances) / (Last Year's Total Assets - Last Year's Customer Liabilities on Acceptance) - 1) * 100 Customer Liabilities on Acceptances only subtracted when included in Total Assets
Other Financial Companies: ((Current Year's Total Assets - Current Year's Custody Securities) / (Last Year's Total Assets - Last Year's Custody Securities) - 1) * 100
This calculation uses restated data for last years values where available
Total Assets - 5 Yr Annual Growth Growth Rate, annual Item; Field 08625
All Industries: ((Current Year's Total Assets / Total Assets six years ago, reduced to a compound annual rate) - 1) * 100
Banks: (((Current Year's Total Assets - Current Year's Customer Liabilities on Acceptances) / (Total Assets - Customer Liabilities on Acceptances six years ago), reduced to a compound annual rate) - 1) * 100 Customer Liabilities on Acceptances only subtracted when included in Total Assets.
Other Financial Companies: (((Current Year's Total Assets - Current Year's Custody Securities) / (Total Assets - Custody Securities six years ago), reduced to a compound annual rate) - 1) * 100
Total Assets – As Reported Supplementary (Asset) Data, Annual and Interim Item; Field 02300
All Industries: TOTAL ASSETS - AS REPORTED represents the reported sum of total current assets, long term receivables, investment in associated companies, other investments, net property plant and equipment and other assets as reported by the company.
This item is available in the annual and interim original and annual and interim restated time series. It is supported for detailed and limited companies and for all update types (fast, full and preliminary).
Total Assets/Common Equity Ratio Leverage Ratio, Annual Item; Field 08287
All Industries: This is the reciprocal of field 08241 Common Equity % Total Assets.

Alphabetical List of Field Definitions - T
Issue 6
© Thomson Financial 2003-2007 468 Confidential Information of Thomson Financial
See definition for Common Equity % Total Assets in the Worldscope Data Definition Guide for additional information.
Data for this field is only available for 1989 and subsequent years.
Total Capital Supplementary Data, Annual Item; Field 03998
All Industries: TOTAL CAPITAL represents the total investment in the company. It is the sum of common equity, preferred stock, minority interest, long-term debt, non-equity reserves and deferred tax liability in untaxed reserves. For insurance companies policyholders' equity is also included.
Total Capital % Total Assets Leverage Ratio, Annual Item; Field 15121
All Industries: Total Capital / Total Assets * 100
Banks: Total Capital / (Total Assets - Customer Liabilities on Acceptances) * 100 Customer Liabilities on Acceptances only subtracted when included in Total Assets
Other Financial Companies: Total Capital / (Total Assets - Custody Securities) * 100
Total Capital % Total Assets - 5 Yr Avg Other Ratio, Annual Item; Field 15124
All Industries: Arithmetic average of the last five years of Total Capital % Total Assets
Total Capital % Total Deposits Leverage Ratio, Annual Item; Field 15025
Banks: Total Capital / Deposits-Total * 100
Total Capital % Total Deposits - 5 Yr Avg Leverage Ratio, Annual Item; Field 15028
Banks: Arithmetic average of the last five years of Total Capital % Total Deposits
Total Debt Liability Data, Annual Item; Field 03255
All Industries: TOTAL DEBT represents all interest bearing and capitalized lease obligations. It is the sum of long and short term debt.

Alphabetical List of Field Definitions - T
Issue 6
© Thomson Financial 2003-2007 469 Confidential Information of Thomson Financial
Total Debt % Common Equity Leverage Ratio, Annual Item; Field 08231
All Industries: (Long Term Debt + Short Term Debt & Current Portion of Long Term Debt) / Common Equity * 100
Insurance Companies: If Common Equity is not available, Policyholders Equity is substituted
Total Debt % Common Equity - 5 Yr Avg Leverage Ratio, Annual Item; Field 08235
All Industries: Arithmetic average of the last five years of Total Debt % Common Equity
Total Debt % Total Assets Leverage Ratio, Annual Item; Field 08236
All Industries: (Short Term Debt & Current Portion of Long Term Debt + Long Term Debt) / Total Assets * 100
Banks: (Short Term Debt & Current Portion of Long Term Debt + Long Term Debt) / (Total Assets - Customer Liabilities on Acceptances) * 100 Customer Liabilities on Acceptances only subtracted when included in Total Assets
Other Financial Companies: (Short Term Debt & Current Portion of Long Term Debt + Long Term Debt) / (Total Assets - Custody Securities) * 100
Total Debt % Total Assets - 5 Yr Avg Leverage Ratio, Annual Item; Field 08240
All Industries: Arithmetic average of the last five years of Total Debt % Total Assets
Total Debt % Total Capital Leverage Ratio, Annual Item; Field 08221
All Industries: (Long Term Debt + Short Term Debt & Current Portion of Long Term Debt) / (Total Capital + Short Term Debt & Current Portion of Long Term Debt) * 100
Total Debt % Total Capital - 5 Yr Avg Leverage Ratio, Annual Item; Field 08225
All Industries: Arithmetic average of the last five years of Total Debt % Total Capital

Alphabetical List of Field Definitions - T
Issue 6
© Thomson Financial 2003-2007 470 Confidential Information of Thomson Financial
Total Deposits % Total Assets Leverage Ratio, Annual Item; Field 15037
Banks: Deposits-Total / (Total Assets - Customer Liabilities on Acceptances) * 100 Customer Liabilities on Acceptances only subtracted when included in Total Assets
Other Financial Companies: Deposits-Total / (Total Assets - Custody Securities) * 100
Total Deposits % Total Assets - 5 Yr Avg Leverage Ratio, Annual Item; Field 15040
Banks, Other Financial Companies: Arithmetic average of the last five years Total Deposits % Total Assets
Total Equity – GAAP Supplementary (Liability) Data, Annual Item; Field 06798
All Industries: TOTAL EQUITY – GAAP represents the sum of the preferred stock and common equity of a non-U.S. company adjusted to conform to U.S. Generally Accepted Accounting Principles.
This item is presented in U.S. dollars (converted at the company's fiscal year end exchange rate). It is only available for ADRs trading on the NYSE, ASE or NASDAQ and is generally not available prior to 1994.
Total Intangible Other Assets - Accumulated Amortization Asset Data, Annual and Interim Item; Field 02655
All Industries: TOTAL INTANGIBLE OTHER ASSETS – ACCUMULATED AMORTIZATION represent the total accumulated amortization of the other assets not having a physical existence. The value of these assets lies in their expected future return.
This item is available in the annual and interim original and annual and interim restated time series. It is supported for detailed and limited companies and for full and fast updates.
Total Intangible Other Assets – Gross Asset Data, Annual and Interim Item; Field 02654
All Industries: TOTAL INTANGIBLE OTHER ASSETS – GROSS represents the gross total other assets not having a physical existence. The value of these assets lies in their expected future return.
This item is available in the annual and interim original and annual and interim restated time series. It is supported for detailed and limited companies and for full and fast updates.
Total Intangible Other Assets – Net Asset Data, Annual Item; Field 02649
All Industries: INTANGIBLE OTHER ASSETS, NET (TOTAL) represent other assets not having a physical existence. The value of these assets lies in their expected future return.
Data for this field is generally not available prior to 1989. It includes but is not restricted to:

Alphabetical List of Field Definitions - T
Issue 6
© Thomson Financial 2003-2007 471 Confidential Information of Thomson Financial
Goodwill/Cost in excess of net assets purchased (field 18280) Patents Copyrights Trademarks Formulae Franchises of no specific duration Capitalized software development costs/Computer programs Organizational costs Customer lists Licenses of no specific duration Capitalized advertising cost Mastheads (newspapers) Capitalized servicing rights Purchased servicing rights
Footnotes: A. May include tangible assets and/or deferred charges
Total Interest Expense % Total Interest Bearing Liabilities Profitability Ratio, Annual Item; Field 15599
Banks: Interest Expense-Total / Average of Last Year’s and Current Year’s ( Short Term Debt and Current Portion of Long Term Debt + Long Term Debt + Deposits-Total) * 100
This calculation uses restated data for last years values where available
Total Interest Expense % Total Interest Bearing Liabilities 5 Yr Avg Profitability Ratio, Annual Item; Field 15602
Banks: Arithmetic average of the last five years of Total Interest Expense % Total Interest Bearing Liabilities
Total Interest Income % Earning Assets Profitability Ratio, Annual Item; Field 15605
Banks: Interest Income-Total / Average of Last Year’s and Current Year’s( Investments-Total + Loans-Net) * 100
This calculation uses restated data for last years values where available
Total Interest Income % Earning Assets - 5 Yr Avg Profitability Ratio, Annual Item; Field 15608
Banks: Arithmetic average of the last five years Total Interest Income % Earning Assets
Total Investment Return Stock Performance Ratio, Annual Item; Field 08801
All Industries: (Market Price Year End + Dividends Per Share + Special Dividend -Quarter 1 + Special Dividend-Quarter 2 + Special Dividend-Quarter 3 + Special Dividend-Quarter 4) / Last Year's Market Price-Year End - 1) *100
Alphabetical List of Field Definitions - T
Issue 6
© Thomson Financial 2003-2007 472 Confidential Information of Thomson Financial
This item is also available at the security level for 1987 and subsequent years.
Total Investment Return – 1 Month % Stock Performance Ratio, Monthly Time Series; Field 08807
All Industries: ((Current Month’s Close Price + Dividends Per Share (regular, extra and special) declared during the month) / Last Month’s Close Price) * 100
Data for this field is available for 1999 and subsequent years and is also available at the security level for 1999 and subsequent years.
Total Investment Return – 3 Month % Stock Performance Ratio, Monthly Time Series; Field 08808
All Industries: ((Current Month’s Close Price + Dividends Per Share (regular, extra and special) declared during the month) / Close Price three months ago) * 100
This item is also available at the security level for 1989 and subsequent years.
Total Investment Return – 3 Yr Annual Return % Stock Performance Ratio, Annual Item; Field 08803
All Industries: (Market Price-Year End + Dividends Per Share + Dividends Per Share-Special-Q1 + Dividends Per Share-Special-Q2 + Dividends Per Share-Special-Q3 + Dividends Per Share-Special-Q4) / Year Ago Market Price-Year End is calculated for each year in the last three years. The result of each year is multiplied together and the product is reduced to a compound annual rate.
Data for this field is available for 1989 subsequent years and is also available at the security level for 1989 and subsequent years.
Total Investment Return - 5 Yr Annual Return Stock Performance Ratio, Annual Item; Field 08805
All Industries: (Market Price + Dividends Per Share + Special Dividend-Quarter 1 + Special Dividend-Quarter 2 + Special Dividend-Quarter 3 + Special Dividend-Quarter 4) / Last Year's Market Price-Year End is calculated for each year in the last five years. The result of each year is multiplied together and the product is reduced to a compound annual rate.
This item is also available at the security level for 1987 and subsequent years.
Total Investments % Total Capital Other Ratio, Annual Item; Field 15580
Insurance Companies: Total Investments / Total Capital *100
Total Investments % Total Capital - 5 Yr Avg Other Ratio, Annual Item; Field 15583
Insurance Companies: Arithmetic average of the last five years of Total Investments % Total Capital

Alphabetical List of Field Definitions - T
Issue 6
© Thomson Financial 2003-2007 473 Confidential Information of Thomson Financial
Total Liabilities Liability Data, Annual Item; Field 03351
All Industries: TOTAL LIABILITIES represent all short and long term obligations expected to be satisfied by the company. It includes but is not restricted to:
Current Liabilities Long Term Debt Provision for Risk and Charges (non-U.S. corporations) Deferred taxes Deferred income Other liabilities Deferred tax liability in untaxed reserves (non-U.S. corporations) Unrealized gain/loss on marketable securities (insurance companies) Pension/Post retirement benefits Securities purchased under resale agreements (banks)
It excludes: Minority Interest Preferred stock equity Common stock equity Non-Equity reserves
Total Liabilities And Shareholders' Equity Liability Data, Annual Item; Field 03999
All Industries: TOTAL LIABILITIES AND SHAREHOLDERS' EQUITY represents the sum of total liabilities, minority interest, non-equity reserves, preferred stock and common equity.
Footnotes: B. Excludes contra items (contingent liabilities) C. Includes trust business assets
Total Loans % Total Assets Other Ratio, Annual Item; Field 15043
Banks: Loans-Total / (Total Assets - Customer Liabilities on Acceptances) *100 Customer Liabilities on Acceptances only subtracted when included in Total Assets
Other Financial Companies: Loans-Total / (Total Assets - Custody Securities) * 100
Total Loans % Total Assets - 5 Yr Avg Other Ratio, Annual Item; Field 15046
Banks, Other Financial Companies: Arithmetic average of the last five years of Total Loans % Total Assets

Alphabetical List of Field Definitions - T
Issue 6
© Thomson Financial 2003-2007 474 Confidential Information of Thomson Financial
Total Loans % Total Deposits Liquidity Ratio, Annual Item; Field 15049
Banks, Other Financial Companies: Loans-Total / Deposits-Total * 100
Total Loans % Total Deposits - 5 Yr Avg Liquidity Ratio, Annual Item; Field 15052
Banks, Other Financial Companies: Arithmetic average of the last five years of Total Loans % Total Deposits
Total Non-Performing Assets Supplementary (Asset) Data, Annual Item; Field 02287
Banks: TOTAL NON-PERFORMING ASSETS represent all assets which have been designated by the bank as having a status of non-performance.
Data for this field is generally not available prior to 1991. It includes but is not restricted to:
Non-accrual loans Reduced rate loans Renegotiated loans Loan past due 90 days or more Assets acquired in foreclosure Repossessed personal property
Total Other Cash Flow Cash Flow Data, Annual Item; Field 04151
Industrials, Other Financial Companies: OTHER CASH FLOW represents non-cash items included in funds from operations other than net income, depreciation, depletion and amortization, and deferred taxes. In cases where the start line reported by the company is other than net income some cash items may be included. It is comprised of the following items provided from 2004:
04052 Dividends 04053 Asset Disposal 04054 Discontinued Operations 04055 Minority Interest 04056 Equity In Earnings 04058 Unrealized Gains/Losses From Fair Value Adjustment Of Financial Assets 04057 Other Cash Flow
It excludes: Extraordinary items Changes in working capital
Footnotes: A. Includes discontinued operations
Alphabetical List of Field Definitions - T
Issue 6
© Thomson Financial 2003-2007 475 Confidential Information of Thomson Financial
Total Premiums Written Supplementary (Income) Data, Annual Item; Field 01004
Insurance Companies: TOTAL PREMIUMS WRITTEN represent the amounts charged to the policyholders for their insurance contracts.
Footnotes: A. Net of reinsurance ceded B. Net of reinsurance ceded and exclude life (long term) insurance operations. Results of life (long term)
insurance operations is accounted for in net other expense (income).
Total Securities Available For Sale Supplementary (Asset) Data, Annual Item; Field 18093
Banks: TOTAL SECURITIES AVAILABLE FOR SALE represents the total amount of securities available for sale. Reporting required by U.S. FASB 115. Updated where available in 1993 and subsequent years. It includes but is not restricted to:
Treasury securities available for sale Federal agency securities available for sale State/Municipal securities available for sale Mortgage backed securities available for sale Corporate stock available for sale Other securities available for sale
Footnotes: A. No standard text
Total Shareholders’ Equity Supplementary Data, Annual & Interim Item; Field 03995
All Industries: TOTAL SHAREHOLDERS’ EQUITY represents the sum of Preferred Stock and Common Shareholders’ Equity.
This item is available in the annual time series and the quarterly, semi-annual and trimester interim time series. It is only available at the company level.
Total Sources Cash Flow Data, Annual Item; Field 04501
All Industries: TOTAL SOURCES represent the total funds generated by the company internally and externally during the fiscal period.
Total Uses Cash Flow Data, Annual Item; Field 04811
All Industries: TOTAL USES represent the total funds used by the company for internal and external activities during the fiscal period.

Alphabetical List of Field Definitions - T
Issue 6
© Thomson Financial 2003-2007 476 Confidential Information of Thomson Financial
Trade Receivables - Net Supplementary (Asset) Data, Annual Item; Field 18297
All Industries: TRADE RECEIVABLES - NET represent claims against customers for merchandise sold or services performed in the ordinary course of business.
Data for this field is generally not available prior to 1992. Footnotes:
A. No standard text B. Gross trade receivables
Trading Account Income Income Data, Annual Item; Field 01017
Banks, Other Financial Companies: TRADING ACCOUNTS INCOME represents revenues received from the resale or purchase of investment securities. It includes but is not restricted to:
Revaluation adjustments Securities trading income
It excludes: Interest earned on trading account securities
Trading Account Securities Asset Data, Annual Item; Field 02208
Banks: TRADING ACCOUNT SECURITIES represent the aggregate value of the securities (government and others) purchased and/or underwritten by the bank. Trading account securities are usually purchased for profit rather than addition to the bank's investment portfolio. They are recorded at the price in effect when they were purchased or sold. It includes but is not restricted to:
Long positions at market value Deposits with stock exchanges, money brokers and others as collateral for stock borrowing Market debtors Client debtors Dealing assets
Trading Volume ($ Amount) Marketability Data, Annual Item; Field 08006
All Industries: Common Shares Traded-Annual * ((Market Price-High + Market Price-Low / 2) If High and Low Prices are not available, then Market Price - Year End is used.
This data is only available for U.S. & Canadian Companies. This item is also available at the security level for 1987 and subsequent years.

Alphabetical List of Field Definitions - T
Issue 6
© Thomson Financial 2003-2007 477 Confidential Information of Thomson Financial
Trading Volume (Weekly Average $ Amount) Marketability Data, Annual Item; Field 08010
All Industries: Trading Volume ($ Amount) / 52
This data is only available for U.S. & Canadian Companies. This item is also available at the security level for 1987 and subsequent years.
Trailing Twelve Months Cash Flow Per Share Stock Data, Annual Item; Field 18265
All Industries: TRAILING TWELVE MONTHS CASH FLOW PER SHARE represents the sum of the interim cash flow per share in the last twelve months.
This item is populated for the quarterly, semi-annual and trimester time series based on the availability of underlying data. It is not available prior to 1998 and is shown per 1,000 shares for Brazilian companies.
Trailing Twelve Months Dividends Per Share Stock Data; Annual Item; Field 18266
All Industries: TRAILING TWELVE MONTHS DIVIDENDS PER SHARE represents the regular dividends declared during the last twelve months. It is based on the “gross” dividend of a security, before withholding tax is deducted at a country’s basic rate, but excluding the special tax credit available in some countries. This tax credit is due to the imputation system of corporate income tax under which shareholders are entitled to credit a certain proportion of the corporate income tax on distributed profits against the income tax imposed on the dividends received. For companies with more than one type of common ordinary share, dividends per share are shown for the share type identified in field 06005 Type of Share.
This item is populated for the quarterly, semi-annual and trimester time series. It is not available prior to 1998 and is shown per 1,000 shares for Brazilian companies. It is also available at the security level for 1998 and subsequent years.
Trailing Twelve Months Earnings Per Share Stock Data, Annual Item; Field 18264
All Industries: TRAILING TWELVE MONTHS EARNINGS PER SHARE represent the sum of the interim earnings per share reported in the last twelve months.
This item is populated for the quarterly, semi-annual and trimester time series based on the availability of underlying data. It is not available prior to 1998 and is shown per 1,000 shares for Brazilian companies.
Trailing Twelve Months Gross Margin Profitability Ratio, Annual Item; Field 18267
All Industries: Trailing Twelve Months Gross Income / Trailing Twelve Months Net Sales/Revenue
This item is populated for the quarterly, semi-annual and trimester time series based on the availability of underlying data. It is not available prior to 1998.

Alphabetical List of Field Definitions - T
Issue 6
© Thomson Financial 2003-2007 478 Confidential Information of Thomson Financial
Trailing Twelve Months Income Taxes Supplementary (Expense) Data; Annual Item; Field 18270
All Industries: TRAILING TWELVE MONTHS INCOME TAXES represents the sum of the interim income taxes reported in the last twelve months.
This item is populated for the quarterly, semi-annual and trimester time series based on the availability of underlying data. It is not available prior to 1998.
Trailing Twelve Months Interest Expense Supplementary (Expense) Data; Annual Item; Field 18269
All Industries: TRAILING TWELVE MONTHS INTEREST EXPENSE represents the sum of the interim interest expense reported in the last twelve months, before the deduction of interest capitalized.
This item is populated for the quarterly, semi-annual and trimester time series based on the availability of underlying data. It is not available prior to 1998.
Trailing Twelve Months Net Margin Profitability Ratio, Annual Item; Field 18268
All Industries: Trailing Twelve Months Net Profit / Trailing Twelve Months Net Sales/Revenue
This item is populated for the quarterly, semi-annual and trimester time series based on the availability of underlying data. It is not available prior to 1998.
Trailing Twelve Months Net Profit Supplementary Income Statement Data, Annual Item; Field 18263
All Industries: TRAILING TWELVE MONTHS NET PROFIT represents the sum of the interim net profit reported in the last twelve months.
This item is populated for the quarterly, semi-annual and trimester time series based on the availability of underlying data. It is not available prior to 1998.
Trailing Twelve Months Net Profit (U.S. $) Supplementary (Income) Data; Annual Item; Field 07260
All Industries: TRAILING TWELVE MONTHS NET PROFIT represents the sum of the interim net profit reported in the last twelve months.
This item is populated for the quarterly, semi-annual and trimester time series based on the availability of underlying data. It is not available prior to 1998.
Trailing Twelve Months Net Sales/Revenue Supplementary Income Statement Data, Annual Item; Field 18262
All Industries: TRAILING TWELVE MONTHS NET SALES/REVENUE represent the sum of the interim net sales/revenue reported in the last twelve months.
This item is populated for the quarterly, semi-annual and trimester time series based on the availability of underlying data. It is not available prior to 1998.

Alphabetical List of Field Definitions - T
Issue 6
© Thomson Financial 2003-2007 479 Confidential Information of Thomson Financial
Trailing Twelve Months Net Sales/Revenue (U.S. $) Supplementary (Income) Data; Annual Item; Field 07270
All Industries: TRAILING TWELVE MONTHS NET SALES/REVENUE represent the sum of the interim net sales/revenue reported in the last twelve months.
This item is populated for the quarterly, semi-annual and trimester time series based on the availability of underlying data. It is not available prior to 1998.
Trailing Twelve Months Operating Margin Profitability Ratio, Historic Item, Interim Time Series; Field 18306
All Industries: Trailing Twelve Months Operating Profit / Trailing Twelve Months Net Sales/Revenue * 100
This item is populated for the quarterly, semi-annual and trimester time series based on the availability of underlying data. It is not available prior to 1998.
Trailing Twelve Months Operating Profit Supplementary Income Statement Data, Historic Data, Interim Time Series; Field 18305
All Industries: TRAILING TWELVE MONTHS OPERATING PROFIT represents the sum of the interim operating profit reported in the last twelve months.
This item is populated for the quarterly, semi-annual and trimester time series based on the availability of underlying data. It is not available prior to 1998.
Trailing Twelve Months Pre-tax Income Supplementary (Income); Annual Item; Field 18271
All Industries: TRAILING TWELVE MONTHS PRE-TAX INCOME represents the sum of the interim pre-tax income reported in the last twelve months.
This item is populated for the quarterly, semi-annual and trimester time series based on the availability of underlying data. It is not available prior to 1998
Trailing Twelve Months Pre-tax Margin Profitability Ratio, Historic Item, Interim Time Series; Field 18304
All Industries: Trailing Twelve Months Pre-tax Income / Trailing Twelve Months Net Sales/Revenue * 100
This item is populated for the quarterly, semi-annual and trimester time series based on the availability of underlying data. It is not available prior to 1998.
Transportation Equipment Asset Data, Annual Item; Field 18380
Industrials, Other Financial Companies: TRANSPORTATION EQUIPMENT represents the cars, ships, planes or any other type of transportation equipment that is part of the company's property, plant and equipment.
Data for this field is generally not available prior to 1992. It excludes:
Transportation equipment leased to others

Alphabetical List of Field Definitions - T
Issue 6
© Thomson Financial 2003-2007 480 Confidential Information of Thomson Financial
Footnotes: A. No standard text C. Net of depreciation D. Includes other
Treasury Securities Supplementary (Asset) Data, Annual Item; Field 02205
Banks, Other Financial Companies: TREASURY SECURITIES represents the purchase of securities which would create a loan made directly to the government. These are negotiable debt obligations of the government and are secured by its "full faith and credit". They are issued at various schedules and rates. It includes but is not restricted to:
Treasury Bills Treasury Notes Treasury Bonds Treasury Securities Available for Sale (field 18087)
Footnotes: A. Includes federal agency securities
Treasury Securities Available For Sale Supplementary (Asset) Data, Annual Item; Field 18087
Banks: TREASURY SECURITIES AVAILABLE FOR SALE represent the amount of treasury securities that cannot be classified as either investment or trading account securities. Reporting required by U.S. FASB 115. Updated where available in 1993 and subsequent years. It includes but is not restricted to:
Treasury bills Treasury notes Treasury bonds Securities of, or guaranteed by the government Government securities Other government's treasury bills Special treasury bills Ordinary treasury bills
Footnotes: A. Include federal agency securities B. No standard text
Treasury Shares Stock Data, Annual Item; Field 05303
All Industries: TREASURY SHARES represent the number of common shares reacquired by the company.
Data for this field is generally not available prior to 1993.
Alphabetical List of Field Definitions - T
Issue 6
© Thomson Financial 2003-2007 481 Confidential Information of Thomson Financial
Treasury Stock Shareholders' Equity Data, Annual Item; Field 03499
All Industries: TREASURY STOCK represents the acquisition cost of shares held by the company. For non-U.S. companies treasury stock may be carried at par value. This stock is not entitled to dividends, has no voting rights and does not share in the profits in the event of liquidation.
Data for this field is generally not available prior to 1989.
Trust Income Income Data, Annual Item; Field 01014
Banks, Other Financial Companies: TRUST INCOME represents income derived from services rendered in a fiduciary capacity. It includes but is not restricted to:
Trust department fees Asset management fees Investment fees
Trusts & Fiduciary Income/Commission & Fees Income Data, Annual Item; Field 01019
Banks, Other Financial Companies: TRUSTS & FIDUCIARY INCOME/COMMISSION & FEES represent income received from asset management. It includes but is not restricted to:
Trust department fees Asset management fees Investment fees Checking account fees Other loan servicing fees Service charges on deposit accounts Business service fees Processing service fees Credit card fees Commission/fees for banking and related services
Footnotes: A. Net of provisions B. Other operating income is not delineated C. Includes commission from foreign exchanges D. Net of expenses F. Net of expenses including taxes
Turnover See NET SALES OR REVENUES
Turnover Rate Marketability Ratio, Annual Item; Field 08011
All Industries: (Trading Volume ($ Amount) / Market Capitalization) * 100

Alphabetical List of Field Definitions - T
Issue 6
© Thomson Financial 2003-2007 482 Confidential Information of Thomson Financial
This data is only available for U.S. & Canadian Companies. This item is also available at the security level for 1987 and subsequent years.
Type Of Share Descriptive Data, Current Item; Field 06005
All Industries: TYPE OF SHARE represents the name of the security whose prices and dividends are shown with the fundamental data of the company. This item is provided for all share types at the security level. The share names are generally shown in the language of the country in which the company is domiciled.
Type Of Share - Mult Share 1, 2, 3, 4, 5, 6, 7 Descriptive Data, Current Items; Fields 20001, 20101, 20201, 20301, 20401, 20501, 20601, respectively
All Industries: TYPE OF SHARE - MULT SHARE 1, 2, 3, 4, 5, 6, 7 represents the name of the security for each type of common/ordinary share of a company. The share names are generally shown in the language of the country in which the company is domiciled.

Issue 6
© Thomson Financial 2003-2007 483 Confidential Information of Thomson Financial
U Unappropriated (Free) Reserves Shareholders' Equity Data, Annual Item; Field 03494
All Industries: UNAPPROPRIATED RESERVES represent free reserves that are not identified for a specific purpose by the company.
Data for this field is generally not available prior to 1989. Footnotes:
A. No standard text B. No standard text
Unconsolidated/Parent Company Depreciation, Depletion & Amortization Supplementary Data, Annual Item; Field 18169
All Industries: UNCONSOLIDATED /PARENT COMPANY DEPRECIATION, DEPLETION & AMORTIZATION represents the process of allocating the cost of a depreciable asset to the accounting periods covered during its expected useful life to the unconsolidated/parent company's business. It is a non-cash charge for use and obsolescence.
Data for this field is generally not available prior to 1995. Footnotes:
A. No standard text
Unconsolidated/Parent Company's Earnings Per Share Supplementary Data, Annual Item; Field 18173
All Industries: UNCONSOLIDATED/PARENT COMPANY'S EARNINGS PER SHARE represent the unconsolidated company's earnings per share.
Data for this field is generally not available prior to 1994. Footnotes:
AA. Earning per share after full tax B. Includes or excludes extraordinary charge or credit D. No standard text F. Period includes strike G. Includes the effects of a change in accounting policies or tax laws M. Calculation based on year end outstanding shares O. No standard text P. Based on common and common equivalent shares Q. Based on fully diluted shares S. No standard text U. Based on average shares outstanding V. No standard text W. No standard text X. Estimated based on standard tax basis Z. Earnings per share estimated using net income after preferred dividends divided by the year end shares
outstanding or the latest shares available

Alphabetical List of Field Definitions - U
Issue 6
© Thomson Financial 2003-2007 484 Confidential Information of Thomson Financial
Unconsolidated/Parent Company's Net Profit Supplementary Data, Annual Item; Field 18172
All Industries: UNCONSOLIDATED/PARENT COMPANY'S NET PROFIT represents the unconsolidated/parent company's net income before extraordinary items and preferred and common dividends, but after operating and non-operating income and expenses, income taxes, minority interest and equity in earnings.
Data in this field is generally not available prior to 1994. Footnotes:
A. Net income is before the effect of minority interest B. No standard text C. Before capital contribution and state guarantees by government or interest on same D. Profit before appropriations and tax F. Profit before tax G. Taxes and other expenses cannot be separated H. Changed reporting practice to exclude the effect of allocations to untaxed reserves J. Net income accounted for in the insurance reserve fund K. Policyholders' equity cannot be separated L. Before provision for loan losses which cannot be separated from equity reserves
Unconsolidated/Parent Company's Pre-tax Income Supplementary Data, Annual Item; Field 18171
All Industries: UNCONSOLIDATED/PARENT COMPANY'S PRE-TAX INCOME represents all the income/loss of the unconsolidated/parent company before any federal, state or local taxes. It consists of revenue minus total expenses, both operating and non-operating.
Data for this field is generally not available prior to 1994. Footnotes:
A. Net of income tax B. No standard text
Unconsolidated/Parent Company Sales Supplementary Data, Annual Item; Field 18170
All Industries: UNCONSOLIDATED/PARENT COMPANY SALES represent the parent/unconsolidated company's gross sales and other operating revenue less discounts, returns and allowances.
Data for this field is generally not available prior to 1994. It excludes:
Excise taxes Windfall profit taxes Value added taxes General and service taxes
Footnotes: A. Gross total sales or revenue AA. Length of fiscal period is 18 months AB. Length of fiscal period is 15 months AC. Length of fiscal period is 9 months AD. Length of fiscal period is 6 months AF. Length of fiscal period is 5 months AG. Length of fiscal period is 13 months

Alphabetical List of Field Definitions - U
Issue 6
© Thomson Financial 2003-2007 485 Confidential Information of Thomson Financial
AH. Length of fiscal period is 14 months AI. Length of fiscal period is 7 months AJ. Length of fiscal period is 8 months AK. Length of fiscal period is 48 weeks AL. Length of fiscal period is 3 months AM. Length of fiscal period is 11 months AN. Length of fiscal period is 53 weeks AP. Length of fiscal period is 16 months AQ. Length of fiscal period is 10 months AR. Length of fiscal period is 20 months AS. Length of fiscal period is 2 months AT. Length of fiscal period is 17 months AU. Length of fiscal period is 4 months AV. Length of fiscal period is 21 months AX. Length of fiscal period is 22 month B. Net sales includes value added, excise, windfall profit or sales tax BA. Major accounting standards switch BB. Change from unconsolidated to consolidated reports BC. Major reorganization BD. Change from domestic consolidation to worldwide consolidation BE. Major accounting standards switch and major reorganization BF. Change from domestic consolidation to domestic consolidation and one other country BG. Change from domestic consolidation and one other country to worldwide consolidation BH. Change from worldwide consultation to domestic consolidation BI. Major accounting standards switch and change from domestic consolidation to worldwide consolidation BJ. Change from domestic consolidation to unconsolidated reports BK. Includes investment income BL. Change from worldwide consolidation to unconsolidated reports BN. Major reorganization. Changes in perimeter of consolidation BP. Change in accounting method for domestic companies from full consolidation to equity method BQ. Substantial changes in forms of financial statements BS. Company's financial statements are based on INPC (National Consumer Price Index). Prior data is not
comparable BT. Based on monetary adjusted statements C. Includes deferred profit on installment sales D. Includes inter company sales (non-U.S. corporations only) F. Combined interim reports for the periods G. Limited income statement given H. Includes services, but no sales are disclosed I. Value added, excise, windfall profit or sales tax has been subtracted along with an undeterminable
amount of other taxes which could not be separated J. Includes only main component L. No standard text M. Includes equity in pre-tax income which cannot be separated N. No standard text P. Not balancing with components of income due to lack of disclosure of each operating item Q. Revenue attributable to the banking business is not disclosed R. Net of interest expenses S. Net of operating expenses T. Net of expenses U. No standard text V. No standard text W. Includes other income Y. Net of expenses and tax Z. Holding company
Alphabetical List of Field Definitions - U
Issue 6
© Thomson Financial 2003-2007 486 Confidential Information of Thomson Financial
Underwriting Expense Supplementary (Expense) Data, Annual Item; Field 01081
Insurance Companies: UNDERWRITING EXPENSE represents any expense associated with writing the insurance policy. It includes policy acquisition costs and premium reimbursement. This amount is included in selling, general and administrative expenses.
Footnotes: A. All or part of general expenses are included
Unearned Income Asset Data, Annual Item; Field 02274
Banks: UNEARNED INCOME represents the earnings on loans which is not generated by interest charges.
Data for this field is generally not available prior to 1990. It includes but is not restricted to:
Fees on Loans Mortgage points Unearned interest Late charges
Unearned Premiums Liability Data, Annual Item; Field 03010
Insurance Companies: UNEARNED PREMIUMS represent premiums on policies written but not yet earned.
Footnotes: A. Includes some other insurance reserves
Unearned Premiums % Total Capital Other Ratio, Annual Item; Field 15133
Insurance Companies: Unearned Premiums / Average of Last Year’s and Current Year’s Total Capital * 100
This calculation uses restated data for last years values where available
Unearned Premiums % Total Capital - 5 Yr Avg Other Ratio, Annual Item; Field 15136
Insurance Companies: Arithmetic average of the last five years Unearned Premium % Total Capital
Unfunded Pension Liabilities Supplementary (Liability) Data; Annual Item; Field 18352
All Industries: UNFUNDED PENSION LIABILITIES result from the failure to provide adequate funds to cover the pension plan. The failure by the employer to fund the pension plan will result in a deferred pension credit.
Data for this field is generally not available prior to 1992.

Alphabetical List of Field Definitions - U
Issue 6
© Thomson Financial 2003-2007 487 Confidential Information of Thomson Financial
Footnotes: A. No standard text
Unrealized Foreign Exchange Gain/Loss Liability Data, Annual Item; Field 03497
All Industries: UNREALIZED FOREIGN EXCHANGE GAIN/LOSS represents the gains and losses from the translation of foreign currency. These amounts are not recognized as part of the current income but will be realized when the foreign entity is sold or liquidated. It is shown as part of shareholders' equity and is based on the current rate of exchange.
Unrealized Gain/Loss from Fair Value Adjustment of Financial Assets Supplementary (Cash Flow) Data, Annual and U.S. interim Item; Field 04058
All Industries: UNREALIZED GAIN/LOSS FROM FAIR VALUE ADJUSTMENT OF FINANCIAL ASSETS represent the non cash adjustment for unrealized gains or losses from changes in the fair value of financial assets recognized in the income statement. This data is a component of Total Other Cash Flow (field 04151).
This item is available in the annual original and annual restated time series for detailed companies, full update.. For U.S. companies it is also available in the interim original and interim restated time series.
Unrealized Gain/Loss On Marketable Securities Shareholders' Equity Data, Annual Item; Field 03498
All Industries: UNREALIZED GAIN/LOSS ON MARKETABLE SECURITIES represents the investment gain or loss from securities held by the company. It is included in common equity for industrials, banks and other financials. It is excluded from common equity and included in Other Liabilities for insurance companies.
Data for this field is generally not available prior to 1989.
Unspecified Deposits Liability Data, Annual Item; Field 03018
Banks: UNSPECIFIED DEPOSITS represent deposits not classified by the bank as being a demand, savings, time or foreign deposit. It includes but is not restricted to:
Public sector deposits (Spain) Promissory notes and bills (Spain) Other deposit accounts
Unspecified / Other Loans Asset Data, Annual Item; Field 02263
Banks: UNSPECIFIED/ OTHER LOANS represent loans included in total loans but not specified by the company as belonging to one of the following loan classifications.
1 Lease Financing 2 Consumer and Instalment Loans

Alphabetical List of Field Definitions - U
Issue 6
© Thomson Financial 2003-2007 488 Confidential Information of Thomson Financial
3 Real Estate Mortgage Loans 4 Foreign Loans 5 Broker and Financial Institution Loans 6 Interbank Loans 7 Commercial Loans
It includes but is not restricted to: Secured loans (Spain) Other loans

Issue 6
© Thomson Financial 2003-2007 489 Confidential Information of Thomson Financial
W Weighted Cost Of Debt Supplementary Data, Annual Item; Field 18231
All Industries: WEIGHTED COST OF DEBT represents the weighted average interest rate of the total fixed rate long term debt.
Data for this field is generally not available prior to 1996 for non-U.S. companies and 1991 for U.S. companies.
Work In Process Asset Data, Annual Item; Field 02098
All Industries: WORK IN PROCESS represents the inventory of products which are in various stages of production.
Data for this field is generally not available prior to 1989.
Working Capital Supplementary Data, Annual Item; Field 03151
All Industries: WORKING CAPITAL represents the difference between current assets and current liabilities. It is a measure of liquidity and solvency.
Working Capital Per Share Stock Data, Annual Item; Field 05506
All Industries: WORKING CAPITAL PER SHARE represents the difference between current assets and current liabilities divided by outstanding shares
This item is shown per 1,000 shares for Brazilian companies
Working Capital % Total Capital Leverage Ratio, Annual Item; Field 08271
All Industries: (Current Assets-Total - Current Liabilities-Total) / Total Capital * 100
Working Capital % Total Capital - 5 Yr Avg Leverage Ratio, Annual Item; Field 08275
All Industries: Arithmetic average of the last five years of Working Capital % Total Capital
Worldscope Identifier Descriptive Data, Current Item; Field 06035
All Industries: WORLDSCOPE IDENTIFIER represents the nine digit identifier used by Worldscope to identify companies/securities on the database.

Alphabetical List of Field Definitions - W
Issue 6
© Thomson Financial 2003-2007 490 Confidential Information of Thomson Financial
This item is also available at the security level. U.S. COMPANY IDENTIFIERS: The nine digit CUSIP is used.
Bytes 1-6 Six digit company identifier Bytes 7-8 Security identifier Byte 9 Check digit
U.S. SECURITY IDENTIFIERS: With the exception of the primary issue of the company the nine digit CUSIP assigned to the security is used. The primary issue is defined as the most widely traded security and the CUSIP assigned to this issue has already been used as the company identifier. For this reason, the security identifier for the primary issue is derived by using the first 6 digits of the company identifier followed by a "9" as the seventh digit, another number and a check digit. NON-U.S. COMPANY IDENTIFIERS: A derived identifier based on the country where the company is domiciled is used.
Byte 1: C Bytes 2-4: WORLDSCOPE country code Bytes 5-8: Four digit unique company identifier Byte 9: 0
NON-U.S. SECURITY IDENTIFIERS: A derived identifier based on the country where the company is domiciled is used. This identifier is identical to the company identifier except that the "0" at the end is replaced with a letter. COUNTRY AVERAGE IDENTIFIERS (Industrial Companies only):
Byte 1: A Bytes 2-4: WORLDSCOPE Country Code Bytes 5-9: filled with zeros
For example: A25000000 is the country average for France "A" identifies the record as an Average record "250" is the country code for France For the name of the country average see WORLDSCOPE field 06001 (Company Name) INDUSTRY AVERAGE IDENTIFIERS:
Byte 1: A Bytes 2-4: WORLDSCOPE Country Code Byte 5: 0 Bytes 6-9: WORLDSCOPE Industry Code
For example: A38004310 is the industry average for Italian Banks "A" identifies the record as an Average record "380" is the country code for Italy "4310" is the industry code for banks For the name of the industry average see WORLDSCOPE field 06001 (Company Name). INDEX IDENTIFIERS:
Byte 1: I Bytes 2-4: WORLDSCOPE Country Code Bytes 5-7: filled with zeros Byte 8: Number of the index Byte 9: 0
Alphabetical List of Field Definitions - W
Issue 6
© Thomson Financial 2003-2007 491 Confidential Information of Thomson Financial
For example: I25000010 indicates that the index values are for a French index. "I" identifies the record as an index record "250" is the country code for France EXCHANGE RATE IDENTIFIERS:
Byte 1: space Byte 2: E Byte 3: X Byte 4: C Byte 5: H Byte 6: space Bytes 7-9: WORLDSCOPE Country Code
For example: " EXCH 756" is the exchange rate identifier for Switzerland's exchange rate. "756" is the country code for Switzerland
Worldscope Identifier - Mult Share 1, 2, 3, 4, 5, 6, 7 Descriptive Data, Current Items; Fields 20003, 20103, 20203, 20303, 20403, 20503, 20603, respectively
All Industries: WORLDSCOPE IDENTIFIER - MULT SHARE 1, 2, 3, 4, 5, 6, 7 represents a nine digit code assigned by Worldscope for each type of common/ordinary share of a company. This identifier provides a link to the detailed information for each security.
See definition for WORLDSCOPE IDENTIFIER for information on how this identifier is derived.
Worldscope Permanent I.D. Descriptive Data, Current Items; Field 06105
All Industries: WORLDSCOPE PERMANENT I.D. represents a permanent identifier assigned to a company or security on the database. For non-US companies and securities, it is the Worldscope Identifier. For US companies and securities, it is derived using the same method used for non-US identifiers. These identifiers are based on the country where the company is domiciled and are derived as follows:
Byte 1: C Bytes 2-4: WORLDSCOPE country code Bytes 5-8: Four digit unique company identifier Byte 9: 0 for company identifiers; a letter for security identifiers
This item is also available at the security level.

Issue 6
© Thomson Financial 2003-2007 492 Confidential Information of Thomson Financial
Y Year Of Fast Update Descriptive Data, Current Item; Field 07013
All Industries: YEAR OF FAST UPDATE represents the year for which a subset of key financial data has been updated from the annual report.
Yield On Investment Profitability Ratio, Annual Item; Field 15513
Insurance Companies: Investment Income / Average of Last Year's and Current Year’s Investments-Total * 100
Yield On Investment - 5 Yr Avg Profitability Ratio, Annual Item; Field 15516
Insurance Companies: Arithmetic average of the last five years of Yield on Investment