wouter verbeke - marketics: adapted analytics for marketing applications
TRANSCRIPT

Prof. dr. ir. Wouter Verbeke
BaqMar – November 26th 2014
Marketics: Adapted Analytics for Marketing Applications

3-12-2014 pag. 2
Who?
• Professor of Business Informatics & Business Analytics– Faculty of Economic and Social Sciences and Solvay Business School, VU Brussels, Belgium– Associated with BUTO, MOBI, SMIT - iMinds– Business Analytics Team: 4 Ph.D. students
• Research topics: – Business Analytics: focus on business user requirements
• End use optimization: ROI, profit, … optimizing analytics• Comprehensibility• Justifiability• …
– Application driven research• Credit risk management• Customer relationship management• Demand forecasting• Fraud detection• …
– Network analytics

3-12-2014 pag. 3
Observation #1

3-12-2014 pag. 4
Observation #2

3-12-2014 pag. 5
Marketing analytics
Operations
Data
Decisionmaking
Evaluation

3-12-2014 pag. 6
• Correct evaluation
– Evaluation measure
Verbeke W., Dejaeger K., Martens D., Hur J., Baesens B., New Insights into Churn Prediction in the Telco Sector: a Profit Driven Data Mining Approach, European Journal of Operations Research, 218 (1), pp. 211–229, 2012

3-12-2014 pag. 7
• Customer churn and retention: dynamics within customer base
• Return of a retention campaign:
Π=𝑁𝛼{𝛽𝛾(𝐶𝐿𝑉−𝑐−𝛿)+ 𝛽(1−𝛾)(−𝑐)+(1−𝛽)(−𝑐−𝛿)}−𝐴
Optimizing return of retention campaigns
New customers
Outflow
Customerbase
(size N)
True would-be churners
(β)
Churners
False would-be churners
(1-β)
Inflow
Nα customers included in a retention campaign and offered an incentive (δ)
All retained
Fraction γretained
Fraction 1-γ not retained

3-12-2014 pag. 8
• The term β represents the ability of the model to identify would-be churners, and 𝛽 = 𝛽0𝜆(𝛼):
Π = 𝑁𝛼 [𝛾𝐶𝐿𝑉 + 𝛿(1 − 𝛾)]𝛽0𝜆(𝛼) − 𝛿 − 𝑐 − 𝐴
• The maximum profit measure is defined as:
MP = max𝛼(П)
• Managerial implications: 𝛼𝑜𝑝𝑡𝑖𝑚𝑎𝑙
• Benchmarking study: significant profit gains!

3-12-2014 pag. 9
• Correct evaluation
– Evaluation measure
– Evaluate campaign effect: control groups
3-12-2014 pag. 10
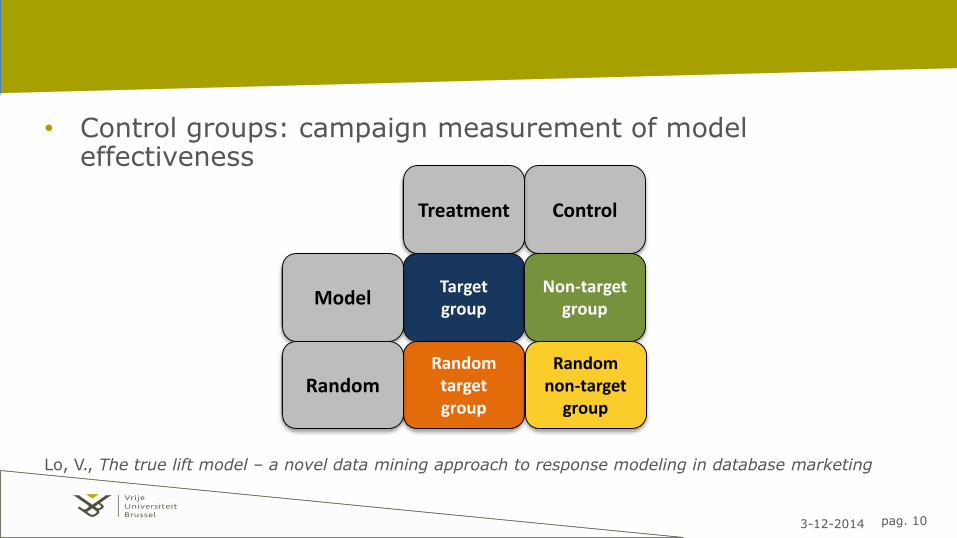
• Control groups: campaign measurement of model effectiveness
Lo, V., The true lift model – a novel data mining approach to response modeling in database marketing
ControlTreatment
Target group
Non-target group
Random target group
Random non-target
group
Model
Random

3-12-2014 pag. 11
Operations
Data
Decisionmaking
Evaluation
Evaluation data
3-12-2014 pag. 12
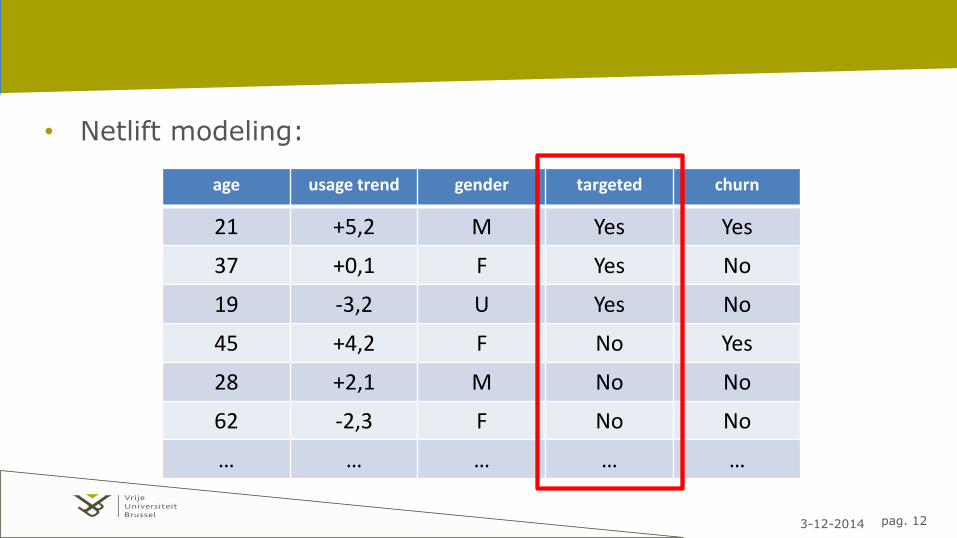
• Netlift modeling:
age usage trend gender targeted churn
21 +5,2 M Yes Yes
37 +0,1 F Yes No
19 -3,2 U Yes No
45 +4,2 F No Yes
28 +2,1 M No No
62 -2,3 F No No
… … … … …
3-12-2014 pag. 13
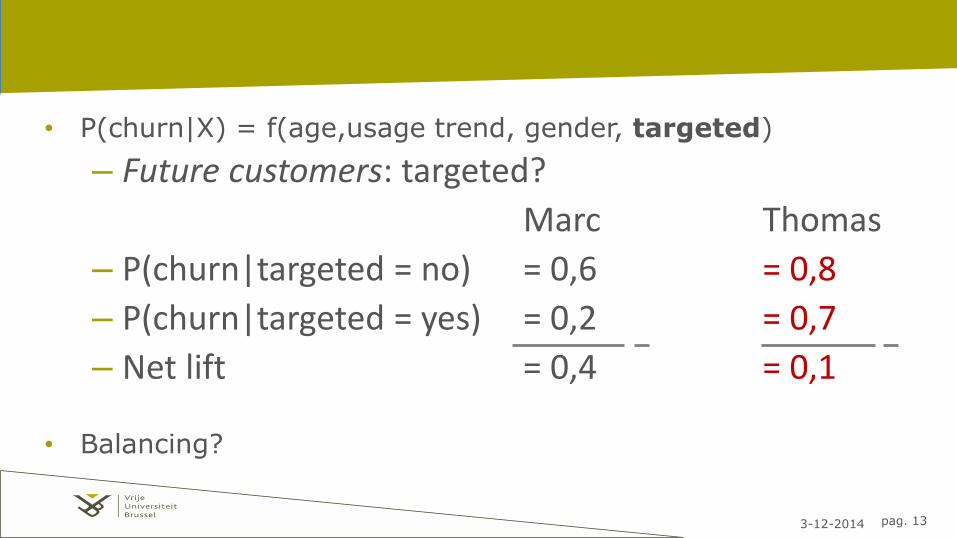
• P(churn|X) = f(age,usage trend, gender, targeted)
– Future customers: targeted?
Marc Thomas
– P(churn|targeted = no) = 0,6 = 0,8
– P(churn|targeted = yes) = 0,2 = 0,7
– Net lift = 0,4 = 0,1
• Balancing?

3-12-2014 pag. 14
Data
Decisionmaking
Evaluation
Evaluation data
Test beds
Exp. data
OperationsImproveddecisionmaking

3-12-2014 pag. 15
Go further

3-12-2014 pag. 16
Go further

3-12-2014 pag. 17
Go further
• Objective function = evaluation criterion?
– Cost-sensitive learning• At the class level: cost of misidentification
• At the individual level
– Customer lifetime value
– Balancing

3-12-2014 pag. 18
Go further
Christakis, Nicholas; Fowler, James H. - Dynamic Spread of Happiness in a Large Social Network: Longitudinal Analysis Over 20 Years in the Framingham Heart Study (http://dash.harvard.edu/handle/1/3685822)

3-12-2014 pag. 19
Social network analytics
• Social network analysis for customer churn prediction
– Featurization, propositionalization, …
– Network analytics:• Predictive
– Relational learning
– Viral approaches
– Graph based
• Descriptive
– Centrality measures
– Link, node, degree distributions
Verbeke W., Martens D., Baesens B., Social network analysis for customer churn prediction, Applied Soft Computing, 14, pp. 431-446, 2014

3-12-2014 pag. 20
Social network effects?

3-12-2014 pag. 21
Relational learning
181806208300809 32462208699 206105300897975 357014032645640 I 32461002530 9 MOBISTAR MOBILE 99 21JAN2010:23:45:44 0 0 0 0 2 1 1 …
195455641 32475611232 206102200262341 351913035725230 I 32476000005 10 Base SMSC Platform 99 21JAN2010:23:46:02 0 0 0 0 2 1 1 …
187097451101277 32465245451 206101100499483 356712034636630 I 32473161616 8 Proximus SMSC Platform 99 21JAN2010:23:45:44 0 0 0 0 2 1 1 …
RawCDRs
2121
8 9 4 38 7 2 39 7 24 3 23 2 9
32
3 32 3 8
9 8
ABCDEFGHIJ
A B C D E F G H I J
Sparseconnectivity
matrix
C
A D
E
BF
J
I
H
G
Weightednetwork
89
4
3
2
3
3
3
22
98
7

3-12-2014 pag. 22
Findings
• Predictive power?
• Featurization?
• Combine with traditional model?

3-12-2014 pag. 23
Go further
• Survival analysis
• Survival analysis …
… with netlift modeling
Thomas
Marc
Loyalty
Time
Marketing campaign #1
Loyalty
Time
Marc
Thomas
Marketing campaign #2

3-12-2014 pag. 24
What did we learn today?
• Checklist
– Evaluation
– Let’s test
– Bring in the next steps
– It’s the data, stupid!
– Parallel models
– Towards real-time customer tracking

3-12-2014 pag. 25
Q&A
www.wverbeke.net