wp 2001 -2 portfolio selection criteria of elton, gruber
TRANSCRIPT

WP 2001-2
Mean variance efficient portfolios by linear programming: A review of some portfolio selection criteria of Elton, Gruber and Padberg
af
Bjarne Astrup Jensen
INSTITUT FOR FINANSIERING, Handelshøjskolen i København Solbjerg Plads 3, 2000 Frederiksberg C
tlf.: 38 15 36 15 fax: 38 15 36 00
DEPARTMENT OF FINANCE, Copenhagen Business School Solbjerg Plads 3, DK - 2000 Frederiksberg C, Denmark
Phone (+45)38153615, Fax (+45)38153600 www.cbs.dk/departments/finance
ISBN 87-90705-47-5 ISSN 0903-0352
brought to you by COREView metadata, citation and similar papers at core.ac.uk
provided by OpenArchive@CBS

Mean variance eÆcient portfolios
by linear programming:
A review of some portfolio selection
criteria of Elton, Gruber and Padberg
Bjarne Astrup Jensen�
Department of Finance
Copenhagen Business School
Solbjerg Plads, A5.04
DK-2000 Frb., Denmark
Phone: +45 3815 3614 Fax: +45 3815 3600
e-mail:�[email protected]
JEL Classi�cation: G11
This version:
2nd February 2001
�I thank Chris Blake, Anders Damgaard, Martin Gruber and participants at the French Finance
Association's Annual Meeting in Aix-en-Provence for helpful comments on earlier versions of the paper.
Part of this research was carried out while the author enjoyed the hospitality of CEREG, Universit�e de
Paris IX, Dauphine, as \chercheur invit�e". Financial support from the Danish Social Science Research
Council is gratefully acknowledged.

Abstract: Finding the mean-variance eÆcient frontier is
a quadratic programming problem with an analytical solu-
tion, whenever the portfolio choice is unrestricted. The an-
alytical solution involves an inversion of the covariance ma-
trix. When short-sale constraints are added to the problem
it is usually thought of as adding considerable complexity
to the quadratic programming problem. This paper shows
that such problems can be handled by a simple linear pro-
gramming procedure, which allows for multiple changes of
basis variables. We show how some classical selection cri-
teria from models with particular covariance matrices fall
into this framework. Furthermore, adding linear constraints
like maximum placement limits for subsets of assets is easily
incorporated.
Keywords: Mean variance eÆcient portfolios, short sale
constraints, linear programming, multiple basis shifts, place-
ment limits.

1 Introduction
Finding the mean-variance eÆcient frontier is a quadratic programming problem with an ana-
lytical solution, whenever the portfolio choice is unrestricted. The analytical solution involves
an inversion of the covariance matrix. When short-sale constraints are added to the problem it
is usually thought of as adding considerable complexity to the quadratic programming problem.
The purpose of this paper is to show that the problem of �nding the mean-variance eÆcient
frontier with short-sale constraints can be solved as a linear programming problem. Furthermore,
due to the speci�c structure of the problem, it allows for multiple basis changes during the course
of running the simplex algorithm. Although powerful quadratic programming algorithms { and,
similarly, general constrained optimization algorithms { exist for solving such problems they
usually do not exploit any special structure of the portfolio problem. This paper provides an
algorithm that is straightforward to implement by anyone with a basic knowledge of the simplex
algorithm and computer programming.
The motivation behind this study derives from a rereading of a number of papers from the late
1970'ties by Elton, Gruber and Padberg,1 where computationally simple routines for �nding
mean-variance eÆcient portfolios are outlined for a number of special cases. These routines
were particularly well suited to solve the case with short sale constraints that was otherwise
perceived as being computationally burdensome, and for the simpler cases their calculations
were reduced to a \back of an envelope" level of complexity. These routines have since then
been an integrated part of the widely used textbook by Elton and Gruber.2
The exposition { in the original papers as well as in the textbook { is based on elaborately
writing out the �rst order conditions as linear equations and then trying to show the correctness
of a postulated solution. While this works relatively smooth in the \one-dimensional" cases,
called the \single index model" and the \constant correlation model", the exact implementation
is not spelled out explicitly for any of the \multi-dimensional" cases discussed under headlines
such as "multi-index models" or \multi-group models". In Elton, Gruber, and Padberg (1977),
e.g., it is stated (p. 336) that \.. The following seems to us to be an eÆcient method. ..", but
no convergence proofs actually exist.3
In this paper we show that the problem of �nding the tangency portfolio under short sale
constraints, which was the original problem to which computationally simple solutions were
sought, �ts into the framework ofWolfe's quadratic simplex algorithm as a rather simple example.
That is, a convergent LP-algorithm with computationally simple steps always exists as one way
of solving the problem. The simplicity of the LP-solution is enhanced by the fact that the
structure of the problem allows for multiple changes of basis variables in each step.
For the particular cases discussed in the above-mentioned papers we show that the simplici-
ty of the solutions originally proposed derive from the same simple matrix inversion lemma.
Additionally we present an alternative proof, based on linear programming, of the optimal-
ity of the \cut-o� procedure" originally described in the \one-dimensional" cases. The same
methodology only applies to the \multi-dimensional" cases under a certain reinterpretation, but
the LP-algorithm keeps track of included and excluded assets in a systematic way under all
circumstances.
1The references in question are Elton, Gruber, and Padberg (1976), Elton, Gruber, and Padberg (1977), Elton,
Gruber, and Padberg (1978a), Elton, Gruber, and Padberg (1978b), Elton, Gruber, and Padberg (1979).2See Elton and Gruber (1995), chapters 7-9. The computational routines are outlined in some detail in an
appendix to chapter 9.3Gruber (1997).
2

An additional application of the LP-algorithm is to trace out the entire eÆcient frontier with
short-sale constraints by varying the value of the risk-free rate of interest as a parameter. Per-
forming sensitivity analysis on the solution provides the answer to the composition of the eÆcient
portfolios as well as the location of the critical points along the frontier, where the set of in-
cluded assets changes. That is, the entire eÆcient frontier can be traced out by solving one
linear programming problem and subsequently perform a standard sensitivity analysis.
We also demonstrate that adding a number of additional linear restrictions to the problem does
not destroy the simplicity of the LP-algorithm. Such linear restrictions are typically portfolio
allocation limits like \maximum 40% of assets within a speci�c group" or \no individual asset
may make up more than 20% of the entire portfolio value". It is important, however, that the
mean-variance eÆcient set is continuous and concave, which is the case when such additional
constraints are linear. Problems with cardinality constraints or constraints of a binary character,
as described in e.g. Beasley et al. (2000), may lead to discontinuties and/or non-cancavity of
the set of feasible portfolio allocations. Such problems cannot be handled by the LP-algorithm
developed in this paper.
The paper is organised as follows.
In section 2 we introduce the notation and the well-known mathematical programming problem
of �nding the tangency portfolio. It is shown how the problem of �nding the tangency portfolio
can be formulated as a linear programming problem with a certain restriction attached to it. In
the Appendix we provide a separate proof of convergence of this LP-algorithm.
In section 3 the matrix inversion lemma is stated and applied to the special covariance matrices
employed.
In section 4 the problem of computing the eÆcient frontier, when returns are described by the
\single index model", is formulated as a linear programming problem and as the premier example
of a one-dimensional model. It is shown how the procedure developed by Elton, Gruber, and
Padberg (1976) for solving this problem, relying on a ranking by the Treynor ratios, can be
derived from a pivoting scheme which guarantees that once an asset is included in the basis it
will never leave the basis again.
In section 5 it is shown that the so-called \constant correlation model" has a reduced form
that is equivalent to one particular example of the single index model. Additionally, a simple
numerical example with 3 assets satisfying the constant correlation model is presented.
In section 6 the \multi-group model" is put into the linear programming framework. It is
shown how the pivoting scheme also for this multi-dimensional model is in accordance with
the originally developed ranking device. However, the linear programming routine enables the
establishment of an order in which to change assets in the portfolio that is computationally simple
and guarantees convergence. The numerical example in Elton, Gruber, and Padberg (1977) is
used for illustration.
In section 7 the \multi-index model" is outlined. Like any model with any covariance matrix
the multi-index model �ts into the linear programming framework, but in its general form the
multi-index model does not give rise to a ranking procedure that generates an algorithmic short-
cut. However, reinterpreting the model by assuming that a market portfolio with no residual
risk exists the model becomes mathematically equivalent to the multi-group model. Details of
the solution are spelled out in the Appendix.
Finally, in section 8 we show that the LP-algorithm can easily be generalised to handle linear
constraints like e.g. maximum placement limits.
3

2 The portfolio selection problem
In the standard mean-variance portfolio selection model for N risky assets, the model input in
the presence of a riskless investment opportunity is
� the vector R 2 IRN of expected returns
� the covariance matrix 2 IRN� IRN
� a riskless rate of interest Rf
In addition to this notation we will use the symbol 1 for the vector of one's in IRN , i.e.
1t = (1; 1; : : : ; 1) (2.1)
It is well known that without short sale constraints any mean-variance eÆcient portfolio is a
portfolio of two assets:4 The riskless asset and one particular portfolio { the tangency portfolio
{ composed solely of risky assets. The composition of the tangency portfolio is derived in a
straightforward manner from the relevant �rst order condition:
Z = R�Rf1 (2.2)
by normalizing the vector Z to a portfolio, i.e. such that the sum of its components add up to
one. This calculation is also useful when there is no riskless asset, since Rf can be treated as a
free parameter. By varying Rf the entire eÆcient frontier for the case with no riskless asset can
be traced out.
In the case with short sale constraints the relevant �rst order conditions or Kuhn-Tucker condi-
tions are:
Z �M = R�Rf1 (2.3)
Zi;Mi � 0 i = 1; 2; � � � ; N (2.4)
ZiMi = 0 i = 1; 2; � � � ; N (2.5)
and the optimal portfolio is found by normalizing the vector Z. Again, any mean-variance
eÆcient portfolio is a portfolio of the riskless asset and one particular portfolio composed solely
of risky assets. The problem is that determining the composition of this portfolio involves
determining which assets to include and which assets to exclude due to short sale constraints.
As in the case with no constraints this calculation is also one way of tracing out the entire
mean-variance eÆcient frontier when there is no riskless asset.
The Lagrangian multipliers Mi can be interpreted as the additional risk premium necessary in
order for assets excluded by the short-sale constraint to be marginal investments with portfolio
weight Zi=0 in an optimal unconstrained solution.
The solution in both cases involves an inversion of or the appropriate subset of , either
directly or indirectly through solving a set of linear equations. The simpli�ed portfolio selection
procedures developed by Elton, Gruber and Padberg reduces the computational burden by
postulating special structures on .
4Besides the sources already refererred to by Elton, Gruber and Padberg, see Huang and Litzenberger (1988),
chapter 3, Merton (1972) or Roll (1977).
4

The case with short sale constraints turns out to be a linear programming problem. Hence, it
is computationally much easier than the general quadratic programming problem solved by one
of the available general methods for such problems. A solution to the Kuhn-Tucker conditions
(2.3)-(2.5) can be obtained as an optimal solution to the following problem:
MinNXp=1
Xp
subject to
Z �M +X = R�Rf1
Z,M , X � 0
Z �M = 0
(2.6)
This mathematical programming problem di�ers from a linear programming problem only by
the so-called exclusion rule Z�M=0. I.e. if Zi is in the basis, Mi must not enter the basis. And
vice versa.
It is known that by performing usual simplex iterations, according to what is known as Wolfe's
quadratic simplex algorithm, in order to decrease the value of the objective function to zero, the
enforcement of the exclusion rule as a restriction on the choice of the in-coming basis variable
does not prevent the LP-routine from reaching an optimal solution5. This is proven separately
in the Appendix, since for this particular case Wolfe's algorithm is notationally much simpler
than the general case and can be improved by allowing for multiple changes of basis.
Throughout, the set of indices corresponding to basis X-variables are identi�ed by the binary N -
vector 1x. The set of non-basis X-variables are identi�ed by the complimentary binary N -vector
1nx .
One initial and primal feasible basis solution is obvious: Select either Xi or Mi according to
whether Ri � Rf is positive or negative and set Z�0. With this choice of basis variables the
initial simplex tableau looks as follows:
X0 Z M X rhs
1 1tx �1tx �1tnx 1tx
�R�Rf1
�0 �I I R�Rf1
where the variable X0 is added in the conventional manner in order to represent the value of
the objective function.
When the algorithm stops the simplex tableau { after a suitable permutation of the variables {
looks like:
X0 Zb Mb Zn Mn X rhs
1 0t 0t 0t 0t �1t 0
0bb
nb
0
�I
bn
nn
�I
0
I 0
0 IR�Rf1
5The general structure of the algorithm is well described in e.g. Franklin (1980), pp. 177-187.
5

with b for basis-variables and n for non-basis variables. In inverted terms6 this can be written
as:
X0 Zb Mb Zn Mn X
1 0t 0t 0t 0t �1t
0I
0
0
�I
�1bb bn
nn �nb�1
bb bn
��1bb
nb�1
bb
�1bb 0
�nb�1
bb I
rhs
0
0@ �1bb 0
�nb�1
bb I
1A�R�Rf1�
At any intermediate step, the simplex tableau in original terms { after a suitable permutation
of the variables { looks like:
X0 Zb Zn M X rhs
1 0t 0t 0t �1t 0
0
bb
nb
bn
nn
�I 0
0 �I
I 0
0 IR�Rf1
In inverted terms � and with a slight abuse of the notation � this tableau becomes7:
X0 Zb Zn M
1 0t 1tx
hnn � nb
�1
bb bn
i1txnb
�1
bb �1tx
0I
0
�1bb bn
nn � nb�1
bb bn
��1bb 0
nb�1
bb �I
6The lower part of this matrix representation deviates from the standard simplex tableau. The rows are
multiplied by �1 for reasons to become clear below.7Again, the rows corresponding to non-basis variables X or, equivalently, the rows corresponding to basis
variables M , are multiplied by �1 relative to the standard simplex tableau.
6

X rhs
�1t � 1txnb
�1
bb �1tnx
1tx
hRx �Rf1x �nb
�1
bb
�Rb �Rf1b
�i�1bb 0
�nb�1
bb I
0B@ �1
bb 0
�nb�1
bb I
1CA�R�Rf1�
Observe that there is a one-to-one correspondance between basis (non-basis) variables Xi and
the corresponding non-basis (basis) variables Mi within the set of indices relating to non-basis
variables Zn.
The usual simplex algorithm with the exclusion rule added will look for a variable to enter, in
this case among Zn or Mn, with the prime purpose of having a variable among Xb leave the
basis and simultaneously maintaining primal feasibility. I.e. all basis variables must be kept
non-negative.
Observe that once an \arti�cial" variable Xj has left the basis, it can be omitted from further
consideration. This means that if the initial basis is chosen as described above, with Mj or
Xj included depending upon the sign of Ri�Rf , then the algorithm only needs to include
X-variables for assets with a positive risk premium Ri�Rf .
This can be implemented in the following manner, allowing for multiple changes of basis vari-
ables.
Theorem 1 The following algorithm converges to the optimal solution of the modi�ed linear
programming problem in (2.6):
1. Choose the initial basis as a combination of M� and X�variables in accordance with the
sign of the risk-premium.
2. Select a current non-basis variable Zi or Mi to enter as a new basis variable. The usual
criteria can be applied, i.e. looking for positive reduced cost coeÆcients, although the exclusion
rule must be obeyed.
3. Find the pivot element. If the entering variable is Zi, check whether the pivot element refers
to another Zb-variable. If so, perform the usual pivot operations. If not { and with reference
to the permutation above this is revealed the �rst time the usual pivot ratio in any row below
the Zb rows is encountered to be lower than among the Zb rows { do the following:
(a) If possible, �nd a row referring to a basis variable among Xb to perform the pivot
operation. This will maintain primal feasibility w.r.t. the variables Zb.
(b) If any basis variable Xj turns out to be negative, exclude Xj from basis and include Mj
instead. This will be in accordance with the exclusion rule since index j does not belong
to the set of indices for Zb-variables.
(c) If it is not possible to exclude an Xb-variable from the basis, exclude the appropriate
Mb-variable and continue in the usual manner.
(d) Once an X-variable has been omitted from the basis, exclude it from further considera-
tion.
7

4. Continue with the pivot operations in (2.) until all X-variables have been excluded.
Proof See the Appendix.
Step 3b amounts to multiple shifts of basis variables. When steps 3a-c can be performed it is
guaranteed that 1) a feasible solution is available and 2) the number of \arti�cial" X-variables
decreases by at least one, but most likely by more than one and 3) the exclusion rule is obeyed
at all points in time. Once all X-variables have been omitted from the basis the optimal solution
called for is obtained. However, it may be necessary to perform pivot operations of the form
\include one Zn-variable and exclude another Zb-variable". It depends upon the structure of
the problem how frequent { if at all { the algorithm will plunge into exploiting the possibility
of multiple change of basis variables.
The algorithm described is perfectly general, except that the phenomenon of cycling is not
discussed explicitly. We do not explicitly incorporate this in the description given above. It
is known to be an extremely rare phenomenon in general and methods exist to overcome this
problem.
In the following sections some special structure on the tableaus shown is established by postu-
lating some special structure on .
3 Special structure of the covariance matrix
Consider a N�N covariance matrix of the following form:
=D +B�Bt (3.1)
where
� D is a N�N diagonal covariance matrix representing \unsystematic risk"
� � is a K�K matrix representing the covariance matrix of the \systematic risk factors" and
� B is a N�K matrix of \factor loadings" bjk
This covariance structure arises from the following return generating processes for asset returns:
Rj = Rj +KXk=1
bkj�k + ej j = 1; 2; : : : ; N (3.2)
with the usual interpretation:
� Rj is the expected return on asset j
� bkj is the response of asset j to the k'th \systematic risk factor" �k
� ej is the \residual" or \unsystematic risk factor" of asset j.
8

By assumption the residual risk factors are mutually independent random variables and also
independent of the systematic risk factors. Note, however, that it is not possible from the
covariance matrix itself to give any economic interpretation of the speci�cation of the factors.
If matrix B is in accordance with the covariance structure, so is the matrix �B.
For the type of matrices in (3.1) the inverse is easily found8 by means of a more general matrix
inversion lemma.
Lemma 1 Let the N�N -matrix F be given as
F � G+HMHt (3.3)
where
� G is a symmetric N�N matrix
� M is a K�K matrix, K�N and
� H is a N�K matrix
Provided G as well as M are non-singular matrices the matrix F is also non-singular with the
inverse matrix
F�1 = G�1 �G�1H�M�1 +HtG�1H
��1HtG�1 (3.4)
Proof This can be proved by veri�cation in a straightforward manner. Multiply the candidate
given in (3.4) for the inverse with F and reduce the expressions.
Applying this matrix inversion lemma to the covariance matrix in (3.1) results in
�1 = D�1 �D�1B���1 +BtD�1B
��1BtD�1 (3.5)
Calculation of this inverse involves a trivial calculation of the inverse of a diagonal matrix D.
Furthermore, the covariance matrices � as well as ��1 +BtD�1B must be inverted. However,
the assumption behind and usefulness of the factor or APT speci�cation in (3.1) is that K<<N .
This means that the computational burden of inverting the N�N -matrix is reduced to that
of inverting a K�K-matrix. As a matter of fact this can be done with no direct inversion at all
in K simple steps, cf. Kwan (1984).
Solving the �rst order conditions (2.2) above for the unrestricted case we have
Z = �1(R�Rf1) =
D�1( R�Rf1 )�D�1B[��1 +BtD�1B ]�1BtD�1 (R�Rf1 ) (3.6)
or
Z =D�1( R�Rf1 )�D�1BC (3.7)
where C is the K-vector
C = [ ��1 +BtD�1B ]�1BtD�1( R�Rf1 ) (3.8)
The matrix inversion lemma applies to submatrices of as well, relevant for portfolios formed
from a subset of the entire menu of assets. In the next sections we will reconcile the reduced
form expressions for some standard cases found in the literature with our linear programming
approach.8We assume that no index portfolio exists so that the matrix D is singular.
9

4 The single index model
The single index model is a one factor model, speci�ed by the following assumption:9
Rj = �j + �jRm + ej ; ej?ei ; ej?Rm for i 6= j (4.1)
As a consequence of this assumption we have the relations
�2j = �2j �2m + �2ej (4.2)
�ij = �i�j�2m (4.3)
In terms of the notation of section 3 this can be written as
� � �2m; B � �; D � diag��2e1 ; �
2e2; : : : ; �2eN
�(4.4)
In this special case the optimal Z is given by �0 ��1, where
�0 =D�1 ( R�Rf1 ) =
0BBBBBBBB@
R1�Rf�2e1
R2�Rf�2e2...
RN�Rf�2eN
1CCCCCCCCA(4.5)
and
�1 =D�1�C (4.6)
As for C in (3.8) we have C=��t�0, where
�t�0 = �tD�1 ( R�Rf1 ) =
nXj=1
�j
�2ej� (Rj �Rf ) (4.7)
� ����1 + BtD�1B
��1
=1
1
�2m+ �tD�1�
=�2m
1 + �2m
NXj=1
�2j
�2ej
(4.8)
and
D�1� =��1=�
2e1; �2=�
2e2; : : : ; �N=�
2eN
�t(4.9)
That is,
Z =
0BBBBBBBB@
R1�Rf��1C
�2e1R2�Rf��2C
�2e2...
RN�Rf��NC
�2eN
1CCCCCCCCA(4.10)
9A less restrictive set of assumptions excludes the requirement ej?ei, and the model is called the market
model. See e.g. Elton and Gruber (1995), p. 152.
10

The same model with short sale constraints is a special case of the general model described
in section 2. If an asset h exists with �h = 0 the last term in the optimal value for Zh will
vanish and the only criterion for optimality is that Rh�Rf > 0. This is so because the row
and column corresponding to this variable will be proportional to the unit vector and una�ected
by any subsequent change of basis. Hence such assets should be chosen as members of the
initial basis, since they will remain with unchanged coeÆcients in all iterations. This means
that computationally they need not be dealt with at all, except for the normalization of Z.
For other assets, Elton, Gruber, and Padberg (1976) suggested that individual securities should
be \ranked" according to their \Treynor ratio", and that this ranking should be used to deter-
mine the sequence in which assets should be included in the optimal portfolio. The ranking by
the Treynor ratio works as follows:
� positive �-securities in decreasing order ofRi�Rf
�iand
� negative �-securities in increasing order ofRi�Rf
�i
Elton, Gruber, and Padberg (1976) demonstrated that while the coeÆcient C would change in
this process, their selection procedure based on the Treynor ratio would select securities one by
one, never omit an already included security and come to an end where the optimal portfolio is
composed of
� all positive �-securities with a Treynor ratio above the endogenously determined \cut-o�"
value of C would be included
� all negative �-securities with a Treynor ratio below the endogenously determined \cut-o�"
value of C would be included
Putting this into our linear programming framework the algorithm will stop exactly after a
number of iterations equal to the number of securities in the optimal portfolio. The original
algorithm is one special case of the linear programming routine where the sequence of in-coming
basis variables is chosen in a speci�c way without ever violating the exclusion rule. Assuming
this ordering of in-coming basis variables and looking away from zero-� assets it is certain that
a security that has entered into the basis at some iteration will never leave again. At the end the
Lagrangian multipliers for any excluded asset p can be read o� the tableau as Cb�p� (Rp�Rf ),
where subscript b refers to the actual set of basis variables { i.e. the securities in the optimal
portfolio { when the algorithm stops.
The details of these considerations are slightly tedious in terms of technical notation. Hence,
they are carried out in the Appendix.
5 The constant correlation model
In the constant correlation case the covariance matrix is
=
26666666664
�21 : : : ��1�j : : : ��1�N��2�1 �22 : : : : : : ��2�N...
.... . .
......
......
. . ....
...
��1�N ��2�N : : : : : : �2N
37777777775=
11

(1� �)
266666664
�21 0 : : : 0
0 �22 0 : : : 0...
.... . .
......
.... . .
...
0 0 : : : 0 �2N
377777775+ ���t (5.1)
where
�t = (�1; �2; : : : ; �N ) (5.2)
Provided 0<�<1 this model has a covariance structure that is mathematically equivalent to a
special case of the single index model with \unsystematic" risk (1 � �)�2j :10 It is convenient to
write this as fD � (1� �)D. Furthermore, � � � and � � �. Hence
�1 = fD�1 � fD�1� �1�+ �tfD�1���1 �tfD�1 (5.3)
By construction we notice the relation �tfD�1�= N1��
. With a little manipulation the solution
for the optimal Z in the case with no short sale constraints becomes
Zi =1
1� �
24Ri �Rf
�2i�
�
1� �+ �N
1
�2i�i
NXj=1
Rj �Rf
�j
35 =
1
(1� �)�i
24Ri �Rf
�i�
�
1� �+ �N
NXj=1
Rj �Rf
�j
35 (5.4)
The selection procedure in case of short sale constraints is simple in this case, since it falls into
the \only positive �-value" category. Hence rank securities by their \Sharpe ratio"Rj�Rf
�jand
include them sequentially until the \cut-o�"-value of Cb occurs. It is straightforward to see that
Cb has the form
Cb =�
1� �+ �k
kXj=1
Rj �Rf
�j(5.5)
Example 1
A simple example with 3 assets is shown here. The assets have the same standard deviation
(�i=1), and �=0:5. The Sharpe ratios, which are identical in this case to the excess expected
return, is given by the vector (10,4,2). Hence the assets are ordered according to a decreasing
Sharpe ratio.
The usual simplex routine goes through the following sequence of steps:
1. The initial basis is (X1;X2;X3) = (10; 4; 2), and the value of the objective function is 16.
2. The entering variable is chosen as Z1. The exiting variable is X3.
3. The new basis is (Z1;X1;X2) = (4; 6; 2), and the value of the objective function is 8.
10However, the \residuals" ei are not residuals, but total variances of individual assets. Hence the assumption
of orthogonality of the ei does not apply.
12

4. The entering variable is chosen as M3. The exiting variable is X2.
5. The new basis is (Z1;M3;X1) = (8; 2; 2), and the value of the objective function is 2.
6. The entering variable is chosen as M2. The exiting variable is X1.
7. The new basis is (M2;M3; Z1) = (1; 3; 10), and the value of the objective function is 0.
8. The algorithm is �nished. The cut-o� rate Cb is 5 in accordance with the Lagrangian multi-
pliers being 1 and 3, respectively.
X0 Z1 Z2 Z3 M1 M2 M3 X1 X2 X3 rhs
X0 1 2 2 2 �1 �1 �1 0 0 0 16
X1 0 1 1=2 1=2 �1 0 0 1 0 0 10
X2 0 1=2 1 1=2 0 �1 0 0 1 0 4
X3 0 1=2 1=2 1 0 0 �1 0 0 1 2
X0 1 0 0 �2 �1 �1 3 0 0 �4 8
X1 0 0 �1=2 �3=2 �1 0 2 1 0 �2 6
X2 0 0 1=2 �1=2 0 �1 1 0 1 �1 2
Z1 0 1 1 2 0 0 �2 0 0 2 4
X0 1 0 �3=2 �1=2 �1 2 0 0 �3 �1 2
X1 0 0 �3=2 �1=2 �1 2 0 1 �2 0 2
M3 0 0 1=2 �1=2 0 �1 1 0 1 �1 2
Z1 0 1 2 1 0 �2 0 0 2 0 8
X0 1 0 0 0 0 0 0 �1 �1 �1 0
M2 0 0 �3=4 �1=4 �1=2 1 0 1=2 �1 0 1
M3 0 0 �1=4 �3=4 �1=2 0 1 1=2 0 �1 3
Z1 0 1 1=2 1=2 �1 0 0 1 0 0 10
Table 1: Ordinary simplex iterations for numerical example 1
Example 2
Alternatively we show how to use the algorithm in theorem 1 and the possibility of multiple
basis shifts. Furthermore, by exploiting the ranking device for this example the need for pivoting
steps of the form \include one Zn-variable and exclude another Zb-variable" is eliminated. The
algorithm in theorem 1 goes through the following steps:
1. The initial basis is (X1;X2;X3) = (10; 4; 2), and the value of the objective function is 16.
2. The entering variable is chosen as Z1. The exiting variable is X1.
3. The new basis is (Z1;X2;X3) = (10;�1;�3), and the value of the objective function is -4.
4. Primal feasibility is re-established by exchanging (X2;X3)=(�1;�3) with (M2;M3)=(1; 3).
13

5. The algorithm is �nished. The cut-o� rate is 5 in accordance with the Lagrangian multipliers
being 1 and 3, respectively.
In step 2 the exiting variable is chosen as X1, since no Zb-variable will become negative by
excluding further search for a pivot element. However, the two other basis variables, X2 and X3
become negative. This is �xed in step 4 through a multiple basis shift.
X0 Z1 Z2 Z3 M1 M2 M3 X1 X2 X3 rhs
X0 1 2 2 2 �1 �1 �1 0 0 0 16
X1 0 1 1=2 1=2 �1 0 0 1 0 0 10
X2 0 1=2 1 1=2 0 �1 0 0 1 0 4
X3 0 1=2 1=2 1 0 0 �1 0 0 1 2
X0 1 0 5=4 5=4 1 �1 �1 �2 0 0 �4
Z1 0 1 1=2 1=2 �1 0 0 1 0 0 10
X2 0 0 3=4 1=4 1=2 �1 0 �1=2 1 0 �1
X3 0 0 1=4 3=4 1=2 0 �1 �1=2 0 1 �3
X0 1 0 0 0 0 0 0 �1 �1 �1 0
Z1 0 1 1=2 1=2 �1 0 0 1 0 0 10
M2 0 0 �3=4 �1=4 �1=2 1 0 1=2 �1 0 1
M3 0 0 �1=4 �3=4 �1=2 0 1 1=2 0 �1 3
Table 2: Ordinary simplex iterations for numerical example 2
Given these parameters there is only one asset in the optimal portfolio. Hence, no real tangency
occurs, since the slope of the restricted eÆcient frontier is too steep at the point representing
the �rst asset.
Performing a sensitivity analysis on the inputs reveals that when Rf is lowered by �, which
means \sliding" down the eÆcient frontier, the optimal values will change as follows:0B@ Z1
M2
M3
1CA =
0B@ 10 +�
1��=2
3��=2
1CAThis implies that the solution with Z1 alone will remain optimal until �=2. At that point Z2
enters and M2 leaves the basis.
When the basis variable M2 has been exchanged for Z2 the tableau looks as follows:
X0 Z1 Z2 Z3 M1 M2 M3 X1 X2 X3 rhs
X0 1 0 0 0 0 0 0 �1 �1 �1 0
Z1 0 1 0 1=3 �4=3 2=3 0 4=3 �2=3 0 12
M2 0 0 1 1=3 2=3 �4=3 0 �2=3 4=3 0 0
M3 0 0 0 �2=3 �1=3 �1=3 1 1=3 1=3 �1 2
Table 3: Change of basis for numerical example 2 after reaching �=2.
14

Moving further down the eÆcient frontier we observe that the basis variables { after resetting
� to 0 { change according to 0B@ Z1
Z2
M3
1CA =
0B@ 12
0
2
1CA+�
0B@2
3
2
3
�1
3
1CAWhen this new � attains the value 6 the third asset comes into play. After another resetting of
� to 0 the segment of the eÆcient frontier with all 3 assets have portfolio weights given by the
normalized vector 0B@ Z1
Z2
Z3
1CA =
0B@ 16
4
0
1CA+�
0B@1
2
1
2
1
2
1CAAs �!1 the portfolio will converge to the minimum variance portfolio (1/3,1/3,1/3).
In this manner the LP-tableau enables an easy calculation of the entire restricted mean-variance
eÆcient frontier once just one point has been located. This means that in order to trace out
the entire eÆcient frontier only one linear programming problem has to be solved, i.e. only one
point has to be solved for explicitly through an optimization problem. The rest follows by a
simple sensitivity analysis on the optimal tableau resulting from this optimization.
6 The multi-group model
The multi-group model is an extended version of the constant correlation case. Instead of one
correlation coeÆcient there is a number of groups, H, of securities within which the correlation
among any two securities is identical. Additionally the correlation between any two securities
in di�erent groups is a constant depending on the groups, but not on the individual securities.
The structure of the covariance matrix is shown in detail below. For notational reasons we treat
only the case with two groups. The �rst group has n1 securities and the second has n2 securities.
We will also use the notation N1 and N2 for the set of indices relating to the securities in group
no. 1 and group no. 2, respectively.
=
0B@I � diag
264�11; : : : ; �11| {z }n1 terms
; �22; : : : ; �22| {z }n2 terms
3751CA266666664
�21 0 : : : 0
0 �22 0 : : : 0...
.... . .
......
.... . .
...
0 0 : : : 0 �2N
377777775+B�Bt
� fD +B�Bt (6.1)
where
Bt =
"�1; : : : ; �n1 0; : : : ; 0
0; : : : ; 0 �n1+1; : : : ; �N
#(6.2)
� =
"�11 �12�21 �22
#(6.3)
15

The inverse of this covariance matrix is
�1 = fD�1 � fD�1B [ ��1 +BtfD�1B ]�1BtfD�1 � fD�1 � fD�1B�BtfD�1 (6.4)
In the same manner as in the previous section it can be shown that the matrix BtfD�1B has a
simple form. It is a diagonal matrix with k'th diagonal element nk1��kk
. And working backwards
in (6.4) we obtain
BtfD�1 �R�Rf1�= vec
0@Xi2Nk
Ri �Rf
�i(1� �kk)
1Ak=1;:::;K
(6.5)
For a security (=row) i 2 Nk we have
Ck �
��BtfD�1( R�Rf1 )
�k=
KXj=1
�kj
0@Xp2Nj
Rp �Rf
�p(1� �jj)
1A (6.6)
The optimal portfolio weight for a security i2Nk thus has the form
Zi =1
�i(1� �kk)
"Ri �Rf
�i�k
#� eti
fD�1 �R�Rf1�BC�
(6.7)
As mentioned previously the computational burden involved in �nding is modest, cf. the
sequential procedure given in Kwan (1984).
If the groups were uncorrelated, i.e. �kg=0 for k 6= g, the problem with short sale constraints
would be solved automatically. In that case � is a diagonal matrix and the elements �kk would
be immediately calculable. The critical values of C { or equivalently { according to the
procedure from the constant correlation model could then be determined within each group
separately. However, due to the structure of correlation among groups this cannot be done
sequentially.
A closer look at the structure of the simplex tableau at intermediate steps in the simplex
algorithm reveals that ranking by the Sharpe ratio { as in the constant correlation model {
is still a useful idea in the multi-group model. Whenever a particular asset in one group is
part of the optimal solution, any asset in the same group with better ranking is also part of
the optimal solution. Unfortunately, it is not possible to exclude the possibility { despite the
ranking { that a security entered into the basis at one point of the iterations will be forced to
leave at a later iteration because of the simultaneous changes at all coordinates of the \cut-o�
vector" . However, it is not likely to happen, but in particular cases it does when running the
simplex algorithm.11
Example 3
As a numerical example we perform the simplex iterations in our algorithm using the input
values from the example given in Elton, Gruber, and Padberg (1977). The original problem
had two groups with 8 and 7 assets, respectively. Given that the optimal portfolio has n1=3
and n2 = 1 we only include 4 assets in group 1 and 3 assets in group 2 in order to limit the
space requirement for representing the calculations. This implies that the tableaus below do not
11In Elton, Gruber, and Padberg (1977) an appendix outlines a straightforward way of updating the vector ,
when a number of securities are added or excluded in the portfolio. The simplex routine will automatically do
this in a simple manner.
16

demonstrate the amount of multiple basis changes that would take place if the entire menu of
assets had been present.
The input data to this example are:
� =
1
2
1
3
1
3
2
5
!�i = 1 8i (6.8)
and the Sharpe ratios like given on the r.h.s. in the tableau.
Given the composition of the optimal portfolio, i.e. n1 = 3 and n2 = 1, we can calculate the
matrix �:
� =
"��1 +
6 0
0 5
3
!#�1=
" 9
2�
15
4
�15
4
45
8
!+
6 0
0 5
3
!#�1=
"7
60
3
50
3
50
42
250
#(6.9)
Insert "Table 4"
Table 4: Change of basis for numerical example in Elton, Gruber, and Padberg (1977)
The vector is identical to the vector C in this example. We �nd C as follows:
C = �
48
40
3
!=
6:4
5:12
!(6.10)
This is in accordance with the �ndings in the last simplex tableau, where m4 = 0:4 and m6 =
0:62.12
7 Multi-index models
The single index model in section 4 is a special case of the more general multi-index or multi-
factor model. The return generating mechanism for asset j is assumed driven by
1. one \market factor" Rm, common to all securities and
2. one sector speci�c factor, Ih, common to all securities in a given sector h 2 f1; 2; : : : ;Hg.
3. The factors are mutually uncorrelated and also uncorrelated with Rm, and a given sector
speci�c factor will only contribute to \systematic risk" within that sector.
12Due to a miscalculation these numbers di�er from the ones found in Elton, Gruber, and Padberg (1977), who
used the correlation �22=2
5instead of 1� �22=
3
5in their calculation of �.
17
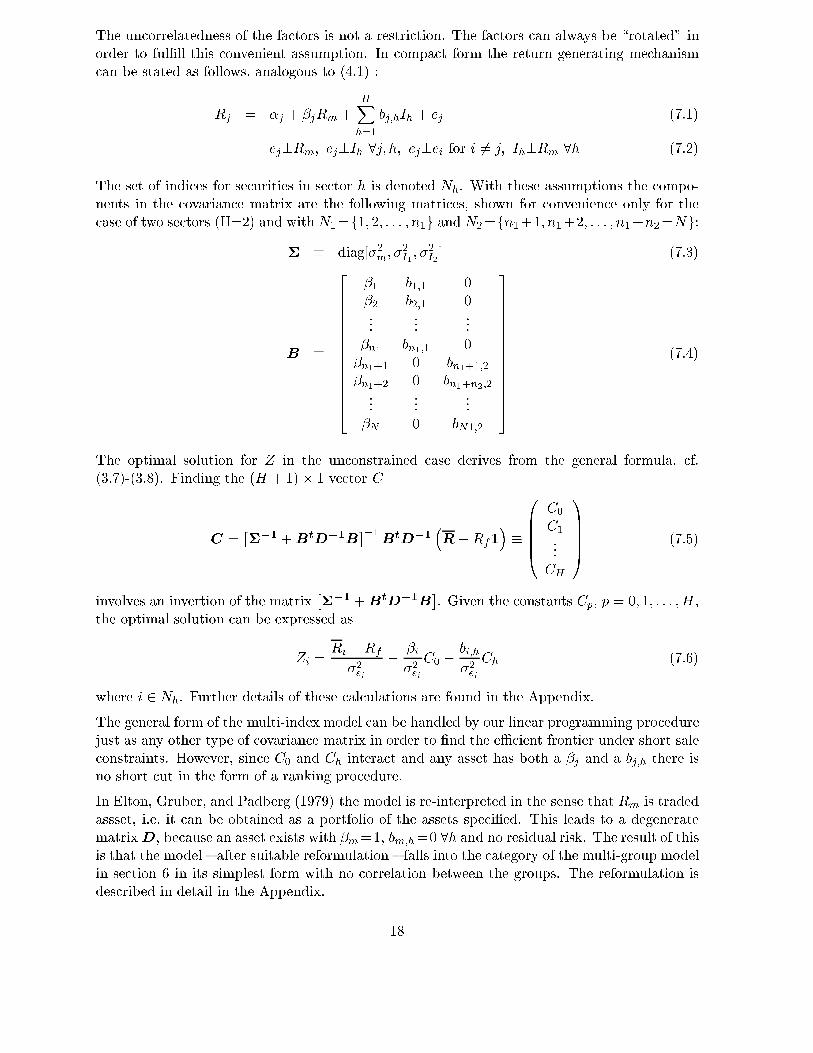
The uncorrelatedness of the factors is not a restriction. The factors can always be \rotated" in
order to ful�ll this convenient assumption. In compact form the return generating mechanism
can be stated as follows, analogous to (4.1) :
Rj = �j + �jRm +HXh=1
bj;hIh + ej (7.1)
ej?Rm; ej?Ih 8j; h; ej?ei for i 6= j; Ih?Rm 8h (7.2)
The set of indices for securities in sector h is denoted Nh. With these assumptions the compo-
nents in the covariance matrix are the following matrices, shown for convenience only for the
case of two sectors (H=2) and with N1=f1; 2; : : : ; n1g and N2=fn1+1; n1+2; : : : ; n1+n2=Ng:
� � diag[�2m; �2I1; �2I2 ] (7.3)
B �
2666666666666664
�1 b1;1 0
�2 b2;1 0...
......
�n1 bn1;1 0
�n1+1 0 bn1+1;2�n1+2 0 bn1+n2;2...
......
�N 0 bN1;2
3777777777777775(7.4)
The optimal solution for Z in the unconstrained case derives from the general formula, cf.
(3.7)-(3.8). Finding the (H + 1)� 1 vector C
C =���1 +BtD�1B
��1BtD�1
�R�Rf1
��
0BBBB@C0
C1
...
CH
1CCCCA (7.5)
involves an invertion of the matrix���1 +BtD�1B
�. Given the constants Cp, p = 0; 1; : : : ;H,
the optimal solution can be expressed as
Zi =Ri �Rf
�2ei�
�i
�2eiC0 �
bi;h
�2eiCh (7.6)
where i 2 Nh. Further details of these calculations are found in the Appendix.
The general form of the multi-index model can be handled by our linear programming procedure
just as any other type of covariance matrix in order to �nd the eÆcient frontier under short sale
constraints. However, since C0 and Ch interact and any asset has both a �j and a bj;h there is
no short cut in the form of a ranking procedure.
In Elton, Gruber, and Padberg (1979) the model is re-interpreted in the sense that Rm is traded
assset, i.e. it can be obtained as a portfolio of the assets speci�ed. This leads to a degenerate
matrixD, because an asset exists with �m=1, bm;h=0 8h and no residual risk. The result of this
is that the model { after suitable reformulation { falls into the category of the multi-group model
in section 6 in its simplest form with no correlation between the groups. The reformulation is
described in detail in the Appendix.
18

8 Including additional linear constraints
The linear programming algorithm is well suited to solve also problems with additional linear
constraints. Typical constraints of this type are placement restrictions, e.g. of the form \max-
imum 40% of assets within a speci�c group" or \no individual asset may make up more than
20% of the entire portfolio value".
Example 4
We demonstrate this by a simple example and state a generalisation of theorem 1. We add to
the above example 2 the following placement constraint:
\Assets no. 1 and 2 are not allowed to make up more than 50% of the entire portfolio value"
Solving for the Z-variables only determines the relative portfolio weights. To �nd the optimal
portfolio the solution found must be normalized. Hence, the placement constraint must be
formulated in relative terms as
Z1 + Z2 � 0:5(Z1 + Z2 + Z3) , 0:5Z1 + 0:5Z2 � 0:5Z3 +W = 0 (8.1)
where W �0 is an additional slack-variable.
De�ne the vector a by at� (0:5; 0:5;�0:5). Then the relevant �rst order conditions or Kuhn-
Tucker conditions in this case become:
Z �M + a� = R�Rf1 (8.2)
atZ +W = 0 (8.3)
Zi;Mi � 0 i = 1; 2; � � � ; N; W; � � 0 (8.4)
ZiMi = 0 i = 1; 2; � � � ; N; W� = 0 (8.5)
This is fully equivalent with the setup in the former cases with no placement constraints. The
same algorithm, making certain that W and � are not simultaneously in the basis, will solve
this problem. For reasons of space limitations we only record the �nal simplex tableau, but the
steps in the algorithm are as follows:
1. The initial basis is (X1;X2;X3;W ) = (10; 4; 2; 0), and the value of the objective function is
16.
2. The entering variable is chosen as Z3. The exiting variable is X3. It is necessary to include
Z3, because no feasible portfolio exists without this asset due to the placement constraint.
3. The new basis is (Z3;X1;X2;W ) = (2; 9; 3; 1), and the value of the objective function is 12.
4. The entering variable is chosen as Z1. The exiting variable is W .
5. The entering variable is �. If the exiting variable is chosen as X2 another ordinary simplex
iteration with M2 as entering and X2 as exiting variable is necessary. If the exiting variable
is chosen as X1, which will not make any Z-variable negative, a multiple bias shift occurs.
The value of X2 will become negative, but X2 can immediately be switched with M2.
19

X0 Z1 Z2 Z3 M1 M2 M3 X1 X2 X3 W � rhs
X0 1 0 0 0 0 0 0 �1 �1 �1 0 0 0
� 0 0 �1=2 0 �1 0 1 1 0 �1 �1 1 8
M2 0 0 �11=12 0 �5=6 1 1=6 5=6 �1 �1=6 �1=2 0 4
Z3 0 0 �1=6 1 �1=3 0 �1=3 1=3 0 1=3 �1 0 4
Z1 0 1 5=6 0 �1=3 0 �1=3 1=3 0 1=3 1 0 4
Table 5: Final simplex tableau for example 3 with placement constraints.
Analogous to theorem 1 we conclude by stating the algorithm for the situation with additional
linear constraints as theorem 2.
Theorem 2 The following algorithm converges to the optimal solution of the modi�ed linear
programming problem in (2.6) with additional linear constraints:
1. Choose the initial basis as a combination of M� and X�variables in accordance with the sign
of the risk-premium. The initial basis variables for the rows corresponding to the additional
linear constraints are chosen as the slack-variables W .
2. Select a current non-basis variable Zi, Mi or �j to enter as a new basis variable. The usual
criteria can be applied, i.e. looking for positive reduced cost coeÆcients, although the exclusion
rules, ZiMi=0 and Wj�j=0, must be obeyed.
3. Find the pivot element. If the entering variable is Zi, check whether the pivot element refers
to another Zb�variable or to a W�variable. If so, perform the usual pivot operations. If not
{ and this is revealed the �rst time the usual pivot ratio in any row below the Zb rows and
the W rows is encountered to be lower than among the Zb and W rows { do the following:
(a) If possible, �nd a row referring to a basis variable among Xb to perform the pivot
operation. This will maintain primal feasibility w.r.t. the variables Zb and Wb.
(b) If any basis variable Xj turns out to be negative, exclude Xj from basis and include Mj
instead. This will be in accordance with the exclusion rule since index j does not belong
to the set of indices for Zb-variables.
(c) If it is not possible to exclude an Xb-variable from the basis, exclude the appropriate
Mb-variable or Wb-variable and continue in the usual manner.
(d) Once an X-variable has been omitted from the basis it can be excluded from further
consideration.
4. Continue with the pivot operations in (2.) until all X-variables have been excluded.
Proof See the Appendix.
20

9 Appendix
Proof [Theorem 1] When the simplex algorithm comes to an end, we have the following three
types of indices:
1. Zj > 0, Mj = 0
2. Zi = 0, Mi > 0
3. Zk =Mk = 0
Due to the exclusion rule these three subsets of indices are disjoint. Let
� e denote the subset of columns in relating to indices of type 1 and 3
� eZ be the corresponding subset of Z
� fM be the subset of columns in M relating to indices of type 2 and 3
The �nal solution produced by the simplex algorithm with the exclusion rule solves the following
LP-problem:
Min
NXp=1
Xp
subject toe eZ � fM +X = R�Rf1eZ, fM , X � 0
Let the dual variables be denoted as s. Then
sj � 0 and sj=0 whenever gMj > 0 for indices j of type 2 and 3
si � 1 and si=1 whenever Xi>0
st eej � 0 and st eej=0 whenever eZj>0 for indices j of type 1 and 3
The \missing" columns in e correspond to indices for which fMj>0. We know that this guaran-
tees both sj=0 and Zj=0. Hence we can conclude immediately that sts=st e~s=0, where ~s
is that part of s which corresponds to columns in e. Since is positive de�nite by assumption
it also follows that s=0. Hence the optimal value of the dual problem is zero, which proves that
the simplex algorithm comes to an end only after all X-variables have been eliminated.
Proof [Theorem 2] When the simplex algorithm comes to an end, we have the following three
types of indices concerning Z-variables:
1. Zj > 0, Mj = 0
2. Zi = 0, Mi > 0
3. Zk =Mk = 0
21

and the following three types of indices concerning W -variables:
4. Wf>0, �f = 0
5. Wg = 0, �g > 0
6. Wh = 0, �h = 0
Due to the exclusion rule both of these two groups of subsets of indices are mutually disjoint.
Let
� e denote the subset of columns in relating to indices of type 1 and 3
� eZ be the corresponding subset of Z
� fM be the subset of columns in M relating to indices of type 2 and 3
� eA denote the subset of columns in A relating to indices of type 5 and 6
� e� denote the corresponding subset of e�� bA denote the subset of rows in eA relating to indices of type 1 and 3
The �nal solution produced by the simplex algorithm with the exclusion rule solves the following
LP-problem:
Min
NXp=1
Xp
subject to
e eZ � fM +X + eAe� = R�Rf1
bAt eZ + eIfW = 0
eZ, fM , fW ,X, e�� 0
Let the dual variables associated with the e-rows be denoted by s and the dual variables associated
with the bA-rows be denoted by q. Then
sj � 0 and sj=0 whenever gMj > 0 for indices j of type 2 and 3
si � 1 and si=1 whenever Xi>0
st eAej � 0 and st eAej=0 whenever e�j>0 for indices j of type 5 and 6
qp � 0 and qp=0 whenever fWj>0 for indices of type 5 and 6
(st e+ qt bAt)ej � 0 and (st e+qt bAt)ej=0 whenever eZj>0 for indices of type 1 and 3
As in the proof of theorem 1 we can conclude that
st ees+ qt bAtes = sts+ qt bAtes � 0
22

Since cAtes as well as q have non-positive components we also know that the last part of this sum
is non-negative. Due to the positive de�niteness of we conclude. like in the proof of theorem
2, that s=0. Hence, all of the arti�cial variables Xi vanish.
Since this does not depend on the rhs of the problem it is also the case that the linear programming
algorithm solves the problem with other linear restrictions.
The single index model (section 4)
As the simplest example consider the case where all assets have positive �-values. Assume that
assets have been sorted in order of decreasing value of their Treynor-ratio as described in section
4. De�ne �k as �b, where b= f1; 2; : : : ; kg. De�ne Ck analogously. Then it is straightforward
to see that
Ck = Ck�1
�k
�k�1
+
�1�
�k
�k�1
�Rk �Rf
�k(9.1)
The sequence �k is a decreasing sequence. For this reason the sequence Ck has by construction
the \single peak property" and hence a uniquely determined maximum. Each new value of
Ck is a convex combination of its own former value Ck�1 and a positive number:Rk�Rf
�k. The
sequence will increase until the point where the entering number {Rk�Rf
�k{ becomes lower than
the accumulated number Ck�1. After that point it will start to decline. Formally this can proved
as follows.
Assume that Ck < Ck�1. This can only happen whenRk�Rf
�k< Ck < Ck�1. Since Ck+1 is a
convex combination of Ck andRk+1�Rf
�k+1(<
Rk�Rf�k
< Ck) it must be the case that Ck+1 <Ck.
Hence, if the sequence Ck is observed to decline once it will continue to decline. That proves
the single peak property.
Given that
� the assets have been numbered according to the ranking by their Treynor ratio
� the assets are entered into the basis in that sequence and that the pivot element in each step
is chosen as the diagonal element in the covariance matrix
we can apply the matrix inversion lemma to the appropriate subset of assets in the basis:
�1bb = D�1
b [I � �b
��b�
tb
�D�1
b ] (9.2)
�b =�2m
1 + �2m�tbD
�1
b �b=
�2m
1 + �2mXi2b
�2i�2ei
) (9.3)
�b = �2m
h1� �b
h�tbD
�1
b �b
ii(9.4)
The coeÆcients in the inverted tableau at some intermediate step become:
23

X0 Zb Zn M
1 0t 1tx
�Dn +�b�n�
tn
��b1
tx�n�
tbD
�1
b �1tx
0I
0
�bD�1
b �b�tn
Dn +�b�n�tn
��1bb 0
�b�n�tbD�1
b �I
X rhs
�1t � �b1tx�n�
tbD
�1
b �1tnx 1tx
hRx �Rf1x � �b�n�
tbD
�1
b
�Rb �Rf1b
�i�1bb 0
��b�n�tbD
�1
b I
0B@ �1bb 0
��b�n�tbD
�1
b I
1CA�R�Rf1�
At any iteration the right hand side will look as follows:0BBBBBBBBBBBB@
...
�i�2ei
�Ri�Rf
�i� Cb
�...
Rj �Rf � �jCb
...
1CCCCCCCCCCCCAIt is easy to see that pivoting \on the diagonal" will not destroy primal fasibility for assets
previously entered. However, there may well be primal infeasibility in rows further down in the
tableau. This is easily repaired by switching the basis entry to the corresponding Lagrangian
multiplier variable. The algorithm will stop exactly when the single peak of Cb has been obtained.
As mentioned in section 3 the matrix B does not have an economic interpretation in its own.
Hence the mirror case with pure negative �-values is a representation of the same validity. In
that case the sequence Ck has the \single through" property, but the arguments are entirely
analogous.
In the general case, with both positive and negative �-values, it becomes slightly more involved
to prove convergence of the algorithm. The sequence Ck is now formed by including assets
according to the sequence in which they are ordered within the two groups of positive and
negative �-values, respectively, and it becomes necessary to switch between the two types of
assets whenever a local peak/through is reached. However, any value for Ck will always be
between the most recently recorded local maximum and local minimum, whenever the ordering
within each of the groups is obeyed. The simplex method could be applied to keep track of this
in a straightforward manner and to guarantee convergence without further quali�cation, since
it is a general procedure.
24

The group of excluded assets { apart from the zero-�-assets { also falls into two groups.
1. If �j > 0 the complementary slackness condition is satis�ed:
�jCb � (Rj �Rf ) > 0 , Cb >Rj �Rf
�j
Otherwise the asset would automatically have been added by the selection procedure, because
Cb could be increased.
2. If �j < 0 the complementary slackness condition is satis�ed:
�jCb � (Rj �Rf ) > 0 , Cb <Rj �Rf
�j
Otherwise the asset would automatically have been added by the selection procedure, because
Cb could have been decreased.
The multi-index model (section 7)
� is already in diagonal form, and due to the block-structure of matrix B the matrix BtD�1B
is almost a diagonal matrix. Only the �rst row and the �rst column has non-zero o�-diagonal
components.
��1 +BtD�1B = +
0
g
!(1; 0; : : : ; 0) + (1; 0; : : : ; 0)t
�0;gt
�(9.5)
= diag
26666641 + �2m
NXj=1
�2j
�2ej
�2m;
1 + �2I1
Xj2N1
b2j;1
�2ej
�2I1; : : : ;
1 + �2IH
Xj2NH
b2j;H
�2ej
�2IH
3777775 (9.6)
gt =
24Xj2N1
�jbj;1
�2ej; : : : ;
Xj2NH
�jbj;H
�2ej
35 (9.7)
This matrix falls into the category of partitioned matrices for which inversion formulas are
readily available:
���1 +BtD�1B
��1�
"1 gt
g 2
#�1
=
"a �agt�1
2
�a�1
2g �1
2+ a�1
2ggt�1
2
#(9.8)
where
a =1
1 � gt�1
2g
Hence
C0 = aNXj=1
�j
�2ej(Rj �Rf )� a
HXh=1
(gh=h)Xi2Nh
bi;h
�2ei(Ri �Rf ) (9.9)
Ch = (1=h)
24Xi2nh
bi;h
�2ei(Ri �Rf )� ghC0
35 (9.10)
25

Reformulating the model by letting Rm re ect the return on an actual portfolio, an \index
portfolio" or a \market portfolio" and, hence, a portfolio with zero residual risk, leads to the
following covariance matrix:
=D +B�Bt (9.11)
where
D � diag�0; �2e1 ; �
2e2; : : : ; �2eN
�(9.12)
� � diag[�2m; �2I1; �2I2 ] (9.13)
B �
266666666666666664
1 0 0
�1 b1;1 0
�2 b2;1 0...
......
�n1 bn1;1 0
�n1+1 0 bn1+1;2�n1+2 0 bn1+n2;2...
......
�N 0 bN1;2
377777777777777775(9.14)
Let Z0 denote the position in the \market portfolio" and let Z=(Z1; Z2; : : : ; ZN ) be the portfolio
positions in the other assets. The �rst order conditions in the unrestricted case:
Z0
Z
!= R�Rf1 (9.15)
can be manipulated by the following row operations: Subtract �j times row 0 from row j for
every j=f1; 2; : : : ; Ng. This leaves the reformulated �rst order conditions as0B@" 0 0t
0 D1
#+
264 1 0 0
0 b1 0
0 0 b2
375 diag[�2m; �2I1 ; �2I2 ]264 1 �t
0 bt1
0
0 0 bt2
3751CA Z0
Z
!=
0BBBBBBBB@
Rm �Rf
R1 �Rf � �1(Rm �Rf )
R2 �Rf � �2(Rm �Rf )
...
RN �Rf � �N (Rm �Rf )
1CCCCCCCCA(9.16)
The �rst equation simply determines Z0 residually as
Z0 +NXj=1
�jZj = Rm �Rf , Z0 = Rm �Rf �
NXj=1
�jZj (9.17)
The rest of these conditions are identical in structure to the multi-group model, in this particular
case with two groups. The portfolio positions Zj are determined as \hedged positions", where
the Rm component is hedged out.
26

Provided that an optimal constrained solution has a non-negative Z0-component the ranking
procedure from the multi-group model can be used to improve the convergence of the LP-
algorithm. This requirement is also necessary for the method discussed in Elton, Gruber, and
Padberg (1979) to be valid. However, no recipe is given for how to handle cases where it is not
ful�lled, and no convergence proof is given.
References
Beasley, J., T.-J. Chang, M. N., and Y. Sharaiha (2000): \Heuristics for cardinality
constrained portfolio optimisation," Computers&Operations Research, 27:1271{1302.
Elton, E. J. and M. J. Gruber (1995): Modern Portfolio Theory and Investment Analysis,
Wiley series in Finance. John Wiley & Sons, Inc., Singapore, Singapore, 5 edition.
Elton, E. J., M. J. Gruber, and M. W. Padberg (1976): \Simple criteria for optimal
portfolio selection," The Journal of Finance, 11:1341{1357.
(1977): \Simple rules for optimal portfolio selection: The multi group case," Journal
of Financial and Quantitative Analysis, 12:329{345.
(1978a): \Simple criteria for optimal portfolio selection: Tracing out the eÆcient
frontier," The Journal of Finance, 13:296{302.
(1978b): \Simple criteria for optimal portfolio selection with upper bounds," Op-
erations Research.
(1979): \Simple rules for optimal portfolio selection: The multi-index case," in
Elton, E. J. and M. J. Gruber, editors, Portfolio Theory 25 Years Later. North-Holland,
Amsterdam.
Franklin, J. (1980): Methods of Mathematical Economics, Springer-Verlag.
Gruber, M. J. (1997): \Personal communication."
Huang, C.-f. and R. H. Litzenberger (1988): Foundations for Financial Economics,
North-Holland, New York, USA.
Kwan, C. (1984): \Portfolio analysis using single index, multi-index, and constant correlation
models: A uni�ed treatment," The Journal of Finance, 39(5):1469{1484.
Merton, R. C. (1972): \An analytical derivation of the eÆcient portfolio frontier," Journal
of Financial and Quantitative Analysis, 7:1851{1872.
Roll, R. (1977): \A critique of the asset pricing theory's tests," Journal of Financial Eco-
nomics, 4:129{176.
27

Table 4
X0
Z1
Z2
Z3
Z4
Z5
Z6
M
1
M
2
M
3
M
4
M
5
M
6
X1
X2
X3
X4
X5
X6
rhs
X0
1
19=6
19=6
19=6
19=6
41=15
41=15
�
1
�
1
�
1
�
1
�
1
�
1
0
0
0
0
0
0
85=2
X1
0
1
1=2
1=2
1=2
1=3
1=3
�
1
0
0
0
0
0
1
0
0
0
0
0
10
X2
0
1=2
1
1=2
1=2
1=3
1=3
0
�
1
0
0
0
0
0
1
0
0
0
0
7
X3
0
1=2
1=2
1
1=2
1=3
1=3
0
0
�
1
0
0
0
0
0
1
0
0
0
7
X4
0
1=2
1=2
1
1=3
1=3
1=3
0
0
0
�
1
0
0
0
0
0
1
0
0
6
X5
0
1=3
1=3
1=3
1=3
1
2=5
0
0
0
0
�
1
0
0
0
0
0
1
0
8
X6
0
1=3
1=3
1=3
1=3
2=5
1
0
0
0
0
0
�
1
0
0
0
0
0
1
9=2
X0
1
0
19=12
19=12
19=12
151=90
151=90
13=6
�
1
�
1
�
1
�
1
�
1
�
19=6
0
0
0
0
0
65=6
Z1
0
1
1=2
1=2
1=2
1=3
1=3
�
1
0
0
0
0
0
1
0
0
0
0
0
10
X2
0
0
3=4
1=4
1=4
1=6
1=6
1=2
�
1
0
0
0
0
�
1=2
1
0
0
0
0
2
X3
0
0
1=4
3=4
1=4
1=6
1=6
1=2
0
�
1
0
0
0
�
1=2
0
1
0
0
0
2
X4
0
0
1=4
1=4
3=4
1=6
1=6
1=2
0
0
�
1
0
0
�
1=2
0
0
1
0
0
1
X5
0
0
1=6
1=6
1=6
8=9
13=45
1=3
0
0
0
�
1
0
�
1=3
0
0
0
1
0
14=3
X6
0
0
1=6
1=6
1=6
13=45
8=9
1=3
0
0
0
0
�
1
�
1=3
0
0
0
0
1
7=6
X0
1
0
0
19=18
19=18
179=135
179=135
10=9
10=9
�
1
�
1
�
1
�
1
�
19=9
�
19=9
0
0
0
0
119=18
Z1
0
1
0
1=3
1=3
2=9
2=9
�
4=3
2=3
0
0
0
0
4=3
�
2=3
0
0
0
0
26=3
Z2
0
0
1
1=3
1=3
2=9
2=9
2=3
�
4=3
0
0
0
0
�
2=3
4=3
0
0
0
0
8=3
X3
0
0
0
2=3
1=6
1=9
1=9
1=3
1=3
�
1
0
0
0
�
1=3
�
1=3
1
0
0
0
4=3
X4
0
0
0
1=6
2=3
1=9
1=9
1=3
1=3
0
�
1
0
0
�
1=3
�
1=3
0
1
0
0
1=3
X5
0
0
0
1=9
1=9
23=27
34=135
2=9
2=9
0
0
�
1
0
�
2=9
�
2=9
0
0
1
0
38=9
X6
0
0
0
1=9
1=9
34=135
23=27
2=9
2=9
0
0
0
�
1
�
2=9
�
2=9
0
0
0
1
13=18
X0
1
0
0
0
1=6
16=15
16=15
1=3
1=3
1=3
0
�
1
�
1
�
4=3
�
4=3
�
4=3
�
1
0
0
9=2
Z1
0
1
0
0
1=4
1=6
1=6
�
3=2
1=2
1=2
0
0
0
3=2
�
1=2
�
1=2
0
0
0
8
Z2
0
0
1
0
1=4
1=6
1=6
1=2
�
3=2
1=2
0
0
0
�
1=2
3=2
�
1=2
0
0
0
2
Z3
0
0
0
1
1=4
1=6
1=6
1=2
1=2
�
3=2
0
0
0
�
1=2
�
1=2
3=2
0
0
0
2
M
4
0
0
0
0
�
5=8
�
1=12
�
1=12
�
1=4
�
1=4
�
1=4
1
0
0
1=4
1=4
1=4
�
1
0
0
0
X5
0
0
0
0
1=12
5=6
7=30
1=6
1=6
1=6
0
�
1
0
�
1=6
�
1=6
�
1=6
0
1
0
4
X6
0
0
0
0
1=12
7=30
5=6
1=6
1=6
1=6
0
0
�
1
�
1=6
�
1=6
�
1=6
0
0
1
1=2
X0
1
0
0
0
0
0
0
0
0
0
0
0
0
�
1
�
1
�
1
�
1
�
1
�
1
0
Z1
0
1
0
0
7=30
0
3=25
�
47=30
7=15
7=15
0
1=5
0
47=30
�
7=15
�
7=15
0
�
1=5
0
36=5
Z2
0
0
1
0
7=30
0
3=25
7=15
�
23=15
7=15
0
1=5
0
�
7=15
23=15
�
7=15
0
�
1=5
0
6=5
Z3
0
0
0
1
7=30
0
3=25
7=15
7=15
�
23=15
0
1=5
0
�
7=15
�
7=15
23=15
0
�
1=5
0
6=5
M
4
0
0
0
0
�
37=60
0
�
3=50
�
7=30
�
7=30
�
7=30
1
�
1=10
0
7=30
7=30
7=30
�
1
1=10
0
2=5
Z5
0
0
0
0
1=10
1
7=25
1=5
1=5
1=5
0
�
6=5
0
�
1=5
�
1=5
�
1=5
0
6=5
0
24=5
M
6
0
0
0
0
�
3=50
0
�
96=125
�
3=25
�
3=25
�
3=25
0
�
7=25
1
3=25
3=25
3=25
0
7=25
�
1
31=50
28