wp 4.2.4 study on biomass trade in germany on biomass trade in germany published by: federal...
TRANSCRIPT

www.4biomass.eu
Biomass - Fostering the Sustainable Usage of Renewable Energy Sources in Central Europe – Putting Biomass into Action!
WP 4.2.4
Study on Biomass Trade
in Germany
Published by: Federal Ministry for the Environment, Nature Conservation and Nuclear Safety
Author: Sybille Tempel, FFU
October 2010
www.4biomass.eu
Biomass - Fostering the Sustainable Usage of Renewable Energy Sources in Central Europe – Putting Biomass into Action!
Publisher:
Federal Ministry for the Environment, Nature Conservation and Nuclear Safety D-11055 Berlin
www.bmu.de
Author: Environmental Policy Research Centre Freie Universität Berlin Sybille Tempel, M.A. D-14195 Berlin
www.fu-berlin.de/ffu
The views expressed in this report are those of the author and do not necessarily reflect the opinions of BMU
Oktober 2010
2

www.4biomass.eu
Biomass - Fostering the Sustainable Usage of Renewable Energy Sources in Central Europe – Putting Biomass into Action!
Table of Content Introduction 4 1 Current State of Renewable Energy Use in Germany 5 1.1 Main mandatory regulation of production and use of biomass 7 2 Biomass potential for energy in Germany 8 3 Bioenergy production and consumption in Germany 8 4 The Bioenergy Market in Germany 13 4.1 Pellets 14 4.2 Wood chips 17 4.3 Firewood (split logs) 18 4.4 Wood briquettes 19 4.5 Sawdust 19 4.6 Biofuels for Transport 20 4.7 Biomethane 25 5 International Bioenergy Trade Flows 25 5.1 Imports and Exports of Firewood, Pellets and Wood Briquettes 26 5.2 Imports and Exports of Biofuels for Transport 28 5.3 Imports and Exports of Biomethane 28 6 Conclusion 29 7 References 30 Tables Table 1 Contribution of renewable energy sources to energy supply in Germany 2009 6 Table 2 Estimated energy potential from forestry and agriculture in Germany 8 Table 3 Overview on bioenergy production in the years 2006 to 2009 9 Table 4 Bioenergy production and consumption in Germany in 2008 9 Table 5 Biogas plants in Germany in 2009 and prognosis for 2010 10 Table 6 Development of primary transport fuel consumption 2007 to 2009 11 Table 7 The German bioenergy market in figures 2009 13 Table 8 Price development of wood pellets in 2009 and 2010 17 Table 9 Firewood prices inclusive delivery until 10 km 19 Table 10 Minimum share of biofuels (energetic) in total transport fuel consumption 21 Table 11 Actual prices for biodiesel at filling stations in August 2010 (week 30) 22 Table 12 Prices for mineral diesel at filling stations in August 2010 (week 30) 22 Table 13 Bioethanol consumption in Germany in 2009 in 1000 tonnes 23 Table 14 German exports and imports of pellets in Europe and select. other countries 26 Figures Figure 1 Structure of final energy supply from RES in Germany 2009 in percent 7 Figure 2 Biofuel and fossil fuel consumption in Germany in 2009 11 Figure 3 Pellet production and domestic demand in Germany 2009 14 Figure 4 Total amount of pellet heating installations in Germany 2009 15 Figure 5 Distribution of pellet heating applications in Germany 15 Figure 6 Fuel prices for heat in June 2010 16 Figure 7 Price development of wood chips, pellets, heating oil and natural gas 18 Figure 8 Development of biofuels for transport in Germany from 2005 to 2009 20 Figure 9 Monthly consumption of ETBE (bioethanol) in Germany 2007 to 2009 in t/a 23 Figure 10 Price developments of oilseeds, vegetable oil and oil groats 24
3
www.4biomass.eu
Biomass - Fostering the Sustainable Usage of Renewable Energy Sources in Central Europe – Putting Biomass into Action!
Introduction
The deployment of biomass for heating and cooling as well as for electricity is increasing rapidly in Germany. Energy from sustainable biomass production is, together with wind energy, a key resource for secure and independent energy supply, for saving fossil fuel reserves, for mitigating the effects of climate change and fostering value creation and employment.
Bioenergy, i.e. solid biomass, biogas, sewage and landfill gas, and also liquid biomass and organic waste, meets at present almost five percent of Germany’s primary energy demand. This share will have to be increased considerably to achieve the national target of 18 percent share of renewable energy sources in final energy consumption by 2020, a necessary contribution to the EU target of 20 percent by that date required by the EU RES Directive 2009/28/EC.
The National Biomass Action Plan for Germany, issued in April 2009, mentions estima-tions that doubling the share of bioenergy in Germany’s energy supply by 2020 may be possible. The development potential of energy plants is expected to be increased from presently 1.7 million hectares to 4 million hectares1. However, meeting the energy de-mand solely from domestic biomass is unrealistic for competitive reasons. It will be inevi-table to use domestic biomass resources in a cascading way, putting material use and food and fodder production in first place and leaving not usable fractions to energy pro-duction.
Furthermore, a sustainable forest and agriculture management requires to attach more importance to by-products and residues from both sectors for generation of heat, cold and power. Germany is committed to use its natural resources sustainably and conserve biodiversity, as it is stipulated in the Sustainability Strategy (2002) and the Biodiversity Strategy (2007).
Thus, imports of unrefined and refined biomass will be needed to meet the demand. Ac-tually, imports and as well exports are already presently usual, and they will definitely gain increasing importance in the years to come. In the National Renewable Energy Ac-tion Plan a primary biomass demand of around 1.400 PJ by 2020 is assumed, while the domestic biomass contribution supposedly will be limited to 1.000 PJ. The difference of 400 PJ may be covered partly by imports from other countries, partly by yield increase and intensified use of residues and wastes2.
The development of trade depends on various impacts, ranging from cost advantages over shipping capacities and routes to policy targets, e.g. for increasing renewable sources or reducing climate threatening emissions. It will be of vital interest for bio-energy trade on intraregional, transnational and international scale to reduce barriers connected with tariff regulation, technical standards, sustainability criteria, underdevel-oped logistics and other possible issues.
Market developments in the forest, agriculture and paper & pulp sectors, and “new” bio-mass trading options like electricity, bio-methane, and “new” commodities such as coke, bio-char, biochemicals, as well as phytosanitary issues regarding wood chips, require in-creasing attention.
The study gives an overview on the situation in Germany concerning biomass potential, bioenergy production and consumption, the domestic market, and international trade.
1 Agency for Renewable Resources (FNR), Press Release of from 06.07.2010 (www.fnr.de). 2 Nationaler Aktionsplan für erneuerbare Energie gemäß der Richtlinie 2009/28/EG zur Förderung
der Nutzung von Energie aus erneuerbaren Quellen (NREAP). August 2010, p. 96.
4
www.4biomass.eu
Biomass - Fostering the Sustainable Usage of Renewable Energy Sources in Central Europe – Putting Biomass into Action!
1 Current State of Renewable Energy Use in Germany
At present, the total final energy consumption in Germany consists of 89 percent fossil fuels (hard coal, lignite, mineral oil, natural gas) and nuclear energy, and 10.1 percent renewable energy sources (biomass 7.0, wind energy 1.6, hydropower 0.8, other renew-ables like solar and geothermic power 0.7 percent).
According to data provided by the Federal Ministry for Environment, Nature Conservation and Nuclear Safety (BMU) and the Arbeitsgruppe Erneuerbare Energien (AGEE Stat), re-newable energy supply increased in 2009 to 238 billion kWh (236 billion kWh in 2008). As aforementioned, the share of renewable energy sources (RES) in final energy con-sumption was 10.1 percent (2008: 9.3 percent). Thus 109 million tonnes greenhouse gas emissions and 107 million tonnes CO2 equivalents could be avoided and the national economy discharged with 7.9 billion Euro from external costs for environmental and health damages. Simultaneously imports of fossil fuels amounting to 6.4 billion Euro were avoided and the domestic value creation was consolidated.
A considerable increase of the share of RES in gross final energy consumption was ob-served in the heat sector: 8.4 percent compared to 7.4 percent in 2008, corresponding to an increase in heat production of 110 billion kWh. The contribution of biomass (almost 101 billion kWh) amounted to 91 percent, due primarily to an increased use of wood and as well of biogas for heat production, the latter amounting to 10 billion kWh (8,1 billion kWh in 2008).
The share of RES in gross final electricity consumption grew to 16.1 percent (15.2 per-cent in 2008), the installed capacity of all renewables, i.e. energy from wind, solar, hy-dro, biomass and geothermal sources, at about 5400 MW. The biogenous energy carriers biomass, biogas, landfill gas and sewage gas as well as the biogenous share of waste de-livered 30.5 billion kWh, i.e. a nine percent increase in electricity generation (27.8 billion kWh in 2008). The share of these energy carriers in electricity consumption climbed up to 5.2. percent (compared to 4.5 percent in 2008).
In transport sector, however, the deployment of RES has declined again slightly: Only a share of 5.5 percent of biofuels was achieved, compared to 5.9 percent in 2008 and 7.3 percent in 2007. This downward trend is expected to be stopped by the quota of 6.25 percent issued in 2009 and the tax relief for pure vegetable oil prolonged until 2012.
The total turnover of all renewable energy amounted to 33.4 billion Euro (30.7 in 2008), of which 17.7 billion Euro were invested in renewable energy plants (14.8 billion Euro in 2008). Employment increased from 278.000 people working in the renewable energy sector in 2008 to 300.500 people in 2009. Biomass makes with 36 percent (109.000 working places) the greatest contribution to gross employment, followed by wind with 29 percent, solar power with 27 percent and geothermal and hydro with 3 percent each. These figures show clearly that renewable energy is becoming an important economic factor in Germany1.
1 BMU/AGEEStat (2010): Entwicklung der Erneuerbaren Energie in Deutschland im Jahr 2009.
BEE Bundesverband Erneuerbare Energien e.V. (2010). Press Release from 18.02.2010. Figures are rounded and preliminary, parts are estimated.
5

www.4biomass.eu
Biomass - Fostering the Sustainable Usage of Renewable Energy Sources in Central Europe – Putting Biomass into Action!
Table 1 Contribution of renewable energy sources to energy supply in Germany 2009
Hydropower
Wind energy
Biomass (total)
therefrom:
solid biomass, including biogenic waste
biogas
liquid biomass
Landfill and sewage gas
Photovoltaics
Geothermal energy
Total electricity
Electricity
0.019
17.1
93.5
[TWh] =
(1 billion kWh)
19.0
37.8
2.0
1.5
6.2
10.0
28.6
Biomass (total)
therefrom:
solid biomass, including biogenic waste
liquid biomass
biogenic gaseous fuel
Solar thermal energy
Deep geothermal energy
Near surface geothermal energy
Total heat
Heat
7.7
100.8
82.9
110.5
4.8
4.7
0.3
[TWh] =
(1 billion kWh)
10.2
Biodiesel (approx. 2.5 mill. t)
Vegetable oil (approx. 0.1 mill. t)
Bioethanol (approx. 0.9 mill. t)
Biogenic fuels (total)
[TWh] =
(1 billion kWh)
1.0
6.7
33.8
26.0Biogenic fuels
Total final energy from renewable energy sources 237.8
Source: Federal Ministry for Environment, Nature Conservation and Nuclear Safety (BMU) - KI III 1 according to Working Group on Renewable Energies-Statistics (AGEE-Stat); all figures provisional, deviations in the totals are due to rounding. State as from March 2010.
6
www.4biomass.eu
Biomass - Fostering the Sustainable Usage of Renewable Energy Sources in Central Europe – Putting Biomass into Action!
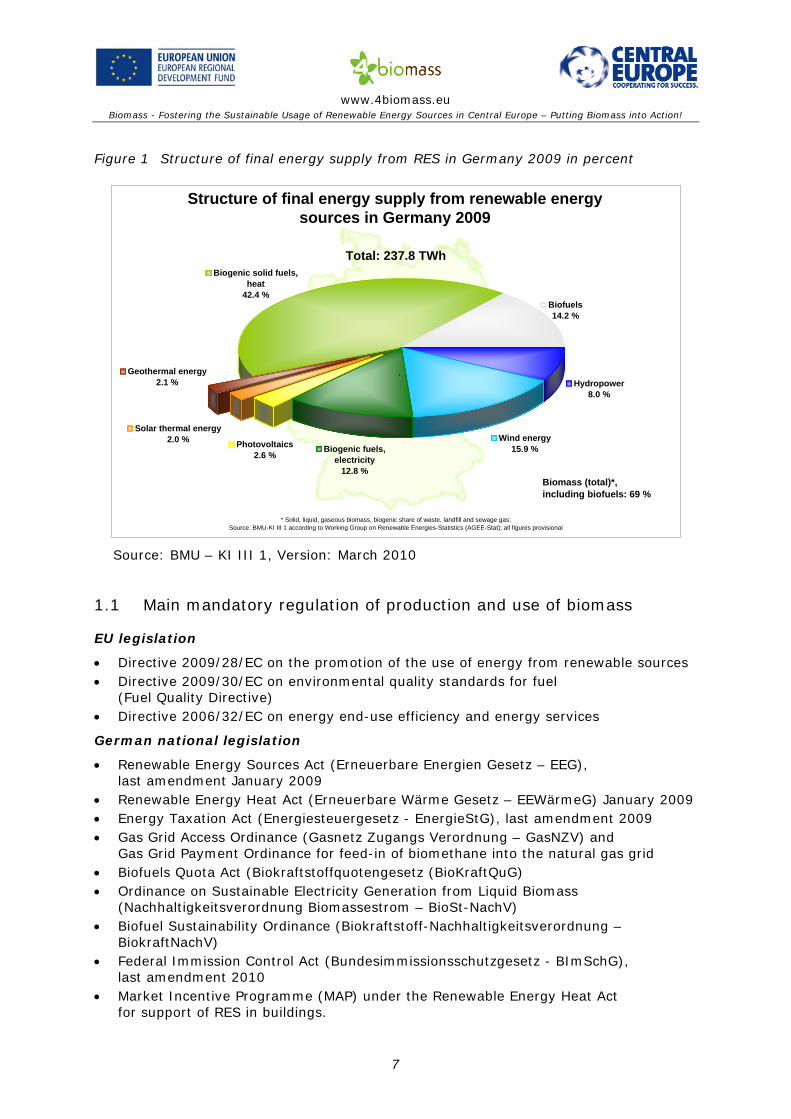
Figure 1 Structure of final energy supply from RES in Germany 2009 in percent
Structure of final energy supply from renewable energy sources in Germany 2009
Wind energy15.9 %Biogenic fuels,
electricity12.8 %
Photovoltaics2.6 %
Geothermal energy2.1 %
Solar thermal energy2.0 %
Biogenic solid fuels, heat
42.4 %Biofuels14.2 %
Hydropower8.0 %
Biomass (total)*, including biofuels: 69 %
Total: 237.8 TWh
,
* Solid, liquid, gaseous biomass, biogenic share of waste, landfill and sewage gas; Source: BMU-KI III 1 according to Working Group on Renewable Energies-Statistics (AGEE-Stat); all figures provisional
Source: BMU – KI III 1, Version: March 2010
1.1 Main mandatory regulation of production and use of biomass
EU legislation
• Directive 2009/28/EC on the promotion of the use of energy from renewable sources • Directive 2009/30/EC on environmental quality standards for fuel
(Fuel Quality Directive) • Directive 2006/32/EC on energy end-use efficiency and energy services
German national legislation
• Renewable Energy Sources Act (Erneuerbare Energien Gesetz – EEG), last amendment January 2009
• Renewable Energy Heat Act (Erneuerbare Wärme Gesetz – EEWärmeG) January 2009 • Energy Taxation Act (Energiesteuergesetz - EnergieStG), last amendment 2009 • Gas Grid Access Ordinance (Gasnetz Zugangs Verordnung – GasNZV) and
Gas Grid Payment Ordinance for feed-in of biomethane into the natural gas grid • Biofuels Quota Act (Biokraftstoffquotengesetz (BioKraftQuG) • Ordinance on Sustainable Electricity Generation from Liquid Biomass
(Nachhaltigkeitsverordnung Biomassestrom – BioSt-NachV) • Biofuel Sustainability Ordinance (Biokraftstoff-Nachhaltigkeitsverordnung –
BiokraftNachV) • Federal Immission Control Act (Bundesimmissionsschutzgesetz - BImSchG),
last amendment 2010 • Market Incentive Programme (MAP) under the Renewable Energy Heat Act
for support of RES in buildings.
7

www.4biomass.eu
Biomass - Fostering the Sustainable Usage of Renewable Energy Sources in Central Europe – Putting Biomass into Action!
2 Biomass potential for energy in Germany
In Germany, the available biomass potential from forests is rather increasing, as the an-nual increment of 100 million m3 extends considerably the removal. The last Federal For-estry Inventory conducted in 2002 has identified wood reserves of 3.4 billion m3, cur-rently the largest amount in Europe. Nevertheless, not the whole increment of growth can be deployed for industrial or energy use. A certain amount of wood residues have to be left because the nutrient balance has to be maintained according to sustainable forest management.
In agriculture, some 1.75 million hectares arable land were used to grow energy crops in 2008, in the years to come high yield levels and further increasing harvests are ex-pected. Since population is slightly decreasing, experts predict a good potential of re-sources.
Table 2 Estimated energy potential from forestry and agriculture in Germany
Estimated energy potential in PJ
Forestry 300-400
Agriculture 450-1.150
Greenland 100
Residues (e.g. manure, straw) 550
Total 1.400-2.200
Source: Nationaler Biomasseaktionsplan für Deutschland (2009), Annex, p.10.
Mobilisation of new biomass potential, e.g. fast growing energy plants like poplar, willow, miscanthus (Short Rotation Coppice – SRC) and agroforest systems promise a consider-able potential when grown on suitable land without concurring with food and fodder pro-duction. Several research projects on these commodities are presently being conducted in different federal states. With the amendment of the Federal Forest Law (BWaldG) in June 2010, areas with short rotation coppice and other agro-forest land do no longer un-derlie forest law but have the status of agricultural land1.
A remarkable potential can be gained from by-products in wood industry as well as from residues and wastes of biogenous origin. Residues from forests like crowns, branches, fo-liages, stumps etc. (appoximately 70 PJ), residues from agriculture like straw bales, rice husks, cuts from landscape management and waste from bio-waste containers (approxi-mately 35 PJ), sewage sludge, sewage gas and landfill gas (appoximately 40 PJ), liquid and solid manure (appoximately 90 PJ) and grain straw (appoximately 275 PJ), together with others add up to an energy amount of appoximately 550 PJ as indicated in table 22.
3 Bioenergy production and consumption in Germany
Solid and gaseous biomass is predominantly used in commercial plants for generation of electricity and combined heat and power, to a lesser extent for generating solely heat in rather small-scale plants. Under the Renewable Energy Sources Act (last amendment
1 BUND (2010): Kurzumtriebsplantagen für die Energieholzgewinnung – Chancen und Risiken.
Juli 2010. 2 Nationaler Biomasseaktionsplan für Deutschland (2009). Annex, p. 9.
8
www.4biomass.eu
Biomass - Fostering the Sustainable Usage of Renewable Energy Sources in Central Europe – Putting Biomass into Action!
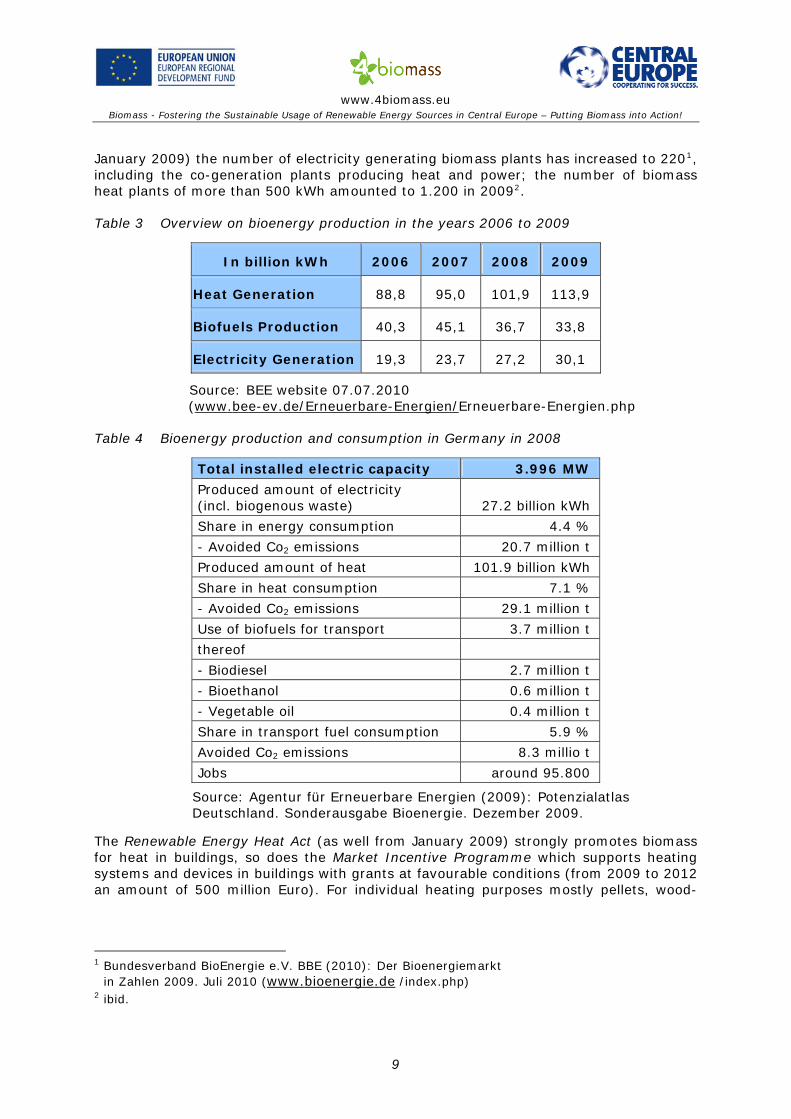
January 2009) the number of electricity generating biomass plants has increased to 2201, including the co-generation plants producing heat and power; the number of biomass heat plants of more than 500 kWh amounted to 1.200 in 20092.
Table 3 Overview on bioenergy production in the years 2006 to 2009
In billion kWh 2006 2007 2008 2009
Heat Generation 88,8 95,0 101,9 113,9
Biofuels Production 40,3 45,1 36,7 33,8
Electricity Generation 19,3 23,7 27,2 30,1
Source: BEE website 07.07.2010 (www.bee-ev.de/Erneuerbare-Energien/Erneuerbare-Energien.php
Table 4 Bioenergy production and consumption in Germany in 2008
Total installed electric capacity 3.996 MW
Produced amount of electricity (incl. biogenous waste)
27.2 billion kWh
Share in energy consumption 4.4 %
- Avoided Co2 emissions 20.7 million t
Produced amount of heat 101.9 billion kWh
Share in heat consumption 7.1 %
- Avoided Co2 emissions 29.1 million t
Use of biofuels for transport 3.7 million t
thereof
- Biodiesel 2.7 million t
- Bioethanol 0.6 million t
- Vegetable oil 0.4 million t
Share in transport fuel consumption 5.9 %
Avoided Co2 emissions 8.3 millio t
Jobs around 95.800
Source: Agentur für Erneuerbare Energien (2009): Potenzialatlas Deutschland. Sonderausgabe Bioenergie. Dezember 2009.
The Renewable Energy Heat Act (as well from January 2009) strongly promotes biomass for heat in buildings, so does the Market Incentive Programme which supports heating systems and devices in buildings with grants at favourable conditions (from 2009 to 2012 an amount of 500 million Euro). For individual heating purposes mostly pellets, wood-
1 Bundesverband BioEnergie e.V. BBE (2010): Der Bioenergiemarkt
in Zahlen 2009. Juli 2010 (www.bioenergie.de /index.php) 2 ibid.
9

www.4biomass.eu
Biomass - Fostering the Sustainable Usage of Renewable Energy Sources in Central Europe – Putting Biomass into Action!
chips and firewood are used. Presently 125.000 pellet furnaces1 are in use, and the num-ber of firewood combustion applications are estimated 10.8 million units in Germany2.
Biogas is mainly used to produce electricity, to a minor amount for both electricity and heat, and, to a still very small amount, as transport fuel. The highest increase of biogas plants ocurred in agriculture where rather small-to medium-size plants on farms use residues and wastes from the surrounding farm land. Municipalities often operate larger biogas facilities, utilising organic waste from industry and households, and achieve a higher installed capacity. In 2009 some 4000 biogas plants were in operation3, the Ger-man Biogas Association listed even 4.984 plants with an installed capacity of 1.893 MW for the same year4.
Table 5 Biogas plants in Germany in 2009 and prognosis for 2010
2009 Prognosis 2010
Number of plants 4.984 5.800
Installed electric capacity in MW
1.893 2.300
Households supplied with electricity in millions
3.5 4.3
Turnover in Germany in billions €
2.6 2.3
Employment places 16.000 17.000
Source: Fachverband Biogas e.V. 2010: Biogas-Branchenzahlen auf einen Blick. Website
Gaseous biomass is primarily used in stationary heat and power applications but can be deployed as well for mobility in transport sector. Only, the promising potential of natural gas and biomethane (upgraded from biogas) is being used still at a marginal amount: At present, the targets of the market share of natural gas and biomethane as a motor fuel have not yet been achieved, thus at the end of 2009 the share of natural gas as fuel in transport was only 0.3 percent in total consumption; only 85.000 of a total of around 50 million vehicles use natural gas as fuel (80 percent cars, 20 percent trucks)5. By Sep-tember 2010, 40 plants for biomethane production were in operation, the prognosis for the end of 2010 is 70 plants6. The plant operators expect of the amendment of the Re-newable Energy Sources Act (EEG) in 2012 improved conditions for biomethane produc-tion.
With a blend of 20 percent biomethane with natural gas, CO2 emissions can be reduced by 39 percent. If pure biomethane is deployed, even 97 percent of CO2 emissions can be avoided7.
1 Ibid. 2 IEA Bioenergy Task 40: Country Report Germany (2009), p. 27 3 BBE 2010, see above. 4 Fachverband Biogas e.V. (2009): Biogas Branchenzahlen 2009. Website www.biogas.org 5 Dena (2010): Erdgas und Biomethan im künftigen Kraftstoffmix. Handlungsbedarf und Lösungs-
ansätze für eine beschleunigte Verwendung im Verkehr. Deutsche Energieagentur (dena), p. 8. 6 Deutsche Enegieagentur (dena) 2010: Biogaspartner. Marktentwicklung in Deutschland. 7 Ibid., p. 4.
10
www.4biomass.eu
Biomass - Fostering the Sustainable Usage of Renewable Energy Sources in Central Europe – Putting Biomass into Action!
Hydrogen for energy and transport fuel production is at present still in experimental phase.
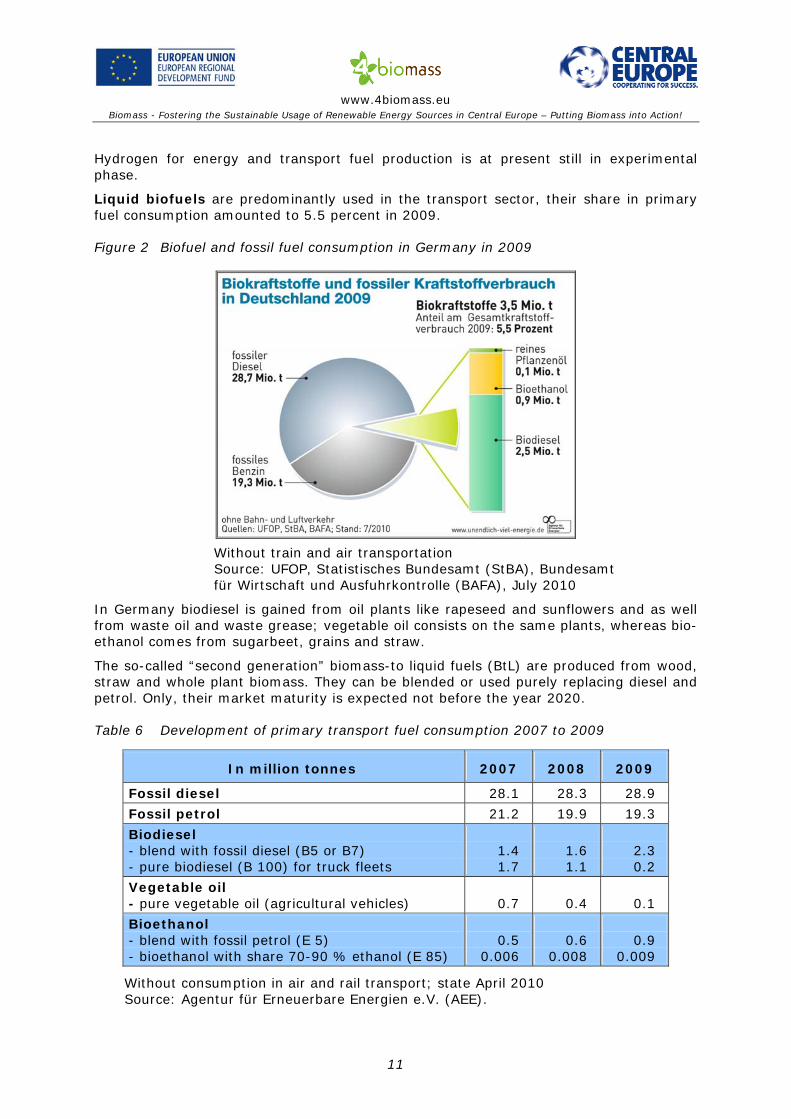
Liquid biofuels are predominantly used in the transport sector, their share in primary fuel consumption amounted to 5.5 percent in 2009.
Figure 2 Biofuel and fossil fuel consumption in Germany in 2009
Without train and air transportation
Source: UFOP, Statistisches Bundesamt (StBA), Bundesamt für Wirtschaft und Ausfuhrkontrolle (BAFA), July 2010
In Germany biodiesel is gained from oil plants like rapeseed and sunflowers and as well from waste oil and waste grease; vegetable oil consists on the same plants, whereas bio-ethanol comes from sugarbeet, grains and straw.
The so-called “second generation” biomass-to liquid fuels (BtL) are produced from wood, straw and whole plant biomass. They can be blended or used purely replacing diesel and petrol. Only, their market maturity is expected not before the year 2020.
Table 6 Development of primary transport fuel consumption 2007 to 2009
In million tonnes 2007 2008 2009
Fossil diesel 28.1 28.3 28.9
Fossil petrol 21.2 19.9 19.3
Biodiesel - blend with fossil diesel (B5 or B7) - pure biodiesel (B 100) for truck fleets
1.4 1.7
1.6 1.1
2.3 0.2
Vegetable oil - pure vegetable oil (agricultural vehicles)
0.7
0.4
0.1
Bioethanol - blend with fossil petrol (E 5) - bioethanol with share 70-90 % ethanol (E 85)
0.5
0.006
0.6
0.008
0.9
0.009
Without consumption in air and rail transport; state April 2010 Source: Agentur für Erneuerbare Energien e.V. (AEE).
11
www.4biomass.eu
Biomass - Fostering the Sustainable Usage of Renewable Energy Sources in Central Europe – Putting Biomass into Action!
Since 2004, fossil diesel is blended with 5 percent biodiesel (B 5). From February 2009 on, under the amended Biofuel Quota Act seven volume percent of biodiesel must be blended to one litre fossil diesel (B 7). This Act obliges all providers of fossil fuels to re-place a certain amount of fossil fuels by a minimum share of biofuels. Thus in 2008, 4.4 percent (energetic) of the total amount of traditional diesel had to be replaced by bio-diesel, corresponding to 1.6 million tonnes biodiesel.
Production of bioethanol increased in 2009 to 591.000 tonnes which corresponds to 29 percent compared to 2008, the consumption expanded even to 44 percent. One third of German bioethanol was produced from sugar beets, 65 percent from maize or rye. Resi-dues from food industry with less than three percent are negligible.
The quota for bioethanol blends in 2008 was only 2 percent, corresponding to 0.6 million tonnes bioethanol, in 2009 it increased as E5 (five percent blended) to 0.9 million ton-nes. From January 2011 on, a share of 10 percent bioethanol (E10) may be blended with fossil fuel1. Pure bioethanol E85 (blended with 15 percent petrol for material reasons) can be used only by the small number of FlexiFuel Vehicles presently in use, thus total production of bioethanol amounted only to 9.000 tonnes in 20092.
Besides the biofuels for transport, liquid biofuels like vegetable oil and biodiesel are also used in co-generation plants for generating heat and electricity. Facilities with rather small capacity (< 10 kWel) are mainly used in residential buildings by private persons for heat and hot water, medium sized plants supply heat to blocks of flats, greenhouses or companies. Municipal energy utilities often operate plants based on liquid biomass with higher installed capacity.
Sustainability criteria of EU Directive 2009/28/EC concerning electricity and liquid bio-fuels from biomass have been first implemented in Germany: The Ordinance on Sustain-able Electricity Generation from Liquid Biomass (Nachhaltigkeitsverordnung Biomasse-strom – BioSt-NachV) and the Biofuel Sustainability Ordinance (Biokraftstoff-Nachhaltigkeitsverordnung – BiokraftNachV), both in force since 2009 and binding from January 2011 on, guarantee the sustainable use of bioliquids. Analogous ordinances for sustainable production and use of solid and gaseous biomass are presently being elabo-rated by the responsible Ministries to follow the respective (non-binding) recommenda-tions of the EU Commission.
The sustainability criteria formulated in EU Directive 2009/28/EC apply not only to pro-duction in EU Member States but also to imports from other countries. Thus their produc-tion of biomass for biofuels and vegetable oil may not be carried out on land with high carbon stock and high biodiversity, such as nature protection land, primary forests, for-ests, wetland, and grassland. Furthermore biofuels and vegetable oil have to achieve savings of at least 35 percent GHG emissions compared to fossil fuels. Verification of the sustainability of the whole production chain of German biofuels and bioliquids is provided by two different certification schemes and the respective certification bodies: The Ger-man Federal Office for Agriculture and Food issued on 20 July 2010 the final regognition of the International Sustainability and Carbon Certification (ISCC) as well as of the RED-cert system. Both certification systems can be applied to all of the steps involved in the process starting with production and collection of input materials through to processing in oil mills and the production of biofuel and bioliquids.
The same verification procedures are required for imports of biofuels and bioliquids from other countries. They have to be verified through a recognised verification body before 1 Press Release from Verband der Deutschen Kraftstoffindustrie e.V. (VDB) from 15.07.2010 2 Bundesverband der deutschen Bioethanolwirtschaft BDBe 2009: WWW:BDBE:DE7Statistik
2009.html.
12
www.4biomass.eu
Biomass - Fostering the Sustainable Usage of Renewable Energy Sources in Central Europe – Putting Biomass into Action!
being transported to European countries. ISCC and TÜV SÜD issue already certificates to suppliers in Brazil and neighbouring countries as well as in Indonesia1.
4 The Bioenergy Market in Germany
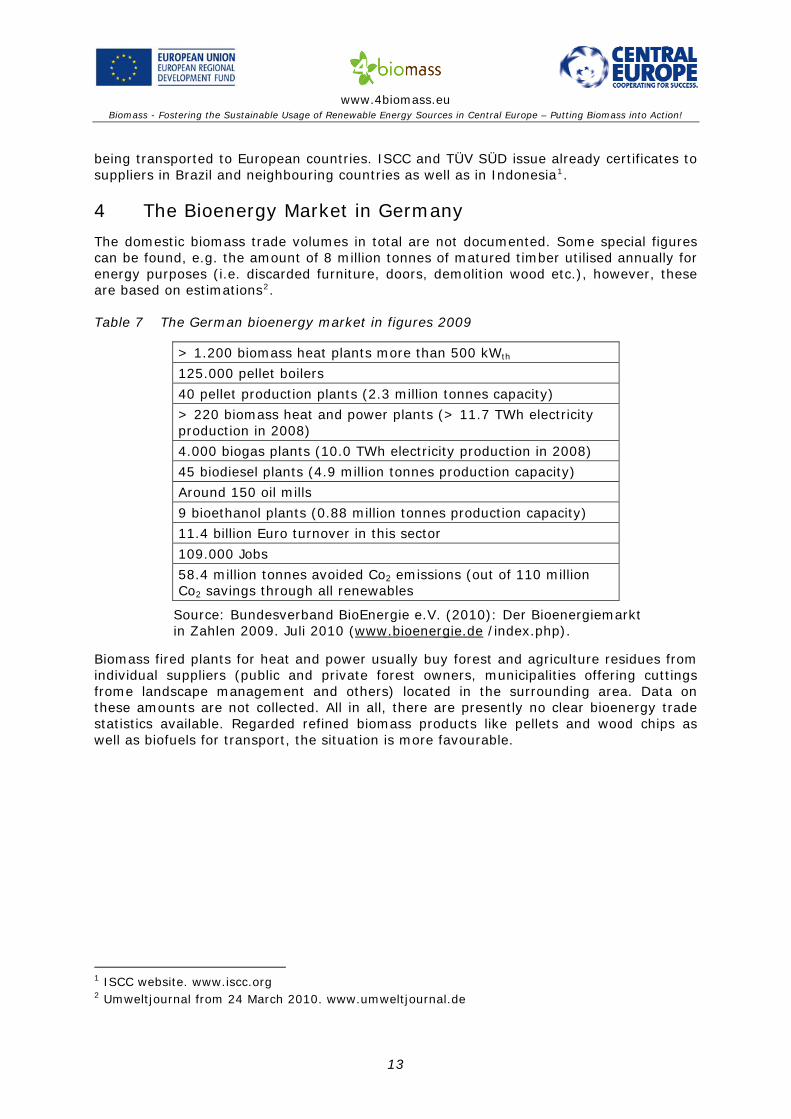
The domestic biomass trade volumes in total are not documented. Some special figures can be found, e.g. the amount of 8 million tonnes of matured timber utilised annually for energy purposes (i.e. discarded furniture, doors, demolition wood etc.), however, these are based on estimations2.
Table 7 The German bioenergy market in figures 2009
> 1.200 biomass heat plants more than 500 kWth
125.000 pellet boilers
40 pellet production plants (2.3 million tonnes capacity)
> 220 biomass heat and power plants (> 11.7 TWh electricity production in 2008)
4.000 biogas plants (10.0 TWh electricity production in 2008)
45 biodiesel plants (4.9 million tonnes production capacity)
Around 150 oil mills
9 bioethanol plants (0.88 million tonnes production capacity)
11.4 billion Euro turnover in this sector
109.000 Jobs
58.4 million tonnes avoided Co2 emissions (out of 110 million Co2 savings through all renewables
Source: Bundesverband BioEnergie e.V. (2010): Der Bioenergiemarkt in Zahlen 2009. Juli 2010 (www.bioenergie.de /index.php).
Biomass fired plants for heat and power usually buy forest and agriculture residues from individual suppliers (public and private forest owners, municipalities offering cuttings frome landscape management and others) located in the surrounding area. Data on these amounts are not collected. All in all, there are presently no clear bioenergy trade statistics available. Regarded refined biomass products like pellets and wood chips as well as biofuels for transport, the situation is more favourable.
1 ISCC website. www.iscc.org 2 Umweltjournal from 24 March 2010. www.umweltjournal.de
13

www.4biomass.eu
Biomass - Fostering the Sustainable Usage of Renewable Energy Sources in Central Europe – Putting Biomass into Action!
4.1 Pellets
Wood pellet production in Germany was started in 1996/1997, and it increased steadily since that time. At present, Germany is one of the largest pellet markets worldwide and the largest in Europe in terms of produced and consumed volumes and installed produc-tion capacities. In terms of per capita volumes though, Austria is undoubtedly in first place.
Figure 3 Pellet production and domestic demand in Germany 2009
Grey column: capacity, orange: production, white: consumption
Source: German Pellet Institute (DEPI)
After the massive expansion of production capacities in 2007, the industry stabilised in 2008. Almost 1.6 million tonnes of pellets were produced, 1.1 million tonnes were con-sumed on domestic market, 28 % of production were exported1.
In 2009, pellet production was mainly based on sawn wood with a share of 70 percent,, around 30 percent were produced from round wood not suitable for sawing. Material from short rotation coppice has not played an important role in pellet production so far.
Pellet trade is continously increasing. The Deutscher Energieholz- und Pelletverband e.V. (DEPV) lists 70 companies producing pressed wood products and 300 distributing firms offering them to big traders, to the specialised pellet trade and to small energy dealers expanding their traditional offer of heating oil with pellets2. The largest manufacturer of wood pellets in Europe is at present the German Pellets GmbH, founded in 2005 in Wis-mar and operating now eight plants in the north, east, south and southwest of Germany.
1 DEPI 2010: Marktreport Heizen mit Pellets. 2 ibid.
14

www.4biomass.eu
Biomass - Fostering the Sustainable Usage of Renewable Energy Sources in Central Europe – Putting Biomass into Action!
Figure 4 Total amount of pellet heating installations in Germany 2009
Source:Deutsches Pellet Institut (DEPI)
Figure 5 Distribution of pellet heating applications in Germany
Source: Deutsches Pelletinstitut (DPI) 2009
As figure 5 shows, 125.000 pellet heating installations were in operation in 2009, for the year 2010 the DEPV expects an increase to 150.000. Around 60 percent are operated in Bavaria and Baden-Württemberg, the demand in northern and eastern Germany seems to be also increasing. Around 8.000 employment places contributed to strengthen re-gional economic structures in 2009, the turnover of wood pellets market amounted up to 1.2 billion Euro in the same year.
15
www.4biomass.eu
Biomass - Fostering the Sustainable Usage of Renewable Energy Sources in Central Europe – Putting Biomass into Action!
The German quality standards for pellets DIN 51731 and the substantially stricter DIN-plus (more than 90 percent of the total pellet production are certified DINplus pellets1) will be replaced by the Enplus sign newly developed by Deutsches Pellet Institut (DEPI), Deutsches Biomasseforschungszentrum (DBFZ) and the Austrian Pellet Association Pro Pellets Austria. Within 2010 the new European norm for wood pellets EN 14961-2 shall be implemented in Germany. With this new norm not only production but also trading of pellets will be regarded2.
Due to the significantly increasing role of pellets and to the fact that Europe is currently the largest market for pellets, national pellet associations from Austria, Finland; France, Germany, Hungary, Italy, Portugal, Spain, Sweden and Switzerland have established on 1 July 2010 the European Pellets Council as a common European platform. The Council will be organised by the European Biomass Association AEBIOM, Christian Rakos from proPellet Austria was elected as the first president. The European Pellet Council will pro-mote pellets from a niche product to a major energy commodity3.
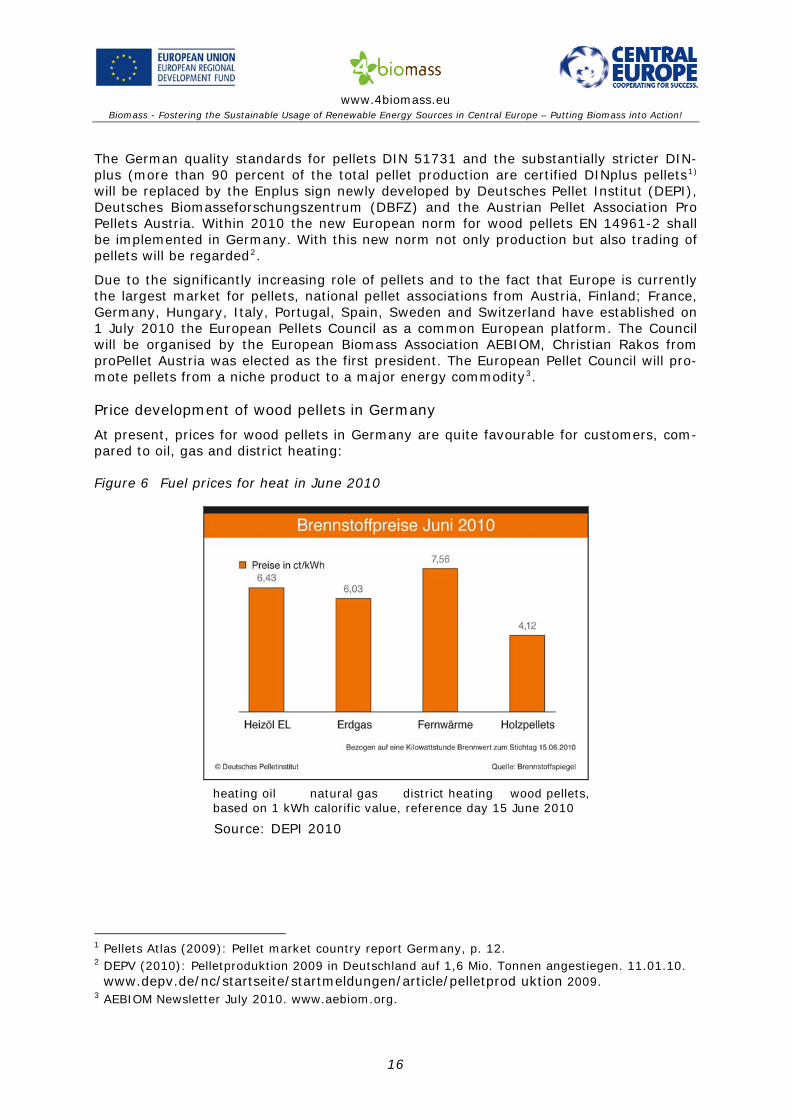
Price development of wood pellets in Germany
At present, prices for wood pellets in Germany are quite favourable for customers, com-pared to oil, gas and district heating:
Figure 6 Fuel prices for heat in June 2010
heating oil natural gas district heating wood pellets, based on 1 kWh calorific value, reference day 15 June 2010
Source: DEPI 2010
1 Pellets Atlas (2009): Pellet market country report Germany, p. 12. 2 DEPV (2010): Pelletproduktion 2009 in Deutschland auf 1,6 Mio. Tonnen angestiegen. 11.01.10.
www depv de/nc/startseite/startmeldungen/article/pelletprod. . uktion 2009. 3 AEBIOM Newsletter July 2010. www.aebiom.org.
16
www.4biomass.eu
Biomass - Fostering the Sustainable Usage of Renewable Energy Sources in Central Europe – Putting Biomass into Action!
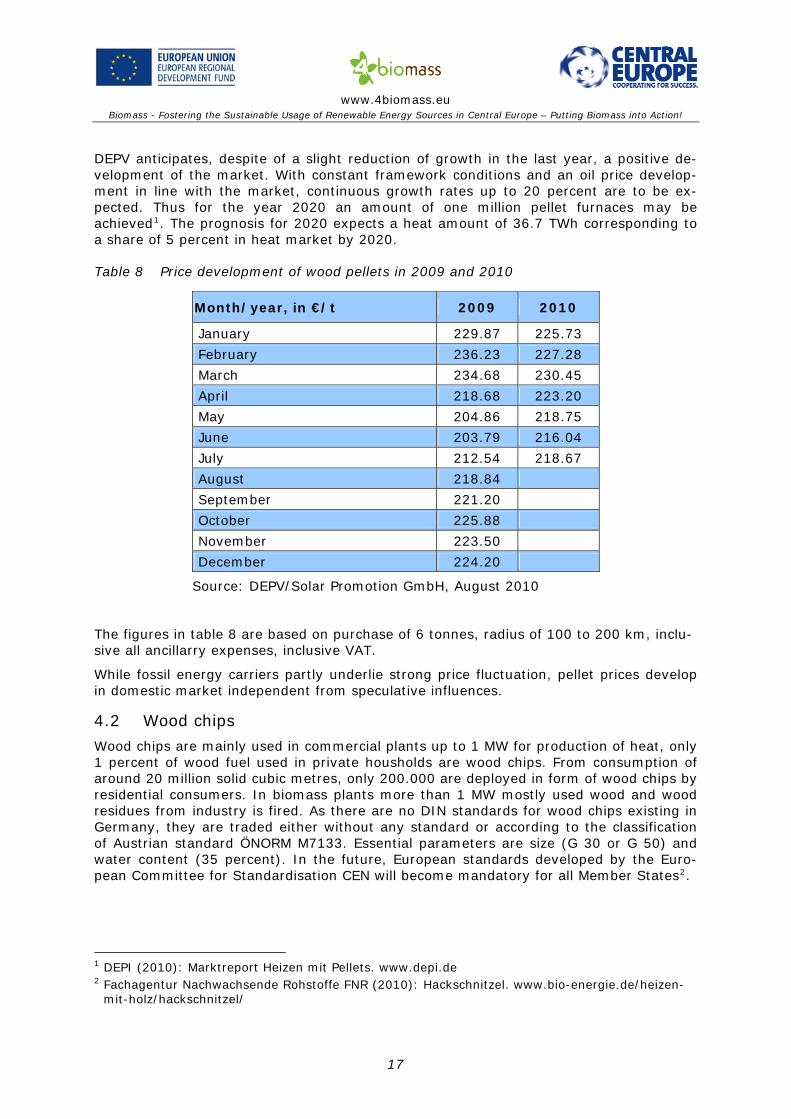
DEPV anticipates, despite of a slight reduction of growth in the last year, a positive de-velopment of the market. With constant framework conditions and an oil price develop-ment in line with the market, continuous growth rates up to 20 percent are to be ex-pected. Thus for the year 2020 an amount of one million pellet furnaces may be achieved1. The prognosis for 2020 expects a heat amount of 36.7 TWh corresponding to a share of 5 percent in heat market by 2020.
Table 8 Price development of wood pellets in 2009 and 2010
Month/year, in €/t 2009 2010
January 229.87 225.73
February 236.23 227.28
March 234.68 230.45
April 218.68 223.20
May 204.86 218.75
June 203.79 216.04
July 212.54 218.67
August 218.84
September 221.20
October 225.88
November 223.50
December 224.20
Source: DEPV/Solar Promotion GmbH, August 2010
The figures in table 8 are based on purchase of 6 tonnes, radius of 100 to 200 km, inclu-sive all ancillarry expenses, inclusive VAT.
While fossil energy carriers partly underlie strong price fluctuation, pellet prices develop in domestic market independent from speculative influences.
4.2 Wood chips
Wood chips are mainly used in commercial plants up to 1 MW for production of heat, only 1 percent of wood fuel used in private housholds are wood chips. From consumption of around 20 million solid cubic metres, only 200.000 are deployed in form of wood chips by residential consumers. In biomass plants more than 1 MW mostly used wood and wood residues from industry is fired. As there are no DIN standards for wood chips existing in Germany, they are traded either without any standard or according to the classification of Austrian standard ÖNORM M7133. Essential parameters are size (G 30 or G 50) and water content (35 percent). In the future, European standards developed by the Euro-pean Committee for Standardisation CEN will become mandatory for all Member States2.
1 DEPI (2010): Marktreport Heizen mit Pellets. www.depi.de 2 Fachagentur Nachwachsende Rohstoffe FNR (2010): Hackschnitzel. www.bio-energie.de/heizen-
mit-holz/hackschnitzel/
17
www.4biomass.eu
Biomass - Fostering the Sustainable Usage of Renewable Energy Sources in Central Europe – Putting Biomass into Action!
Price development for wood chips
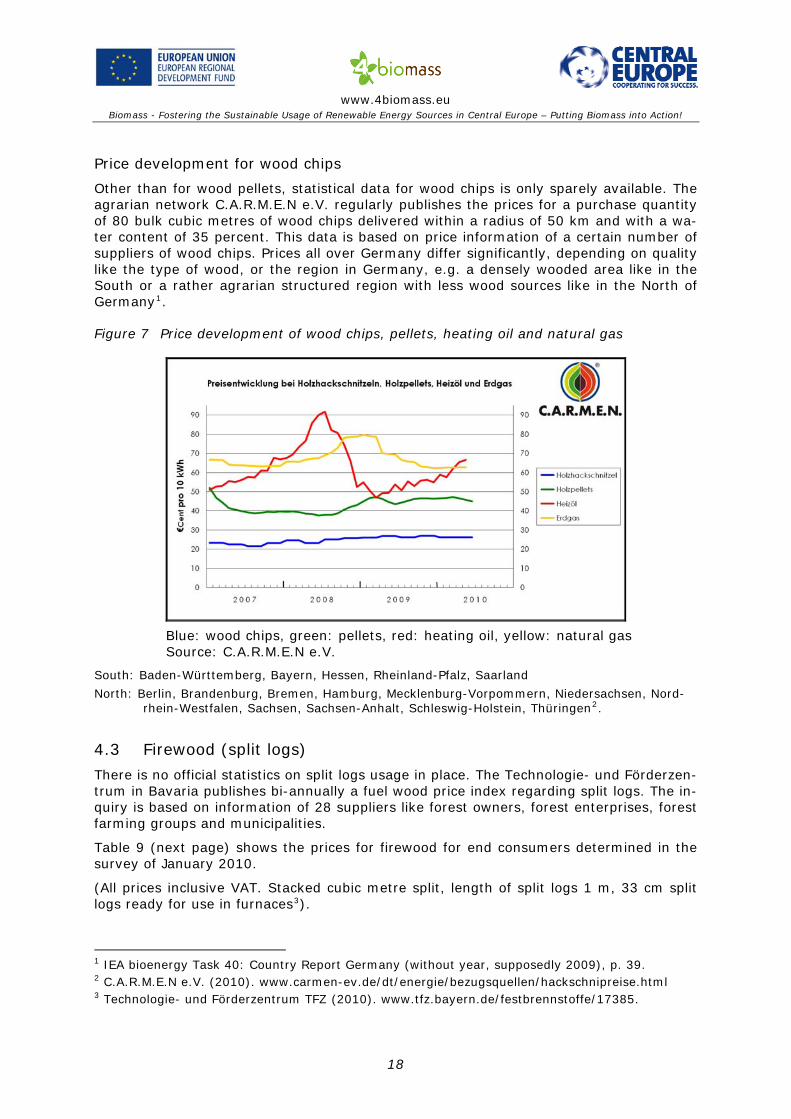
Other than for wood pellets, statistical data for wood chips is only sparely available. The agrarian network C.A.R.M.E.N e.V. regularly publishes the prices for a purchase quantity of 80 bulk cubic metres of wood chips delivered within a radius of 50 km and with a wa-ter content of 35 percent. This data is based on price information of a certain number of suppliers of wood chips. Prices all over Germany differ significantly, depending on quality like the type of wood, or the region in Germany, e.g. a densely wooded area like in the South or a rather agrarian structured region with less wood sources like in the North of Germany1.
Figure 7 Price development of wood chips, pellets, heating oil and natural gas
Blue: wood chips, green: pellets, red: heating oil, yellow: natural gas
Source: C.A.R.M.E.N e.V.
South: Baden-Württemberg, Bayern, Hessen, Rheinland-Pfalz, Saarland
North: Berlin, Brandenburg, Bremen, Hamburg, Mecklenburg-Vorpommern, Niedersachsen, Nord-rhein-Westfalen, Sachsen, Sachsen-Anhalt, Schleswig-Holstein, Thüringen2.
4.3 Firewood (split logs)
There is no official statistics on split logs usage in place. The Technologie- und Förderzen-trum in Bavaria publishes bi-annually a fuel wood price index regarding split logs. The in-quiry is based on information of 28 suppliers like forest owners, forest enterprises, forest farming groups and municipalities.
Table 9 (next page) shows the prices for firewood for end consumers determined in the survey of January 2010.
(All prices inclusive VAT. Stacked cubic metre split, length of split logs 1 m, 33 cm split logs ready for use in furnaces3).
1 IEA bioenergy Task 40: Country Report Germany (without year, supposedly 2009), p. 39. 2 C.A.R.M.E.N e.V. (2010). www.carmen-ev.de/dt/energie/bezugsquellen/hackschnipreise.html 3 Technologie- und Förderzentrum TFZ (2010). www.tfz.bayern.de/festbrennstoffe/17385.
18
www.4biomass.eu
Biomass - Fostering the Sustainable Usage of Renewable Energy Sources in Central Europe – Putting Biomass into Action!
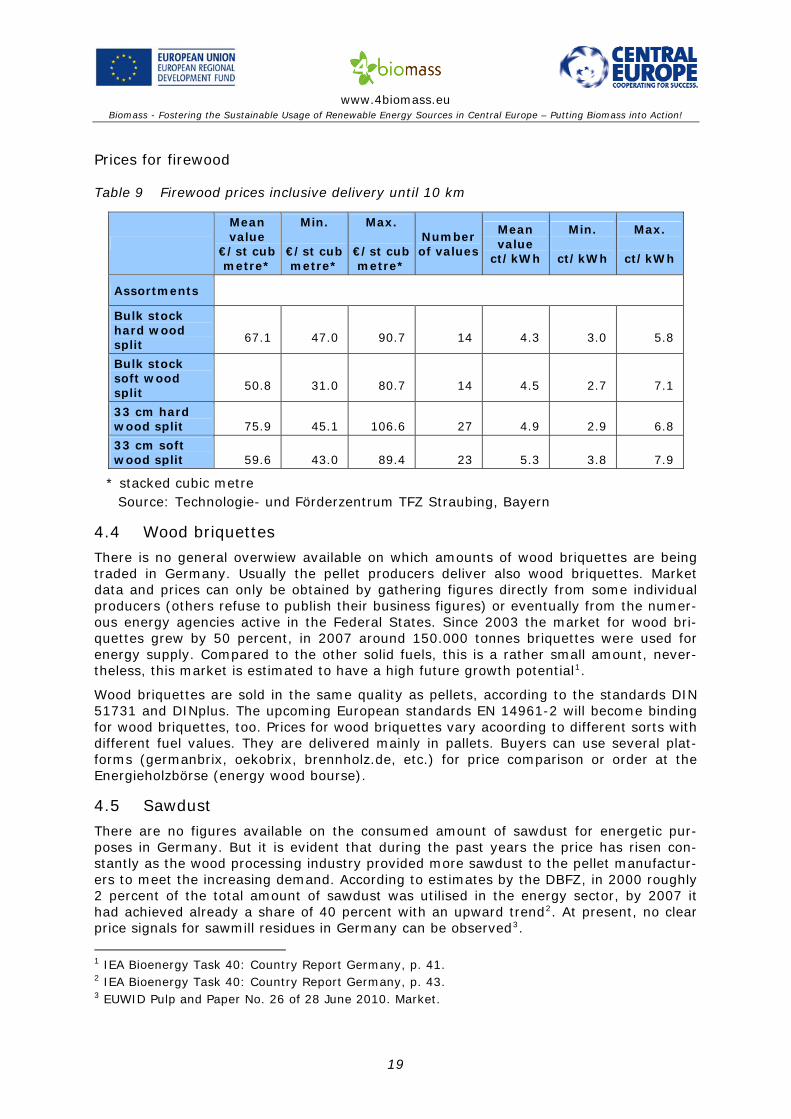
Prices for firewood
Table 9 Firewood prices inclusive delivery until 10 km
Mean value
€/st cub metre*
Min.
€/st cub metre*
Max.
€/st cub metre*
Number of values
Mean value
ct/kWh
Min.
ct/kWh
Max.
ct/kWh
Assortments
Bulk stock hard wood split
67.1
47.0
90.7
14
4.3
3.0
5.8
Bulk stock soft wood split
50.8
31.0
80.7
14
4.5
2.7
7.1
33 cm hard wood split
75.9
45.1
106.6
27
4.9
2.9
6.8
33 cm soft wood split
59.6
43.0
89.4
23
5.3
3.8
7.9
* stacked cubic metre Source: Technologie- und Förderzentrum TFZ Straubing, Bayern
4.4 Wood briquettes
There is no general overwiew available on which amounts of wood briquettes are being traded in Germany. Usually the pellet producers deliver also wood briquettes. Market data and prices can only be obtained by gathering figures directly from some individual producers (others refuse to publish their business figures) or eventually from the numer-ous energy agencies active in the Federal States. Since 2003 the market for wood bri-quettes grew by 50 percent, in 2007 around 150.000 tonnes briquettes were used for energy supply. Compared to the other solid fuels, this is a rather small amount, never-theless, this market is estimated to have a high future growth potential1.
Wood briquettes are sold in the same quality as pellets, according to the standards DIN 51731 and DINplus. The upcoming European standards EN 14961-2 will become binding for wood briquettes, too. Prices for wood briquettes vary acoording to different sorts with different fuel values. They are delivered mainly in pallets. Buyers can use several plat-forms (germanbrix, oekobrix, brennholz.de, etc.) for price comparison or order at the Energieholzbörse (energy wood bourse).
4.5 Sawdust
There are no figures available on the consumed amount of sawdust for energetic pur-poses in Germany. But it is evident that during the past years the price has risen con-stantly as the wood processing industry provided more sawdust to the pellet manufactur-ers to meet the increasing demand. According to estimates by the DBFZ, in 2000 roughly 2 percent of the total amount of sawdust was utilised in the energy sector, by 2007 it had achieved already a share of 40 percent with an upward trend2. At present, no clear price signals for sawmill residues in Germany can be observed3.
1 IEA Bioenergy Task 40: Country Report Germany, p. 41. 2 IEA Bioenergy Task 40: Country Report Germany, p. 43. 3 EUWID Pulp and Paper No. 26 of 28 June 2010. Market.
19
www.4biomass.eu
Biomass - Fostering the Sustainable Usage of Renewable Energy Sources in Central Europe – Putting Biomass into Action!
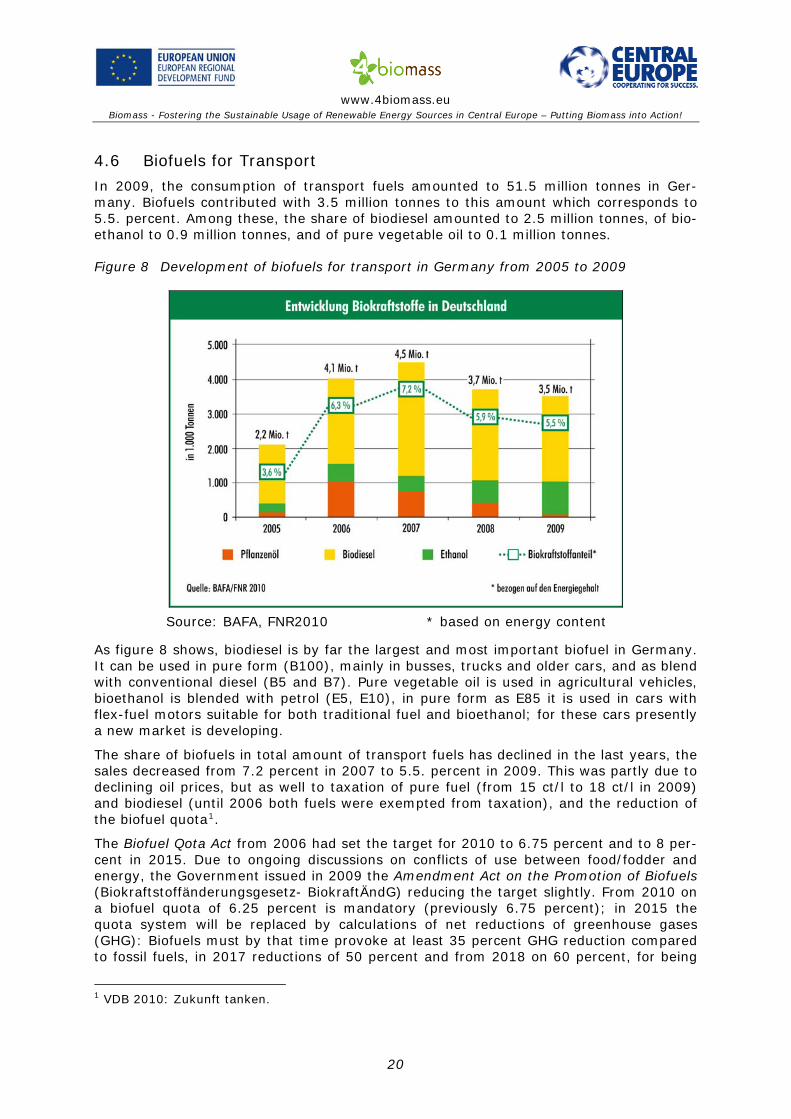
4.6 Biofuels for Transport
In 2009, the consumption of transport fuels amounted to 51.5 million tonnes in Ger-many. Biofuels contributed with 3.5 million tonnes to this amount which corresponds to 5.5. percent. Among these, the share of biodiesel amounted to 2.5 million tonnes, of bio-ethanol to 0.9 million tonnes, and of pure vegetable oil to 0.1 million tonnes.
Figure 8 Development of biofuels for transport in Germany from 2005 to 2009
Source: BAFA, FNR2010 * based on energy content
As figure 8 shows, biodiesel is by far the largest and most important biofuel in Germany. It can be used in pure form (B100), mainly in busses, trucks and older cars, and as blend with conventional diesel (B5 and B7). Pure vegetable oil is used in agricultural vehicles, bioethanol is blended with petrol (E5, E10), in pure form as E85 it is used in cars with flex-fuel motors suitable for both traditional fuel and bioethanol; for these cars presently a new market is developing.
The share of biofuels in total amount of transport fuels has declined in the last years, the sales decreased from 7.2 percent in 2007 to 5.5. percent in 2009. This was partly due to declining oil prices, but as well to taxation of pure fuel (from 15 ct/l to 18 ct/l in 2009) and biodiesel (until 2006 both fuels were exempted from taxation), and the reduction of the biofuel quota1.
The Biofuel Qota Act from 2006 had set the target for 2010 to 6.75 percent and to 8 per-cent in 2015. Due to ongoing discussions on conflicts of use between food/fodder and energy, the Government issued in 2009 the Amendment Act on the Promotion of Biofuels (Biokraftstoffänderungsgesetz- BiokraftÄndG) reducing the target slightly. From 2010 on a biofuel quota of 6.25 percent is mandatory (previously 6.75 percent); in 2015 the quota system will be replaced by calculations of net reductions of greenhouse gases (GHG): Biofuels must by that time provoke at least 35 percent GHG reduction compared to fossil fuels, in 2017 reductions of 50 percent and from 2018 on 60 percent, for being
1 VDB 2010: Zukunft tanken.
20

www.4biomass.eu
Biomass - Fostering the Sustainable Usage of Renewable Energy Sources in Central Europe – Putting Biomass into Action!
counted against the 10 percent EU reduction target for 2020. This caused severe overca-pacities in manufacturing facilities.
Table 10 Minimum share of biofuels (energetic) in total transport fuel consumption
Year Before amend-
ment After amendment
2009 6.25 % 5.25 %
2010 6.75 % 6.25 %
Net GHG emis-sion reduction
2015 8 % circa 5.1 % - 3 %
2020 15-17 % circa 12 % - 10 %
Source: AEE (2010): Biokraftstoffe. Marktentwicklung, Klima- und Umweltbilanz und Nutzungskonkurrenzen. August 2010
Particularly the breakdown of the sales of pure biodiesel (B100) and simultaneously the import of less expensive biodiesel based on soy oil from the U.S. and South America us-ing export subsidies, caused a decrease of the number of biodiesel plants and filling sta-tions: At the beginning of 2010, around 50 percent of biodiesel manufacturing facilities had stopped production or were insolvent, the number of filling stations offering pure biodiesel decreased from 1.900 in 2007 to only 200 in 20101.
Several Biofuel Associations stipulated in a Memorandum to increase again the biofuel quota already in 2011 to 7 percent, and continue in annual steps to 10 percent in 20202. However, due to increasing efficiency of technologies used, transport fuel demand in Germany will decrease perceptably in the coming years, primarily regarding petrol. So in 2003 an amount of 25.900 tonnes of petrol had been needed, estimations for 2025 an-ticipate only 13.600 tonnes.
The only big industrial biofuels producer in Europe is the German VERBIO Vereinigte Bio-Energie AG with a capacity of 450.000 tonnes biodiesel and 300.000 tonnes bioethanol annually, as well as pharmaglycerine as a co-product for cosmetic industry. By process optimisation and technological innovation a production circle has been achieved – the mash from bioethanol production is partly prepared for feed for cows and pigs and partly used in biogas plants, and the produced biogas delivers then the energy for the produc-tion process again. This leads to an almost complete energetic utilisation of the deployed raw material and allows at the same time savings of 80 percent of CO2 emissions. In 2009 the VERBIO Group achieved a turnover of 501.7 million Euro with 411 employees. Nevertheless, on reason of the economic crisis in the last year, biodiesel exports to East-ern Europe decreased considerably (see chapter on export of biofuels, p. 24). Bioethanol production of 180.762 tonnes in 2009 compared to 138.478 tonnes in 2008 were almost completely used in domestic blending market. The share of VERBIO in E85 sales in Ger-many amounts to 50 percent3.
1 AEE (2010): Biokraftstoffe. Marktentwicklung, Klima- und Umweltbilanz und Nutzungskonkurren-
zen. Renews Spezial, Ausgabe 38, August 2010, p. 8. 2 BDBe, UFOP, VDB 2010: Memorandum der Verbände der deutschen Biokraftstoffwirtschaft BDBe,
UFOP und VDB zur Beimischung von Biokraftstoffen. 30 März 2010. 3 VERBIO (Vereinigte BioEnergie AG). http://www.co2-handel.de/article341_13936.html. 06.
August 2010
21
www.4biomass.eu
Biomass - Fostering the Sustainable Usage of Renewable Energy Sources in Central Europe – Putting Biomass into Action!
Prices for transport biofuels
Biodiesel
As already stated, biodiesel achieved with an amount of 2.5 million tonnes in 2009 by far the greatest market potential in biofuel transport sector. Actual prices for road transport are shown in the following table:
Table 11 Actual prices for biodiesel at filling stations in August 2010 (week 30)
Prices for biodiesel at filling stations In cent/litre, inclusive energy tax (18.6 cent/litre) and VAT (19 %)
Week 30 Previous week July 2010 Change in ct
North 107.50 106.30 107.74 1.20
East 109.70 109.33 109.51 0.37
West 108.72 110.69 109.38 -1.97
South 108.85 108.81 108.80 0.04
Price spread
91.9-116.9 90.9-116.9
Source: AMI GmbH 2010. Website UFOP. www.ufop.de
Compared to fossil diesel, biodiesel is around 10 cent less expensive.
Table 12 Prices for mineral diesel at filling stations in August 2010 (week 30)
Prices for mineral diesel at filling stations In cent/litre, inclusive mineral oil tax (47.04 cent/litre) and VAT (19 %)
Week 30 Previous week July 2010 Change in ct
North 117.70 116.90 118.26 0.8
East 119.11 118.28 119.73 0.8
West 120.30 119.32 120.22 0.9
South 119.47 117.84 119.91 1.6
Price spread
113.9-125.9 112.9-127.9
Source: AMI GmbH 2010. Website UFOP. www.ufop.de
Several biofuel associations claim a minimum difference between mineral diesel and bio-diesel of at least 10 percent to be granted.
Bioethanol
The production of bioethanol started in Germany only in 2005. By 2009 it amounted to 591.000 tonnes, an increase of 29 percent compared to the previous year. One third was produced from sugar beets, 65 percent from grain like wheat, maize or rye. Other raw material like residues from food industry are with a share of three percent still marginal. Bioethanol utilisation increased even stronger than production, it amounted to 903.000 tonnes in 2009, an increase of 44 percent compared to the previous year. 693.000 ton-nes have been blended at an amount of five percent with petrol (E5) according to stan-dard EN DIN 228. From January 2011 on, 10 percent bioethanol will be blended with pet-rol (E10). Experts anticipate for the blending market in 2010 further increase, particulary when E10 will be introduced not only in German market but as well in the whole of
22
www.4biomass.eu
Biomass - Fostering the Sustainable Usage of Renewable Energy Sources in Central Europe – Putting Biomass into Action!
Europe. A number of countries just start blending biofuels with traditional fuels as is re-quired by EU RES Directive 20091.
Table 13 Bioethanol consumption in Germany in 2009 in 1000 tonnes
2009 2009 aggregated Change to 2008
Petrol in total 20.232 -1.6 %
Thereof: Bioethanol for ETBE 202 -45 %
Thereof: Bioethanol for blends 693 +176 %
Bioethanol in E 85 9.0 +6 %
Bioethanol in total 903 +44 %
Source: BDBe Statistik 2009
On rather low level stayed the use of pure biothanol E85 (this is a blend with 15 percent petrol) in the last year. The market for E85 is presently in initial stage, as only FlexiFuel Vehicles (FFV) dispose of the necessary technology; their number is anticipated to in-crease in the time coming though. The price for E85 is usually 20 percent less than that for traditional super mineral fuel, according to the Energy Taxation Act from 2006 the share of bioethanol in blends is exempted from mineral oil tax until 2015.
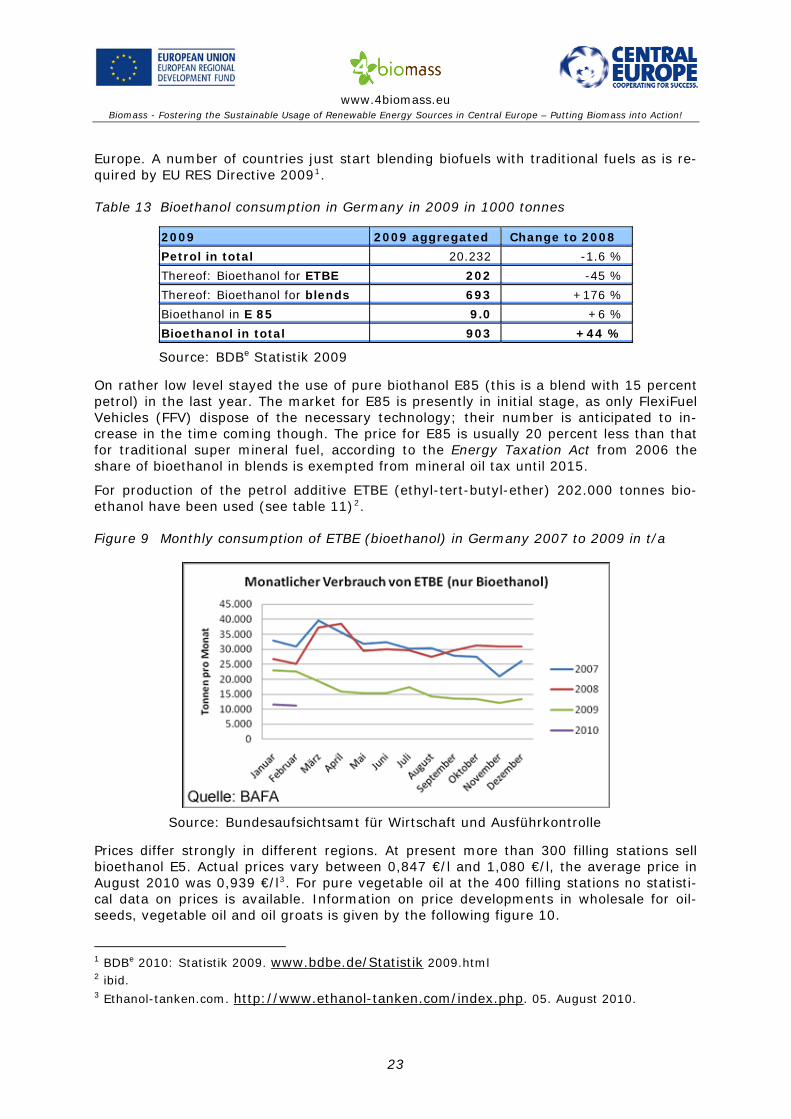
For production of the petrol additive ETBE (ethyl-tert-butyl-ether) 202.000 tonnes bio-ethanol have been used (see table 11)2.
Figure 9 Monthly consumption of ETBE (bioethanol) in Germany 2007 to 2009 in t/a
Source: Bundesaufsichtsamt für Wirtschaft und Ausführkontrolle
Prices differ strongly in different regions. At present more than 300 filling stations sell bioethanol E5. Actual prices vary between 0,847 €/l and 1,080 €/l, the average price in August 2010 was 0,939 €/l3. For pure vegetable oil at the 400 filling stations no statisti-cal data on prices is available. Information on price developments in wholesale for oil-seeds, vegetable oil and oil groats is given by the following figure 10.
1 BDBe 2010: Statistik 2009. www.bdbe.de/Statistik 2009.html 2 ibid. 3 Ethanol-tanken.com. http://www.ethanol-tanken.com/index.php. 05. August 2010.
23

www.4biomass.eu
Biomass - Fostering the Sustainable Usage of Renewable Energy Sources in Central Europe – Putting Biomass into Action!
Figure 10 Price developments of oilseeds, vegetable oil and oil groats
Source: UFOP website. 05. August 2010.
24

www.4biomass.eu
Biomass - Fostering the Sustainable Usage of Renewable Energy Sources in Central Europe – Putting Biomass into Action!
Synthetic biofuels (BtL or 2nd generation fuels, biodiesel and bioethanol from lignocellu-lose) are still in testing phase and presumably not available on the market before 2020.
4.7 Biomethane
The trade with biomethane is a newly developing market in Germany. Presently, 40 bio-methane plants are in operation feeding into the natural gas grid, by the end of 2010 an increase to 70 plants is expected. They will feed-in around 50.000 Nm3 per hour into the grid.
The German Energy Agency (dena) presented on 22 September 2010 the Biogas Register Germany in Berlin. This register secures an efficient and reliable documentation of bio-methane creating an intersectoral standard for proof of origin and characteristics of up-graded biogas to be fed into the natural gas grid. Producers, retailers, consumers and authorised inspectors can apply for registration, the amounts of biogas produced and sold will be documented. This is expected to give a push to German-wide biogas trading1.
The German government supports the demand for biomethane by several promotion in-struments like Renewable Energy Sources Act, Federal Imission Control Act, Renewable Energy Heat Law. Only, some associations claim to strenghten support instruments, par-ticularly the Renewable Energy Heat Law (EEWärmeG) to accelerate the development of a heat market for biomethane, otherwise the German targets of 6 billion Nm3 bio-methane feed-in annually by 2020 and 10 billion Nm3 by 2030 will not be achieved2.
5 International Bioenergy Trade Flows
In Germany 90 percent of utilised bioenergy are of domestic origin, only 10 percent are imported from other countries, at present apparently in first line from neighbouring coun-tries. This seems to be true also for exports. But it can be observed that more and more a global market for biomass is developing. So for example, Canada exports residues from wood industry in form of pellets on ships to Belgium, the Netherlands, and Sweden3.
Biomass can be imported as raw material or as a refined bioenergy carrier. Particularly biomass and bioenergy with high energy density and already well established logistic concepts possess the best technical preconditions for transport. This pertains presently to
• Solid bioenergy carriers and raw material with high bulk density like e.g. pellets and wood chips, grain and seeds
• Liquid bioenergy carriers like biodiesel, bioethanol, vegetable oil • Biomethane (biogas upgraded to natural gas)4.
In Germany, exports of pellets exceed imports. In 2007 they amounted to around 50 percent of production, imports amounted to about 30 percent of domestic consumption. Biodiesel exports, however, are on a similar level to imports5.
1 Dena 2010: Biogasregister Deutschland geht an den Start. Einheitliches Dokumentationssystem
stärkt Markt für Biogas im Erdgasnetz. Press release 22.09.2010. 2 Dena 2010: Biomethan im KWK- und Wärmemarkt. Projekt Biogaspartner. July 2010, p.5. 3 TU Vienna 2009: Lukas Kranzl in Press Release from 16.02.2009.
www. .tuwien.ac.at/aktuelles/news_detail/article/5466/ 4 NREAP Germany. German version, p.99. 5 IEA Bioenergy Task 40: Country Report Germany. July 2009, p.45.
25
www.4biomass.eu
Biomass - Fostering the Sustainable Usage of Renewable Energy Sources in Central Europe – Putting Biomass into Action!
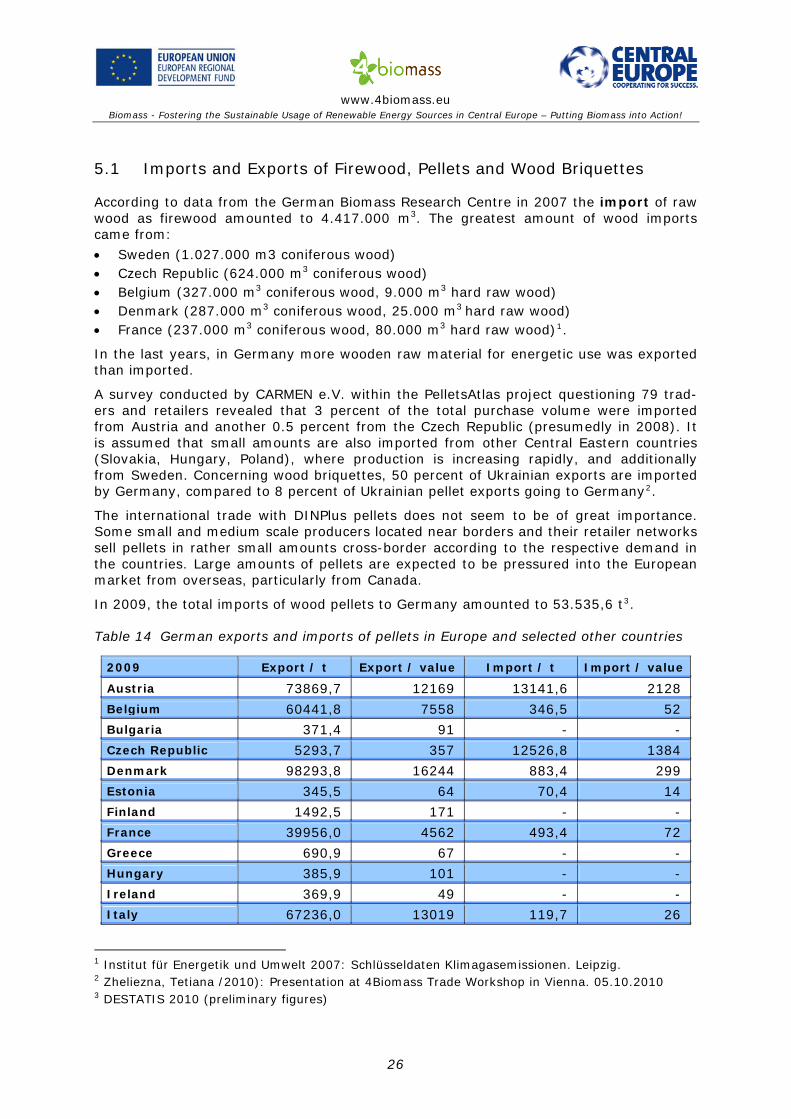
5.1 Imports and Exports of Firewood, Pellets and Wood Briquettes
According to data from the German Biomass Research Centre in 2007 the import of raw wood as firewood amounted to 4.417.000 m3. The greatest amount of wood imports came from:
• Sweden (1.027.000 m3 coniferous wood) • Czech Republic (624.000 m3 coniferous wood) • Belgium (327.000 m3 coniferous wood, 9.000 m3 hard raw wood) • Denmark (287.000 m3 coniferous wood, 25.000 m3 hard raw wood) • France (237.000 m3 coniferous wood, 80.000 m3 hard raw wood)1.
In the last years, in Germany more wooden raw material for energetic use was exported than imported.
A survey conducted by CARMEN e.V. within the PelletsAtlas project questioning 79 trad-ers and retailers revealed that 3 percent of the total purchase volume were imported from Austria and another 0.5 percent from the Czech Republic (presumedly in 2008). It is assumed that small amounts are also imported from other Central Eastern countries (Slovakia, Hungary, Poland), where production is increasing rapidly, and additionally from Sweden. Concerning wood briquettes, 50 percent of Ukrainian exports are imported by Germany, compared to 8 percent of Ukrainian pellet exports going to Germany2.
The international trade with DINPlus pellets does not seem to be of great importance. Some small and medium scale producers located near borders and their retailer networks sell pellets in rather small amounts cross-border according to the respective demand in the countries. Large amounts of pellets are expected to be pressured into the European market from overseas, particularly from Canada.
In 2009, the total imports of wood pellets to Germany amounted to 53.535,6 t3.
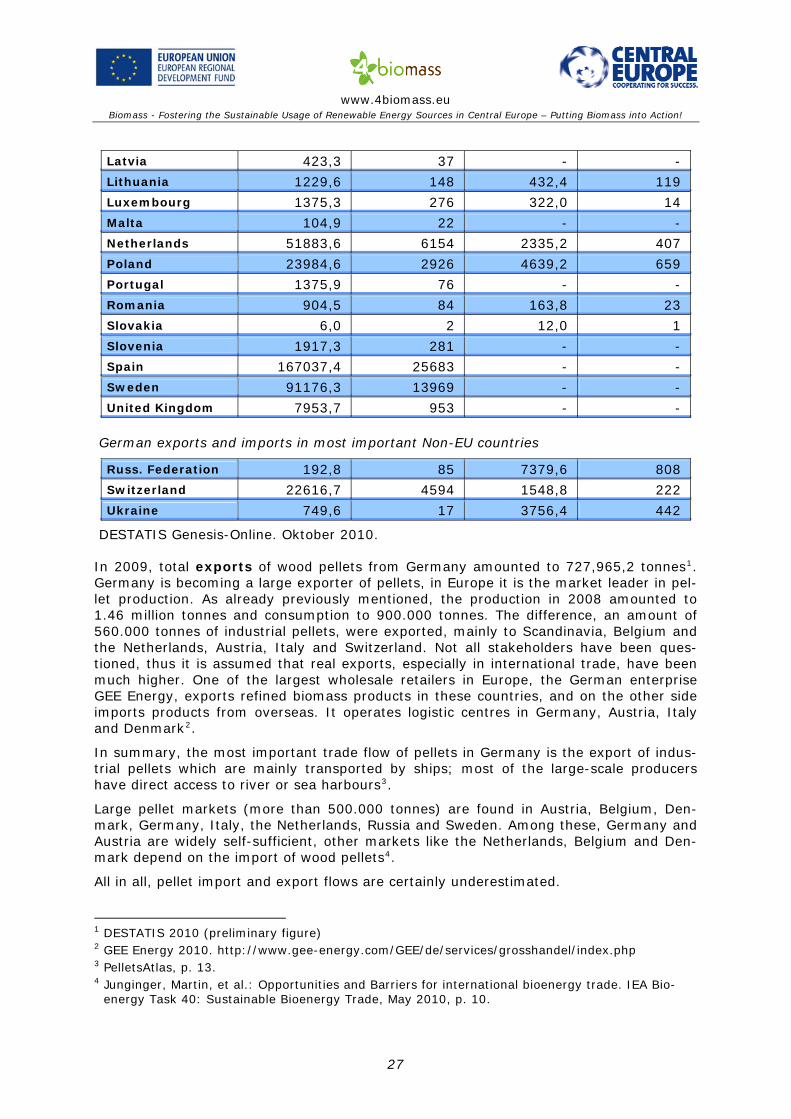
Table 14 German exports and imports of pellets in Europe and selected other countries
2009 Export / t Export / value Import / t Import / value
Austria 73869,7 12169 13141,6 2128
Belgium 60441,8 7558 346,5 52 Bulgaria 371,4 91 - -
Czech Republic 5293,7 357 12526,8 1384
Denmark 98293,8 16244 883,4 299 Estonia 345,5 64 70,4 14
Finland 1492,5 171 - - France 39956,0 4562 493,4 72
Greece 690,9 67 - - Hungary 385,9 101 - -
Ireland 369,9 49 - - Italy 67236,0 13019 119,7 26
1 Institut für Energetik und Umwelt 2007: Schlüsseldaten Klimagasemissionen. Leipzig. 2 Zheliezna, Tetiana /2010): Presentation at 4Biomass Trade Workshop in Vienna. 05.10.2010 3 DESTATIS 2010 (preliminary figures)
26
www.4biomass.eu
Biomass - Fostering the Sustainable Usage of Renewable Energy Sources in Central Europe – Putting Biomass into Action!
Latvia 423,3 37 - -
Lithuania 1229,6 148 432,4 119 Luxembourg 1375,3 276 322,0 14
Malta 104,9 22 - - Netherlands 51883,6 6154 2335,2 407
Poland 23984,6 2926 4639,2 659 Portugal 1375,9 76 - -
Romania 904,5 84 163,8 23 Slovakia 6,0 2 12,0 1
Slovenia 1917,3 281 - - Spain 167037,4 25683 - -
Sweden 91176,3 13969 - -
United Kingdom 7953,7 953 - -
German exports and imports in most important Non-EU countries
Russ. Federation 192,8 85 7379,6 808 Switzerland 22616,7 4594 1548,8 222
Ukraine 749,6 17 3756,4 442
DESTATIS Genesis-Online. Oktober 2010.
In 2009, total exports of wood pellets from Germany amounted to 727,965,2 tonnes1. Germany is becoming a large exporter of pellets, in Europe it is the market leader in pel-let production. As already previously mentioned, the production in 2008 amounted to 1.46 million tonnes and consumption to 900.000 tonnes. The difference, an amount of 560.000 tonnes of industrial pellets, were exported, mainly to Scandinavia, Belgium and the Netherlands, Austria, Italy and Switzerland. Not all stakeholders have been ques-tioned, thus it is assumed that real exports, especially in international trade, have been much higher. One of the largest wholesale retailers in Europe, the German enterprise GEE Energy, exports refined biomass products in these countries, and on the other side imports products from overseas. It operates logistic centres in Germany, Austria, Italy and Denmark2.
In summary, the most important trade flow of pellets in Germany is the export of indus-trial pellets which are mainly transported by ships; most of the large-scale producers have direct access to river or sea harbours3.
Large pellet markets (more than 500.000 tonnes) are found in Austria, Belgium, Den-mark, Germany, Italy, the Netherlands, Russia and Sweden. Among these, Germany and Austria are widely self-sufficient, other markets like the Netherlands, Belgium and Den-mark depend on the import of wood pellets4.
All in all, pellet import and export flows are certainly underestimated.
1 DESTATIS 2010 (preliminary figure) 2 GEE Energy 2010. http://www.gee-energy.com/GEE/de/services/grosshandel/index.php 3 PelletsAtlas, p. 13. 4 Junginger, Martin, et al.: Opportunities and Barriers for international bioenergy trade. IEA Bio-
energy Task 40: Sustainable Bioenergy Trade, May 2010, p. 10.
27
www.4biomass.eu
Biomass - Fostering the Sustainable Usage of Renewable Energy Sources in Central Europe – Putting Biomass into Action!
5.2 Imports and Exports of Biofuels for Transport
In Germany, biofuels for transport primarily are produced from domestic biomass, i.e. vegetable oil from rapeseed for biodiesel, and grain and sugar beets for bioethanol.
Imports of biomass for production of transport fuel are still marginal compared to im-ports for animal feed. In the past years, biofuels and biomass for their production have been imported from other Member States, e.g. France and Spain, and from United States, Argentine, Brazil; some amounts came from some Eastern European countries. Thus e.g. imports of rapeseed from Ukraine to Germany for biodiesel production amounted in 2008/2009 to 131.000 tonnes1. From 2.5 million tonnes of biodiesel con-sumed in Germany in 2009, only 5.2 percent came from imported palm oil2. This is also due to the fact that palm oil at low temperatures solidifies and thus is not suitable for use in Central and North Europe. Furthermore, the technical standards for biodiesel cannot be achieved with palm oil, therefore only few percentage points of it can be blended with biodiesel3.
The export of biodiesel has declined in the last two years. The aforementioned German biofuel producer VERBIO reports that in 2008 an amount of 37.4 percent of its biodiesel production were exported to Eastern Europe, whereas in 2009 only an amount 11.8 per-cent had been achieved. In contrast, due to an increased demand, the production of bio-ethanol was expanded considerably in the previous year (2009: 180.762 tonnes, com-pared to 2008: 138.478 tonnes), but nearly the total amount of bioethanol production was used for blending, so that no bioethanol was exported.
5.3 Imports and Exports of Biomethane
As aforementioned, the market for biomethane and biogas is in initial phase in Germany. Experts from Biogas Associations point to the just started biogas register which will document data on production and sales as well as on technical standards. According to the National Renewable Energy Action Plan Germany, the import of biomethane may gain a considerable importance by 2020. Presently no prognosis can be made as to how fa-vourable conditions can be created under which imports could be expected. Neither the physically available import potential nor the demand for imports by 2020 can be esti-mated; great importance may obtain the biofuels sector4.
The export quota of biogas technology amounts to 30 percent, the export volume at around 150 million Euro5.
In the German NREAP it is assumed that the national target of 18 percent renewable en-ergy in final energy consumption by 2020 will be achieved by own national resources. Es-timations expect even an amount of 19.6 percent6, so that no imports would be needed.
1 Deutsche Beratergruppe für die Ukraine: Klimaschutz und Agrarhandel: Implikationen der neuen
EU-Nachhaltigkeitsrichtlinie für die Ukraine. Ausgabe 22, Juni 2010. 2 Estimations from VDB and Greenpeace. 3 AEE (2010): Biokraftstoffe. Marktentwicklung, Klima- und Umweltbilanz und Nutzungskonkurren-
zen. Renews Spezial, Ausgabe 38, August 2010, p. 13. 4 NREAP Germany, July 2010, p. 97. 5 Agentur für Erneuerbare Energien 2010: Fakten. Die wichtigste Daten zu den Erneuerbaren ener-
gien. Schnell und kompakt. Stand 6/2010. 6 NREAP Germany 2010, p. 104.
28

www.4biomass.eu
Biomass - Fostering the Sustainable Usage of Renewable Energy Sources in Central Europe – Putting Biomass into Action!
6 Conclusion
Due to the fact that data on trade flows of domestic raw biomass for energy as well as for processed biomass like pellets, wood chips, briquettes etc. are not centrally registered but only in parts for certain suppliers or specific regions recorded, it is difficult to specify the actual traded amounts of these biomass fractions. A significant amount is sold to lo-cal and regional private and industrial customers without being documented, this con-cerns particularly used wood and residues from forests and agriculture. Only some of the big enterprises producing refined biomass, document their production and sales figures as well as their exports; this quantity is only a part of the whole traded amount. There is definitely a need for clear global bioenergy trade statistics. The same applies to imports and exports of biofuels. Biodiesel, bioethanol, palm oil, as well as domestic oilseeds proc-essed to biodiesel, are not documented as self-contained data, thus it is not possible to completely determine tradeflows of these goods.
There are some barriers for bioenergy trade: On domestic market there is an unfair com-petition of solid biomass with fossil fuels (external costs are not included in price, and they are still subsidised in some cases, e.g. hard coal). Of course, this refers not only to biomass but to all renewables. On global markets, the United States subsidise their ex-port of biodiesel and Argentina promotes its biodiesel exports fiscally. Import and export tariffs influence markets and competition negatively, so Russia e.g. has decreed in-creased export tariffs for roundwood recently. Concerning pellet markets, a global classi-fication system is lacking.
German transnational trading activities seem to concentrate rather on European area, as the main trading partners are Austria, the Baltic States and Scandinavia, Italy, the BeNe-Lux and several Central and Eastern European countries (comp. table 14). Particularly the latter could intensify their expansion of biomass potential, unrefined and refined, to boost the intra-regional trade in Central Europe. This would allow relatively short trans-portation routes and quick supply, and thus strengthen the efforts for more sustainability in supra-regional and international trade. Long-distance transports of pellets from Can-ada or palm oil from Indonesia are certainly more cost-intensive and environmentally harmful than those within and around Central Europe.
The sustainability regulation for liquid biomass and biofuels for transport in Germany and Europe will contribute not only to serious climate protection successes but might simulta-neously give a push to the introduction of globally valid ecological standards in world bio-fuels trade. “Three key issues should be addressed in any biodiversity risk-mitigation strategy: conservation of areas of significant biodiversity value; mitigation of negative ef-fects related to indirect land-use change; and promotion of agricultural practices with few negative impacts on biodiversity”1. It would be consequent to introduce sustainability standards also for solid biomass in the near future. They should become mandatory for all utilisation pathways of biomass, otherwise the non-sustainable production of food and feed will be shifted to other areas. The EU Commission is presently discussing the oppor-tunities and barriers of extending sustainability regulation on solid biomass.
In the long term, it will be crucial to not limit sustainability regulation to European area, but extend it on global trade activities. This will require a change of World Trade Organi-sation (WTO) rules towards a just and socially acceptable trade development including developing and emerging countries. The efforts for a sustainable utilisation of the global bioenergy potential may even promote an understanding of the necessity of worldwide land use planning. 1 Hennenberg, K.; Fritsche, U. R.; Wiegmann, K. (2010): The Power of Bioenergy-Related Stan-
dards to Protect Biodiversity. http://www.oeko.de/oekodoc/975/2009-074-en.pdf
29

www.4biomass.eu
Biomass - Fostering the Sustainable Usage of Renewable Energy Sources in Central Europe – Putting Biomass into Action!
7 References AEBIOM Newsletter July 2010. www aebiom org. .
AEE Agentur für Erneuerbare Energien 2010: Biokraftstoffe. Marktentwicklung, Klima- und Umweltbilanz und Nutzungskonkurrenzen. Renews Spezial, Ausgabe 38. August 2010. www. www.unendlich-viel-energie.de/
BBE (Bundesverband BioEnergie e.V.) 2010: Der Bioenergiemarkt in Zahlen 2009. www bioenergie de. .
BDBe Bundesverband der deutschen Bioethanolwirtschaft 2009: Press Release from 15.07.2010. www bdbe de/statistik2009/html. .
BDBe Statistik 2009. www.bdbe.de/statistik2009/html
BDBe/UFOP/VDB 2010: Memorandum der Verbände der deutschen Biokraftstoffwirtschaft BDBe/UFOP/VDB zur Beimischung von Biokraftstoffen. 20.03.2010
BMU/AGEE-Stat 2010 (Bundesministerium für Umwelt, Naturschutz und Reaktorsicherheit (BMU – Federal Ministry for the Environment, Nature Protection and Nuclear Safety) / Arbeitsgruppe Erneuerbare Energien-Statistik (Working Group Renewable Energy Sta-tistics)
BUND (2010): Kurzumtriebsplantagen für die Energieholzgewinnung – Chancen und Risi-ken. Juli 2010.
C.A.R.M.E.N e.V. 2010. www carmen-ev de/dt/energie/bezugsquellen/. .
Dena 2010: Erdgas und Biomethan im künftigen Kraftstoffmix. Handlungsbedarf und Lö-sungsansätze für eine beschleunigte Verwendung im Verkehr. www dena de. .
DEPI Deutsches Pellet Institut 2010: Marktreport Heizen mit Pellets. www.dpi.de
DPEV Deutscher Energieholz- und Pelletverband e.V. 2010. www depv de. .
Deutsche Beratergruppe für die Ukraine 2010: Klimaschutz und Agrarhandel: Implikatio-nen der neuen EU-Nachhaltigkeitsrichtlinies für die Ukraine. Ausgabe 22, June 2010
Ethanol-tanken.com. 2010. http://www ethanol-tanken com/index php. . . . 05.08.2010
EUWID 2010: Pulp and Paper No. 26. 2606. 2010. www.euwid.eu
FNR Fachagentur Nachwachsende Rohstoffe 2010: Press Release from 06.07.2010. www fnr de. .
Fachverband Biogas e.V. 2009: Biogas Branchenzahlen 2009. www biogas org. .
GEE Energy GmbH & Co. KG 2010. http://www gee-energy com/GEE/de/services/grosshandel/index php
.. .
Hennenberg, K.; Fritsche, U. R.; Wiegmann, K. (2010): The Power of Bioenergy-Related Standards to Protect Biodiversity. http://www.oeko.de/oekodoc/975/2009-074-en.pdf
Holzbörse Bayern. http://www.biomasseboerse.bs-bayern.de/html/angebote.php
IEA Bioenergy Task 40: Country Report Germany 2009. International Energy Agency
Institut für Energetik und Umwelt 2007: Schlüsseldaten Klimagasemissionen. Leipzig.
Junginger, Martin, et al. 2010: Opportunities and barriers for international bioenergy trade. IEA Bioenergy Trade Task 40: Sustainable Bioenergy Trade, May 2010
NREAP Germany 2010: Bundesrepublik Deutschland. Nationaler Aktionsplan für erneuer-bare Energie gemäß der Richtlinie 2009/28/EG zur Förderung der Nutzung von Ener-gie aus erneuerbaren Quellen. August 2010
Pellet Atlas 2009: Pellet market country report Germany. IEE Europe. www pelletatlas Info/pelletatlas. .
TFZ Technologie- und Förderzentrum 2010. www tfz bayern de/festbrennstoffe/17385. . .
UFOP Union zu Förderung von Ölpflanzen e.V. 2010. www.ufop.de
30

www.4biomass.eu
Biomass - Fostering the Sustainable Usage of Renewable Energy Sources in Central Europe – Putting Biomass into Action!
Umweltjournal 24.03.2010. www.umweltjournal.de
VDB Verband der Deutschen Kraftstoffindustrie e.V. 2009: Press Release from 15.07.2010. www vdb de. .
VERBIO Vereinigte BioEnergie AG 2010. http://www co2-handel de/article341_13936 html
.. . . 06.08.2010
Zheliezna, Tetiana 2010: Biomass trade flows from Ukraine to Central European coun-tries. Presentation at 4Biomass Trade Workshop in Vienna. 0510.2010. www.4biomass.eu
31