wrap coversheet theses new
TRANSCRIPT

warwick.ac.uk/lib-publications
A Thesis Submitted for the Degree of PhD at the University of Warwick
Permanent WRAP URL:
http://wrap.warwick.ac.uk/133202
Copyright and reuse:
This thesis is made available online and is protected by original copyright.
Please scroll down to view the document itself.
Please refer to the repository record for this item for information to help you to cite it.
Our policy information is available from the repository home page.
For more information, please contact the WRAP Team at: [email protected]

i
The Influence of Metallic Surface
Topography towards Adhesion of Gram-
positive & Gram-negative Bacteria
by
Ahmad Johari Mohamad
A thesis submitted in partial fulfilment of the requirements for the
degree of
Doctor of Philosophy in Engineering
University of Warwick, School of Engineering
May 2019
ii
TABLE OF CONTENTS
ACKNOWLEDGEMENT ........................................................................................................... v
DECLARATION......................................................................................................................... vi
ABSTRACT ............................................................................................................................... vii
List of Abbreviations ............................................................................................................... viii
List of Figures ............................................................................................................................... x
List of Tables ............................................................................................................................. xiv
................................................................................................................. 15
1.1 Problem Statement ....................................................................................................... 15
1.2 Background of the Study.............................................................................................. 18
1.3 Motivation for the Study .............................................................................................. 20
1.4 Aims ............................................................................................................................. 21
1.5 Project Objectives ........................................................................................................ 22
1.6 Organisation of the Thesis ........................................................................................... 24
........................................................................................................ 26
2.1 Learned from nature ..................................................................................................... 26
2.1 Biomaterial and the Application .................................................................................. 28
2.2 Surface topographies .................................................................................................... 30
2.3 Surface Wettability ...................................................................................................... 31
2.4 Surface finishing techniques ........................................................................................ 33
2.4.1 Polishing .............................................................................................................. 33
2.4.2 Wire EDM ............................................................................................................ 34
2.4.3 Laser Fabrication.................................................................................................. 35
2.6 Mechanism and Factors Governing Bacterial Adhesion .............................................. 38
2.6.1 Bacterial properties .............................................................................................. 39
2.6.2 Surface properties ................................................................................................ 40
2.6.3 Environmental Condition ..................................................................................... 44
2.6.4 Micro-organisms: S. aureus, E. coli and B. subtilis ............................................. 45
2.6.5 Wire Electrical Discharge Machine (WEDM) ..................................................... 47
2.6.6 Laser-assisted technique ....................................................................................... 48
2.6 Biological ..................................................................................................................... 49
2.7.1 Optical density (OD) ............................................................................................ 51
2.8 Chapter Summary ........................................................................................................ 54
......................................................... 55
3.1 Introduction to Partial Characterisation of Micro-organism ........................................ 55

iii
3.2 Growth curve ............................................................................................................... 56
3.3 Partial characterisation of the model organism ............................................................ 59
3.3.1 Determination of Cell Size ................................................................................... 61
3.3.2 Determination Cell Surface Hydrophobicity (CSH) ............................................ 63
3.3.3 Determination of Bacteria Zeta Potentials ........................................................... 68
3.4 Screening of the Process Condition for Bacterial Adhesion on Glass ......................... 68
3.4.1 Preliminary adhesion of E. coli and B. subtilis on the glass substrata. ................ 69
3.4.2 Effect of Cell Concentration on the Percentage of Adhesion .............................. 77
3.4.3 Effect of Culture Age on the Percentage of Adhesion ......................................... 80
3.5 Chapter Summary ........................................................................................................ 87
........................................................................................................................ 88
4.1 Introduction .................................................................................................................. 88
4.2 Polished Surface Characterisation ............................................................................... 89
4.2.1 Polished Surface Height Characterisation ............................................................ 89
4.2.2 Spatial and Hybrid Parameter Analysis ............................................................... 94
4.3 The Correlation between Contact Angles and Surface Roughness .............................. 97
4.4 Bacteria-Surface Adhesion ........................................................................................ 100
4.5 Bacterial Adhesion on Control sample ...................................................................... 101
4.6 Bacterial Adhesion on Polished Stainless-Steel ......................................................... 103
4.7 Bacterial Adhesion on Polished Titanium.................................................................. 105
4.8 Correlation Between Surface Parameter, Contact Angle and Bacterial Adhesion ..... 106
4.9 Chapter Summary ...................................................................................................... 112
............................................................................................................. 113
5.1 Introduction ................................................................................................................ 113
5.2 WEDM Surface Characterisation ............................................................................... 116
5.2.1 WEDM Height Parameter Characterisation ....................................................... 116
5.2.2 Spatial and Hybrid Parameter Characterisation ................................................. 119
5.3 The Correlation between Contact Angle Measurement and Surface Topography
Parameter............................................................................................................................ 123
5.4 Bacteria-Surface Adhesion ........................................................................................ 126
5.5 Bacterial Adhesion on WEDM stainless-steel ........................................................... 126
5.6 Bacteria Adhesion on WEDM titanium ..................................................................... 129
5.7 Correlation Between Surface Parameter, Contact Angle and Bacterial Adhesion ..... 130
5.8 Chapter Summary ...................................................................................................... 137

iv
.............................................................................................................. 138
6.1 Introduction ................................................................................................................ 138
6.2 Laser-Assisted specimen: The correlation of surface topography and wettability .... 140
6.2.1 Height Parameter Analysis ................................................................................. 141
6.2.2 Laser scan Speed correlation with Sa and Sv ..................................................... 145
6.2.3 Spatial and Hybrid Parameter Characterisation ................................................. 146
6.3 The correlation of Contact Angle with Surface Topography Parameter .................... 149
6.4 Bacterial adhesion on Stainless Steel that has undergone laser treatment ................. 153
6.5 Bacterial adhesion on Titanium that has undergone femtosecond laser treatment .... 155
6.6 Discussion on the effect of modified properties towards bacterial adhesion ............. 159
6.7 Viewing the adhesion patterns using SEM ................................................................ 165
6.8 Correlation of Wettability and Surface Topographies with Bacterial Adhesion ....... 176
6.9 Chapter Summary ...................................................................................................... 182
.......................................................................... 183
7.1 Conclusions ................................................................................................................ 183
7.2 Recommendations for future studies .......................................................................... 188
REFERENCES ......................................................................................................................... 190

v
ACKNOWLEDGEMENT
First and foremost, I would like to thank Prof X. Liu for her excellent supervision,
guidance and the never-ending support throughout the completion of this study. I would
also like to extend my gratitude to Prof Elizabeth Wellington for allowing my work to
be carried out in her laboratory at the School of Life Sciences University of Warwick.
Martin Davis deserves a mention for his assistance in handling the analytical
instruments at the metrology laboratory, School of Engineering.
I would like to acknowledge the collaborators of the FABSURFWAR projects from the
Karlsruhe Institute of Technology (KIT) Germany, Dr W. Pfleging, Alexandra Reif, and
Jan Rakebrandt for their help in laser fabrication and helpful guidance on the effect of
laser's parameter towards the surface patterning.
I would like to thank my late father Mohamad Hussin, my lovely mother, Rafiah Ab
Rahman, brothers and sisters, my lovely wife, Dr Wan Salwanis Wan Md Zain, all my
children, Ayyash Mukhlis, Anas Mukhlis, Asra Imani, Afra Imani and Adra Imani for
their steadfast support, encouragement and undivided help during the hard times in the
completion of this study. Without them, all this wouldn’t be possible to complete. Not
to forget all my friends in Coventry, especially Abang Fuad, Kak Shidah and family
who have been very good companions.
A heartfelt appreciation goes to my Sponsors, Universiti Malaysia Pahang (UMP) and
the Ministry of Higher Education Malaysia (MOHE) for the chance and financial
support for this study. Last but not least, my foremost gratitude goes to Allah SWT Who
has made all this possible. Alhamdulillah.

vi
DECLARATION
I hereby declare that the thesis is my original work and it has
been written by me in its entirety. I have duly
acknowledged all the sources of information which have
been used in the thesis.
This thesis has also not been submitted for any degree in any
university previously
Ahmad Johari b Mohamad
May 2019

vii
ABSTRACT
The presence of bacteria on metals is considered a serious source of potential
contamination for domestic and industrial environments. Possible contributing factors to
the formation of biofilm are related to the surface properties of materials used such as
surface topography and hydrophobicity. Surface topography and hydrophobicity will be
the focus in this investigation towards Gram-positive and Gram-negative bacteria (S.
aureus, E. coli and B. subtilis) adhesion. Modified surfaces of 316L stainless-steel and
Ti6Al4V, titanium prepared by polishing, WEDM and laser-assisted technique and the
as-received substrates were also considered in the study. The corresponding surface
topography and contact angle measurement were assessed by Bruker Optical Profilometry
and Kruss DSA, Germany. The number of adhered bacterial on metal surfaces was
determined by O.D, CFU and Fluorescent Microscopy. Polished, WEDM and laser-
assisted surfaces managed to mitigate bacteria adhesion as opposed to controlling
surfaces but increased the adhesion of E. coli on both stainless steel and titanium. The
introduction of laser-assisted technique using argon gas successfully combatted the
adhesion of both Gram-positive and Gram-negative bacteria, revealing the lowest
adhesion for S. aureus and E. coli, surpassing those on polished surface and WEDM. The
success factor was presumably contributed by the ability to suppress oxidation, while
contours and nanograin surface effects prevent entrapments of bacteria whilst inducing
an antibacterial property through contact killing mode.

viii
List of Abbreviations
AFM Atomic Force Microscopy
B. cereus Bacillus cereus
B. subtilis Bacillus subtilis
B.cereus Bacillus cereus
CA Contact angle
CAM Contact angle measurement
CFU Colony Forming Unit
CLSM Confocal Laser Scanning Microscopy
CO2 Carbon Dioxide
E. coli Escherichia coli
EPS Extracellular Polymeric Substance
Fe2+ Iron
HCl Hydrochloric acid
K2HPO4 Dipotassium Phosphate
KCl Potassium Chloride
KH2PO4 Monopotassium Phosphate
LP Laser parameter
LPx Laser parameter step x, x = 1-4
MgSO4 Magnesium Chloride
NaCl Sodium Chloride
NaOH Sodium Hydroxide
OD Optical Density
PBS Phosphate Buffer Solution
PIA Polysaccharide Intercellular Adhesion
S. aureus Staphylococcus aureus
Sa Roughness average
Sds Summit density
Sdr Developed Interfacial Area Ratio
Sdq RMS Surface Slope
ix
Str Texture Aspect Ratio
E. coli Escherichia coli
SEM Scanning Electron Microscope
Sku Kurtosis
Sq Root mean square roughness
SS Stainless steel
SSC Stainless steel - control (mirror finish)
SSE Stainless steel undergone EDM
Ssk Skewness
SSL Stainless steel undergone laser
SSL-Air Stainless steel undergone laser fabrication in air
SSL-Ar Stainless steel undergone laser fabrication in argon
SSP Stainless steel undergone polishing
TI Titanium
TIC Titanium – control (mirror finish)
TIE Titanium undergone EDM fabrication
TIL Titanium undergone laser fabrication
TIL-Air Titanium undergone laser fabrication under air
TIL-Ar Titanium undergone laser fabrication under argon
TIP Titanium undergone polishing process
WEDM Wire-Electrical discharge machine
x
List of Figures
Figure 1-1 Scope of the experiment ............................................................................................ 23
Figure 2-1: Schematic set up of laser fabrication of bioactive glass where the laser beam was
passed through the neutral density filter (NDF) and lens (L = 5 cm focal lengths) before hits the
sample on the computer-controlled X-Y stages. ......................................................................... 36
Figure 2-2 Factors that influence the development and biology of a biofilm ............................. 44
Figure 2-3 SEM’s image of a) S. aureus, b) E. coli and c) B. subtilis (Carr, 2007) ................... 45
Figure 3-1 The growth curves of a) S. aureus, b) E. coli and c) B. subtilis, grown in 250 mL
flask containing LB medium for 24 hours, with shaking at 200 rpm and 37oC.[OD , CFU] ... 57
Figure 3-2: Images of the exponential phase-cells of a) S. aureus, b) E. coli and c) B. subtilis
from 10 hours culture, observed under SEM at magnification between 2500x - 3000x. ............ 60
Figure 3-3 Images from Gram staining analysis of a) S. aureus, b) E. coli and c) B. subtilis .... 60
Figure 3-4 Close up pictures of a) S. aureus, b) E. coli and c) B.subtilis under 4000x
magnification using SEM. .......................................................................................................... 62
Figure 3-5 Bacterial adhesion on solvent a) hexadecane, b) hexane, c) chloroform, and d) ethyl
acetate. Adhesion was carried out using bacteria at the exponential phase and the late stationary
phase using 10-hour culture and 66 hours culture, respectively. ................................................ 65
Figure 3-6 Percentage adhesion of S. aureus, E. coli and B. subtilis on the glass substrates.
Samples were immersed in bacterial suspension (OD = 1.0) for 24 hours. ................................ 69
Figure 3-7 Number of cells adhered on the glass substrata after immersion in the bacterial
suspension with initial OD of 1.0 (containing approximately ~108 CFU/mL of active cells in the
exponential phase). Bacteria were quantified at 4, 8, 12 and 24 hours. ...................................... 71
Figure 3-8 The images show the adhered S. aureus on the glass slide viewed under light
microscopy at a) 4 hours, b) 8 hours, c) 12 hours and d) 24 hours. ............................................ 75
Figure 3-9 The images show the adhered E. coli on the glass slide viewed under light
microscopy at a) 4 hours, b) 8 hours, c) 12 hours and d) 24 hours. ............................................ 76
Figure 3-10 The images show the adhered B. subtilis on the glass slide viewed under light
microscopy at a) 4 hours, b) 8 hours, c) 12 hours and d) 24 hours. ............................................ 76
Figure 3-11 Numbers of remaining bacteria in the PBS solution during 24 hours of exposure on
the glass substrate. ...................................................................................................................... 77
Figure 3-12 Number of cells adhered on the glass substrata after 24 hours immersion in the
bacterial suspension with initial OD of 0.8, 1.0 and 1.2 containing active cells in the exponential
phase. Bacteria were viewed using a light microscope. .............................................................. 78
Figure 3-13 The adhered cells after 24 hours exposure to the glass surface at OD a) 0.8, b) 1.0
and c) 1.2. Bigger flocs were formed at higher cell concentration. ............................................ 79
Figure 3-14 : E. coli (A) and B. subtilis (B) with contact on the glass surface for 24 hours at
initial cell concentration of 1.2. .................................................................................................. 80
Figure 3-15 Percentage adhesion of, E. coli and B. subtilis on the glass substrates after 24 hours
exposure to the bacteria solution containing active ( ) and stationary-phase ( ) cells. ................ 81
Figure 3-16 Number of adhered cells per mm2 area; exponential-phase cells ( ) and stationary
phase-cells ( ) on the glass substrates after 24 hours exposure with bacterial suspension in PBS
buffer with initial OD of 1.0 containing cells at ~ 1 x 10⁸/mL. .................................................. 82
Figure 3-17 Light microscopy images showing adhered exponential phase cells of a) S. aureus,
b) E. coli and c) B. subtilis, on glass substrates at 24 hours exposure to bacterial solution
(approximately 1 x 10⁸ CFU mL) while (b), (d) and (e) are the adhered stationary phase cells,
respectively. ................................................................................................................................ 84

xi
Figure 3-18: Adhered cells (B. subtilis) on the glass substrate for cells in the exponential phase
(a & b), cells in the stationary phase (c & d). ............................................................................. 85
Figure 4-1 Graph of the height parameters on 316L and Ti6Al4V with respect to A) Sa and Sq,
B) Sku and Ssk ............................................................................................................................. 90
Figure 4-2 Graph of the height parameters on 316L and Ti6Al4V with respect height surfaces
parameter, SP (max peak height), Sv (max valley depth) and Sz (max height of surface) .......... 91
Figure 4-3 Bruker images on polished stainless-steel and titanium ............................................ 92
Figure 4-4 Correlations between graph A) Sa and polished grit and B) kurtosis (Sku)and
skewness (Ssk). R2 > 0.7 indicated strong correlation, R2 = 0.5 – 0.69 represented moderate
correlation and R2 = 0.49 – 0.3 poorly correlated and R2 < 0.29 provided no correlation. ......... 93
Figure 4-5 3D optical profilometry images with spatial parameter data ..................................... 95
Figure 4-6 Auto-correlation on polished stainless-steel specimen.............................................. 96
Figure 4-7 Auto-correlation on polished titanium specimen ...................................................... 96
Figure 4-8 Graph of contact angle measurement on metallic polished specimen ....................... 97
Figure 4-9 Correlation between a), average roughness, Sa b) kurtosis, Sku c) skewness, Ssk d)
auto-correlation length, Sal e) developed interfacial area ratio. Sdr h) summit density, Sds with
water contact angle on 316L and Ti6Al4V Specimen. ............................................................... 98
Figure 4-10 Number of bacterial adhered on stainless steel and titanium undergone surface
polishing technique (mirror finishing) after four hours t at 37oC and CFU ~ 1 x 10⁸ CFU/mL.
.................................................................................................................................................. 101
Figure 4-11 Graph of bacterial adhesion on the polished-stainless steel .................................. 103
Figure 4-12 Graph of bacterial adhesion on the polished titanium ........................................... 105
Figure 4-13 Correlation between CA, Sa and Sds with bacteria adhesion (S. aureus , E. coli a
and B. subtilis ) on SSP a), c), e) and on TIP b), d), f)............................................................ 108
Figure 4-14 Correlation between Sku and Ssk and bacteria adhesion (S. aureus , E. coli a and
B. subtilis ) on SSE a), c), e) and TIE b), d), f). ...................................................................... 110
Figure 4-15 Fluorescent images of a) SSP-without bacteria, b) S. aureus on SSP, c) TIP without
bacteria, and d) S. aureus on TIP e) E. coli on SSP, f) B. subtilis on SSP, g) E. coli on TIP and
h) B. subtilis on TIP. ................................................................................................................. 111
Figure 4-16 SEM images of E. coli on titanium specimen at different magnification, a) 5000x,
b) 1000x and c) 500x ................................................................................................................ 111
Figure 5-1 WEDM stainless-steel morphology a) SSE-01 (10mm/min), b) SSE-02 (12mm/min),
SSE-03 (20mm/min) and d) SSE-04 (22mm/min) .................................................................... 114
Figure 5-2 WEDM titanium morphology a) TIE-01 (10mm/min), b) TIE-02 (12mm/min), TIE-
03 (20mm/min) and d) TIE-04 (22mm/min) ............................................................................. 115
Figure 5-3 Graph of the height parameters on 316L and Ti6Al4V with respect to A) Sa and Sq,
B) Sku and Ssk ........................................................................................................................... 117
Figure 5-4 Graph of height parameter on 316L and Ti6Al4V with respect to maximum height
surface parameter, SP (max peak height), Sv (max valley depth) and Sz (max height of surface)
.................................................................................................................................................. 118
Figure 5-5 3D optical profilometry for TIE-02 with Sa = 3.30 m, Sku = 3.34, Ssk = 0.38, SP =
33.48, Sv = -15.99 and Sz = 49.48 ............................................................................................. 118
Figure 5-6 Correlations between a) average roughness, Sa m) and machine feed rate
(mm/min) b) maximum height surfaces, Sz (m) and machine feed rate (mm/min) on WEDM
stainless-steel and titanium. R2 > 0.7 indicated strong correlation, R2 = 0.5 – 0.69 represented
moderate correlation and R2 = 0.49 – 0.3 poorly correlated and R2 < 0.29 provided no
correlation. ................................................................................................................................ 119

xii
Figure 5-7 3D optical profilometry images for a) Ti6Al4V with Std = -81.23, Str = 0.10 and b)
Ti6Al4V with Std = n/a, Str = 0.85 ........................................................................................... 121
Figure 5-8 ACF on WEDM stainless-steel specimen ............................................................... 122
Figure 5-9 ACF on WEDM titanium specimen ........................................................................ 123
Figure 5-10 A graph of contact angle measurement on EDM specimen .................................. 123
Figure 5-11 The correlation between a), average roughness, Sa b) kurtosis, Sku c) skewness, Ssk
d) auto-correlation length, Sal e) developed interfacial area ratio. Sdr h) summit density, Sds
with water contact angle on 316L and Ti6Al4V specimen. ...................................................... 125
Figure 5-12 A graph of bacteria adhesion on WEDM stainless-steel specimen (SSE) ............ 127
Figure 5-13 Graph of bacteria adhesion on WEDM titanium (TIE) ......................................... 129
Figure 5-14 Correlation between Sa, Sku, Ssk and bacteria adhesion (S. aureus , E. coli a and
B. subtilis ) on stainless-steel (a), (c), (e) and on titanium (b), (d), (f). .................................. 132
Figure 5-15 Correlation between Sku and Ssk and bacteria adhesion (S. aureus , E. coli a and
B. subtilis ) on stainless-steel (a), (c), (e) and on titanium (b), (d), (f). .................................. 135
Figure 6-1 Images for the titanium undergone femto-second irradiation techniques showing all
the available features on the modified surfaces viewed with SEM........................................... 139
Figure 6-2 Graph of height parameter on 316L and Ti6Al4V with respect to a) Sa and Sq, b) Sku
and Ssk and c) SP (max peak height), Sv (max valley depth) and Sz (max height of surface) .. 142
Figure 6-3 Graph of height parameter on 316L and Ti6Al4V with respect to a) Sa and Sq, b) Sku
and Ssk and c) SP (max peak height), Sv (max valley depth) and Sz (max height of surface) .. 144
Figure 6-4 Correlation between A) average roughness, Sa and laser scan SPeed (mms-1) on 316L
(air) and 316L (argon), B) average roughness, Sa and laser scan SPeed (mms-1) on Ti6Al4V (air)
and Ti6Al4V (argon).. ............................................................................................................... 145
Figure 6-5 Correlation between A) max height surface, Sz and laser scan SPeed (mms-1) on 316L
(air) and 316L (argon), B) max height surface, Sz and laser scan SPeed (mms-1) on Ti6Al4V
(air) and Ti6Al4V (argon). ........................................................................................................ 146
Figure 6-6 3D optical profilometry images on SSL-01 (Air) and SSL-01 (Ar) ........................ 148
Figure 6-7 The difference between dominant lay surface and isotropic surface of Ti6Al4V ... 149
Figure 6-8 Graph of water contact angle on laser-assisted on 316L and Ti6Al4V ................... 150
Figure 6-9 Correlation between contact angle and A) average roughness, Sa on 316L C)
surfaces kurtosis, Sku on 316L, E) surface skewness, Ssk on 316L, B) average roughness, Sa on
Ti6Al4V, D) surface kurtosis, Sku, F) surface skewness, Ssk. .................................................. 151
Figure 6-10 Correlation between contact angle and A) summits density, Sds, C) developed
interfacial area ratio, Sdr on 316L, B) summits density, Sds, D) developed interfacial area ratio,
Sdr on Ti6Al4V......................................................................................................................... 152
Figure 6-11 Numbers of adhered bacteria on lasered surfaces (stainless steel) after exposure to
bacterial suspension (1 x 10⁸ CFU/mL) for four hours at 37oC. (SA- S. aureus; EC – E. coli) 154
Figure 6-12 Numbers of adhered bacteria on lasered surfaces (titanium) after exposure to
bacterial suspension (1 x 10⁸ CFU/mL) for four hours at 37oC. (SA- S. aureus; EC – E. coli) 157
Figure 6-13 Adhesion of S. aureus on three difference parts of the multi scales stainless steel
surfaces undergone laser treatment (air) ................................................................................... 167
Figure 6-14 Adhesion of S. aureus on three difference parts of the multi scales stainless steel
surfaces undergone laser treatment (argon) .............................................................................. 168
Figure 6-15 Adhesion of S. aureus on three difference parts of the multi scales titanium surfaces
undergone laser treatment in (air) ............................................................................................. 168
Figure 6-16 Adhesion of S. aureus on three difference parts of the multi scales titanium surfaces
undergone laser treatment in (argon). ....................................................................................... 169

xiii
Figure 6-17 Adhesion of E. coli on three difference parts of the multi scales stainless steel
surfaces undergone laser treatment (air) ................................................................................... 171
Figure 6-18 Adhesion of E. coli on three difference parts of the multi scales stainless steel
surfaces undergone laser treatment (argon) .............................................................................. 172
Figure 6-19 Adhesion of E. coli on three difference parts of the multi scales titanium surfaces
undergone laser treatment (air) ................................................................................................. 173
Figure 6-20 Adhesion of E. coli on three difference parts of the multi scales titanium surfaces
undergone laser treatment (argon) ............................................................................................ 173
Figure 6-21 Formation of cells clusters by S. aureus on the unstructured area of a) SS and b) TI
fabricated in air. ........................................................................................................................ 174
Figure 6-22 Fluorescence images of S. aureus on the SSL-02-Ar (a-b) and E. coli on the TIL4-
Ar (c-d) showing more cells were retained on the unstructured area than the LIPSS. ............. 175
Figure 6-23 The SEM images showing the shape of S. aureus and E. coli on the structured
(LIPSS) and unstructured stainless steel and titanium fabricated in air and argon. a) Polished
sample, b) S. aureus-air, c) S. aureus -argon, d) E. coli air and e) E. coli-argon ...................... 177
Figure 6-24 Correlation between CA, Sa and Sds on the adhesion of S. aureus and E. coli on SS
(a, c, and e) and TI (b, d and f) in air and argon fabrication. ( ) SA-Air, ( ) SA- AR, (an )
EC-Air and ( X ) EC-AR. ......................................................................................................... 178
Figure 6-25 Correlation between Ssk and Sku on the adhesion of S. aureus and E. coli on SS (a
and b) and TI (c and d) in air and argon fabrication. ( ) SA-Air, ( ) SA- AR, (an ) EC -Air
and ( X ) EC-AR. R2 > 0.7 indicated strong correlation, R2 = 0.5 – 0.69 represented moderate
correlation and R2 = 0.49 – 0.3 poorly correlated and R2 < 0.29 provided no correlation. .... 181
xiv
List of Tables
Table 3-1 Size of bacteria at the exponential and stationary phase ............................................ 61
Table 3-2 Determination of electron acceptor/donor properties [131] ....................................... 67
Table 3-3 Surface charge of the bacteria in exponential and stationary phase ........................... 68
Table 4-1 Spatial and Hybrid Parameter Data on Polished Metallic Specimen .......................... 94
Table 4-2 Size of bacteria at the exponential stage ................................................................... 100
Table 4-3 Data on Surface Topography Parameter, Contact Angle and Bacteria Adhesion .... 102
Table 4-4 Total number of bacteria adhered on stainless steel and titanium ............................ 106
Table 5-1 WEDM topography data on a spatial and hybrid parameter for 316L stainless-steel
and Ti6Al4V, titanium .............................................................................................................. 121
Table 5-2 Data on Surface Topography Parameter, Contact Angle and Bacteria Adhesion
undergone WEDM fabrications ................................................................................................ 128
Table 5-3 Total number of bacteria adhered on stainless steel and titanium ............................ 130
Table 6-1 Laser parameter for different surface topographies .................................................. 140
Table 6-2 Laser parameter for different surface topographies .................................................. 141
Table 6-3 Spatial and hybrid parameter data on 316L and Ti6Al4V ........................................ 147
Table 6-4 Data for control and laser Specimen (stainless steel). .............................................. 156
Table 6-5 Data of bacterial adhesion for control and laser Specimen (titanium)...................... 158
Table 6-6 Summations of bacteria in all process with respect to metal .................................... 160

15
Introduction
1.1 Problem Statement
The presence of bacteria colonies or ‘biofilm’ on inert surfaces can be both
advantageous and destructive. Nitrogen fixation and the bioremediation of wastewater
are the beneficial functions of microbial biofilms. However, biofouling mechanisms such
as the fluid flow blockage in conduits, over surfaces, filters, heat exchangers, and
corrosion, are major economic liabilities in the oil, gas, maritime, manufacturing and food
industries [1]. In general, a biofilm is often regarded as the colonisation of submerged
surfaces by undesirable organisms such as algae, bacteria, and barnacles. This
colonisation has damaging effects on exposed surfaces, e.g. in shipping and leisure
vessels, heat exchangers, oceanographic sensors and aquaculture systems [2]. There are
many problems caused by this biofilm phenomenon, including biofouling and bio-
corrosion. For example, the development of biofouling on the hull of ships reduces their
speediness by ~10% and raises fuel consumption, which has an impact on operational
costs and leads to more greenhouse gases production. The accumulation of algae/bacteria
also increases the surface roughness of the hull, which in turn causes increased frictional
resistance and fuel consumption while decreasing the maximum speed and range [3].
In European countries, biofouling causes a lot of damage in the aquaculture
industries This often results in additional costs in terms of operational and maintenance
procedures. In farm industries, biofouling significantly reduces the efficiency of materials
and equipment such as netting and buoys, onshore equipment, cages and structures such
as pipelines, pumps, filters and holding tanks. Annual cost estimates due to unwanted
biofouling growth comes up to nearly €100,000 per farm.

16
The use of membrane technology, micro and ultra-filtration in wastewater
treatment systems exposes them to widespread fouling caused by micro-organisms and
organic molecules. This limitation can lead to a significant decline of the permeate flux,
higher-energy consumption and eventually, failure to meet regulatory standards. In
addition, regular cleaning of the surfaces is costly and may damage the materials/layers.
The cost of fixing the biofilm issue in membrane applications at a water factory caused
an increase of 30% in operating costs. Due to the biofilm problem, membrane life-time is
reduced from three years to one year and the replacement of the membrane alone cost
around USD 1.17 million/year [4].
In power plants, biofouling has accounted for 20% of all-inclusive fouling in
energy generation. Biofouling generally occurs in the intake structures, i.e. screen,
seawater cooling pipeline and heat-exchanger tubes in the salt removal system, thus
causing an extensive decline in plant efficiency at great economic cost. For example, the
presence of a biofilm on the transfer surfaces of heat exchangers cooled by seawater
reduces the heat transfer rate by 20-50% and incurs a global expenditure of over $15
billion per annum to control the problem. It is estimated that the worldwide cost for
biofilms in desalination reaches billions of US dollars annually [5].
Meanwhile, the formation of biofilm in the bio-medical field is highly associated
with health and safety issues. 5% of disease infection cases involving chronic issues are
due to pathogen adhesion on instruments and devices causing fatal illnesses. For example,
Staphylococci SP are among the most important pathogens causing bloodstream
infections that are associated with implanted medical devices. Controlling the bacterial
adhesion to material surfaces is important for the prevention of biofilm formation and
biomaterial-associated infections [6].
Bio-corrosion is caused or promoted by micro-organisms, occurs in both metallic
and non-metallic materials, and is often evident either as layers of metal sulphide or a
hydrogen sulphide smell which may contribute to health issues. On cast iron, a graphitic
corrosion selective leaching may be the result, with iron being consumed by the bacteria,

17
leaving a graphite matrix with low mechanical strength in place. To combat corrosion,
various kinds of corrosion inhibitors can be used such as benzalkonium chloride, which
is common in the oilfield industry. Apart from metal, microbial corrosion also occurs in
plastics, concrete, and many other materials: two examples are nylon-eating bacteria and
plastic-eating bacteria. These micro-organisms can directly or indirectly affect the
integrity of many of the materials used in industrial systems. Most metals, including iron,
copper, nickel, aluminium, and their alloys, are susceptible to damage. Only titanium and
its alloys appear to be generally resistant to microbial attack.
The possible contributing factors that induce biofilm formation are related to the
surface properties of the materials used, such as the surface topography, surface chemistry
and the hydrophobicity. Hydrophobicity has often been regarded by researchers as the
main factor that governs cell-surface adhesion. Hydrophobic bacteria prefer hydrophobic
surfaces, and this hydrophobic attachment is stronger compared to the adhesion of
hydrophilic bacteria-hydrophilic surface. However, making these surfaces
superhydrophobic has adverse effects on the bacterial adhesion. Superhydrophobic
surfaces repel water to a degree that is a few orders of magnitude stronger than normal
hydrophobic surfaces, thus preventing any attachment of microstructures (dirt/bacteria)
onto its surfaces. Superhydrophobic surfaces wash off water from their surfaces;
therefore, they create a phenomenon called self-cleaning. These superhydrophobic
surfaces can be produced via several approaches, which are mainly dominated by two
aspects: i) roughness surface modification and ii) chemical modification. This self-
cleaning property (bacterial adhesion repellent surface) is beneficial in reducing the
formation of biofilm and avoiding water corrosion [7].
Biofilm formation has caused severe problems in many engineering applications;
therefore, any comprehensive innovation which leads to the process of removal or
blocking of the formation of biofilm, will affect many industrial sectors and directly
impact many important areas. Billions of dollars could be saved yearly if biofouling could
be kept to a minimum. Since bacterial adhesion is a complex process and involves a
combination of micro-organism properties, surface properties and environmental factors,
the solution provided to rectify this issue could eventually be misleading and less

18
accurate. Therefore, extensive research needs to be carried out to save billions of dollars
for the industries involved. The biofouling can be best prevented by controlling the initial
bacterial adhesion, starting at the initial stages of adhesion prior to biofilm formation.
Understanding the mechanisms as well as the time and length scales of bacterial adhesion
with respect to the effect of the surface properties might allow for the control of bacterial
adhesion. This control can be achieved by engineering the surfaces for adhesion and
controlling the properties that increase repulsion towards bacterial adhesion.
1.2 Background of the Study
Our environment has complex systems and processes that function from the macro
to the micro scales. This creates the possibility of a great diversity of practical applications
and benefits for human beings in all aspects of existence, since many features of nature
can be adapted to contribute meaningfully to the world; e.g. through physical structures,
chemical compounds, manoeuvrability as well as material description. The process of
manipulating nature’s strategies into human technology is called ‘biomimetics’.
Biomimetics is a term invented in the 1950s by Schmitt for the transfer of ideas
from biology to technology. It has produced many significant and successful concepts
and devices in the past 60 years, but is still empirical [8]. Therefore, this emerging
technology is still effective and is experiencing progress in many studies seeking to
embed nature into human technological innovation. The term biomimetics has been
defined as a process of gathering and merging biological characteristics in order to mimic
biology or nature for technological innovation [9, 10]. It is obvious that the properties of
biological materials and surfaces create a process of interplay between surface
topography, wettability and chemical properties [10-15].

19
In theory, biomimetic research is derived from nature; e.g. bacteria, plants, insects,
spiders, lizards, aquatic animals, birds, seashells, spiders’ webs, moth-eyes, the fur and
skin of polar bears, and biological systems [11]. This is often useful to create an add-on
value to the existing technology for specific purposes. For example, in the plant category,
the lotus leaf (scientifically known as Nelumbo nucifera) plays an important role in many
innovations and applications of superhydrophobic materials with a self-cleaning
architecture. The technology embedded within its properties has been utilised and
manipulated in various applications, e.g. in transparent and anti-reflective
superhydrophobic coatings, super-hydrophobicity, self-cleaning surfaces, energy
conversion, bacterial adhesion, thermal insulation, sensory aid, biological self-assembly,
fluidic drag reduction, enhancing a water supporting force, the controlled transportation
of fluids, superhydrophobic valves, bio-surfaces, anti-biofouling, the prevention of water
corrosion, battery and fuel cell applications, humidity-proof coatings for electronic
devices, superhydrophobic textiles, oil-water separation and micro condensation [11, 12,
14-17].
The hydrophobicity effect of the lotus leaf and the ability to repel water and self-
cleaning properties has provoked a substantial area of interest due to their many
applications [18-23]. It has induced more thoughtful and motivating investigations for
researchers to make more significant discoveries. The reason for the significant potential
of lotus leaf as a self-cleaning surface lies in the micro/nano-structures and hierarchical
roughness (micro-bumps) [24-26]. A micro-level scale investigation of the lotus leaf in
1997 has shown that the hydrophobicity effect of the leaf was contributed by rough scale
of wax crystalloids of varied composition [13-16]. Therefore, numerous follow-up studies
have confirmed that this combination of micrometre-scale has more benefits in
engineering applications. S-scale roughness, along with a low surface energy material,
leads to an apparent water contact angle greater than 150, a low sliding angle (hysteresis)
and the self-cleaning effect [16]. Materials with these properties are called
superhydrophobic surfaces [27]. Other bio-inspired natural phenomena such as
dragonflies and geckos exhibit an antibacterial property due to their sharp nanopillar
arrays which can damage the bacterial cell wall when it meets the skin and have been
referred to as model surfaces for various applications [28].

20
1.3 Motivation for the Study
It is becoming increasingly difficult to ignore the impact of a self-cleaning
phenomenon in worldwide industries. It plays a key role in several areas and is gradually
expanding into new applications such as health and safety, environmental concerns and
food industries. The study of this self-cleaning innovation leads to many other process
studies such as the fabrication of surfaces and surface characteristics. Self-cleaning
surfaces, as mentioned above, are materials derived from increased surface topography.
Currently, there is a growing interest within various industries for self-cleaning surfaces
in applications as diverse as aerospace, skyscrapers, food packaging, automobiles and
bio-medical engineering. Over the past decade, many attempts have been invested in this
field with empirical studies trying to understand the mechanism of this unique
phenomenon and thus the possible applications are limited. In this new global economy,
the self-cleaning innovation is believed to have a key role in generating economic impact
by improving the biofilm effects of many surfaces. The contribution of the self-cleaning
innovation affects several issues in that it increases product quality and quantity, avoids
material damage, increases the efficiency of process performance, prevents the use of
biocides and increases the lifetime of the components due to extended cleaning.
Self-cleaning surfaces can be utilised in many potential areas such as on
antifouling surfaces in the marine, pharmaceutical, textile, bio-surface, sustainable
energy, environmental, bio-medical transplant material, and cleaning industries [16]. The
use of antifouling (AF) coatings to control the problem of fouling in marine vehicles saves
the US Navy around USD 2.1 billion per annum [3]. Organ transplantation generates
around £15 billion of business worldwide each year through the production of
biomaterials to replace non-functioning human organs. Surface roughness plays into a
key aspect of biomaterial function; it creates more adherence to human tissues to ensure
that the material is well accepted by the human body. The annual cost for organ
transplantation and health infection is estimated to be in the billions of dollars in the US,
with about 2 million fracture-fixation devices being inserted yearly [29].

21
The fishing industries also benefit significantly from self-cleaning innovation
surfaces [30], while pipe corrosion and fouling require USD 6–8 billion for cleaning
purposes. Bridge corrosion costs around USD 7 billion annually. It is estimated that the
100 main biomimetic products generated approximately US $1.5 billion over 2005–2008.
Annual sales are expected to continue to increase dramatically [11]. As a result, these
markets are worth billions of pounds annually worldwide. There will be an increase in
the volume in many sectors, strongly motivating any significant and comprehensive study
into self-cleaning innovation surfaces.
Undoubtedly, this self-cleaning phenomenon benefits many industries and is
becoming gradually more popular due to increases in economic factors as well as in health
and safety issues. However, to date there has been little discussion of the relationships
between surface topography, contact angle and bacterial adhesion. Therefore, in this
study, the concept of the lotus leaf phenomenon has been used to investigate the effect
roughness on the self-cleaning property surfaces [31]. Further investigation will be
focused on the effects of surface topography parameter, wettability and bacterial adhesion
on metallic surfaces. This will be supported by evidence from the surface roughness
parameter by quantifying and determination of the adhesion kinetics based on three
distinct types of bacteria which are S. aureus, E. coli and B. subtilis.
1.4 Aims
The aim of the research is to establish strong relationship between surface
topography, wettability and bacteria adhesion on metallic surfaces that have undergone
several fabrications methods. It is designed to investigate the effect of surface topography
parameters towards the contact angle and leads to the effect of bacterial adhesion, which
can be used further for developing a material that resists bacterial adhesion for hygiene,
safety and cost-effective purposes. This study also aims to provide sound, blended
information concerning the effect of surface roughness, hydrophobicity, environmental
factors as well as bacterial properties and the adhesion of bacteria on stainless steel and
titanium surfaces. The merged knowledge of these properties with respect to bacterial
adhesion will be beneficial in the preparation of a material with self-cleaning properties
and is of utmost importance, especially in domestic and medical applications.

22
1.5 Project Objectives
The project is expected to achieve:
i) Fabrication of various stainless-steel and titanium surfaces topography
According to the theory of the lotus leaf, the effective contact angle can be
increased by increasing the roughness of the surface, which will subsequently
increase the surface hydrophobicity. There are two factors influencing the critical
surface properties of materials, which are: i) the non-wetting (hydrophobicity) and
ii) the surface attachment point (organisms smaller than the scale of the surface
microstructure). To achieve a surface with the properties mentioned above,
various substrates were rendered through the processes of surface roughness
modification. The roughness can be tailored by the mechanical processes of
grinding, milling, sandblasting, chemical etching or laser etching to obtain micro-
indentations that are arranged in a specific pattern.
ii) Characterisation of the substrates' surfaces in terms of surface wettability. The
study will investigate the parameters of the surfaces such as roughness, skewness
and kurtosis and the wettability of the surfaces. These surface parameters are
expected to play an important role in bacterial adhesion due to the shape,
peakedness, and surface attachment point. Widening the surface area contact with
the bacteria furthers the ability of the bacteria to attach to the surface and form a
colony.
iii) Bacterial Characterisation: This concerns understanding and applying the proper
techniques for the handling, culturing and analysis of the bacteria. The bacteria
were partially characterised to understand the effect of the bacteria’s properties
and their influence on the adhesion process.

23
iv) Effect of Physical Factors on the Bacterial Adhesion Process: This concerns
identifying the bacterial adhesion behaviour based on the effect of certain
environmental factors such as temperature, agitation, time of exposure, the
concentration of the bacteria and age culture on the adhesion processes using
standard experimental procedures.
v) Effect of Surface Properties on the Bacterial Adhesion: The physical aspects of
the surfaces (surface contact angle with respect to non-wetting properties or
hydrophobicity) were thoroughly studied to determine the effect of the materials
and their hydrophobicity properties and their influence on the adhesion
mechanism.
To summarise the scope of the research, a graphic relationship is shown in Figure 1-1
below.
Surface
Topography
Bacterial
Adhesion
Contact Angle
Measurement
Figure 1-1 Scope of the experiment

24
1.6 Organisation of the Thesis
The thesis consists of several chronological chapters that were derived to provide
a detailed understanding of the bacterial adhesion on the modified surfaces with
controlled properties. The introductory chapter explains the motivation for the study by
addressing the problems associated with bacterial adhesion. It has also addressed how the
desirable features of any newly proposed system must be fabricated to achieve the
objectives of the research. The remainder of this thesis is organised into eight chapters as
follows:
i) CHAPTER 2 presents a literature review of biomimetic innovation,
hydrophobicity, surface characterisation and the factors that affect bacterial
adhesion on metallic surfaces.
ii) CHAPTER 3 presents a preliminary characterisation of the sample micro-
organisms (S. aureus, E. coli and B. subtilis) such as the bacterial growth curve,
surface properties and sizes. The adhesion of these bacteria was also thoroughly
examined using glass substrate to observe the varying adhesion orientations with
respect to different types of bacteria.
iii) CHAPTER 4 – discusses the surface characterisation of metallic polished
specimens’ surface topography parameter with respect to contact angle
measurement and bacterial adhesion.
iv) CHAPTER 5 – discusses the surface characterisation of metallic WEDM
specimens’ surface topography with respect to contact angle measurement and
bacterial adhesion. A comparison will be made between polished and WEDM
specimens on surface topography, contact angle and bacterial adhesion.

25
v) CHAPTER 6 discusses the surface characterisation of polystyrene and metallic
laser-assisted specimens’ surface topography with respect to contact angle
measurement and bacterial adhesion. A comparison will be made between
polished, WEDM and laser-assisted specimens on surface topography, contact
angle and bacteria adhesion.
vi) CHAPTER 7 discusses the overall contributions and conclusions from the results
achieved in this study. Some recommendations are highlighted for future studies
to generate improvements and more significant findings with respect to the related
issues.

26
Literature Review
2.1 Learned from nature
There is a large volume of published studies describing the role of nature in
engineering applications [32]. This phenomenon has become more interesting in the last
five decades since Richard P. Feynman presented a technological vision of extreme
miniaturisation in 1959 [33]. Learning from nature was broadened with the help of the
first commercial Scanning Electron Microscope (SEM) in 1965 by the Cambridge
Scientific Instrument Company [34], that enabled researchers to have a deeper knowledge
of the nano-realm and the magnificence of nano-creatures [35-38]. The identification of
the characteristics of nano-creatures has led researchers to design numerous engineering
applications through broad disciplines, and the practice is known as bio-mimetic study
[17, 39].
Historically, biomimetic study started thousands of years ago when the Chinese
craved for artificial silk [40]. It became recognised when historians found that the ancient
Chinese used lotus leaves in their cultural activities and emphasised the greatest self-
cleaning behaviour of the leaf [41]. Since then, it has become one of the key interests for
scientists to focus on and has expanded the knowledge of nature for human daily
applications [13, 24, 27, 42]. In other words, biomimetics is related to the concept of using
ideas from nature and manipulating the hidden engineering aspects in various fields such
as automotive industries, aerospace, food packaging, textile and bio-medical engineering
[43-48]. The term ‘bio mimetic’ was derived from the Greek term bios or life and the
suffix mimetic means the ability for mimicry [10]. Scientists focus on the structures that
embody the object while exploring the functionalisation of these structures in nature’s
daily operation.

27
Numerous studies have attempted to explain the intensifying of biomimetic
engineering [49]. There has been an increase in the level of exploration since the 1960s.
It is projected to grow broadly in the next 10 years (year 2020) and expand into many
areas of research such as biomaterials, gel-artificial muscle, mechanic-biomimetic,
biomimetic chemistry, and neuropsychology. The most likely cause of the increase might
have come from the discovery of the lotus effect by Wilhelm Barthlott and C. Neinhuis
officially in 1965 [50]. This is because there is evidence of the increasing number of
publications on the lotus effect (super hydrophobicity) since the 1990s due to the
possibility of building superhydrophobic surfaces with desired properties when the
technology matured [17, 24, 27, 39]. Figure 2.2 clearly depicts that the number of
published papers increased exponentially from the 1990s until the 2010s. The citation
count in biomimetic engineering also presented a significant increase and reflected the
trend of published papers. This trend shows the substantial value and relevance of
biomimetic engineering in the future and benefits many other research disciplines.
Therefore, it can be concluded that interest in biomimetics has become more significant
and there will be more exploration and development activities in this topic.
In addition to the increasing literature publication, the real evidence to show the
expansion in biomimetic and nanotechnology study is the research spending allocations
by the world governments. Based on a US National Nanotechnology Initiative report in
2000, almost every developed and developing economy had initiated their own
nanotechnology programs [51]. The world governments are spending $10 billion per
annum on nanotechnology research and development, and this amount is estimated to
grow by 20% over the next three years. This spending by the governments reflect the
potential benefits behind the biomimetic engineering field.
Many countries have allocated money in their budgets for nanotechnology
research and development. Starting from 1997, the United States, Western Europe and
Japan has spent about USD 687 million in total. This amount will increase significantly
in the next five years when all the countries start to make investments in nanotechnology
research. In 2002, Japan led the investment by spending around USD 750 million
compared to the United States with USD604 million. The amount of budget allocation all
over the world for nanotechnology research and development has totalled USD 2,274
28
million dollars since 2002. This trend shows the importance and expansion of
nanotechnology research and development. It also shows that governments have
demonstrated interest and are allocating huge amounts for research and development in
nanotechnology.
2.1 Biomaterial and the Application
The development of biomaterials was inspired from nature and the environment
as summarised by Nosonovsky and Bhushan [52] who demonstrated their selected
contributions. [10]. Materials that possess compatibility with living cells/organism are
termed as biomaterials. They range from plastics to polymers, metals and composites to
ceramics. Implants are one of the biomaterials that are often associated with severe
bacterial infection [53]. Numerous efforts have been expended to develop a smart implant
with the ability to support the growth of tissues, whilst hindering bacterial adhesion and
colonisation by either preventing the attachment or killing the micro-organisms upon
contact with the surfaces. Other biomaterials possess a selective barrier which permit the
transport of a specific component, whilst resisting the other, i.e. in the dialysis process
for patients with damaged kidneys. There are other functions of biomaterials that are
being continuously exploited for various purposes.
Material selection for biomaterials is based not only upon the usability, strength,
and durability but also on their antibacterial properties. Metals are often selected as load
bearing materials, ranging from pure compounds to various alloys invented for specific
purposes [53]. Metals and alloys which have high melting points and specific gravity are
often chosen due to their excellent thermal, electrical and mechanical properties. Besides
that, metals are strong and highly durable against wear making them an excellent choice
for use as implants and bone joints. Stainless steel and titanium/titanium alloys are often
selected owing to their strength and chemical stability to undergo various fabrication
techniques while posing negligible cytotoxicity for human use [54]. Stainless steel is
generally known for its high corrosion resistance due to the formation of a thin passive
chromium-oxide film [55]. New metals that are gaining interest are Mg, ZnO and Cu as
they possess antibacterial properties that disrupt the cellular membrane and subsequently
29
killing the bacteria when coming into contact. The release of ionised Mg/Cu/Zn that can
travel through the membrane and bind with the DNA while inhibiting enzyme activity,
increases the bacterial fatality rate [56].
Synthetic polymeric materials have been widely used in disposable medical
supplies, prosthetic materials, dental materials, implants, dressings, extracorporeal
devices, encapsulates, polymeric drug delivery systems, tissue engineered products, and
orthodontic facilities. They have been associated with various infection cases in
hospitalised patients which require the removal of the infected devices, thus causing
trauma and long hospitalisation periods [53]. Wenzel [57] reported that 10% of 40 million
admitted patients were infected with nosocomial infections involving the urinary tract,
surgical site, bloodstream and lungs from the use of polymeric medical apparatuses. The
main problem regarding the use of the plastic made biomaterials is caused by the
difficulty to sterilise the materials, either associated with their low tolerance towards
thermal processing or to withstand strong chemical agents. Godoy-Gallardo, Mas-
Moruno [58] stated that the current effective treatment for fighting infection in tooth
implants was to use antibiotics before proceeding with the removal and replacement of
the infected implant.
The current study employed two types of metallic surfaces which are austenitic
stainless steel (316L) and titanium vanadium alloy (Ti6Al4V). The 316L SS has found
wide applications due to its excellent ductility and corrosion resistance and is used for the
fabrication of cardiovascular stents and equipment for the food industry. It contains 18%
Cr and 8% nickel and is the most commonly used stainless steel. Chromium when
exposed to air and water forms an oxidised layer which prevents the metal from corrosion
by stabilising the ferritic content of the SS. The chemical stability is contributed by the
inert oxy-hydroxide layer which maintains the surface smoothness (no additional
anchoring point), thereby inhibiting biofilm growth during long-term exposure [55].
Besides, its competitive price comparative to titanium has increased the uses of this
substance in daily operations. Meanwhile, Ti6Al4V is made from aluminium, vanadium
and titanium and is often utilised in the fabrication of high strength prosthetic implants
because of its recognised osseointegration and biocompatibility. It is also used for
manufacturing equipment in chemical processing and airframe structural components

30
owing to its chemical inertness, high strength and its property as a lightweight material
[59]. In addition, it is used to fabricate many surgical tools as it can reduce fatigue
symptoms in surgeons during long operations [60].
2.2 Surface topographies
The next step after surface fabrication is the process of surface characterisation
for identifying the surface parameters such as height parameter, spacing parameter and
hybrid parameters [61]. Previously, surface parameters for 3D measurements were
denoted by ‘R’ but has been changed to ‘S’ according to the new ISO25178 standard.
These parameters can be measured using two types of measurements, i) contact mode and
ii) non-contact mode. Contact mode measurement can be determined using Taylor’s
Hobson, AFM, and Tribological Probe Microscope (TPM), while optical profilometry is
used for the non-contact mode [62, 63][48, 49]. The advantages of optical profilometry
such as WYKO, Bruker and the stylus measurement lies in their ability to cover more
measurement areas and producing additional information whilst exploring the deep
valley.
For the parameter analysis, 3D areal texture measurement gives more information
compared to 2D parameter analysis. The 2D profiles, even if properly controlled, will
give an incomplete description of the real topography. With the use of areal parameters,
the texture shape and direction, attributing features can be accurately estimated and
connected. Isolated features can be differentiated, while with traditional profile
parameters it is limited to manufacturing process control and cannot be used to diagnose
product functional performance. Areal parameters use all the available data from the
texture surface while 2D profiles only use data from previously identified segments from
the texture surface.
31
Height distribution parameters of skewness and kurtosis are also taken for
comparison purposes. Skewness (Ssk) is defined as the degree of symmetrical height
distribution and is characterised by positive or negative values, indicating more material
on peaks or valleys, respectively. It cannot distinguish if the profile spikes are evenly
distributed above or below the mean plane and is strongly influenced by isolated peaks
or isolated valleys. The direction of the Ssk is dependent on whether the bulk of material
is above the mean plane (negative skew) or below the mean plane (positive skew). If Ssk
< 0, it indicates that the surface has more valleys or pits, whereas Ssk > 0 shows a surface
with dense peaks. If the peaks and valleys are normally distributed the Ssk = 0 according
to Gaussian distribution. A negative skewness (often specified between -1.6 and -2.0) is
used as a criterion for a good bearing surface. The measurement for Ssk is shown below,
Meanwhile, kurtosis (Sku) describes the sharpness of height distribution and
takes a value of 3 for a Gaussian distribution surface. A surface with a narrow height
distribution has a kurtosis value greater than 3, while a surface that has a well spread out
structure has Sku < 3.0. Or in other words, if the Sku is < 3, it indicates a random structure
while a value above 3 shows an ordered or organised surface structure. Furthermore,
hybrid parameter-summit density (Sds) is used to characterise a modified surface,
representing the number of peaks (summits) per unit area making up the surface. In the
current study, this parameter is used to explain the hydrophobic properties of the surface
and the alteration of the contact point between bacteria-surface. It is used in accordance
with the parameters for a detailed impact of surface topography to repel adhesion.
2.3 Surface Wettability
Wettability involves the measurement of contact angle (CA) as the primary data,
which indicates the degree of wetting when a solid and a liquid interact. Wetting
phenomena of the surface is also used to evaluate the surface free energy measured using
static measurement. Technically, hydrophobicity can be defined as the measurement of
energy dissipation during the flow of a droplet along a solid surface. They can be divided
into four stages such as super hydrophilic, hydrophilic, hydrophobic and super

32
hydrophobic. If the contact angles are greater than 90°, they are called hydrophobic
surfaces and if below 60°, they are defined as hydrophilic surfaces. With contact angles
greater than 160°, a surface is considered as super hydrophobic and when less than 10°,
it is known as super hydrophilic, subsequently evaluated as surfaces with low and high
surface energy, respectively [64].
Contact angle is defined as the angle formed by the intersection of the liquid-solid
interface and the liquid-vapour interface is measured using the sessile drop method. The
calculations based on measured contact angle values yield an important parameter such
as the solid surface tension, which quantifies the wetting characteristics of a solid
material.
Contact angle measurement can be achieved by considering a droplet of liquid
settling on a flat horizontal surface. Ideally, the shape of a liquid droplet is determined by
the surface tension of the liquid. Each molecule in the bulk is pulled equally in every
direction by neighbouring liquid molecules, resulting in a net force of zero. However, the
molecules exposed at the surface do not have neighbouring molecules in all directions to
provide a balanced net force. As a result, the liquid voluntarily contracts its surface area
to maintain the lowest surface free energy. The intermolecular force to contract the
surface is called the surface tension, and it is responsible for the shape of liquid droplets.
Historically, Thomas Young (1805) described the contact angle of a liquid drop on an
ideal solid surface is defined by the mechanical equilibrium of the drop under the action
of three interfacial tensions referred to as Young’s equation. In 1936, Wenzel proposed
a modified version of contact angle equations based on Young’s equations as follows.
The equilibrium contact angle, r is the surface roughness ratio given by (𝑟 =𝑎
𝐴=
(𝑑𝑎
𝑑𝐴) ≥ 1). 𝜃𝑎 is the apparent contact angle, a = actual surface area, and A = apparent area,
or geometrical area of the surface. The validity of the equation lies in the assumption that
the surface features of the substrate are insignificant compared to the drop dimensions.

33
2.4 Surface finishing techniques
2.4.1 Polishing
Mechanical polishing is one of the oldest processing methods, associated with the
removal of unnecessary surface imperfections in various materials from metals [65] to
polymers [66] and composites [67]. Polishing is grouped as wet and dry polishing and is
targeted to generate surfaces with very high tolerances in geometry, surface integrity, and
roughness characteristics. Polishing particles remove macro/micro elements and produce
a smoother surface or flatness in low discrepancies by rubbing the polishing particles on
a rotating disk. Polishing uses a larger number of multi point or random cutting edges for
effective material removal. Abrasive finishing processes are used in a wide range of
material applications and industries, i.e. in aerospace, automotive, mechanical seals, fluid
handling, and many others precision engineering industries.
The polishing process is controlled by varying the speed, contact pressure [68],
temperature, grit size and chemical usage [69]. Wet polishing reduces the fracturing rate,
inhomogeneity and crack formation during mechanical grinding of composite materials
[67]. During dry polishing, temperature effects are very significant especially for
materials with low thermal tolerance e.g. polymers and bio composites. The surface
defects can be greatly reduced due to the softening of the material’s surface caused by
augmented temperature. Meanwhile, the grit size affects the final roughness of the
surfaces, where a rougher surface can be produced by grinding with high grit size,
presented by more fractured zone and polishing streak. In a diamond finishing study,
increasing the contact pressure and speed increases wear and surface defects [68]. Studies
on the effects of the polishing process and polished material for preventing bacterial
adhesion have also been reported by many authors. Bacterial adhesion onto polished TI
alloy-based implants was reduced after the roughness was kept to nanometre level (Sa =
350-540 nm) and was also due to the formation of a thin surface oxide layer on the
titanium that aided in mitigating the transport of bacteria onto the surface [69]. A study
by Skovager, Whitehead [70] reported that polished stainless steel caused more adhesion
of Listeria monocytogenes but showed the lowest retainment during the cleaning process
34
compared to other rougher surfaces. Kang, Choi [71] reported a positive and negative
correlation relating to surface roughness and adhesion of Streptococcus mitis between
two different polished substrates using various types of polishing kits. In a collective
review by Hu, Zhang [72], the polishing process alters the surface morphology, chemical
composition, wettability [69] and subsequently affected the post modification activities.
2.4.2 Wire EDM
The wire electrical discharge machining (WEDM) is a non-traditional machining
preferable in small scale production as it offers a cheap and fast method for cutting tough
alloy materials with high hardness and impact resistance [73]. WEDM is widely utilised
in modern industries such as aerospace, automotive, precision instruments, moulds etc
[74, 75]. It is a non-contact, force free and thermal process where an ionised channel
between the nearest point of the work and tool is generated by the applied voltage.
WEDM can be utilised to create a surface with specialised and difficult contours, but it
suffers from a few limitations such as poor surface finish and high tool cost that affects
the production cost of the finished products. Good workmanship is measured by the
electrode wear rate, size precision, efficient material removal rate (MRR), chemical and
surface topography quality (i.e Sa, peaks, cracks etc) [76]. A better finishing quality by
WEDM was reported by combining with an ultrasonic or magnetic field where surface
roughness, irregularities, and surface cracks were successfully reduced compared to a
conventional WEDM process [77].
WEDM process is a thermal-utilising-process using electrical discharge to erode
certain parts of the conductive materials, which leads to melting-vaporisation-ionisation
of the wire electrode at the pulse discharge point. The conductive materials are immersed
in the dielectric liquid, and wire brass with a varied diameter (0.02 – 0.3 mm) is usually
used as the electrode [76], often facing high wearing rate. The process generates recast
layers, protruding peaks of molten metal, discharge craters and cracks. Moreover, the
remaining debris that failed to be removed by the dielectric fluid accumulates in the

35
discharge channel and machining gap, subsequently affecting the stability of the
discharge pulse, thus producing a surface with poor finishing [76].
Despite the precision control over difficult sizes and shapes, the operating
procedures consisted of various parameters, and the synergistic change of more than one
parameter often revealed a significant output. The set-up for the machine parameters are
often complex and the detailed input factor and their heat treatment is yet to be
understood. The effects of pulse on/off time [78], voltage, wire tension, cutting speed, cut
directions and electrolyte flushing pressure [79] have been reported in the literature as
affecting the properties of surface finishing and the wearing rate of the electrode wire.
Optimising these process parameters aids in prolonging the shelf life of the wire electrode,
increasing cutting efficiency and reducing surface imperfections. The reduced
abrasive/adhesive wear and anti-erosion properties of an aluminium oxide film was
obtained by Cheng, Nakamoto [80], by employing high speed WEDM. Torres, Puertas
[78] reported that the lowest Sa value was obtained by keeping the current load at 4A and
pulse time of 50 s, which were the lowest values in the range tested. Meanwhile, reduced
peaks and irregularities (cleaner surface) were attained at the highest pulse time (150 s).
A better surface finishing was associated with higher material removal rate (MRR),
achieved by varying the current density and further enhanced by introducing the magnetic
field and ultrasonic vibration [77]. Despite many studies on optimising the processing
parameters of WEDM to produce a good surface finishing, to the best of our knowledge,
this surface finishing has not been reported with intensity for bacterial adhesion.
2.4.3 Laser Fabrication
Implant failure due to the presence of bacteria and biofilm often requires a
secondary surgery to remove the infected component causing a possible threat to patient
health and can lead to fatality. It has been a long search for a universal surface that would
facilitate the growth of tissue, while preventing the adherence of most pathogenic
bacteria. Such a surface is still at an early stage since the phenomena of adhesion is yet
to be understood. Although numerous reports have been published relating to bacterial

36
adhesion with surface modification, failure to carry out comprehensive analyses on the
surface and bacterial properties has resulted in a deficient conclusion on the properties of
surfaces that can be manipulated for preventing adhesion.
Femtosecond laser fabrication offers a very flexible 3D positional control with
high accuracy of energy deposition at a scale range down to sub-m resolutions. Unlike
nanosecond laser, femtosecond laser produces a clean surface finishing, eliminating the
heat affected zone during processing [72]. It can be used to design a surface from a wide
range of materials, where the post modification textures often offer high thermal and
mechanical stability against abrasion which are some of the many important features to
be attained in load bearing implants [72]. Laser processing techniques are compatible and
can be utilised to complement other laser-based techniques i.e. interference lithography
and micromachining. Figure 2-1 illustrates the simple laser technique used by Ma, Tong
[81].
Figure 2-1: Schematic set up of laser fabrication of bioactive glass where the laser beam
is passed through the neutral density filter (NDF) and lens (L = 5 cm focal lengths) before
hitting the sample on the computer-controlled X-Y stages.
Surface texturing with an ultrafast laser offers simplicity, flexibility,
controllability and reproducibility of results and is also easy for scaling up [82]. Laser
fabrication has been gaining interest and is a widely exploited method to achieve a surface
with varying functionalisation’s. Laser fabrication has been utilised for micro polishing
[83] and to produce surfaces with emerging textures [58], controlled wettability (REF),
biofunctionalization [84], low reflection etc. The evolution of LIPSS emerged after the

37
laser fabrication could be varied to suit various applications. LIPSS can be tailored by
varying the laser power (P), number of pulses [58], laser speed (V) [72], temperature [85],
laser spot diameter (D), [84], wavelength [85] etc. These parameters will determine the
laser fluence, F which represents the amount of energy per unit area as follows: -
𝑭 = 𝑷
𝑽 𝒙 𝑫 Equation 2-1
Where F in (J/mm2), P (mW), V (mm/s) and D (mm).
The effect of laser fluence determines the melting rate of the metal surface after
the laser incidents. A very low F results in an incomplete melting of the exposed surface
subsequently reducing the strength attachment of the molten layer on the substrate.
Reducing the scanning speed will expand the formation of the heat affected zone and
overlapping may occur if the hatch distances are kept at minimum. Besides that, the
vaporisation rate of the metal was increased and blown off through laser bombardment
leaving a deep gap between the protrusions Hu, Zhang [72]. The overlapping ratio needs
to be set accurately to have a good balance between surface homogeneity and processing
efficiency. An overlapping ratio that’s too high or too low may lead to overheating thus
increasing cladding inefficiency or causing surface inhomogeneity, respectively [84].
According to Du, Ai [86], increasing the laser fluence > 5.5 x 10³ W/mm2 in accordance
with an increased pulse overlap produced a polyimide surface with hydrophilic character,
while increasing these parameters produced a superhydrophobic characteristic. The two
extreme conditions arise due to its surface topography and changes in its surface
chemistry. In a combination of laser texturing and chemical treatment that produced a
circle shape texture pattern, the super hydrophobicity of SS surface was reduced with an
increasing ratio of P/D from 1.0 to 1.8 due to the increased flattened area on the modified
surfaces [81].

38
2.6 Mechanism and Factors Governing Bacterial Adhesion
Bacterial adhesion is influenced by the properties of both the bacteria and the
substratum surface. Bacterial characteristics that are highly influential in directing the
adhesion mechanism are hydrophobicity [87], surface charge, motility, pH, chemical
agents [88], biofilm rheology, temperature [89] and the excretion of extracellular
substances such as polysaccharides/protein. The adhesion and colonisation of bacteria are
being recognised to be of significant socio-economic interest throughout the world.
Bacterial contamination and biofilm growth affect many aspects of society, ranging from
bio-induced corrosion of industrial piping and other materials, to serious health
implications in infected individuals [90]. Biofilms are particularly durable and persistent,
being responsible for 65% of hospital-acquired infections in the US. Cleaning with
chemical disinfectants not only threaten the environment but may create new strains that
are more robust and resistant to antibiotics. Besides that, the use of disinfectants is tightly
controlled by local authorities, often incurring a very high cost for environmental-friendly
solvents, yet often failing to achieve the complete elimination of biofilms. Thereby, the
effective action to limit the impact of bacterial adhesion is to prevent the initial formation
rather than employing remediation.
The adhesion of micro-organisms on the surface is associated with hydrophobic
interaction, cell communications, specific interactions of the relevant properties of the
substratum such as hydrophobicity, zeta potential, surface texture, surface energy etc.
[91]. The influence of the surface free energies of the substratum and the bacterium can
be modelled using a thermodynamic approach. The extended-DLVO [92] theory accounts
for Lifshitz–Van der Waals, electrostatic, and short-range acid–base interaction energies
between the surface and the bacterium as a function of their separation distance. The
mechanistic knowledge of bacterial adhesion obtained from the extended-DLVO theory
provides guidelines for the development of surface coatings exhibiting minimal adhesion
of bacteria.

39
Adhesion on the surface is initiated by the formation of a conditioning aqueous
layer on the solid surfaces that are rich in nutrients, subsequently attracting the sessile
organism. The establishment of bacteria-surface interaction consists of four stages[93].
The first stage is the initial attachment-involving interaction between the bacterial cell-
surface. Stage two occurs when the binding proceeds with specific and non-specific
interactions between the surface proteins and binding molecules on the biomaterial. After
adhesion is secured, the micro-organisms predominantly grow as communities on the
surfaces (stage 3) and continuous colonisation is depicted by the irreversible adhesion or
biofilm formation. A rapid multiplication of the species occurs with the formation of
biofilm and the adhered bacteria becoming the source of nutrient for the biofilm
community, thus maintaining their viability.
2.6.1 Bacterial properties
An important feature of the bacterial cell membrane is related to the composition
that leads to its multiple responses when interacting with inert surfaces or biological
compounds. The composition and types of the polysaccharides, lipids and proteins
attached to the cell membrane vary significantly with different types of bacteria and are
categorised based on the Gram positive or negative grouping. The cell walls of Gram-
positive bacteria are mainly a network of long sugar strands consisting of a thick layer of
stretchable peptidoglycan approximately ~25 nm, cross-linked with amino acids a). The
peptidoglycan cell wall is comprised of multiple inter-connected sheaths of cross-linked
glycan strands that form the general shape of the bacterial cell. In contrast, the membrane
of Gram-negative bacteria consists of lipopolysaccharides, comprised of an inner and
outer membrane separated by a periplasmic space and a thinner layer of peptidoglycan.
b). The peptidoglycan layer is linked to the outer membrane via lipoprotein, is thinner
than the one in the Gram-positive bacteria and vulnerable against shear.

40
It is important to note that the bacterial properties are highly dependent on their
surrounding (pH, medium and nutrient availability, temperature, salinity etc.) and on the
growth stages. Protein and lipid composition on the bacterial surfaces vary according to
the growth stages, subsequently changing its hydrophobicity and surface charge, thereby
affecting adhesion. Proteinaceous appendages including pili and flagella also initiate the
bacterial adhesion by establishing a strong binding between surface and cell. Bacteria
often carry a negative charge in an ionic solution above and below their isoelectric values,
and upon contact with biomaterial surfaces which usually have a negative charge the
repulsion effect is activated. But at around 15 nm, van der Waals and hydrophobic forces
are exerted and the repulsion is overcome.
Others have reported that the effect of the electrostatic interaction between the
negatively charged-bacterial cell and positively charged substratum surpassed the
attraction caused by hydrophobic attraction. In addition, the forces caused by electrostatic
interaction are far greater resulting in a stronger adhesion for cell-metal surface
interaction [94]. Bacteria with a high surface energy show low preference for hydrophobic
surfaces (low surface energy) but perform a strong bonding with hydrophilic surfaces
[95]. An adhesion study on polymeric composites using two different types of rod-shaped
Gram-positive and Gram-negative bacteria showed a significant difference in magnitudes
of adhesion, where the Gram-positive bacteria was a greater coloniser than the Gram-
negative Sp [55].
2.6.2 Surface properties
The effects of surface patterns [96], surface roughness [93], surface energy [97],
chemical composition and wettability [98] were the most widely reported as very
influential aspects for adhesion. Primarily, the adhesion magnitude is debated based on
the modified roughness and wettability before the other factors as these parameters can
be easily altered and undergo a simple analysis method as discussed previously. However,
when these parameters often failed to provide a consistent observation for different types
of bacteria or surfaces, other factors such as surface chemistry and energy was evaluated.

41
The studies often concluded that alterations of adhesion were a contribution of two or
more synergistic factors and are strain dependent.
The ability of surfaces to repel bacteria is often associated with the
increased/reduced wettability of the modified surfaces. It is widely accepted that the
resistance for adhesion increases when the CA are beyond = 160°, where a super
hydrophobicity character is pronounced. Yoon, Rungraeng [99] reported that despite
different chemical properties, superhydrophobic TI/SS has been proven to reduce the
adhesion capacity in comparison to its control experiments (CA < 100°), but slightly
below a similar surface with CA = 143° [99]. The increased cleaning ability achieved
with hydrophobic/superhydrophobic surfaces is contributed by the rolling off effect of
the water droplets that produces a minimal contact between the liquid/cells with the
surface, thus minimising the adhesion. Super hydrophobicity can be easily fabricated to
increase the resistance to mass transfer, thus can minimise the proliferation of the adhered
bacteria and avoid the formation of biofilms in long operations. However, the
effectiveness of the superhydrophobic surface are still dependent on the types of bacteria,
types of material, the surrounding conditions and poor in stability. Superhydrophobic
surfaces can be attained using various physical and chemical methods, or a combination
of both. Super hydrophobicity has been established by authors using various techniques
such as nano-structuring [54], plasma technique [100], coatings and chemical
functionalisation [101], lithography, or a combination of these processes. The question
that arises with the approaches concerns the reproducibility and the durability of the
surface. The effect from chemical functionalisation often lack stability linked with the
leaching process. The increased wettability effect achieved using nano-structuring often
produce a variety of results, which are caused by the synergistic effects from multiple
factors which have yet to be understood.
Surface texturing is one of the methods that was proposed to reduce the bacteria
adhesion. A pitted surface increases the wettability of the surface, thus serving as a
sink/strainer for bacterial adhesion. On the other hand, a surface with protruding features
works differently from a surface with valleys and grooves. Many researchers have
reported that reduced adhesion was attained since bacterial attachment was prevented on
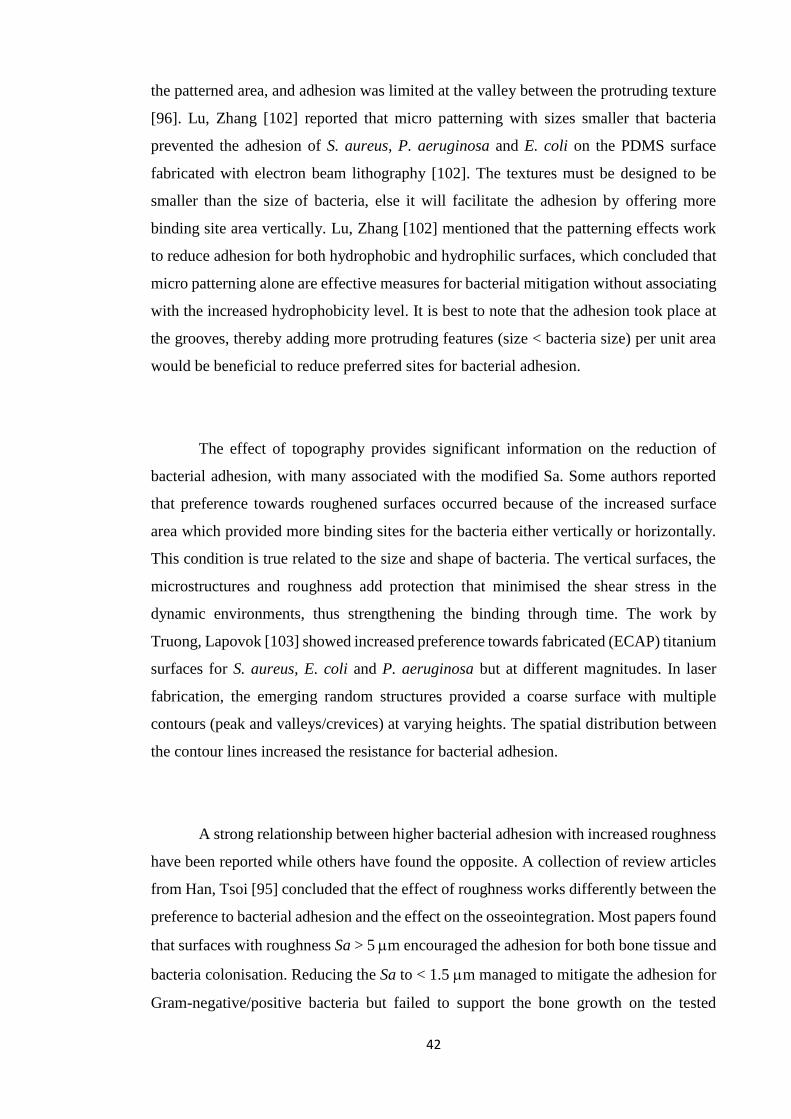
42
the patterned area, and adhesion was limited at the valley between the protruding texture
[96]. Lu, Zhang [102] reported that micro patterning with sizes smaller that bacteria
prevented the adhesion of S. aureus, P. aeruginosa and E. coli on the PDMS surface
fabricated with electron beam lithography [102]. The textures must be designed to be
smaller than the size of bacteria, else it will facilitate the adhesion by offering more
binding site area vertically. Lu, Zhang [102] mentioned that the patterning effects work
to reduce adhesion for both hydrophobic and hydrophilic surfaces, which concluded that
micro patterning alone are effective measures for bacterial mitigation without associating
with the increased hydrophobicity level. It is best to note that the adhesion took place at
the grooves, thereby adding more protruding features (size < bacteria size) per unit area
would be beneficial to reduce preferred sites for bacterial adhesion.
The effect of topography provides significant information on the reduction of
bacterial adhesion, with many associated with the modified Sa. Some authors reported
that preference towards roughened surfaces occurred because of the increased surface
area which provided more binding sites for the bacteria either vertically or horizontally.
This condition is true related to the size and shape of bacteria. The vertical surfaces, the
microstructures and roughness add protection that minimised the shear stress in the
dynamic environments, thus strengthening the binding through time. The work by
Truong, Lapovok [103] showed increased preference towards fabricated (ECAP) titanium
surfaces for S. aureus, E. coli and P. aeruginosa but at different magnitudes. In laser
fabrication, the emerging random structures provided a coarse surface with multiple
contours (peak and valleys/crevices) at varying heights. The spatial distribution between
the contour lines increased the resistance for bacterial adhesion.
A strong relationship between higher bacterial adhesion with increased roughness
have been reported while others have found the opposite. A collection of review articles
from Han, Tsoi [95] concluded that the effect of roughness works differently between the
preference to bacterial adhesion and the effect on the osseointegration. Most papers found
that surfaces with roughness Sa > 5 m encouraged the adhesion for both bone tissue and
bacteria colonisation. Reducing the Sa to < 1.5 m managed to mitigate the adhesion for
Gram-negative/positive bacteria but failed to support the bone growth on the tested

43
implant [95]. This is supported by the earlier finding of Korber, Choi [104], that a rough
surface increases surface area or contact point for the bacteria-surface interactions and
enhanced cell to cell communications which leads to biofilm development. However,
more bacterial attachment was observed on the weld metal of 304L SS compared to its
base metal, where a strong correlation between the adhesion and the average grain size
was successfully reported. Another observation by Little, Edelman [105] showed that
smoother and rougher surfaces enhanced the bacterial adhesion of four different bacterial
strains on the 304-SS surface with Sa ranging from 0.03 to 0.89 m. Minimal adhesion
was observed at Sa = 0.16 m while both smoother and rougher surfaces were shown to
attract more bacteria.
In laser fabrications, adhesion of E. coli on SS that has undergone nanosecond
laser was hindered on a surface with roughness Sa between 0.006 m and 33.00 m with
coverage area reduced to < 10%. Conversely, bacterial coverage increased to more than
50% on a surface with roughness between 0.83–11 m. A study on PPMA also shows
increased S. aureus adhesion on a surface displaying roughness in the range of 0.3–1.86
m. Finer and rougher surfaces with roughness 0.04 m and 7.89 m displayed an
increased antibacterial property, respectively. An increase in the roughness of SS from
0.04 m for a polished sample to 0.30 m for an abraded sample, increased bacterial
adhesion strength more than a larger increase in surface roughness from 0.04 to 0.96 m
for the polished stainless steel. This means that under the same tip-surface force during
scanning with an atomic force microscopy tip, more cells remained on abraded stainless
steel than on unpolished/polished stainless steel. Although no absolute value of roughness
has been reported to be the standard for controlling the adhesion phenomena, the
roughness that similar to the size of the bacteria are often referred to as the threshold
values. Others have reported Sa = 0.2 m to be the threshold value since any further
reduction of Sa did not contribute towards reducing adhesion on the dental implant Han,
Tsoi [95].
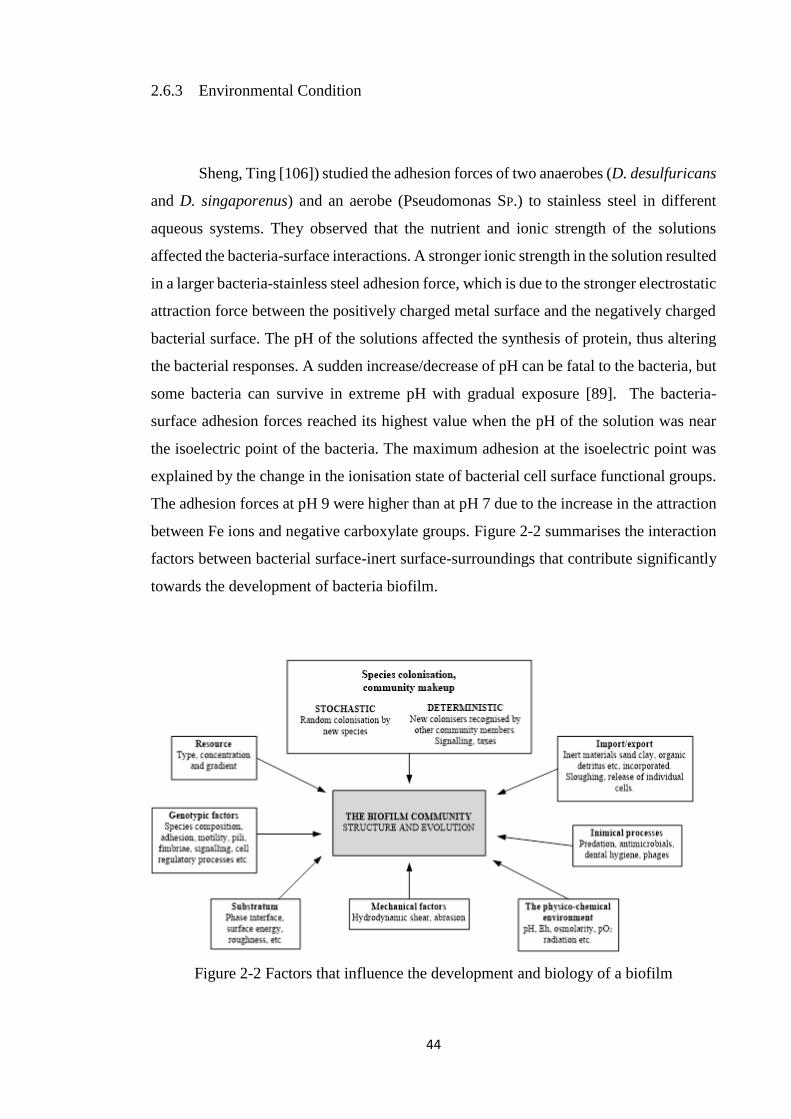
44
2.6.3 Environmental Condition
Sheng, Ting [106]) studied the adhesion forces of two anaerobes (D. desulfuricans
and D. singaporenus) and an aerobe (Pseudomonas SP.) to stainless steel in different
aqueous systems. They observed that the nutrient and ionic strength of the solutions
affected the bacteria-surface interactions. A stronger ionic strength in the solution resulted
in a larger bacteria-stainless steel adhesion force, which is due to the stronger electrostatic
attraction force between the positively charged metal surface and the negatively charged
bacterial surface. The pH of the solutions affected the synthesis of protein, thus altering
the bacterial responses. A sudden increase/decrease of pH can be fatal to the bacteria, but
some bacteria can survive in extreme pH with gradual exposure [89]. The bacteria-
surface adhesion forces reached its highest value when the pH of the solution was near
the isoelectric point of the bacteria. The maximum adhesion at the isoelectric point was
explained by the change in the ionisation state of bacterial cell surface functional groups.
The adhesion forces at pH 9 were higher than at pH 7 due to the increase in the attraction
between Fe ions and negative carboxylate groups. Figure 2-2 summarises the interaction
factors between bacterial surface-inert surface-surroundings that contribute significantly
towards the development of bacteria biofilm.
Figure 2-2 Factors that influence the development and biology of a biofilm
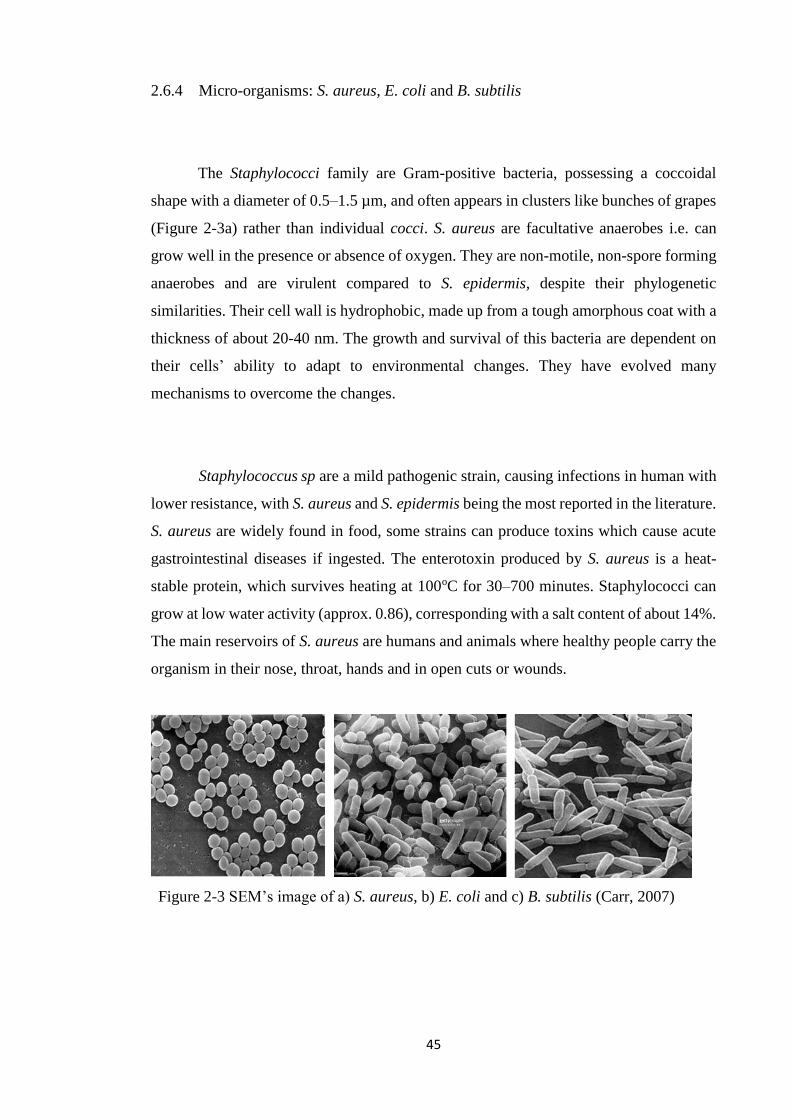
45
2.6.4 Micro-organisms: S. aureus, E. coli and B. subtilis
The Staphylococci family are Gram-positive bacteria, possessing a coccoidal
shape with a diameter of 0.5–1.5 µm, and often appears in clusters like bunches of grapes
(Figure 2-3a) rather than individual cocci. S. aureus are facultative anaerobes i.e. can
grow well in the presence or absence of oxygen. They are non-motile, non-spore forming
anaerobes and are virulent compared to S. epidermis, despite their phylogenetic
similarities. Their cell wall is hydrophobic, made up from a tough amorphous coat with a
thickness of about 20-40 nm. The growth and survival of this bacteria are dependent on
their cells’ ability to adapt to environmental changes. They have evolved many
mechanisms to overcome the changes.
Staphylococcus sp are a mild pathogenic strain, causing infections in human with
lower resistance, with S. aureus and S. epidermis being the most reported in the literature.
S. aureus are widely found in food, some strains can produce toxins which cause acute
gastrointestinal diseases if ingested. The enterotoxin produced by S. aureus is a heat-
stable protein, which survives heating at 100oC for 30–700 minutes. Staphylococci can
grow at low water activity (approx. 0.86), corresponding with a salt content of about 14%.
The main reservoirs of S. aureus are humans and animals where healthy people carry the
organism in their nose, throat, hands and in open cuts or wounds.
Figure 2-3 SEM’s image of a) S. aureus, b) E. coli and c) B. subtilis (Carr, 2007)

46
Escherichia coli (E. coli) is a Gram-negative, rod-shaped, non-spore forming,
motile with peritrichous flagella or non-motile, and grows well in LB media (Figure
2-3b). The normal length of the bacteria is between 1.0–1.5 µm, while the shorter end is
0.45–0.8 µm and can reach up to 2–3 µm in length. E. coli expresses different types of
pili that stretch 5–10 nm long, which aid the bacteria to fasten themselves to a surface,
thus preventing shearing when external forces are applied [107]. E. coli can be found in
the human body with the ability to grow under both aerobic and anaerobic conditions
Morgan and Wilson [108]. Most strains of E. coli are harmless and are a part of the normal
intestinal microflora, synthesising vitamins to efficiently retard the growth of harmful
organisms. An overpopulation of intestinal E. coli causes sickness and diarrhoea with
vomiting. The worst case associated with E. coli infection is causing bloody diarrhoea
which can lead to kidney failure and fatality, with more cases observed in children and
people with low immunity. The optimal conditions for E. coli growth occur at a pH
between 6.0 to 8.0, with temperatures between 30o to 39oC. However, growth can occur
in as low as pH 4.3 and as high as pH 10 and is a strain-dependent property [109].
B. subtilis is a Gram-positive spore forming bacteria shaped like a rod (Figure 2-3
c). Bacillus with spore forming ability grow well in an aerated medium and start to
produce end spores when nutrient and oxygen availability becomes limited. These strains
are widely studied due to its lack of pathogenicity effect on humans, animals and plants.
The adhesion of B. subtilis is facilitated by EPS enhanced cellular adhesion and the
abilities vary with the stage of growth [110]. Bacillus are exploited for the manufacture
of various enzymes, secreting extracellular proteins which are beneficial for many
industrial purposes. Besides that, B. subtilis are suitable to be used as a mini factory for
synthesising a product of interest, achieved by inserting foreign genes to produce the
product of interest. The major concern with the spore forming bacteria is due to its ability
to thrive in unfavourable conditions and are resistant to heat, chemicals, pH, nutrient
limitation, dehydration etc, thus causing persistent contamination [111].
The length of mature B. subtilis cells range between 1.2–2.4 µm with a diameter
of approximately 0.5–0.75 µm. Its oval-thick skin end spore is slightly smaller with a
dimension of 0.6–0.9 µm, is highly resistant to extreme environments such as chemicals,
radiation and insusceptible to enzyme attack. The matured cells are made by thick

47
capsules of heteropolymer matrix of peptidoglycan. It thicknesses range between 20–50
nm, attached to anionic polymers such as teichoic and teichuronic acids, 10x thicker than
that of typical Gram-negative bacteria such as E. coli. The highly negative charge of the
B. subtilis induces bonding towards metallic surfaces with an opposite charge. This is
attributed to the anionic polymers and the un-substitute carboxyl groups of muramyl
peptide that covers the surfaces contributing to its negative surface charge. Besides that,
B. subtilis also synthesises lipoteichoic acid which contains polyanionic hydrophilic
chains.
2.6.5 Wire Electrical Discharge Machine (WEDM)
The spark theory on wire electrode discharge machining (WEDM) is basically the
same as that of the vertical EDM process. In wire EDM, the conductive materials are
machined with a series of electrical discharges (sparks) that are produced between an
accurately positioned moving wire (the electrode) and the work piece. High frequency
pulses of alternating or direct current is discharged from the wire to the workpiece with a
very small spark gap through an insulated dielectric fluid [112].
The mechanism of WEDM puts impulse voltage between the electrode wire and
the workpiece through an impulse source controlled by a servo system, to get a certain
gap, and realise impulse discharging in the working liquid between electrode wire and
workpiece. Numerous tiny holes appear due to the erosion of impulse discharging, and
therefore gets the needed shape of workpiece [113]. The electrode wire is connected to
the cathode of the impulse power source, and the workpiece is connected to the anode of
the impulse power source. When the workpiece is approaching the electrode wire in the
insulating liquid and the gap between them gets smaller to a certain value, the insulating
liquid is broken through; very shortly, discharging channel forms, and the WEDM method
involved using an electric voltage to produce rough surfaces. The Wire Electric Discharge
Machine (WEDM) uses a single pulse discharge machine equipped with an IGBT wave
generator to produce a surface roughness below 10 m. For this study, experiments were
carried out using a pulse range between 100–500 ms, with the electrode distance kept in

48
the range of 10 mm to 22 mm to obtain four different degrees of roughness. The pulse
duration was controlled manually by changing the program parameters of the single chip,
and the waveform produced was recorded using an oscilloscope for further analysis. The
voltage and current were set at their typical values of 200 V and 10 A, respectively. The
shape of the electrode chosen during machining was also varied, either using a needle or
disk type.
2.6.6 Laser-assisted technique
For the laser-assisted technique, the surfaces of both metals (stainless steel and
titanium alloy) were treated using the laser ablation technique. The laser treatment was
performed at the Karlsruhe Institute of Technology (KIT, Germany) using a micro-
machining workstation (PS450-TO, Optec, Belgium) equipped with an ultrafast fiber
laser (Tangerine, Amplitude Systems, France) operating with an average power of 35 W.
In order to accommodate the biological tests, the modified surfaces were fabricated using
a metal surface of size 2.0 cm x 2.0 cm and was polished to mirror finishing before
undergoing laser treatment. The metal surfaces were then crafted with 4 different surfaces
of size 5 mm x 5 mm, using four (4) laser parameters. The laser surface texturing was
carried out under two conditions, i) ambient air and ii) in argon; with a central wavelength
of 515 µm, a laser pulse duration of 380 fs and a repetition rate of 200 kHz. The laser
beam scanning speed towards the metals was set at between 10–50 mm/s while the
average laser power was varied between 80 mW - 120 0mW, with a single or double pass.
Between two laser pulses, the sample is moved in the scanning direction with a length of
about 2.75μm. The generation of the LIPSS was guided through a beam expander (2-fold)
and the scan head was from Newson Engineering BV, Belgium. This was used together
with an f-theta lens with a focal length of 100 mm [7]. After the laser treatment, the
surface structure achieved was characterised by scanning electron microscopy (SEM)
(Carl Zeiss, SEM EVO 50).

49
2.6.7 Surface Characterisation
All specimens were characterised prior to adhesion testing using both qualitative
and quantitative analysis. Surface characterisations were tested and analysed for surface
topography and the surface wettability (contact angle). Surface structures were measured
by using an optical interferometer profiler (Contour GT-K0 3D Profiler, Bruker), which
provides a fast and high-resolution measurement (0.1 to 10 mm) over a large scanning
area up to 50 × 50 mm2. This profiler has a vertical resolution of 0.1 nm and a lateral
resolution of 0.13 m. In this study, the topography measurements for each specimen
were obtained under a magnification of 10 to 27.5 over an area of 0.5 × 0.5 mm2 with a
stitching facility. High magnification measurements were also taken over a smaller area
of 100 × 100 μm2 to provide some finer features. For comparison purposes, surface
structures on as-received surface areas were also measured. Surface data validity was
achieved with a minimum of three (3) sets of measurements taken at different places;
averaged values of surface roughness, and their height distribution parameters were
recorded and analysed in Chapter 4.
2.6 Biological
There are two parts involved in the biological experiment: i) bacterial
characterisation and ii) the bacterial adhesion test. The types of bacteria selected for
the surface adhesion experiment were chosen from non-harmful strains of S. aureus,
E. coli and B. subtilis. They were chosen based on their size, shape
(coccus/oval/rod), Gram type, hydrophobicity and surface charges.
For the bacterial-surface adhesion on glass surfaces, the experiment was
carried out in two conditions; i) Adhesion of active young cells (cells at the
exponential phase) and ii) adhesion of old cells (cells in the stationary phase) using
a 66-hour culture. To obtain young and active cells, E. coli/S. aureus/B. subtilis was
cultivated in LB broth for 10 hours to ensure a maximum viable cell count located

50
in the middle of the log phase. In contrast, the study of bacterial adhesion with old
cultures was carried out by prolonging the bacterial cultivation for 66 hours, where
the bacteria cell was starved due to the exhaustion of nutrients. At this stage, the
growth ceased, and the viable bacteria continued to live with very minimal cell
activity. For the preparation of the bacterial suspension, the culture broths for both
conditions were centrifuged at 5000 rpm, and the cell was washed twice using a
saline solution. The cells were suspended in a 0.1 M Phosphate buffer saline (PBS)
pH ~7.0 and made-up to an OD of 1.0 (measured with UV VIS). This bacterial
suspension was then used for the subsequent adhesion experiments. This procedure
was carried out in order to ensure the equivalent number of bacteria was used for
every experiment to avoid discrepancies in the data.
The E. coli, S. aureus and B. subtilis specimens were obtained from the Science
Lab, School of Biosciences, University of Warwick. For long term preservation, these
cultures were kept in 20% (v/v) glycerol, and stored in a freezer at -80°C. For use in
subsequent microbial work, these bacterial stocks were stored at -20°C, transferred to an
agar plate and incubated for 24 hours at 37°C before preparing the seed culture.
The samples collected at specified time intervals were quantified using a plating
method for the determination of the numbers of live cultures. The sample was diluted up
to 10-2-10-6 dilution using sterilised distilled water to obtain countable colonies. 10 µL
of aliquots was then transferred to an agar plate and incubated at 37oC for 24 hours. The
number of colonies formed on the agar surface were counted and measured as CFU/ml.
The procedures were carried out in a strictly sterile environment.

51
2.7.1 Optical density (OD)
The optical density (OD) of the samples was determined using a UV
Spectrophotometer (Hitachi) for measuring the concentration of micro-organisms in the
samples for both live and dead cells. The samples were diluted using distilled water, and
the OD was read at wavelength 600nm against the fermentation media as a blank. The
results were plotted against time for the growth curve.
A smear of bacterial culture was prepared and fixed to the surface of a clean glass
slide. The bacteria smear was air dried at room temperature and passed through a flame
very quickly several times for heat fixation. A drop of crystal violet was smeared on the
bacterial sample and left for 1 minute and the process was continued by washing with
distilled water from a wash bottle. The smear was then covered with Gram’s iodine for 1
minute. The iodine was washed off by tilting the slide and squirting water above the smear
so that the water ran over the smear. A 95% ethyl alcohol solution was run through the
smear to decolourise the surface until no large amounts of the purple wash came out.
Finally, safranin was added for 1 minute, and removed by washing with distilled water.
Excess water was removed by blotting with a paper towel or adsorbent paper, which was
pressed lightly on the smear. The stained smear was then examined microscopically using
low (10 – 20x), high-dry (40x), and oil immersion (100x) lenses. Upon the staining of
the bacteria, the stock solution was diluted using DMSO to a final concentration of 50-20
nM and was stored at -20oC. This must be done in a plastic vial to prevent the stain from
sticking to the wall (e.g. glass). Drops of diluted dye were applied on the adhered bacteria,
and the slide was tilted to make sure that it covered most of the respective area. The
sample was left for 5 minutes in a dark room to allow time for the dye to penetrate the
bacterial cell. The slide was then rinsed with distilled water to remove the excess dye and
allowed to dry. The smear was covered with a glass coverslip before being visualised with
a fluorescent microscope.

52
During the observation of the sample with a microscope, several different
counting methods can be used to evaluate the number of adhered bacteria. In general,
a suitable approach simply involves dividing the area of interest into sections, counting
the number of bacteria in each section and taking the average overall number.
However, the counting process can be extremely difficult in some cases when there
are many cells and/or congregations of a bacterium. However, to optimise the accuracy
of the measurement, statistical analysis was carried out to increase the degree of
confidence.
Viewing of a micro-organism under light microscopy was done using oil
immersion lenses with 100x magnification. The microscope was connected to an
eyepiece, and viewing can be done through the computer screen, and images can be
captured and saved. Measuring the size of bacteria was done manually with the help of
the software, Dino® version 3.
Visualisations were carried out in the dark room since Syto®9 is a light sensitive
dye. The stained cells appeared green when viewing with a fluorescent microscope
(Hitachi). Images were visualised using 10x, 20x, 40x and 100x lenses. The viewed
images were captured using software (DenQ) for the determination of the number of
adhered cells on the solid surfaces. The image grey levels were modified to obtain high
contrasts between the cells and the background. This can help in either counting the
individual cells, or if these are too numerous, in determining the percentage area covered
by the bacteria.
Viewing with a SEM (Zeiss) was carried out for the observation of the adhered
bacteria on the solid surfaces. It also provides close-up images of the bacteria for the
determination of sizes and shapes. Samples were coated with gold prior to viewing, and
images were captured using 250x, 500x, 1000x, 2000x and 5000x magnifications.
53
Determinations of shapes and sizes were carried out by viewing and capturing the
images using microscope. The sizes were measured using ImageJ from an average of 50–
100 different images, and the average values with standard deviation were recorded. All
micro-organisms were grown from the 10-hour and 72-hour cultures to study the cells’
surface characteristics during the exponential and stationary phases. Four types of
solvents were used, hexadecane, chloroform, ethyl acetate and decane, for the
determination of the electron donor/acceptor properties of the cells. 3 ml of bacterial
suspension (OD of 1.0) was added to 3 ml of solvent (1:1 ratio). The mixture was then
mixed and vortexed for 60 seconds and allowed to separate at room temperature for 15
minutes. The OD of the bacterial suspension against the fresh PBS buffer, after the phase
separation, was measured at 600 nm and the affinity towards the solvent was calculated
using the following equation. All measurements were carried out in triplicate and the
results presented were the average values.
The quantitative evaluation of the adhered cells on the solid surfaces was
performed using fluorescence microscopy (Zeiss) with the help of software Open Lab
4.0.2 using the established protocol. The software assisted in quantifying the number of
adhered cells by evaluating the cell coverage in terms of integrated density [I.D. = N x
(M-B)], where N is the pixel in the area covered by the microscope, and M and B are the
average grey area and common pixel, respectively. The densities of the cells were
determined by the numbers of bacteria adhered per area covered.
This chapter reviewed the development of biomimetic study and the current
scenario that creates a new dimension of biomimetic phenomenon. It covers the surface
finishing techniques (polishing, WEDM and laser) and the quality of surface finishing.
The effects of varying the process parameters on the properties of modified surfaces were
thoroughly reported. The mechanism of bacterial adhesion on the biomaterials were
deeply reported, and factors affecting the interaction of bacteria i.e bacterial properties,
surface properties and surrounding effects were appropriately addressed.

54
2.8 Chapter Summary
The methodological approach engaged in this study combined two major fields:
surface at engineering and biological works. The combination will provide a
comprehensive evidence of the behaviour of bacterial adhesion on inert surfaces such as
metals and polymers. Knowledge of the bacterial adhesion phenomenon will lead the
researcher to understand the major parameters influencing the interaction between the
surface and micro-organism mechanism. To scientifically demonstrate the interactivity
between surfaces and biological organisms, several quantitative and qualitative
experimental works have been conducted according to the standard procedures.
For the entire thesis, four (4) major experiments were involved and have been
classified as: i) the fabrication process, ii) surface characterisation, iii) bacterial
characterisation and iv) adhesion testing works. The results of each stage were closely
monitored to ensure the validity of the data to be used in the next experimental stage,
whereby the final correlation of bacteria adhesion can be concluded in the last experiment
(adhesion test). The uniformity of substrate topography parameters will determine the
constructive correlation of the adhesion phenomena while bacterial characteristics varied
the trend and adhesion degree on these surfaces. These aspects were thoroughly studied
and analysed to relate the adhesion with the properties of the surfaces. Correlations
between surface topography and bacteria adhesion contributed significantly to the
determination of the major parameters that governed the adhesion process.

55
Bacterial Characterisation & Process Screening
3.1 Introduction to Partial Characterisation of Micro-organism
This chapter discusses the effect of bacterial properties on the adhesion on a solid
surface (borosilicate glass). The work was dedicated to searching for some patterns
concerning adhesion involving distinctive bacteria, which are S. aureus, E. coli and B.
subtilis. The bacteria underwent a partial characterisation which includes a determination
of shape and size, cell-surface characterisation and Gram types. The solid surfaces
(glass) were fully immersed in a 100 mL bacterial suspension (containing approximately
~ 1 x 10⁸ CFU/mL of active/stationary phase cells) and shaken for a predetermined time
and condition. A typical borosilicate glass with dimensions of 25.4 x 76.2 mm was used
in this study and cleansed with ethanol followed by immersion in an ultrasonic bath for
10 minutes.
Biofilm development can occur under both low and highly dynamic environments.
The properties of the biofilms are relatively different from each other, with the latter being
the most difficult to be treated even after the combined use of biocides and mechanical
handling (scraping and brushing). Thus, the best way of cleaning the surfaces is to prevent
the formation of biofilms. Therefore, preparing a surface that resists bacterial adhesion is
a multi-million-dollar industry which not only saves on yearly maintenance costs, but can
also prolong the shelf life of the equipment. The preliminary adhesion studies involved
the screening of the physical parameters that contributed to the adhesion, including the
exposure time, bacterial concentration and culture age. The results of the study were used
for further works in the search for the possibility of manipulating the physical properties
of the targeted surfaces, namely the wettability, roughness and surface topography. Prior
to that, experimental works on the growth curve of the bacteria were carried out to

56
determine a suitable time for harvesting the cells in their exponential and stationary
phases.
3.2 Growth curve
The growth kinetic of different bacterial strains was examined.
Figure 3-1 (a – c) illustrates the growth stages of the bacteria over a 24-hour
incubation in a Luria broth, occurring at 37oC. Absorbance data and a colony forming
unit from three replications were used to measure the growth of the bacteria. Figure 3-1
(a) represents the growth stages of S. aureus, showing the absence of the stationary phase.
The cells grew exponentially for up to 12 hours, followed by a sudden decline up to the
24-hour mark. A similar trend was also observed in the colony forming unit, where the
numbers dropped by half, from the optimum value of 200 x 108 to less than 100 x 108
CFU/mL at the end of the incubation period. In contrast, the growth curves for the E. coli
[Figure 3-1 (b)] and B. subtilis [Figure 3-1 (c)] show the typical growth curves with clear
exponential, stationary and death phases. The overall results show that the maximum
number of CFU for all three types of bacteria varies accordingly. The highest number of
active cells was found with B. subtilis (~350 x 108 CFU/ mL), which was greater by 67%
and 75% as opposed to S. aureus (~210 x 108 CFU/ mL) and E. coli (~200 x 108 CFU/
mL), respectively. LB mediums are used widely for culturing B. subtilis, and the current
study shows that an appropriate growth was achievable with the same medium for
growing E. coli and S. aureus. Therefore, the LB medium was used as the culturing
preparation throughout the study for all three species.
After transferring the starter culture into the new medium, the cell is in the lag
phase which occurs within 0 to 4 hours maximum. The lag phase often serves as the
adaptation period for the bacteria to become familiar with the new environment, thus
growth is limited in this stage. Following the lag phase, the cells continued to grow and
produced newer cells efficiently due to the availability of mineral and essential substrates
for growth. This stage went on for 12 – 16 hours for all the tested bacteria before entering
the stationary or death phase. The deterioration of growth for S. aureus occurred at t =
12 hours, while for E. coli and B. subtilis it was delayed slightly, occurring at t = 14 and

57
t = 16 hours, respectively. The reduced number of CFU in the culture medium resulted
from the inability of the bacteria to survive in the nutrient-deprived medium which has
lost its culturability. After most of the nutrients had been used up, the bacteria were
forced to enter the stationary phase, which occurred between 12 – 16 hours after the
initiation of culture and the numbers of surviving cells decreased continuously.
Figure 3-1 The growth curves of a) S. aureus, b) E. coli and c) B. subtilis, grown in a 250
mL flask containing LB medium for 24 hours, with shaking at 200 rpm and 37oC.[OD ,
CFU ]

58
The growth of the population is limited by one or multiple factors, which could
be the exhaustion of the available nutrients, the accumulation of inhibitory
metabolites/end products, the possibility of the exhaustion of space, or combinations of
these factors. In the current study, both OD and the numbers of viable bacteria are
interrelated and show a good data correlation. It is best to note that during the period of
16–18 hours, data fluctuation was observed for E. coli and B. subtilis. The fluctuation,
which can be interpreted as a poor correlation between OD and CFU analysis, shows the
independent value between the number of live cells (with the ability to reproduce) and
the actual intact cells (both dead/live) available in the culture broth. At this stage, after
the maximum population had been reached during the exponential stage, the rate of death
escalated due to the previously mentioned reason, which was dictated by the low CFU
count [(c)], but the OD reading remained uninterrupted. The OD readings, however,
represent the number of intact cells, both active and dead cells. B. subtilis has a thick outer
membrane (peptidoglycan), which possibly makes the cell lysis rate very slow compared
to the other bacterial strains in the study. Therefore, the intact non-living cells in the
culture were still detected during the OD analysis. The OD reading remained high while
the CFU count decreased with time.
Referring the best time to harvest all three bacteria to obtain the cells in their
exponential phase would be between 8 to 10 hours, where cells were still in their mid-
exponential phase. Conversely, the best time to harvest the intact cells in their late
stationary/death phase must be beyond 30 hours. Therefore, all the bacterium for the
adhesion purposes was grown in LB media, cultured up to 10 hours for the exponential
phase and prolonged up to 72 hours to obtain cells in their late stationary phase.

59
3.3 Partial characterisation of the model organism
Viewing under SEM for the 10 hr cultures (exponential phase) shows that E. coli
and B. subtilis SP. possessed a common rod shape, meanwhile the S. aureus apparently is
a typical coccus shape (Figure 3-2). When viewed microscopically, S. aureus appears in
clusters, like bunches of grapes, and this was confirmed with the images from the gram
staining shown in Figure 3-2 (a). E. coli appears as a slightly ovalis cylinder, with a very
similar look to B. subtilis but from the Gram-negative group, from its pink staining as
shown in Figure 3-2 (c). S. aureus and B. subtilis are of positive types, dictated by their
purple hue when observed using the light microscope (Figure 3-2). The major differences
between Gram-negative and Gram-positive bacteria depend on the cell wall structure. The
Gram-negative bacteria are unable to retain the crystal violet dye after the ethanol
washing step due to their thinner peptidoglycan layer [114], where the counterstain
(safranin) was added afterwards to re-stain with a pink shade for easy visualisation.
Besides this, the thin outer membrane was easily disrupted during the decolourisation step
[115]. In contrast, the capability of the Gram-positive bacteria to retain the crystal violet
stains is due to their thick peptidoglycan and secondary polymer layer in conjunction with
an impermeable wall that resists decolourisation during the washing step [115, 116].

60
Figure 3-2: Images of the exponential phase-cells of a) S. aureus, b) E. coli and c) B.
subtilis from a 10 hour culture, observed under SEM at magnification between 2500x -
3000x.
Figure 3-3 Images from Gram staining analysis of a) S. aureus, b) E. coli and c) B. subtilis

61
3.3.1 Determination of Cell Size
Microscope images of the micro-organisms were taken from 10 and 66-hour shake
flask cultures to study the size and the morphology of cells in the exponential and
stationary phases, respectively. The measurement was done using 100 cells for each
micro-organism, and the mean averages were taken as a result. Table 3-1 shows the sizes
of both young and active cells in their active exponential stage, and the aged cells in their
late stationary phase. The results show the differences in the cell sizes of the bacteria in
the two phases. For B. subtilis and E. coli, the size of the cells in the stationary phase was
apparently bigger in comparison to the young and active cells in the exponential phase.
The sizes of E. coli and B. subtilis at the exponential phase were 1.23 ± 0.07 μm and 1.69
± 0.18 μm and increased by ~54 % and ~25% in the death phase giving the mean value
of 1.89 ± 0.10 μm and 2.11 ± 0.06 μm, respectively. The change of size was reported for
many other bacteria, which might be contributed by the changes in the osmotic pressure
in the surrounding environments due to the consumption of nutrients. Consequently, this
results in the passive transport of water molecules crossing the semi-permanent
membrane and causing the bacteria to swell. However, starving the soil bacteria in a low
nutritional medium does not reduce or increase the size, but the cells lose their
culturability [117]. In addition, the size of the bacteria was generally dictated by the type
of medium and the nutrient availability. Bacteria cultured in nutrient- rich complex media
appeared larger by 40% in comparison to bacteria cultured in defined low nutritional
media. The increased size in the E. coli species, as they shifted from the exponential to
the stationary stage was also observed [118].
Table 3-1 Size of bacteria at the exponential and stationary phase
Bacteria Gram types Shape Cell Size (μm) 1%
Difference Exponential Stationary
S. aureus Positive Coccus 0.75 ± 0.12 0.65 ± 0.14 -13.3
E. coli Negative Short rod 1.23 ± 0.07 1.89 ± 0.10 53.6
B. subtilis Positive Long rod 1.69 ± 0.18 2.11 ± 0.06 24.9
1 Size changes with reSPect to the exponential phase

62
An observation of the size of S. aureus in the stationary phase revealed a
contradictory result to the sizes of B. subtilis and E. coli. Based on the image from SEM
analysis (Figure 3-4), the average diameter of S. aureus in the stationary phase was 0.65
+ 0.14 μm and apparently, this was smaller compared to the cells in the exponential phase.
The mean size during the active phase was 0.75 ± 0.12 μm and reduced by 13.3% (Table
3-1) in the stationary phase to an average of 0.65 ± 0.14 μm. The bacteria responded
differently to changes in their environments. More often, Gram-negative bacteria were
recorded to reduce in size and became more spherical they have in a nutrient-deprived
environment for a prolonged period [119]. However, this was not the case in the current
study. The current study revealed that the increased/decreased sizes were more prominent
in the Gram-negative bacteria (E. coli) compared to the Gram-positive bacteria (B. subtilis
and S. aureus). This was presumably owing to the thickness of the cell wall allowing the
transport of osmotic components in and out of the cells, that an increment of cell length
of ~6% was observed for E. coli in the stationary phase (0.93 μm) as opposed to
exponential phase-cells (0.87 μm) [120].
Figure 3-4 Close up pictures of a) S. aureus, b) E. coli and c) B. subtilis under 4000x
magnification using SEM.

63
The mechanism of the cell's dimension difference was long thought to be the
growth rate mechanism, and medium/nutrition independent, where bacteria with high
grow rates were three times bigger than their slow-growing counterparts [121]. However,
recent research has found that the size of the bacteria is a rather complex, multifactorial
phenomenon. The nutritional availability that contributes to the high growth rate dictates
the cell size, which is also a function of cell expansion and cell cycle progression [122].
It was reported that the cell sizes were more affected by the nutritional value through the
medium rather than the growth rate. This is supported by the observation that the growth
rates of B. subtilis and E. coli were able to be maintained in the nutrient-deprived
environment, but this reduced the cell sizes by approximately 35% and 25%, respectively,
in comparison to culturing in a carbon-rich medium. During growth in a nutrient-rich
medium, cell division was delayed while cells continued to grow in size [122]. However,
the condition is not generally true for other microbes, where other researchers have
reported otherwise, and the actual mechanisms are far from clear.
3.3.2 Determination Cell Surface Hydrophobicity (CSH)
The wettability of a surface is now more generally expressed in a reverse sense
and is referred to as hydrophobicity. There are several methods available for the
determination of cell surface hydrophobicity, ranging from the highly accurate yet
laborious and pricey, to simplistic and straight-forward measurements. Contact angle
measurement (CAM) [123], atomic force microscopy (AFM) [124] and hydrophobic
interaction chromatography (HIC) [125] are more specific and accurate, whilst the
technique of bacterial adherence to hydrocarbons (BATH) provides speedy results with
simple preparation steps at fairly low cost [123, 125-127]. A few authors reported that a
good correlation was achieved between HIC and BATH [125, 128], while others achieved
a contradictory result between BATH and CAM. Although there are continuous debates
and questions arising concerning the accuracy of the BATH test, this method still achieves
wide acceptance, it is a good correlation for the electron donor properties achieved for
the BATH technique and when using CAM for the E. coli strain [129]. However, weak
and contrasting results were discovered for S. aureus and B. subtilis. Nonetheless, the
adhesion of cells onto a solid surface is affected by three important components: i) the

64
physicochemical properties of the micro-organisms, ii) the surface characteristics and iii)
the surroundings (e.g. medium, hydrodynamic properties, temperature, shear stress,
exposure time, size of inoculum). The physiochemistry of the micro-organisms is long
thought to be the important or the main driving force, which interacts differently for a
given surface and process conditions [130]. It is very useful to determine the properties
of the interacting bacteria in terms of electron donating/electron accepting properties as
this will also influence the adhesion process and provide a better understanding of the
directions of the mechanism in terms of the specific interaction with the surfaces. Apart
from this, strain types, particle shape, surface wettability and surface charge are some of
the important factors that initiate cell-surface adhesion [131-133].
The BATH results obtained for the three bacteria using four types of solvents
(hexane, hexadecane, chloroform and ethyl acetate) showed the diversity of their surface
properties. Figure 3-3 depicts that the bacteria exhibited a broad range of affinity towards
these solvents, ranging between 6%-47%. The adhesions to hexadecane were considered
as the measurement for the hydrophobicity since this omitted the effects of electrostatic
owing to its uncharged properties [134, 135]. It also shows that CSH varied differently as
the cells moved from the exponential to the stationary phase, with the percentage of
difference varying from 4% to 85%. B. subtilis and E. coli are relatively hydrophilic in
nature as they adhered weakly towards the polar solvent (hexadecane) with less than 30%
adhesion for both the active and stationary phase-cells. On the other hand, a strong
hydrophobic character was shown by S. aureus as their affinity towards hexadecane was
more than 45%. Meanwhile, B. subtilis was the most hydrophilic bacteria, with the lowest
affinity towards hexadecane (~11%). Upon shifting from the exponential stage to the
stationary growth phase, the hydrophobicity of the cells reduced for S. aureus and E. coli
with the percentage of reduction varying from 50-70%, as denoted by the weaker
adhesion towards hexadecane [Figure 3-4 (b)]. Contrarily, there was a slight increase in
the CSH level for the B. subtilis stationary phase-cells, measured to be 11% higher than
the cells in the exponential phase. The order of hydrophobicity for the active cells in
increasing levels is as follows: B. subtilis < E. coli < S. aureus, while for the stationary
phase-cells it is: E. coli < B. subtilis < S. aureus.
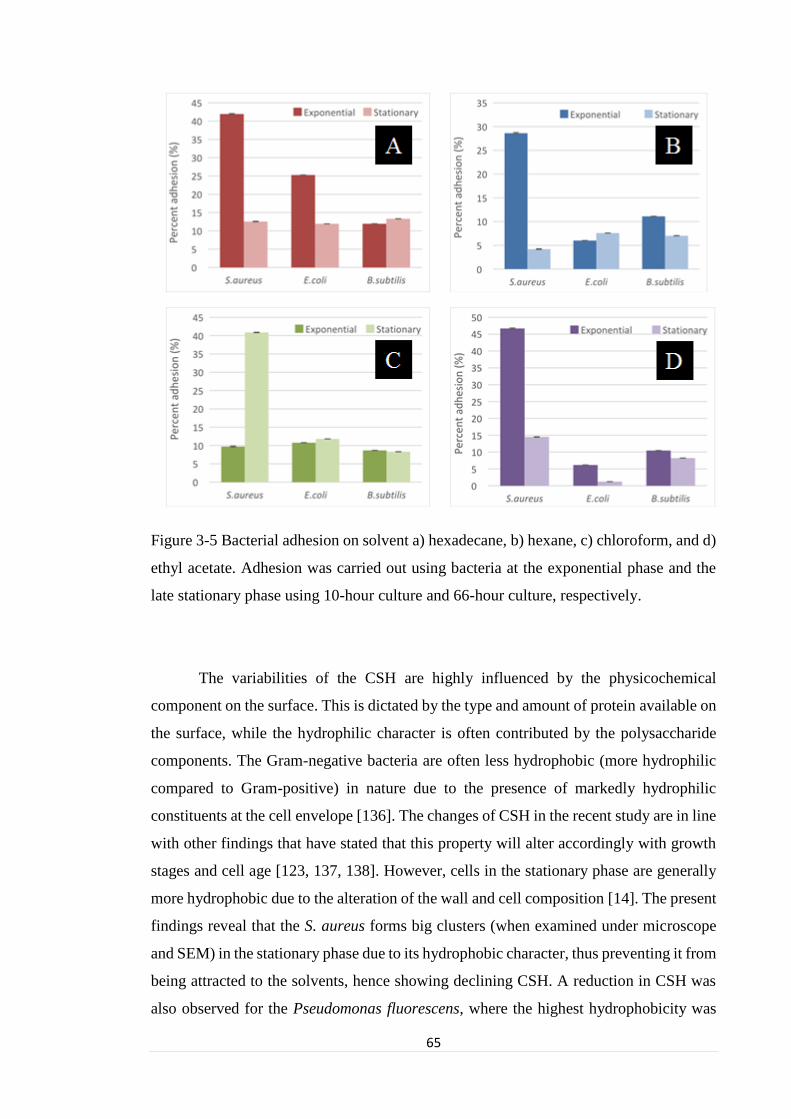
65
Figure 3-5 Bacterial adhesion on solvent a) hexadecane, b) hexane, c) chloroform, and d)
ethyl acetate. Adhesion was carried out using bacteria at the exponential phase and the
late stationary phase using 10-hour culture and 66-hour culture, respectively.
The variabilities of the CSH are highly influenced by the physicochemical
component on the surface. This is dictated by the type and amount of protein available on
the surface, while the hydrophilic character is often contributed by the polysaccharide
components. The Gram-negative bacteria are often less hydrophobic (more hydrophilic
compared to Gram-positive) in nature due to the presence of markedly hydrophilic
constituents at the cell envelope [136]. The changes of CSH in the recent study are in line
with other findings that have stated that this property will alter accordingly with growth
stages and cell age [123, 137, 138]. However, cells in the stationary phase are generally
more hydrophobic due to the alteration of the wall and cell composition [14]. The present
findings reveal that the S. aureus forms big clusters (when examined under microscope
and SEM) in the stationary phase due to its hydrophobic character, thus preventing it from
being attracted to the solvents, hence showing declining CSH. A reduction in CSH was
also observed for the Pseudomonas fluorescens, where the highest hydrophobicity was

66
observed during three hours after incubation and this declined gradually between 12 to
48 hours. The starvation of the cells during the stationary phase (nutrient deprived
medium) caused the consumption of a certain amino acid on the cell wall as the energy
source for the metabolism process, thus reducing the CSH [138, 139]. This could also
occur due to the degradation of wall proteins, which is due to nutritional stress [138].
Interestingly, B. subtilis exhibited a conflicting trend to the previously mentioned
bacteria where the adherence towards hexadecane was slightly increased in the cells in
the stationary phase. At matured stages, where often the nutrient availabilities in a
medium are very low, the cell envelope and exosporium of B. subtilis consist mainly of
proteins. Lipids and phospholipids will be thickened, thus contributing to the increased
hydrophobicity level of the Bacillus [140, 141]. At these stages, spore formation will take
place, and it is best to note that the composition of the protein on the surface often varies
between strains, and thus also the CSH level. Care should be taken as the CSH level is
easily provoked by single/multiple effects of environmental factors such as substrate
concentration, surfactants (sorbitol, tween 80, etc.), temperature, etc., thus imposing
different adhering ability onto the surfaces [87, 136, 142, 143].
From the study, eight out of 12 isolates of Staphylococcus SP. possessed moderate
to highly hydrophobic surfaces, dictated by their high affinity towards xylene (34.07–
81.25%) [125]. Despite the result, care should be taken since the BATH tests are prone
to erroneous output due to its different responses to ionic strength and the covalent
compounds of the buffer [125]. Some hydrophilic bacteria may possess hydrophobic
characteristics due to their hydrophobic hyphae, fibronectin, flagella, etc. B. subtilis
showed a diverse range of CSH levels, varying between 6-66% when tested using the
BATH technique [128].
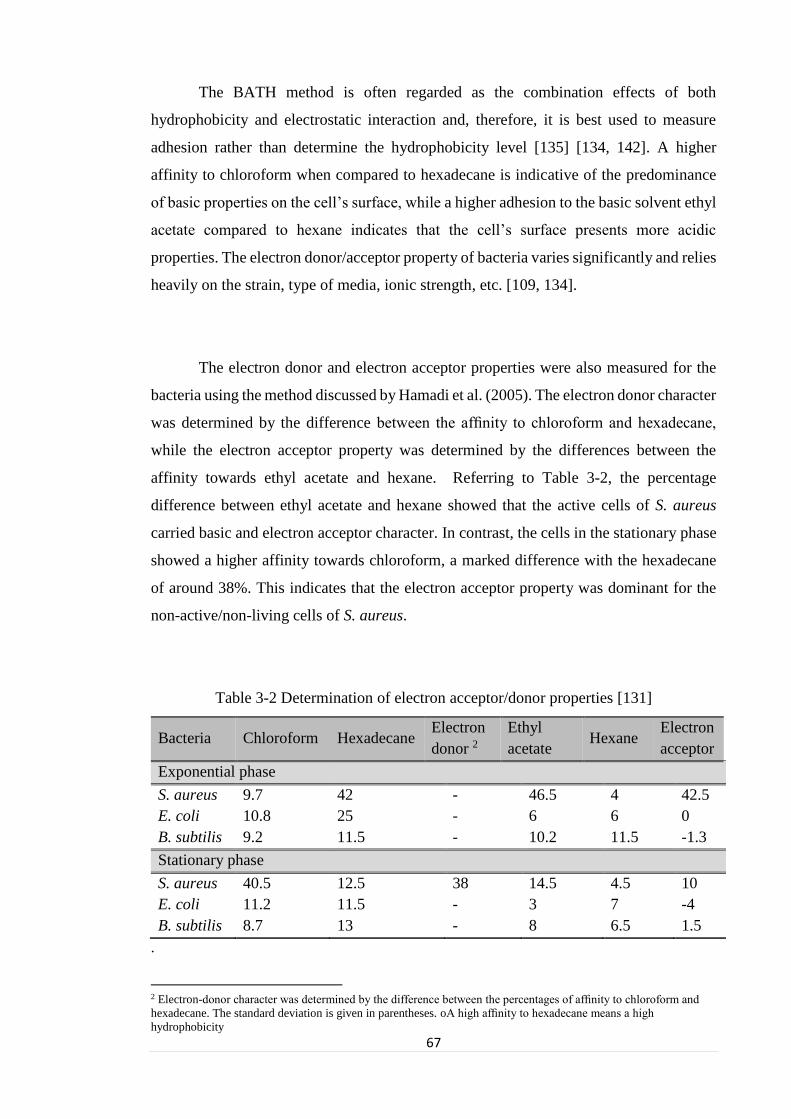
67
The BATH method is often regarded as the combination effects of both
hydrophobicity and electrostatic interaction and, therefore, it is best used to measure
adhesion rather than determine the hydrophobicity level [135] [134, 142]. A higher
affinity to chloroform when compared to hexadecane is indicative of the predominance
of basic properties on the cell’s surface, while a higher adhesion to the basic solvent ethyl
acetate compared to hexane indicates that the cell’s surface presents more acidic
properties. The electron donor/acceptor property of bacteria varies significantly and relies
heavily on the strain, type of media, ionic strength, etc. [109, 134].
The electron donor and electron acceptor properties were also measured for the
bacteria using the method discussed by Hamadi et al. (2005). The electron donor character
was determined by the difference between the affinity to chloroform and hexadecane,
while the electron acceptor property was determined by the differences between the
affinity towards ethyl acetate and hexane. Referring to Table 3-2, the percentage
difference between ethyl acetate and hexane showed that the active cells of S. aureus
carried basic and electron acceptor character. In contrast, the cells in the stationary phase
showed a higher affinity towards chloroform, a marked difference with the hexadecane
of around 38%. This indicates that the electron acceptor property was dominant for the
non-active/non-living cells of S. aureus.
Table 3-2 Determination of electron acceptor/donor properties [131]
Bacteria Chloroform Hexadecane Electron
donor 2
Ethyl
acetate Hexane
Electron
acceptor
Exponential phase
S. aureus 9.7 42 - 46.5 4 42.5
E. coli 10.8 25 - 6 6 0
B. subtilis 9.2 11.5 - 10.2 11.5 -1.3
Stationary phase
S. aureus 40.5 12.5 38 14.5 4.5 10
E. coli 11.2 11.5 - 3 7 -4
B. subtilis 8.7 13 - 8 6.5 1.5
.
2 Electron-donor character was determined by the difference between the percentages of affinity to chloroform and
hexadecane. The standard deviation is given in parentheses. oA high affinity to hexadecane means a high
hydrophobicity

68
3.3.3 Determination of Bacteria Zeta Potentials
The surface of the bacteria was tested using bacterial suspension at physiological
pH ~7 in a PBS buffer with molarity of 0.01M. The suspension was prepared using
cultures at the exponential stage (t =10 hrs) and at near the death phase, (t = 72 hrs) and
the OD reading was set at 1.0 reading 600 nm. The zeta potentials of the bacteria in the
exponential and stationary stages are presented in Table 3-3 below. The surface charge of
the S. aureus increased slightly to 17.1 mV when cells were in the stationary phase, an
increase of 31.5% although the value was not statistically significant. On the other hand,
the negativity charges of E. coli and B. subtilis were reduced to 23.6 mV and 34.4 mV,
which marked a reduction of less than 10% relative to the cell in the exponential phase.
Table 3-3 Surface charge of the bacteria in exponential and stationary phase
Bacteria Exponential (mV) Stationary (mV)
S. aureus ~13.0 + 0.8 ~17.1 + 0.6
E. coli ~24.6 + 1.0 ~23.6 + 1.1
B. subtilis ~35.2 + 2.0 ~34.4 + 1.0
3.4 Screening of the Process Condition for Bacterial Adhesion on Glass
The adhesion process on the glass substrata (hydrophilic surface) was carried out
for 24 hours, with initial cell concentration fixed at OD 1.0 (~108 cfu/mL) containing
active young cells in their exponential phase. The bacteria were suspended in a PBS buffer
(non-nutritious media) to prevent the cells from multiplying during the incubation time.
Samples were withdrawn at 2, 4, 8, 12 and 24 hours to check on the remaining OD of the
bacterial suspension and the number of adhered cells using a fluorescence microscope.
The adhesion is measured by the percentage of adhesion (%) and the number of adhered
cells per centimetre square area (no of cells/cm2). The percentage of adhesion was
measured as follows: 𝑷𝒆𝒓𝒄𝒆𝒏𝒕 𝒂𝒅𝒉𝒆𝒔𝒊𝒐𝒏 (%) = 𝑶𝑫𝒊−𝑶𝑫𝒕=𝒕
𝑶𝑫𝒊𝒙 𝟏𝟎𝟎% …Equation 3-1

69
The adhesion capacity was also determined by quantifying the number of adhered
bacteria on the glass substrata. Since the adhesion experiment was carried out in triplicate,
five (5) randomly selected images were taken for each sample, giving a total of 15 images
per surface. The adhered cells were presented as the number of adhered cells per cm2 area
taken as the average counted from 15 images. The kinetic adhesion of the adhered cells
per hour was also determined graphically during the exponential phase adhesion.
3.4.1 Preliminary adhesion of E. coli and B. subtilis on the glass substrata.
To evaluate the adhesion for all the bacteria species on the glass surfaces, the
adhesion procedure was developed and maintained throughout the study based on the
exposure of a fixed concentration of active live bacteria to a surface for a fixed time. All
experimental variables, except the bacterial strain cell types (active or live cells), were
held constant, including the cell concentration, exposure time, shaking speed, container
size and solution volume. Data for the percentage of adhesion based upon the reduction
of the OD reading is presented in Figure 3-6.
Figure 3-6 Percentage adhesion of S. aureus, E. coli and B. subtilis on the glass substrates.
Samples were immersed in bacterial suspension (OD= 1.0) for 24 hours.
R² = 0.5934
R² = 0.9211
R² = 0.9531
0
10
20
30
40
50
0 4 8 12 16 20 24
Per
cent
adhes
ion (
%)
Time (h)
S. aureusE. coliB. subtilis

70
Figure 3-6 presents data with respect to the percentage difference of OD reading
over the initial OD. It was assumed that the greater the percentage of the OD difference
(which will be referred onwards as percentage adhesion), the higher the bacterial adhesion
to that surface. All adhesion with the tested bacteria shows that the percentage adhesion
increased almost linearly with time during the first 12 hours of incubations. A speedy
increase of adhesion for S. aureus was observed in the first 8 hours of exposure and
reached a maximum at t = 12 hours (17%) and remained on a plateau afterwards until t =
24 hours. E. coli adhesion also sped up and increased linearly with time, up to 24 hours
(R2 = 0.95). The maximum adhesion was achieved at > 35% and showed no evidence of
slowing down. Meanwhile, the adhesion of B. subtilis shows an increasing trend, which
is linear up to 12 hours of exposure (R2 = 0.92), with signs of slowing down, and
maximum adhesion was achieved at 29%. Despite being in different gram groups, a close
competition was observed between E. coli and B. subtilis (hydrophilic species), and the
final adhesion percentage was the lowest for the most hydrophobic species, S. aureus.
The order of adhesion is as follows, S. aureus < E. coli < B. subtilis.
The adhesion of the bacteria on the glass surfaces was also viewed under a
microscope, and the result was analysed thoroughly for the adhered cells on the glass
surface. The data on the quantified adhered cells presented in Figure 3-7 shows a similar
profile regarding adhesion percentage but differs in terms of order. A speedy increase in
the number of adhered S. aureus cells was observed in the first 8 hours of exposure, and
this reached a maximum at t = 12 hours with no significant increase until the end of
fermentation. On the other hand, the adhesion of E. coli and B. subtilis sped up between
4-8 hours of incubation, with a gradual increase up to 24 hours. All three profiles
suggested that the adhesion saturations/equilibrium were achieved after 12 hours of
incubation, for all the bacteria tested. There were negligible changes in the numbers of
adherent cells counted at t = 12h and t = 24h, varying only between 2–6%. However, it
was observed that the decreasing rate of adhesion for B. subtilis occurred much earlier, at
t = 8h. The order of adhered cells was highest in S. aureus, followed by E. coli, and the
lowest adhesion was attained with B. subtilis, which provides a good agreement with the
level of hydrophobicity index for the bacteria species (Figure 3-7). The number of
adhered cells increased in parallel with the degree of hydrophobicity of the bacteria. S.
aureus (Gram-positive) is the most hydrophobic species and adhered most to the glass

71
accounting for ~1.5 x 10³ bacteria/ mm2, followed by E. coli (Gram-negative) at ~ 0.9 x
103 bacteria/ mm2 and B. subtilis (~0.7 x 10³ bacteria/ mm2). S. aureus was the greatest
coloniser of all the tested strains owing to the CSH level (~45%), which was the highest
among all the other strains. B. subtilis, which has the lowest CSH at 11% affinity towards
hexadecane, adhered the least to the glass surfaces. Doubling the value of the CSH level
of E. coli at 25%, increased the adhesion by 30% compared to B. subtilis. Many studies
have reported that hydrophobic bacteria are greater colonisers compared to their
hydrophilic counterparts.
Figure 3-7 Number of cells adhered on the glass substrata after immersion in the bacterial
suspension with initial OD of 1.0 (containing approximately ~108 CFU/mL of active cells
in the exponential phase). Bacteria were quantified at 4, 8, 12 and 24 hours.
Apart from the hydrophobicity correlation between CSH and the number of
adhered cells, the adhesions were believed to be correlated with the surface charge of the
bacteria. The zeta potential of the exponential phase-cell in the near physiological pH was
the highest for B. subtilis, which might explain why there was the least number of cells
adhered to the glass surface. A greater repulsion existed between the negatively charged
glass surfaces and the highly negative B. subtilis (z= ~35 + 2.0 mV). This is followed by
E. coli with a surface charge of z = ~24 + 1.0 mV and the lowest negativity of S. aureus
655
1357
1625 1656
482
695
911972
232
588657 694
0
500
1000
1500
2000
2500
4 8 12 24
No
of
adher
ed (
Bac
teri
a/m
m2)
Time (h)
S.aureus E.coli B.subtilis
72
(z = ~13 + 0.8 mV), subsequently resulting in the highest adherence to the glass surface
associated with the lowest repulsion. Statistical analysis shows that the final number of
adhered bacteria on the glass surfaces varies significantly between the three bacterial
species (confidence level = 95%) with respect to the zeta potential. Other than that, the
influence of the biological component on the bacterial surface might aid in
enhancing/reducing the adhesion. The adhesion of E. coli and S. aureus on the inert
surfaces was attributed to the presence of an extracellular polymeric substance (EPS) and
lipopolysaccharide (LPS), which aid in the adhesion process. Despite being the most
hydrophilic bacteria, due to the lack of LPS, B. subtilis is the least adhered on the glass
surface. Studies reported that hydrophilic bacteria will adhere more onto hydrophilic
surfaces [131]. However, the situation did not occur here, thus it was expected that despite
its highly hydrophilic surface, limited adhesion was observed in Bacillus, possibly due to
the non-existence of the molecular structure on its surfaces (e.g: LPS) to aid the adhesion
and due to repulsion effect.
The current findings agree with the earlier studies which stated that the availability
of LPS and its length dictated the degree of adhesion, thus in some cases it demolished
the effect of hydrophobicity/hydrophilic attraction [144]. Others have reported that the
truncation of the carbohydrate chain on the LPS structure reduced the adhesion capacity
of E. coli on the hydrophilic surfaces (glass and mica) but showed attraction towards
hydrophobic surfaces e.g. polystyrene and Teflon due to its increased CSH level [145].
Little variation was also expected from the electrostatic interaction between the bacteria
and the glass surface, since the experiment was conducted in the low ionic strength buffer
and nearly neutral pH. At this stage, the hydrophilic-hydrophilic interactions are disabled
and the effect of electrostatic (either repulsion or attraction) is augmented, which
subsequently dictated the adhesion phenomena.
Statistical analysis also shows that the adhesion capacity also varies with a
significant difference (p < 0.05) between the S. aureus and E. coli, representing the Gram-
positive and negative types, respectively. Meanwhile, the increment in the number of
adhered B. subtilis with respect to time was not statistically significant, and in fact showed
the lowest adhesion compared to the other species. The increasing bacteria count on the
73
glass showed that the attachment on the inert surface escalated with time, thus explaining
the reduction of the colony in the CFU plating as shown in Figure 3-6. Following the
same gram type (S. aureus and B. subtilis), it showed a significant difference of attraction
between these two species towards glass surfaces. In this case, the hydrophobicity of the
S. aureus empowers the law of attraction towards the glass therefore increasing the
adhesion capacity by ~ 60% compared to B. subtilis. Quite often, the adhesion and the
hydrophilic surface do not provide a good correlation between the number of adhesion
and the increased CSH of the bacteria. Studies have revealed that the interaction between
the adhered Zymomonas mobilis 113S on the glass surface was inversely related with the
increased CSH level of the cell [136] However, when the study was performed on
hydrophobic surfaces, the number of adhered cells increased proportionally with the CSH
level, providing a linear relationship. In addition, a report by Cunliffe, Smart [146] shows
that there was a considerable difference in the attachment of several bacteria to the
hydrophilic surface. Meanwhile, a report by van Hoogmoed, van der Kuijl-Booij [88]
show that the adhesion of S. aureus was higher on the hydrophilic substrate than on the
hydrophobic surface. These findings were in contradiction to Chan, Carson [147] who
observed that hydrophobic S. aureus adheres preferentially onto hydrophobic surfaces
rather than hydrophilic surfaces. The current findings suggest that the effects of
interaction towards the hydrophilic glass surface increased with increasing
hydrophobicity, which might also be contributed by the reduction of the repulsive
interaction through the reduction of the zeta potential value of these bacteria. The
magnitude of the percentage increase of the adhered cells was followed closely by the
percentage difference of the bacterial zeta potential with respect to B. subtilis.
S. aureus selected for this study was considered as having a strong electron-
acceptor property, shown by the strong affinity towards chloroform (> 45%). Because of
the attractive effect from the electron-acceptor/electron-donor interactions (although the
interactive nets for bacteria and the surface are both negative); the adhesion was high,
even though there should be an additional repulsive effect from the differences due to
hydrophobic CSH and the hydrophilic properties of the glass surfaces. Bellon-Fontaine,
Rault [148] has reported that proteins can adsorb onto a very hydrophilic surface, such as
clean glass, even though macroscopically the net interaction is repulsive. The reason for
this lies in the microscopic acid-base interactions between the strong electron-donor sites
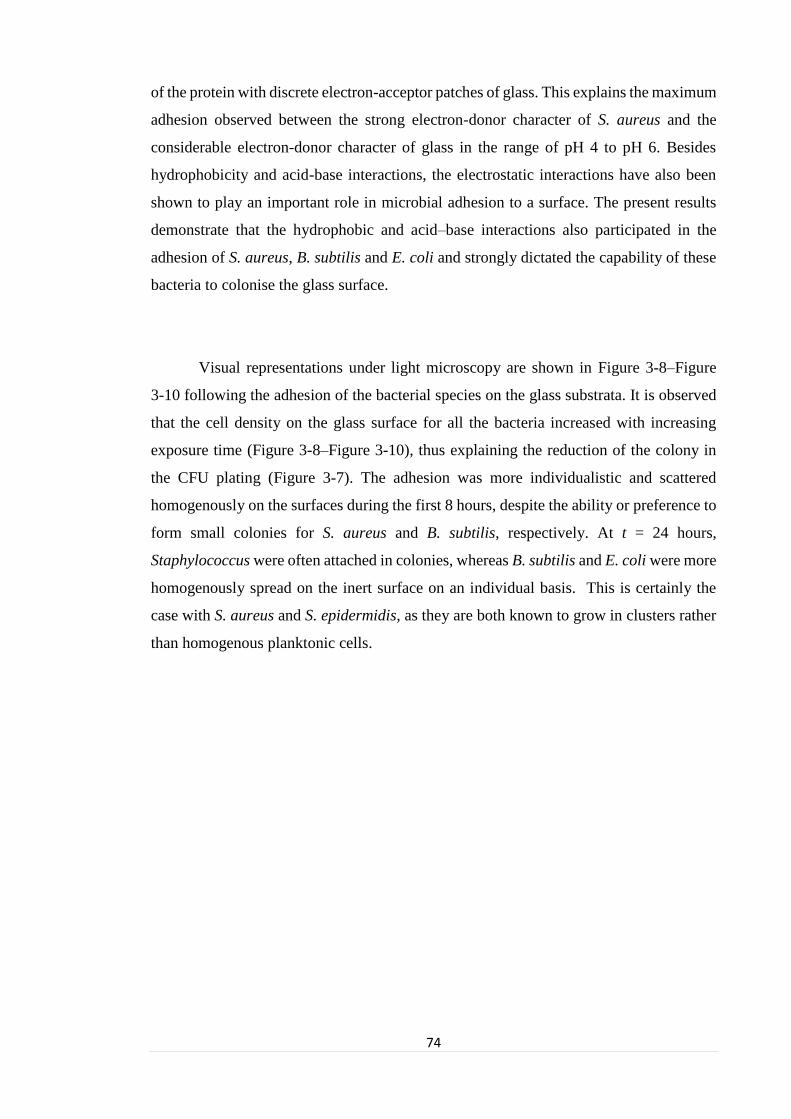
74
of the protein with discrete electron-acceptor patches of glass. This explains the maximum
adhesion observed between the strong electron-donor character of S. aureus and the
considerable electron-donor character of glass in the range of pH 4 to pH 6. Besides
hydrophobicity and acid-base interactions, the electrostatic interactions have also been
shown to play an important role in microbial adhesion to a surface. The present results
demonstrate that the hydrophobic and acid–base interactions also participated in the
adhesion of S. aureus, B. subtilis and E. coli and strongly dictated the capability of these
bacteria to colonise the glass surface.
Visual representations under light microscopy are shown in Figure 3-8–Figure
3-10 following the adhesion of the bacterial species on the glass substrata. It is observed
that the cell density on the glass surface for all the bacteria increased with increasing
exposure time (Figure 3-8–Figure 3-10), thus explaining the reduction of the colony in
the CFU plating (Figure 3-7). The adhesion was more individualistic and scattered
homogenously on the surfaces during the first 8 hours, despite the ability or preference to
form small colonies for S. aureus and B. subtilis, respectively. At t = 24 hours,
Staphylococcus were often attached in colonies, whereas B. subtilis and E. coli were more
homogenously spread on the inert surface on an individual basis. This is certainly the
case with S. aureus and S. epidermidis, as they are both known to grow in clusters rather
than homogenous planktonic cells.

75
Figure 3-8 The images show the adhered S. aureus on the glass slide viewed under light
microscopy at a) 4 hours, b) 8 hours, c) 12 hours and d) 24 hours.

76
Figure 3-9 The images show the adhered E. coli on the glass slide viewed under light
microscopy at a) 4 hours, b) 8 hours, c) 12 hours and d) 24 hours.
Figure 3-10 The images show the adhered B. subtilis on the glass slide viewed under
light microscopy at a) 4 hours, b) 8 hours, c) 12 hours and d) 24 hours.

77
Figure 3-11 Numbers of remaining bacteria in the PBS solution during 24 hours of
exposure on the glass substrate.
3.4.2 Effect of Cell Concentration on the Percentage of Adhesion
An experiment with respect to the varying of the initial cell concentration was
carried out to investigate the possibility of an increased coagulation probability of the
bacteria, which subsequently affects the adhesion. The experimental steps were carried
out over 24 hours, and the glass substrates were exposed to the bacterial suspension at
initial OD of 0.8, 1.0 and 1.2 with continuous shaking. Data were taken at the end of the
experiment (one-time sampling) and the number of the adhered cells were quantified from
three replicates. The results are presented in Figure 3-12.
0
20
40
60
80
100
120
0 4 8 12 24
Rem
ainin
g b
acte
ria
x 1
07
(C
FU
/mL
)
Time (h)
S.aureus E.coli B. subtilis

78
Figure 3-12 Number of cells adhered on the glass substrata after a 24 hour immersion in
the bacterial suspension with initial OD of 0.8, 1.0 and 1.2 containing active cells in the
exponential phase. Bacteria were viewed using a light microscope.
Figure 3-12 shows that the number of adhered cells for all three bacterial strains
increases with increased cell concentration. A steep increase (p > 0.05) was observed in
S. aureus, where the number of cells increased from ~2900/ mm2 at 0.8 to 3400/mm2 at
1.0, which was ~85% higher than the cells at 0.8. Increasing the cell concentration to 1.2
resulted in a 3-fold increase of the bacteria retained on the glass slide (7500/mm2) as
opposed to bacteria at 0.8. The increase of the Staphylococcus species can be associated
with their greater ability to form micro-colonies due to the high cell concentration. The
‘quorum sensing’, cell to cell communication, was enhanced where the distances between
cells were reduced at a high cell concentration, thus promoting the formation of
aggregates [149]. The micro-colonies, which presumably had a lower electronegativity
compared to the planktonic cells, might reduce the repulsion force with respect to the
glass surfaces, subsequently allowing more adhesion on the glass. The number of
adherent cells increased with an increase in the cell concentration in the medium, due to
its ability to form clusters, thus facilitating the adhesion on the glass surface [150]. Figure
3-12 shows the adhesion behaviour of S. aureus on the glass surface with respect to the
cell concentration, viewed with light microscopy.
0
1500
3000
4500
6000
7500
9000
0.8 1 1.2
No o
f ad
her
ed (
Bac
teri
a/m
m2)
OD@600nm
S. aureus E. coli B. subtilis

79
Figure 3-13 The adhered cells after 24 hours exposure to the glass surface at OD a) 0.8,
b) 1.0 and c) 1.2. Bigger flocs were formed at higher cell concentration.
The dependence of the degree of adhesion on the cell concentration is not
surprising, as an increase in the factor will lead to numerous collisions between the
bacteria on the glass surface, hence allowing more chances for attachment. However, the
degree of the E. coli adhesion with respect to increased bacterial concentration occurred
at a much lower percentage compared to S. aureus. The number of adhered cells for E.
coli at 0.8 and 1.0 cell concentrations was reduced by half when compared to S. aureus.
A further increase of cell concentration to 1.2 marked a greater difference in the number
of adhesions between these two species. Conversely, the adhesion of B. subtilis on the
glass surface shows negligible differences with respect to bacteria concentration and was
the least adhered at all tested levels. Unlike S. aureus, the adhesion of B. subtilis and E.
coli at higher cell concentrations does not provide any evidence of augmented cell
clustering. Figure 3-14 shows E. coli and B. subtilis with contact on the glass surface for
24 hours at an initial cell concentration of 1.2.

80
Figure 3-14 : E. coli (A) and B. subtilis (B) with contact on the glass surface for 24 hours
at initial cell concentration of 1.2.
3.4.3 Effect of Culture Age on the Percentage of Adhesion
Experiments were carried out to test the capability of the old/dead bacteria to
adhere to the glass surface. Since the bacteria in the death phase underwent a shift in their
physicochemical properties, the adhesion to the glass surface is also affected accordingly.
The adhesive capacity of the cells in the exponential and stationary phases was studied
within 24 hours of exposure to the glass surfaces using cells at t = 10 hours and t = 66
hours to represent the exponential active phase and the stationary cells (old), respectively.
Previously, the characterisation analysis in section 3.1 revealed that the properties of the
bacteria were affected as the bacterial cells moved from the active phase to the stationary
phase, i.e. the hydrophobicity level, the electron donor/acceptor properties and the sizes.
Although the percentage difference varies independently with the types of bacteria,
current studies have revealed that the adhesion capacities between the species were
affected (although not statistically significant) in accordance with the differences in the
physicochemical properties, as analysed in the earlier findings.

81
Figure 3-15 Percentage adhesion of, E. coli and B. subtilis on the glass substrates after 24
hour exposure to the bacteria solution containing active ( ) and stationary-phase ( ) cells.
Figure 3-15 shows that the adhesion capacity of S. aureus in stationary phase
increased by 41% compared to the cells in the exponential phase. However, both E. coli
and B. subtilis showed a decrease in adhesion by 14% and 29%, respectively. A greater
reduction was observed in the B. subtilis, which was in parallel with the increasing
hydrophobicity level of the CSH (section 3.3.2) in the stationary-phase cells. It is best
noted that the adhesion for the stationary-phase cells also showed the same trend with the
previous observation, for the percentage of adhesion (Figure 3-13) and the number of
adhered cells (Figure 3-15). Figure 3-15 depicts that the order of adhered stationary phase
cells was the highest with E. coli accounting for 1374 cells per mm2 area. This is followed
by S. aureus, with 1118 cells/ mm2 and the least adhered was B. subtilis amounting to
only 587/mm2. The ability of the bacteria to adhere to the inert surface was not related to
the growth rate or the adhesion incubation time [151]. The different levels of bacterial
adhesion occurring with changes in the growth rate and phases were probably associated
with surface changes and not directly dependent on the physiological activity, particularly
since the adhesion did not decrease with the death phase cells. It was observed that the
adhesions of E. coli and S. aureus at both the exponential and stationary state were still
higher than the adhesion by B. subtilis.
17.3
35.97
29.7
24.7
30.8
21
0
5
10
15
20
25
30
35
40
45
S. aureus E. coli B. subtilis
Per
cent
adhes
ion
(%
)
Active
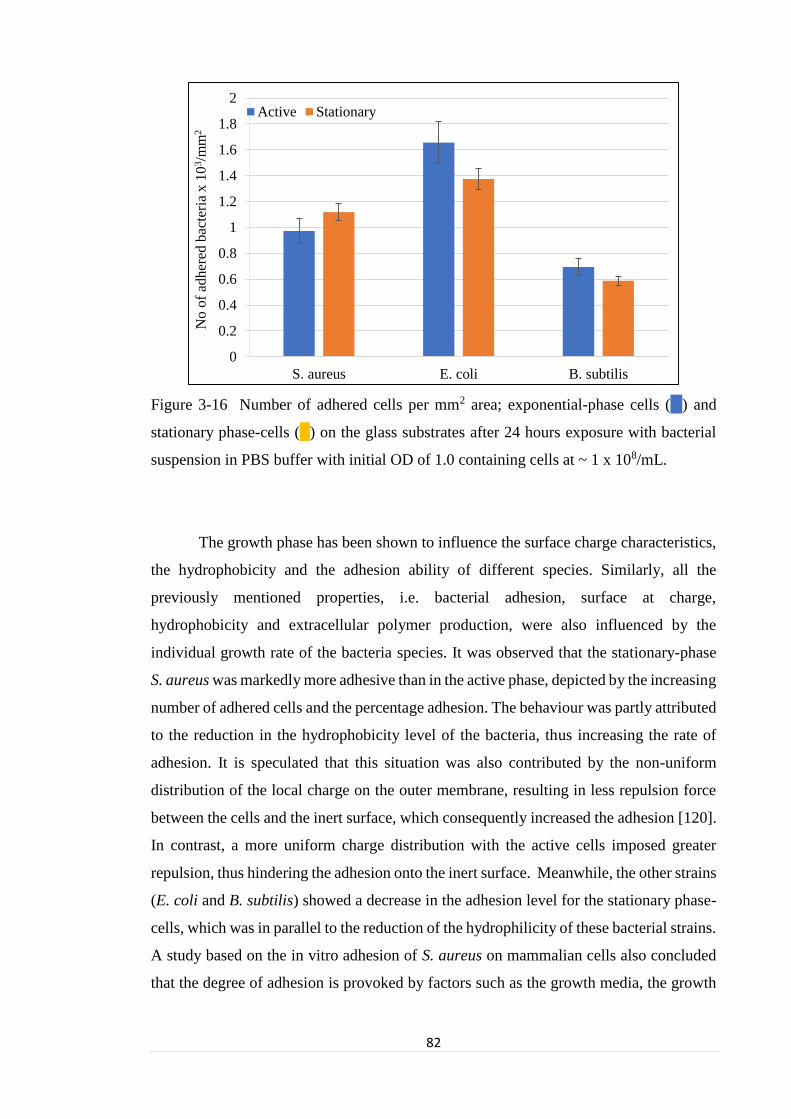
82
Figure 3-16 Number of adhered cells per mm2 area; exponential-phase cells ( ) and
stationary phase-cells ( ) on the glass substrates after 24 hours exposure with bacterial
suspension in PBS buffer with initial OD of 1.0 containing cells at ~ 1 x 10⁸/mL.
The growth phase has been shown to influence the surface charge characteristics,
the hydrophobicity and the adhesion ability of different species. Similarly, all the
previously mentioned properties, i.e. bacterial adhesion, surface at charge,
hydrophobicity and extracellular polymer production, were also influenced by the
individual growth rate of the bacteria species. It was observed that the stationary-phase
S. aureus was markedly more adhesive than in the active phase, depicted by the increasing
number of adhered cells and the percentage adhesion. The behaviour was partly attributed
to the reduction in the hydrophobicity level of the bacteria, thus increasing the rate of
adhesion. It is speculated that this situation was also contributed by the non-uniform
distribution of the local charge on the outer membrane, resulting in less repulsion force
between the cells and the inert surface, which consequently increased the adhesion [120].
In contrast, a more uniform charge distribution with the active cells imposed greater
repulsion, thus hindering the adhesion onto the inert surface. Meanwhile, the other strains
(E. coli and B. subtilis) showed a decrease in the adhesion level for the stationary phase-
cells, which was in parallel to the reduction of the hydrophilicity of these bacterial strains.
A study based on the in vitro adhesion of S. aureus on mammalian cells also concluded
that the degree of adhesion is provoked by factors such as the growth media, the growth
0
0.2
0.4
0.6
0.8
1
1.2
1.4
1.6
1.8
2
S. aureus E. coli B. subtilis
No
of
adh
ered
bac
teri
a x
10
3/m
m2
Active Stationary
83
phase and the types of host, and the localisation is highly influenced by the in-vitro micro-
environment [152].
Changes in cell morphology were first observed during the characterisation part
of the active and stationary phase cells. Viewing the SEM images, together with a
qualitative observation of the adhered cells, also provided a good agreement, which
indicates the increased size for the stationary phase cells adhered to the glass surfaces
(Figure 3-17). These findings are true for the E. coli and B. subtilis strains, with an average
increase as the cell volume varied between ~30% and ~18%, respectively. The cells in
the stationary phase appeared larger, and with greater volume, compared to the adherent
cells in the exponential phase. Notably, the reduction in size was observed for the S.
aureus in the exponential phase, even though the changes were less than 10%.
Morphological changes in the adhered cells on the glass slides were also observed under
light microscopy. The current findings suggest that the changes in size might well have
resulted in an increased/reduced number of adhered cells. Increases in adhered S. aureus
might be contributed by the increasing strength of adhesion, related to the size reduction.
The smaller size increases the contact area between the bacteria and the glass, thus
strengthening the adhesion and, consequently, preventing detachment due to the external
force exerted by the dynamic environment. Collectively, more cells were retained in the
glass over the 24-hour incubation, thus marking an increase in the adhered cells, in
comparison with incubation with active cells. Meanwhile, augmented volumes of
stationary phase cells of E. coli and B. subtilis could have prevented cell adhesion, due to
an increasing individual cell weight, thus weakening the cell-substrate interaction and
promoting cell detachment from the surface.

84
Figure 3-17 Light microscopy images showing adhered exponential phase cells of a) S.
aureus, b) E. coli and c) B. subtilis, on glass substrates at 24 hours exposure to bacterial
solution (approximately 1 x 10⁸ CFU mL) while (b), (d) and (e) are the adhered stationary
phase cells, respectively.

85
Figure 3-18: Adhered cells (B. subtilis) on the glass substrate for cells in the exponential
phase (a & b), cells in the stationary phase (c & d).
Various authors have reported varying degrees of adhesion with respect to
changes in the bacteria’s physical factors. In the current study, it is speculated that the
increased adhesion for the stationary phase S. aureus correlated with 1) a reduction of
sizes, ii) strengthening of the hydrophilic-hydrophilic interaction due to reduced CSH
[131], iii) improved electron donor properties [131] iv) increased zeta potentials [153].
Further analysis revealed that the zeta potential of the S. aureus increased from ζexp = -
13.1 mV3 to ζ stat = -17.2 mV3 for cells in the exponential and stationary states,
respectively. The increase, which was over 30%, could have contributed to the increased
number of adhered cells. A study revealed that E. coli strains with the highest negativity
were the greatest colonisers on PMMA surfaces compared to strains with lower zeta
potentials, and presented the highest initial adhesion rate as well as the highest
equilibrium value [153]. This attempts to relate the percent of adhesion with the zeta
potential, however, it failed to produce a significant correlation between these properties
[154].
86
When the surface hydrophobicity of a bacterial cell is increased, the charge at the
cell surface will be reduced, subsequently diminishing the repulsive forces which
normally exist between two negatively charged bodies. This phenomenon will either
increase the chances of adhesion or simply strengthen the interaction between the bacteria
and the inert surfaces. The increased adhesion observed in the stationary phase E. coli
was presumably due to the fimbriae adhesions, which are composed of hydrophobic
amino acids, and which increase the surface hydrophobicity and reduce the cell-surface
charge. Bacterial cell adhesions can be ranked based on their hydrophobicity with
recognised pathogenic Escherichia coli showing a greater surface hydrophobicity than
other non-pathogens.
Increases in cell sizes due to the adhesion phenomenon were also observed due to
cell adaptation owing to the augmented roughness of the modified glass surfaces [132].
The bacteria P. issacchenkonii appeared bigger on an altered glass surface (high
roughness) compared to cells on a smooth glass surface. Analysis with AFM and CSLM
revealed that excessive granular EPS production was provoked due to changes in the
surface topography, thus increasing the size of the cells by relatively 20-40% in length,
width and height. The cell alteration was their sustenance strategy on the rough surfaces.
The excess EPS coating could be the means for an extra protection to the outer membrane,
preventing it from being ruptured due to the ‘brushing’ effect of the rougher surfaces.
Increased adhesion in the stationary phase growth was also observed in B. cereus on
stainless steel due to an increased CSH level in the stationary phase cells. Stainless steel
possesses a hydrophobic character and attraction towards a similar surface property as the
main driving force is highlighted. The present study is also consistent with the general
hypothesis; both reduction/increases of adhesion for the stationary phase cells were in
parallel to the differences in the CSH level and the attraction law towards hydrophilic
surfaces (glass, θ = 52o) [154].

87
3.5 Chapter Summary
This chapter provided a preliminary understanding of the extent of adhesion in
three (3) bacteria with different properties towards inert surfaces (glass). At this stage,
the bacterial properties for all the strains were crucially examined to search for the
determining single or multiple factors associated with bacterial properties that governed
the adhesion, e.g. the CSH level, Gram type, sizes, and surface charge (zeta potential) of
the bacteria. These factors were monitored when the adhesion experiments were tested
using bacteria at different growth stages. The findings revealed that the bacteria with
hydrophobic surfaces (S. aureus) are very adhesive in nature, compared to the bacteria
with hydrophilic surfaces (E. coli and B. subtilis) regardless of the Gram type. The
adhesion capacity of bacteria onto the glass surface was in parallel with the increasing
CSH level, and thus against the theory of the preference of adhesion for hydrophilic-
hydrophilic interaction. Apart from this, the adhesion to the glass surfaces (negatively
charged) was also contributed by the bacterial surface charge, where lower repulsion was
observed in bacteria with a lower zeta potential, thus enhancing the adhesion. The changes
in sizes might contribute towards adhesion, where bacteria with a huge volume (bigger in
size) were expected to have a lower adhesion strength on the surface, therefore reducing
their ability to remain attached at the surface in dynamic environments (hydrodynamic
forces).

88
Polished Surface Characterisation with respect to Contact
Angle Measurement and Bacterial adhesion
4.1 Introduction
The discussion in this chapter is focused on metallic surface
characterisation (316L and Ti6Al4V) with respect to contact angle measurement
and the number of cell attachment on the modified surface. To investigate the
systematic correlation between these three areas (surface characterisation,
wettability and cell adhesion), the use of 3D Optical Profilometry (Bruker, UK),
Drop Shape Analyzer (Kruss, Germany) and standard cell-attachment
experiments with the right process are essential. The main objectives of producing
a metallic polished specimen with sub-micron roughness (0.10 m to 0.20 m)
were to assess the behaviour of the cells towards micro-size roughness and the
hydrophobicity of the surfaces. On surface characterisation, three groups of
measurement were used in the data analysis. These were height, spatial and hybrid
parameters. Normally, height parameters are used to construct the relationship
between hydrophobicity surfaces. However, trusting those values only is not
enough; therefore, an extension to analyse spatial and hybrid parameters is
essential. Consequently, there are ten parameters that will be used for the whole
thesis from the three groups of measurements. For wettability phenomena, a
distilled water sessile drop was used to measure the contact angle of water. And
lastly, for cell-adhesion, S. aureus, E. coli and B. subtilis were used as the test
objects for bacterial adhesion experiment due to their Gram-type and shape as
discussed in Chapter 4.
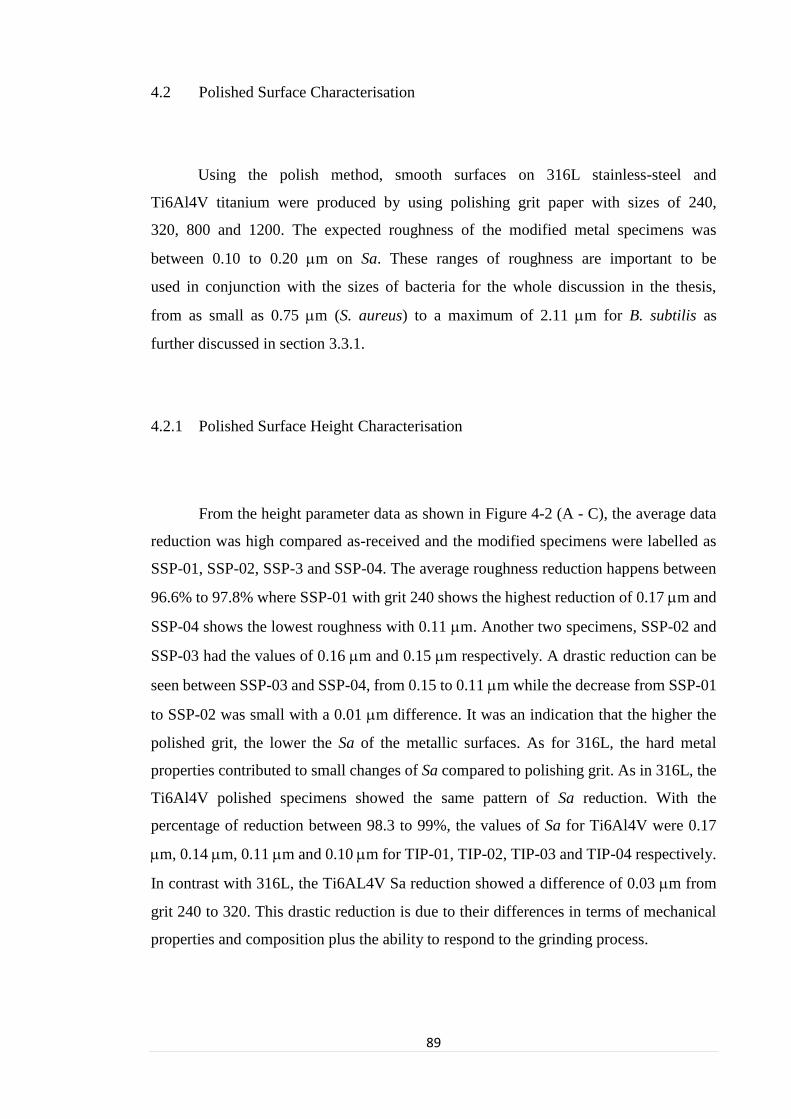
89
4.2 Polished Surface Characterisation
Using the polish method, smooth surfaces on 316L stainless-steel and
Ti6Al4V titanium were produced by using polishing grit paper with sizes of 240,
320, 800 and 1200. The expected roughness of the modified metal specimens was
between 0.10 to 0.20 m on Sa. These ranges of roughness are important to be
used in conjunction with the sizes of bacteria for the whole discussion in the thesis,
from as small as 0.75 m (S. aureus) to a maximum of 2.11 m for B. subtilis as
further discussed in section 3.3.1.
4.2.1 Polished Surface Height Characterisation
From the height parameter data as shown in Figure 4-2 (A - C), the average data
reduction was high compared as-received and the modified specimens were labelled as
SSP-01, SSP-02, SSP-3 and SSP-04. The average roughness reduction happens between
96.6% to 97.8% where SSP-01 with grit 240 shows the highest reduction of 0.17 m and
SSP-04 shows the lowest roughness with 0.11 m. Another two specimens, SSP-02 and
SSP-03 had the values of 0.16 m and 0.15 m respectively. A drastic reduction can be
seen between SSP-03 and SSP-04, from 0.15 to 0.11 m while the decrease from SSP-01
to SSP-02 was small with a 0.01 m difference. It was an indication that the higher the
polished grit, the lower the Sa of the metallic surfaces. As for 316L, the hard metal
properties contributed to small changes of Sa compared to polishing grit. As in 316L, the
Ti6Al4V polished specimens showed the same pattern of Sa reduction. With the
percentage of reduction between 98.3 to 99%, the values of Sa for Ti6Al4V were 0.17
m, 0.14 m, 0.11 m and 0.10 m for TIP-01, TIP-02, TIP-03 and TIP-04 respectively.
In contrast with 316L, the Ti6AL4V Sa reduction showed a difference of 0.03 m from
grit 240 to 320. This drastic reduction is due to their differences in terms of mechanical
properties and composition plus the ability to respond to the grinding process.
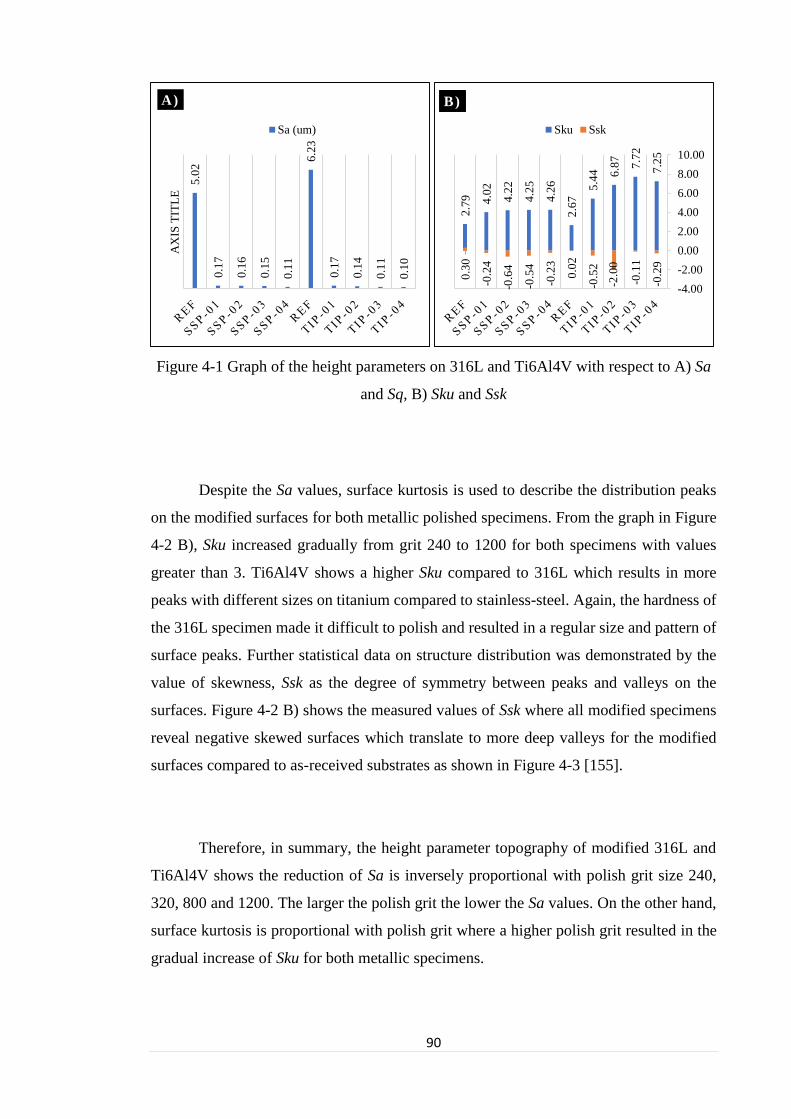
90
Figure 4-1 Graph of the height parameters on 316L and Ti6Al4V with respect to A) Sa
and Sq, B) Sku and Ssk
Despite the Sa values, surface kurtosis is used to describe the distribution peaks
on the modified surfaces for both metallic polished specimens. From the graph in Figure
4-2 B), Sku increased gradually from grit 240 to 1200 for both specimens with values
greater than 3. Ti6Al4V shows a higher Sku compared to 316L which results in more
peaks with different sizes on titanium compared to stainless-steel. Again, the hardness of
the 316L specimen made it difficult to polish and resulted in a regular size and pattern of
surface peaks. Further statistical data on structure distribution was demonstrated by the
value of skewness, Ssk as the degree of symmetry between peaks and valleys on the
surfaces. Figure 4-2 B) shows the measured values of Ssk where all modified specimens
reveal negative skewed surfaces which translate to more deep valleys for the modified
surfaces compared to as-received substrates as shown in Figure 4-3 [155].
Therefore, in summary, the height parameter topography of modified 316L and
Ti6Al4V shows the reduction of Sa is inversely proportional with polish grit size 240,
320, 800 and 1200. The larger the polish grit the lower the Sa values. On the other hand,
surface kurtosis is proportional with polish grit where a higher polish grit resulted in the
gradual increase of Sku for both metallic specimens.
5.0
2
0.1
7
0.1
6
0.1
5
0.1
1
6.2
3
0.1
7
0.1
4
0.1
1
0.1
0
AX
IS T
ITL
E
A)
Sa (um)
2.7
9 4.0
2
4.2
2
4.2
5
4.2
6
2.6
7
5.4
4 6.8
7
7.7
2
7.2
5
0.3
0
-0.2
4
-0.6
4
-0.5
4
-0.2
3
0.0
2
-0.5
2
-2.0
0
-0.1
1
-0.2
9
-4.00
-2.00
0.00
2.00
4.00
6.00
8.00
10.00
B)
Sku Ssk

91
The main aim of the study was to establish the correlation between surface
topography with contact angle and cell-adhesions. The interaction of water droplets on
the surface and the attraction of cells start with the structure of the inert surfaces.
Therefore, it is essential to identify the profile of the surface especially the length of peaks
(Sp), valleys (Sv) and the overall height length of the surfaces (Sz). These important values
determine the measured value of contact angle as well the degree of cell-attachment
especially when dealing with the number of deep valleys. This is because the high number
or deep length of the valleys makes it possible to entrap the cells inside the holes resulting
in the formation of a biofilm/colony. In contrast, more peaks influence the hydrophobicity
of the surfaces and influence the attachment of the cells by reducing the contact points.
Therefore, the information concerning Sp, Sv and Sz were essential to be used in the
discussion of contact angle (CA) and cell-adhesion correlation with surface topography.
Figure 4-2 Graph of the height parameters on 316L and Ti6Al4V with respect to height
surfaces parameter, SP (max peak height), Sv (max valley depth) and Sz (max height of
surface)
Figure 4-2 demonstrates height surface values where for the peaks on the surfaces,
Sp values were 2.52 m, 1.83 m, 1.74 m and 1.31 m for SSP-01, SSP-02, SSP-03 and
SSP-04 respectively and 1.79 m, 0.88 m, 0.76 m and 0.59 m for TIP-01, TIP-02,
TIP-03 and TIP-04 respectively. Overall, Ti6Al4V has lower SP compared with 316L.
The variations between high and low peaks was 1.21 m for 316L and 1.17 m for
Ti6Al4V. As for the distribution of valleys in both metals, Sv values were -1.84 m, -1.89
14
.60
2.5
2
1.8
3
1.7
4
1.3
1
22
.57
1.7
9
0.8
8
0.7
6
0.5
9
-19
.35 -1
.84
-1.8
9
-1.8
9
-2.0
8
-27
.54 -1
.27
-0.6
8
-0.7
4
-0.7
8
33
.95
4.4
0
3.7
2
3.6
4
3.3
9
49
.11
3.0
7
1.5
6
1.5
1
1.3
7
R E F S S P - 0 1 S S P - 0 2 S S P - 0 3 S S P - 0 4 R E F TI P - 0 1 TI P - 0 2 TI P - 0 3 TI P - 0 4
Sp (um) Sv (um) Sz (um

92
m, -1.89 m and -2.08 m for 316L and -1.27 , -0.68 , -0.74 m and -0.78 m for
Ti6Al4V. The variations were not too much different in Sp as reflected in the discussion
of the skewness parameter in the previous paragraph (-ve skewed plane). Finally, for the
overall length between Sp and Sv, the maximum height of surfaces, Sz for both metals
shows the values of 4.40 mmm and m for 316L and
m,mm and 1.37m for Ti6Al4V respectively. By comparing
between these metals, Ti6Al4V shows a high variation of Sz (1.01 m) compared to 316L
with the highest Sz of 4.40 m and the lowest of 3.39 m. while for Ti6Al4V, the
variation of Sz was 1.7 m.
Therefore, in summary of height of surfaces values, both metals show relatively
low values of SP, Sv and Sz with respect to as-received substrates. However, with the
negative skewed surfaces, it is expected to demonstrate that both metals produced kurtosis
and skewness values which are in the region of negative skew with deep valley kurtosis.
For the same Sa, (0.17 um) between both metals, titanium produced more smooth surfaces
compared to stainless-steel as shown by the Bruker images in Figure 4-3.
Figure 4-3 Bruker images of polished stainless-steel and titanium

93
Figure 4-4 Correlations between graph A) Sa and polished grit and B) kurtosis (Sku)and
skewness (Ssk). R2 > 0.7 indicated strong correlation, R2 = 0.5 – 0.69 represented
moderate correlation and R2 = 0.49 – 0.3 poorly correlated and R2 < 0.29 provided no
correlation.
To establish the correlation between polished grit and average roughness, Sa, the
measured values of Sa and polished grit were plotted as shown in Figure 4-4. It is clear
from the graph that both metals showed a negative strong correlation between polished
grit and water contact angles, with R2 equal to 0.9203 and 0.8661 for stainless-steel and
titanium respectively. The strong correlation is derived from the material and mechanical
properties of both metals. 316L stainless steel is known as a hard metal that tends to
harden if machined too quickly. Grinding with 18 LBS/N – 30 LBS/N at 20–60 rpm,
resulted in gradually reduced Sa values. For Ti6Al4V titanium in general, the metal is a
little soft compared to 316L, and removing parts is higher and make the grinding process
more difficult. On the other hand, titanium is a soft metal where is easier to remove the
metal when it changes from grit 240 to grit 320 with 0.03 um as discussed in the above
paragraph. With grinding technique, both metals produced deep valley surfaces where the
kurtosis values were greater than 3.00 (Sku > 3) and skewness values were negative as
shown in Figure 4-4 (B). The grinding process removed the peaks of the as-received
substrates and flattened the surfaces, and the deep valleys that remained caused the
surface to be more hydrophilic.
R² = 0.9203
R² = 0.8661
0.080
0.100
0.120
0.140
0.160
0.180
0 500 1000 1500
µm
Grita)
316L Ti6Al4V
0.000
1.000
2.000
3.000
4.000
5.000
6.000
7.000
8.000
9.000
-2.500 -2.000 -1.500 -1.000 -0.500 0.000
Ku
rto
sis,
Sku
Skewness, Sskb)
316L Ti6Al4V
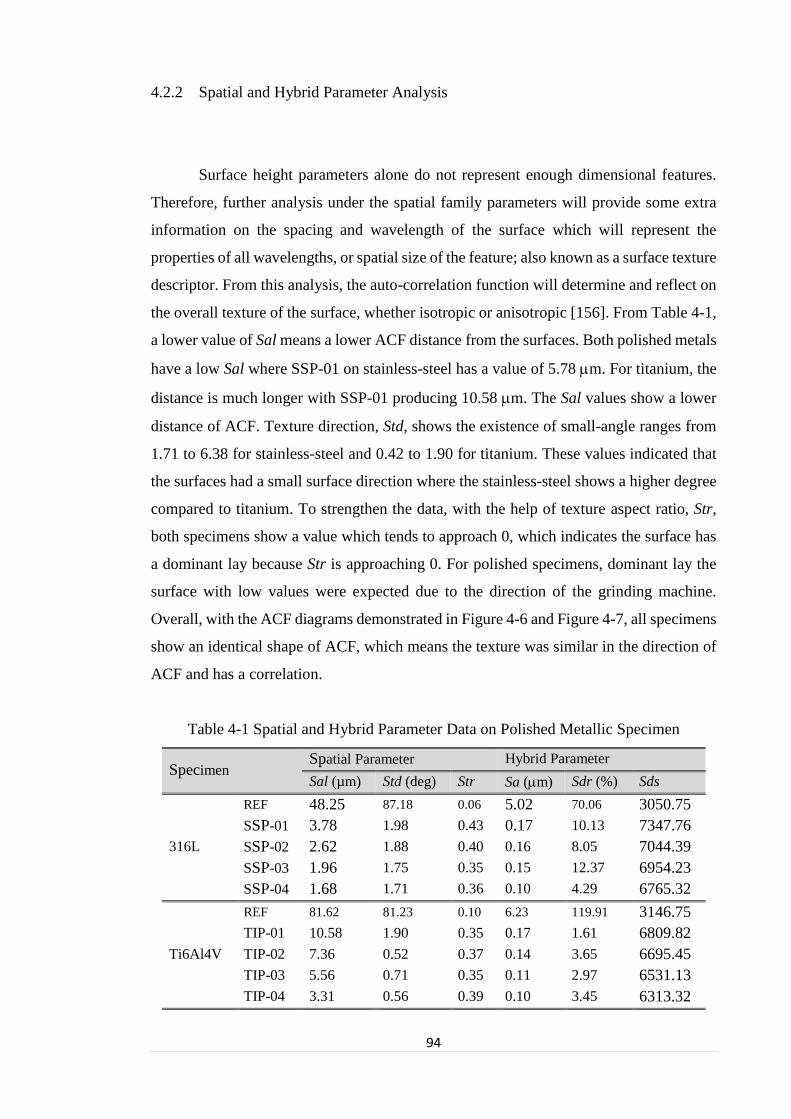
94
4.2.2 Spatial and Hybrid Parameter Analysis
Surface height parameters alone do not represent enough dimensional features.
Therefore, further analysis under the spatial family parameters will provide some extra
information on the spacing and wavelength of the surface which will represent the
properties of all wavelengths, or spatial size of the feature; also known as a surface texture
descriptor. From this analysis, the auto-correlation function will determine and reflect on
the overall texture of the surface, whether isotropic or anisotropic [156]. From Table 4-1,
a lower value of Sal means a lower ACF distance from the surfaces. Both polished metals
have a low Sal where SSP-01 on stainless-steel has a value of 5.78 m. For titanium, the
distance is much longer with SSP-01 producing 10.58 m. The Sal values show a lower
distance of ACF. Texture direction, Std, shows the existence of small-angle ranges from
1.71 to 6.38 for stainless-steel and 0.42 to 1.90 for titanium. These values indicated that
the surfaces had a small surface direction where the stainless-steel shows a higher degree
compared to titanium. To strengthen the data, with the help of texture aspect ratio, Str,
both specimens show a value which tends to approach 0, which indicates the surface has
a dominant lay because Str is approaching 0. For polished specimens, dominant lay the
surface with low values were expected due to the direction of the grinding machine.
Overall, with the ACF diagrams demonstrated in Figure 4-6 and Figure 4-7, all specimens
show an identical shape of ACF, which means the texture was similar in the direction of
ACF and has a correlation.
Table 4-1 Spatial and Hybrid Parameter Data on Polished Metallic Specimen
Specimen Spatial Parameter Hybrid Parameter
Sal (µm) Std (deg) Str Sa (m) Sdr (%) Sds
316L
REF 48.25 87.18 0.06 5.02 70.06 3050.75
SSP-01 3.78 1.98 0.43 0.17 10.13 7347.76
SSP-02 2.62 1.88 0.40 0.16 8.05 7044.39
SSP-03 1.96 1.75 0.35 0.15 12.37 6954.23
SSP-04 1.68 1.71 0.36 0.10 4.29 6765.32
Ti6Al4V
REF 81.62 81.23 0.10 6.23 119.91 3146.75
TIP-01 10.58 1.90 0.35 0.17 1.61 6809.82
TIP-02 7.36 0.52 0.37 0.14 3.65 6695.45
TIP-03 5.56 0.71 0.35 0.11 2.97 6531.13
TIP-04 3.31 0.56 0.39 0.10 3.45 6313.32
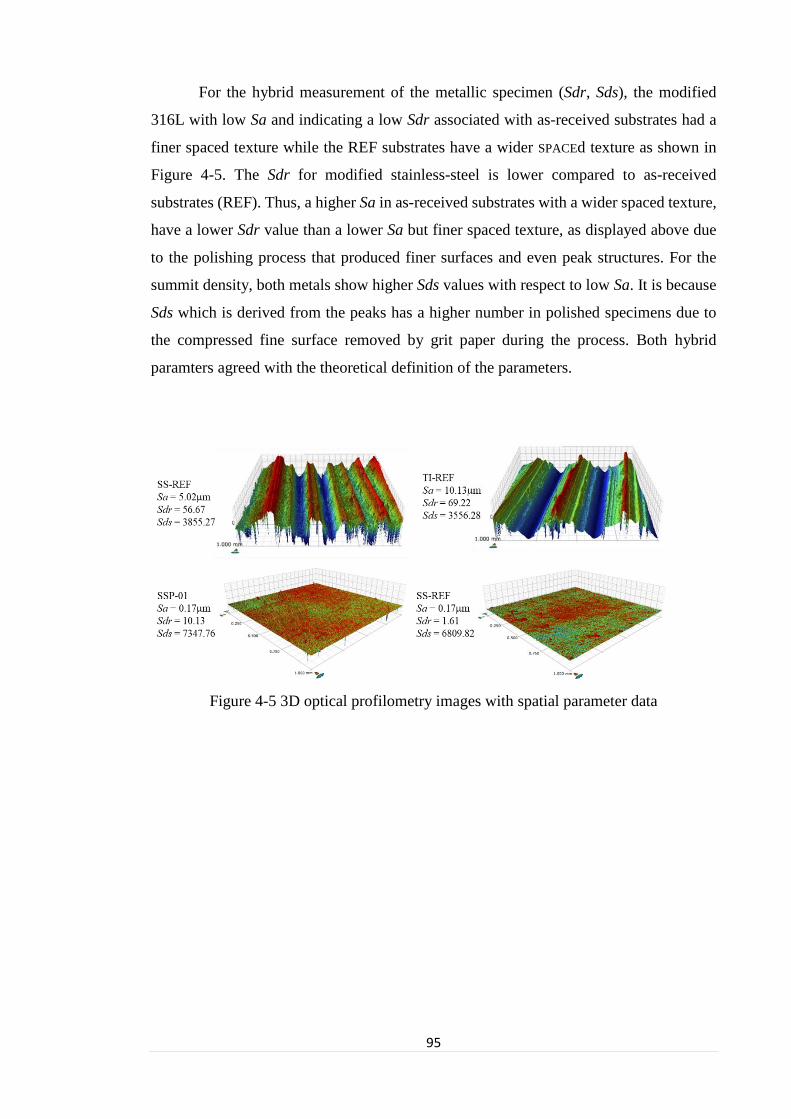
95
For the hybrid measurement of the metallic specimen (Sdr, Sds), the modified
316L with low Sa and indicating a low Sdr associated with as-received substrates had a
finer spaced texture while the REF substrates have a wider SPACEd texture as shown in
Figure 4-5. The Sdr for modified stainless-steel is lower compared to as-received
substrates (REF). Thus, a higher Sa in as-received substrates with a wider spaced texture,
have a lower Sdr value than a lower Sa but finer spaced texture, as displayed above due
to the polishing process that produced finer surfaces and even peak structures. For the
summit density, both metals show higher Sds values with respect to low Sa. It is because
Sds which is derived from the peaks has a higher number in polished specimens due to
the compressed fine surface removed by grit paper during the process. Both hybrid
paramters agreed with the theoretical definition of the parameters.
Figure 4-5 3D optical profilometry images with spatial parameter data

96
Figure 4-6 Auto-correlation on polished stainless-steel specimen
Figure 4-7 Auto-correlation on polished titanium specimen

97
4.3 The Correlation between Contact Angles and Surface Roughness
Figure 4-8 Graph of contact angle measurement on metallic polished specimen
From the overall data on metallic polished specimens, the surface profile shows
the Sa with sub-micro roughness, negative skew, short distance of Sal, and higher value
of Sds compared to as-received substrates (REF). In summary, metallic polished
specimens (316L and Ti6Al4V) exhibit flat surfaces with negative skew and high summit
density. Figure 4-8 shows the CA measurement with the values of 62.57°, 61.63°, 54.80°,
and 43.50° for 316L and 62.37°,61.83°, 61.77°and 61.43° for titanium where all
specimens demonstrate low contact. All CA measured for polished specimens were
hydrophilic, as any surface with CA < 70° are considered hydrophilic [39]. The difference
between higher and lower CA measurements for 316L was 19.07° while for Ti6Al4V it
was 0.94°. 316L shows the wider range of CA measurement, which means the structure
was not affected much by polished grit from 240 to 1200 while for Ti6Al4V, titanium
remains with a narrow variation as discussed in section 4.2.1. The Sa variation for 316L
was 0.03um and 0.01um for Ti6AL4V. Wider roughness variations contribute
significantly to the measurement of CA regardless of the type of material. For the kurtosis
relationship with CA, the higher the kurtosis, the higher the CA measurement and a low
Sku produces a low CA measurement. This is in contrast with surface skewness, where
there is no significant relationship between Ssk values with the CA measurement for both
metallic specimens. To quantify the relation for all parameters,
70
.49
62
.57
61
.63
54
.80
43
.50
65
.77
62
.37
61
.83
61
.77
61
.43
R S S P - 0 1 S S P - 0 2 S S P - 0 3 S S P - 0 4 R TI P - 0 1 TI P - 0 2 TI P - 0 3 TI P - 0 4
R E F 3 1 6 L R E F TI 6 AL4 V
CA
(°)
POLISHED SPECIMEN
CA (H2O)
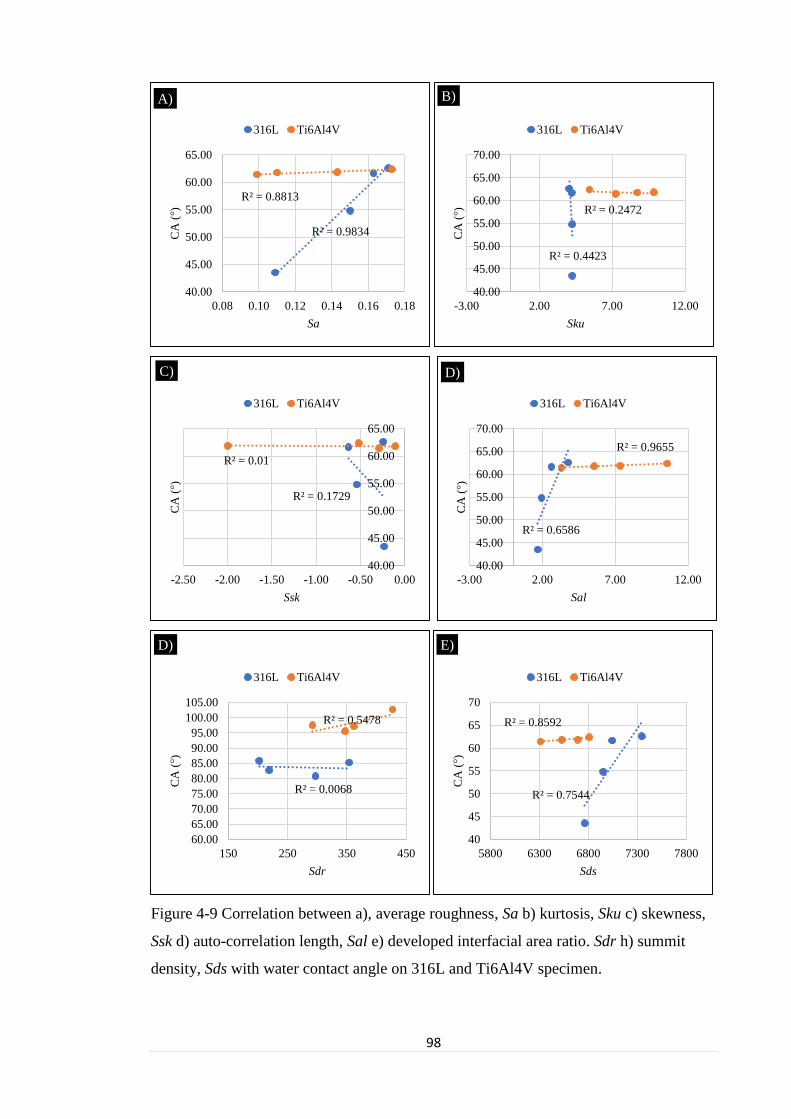
98
Figure 4-9 Correlation between a), average roughness, Sa b) kurtosis, Sku c) skewness,
Ssk d) auto-correlation length, Sal e) developed interfacial area ratio. Sdr h) summit
density, Sds with water contact angle on 316L and Ti6Al4V specimen.
R² = 0.9834
R² = 0.8813
40.00
45.00
50.00
55.00
60.00
65.00
0.08 0.10 0.12 0.14 0.16 0.18
CA
(°)
Sa
A)
316L Ti6Al4V
R² = 0.4423
R² = 0.2472
40.00
45.00
50.00
55.00
60.00
65.00
70.00
-3.00 2.00 7.00 12.00
CA
(°)
Sku
B)
316L Ti6Al4V
R² = 0.1729
R² = 0.01
40.00
45.00
50.00
55.00
60.00
65.00
-2.50 -2.00 -1.50 -1.00 -0.50 0.00
CA
(°)
Ssk
C)
316L Ti6Al4V
R² = 0.6586
R² = 0.9655
40.00
45.00
50.00
55.00
60.00
65.00
70.00
-3.00 2.00 7.00 12.00
CA
(°)
Sal
D)
316L Ti6Al4V
R² = 0.0068
R² = 0.5478
60.00
65.00
70.00
75.00
80.00
85.00
90.00
95.00
100.00
105.00
150 250 350 450
CA
(°)
Sdr
D)
316L Ti6Al4V
R² = 0.7544
R² = 0.8592
40
45
50
55
60
65
70
5800 6300 6800 7300 7800
CA
(°)
Sds
E)
316L Ti6Al4V

99
The effects of surface properties on CA with respect to metallic polished
fabrication were presented in Figure 4-9 [A) – E)]. The CA were plotted against
Sa, Sku, Ssk, Sal, Sdr and Sds and a linear regression was plotted with R2 values
to indicate the accuracy of the correlation. R2 values between 0.7–1.0 represented
a strong correlation, R2 = 0.50–0.69 for moderate, R2 = 0.3–0.49 for poor and R2
< 0.29 means no correlation was observed in the responses. Variations in
responses with correlation between 0.01 to 0.9834 was observed towards contact
angle values. A correlation of contact angle with Sa, Sku and Ssk [Figure 4-9 A),
B) and C)] were carried out to identify any strong influence by surface profiles
within the test ranges over 43.50o–62.57°. 316L polished specimen provided the
strongest correlation with R2 of 0.9834, indicating the high influence of polished
grit towards hydrophobicity. Sku shows a moderate correlation for 316L with R2
of 0.4423 and no correlation for titanium with R2 of 0.2472. The higher the Sku
for titanium, the lower the correlation with CA measurements. Ssk showed the
least influence on CA measurement where both metallic polished specimens show
no correlation with R2 below 0.01.
On the spatial and hybrid parameters, Sal, Sdr and Sds, the variations in responses
occur with the regression (R2) values between 0.0068 (no correlation) up to 0.9655 (strong
correlation). The Ti6Al4V specimen showed a strong correlation with CA measurement
on Sal and Sds with R2 equal to 0.9655 and 0.8592 respectively and a moderate correlation
on Sdr with R2 equal to 0.5478. In contrast, the 316L specimen showed a strong
correlation on Sds with R2 equal to 0.7544, a moderate correlation on Sal with R2 equal
to 0.6586 and no correlation on the Sdr parameter. Therefore, surface texture indicates
substantial influences towards surface wettability especially with the Sds parameters
which showed strong correlations for both metallic polished specimens.

100
4.4 Bacteria-Surface Adhesion
Four different surfaces were produced for each metal that underwent the polishing
technique using grit paper ranging from 240–1200, where the post-modification
properties varied from those of received substrates. In the adhesion study, samples were
cleaned and sterilised before being exposed to the bacterial suspension containing
approximately 1 x 10⁸ CFU/ mL of cells in the mid exponential phase for four (4) hours
using three types of bacteria as in Chapter 4. The bacteria can be divided into Gram-
positive bacteria (S. aureus and B. subtilis) and Gram-negative (E. coli) with varying
properties i.e. coccus shape for S. aureus and rod-shaped for B. subtilis and E. coli. In this
section, discussions about the bacteria adhesion measurement were carried out using
fluorescent microscopy procedure as mentioned in Chapter 3. The effects of an altered
surface topography including Sa, Sds, Sku, Ssk and wettability were discussed
individually while observing the correlations between changing these parameters and
their effects on the adhesion intensity. Table 4-3 shows the data from the surface
topography parameter, water contact angle and the number of bacteria adhered to the
specimens. It shows the range of measurement for both polished stainless steel and
titanium specimens with height, spatial and hybrid surface parameters, contact angle of
water against the number of bacteria counted on per-mm2 areas. The effectiveness of the
process was compared against the adhesion on the control specimens. The control
specimens used was similar metal that have undergone fine polishing until a mirror finish
surface was achieved, denoted by SSC for stainless steel and TIC for the titanium.
Table 4-2 Size of bacteria at the exponential stage
Properties S. aureus E. coli B. subtilis
Gram Type + - +
Shape Coccus Rod Rod
Size (mm)
0.6-0.7 1.2-1.8 (L)
0.45 – 05 (D)
2 -2.5 (L)
0.5-0.75 (D)
CSH (%) ~42 ~25 ~12
Characteristic Hydrophobic Moderately hydrophilic Hydrophilic

101
4.5 Bacterial Adhesion on Control sample
Control experiments were performed to be the standard for comparing the
effectiveness of modified surfaces in repelling adhesion. The number of adhered bacteria
retained by the SSC and TIC is presented by Figure 4-10. Comparable to adhesion on the
glass surface, S. aureus (Gram-positive and hydrophobic bacteria) performed as the
greatest coloniser depicted by the highest number of cells adhered on SSC and TIC, with
~158 x 103/mm2 and 82.6 x 10³/mm2, respectively. This was followed by B. subtilis,
which is also Gram-positive but has a hydrophilic membrane, with 50.8 x 10³/mm2 and
45.8 103/mm2 on SSC and TIC, respectively. In this study, the TIC showed a greater
antibacterial effect, depicted by a lower bacterial retention for all three species. A greater
repulsion was obtained for the S. aureus, as shown by the nearly ~50% reduction, while
only less than 10% reduction was observed for E. coli and B. subtilis. Unlike the adhesion
on glass, E. coli when exposed to metallic surfaces showed the lowest adhesion
comparative to S. aureus and B. subtilis. This was not expected since the CSH level of E.
coli was higher than B. subtilis, hence it was predicted to be the second greatest coloniser
after S. aureus. Only 14.5 x 10³/mm2 and 13.5 x 10³/mm2 of E. coli was retained on the
SSP and TIP after 4 hours exposure, respectively.
Figure 4-10 Number of bacterial adhered on stainless steel and titanium undergone
surface polishing technique (mirror finishing) after four hours t at 37oC and CFU ~ 1 x
108 CFU/mL.
158
82.6
14.5 13.5
50.8 45.8
0
20
40
60
80
100
120
140
160
180
SSC TIC
Num
ber
of
adher
ent
cell
(10
3/
mm
2)
S. aureus E. coli B. subtilis

102
Table 4-3 Data on Surface Topography Parameter, Contact Angle and Bacterial Adhesion
Specimen Surface Topography Parameter
Contact Angle
Measurement Bacterial Adhesion/mm2
Sa (m) Sku Ssk Str Sds CAM S. aureus E. coli B. subtilis
SSP-01 0.17 4.02 -0.24 0.50 7347.76 62.57 ± 0.46 53800 ± 1000 31300 ± 2000 38600 ± 300
SSP-02 0.16 4.22 -0.64 0.20 7044.39 61.63 ± 0.50 65900 ± 2000 42500 ± 3700 61100 ± 4000
SSP-03 0.15 4.25 -0.54 0.35 6923.45 54.80 ± 0.54 30500 ± 1000 17600 ± 1100 15100 ± 1000
SSP-04 0.11 4.26 -0.23 0.38 6865.32 43.50 ± 0.11 62400 ± 1200 29200 ± 1000 26300 ± 1000
TIP-01 0.17 5.44 -0.52 0.35 7354.02 62.37 ± 0.31 69600 ± 1000 74400 ± 1000 50100 ± 1000
TIP-02 0.14 6.87 -2.00 0.40 7161.68 61.83 ± 0.65 37800 ± 2000 18700 ± 2000 38200 ± 1000
TIP-03 0.11 7.72 -0.11 0.36 7016.53 61.77 ± 0.32 55200 ± 2000 40600 ± 2000 48500 ± 2000
TIP-04 0.10 7.25 -0.29 0.40 6790.66 61.43 ± 0.85 54400 ± 2000 23800 ± 2000 29200 ± 1000

103
4.6 Bacterial Adhesion on Polished Stainless-Steel
All stainless-steel surfaces that have undergone polishing and exhibited
hydrophilic character were exposed to S. aureus, E. coli and B. subtilis for four hours and
the number of attached cells were recorded in Figure 4-11. It shows S. aureus (Gram-
positive, hydrophobic) as being a greater coloniser compared to its counterparts E. coli
(Gram-negative, hydrophilic) except for SSP-04. It was clearly observed that S. aureus
were attracted to the polished stainless-steel, indicating a ~30% difference compared to
E. coli and B. subtilis. After four hours of exposure, SSP-01, SSP-02 and SSP-04 allowed
an adhesion of S. aureus between 53.8 x 10³/mm2 to 65.9 x 10³/mm2, while the highest
repellence was attained by SSP-03 with only 30.5 x 10³/mm2 cells attached onto the
surface. All SSP surfaces managed to reduce S. aureus adhesion by > 50% as opposed to
SSC.
Figure 4-11 Graph of bacterial adhesion on the polished-stainless steel
53.8
65.9
30.5
62.4
31.3
42.5
17.6
29.2
38.6
61.1
15.1
26.3
0
10
20
30
40
50
60
70
SSP-01 SSP-02 SSP-03 SSP-04
Num
ber
of
adher
ent
cell
(1
03
/ m
m2
)
S. aureus E. coli B. subtilis
104
When comparing the adhesion of the three tested bacteria, E. coli exhibited the
lowest surface coverage, depicted by a cell count of between 17.6 x 10³/mm2 – 42.5 x
103/mm2. The lowest repellence against E. coli was attained by surface SSP-03 (17.6 x
103/mm2), the highest adhesion was attained by SSP-02 with adhesion of 42.5 x 10³/mm2.
Although the colonisation rate was the lowest, the SSP surfaces increased the attachment
of E. coli 1.2–3 times compared to SSC. Ortega et al (2010) reported that E. coli was a
slow coloniser, taking between 3-4 hours to establish a bacteria-surface interaction. The
present study similarly showed that E. coli was a slower coloniser compared to S. aureus,
taking 12 hours to reach a plateau of surface density, while other bacteria took 8 hours.
This suggested that E. coli might require a longer time to establish the adhesion before
irreversible attachment was secured. The ability of S. aureus and B. subtilis to stabilise
themselves on the surface within seconds to minutes upon contact, explained the higher
numbers of cells retained on the surface. Meanwhile E. coli adhesion remained the lowest,
with only a slight competition with B. subtilis observed on SSP-03 and SSP-04.
B. subtilis (Gram-positive) which is the most hydrophilic strain in this study, was
the second highest coloniser as depicted by the total numbers of adherent bacteria on SSP
and TIP (Table 4-4). It is widely known that Gram-positive bacteria are better colonisers
than Gram-negative SP, later discriminated based on the hydrophobic/hydrophilic CSH.
The study once again proved the ability of colonising SSE surfaces, in decreasing order
are as follows, S. aureus (Gram-positive and hydrophobic) > B. subtilis (Gram-positive
and hydrophilic) > E. coli (Gram-negative and hydrophilic). Comparing with the adhesion
on SSC, all SSP samples managed to scrap adhered B. subtilis by 60-72% relative to those
on control. Overall, the current observation shows that SSP-03 prevented the anchoring
of cells, with the lowest adhesion for all bacteria species occurring at 30.5 x10³, 17.6 x10³
and 15.1 x10³ for S. aureus, E. coli and B. subtilis.

105
4.7 Bacterial Adhesion on Polished Titanium
Similar to those of SSP, TIP surfaces that have undergone similar polishing were
exposed to S. aureus, E. coli and B. subtilis for four hours and the number of adhered
cells are presented in Figure 4-12. The adherence of S. aureus on TIC (82.6 x 10³/mm2)
samples was reduced on all titanium surfaces, with the highest repellence ability shown
by TIP-02 contributing with a figure of only 37.8 x 10³/mm2. In contrast to S. aureus, the
adhesion of E. coli was promoted (relative to TIC), where the maximum adhering bacteria
increased 6-fold (TIP-01). TIP-01 displayed the highest E. coli density, while the lowest
adhesion was observed on TIP-04 (18.7 x 10³/mm2), a ~40% increase relative to TIC. The
increase in the number of E. coli on individual titanium surfaces surpassed those on the
SS polished with the same grit number, suggesting the effect of affinity towards certain
materials. Meanwhile, the lowest adhesion for B. subtilis occurred on TIP-04, presenting
approximately 29.2 x 10³/mm2. Overall, the current observation shows that TIP-04
prevented the anchoring of rod-shaped cells, while TIP-02 was effective for the removal
of coccus shape bacteria.
Figure 4-12 Graph of bacterial adhesion on polished titanium
69.6
37.8
55.2 54.4
74.4
18.7
40.6
23.8
50.1
38.2
48.5
29.2
0
10
20
30
40
50
60
70
80
TIP-01 TIP-02 TIP-03 TIP-04
Num
ber
of
adher
ent
cell
(1
03
/ m
m2
)
S. aureus E. coli B. subtilis

106
4.8 Correlation Between Surface Parameter, Contact Angle and Bacterial Adhesion
Collectively, the total number of cells attached onto all polished stainless steel
were 212.6 x 10³, 150.6 x 10³ and 141.1 x 10³/mm2 for S. aureus, E. coli and B. subtilis
respectively. Meanwhile the changes in total number of S. aureus adhesion was negligible
on TIP, while E. coli and B. subtilis showed a reduction and increase in adhesion,
respectively. Data from Table 4-4 shows that in every treatment, the bacterial density on
the surfaces was as follows: S. aureus > B. subtilis > E. coli. The current finding is similar
to those reported by Rodrigues-Contreras et al (2018), where B. subtilis adhered more
than E. coli on SS surfaces. Collectively, the total number of adhesions for S. aureus on
polished stainless steel was similar to polished titanium, showing a negligible difference.
On the other hand, the adhesion of B. coli and B. subtilis was greatly reduced and
enhanced on titanium, respectively, in comparison to polished stainless steel surfaces
(Table 4-4).
Table 4-4 Total number of bacteria adhered on stainless steel and titanium
Fabrication/Metal S. aureus
(103/mm2)
E. coli
(103/mm2)
B. subtilis
(103/mm2)
Control
(Mirror Finish)
Stainless steel 158.1 + 7.5 14.5 + 2.1 50.8 + 3.2
Titanium 82.6 + 4.6 13.5 + 1.9 45.8 + 3.9
Polished Stainless steel 212.6 + 7.8 150.6 + 8.9 141.1 + 11.5
Titanium 217.1 + 6.5 127.5 + 12.6 165.70 + 4.8
Figure 4-13 shows the relationship between bacterial adhesion with surface
parameters, CA, Sa, and Sds on SSP and TIP. It is important to note that all the polished
SSP and TIP exhibited CA < 70o, ranging from 43.5o – 62.57o showing that the surfaces
were moderate hydrophilic to poor hydrophilic. When hydrophobic bacteria interact with
hydrophilic surfaces or vice versa, the adhesion behaviour becomes very difficult to
predict. The hydrophobicity of the bacteria is expected to play an important role in the
adhesion. Being similar Gram-positive bacteria, the magnitude of adhesion of S. aureus
(CSH = 42%) exceeded the adhesion of B. subtilis (CSH = 12%). The adhesion of S.
aureus was independent from increasing CA within the hydrophilic range, while E. coli

107
adhesion on SSP and TIP was negatively and positively correlated, given by R2 = 0.31
and R2 = 0.28, respectively, showing increased adhesion with increased hydrophobicity.
Interestingly, increasing CA in SSP and TIP promoted the adhesion of B. subtilis. A linear
correlation with R2 = 0.34 and R2 = 0.74 for SS and TI was developed depicting that
correlation for Sa stretches from poor to strongly correlated, respectively.
Previous studies in the literature suggested the threshold value of Sa that
discriminated between the ability to reduce or decrease bacterial adhesion was 0.2 m
(Chapter 2). The Sa of the polished metal for SSP (Sa = 0.010–0.17 m) and TIP (Sa =
0.11–0.17 m) were assessed to study the effects of Sa below the threshold value (Figure
4-13 C–D) with adhesion. In the case of SSP, adhesion of S. aureus and E. coli reduced
with increasing Sa values from 0.10–0.17, while B. subtilis showed an opposing trend.
Meanwhile, when tested on TIP, the adhesion of all species was promoted with increasing
Sa values. E. coli adhesion with respect to varied Sa provided the strongest correlation
above all with (R2 = 0.42-0.50), while other species were not presented by the linear
regression indicated by low R2 (< 0.20). Therefore, the adhesion of Gram-positive
bacteria, regardless of its CSH and shapes, is independent from changes of Sa on smooth
surfaces (Sa < 0.2).

108
Figure 4-13 Correlation between CA, Sa and Sds with bacterial adhesion (S. aureus , E.
coli a and B. subtilis ) on SSP a), c), e) and on TIP b), d), f).
R² = 0.0009
R² = 0.3126
R² = 0.341
0
10
20
30
40
50
60
70
40 50 60 70
Nu
mb
er o
f ad
her
ent
cell
(1
03/
mm
2)
CAa)
R² = 0.2903
R² = 0.7299
R² = 0.0716
0
10
20
30
40
50
60
70
80
90
61 61.5 62 62.5
Nu
mb
er o
f ad
her
ent
cell
(1
03/
mm
2)
CAb)
R² = 0.0469
R² = 0.4954
R² = 0.177
0
10
20
30
40
50
60
70
0.09 0.11 0.13 0.15 0.17 0.19
Nu
mb
er o
f ad
her
ent
cell
(1
03/
mm
2)
Sac)
R² = 0.0912
R² = 0.4261
R² = 0.0852
0
10
20
30
40
50
60
70
80
90
0.08 0.10 0.12 0.14 0.16 0.18
Nu
mb
er o
f ad
her
ent
cell
(1
03/
mm
2)
Sad)
R² = 0.0155
R² = 0.0875
R² = 0.1581
0
10
20
30
40
50
60
70
6800 7000 7200 7400
Nu
mb
er o
f ad
her
ent
cell
(1
03/
mm
2)
Sdse)
R² = 0.0885
R² = 0.4731
R² = 0.2156
0
10
20
30
40
50
60
70
80
90
6600 6800 7000 7200 7400
Nu
mb
er o
f ad
her
ent
cell
(1
03/
mm
2)
Sdsf)

109
Figure 4-13 (E–F) shows the responses for bacterial adhesion on SSP and TIP
with respect to the summit density parameter (Sds). Adhesion increased proportionally
with increasing Sds in all bacterial species on both metals (with the exception of E. coli
on SS), which agreed with the relationship between Sds and CA. Previously, it was found
that Sds contributed to a higher contact angle (hydrophobicity) proven by a strong linear
regression. Denser peaks per unit area (increase of Sds) in conjunction with low roughness
enlarged the contact point of the bacteria with the surface. Although the adhesion
increased with increasing Sds, the low regression observed within the tested range
suggested that the adhesion process was independent of this variable. Nevertheless, the
features correlated well for representing E. coli on titanium, given by R2 = 0.4731.
It is worth mentioning that the responses in adhesion capability for all species with
respect to changes of CA, Sa and Sds values were more sensitive on TIP than SSP, proven
by the steeper line of the linear regression for the range studied. The slight difference (<
10%) between the properties of SSP and TIP with the use of similar grit paper can be
neglected, therefore the gradient represented the sensitivity of the responses when small
changes were applied. It was assumed that the polishing method might have affected the
surface composition of the polished metal. Presumably, polishing thickened the oxide
layer of the SSP, thereby the adhesion might have been controlled by the electrostatic
interaction between the oxides and the bacteria. Unlike stainless steel, titanium is stable
and chemically inert, suppressing the oxidising effect. Nevertheless, the effect of surface
skewness and kurtosis (Figure 4-13) was evaluated to look out for a correlation between
adhesion and surface topography (valleys and peaks).

110
Figure 4-14 Correlation between Sku and Ssk and bacterial adhesion (S. aureus , E. coli
a and B. subtilis ) on SSE a), c), e) and TIE b), d), f).
Figure 4-14 shows the bacterial adhesion on the polished stainless-steel with
respect to Sku and Ssk. In general, no concrete correlation based on Sku and Ssk for all
three bacteria with respect to polished stainless-steel surfaces can be made due to very
low R2 ( < 0.2). However, the effects of Sku and Ssk changed drastically when polished
titanium was used. A moderate to strong correlation was established for all bacteria
species with changes in both Sku and Ssk. Following the same fabrication technique, the
Sku values for TIP were much higher than those of SSP, showing a high peakedness in
TIP, made up by narrow and sharper peaks. The higher kurtosis values represented a wide
range of peak height distribution and inhomogeneous surfaces thus increasing the
resistance to adhesion. Meanwhile the Sku for SSE was narrowly distributed, suggesting
R² = 0.0092
R² = 0.0676
R² = 0.078
0
10
20
30
40
50
60
70
4.00 4.05 4.10 4.15 4.20 4.25 4.30
Nu
mb
er o
f ad
her
ent
cell
(1
03/
mm
2)
Skua)
R² = 0.7431
R² = 0.4702
R² = 0.6274
0
10
20
30
40
50
60
70
80
90
4.00 6.00 8.00 10.00 12.00 14.00
Nu
mb
er o
f ad
her
ent
cell
(1
03/
mm
2)
Skub)
R² = 0.0335
R² = 0.1548
R² = 0.1234
0
10
20
30
40
50
60
70
-0.80 -0.60 -0.40 -0.20 0.00
Nu
mb
er o
f ad
her
ent
cell
(1
03/
mm
2)
Sskc)
R² = 0.5398
R² = 0.1778
R² = 0.3563
0
10
20
30
40
50
60
70
80
90
-2.50 -2.00 -1.50 -1.00 -0.50 0.00
Nu
mb
er o
f ad
her
ent
cell
(1
03/
mm
2)
Sskd)

111
a controllable peak height. The adhesion of E. coli and S. aureus was reduced with
increasing Sku value because the contact area between the bacteria and the peaks was
subsequently reduced with increasing Sku. Figure 4-15 shows the images of bacteria on
the SSP and TIP after a 4-hour exposure to bacterial suspensions. Meanwhile, Figure 4-16
shows the SEM images for E. coli adhered to stainless steel.
Figure 4-15 Fluorescent images of a) SSP-without bacteria, b) S. aureus on SSP, c) TIP
without bacteria, and d) S. aureus on TIP e) E. coli on SSP, f) B. subtilis on SSP, g) E.
coli on TIP and h) B. subtilis on TIP.
Figure 4-16 SEM images of E. coli on titanium specimen at different magnification, a)
5000x, b) 1000x and c) 500x

112
4.9 Chapter Summary
In summary, polished specimens reduced gradually with polishing grit paper size
are in a negative correlation to average roughness Sa, while for Sku, it indicates a positive
correlation and Ssk shows a weak correlation. Polished titanium produced fine surfaces
compared to stainless-steel for height and hybrid parameter analysis. It is due to the
difference in material structure between them. Titanium is soft compared to stainless-
steel, which is a harder metal in physical condition. With respect to polishing grit, Sq and
Sku show a strong correlation with a regression value of nearly 1.00 while for Ssk, a
moderate correlation occurs with regression around 50% of Sa and Sku of the specimen.
In conclusion, a higher polishing grit can lower the roughness and may increase the
kurtosis of the surfaces. In terms of the wettability phenomenon, Sds demonstrated a
strong positive correlation followed by Ssc with moderate regression values.
Unfortunately, no significant correlation was indicated by Sdq and Str even though they
are closely related to the texture of the surface. Therefore, Sds is the important parameter
contributing to the surface wettability of the metallic specimen.
In general, the linear correlation between the surface properties (CA, Sa, Sds, Sku
and Ssk) and the bacterial adhesion on SSE alone was either poorly correlated or
insignificant. When observation was conducted on TIP, the regression value for the linear
relationship was greatly improved showing a moderate to strong interaction existed. The
variation in responses between these two surfaces was presumably due to the thickening
of the oxide layer on the SSE surfaces that was formed after the polishing process. Being
inert, oxidation was suppressed on the titanium surfaces, suggesting that the increase and
reduction of adhesion displayed a sensitivity of the bacteria towards the parameters
studied. It is appropriate to suggest that the natural effect coming from the hydrophilic-
hydrophilic surface interaction does not seem able to surpass the effect due to
hydrophobic bacteria (S. aureus). Thereby it is appropriate to suggest that the primary
factor for adhesion was contributed by the hydrophobic CSH, while hydrophobic surfaces
will augment the effect.
113
WEDM Surface Characterisation with respect to Contact
Angle Measurement and Bacterial adhesion
5.1 Introduction
The discussion in Chapter 5 will cover the relationship between sub-micron
roughness with surface wettability and cell attachment on metallic surfaces. The
parameters influencing surface wettability are Sa and Sds while S. aureus dominated the
cells attached on stainless-steel and rod-shaped B. subtilis adhered more to titanium
surfaces. In this chapter, the discovery continues from sub-micron on polished to micro
level roughness with the same parameters fabricated using wire electrode discharge
machining (WEDM). WEDM fabrication produced a surface roughness between 3 µm to
4 µm with a machine feed rate of between 10 mm/min to 22 mm/min. From the nature of
the WEDM process, it was expected to provide a peak structure (Ssk > 0) contrasting with
the polish technique with a deep valley structure (Ssk < 0) [155]. At the end of the
discussion, wide-range conclusions need to be established in terms of the degree of
influence on wettability and cell-attachment on both metallic surfaces.
At the end of the discussion, a wide-ranging conclusion on whether surface
topography influences wettability and cell attachment with respect to S. aureus, E. coli
and B. subtilis bacteria must be reached. The cutting operation is performed by Wire-cut
Electrical Discharge Machining (WEDM) machine (SODICK VZ300L), surface
characterisation was measured by using Bruker Optical Profilometry, contact angle by
using Kruss DSA, Germany and the bacterial adhesion experiment followed the standard
procedure as mentioned in Chapter 3. Wire electrical discharge machining (WEDM) is
an important technology in the machining of very hard materials. The quality of an
electrode machined surface determines the functionality of the metals.

114
Figure 5-1 WEDM stainless-steel morphology a) SSE-01 (10mm/min), b) SSE-02
(12mm/min), SSE-03 (20mm/min) and d) SSE-04 (22mm/min)

115
Figure 5-2 WEDM titanium morphology a) TIE-01 (10mm/min), b) TIE-02
(12mm/min), TIE-03 (20mm/min) and d) TIE-04 (22mm/min)
The morphology of 316L and Ti6Al4V surfaces machined using the wire
electrode discharge machine is formed by many craters and micro cracks that resulted
from individual electrical discharges and enormously rapid transformation of molten
material into solid solution respectively [76]. Both morphology of the given area surface
shows traces that are typical of material that was completely molten and subsequently
rapidly cooled. With the help of scanning electron microscopy, the surfaces of 316L and
Ti6Al4v were viewed under 500x, 1000x and 2000x magnifications as shown in Figure
5-1 (a – d) and Figure 5-2 (a–d). From the images, it is clear that craters and cracks formed
on the surfaces vary greatly. For micro cracks, SSE-02 (12mm/min) showed the length of
an individual crack exceeds 10m followed by SSE-04 (22 mm/min). In contrast, SSE-
01 (10 mm/min) and SSE-03 (20 mm/min) showed tiny lines of crack and can be
considered acceptable.

116
With respect to the interaction with bacteria, the occurrence of craters might trap
the bacteria, especially if the crater's diameter is larger than bacterial sizes. Due to the
tiny line of the cracks, it is impossible for the bacteria to be trapped in the valley of the
crack. However, it is perfectly possible for the fimbria of the bacteria to be attached or
locked on the surfaces. It is plausible for bacteria to form a colony inside the craters
(diameter = 3 to 5 um) due to the diameter of the craters (3 to 5 um) being bigger than the
size of the bacteria (0.5 to 2um). All samples with electrode erosive machined to contain
defects burned cavities, which means that the machine’s parameter setting has no impact
on its presence [76].
5.2 WEDM Surface Characterisation
5.2.1 WEDM Height Parameter Characterisation
The valuation of suitable surface parameters allowed the prediction of the peaks
or deep-valley surfaces. Parameters involved by means of the profile method included
average roughness (Sa), kurtosis (Sku), skewness (Ssk), maximum height profile (Sz),
maximum peak height (SP), maximum valley depth (Sv). Area parameters allow the
evaluation of the area quantitatively in all directions that are technically significant.
Values of individual parameters for 316L and Ti6Al4V were plotted in diagrams shown
in Figure 5-4 (A–C). Every average roughness, Sa show a reduction of around 33.4% to
51.2% from the as-received substrate (REF), from 5.02 m to 3.34m 2.50 m, 2.91 m
and 2.47 m for SSE-01, SSE-02, SSE-03 and SSE-04 respectively. Ti6Al4V also
showed a reduction but the percentage of reduction was around 48.94% to 50.45% with
Sa values of 3.36 m, 3.30 m, 3.34 m, and 3.26 m for TIE-01, TIE-02, TIE-03 and
TIE-04 respectively. The Sa data shows that Ti6Al4V are not affected much by the
machine feed rate variables because the Sa variation 0.10 m while for 316L the variation
was 0.84 m. For kurtosis and skewness parameters, all the specimens established
positive values with Sku > 3 except for SSE-01 and SSE-03 (Sku < 3). Surfaces with
positive Ssk and Sku greater than 3 demonstrated peaks/deep-valley structure as shown in
Figure 5-5 (3D optical profilometry images). On the plane skewness, Ssk represents Ssk
> 0 for all surfaces, which indicates the predominance of peaks on the surface [155].
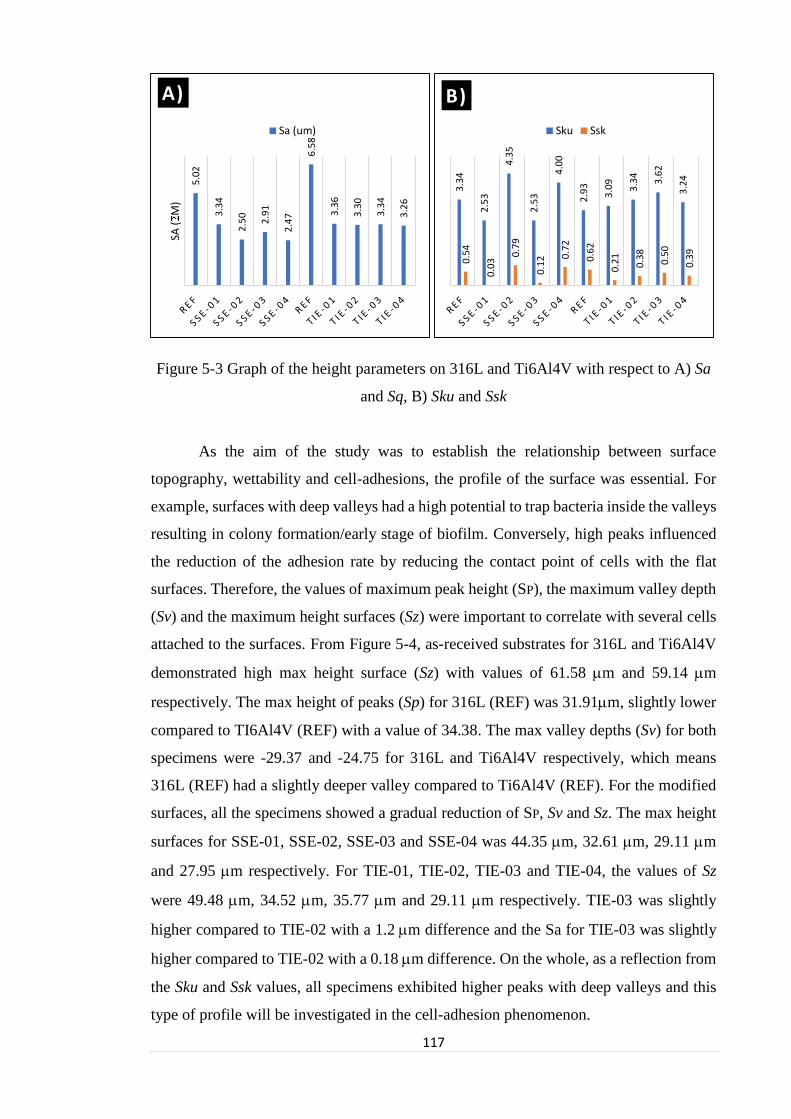
117
Figure 5-3 Graph of the height parameters on 316L and Ti6Al4V with respect to A) Sa
and Sq, B) Sku and Ssk
As the aim of the study was to establish the relationship between surface
topography, wettability and cell-adhesions, the profile of the surface was essential. For
example, surfaces with deep valleys had a high potential to trap bacteria inside the valleys
resulting in colony formation/early stage of biofilm. Conversely, high peaks influenced
the reduction of the adhesion rate by reducing the contact point of cells with the flat
surfaces. Therefore, the values of maximum peak height (SP), the maximum valley depth
(Sv) and the maximum height surfaces (Sz) were important to correlate with several cells
attached to the surfaces. From Figure 5-4, as-received substrates for 316L and Ti6Al4V
demonstrated high max height surface (Sz) with values of 61.58 m and 59.14 m
respectively. The max height of peaks (Sp) for 316L (REF) was 31.91m, slightly lower
compared to TI6Al4V (REF) with a value of 34.38. The max valley depths (Sv) for both
specimens were -29.37 and -24.75 for 316L and Ti6Al4V respectively, which means
316L (REF) had a slightly deeper valley compared to Ti6Al4V (REF). For the modified
surfaces, all the specimens showed a gradual reduction of SP, Sv and Sz. The max height
surfaces for SSE-01, SSE-02, SSE-03 and SSE-04 was 44.35 m, 32.61 m, 29.11 m
and 27.95 m respectively. For TIE-01, TIE-02, TIE-03 and TIE-04, the values of Sz
were 49.48 m, 34.52 m, 35.77 m and 29.11 m respectively. TIE-03 was slightly
higher compared to TIE-02 with a 1.2m difference and the Sa for TIE-03 was slightly
higher compared to TIE-02 with a 0.18 m difference. On the whole, as a reflection from
the Sku and Ssk values, all specimens exhibited higher peaks with deep valleys and this
type of profile will be investigated in the cell-adhesion phenomenon.
5.0
2
3.3
4
2.5
0
2.9
1
2.4
7
6.5
8
3.3
6
3.3
0
3.3
4
3.2
6
SA (
M)
A)
Sa (um)
3.3
4
2.5
3
4.3
5
2.5
3
4.0
0
2.9
3
3.0
9
3.3
4
3.6
2
3.2
4
0.5
4
0.0
3
0.7
9
0.1
2 0.7
2
0.6
2
0.2
1
0.3
8
0.5
0
0.3
9
B)
Sku Ssk

118
Figure 5-4 Graph of height parameter on 316L and Ti6Al4V with respect to maximum
height surface parameter, SP (max peak height), Sv (max valley depth) and Sz (max height
of surface)
Figure 5-5 3D optical profilometry for TIE-02 with Sa = 3.30 m, Sku = 3.34, Ssk = 0.38,
SP = 33.48, Sv = -15.99 and Sz = 49.48
Figure 5-6 shows a graph of the machine feed rate correlated with average
roughness, Sa and max height surface, Sz. Despite the gradual increase in the machine
feed rate parameter from 10 mm/min up to 22 mmm/min with other machine parameters
set to constant, remarkably, the average roughness shows a low influence where the 316L
specimen poorly correlated with the machine feed rate (R2 = 0.3415) while Ti6Al4V
showed no correlation (R2 = 0.2444). Pragya Shandilya [157] reported that for optimum
WEDM surface parameters, the machine feed rate had no substantial influence. There are
31
.91
19
.72
21
.12
16
.52
16
.11
34
.38
33
.48
18
.58
18
.79
16
.85
-29
.37
-24
.63 -1
1.5
0
-12
.59
-11
.84
-24
.75 -16
.00
-15
.94
-16
.98
-12
.26
61
.28
44
.35
32
.61
29
.11
27
.95
59
.14
49
.48
34
.52
35
.77
29
.11
R E F S S E - 0 1 S S E - 0 2 S S E - 0 3 S S E - 0 4 R E F T I E - 0 1 T I E - 0 2 T I E - 0 3 T I E - 0 4
Sp (um) Sv (um) Sz (um)
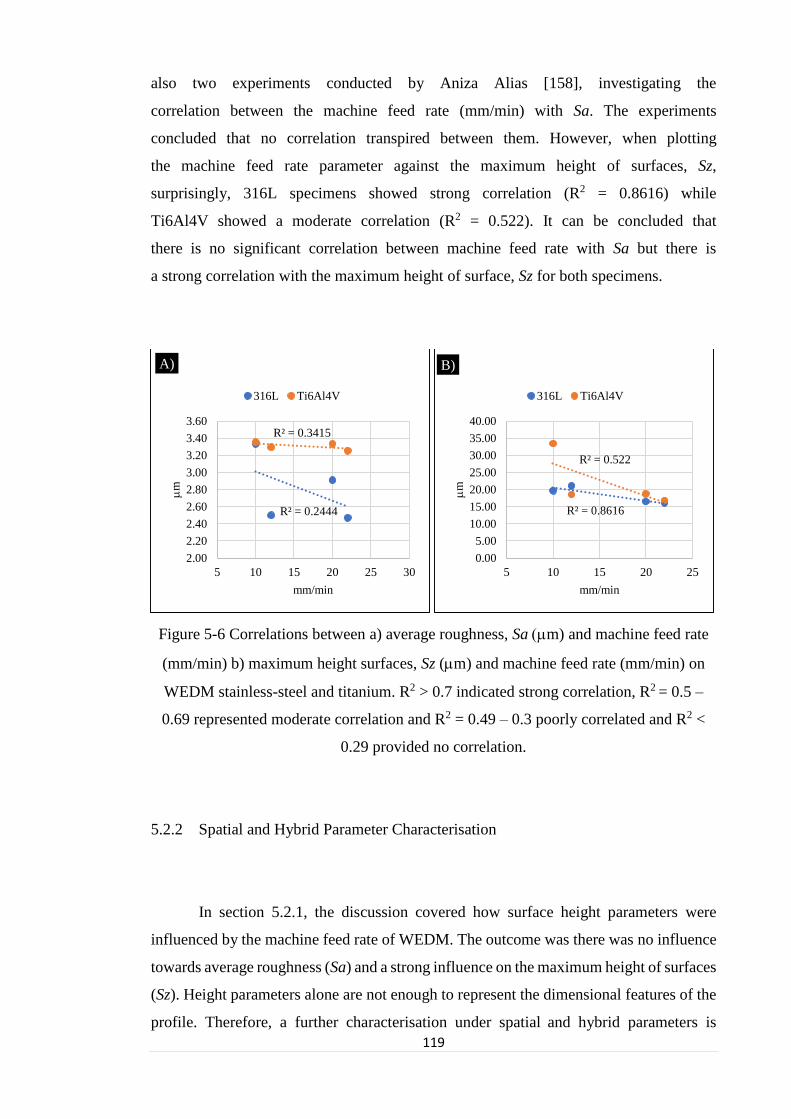
119
also two experiments conducted by Aniza Alias [158], investigating the
correlation between the machine feed rate (mm/min) with Sa. The experiments
concluded that no correlation transpired between them. However, when plotting
the machine feed rate parameter against the maximum height of surfaces, Sz,
surprisingly, 316L specimens showed strong correlation (R2 = 0.8616) while
Ti6Al4V showed a moderate correlation (R2 = 0.522). It can be concluded that
there is no significant correlation between machine feed rate with Sa but there is
a strong correlation with the maximum height of surface, Sz for both specimens.
Figure 5-6 Correlations between a) average roughness, Sa m) and machine feed rate
(mm/min) b) maximum height surfaces, Sz (m) and machine feed rate (mm/min) on
WEDM stainless-steel and titanium. R2 > 0.7 indicated strong correlation, R2 = 0.5 –
0.69 represented moderate correlation and R2 = 0.49 – 0.3 poorly correlated and R2 <
0.29 provided no correlation.
5.2.2 Spatial and Hybrid Parameter Characterisation
In section 5.2.1, the discussion covered how surface height parameters were
influenced by the machine feed rate of WEDM. The outcome was there was no influence
towards average roughness (Sa) and a strong influence on the maximum height of surfaces
(Sz). Height parameters alone are not enough to represent the dimensional features of the
profile. Therefore, a further characterisation under spatial and hybrid parameters is
R² = 0.2444
R² = 0.3415
2.00
2.20
2.40
2.60
2.80
3.00
3.20
3.40
3.60
5 10 15 20 25 30
m
mm/min
A)
316L Ti6Al4V
R² = 0.8616
R² = 0.522
0.00
5.00
10.00
15.00
20.00
25.00
30.00
35.00
40.00
5 10 15 20 25
m
mm/min
B)
316L Ti6Al4V

120
needed to provide the spacing and texture information on the surface texture, whether
isotropic or anisotropic [156].
Table 5-1 shows the spatial and hybrid data on 316L and Ti6Al4V WEDM
specimens consisting of the auto-correlation length (Sal), texture direction (Std), texture
aspect ratio (Str), developed interfacial area ratio (Sdr) and summit density (Sds) The Sal
for 316L (REF) and Ti6Al4V (REF) are higher compared to the modified specimens with
values of 48.25 m and 81.62 m respectively. These values decreased to 26.40 m,
24.88 m, 21.19 m and 22.90 m for the 316L and 19.11 m, 17.19 m, 16.33 m and
17.89 m for the Ti6Al4V specimens. Referring to Figure 5-8 and Figure 5-9 on ACF
plot, both metals show the same pattern of ACF where 316L shows a slightly wider
SPACEd compared to Ti6Al4V with Sa values of around 3.00 m. On the texture direction,
Std, no data was recorded (n/a) for all modified specimens while for the as-received
(REF), it shows 87.18° and -81.23° for 316L and Ti6Al4V respectively. No measured
data on Std means the surfaces were isotropic (no dominant direction) while the as-
received (REF) surfaces have a dominant lay with the angle > 80° as shown in Figure 5-7.
The other parameter be discussed is the texture aspect ratio, Str which refers to the same
dimensional surface measurement, either spatial isotropy or directionality texture
surfaces. From Table 5-1, the Str for 316L were 0.77. 0.68. 0.60 and 0.63 with as-received
(REF) value of 0.06 and for Ti6Al4V were 0.89, 0.85, 0.93 and 0.84 with as-received
(REF) value of 0.10. With the Str close to 1.00, the surface texture is considered spatially
isotropic.

121
Table 5-1 WEDM topography data on spatial and hybrid parameters for 316L stainless-
steel and Ti6Al4V titanium
Specimen Hybrid
Parameter REF
10
mm/min
12
mm/min
20
mm/min
22
mm/min
316L
(spatial)
Sal (µm) 48.25 26.40 24.88 21.19 22.90
Std (deg) 87.18 n/a n/a n/a n/a
Str 0.06 0.77 0.68 0.60 0.63
316L
(hybrid)
Sa (m) 5.02 3.31 2.43 4.22 2.39
Sdr (%) 56.67 180.48 137.08 152.36 121.30
Sds 3855.27 4876.28 4863.23 4786.86 3874.63
Ti6Al4V
(spatial)
Sal (µm) 81.62 19.11 17.19 16.33 17.89
Std (deg) -81.23 n/a n/a n/a n/a
Str 0.10 0.89 0.85 0.93 0.84
Ti6Al4V
(hybrid)
Sa (m) 9.58 3.36 3.36 3.46 3.06
Sdr (%) 69.21 203.78 296.67 256.89 215.80
Sds 3556.28 4448.71 4372.52 4458.99 4809.01
Figure 5-7 3D optical profilometry images for a) Ti6Al4V with Std = -81.23, Str = 0.10
and b) Ti6Al4V with Std = n/a, Str = 0.85
The discussion of hybrid parameters focuses on summit density (Sds) and
developed interfacial area ratio (Sdr). Sds is the number of summits per unit area making
up the surface while Sdr is an expressed percentage of additional surface area contributed
by the texture as compared to an ideal plane the size of the measurement region.
Typically, Sdr will increase with the spatial intricacy of the texture, whether or not Sa
changes. From Table 5-1, the summit density for 316L (REF) is 3855.27 summits/mm,
slightly low compared to modified surfaces with 4876.28 summits/mm, 4863.23
summits/mm, 4786.86 summits/mm, and 3874.63 summits/mm for SSE-01, SSE-02,

122
SSE-03 and SSE-04 respectively. For Ti6Al4V, the summit for as-received (ref) substrate
is 3556.28 summits/mm, slightly low compared to modified specimens with 4448.71
summits/mm, 4372.52 summits/mm, 4458.99 summits/mm, and 4809.01 summits/mm
for TIE-01, TIE-02, TIE-03 and TIE-04 respectively. Similar to Sds, Sdr (%) shows
extremely higher differences between as-received (ref) and modified specimens with the
increase being between 53.28% to 68.6% while for Ti6AL4V the increment is higher,
between 66.03% to 76.67%. The higher values of Sdr meant a higher contribution of
surface texture as compared to an ideal plane of the measurement region, regardless of
the roughness value. For example, TIE-01 and TIE-02 shared the same Sa, 3.36 m,
however TIE-02 contributed more surface texture with 296.67% compared to TIE-01 with
203.78%. On the whole, Ti6Al4V has a higher Sdr compared to 316L.
Figure 5-8 ACF on WEDM stainless-steel specimen

123
Figure 5-9 ACF on WEDM titanium specimen
5.3 The Correlation between Contact Angle Measurement and Surface Topography
Parameter
Figure 5-10 A graph of contact angle measurement on EDM specimen
In section 5.2, the characterisation of electro-erosive machined surface was
discussed, which covered the height, spatial and hybrid parameters. On top of that, the
aims of the thesis were to identify the influence of parameter contribution to a surface at
hydrophobicity. Therefore, the measurement of water contact angle on the electro-erosive
70.4980.73 82.25 78.60
70.77 65.77
95.50 93.07 94.20102.67
0.00
20.00
40.00
60.00
80.00
100.00
120.00
REF 10 12 20 22 REF 10 12 20 22
Stainless Steel, 316L Titanium, Ti-6Al-4V
CA
(°)
mm / min
CA (H2O)

124
machined surface has been made, and data was tabulated in Figure 5-10 presenting the
contact angle versus machine feed rate of WEDM (mm/min). Generally speaking, all
modified specimens show hydrophobic surfaces compared to polished specimens with
low Sa values. Through increasing the Sa up to 3.36 m, the surface becomes more
hydrophobic compared to as-received (ref) value with 70.49° and 65.77° for 316L and
Ti6Al4V respectively [39]. For SSE-01 to SSE-04, the contact angle increased to 80.73°,
82.25°, 78.60° and 70.77° and for TIE-01 to TIE-04, the values were 95.50°, 90.37°,
94.20°, and 102.67° respectively. The variation between the high and low measurement
for 316L and Ti6Al4V specimens was 9.96° and 10.60° respectively, while the variation
of Sa was 1.83 m for 316L and 0.40m for Ti6AL4V.
The effects of surface properties on the CA measurement with respect to metal
types and WEDM fabrications are presented in Figure 5-11 a) to f). CA
measurements were plotted against Sa, Sku, Ssk, Sal, Str and Sds and linear
regression was plotted to quantify the relationship between those parameters.
Variations in responses with a correlation between 0.001 to 0.9792 was observed
towards contact angle values. The relationship between contact angle with Sa, Sku
and Ssk (Figure 5-11 A, B and C) demonstrated a poor correlation between Sa for
Ti6Al4V with R2 equal to 0.4812 while for 316L there was no correlation. For
Sku, 316L shows a moderate correlation and Ti6Al4V shows no correlation. For
the Ssk, both metals show no correlation at all with the contact angle measurement.
The kurtosis, Sku, shows a poor correlation for stainless-steel and no correlation
for titanium with R2 of 0.4180 and 0.0159 respectively. A slight change in
titanium’s kurtosis resulted in poor Sku values while fluctuating kurtosis for
stainless steel improved the correlation. For surface skewness, no correlation for both
metal WEDM were found even though all Ssk values were positive. In the polished
specimens, there was no correlation for Ssk due to negative values, but for the positive
values (WEDM), there was no correlation at all. This means that there is no influence of
skewness on the CA measurement whether it is positive or negative skewed surface. For
the correlation with Sal, Sdr and Sds, Sds showed a strong correlation with R2 equal to
0.9487 for 316L and 0.9792 for Ti6Al4V respectively. Sal and Sdr show either poor or
no correlation with water contact angles.

125
Figure 5-11 The correlation between a) average roughness, Sa b) kurtosis, Sku c)
skewness, Ssk d) auto-correlation length, Sal e) developed interfacial area ratio, Sdr h)
summit density, Sds with water contact angle on 316L and Ti6Al4V specimens.
R² = 0.1788
R² = 0.4812
60
65
70
75
80
85
90
95
100
105
2.00 2.50 3.00 3.50
CA
(°)
Sa
A)
316L Ti6Al4V
R² = 0.418
R² = 0.0159
60
65
70
75
80
85
90
95
100
105
1.00 2.00 3.00 4.00 5.00
CA
(°)
Sku
B)
316L Ti6Al4V
R² = 0.0924
R² = 0.001
60
65
70
75
80
85
90
95
100
105
0.00 0.20 0.40 0.60 0.80 1.00
CA
(°)
Ssk
C)
316L Ti6Al4V
R² = 0.2271
R² = 0.0919
60
65
70
75
80
85
90
95
100
105
15 20 25 30
CA
(°)
Sal
D)
316L Ti6Al4V
R² = 0.3804
R² = 0.3958
60
65
70
75
80
85
90
95
100
105
0 100 200 300 400
CA
(°)
Sdr
E)
316L Ti6Al4V
R² = 0.9467
R² = 0.9792
60
65
70
75
80
85
90
95
100
105
3500 4000 4500 5000
CA
(°)
Sds
F)
316L Ti6Al4V

126
5.4 Bacteria-Surface Adhesion
Four different surfaces were produced for SSE and TIE using the WEDM
technique with different machine feed rates from 10 mm/min to 22 mm/min. The process
produced surfaces with hydrophobic characteristics, with CA ranging from 80.73o–
102.67 o and roughness varying from 2.50–3.36 m. These surfaces were exposed to a
bacterial solution to determine the ability of the surface to repel adhesion, relative to the
control process. Prior to the adhesion test, WEDM samples were cleaned and sterilised at
121oC for 20 minutes before being immersed into individual bacterial suspensions
containing approximately 1 x 10⁸ CFU/ mL of cells in the mid exponential phase for four
(4) hours. The bacteria can be divided into Gram-positive (S. aureus and B. subtilis) and
Gram-negative (E. coli) bacteria with varying properties i.e. coccus shape for S. aureus
and rod-shaped for B. subtilis and E. coli (Table 3-1). In this section, a bacterial adhesion
measurement was carried out using fluorescent microscopy procedure as mentioned in
Chapter 3. The effects of an altered surface topography including Sa, Sds, Sku, Ssk and
wettability were discussed individually while observing the correlations between
changing these parameters and their effect on the adhesion intensity. The details in Table
5-2 show the data from the surface topography parameter, water contact angle and number
of bacteria adhered to the specimens. It shows the range of measurement for both WEDM-
stainless (SSE) steel and WEDM-titanium (TIE) specimens with height, spatial and
hybrid surface parameters, and the contact angle of water against the number of bacteria
counted on per-mm2 basis. The effectiveness of the process was then compared against
the adhesion on control specimens.
5.5 Bacterial Adhesion on WEDM stainless-steel
Metallic surfaces that were treated with WEDM and exhibiting poor to moderate
hydrophobic character were exposed to S. aureus, E. coli and B. subtilis for four hours
and the number of attached cells were recorded in Figure 5-12. Again, the surface areas
of SSE-01 to SSE-04 were dominated by S. aureus (Gram-positive, hydrophobic),
showed by the highest population ranging from 44.1 x 10³/mm2 to 98 x 103/mm2, an
increase of ~50% over those of E. coli and S. aureus. A very dense population of S. aureus

127
was observed on SSE-03, while SSE-02 provided the highest resistance to S. aureus.
Although the WEDM fabrication increased the number of adhering bacteria relative to
the polishing process, the adhesion was still low compared to the control specimen (SSC-
158 x 103/mm2). A reduction of adhesion relative to control substrates was obtained in a
range of 37.9%–72.1% for S. aureus.
Figure 5-12 A graph of bacteria adhesion on WEDM stainless-steel specimen (SSE)
In general, the adhesion of E. coli was lower than B. subtilis on the SSE surfaces
except for sample SSE-03, where E. coli density was ~3 times higher than B. subtilis.
This finding is similar to Han, Tsoi [95], where in most surfaces, B. subtilis retained on
SS was higher than E. coli. However, when compared with SSC, E. coli adhesion on SSE-
03 was promoted by up to 4-fold, showing a very dense population of 59.4 x 10³/mm2. It
adhered the least onto SSE-01, with only 19.1 x 10³/mm2, thus concluding that SSE metals
failed to mitigate E. coli relative to control. In contrast, B. subtilis adhesion was
successfully mitigated as showed by the low number of adhesions. B. subtilis adhesion
was prevented on SSE-03 as shown by the 17.8 x 10³/mm2 cell count, correlating to 2
times lower than SSC. It is worth to highlight that B. subtilis was stabilised on SSE-01to
SSE-04 as showed by the low variation in the data, 17.8 x 10³/mm2 – 37.6 x 10³/mm2.
SSE-02 might provide a general with moderate anti bactericidal properties as the number
of retained bacteria was reduced by half compared to the highest reading obtained in other
surfaces. Alternatively, SSE-02, SSE-01 and SSE-03 were the best surfaces to repel
individual adhesion by S. aureus, E. coli and B. subtilis, respectively.
67.6
44.1
98.3
63.6
19.1
32.9
59.4
34.429.9 32.3
17.8
37.6
0
20
40
60
80
100
120
SSE-01 SSE-02 SSE-03 SSE-04
Nu
mb
er o
f ad
her
ent
cell
(1
03/
mm
2)
S. aureus E. coli B. subtilis

128
Table 5-2 Data on Surface Topography Parameter, Contact Angle and Bacteria Adhesion undergone WEDM fabrications
Specimen Surface Topography Parameter
Contact Angle
Measurement Bacterial Adhesion/mm2
Sa (um) Sku Ssk Str Sds CAM S. aureus E. coli B. subtilis
SSE-01 3.34 2.53 0.03 0.77 4876.28 80.73 ± 0.25 67600 ± 1100 19100 ± 1000 29900 ± 2000
SSE-02 2.50 4.35 0.79 0.58 4863.23 82.75 ± 0.46 44100 ± 1000 32900 ± 4000 32300 ± 3400
SSE-03 2.91 2.53 0.12 0.57 4786.86 85.27 ± 0.95 98300 ± 1300 59400 ± 1000 17800 ± 1000
SSE-04 2.47 4.00 0.72 0.53 3874.63 85.77 ± 0.31 63600 ± 1000 34400 ± 1100 37600 ± 2000
TIE-01 3.36 3.09 0.21 0.89 4448.71 97.50 ± 0.12 42400 ± 2000 37700 ± 1000 17600 ± 3000
TIE-02 3.30 3.34 0.38 0.85 4372.52 97.23 ± 0.67 38400 ± 3000 51800 ± 1000 29100 ± 2000
TIE-03 3.34 3.62 0.50 0.93 4458.99 95.53 ± 0.74 43400 ± 6000 24100 ± 400 47100 ± 1000
TIE-04 3.26 3.24 0.39 0.84 4809.01 102.67 ± 0.23 34400 ± 3000 50200 ± 2000 17700 ± 1000

129
5.6 Bacteria Adhesion on WEDM titanium
TIE surfaces were exposed to S. aureus, E. coli and B. subtilis for four hours and
the number of adhered cells were presented in Figure 5-13. Adherence of S. aureus (82.6
x 103/mm2) and B. subtilis (45.8 x 10³/mm2) on TIE was successfully controlled by all
TIE samples that went through the WEDM process. Comparable to the polishing process,
S. aureus adhesion on TIE was greater than TIP as depicted by the lower adhesion on
TIE-01, TIE-03 and TIE-04. The number of adhered S. aureus was 42.4 x 10³/mm2, 43.4
x 103/mm2 and 34.4 x 10³/mm2, respectively. These figures were 40%, 22% and 37%
lower relative to TIP-01, TIP-03 and TIP-04, respectively. Similarly, E. coli adhesion was
also reduced on TIE-01 and TIE-03, contributing to 50% and 40% improvements over
polished titanium. Shockingly, TIE-02 and TIE-04 induced E. coli adhesion, where the
number of adhered cells increased by > 2 fold compared to TIP-02 and TIP-04. The
adhesion of E. coli on these metals surpassed the adhesion by S. aureus and B. subtilis.
Figure 5-13 Graph of bacteria adhesion on WEDM titanium (TIE)
Similar to S. aureus, B. subtilis’ adhesion on all TIE metals were also reduced when
compared to polished titanium. When comparing the adhesion of the three tested bacteria,
B. subtilis was successfully mitigated most TIE specimens, exhibiting the lowest surface
coverage with the exception of TIE-03. The adhesion of B. subtilis varied between 17.6
x 103/mm2 – 29.1 x 10³/mm2 on TIE-01, TIE-02 and TIE-04. The highest repellence of B.
42.438.4
43.4
34.437.7
51.8
24.1
50.2
17.6
29.1
47.1
17.7
0
10
20
30
40
50
60
TIE-01 TIE-02 TIE-03 TIE-04
Nu
mb
er o
f ad
her
ent
cell
(1
03/
mm
2)
S. aureus E. coli B. subtilis
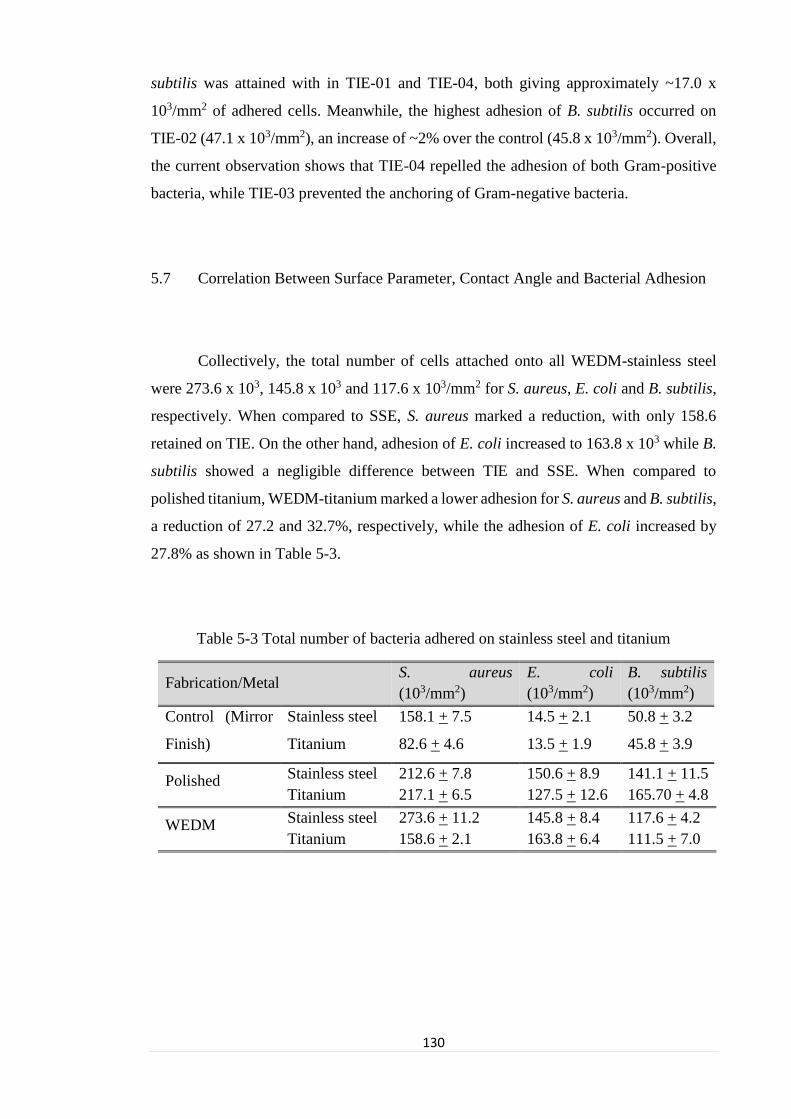
130
subtilis was attained with in TIE-01 and TIE-04, both giving approximately ~17.0 x
103/mm2 of adhered cells. Meanwhile, the highest adhesion of B. subtilis occurred on
TIE-02 (47.1 x 10³/mm2), an increase of ~2% over the control (45.8 x 10³/mm2). Overall,
the current observation shows that TIE-04 repelled the adhesion of both Gram-positive
bacteria, while TIE-03 prevented the anchoring of Gram-negative bacteria.
5.7 Correlation Between Surface Parameter, Contact Angle and Bacterial Adhesion
Collectively, the total number of cells attached onto all WEDM-stainless steel
were 273.6 x 10³, 145.8 x 10³ and 117.6 x 10³/mm2 for S. aureus, E. coli and B. subtilis,
respectively. When compared to SSE, S. aureus marked a reduction, with only 158.6
retained on TIE. On the other hand, adhesion of E. coli increased to 163.8 x 10³ while B.
subtilis showed a negligible difference between TIE and SSE. When compared to
polished titanium, WEDM-titanium marked a lower adhesion for S. aureus and B. subtilis,
a reduction of 27.2 and 32.7%, respectively, while the adhesion of E. coli increased by
27.8% as shown in Table 5-3.
Table 5-3 Total number of bacteria adhered on stainless steel and titanium
Fabrication/Metal S. aureus
(103/mm2)
E. coli
(103/mm2)
B. subtilis
(103/mm2)
Control (Mirror
Finish)
Stainless steel 158.1 + 7.5 14.5 + 2.1 50.8 + 3.2
Titanium 82.6 + 4.6 13.5 + 1.9 45.8 + 3.9
Polished Stainless steel 212.6 + 7.8 150.6 + 8.9 141.1 + 11.5
Titanium 217.1 + 6.5 127.5 + 12.6 165.70 + 4.8
WEDM Stainless steel 273.6 + 11.2 145.8 + 8.4 117.6 + 4.2
Titanium 158.6 + 2.1 163.8 + 6.4 111.5 + 7.0

131
Figure 5-14 shows the relationship between bacterial adhesion with surface
parameters, CA, Sa, and Sds on SSE and TIE. It is important to note that all the WEDM-
SSE and WEDM-TIE exhibited an enlarged hydrophobicity, with CA of 80.7o < CA <
102.7o, showing that the surfaces were poor to moderately hydrophobic. It was found
previously that adhesion of hydrophobic bacteria on hydrophilic surfaces was difficult to
predict. This provided a very poor linear correlation between adhesion of hydrophobic
bacteria with surface parameter. Previously, most of the properties studied were
independent of surface properties, which was showed by very low regression values (R2
< 0.2).
The effect of CA on the adhesions onto SSE and TIE are shown on Figure 5-14 (a
& b). Previously in polishing, only bacteria with hydrophilic surfaces produced a linear
correlation between the effect of CA with increasing number of adhesion (poor
correlation). Current observations highlighted two important ones based on the SS.
Firstly, similar to SSP, the effect of increasing CA, Sa and Sds on SSE failed to provide
any correlation with the adhesion of S. aureus and B. subtilis. Secondly, the regression
coefficient for linear correlation between E. coli and CA (R2 = 0.5408) was higher than
the regression on SSP-CA-E. coli (R2 = 0.341), suggesting that E. coli, being moderately
hydrophilic are compatible with the SSE despite it being moderately hydrophobic. The
adhesion of E. coli on SSE increased linearly with increasing CA showing the affinity
towards hydrophobic surfaces. Unlike B. subtilis which was purely hydrophilic, E. coli
used in this study was considered to have moderately hydrophilic CSH, thus it may also
generate an affinity towards hydrophobic surfaces similar to S. aureus within the tested
range. (< 90o). S. aureus in general has the highest adhesion rate on every specimen
followed by E. coli and B. subtilis.

132
Figure 5-14 Correlation between Sa, Sku, Ssk and bacteria adhesion (S. aureus , E. coli
a and B. subtilis ) on stainless-steel (a), (c), (e) and on titanium (b), (d), (f).
R² = 0.1573
R² = 0.5408
R² = 0.0087
0
20
40
60
80
100
120
80 82 84 86 88
Nu
mb
er o
f ad
her
ent
cell
s x1
03
CAa)
R² = 0.8073
R² = 0.4293
R² = 0.498
0
10
20
30
40
50
60
94 96 98 100 102 104
Nu
mb
er o
f ad
her
ent
cell
s x1
03
CAb)
R² = 0.173
R² = 0.0671
R² = 0.1899
0
20
40
60
80
100
120
2.00 2.50 3.00 3.50
Nu
mb
er o
f ad
her
ent
cell
s x1
03
Sac)
R² = 0.9204
R² = 0.5027
R² = 0.094
0
10
20
30
40
50
60
3.20 3.25 3.30 3.35 3.40
Nu
mb
er o
f ad
her
ent
cell
s x1
03
Sad)
R² = 0.0056
R² = 4E-06
R² = 0.3499
0
20
40
60
80
100
120
3500 4000 4500 5000
Nu
mb
er o
f ad
her
ent
cell
s x1
03
Sdse)
R² = 0.5338
R² = 0.0959
R² = 0.1917
0
10
20
30
40
50
60
4300 4400 4500 4600 4700 4800 4900
Nu
mb
er o
f ad
her
ent
cell
s x1
03
Sdsf)

133
Interestingly, the adhesion of all species on TIE with respect to CA can be
presented by linear regression with R2 = 0.81, R2 = 0.43 and R2 = 0.50 for S. aureus, E.
coli and B. subtilis, respectively. The CA of TIE surfaces are controlled at 95.2o < CA <
102.7o where a hydrophobic character was prominent. Following this, presumably the
adhesion was merely controlled by the hydrophobic character of the surface. Figure 5-14
(b) shows that the adhesion of Gram-positive bacteria reduced with increasing CA,
showed by moderate correlation, meanwhile the E. coli adhesion increased proportionally
with increasing CA, represented by poor linear correlation. At this range of surface
wettability, the adhesion mechanism might change slightly compared to adhesion with
hydrophilic surface/mildly hydrophobic (SSP-TIP/SSE). On the hydrophobic surfaces,
the adhesion mechanism might be contributed by the specific interaction of the
hydrophobic proteinaceous component, where the effect of Gram type was more
pronounced compared to the attraction between surfaces with similar characteristic
(hydrophobic to mild hydrophobic). This might explain why a poor correlation was
obtained for the effect of CA on E. coli adhesion, while other bacteria produced a
moderate and strong correlation.
The Sa of the SSE and TIE ranged between 2.47–3.34 m and 3.26–3.36 m
Figure 5-14 (c & d). It was mentioned previously that the adhesion capacity of the bacteria
with Sa increased when Sa > bacteria size, due to the additional contact area available for
adhesion. The range used in this study since the size of Bacillus Sp reported can range up
to 3 m in length. As expected, the adhesion of all bacteria species on SSE was
independent of Sa, suggesting that there were other properties that governed the adhesion.
Meanwhile, a very strong correlation between Sa and S. aureus (R2 = 0.92) and moderate
correlation for E. coli (R2 = 0.50) was observed with respect to TIE. In contrast, the
adhesion behaviour of B. subtilis was independent of Sa suggesting that the Sa range was
insufficient. Despite the low correlation for S. aureus-Sa on SSE, the number of adhering
S. aureus increased with small changes in Sa, providing a positive correlation. On TIE,
the relationship for Sa-S. aureus adhesion provided a positive strong correlation. Based
on this observation, it is suggested that a new topography with emerging surface
structures might increase the area for adhesion Bohinc, Dražić [159]. Being flexible and
highly adhesive, S. aureus can easily position itself on both the horizontal and vertical
planar.
134
The effect of Sds on adhesion is presented in Figure 5-14 (e & f). Sds value on
SSE and TIE was in the range of 3900-4900/mm2, much lower than that of polishing.
While polishing flattened the surfaces by removing high peaks through grinding, the
EDM process generates the formation of much higher peaks but is less dense. The effects
of Sds can be easily explained by referring to adhesion on SSE-02 and SSE-04 for all
three bacteria. The populations of S. aureus, E. coli and B. subtilis on SSE-04 (Sa = 2.47
m, Sku = 4.0 and Sds = ~3900/mm2) were 63.6 x 10³/mm2, 34.4 x 10³/mm2 and 37.6 x
103/mm2, respectively. With nearly similar surface properties, the adhesion for these
bacteria was reduced on the SSE-02 (Sa = 2.5 m, Sku = 4.0 and Sds = ~4900/mm2) to
44.1 x 10³/mm2, 32.9 x 10³/mm2 and 32.3 x 10³/mm2, lower by 31%, 5% and 14% than
those on SSE-04, respectively. Predictably, the reduction occurred due to the increasing
number of Sds to ~4900/mm2. Nevertheless, the linear correlation for presenting the effect
of Sds on adhesion was only available for B. subtilis on SSE and S. aureus on TIE,
presenting a poor (R2 = 0.35) and moderate correlation (R2 = 0.53), respectively.
It is notable that the responses for adhesion capability in all species with respect
to changes in CA, Sa and Sds values, were once again more sensitive on the TI metals
than the SS metals, proven by the increased regression coefficient for the linear
correlation based on the range studied. Previous observations showed that B. subtilis on
TIP responded well to changes in CA and Sa, while current findings revealed that S.
aureus on TIE reacted well to the changes in these properties within the tested range for
individual metals. Nevertheless, the effect of surface skewness and kurtosis (Figure 5-15)
on the bacterial responses was evaluated, where the effect of surface texture and
irregularities was discussed (valleys and peaks).
In contrast with polished stainless steel and polished titanium (Ssk < 0), all metals
that have undergone WEDM produced surfaces with positive skewness, ranging from
0.03 to 0.7. This shows that the post modification surfaces predominantly consisted of
more peaks instead of valleys. However, the Sku values for these metals were narrowly
distributed between 2.53–4.35, suggesting that the peak height distributions were
controlled efficiently. Comparing SSE to SSP and TIE to TIP, the effect of skewness and
kurtosis affected the adhesion mechanisms of bacteria. This owed to the distinct
difference in surface morphology between polished samples and WEDM samples.

135
Figure 5-15 Correlation between Sku and Ssk and bacteria adhesion (S. aureus , E. coli
a and B. subtilis ) on stainless-steel (a), (c), (e) and on titanium (b), (d), (f).
When comparing the effect of Sku and Ssk after WEDM process on adhesion, the
correlation revealed a different finding than those in polished metals. While the adhesion
for three bacteria on SSP were independent of Sku, the opposite was true for SSE.
Adhesion of both Gram-positive bacteria were highly correlated with changes in Sku. S.
aureus adhesion reduced with increasing Sku, while B. subtilis adhesion increased
proportionally with increasing Sku, depicted by R2 = 0.63 and R2 = 0.51, respectively.
Conversely, E. coli once again proved that Sku in polishing and WEDM is not involved
in adhesion on SSE and SSP, showed by very low R2 < 0.2. Meanwhile, the effect of Sku
on B. subtilis onto TIE revealed the strongest linear correlation, with R2 = 0.93.
Meanwhile, negative linear with poor correlation was obtained by E. coli on, whilst S.
R² = 0.6289
R² = 0.0378
R² = 0.5139
0
20
40
60
80
100
120
2.00 2.50 3.00 3.50 4.00 4.50
Nu
mb
er o
f ad
her
ent
cell
s x 1
03/m
m2
Skua)
R² = 0.1147
R² = 0.3291R² = 0.9344
0
10
20
30
40
50
60
3.00 3.20 3.40 3.60 3.80
Nu
mb
er o
f ad
her
ent
cell
s x 1
03/m
m2
Skub)
R² = 0.5175
R² = 0.011
R² = 0.472
0
20
40
60
80
100
120
0.00 0.20 0.40 0.60 0.80 1.00Nu
mb
er o
f ad
her
ent
cell
s x 1
03/m
m2
Sskc)
R² = 0.0009
R² = 0.098
R² = 0.6423
0
10
20
30
40
50
60
0.10 0.20 0.30 0.40 0.50 0.60Nu
mb
er o
f ad
her
ent
cell
s x 1
03/m
m2
Sskd)

136
aureus was not affected by the Sku value within the tested Sa. Since the Sa value for TIE
already exceeded the size of S. aureus, the range of peak height distribution does not
inflict any control measures, and bacteria can easily adhere on any protruding features
arising after the fabrications.
The effect of skewness was studied, and the results are shown in Figure 5-15
(c&d) for SSE and TIE, respectively. On both metallic surfaces, E. coli adhesion was not
affected by the Ssk as shown by the very low regression coefficient. However, the Bacillus
subtilis adhesion was highly affected by the distribution of peak to valley structures, given
by the positive correlation for SSE (R2 = 0.47) and TIE (R2 = 0.64). Meanwhile, S. aureus
adhesion on SSE reduced proportionally with increasing Ssk as shown by the moderate
linear correlation (R2 = 0.52). The behaviour of E. coli against the effect of either valley
in polishing (-ve Ssk) or protruding texture of WEDM (+ve Ssk) proved that the
topography of the surfaces does not directly influence the E. coli adhesion, which shows
that it may use a different mechanism to attach to inert surfaces which is yet to be
understood.

137
5.8 Chapter Summary
All WEDM specimens produced electro-erosive machined surfaces with Sa
between 2.5 to 3.5 m with positive skewness and Sku greater than 3. From the SEM
images, more cracks and deep craters were observed on Ti6Al4V relative to 316L
specimens. Cracks with sizes smaller than the bacterial size do not affect the adhesion
performance while deep craters may contribute to the entrapment of bacteria due to the
diameter being bigger than the bacterial dimension. As expected, the machine feed rate
does not influence the average roughness, Sa (poor correlation). Meanwhile, Sz (max
height of surfaces) showed a strong correlation, therefore this property can be controlled
by varying the machine feed rate. Even though not all spatial parameters reflected a
significant correlation with the CA measurement, Sds showed a strong correlation for
both metals. Comparing against polished specimens, a higher Sds promotes hydrophilic
surfaces while in WEDM, low Sds values with positive skewed surfaces promote
hydrophobic surfaces by trapping air between the peaks.
The sensitivity of bacterial adhesion to changes in CA, Sa, Sds, Ssk and Sku was
pronounced on the titanium surface. Unlike SSE, the relationship of these properties and
the adhesion on TIE often produced a negative/positive linear correlation with a
regression range from 0.4 to 0.9. Since the SSE and TIE ranged from mild hydrophobic
to hydrophobic, it was observed to disturb the adhesion of mild hydrophilic bacteria and
hydrophobic bacteria. Before any bacterial adhesion can be controlled through varying
CA, Sa and Sds, the adhesion must be accomplished within the surface with similar
properties, either hydrophobic-hydrophobic or hydrophilic-hydrophilic interaction. If the
contact was between two opposite properties, the contribution of these properties towards
increasing/reducing the adhesion was often insignificant. Apart from that, it is worth to
note that the adhesion of Gram-negative bacteria on metallic surfaces after WEDM
fabrication was more difficult to predict, because the effect of hydrophobic surfaces may
provoke a specific binding based on the proteinaceous compound, which then must be
discriminated based on the Gram types.

138
Laser-Assisted Surface Characterisation with respect to
Contact Angle Measurement and Bacterial Adhesion
6.1 Introduction
This chapter discusses the effect of additional features on metallic surfaces
(textures and grains of stainless steel and titanium) that have undergone femto-second
irradiation on the behaviour of bacterial adhesion using two model organisms, S. aureus
and E. coli. Four different surfaces were produced for each metal that has gone through
various irradiation techniques (has been detailed in Chapter 3 and Chapter 4) and were
fabricated in air and argon. The modified surfaces were then cleaned and sterilised before
being exposed to the bacterial suspension (initial OD set at 1.0), containing approximately
1 x 10⁸ CFU/ mL of cells in the mid exponential phase for four (4) hours to determine the
rate of adhesion. The surface morphologies before and after four hours of cultivation were
captured by SEM and fluorescent microscope. For fluorescence imaging, the adhered
bacteria were stained with Syto9 dye and data was taken from 15 randomly selected
images of three replicates. The metal samples were also viewed under SEM using low
and high magnifications (1000x–20,000x), where the adhesion density was thoroughly
observed to examine the effectiveness of the nano-structures for preventing adhesion.
Following the laser treatment, the laser induced periodic surface topography
(LIPSS) was termed as self-organised structures which refer to the spontaneous features
formed under laser fluence and varied pulses [85]. The modified surface (Figure 6-1),
with additional 3D topography, consisting of LIPSS and nano-grains was expected to
increase the surface hydrophobicity, thus controlling the bacteria-surface interactions.
The nano-surface will also alter the morphology of the adhered cells, thus affecting the

139
survivability and its proliferation. To obtain a surface with such features with an
increased ability to repel adhesion, the treatment processes were carried out in two
conditions, i) in air and ii) argon. The objective of the chapter was to use a physical
method for producing a highly hydrophobic surface by surface texturing that is
producible, robust and with increased ability to prevent bacteria adhesion. The
effectiveness of the treatment was discussed by i) determining the bacterial adhesion on
the fabricated surfaces and ii) finding the correlation between bacterial adhesion with
surface topographies and wettability. The laser parameter and the description of the
fabricated surfaces is presented in Table 6-1for both stainless steel and titanium, while
the SEM images are provided in Appendix A1.
Figure 6-1 Images for the titanium that have undergone femto-second irradiation
techniques showing all the available features on the modified surfaces viewed with SEM.

140
Table 6-1 Laser parameter for different surface topographies
Sample Surface Description Power
(mW)
Scan speed
(mm/s) N
Control 316L Stainless steel undergone
polishing.
- - -
SSL-01-/
TIL-01
The LIPPS form more convex micro
to macrostructures with maximum
waviness, very coarse line with
nanograins made from molten metal.
120 10 1
SSL-02
/TIL-02
The LIPPS were more flatten with
reduced waviness and shallow
valleys between micro-
macrostructures. The control lines
were smoother.
120 50 1
SSL-03
/TIL-03
The LIPPS are flattened, reduced
valleys and waviness, with longer
and smoother contour lines.
120 50+50 2
SSL-04
/TIL-04
The LIPPS are flatten with reduced
waviness, increased nanograins
structures appeared on the top of the
contour lines
80 10+50 2
6.2 Laser-Assisted specimen: The correlation of surface topography and wettability
Laser-assisted technique parameters vary on the power, velocity and number of
laser-running on the stainless-steel and titanium surfaces as shown in Table 6-2. Both
specimens of stainless steel and titanium were treated with air and argon gases after the
scan process to examine the effect of oxidation on the metal surfaces. Surface topography
data analysis will cover the height, spatial and hybrid family, while for the wettability
test, data from water contact angle measurement were used in the analysis.

141
Table 6-2 Laser parameter for different surface topographies
Sample Power
(mW)
Scan SPeed
(mm/s)
Distance
(m) N
LS-01 120 10 50 1
LS-02 120 50 50 1
LS-03 120 50 50 2
LS-04 80 10+50 50 2
LT-01 120 10 50 1
LT-02 120 50 50 1
LT-03 120 50 50 2
LT-04 80 10+50 50 2
6.2.1 Height Parameter Analysis
The assessment of suitable surface parameters allowed the prediction of the peaks
or deep-valley surfaces. Parameters involved by means of the profile method included
average roughness (Sa), kurtosis (Sku), skewness (Ssk), maximum height profile (Sz),
maximum peak height (SP), maximum valley depth (Sv). Area parameters allow
evaluation of the area quantitatively in all directions that are technically significant.
Evaluated values of individual parameters for 316L (Air & Argon) were plotted as shown
in Figure 6-2 (A – C). Mixed values of were roughness recorded to demonstrate the higher
value for Argon treated compared to Air treated specimens. SSL-01 (Argon) recorded a
value of 0.56 m while SSL-01 (Air) gave a value of 0.29 m with an increment of about
48%. Another higher increase of Sa (61%) for stainless-steel was SSL-04 with Argon
treated surface at 0.18 m while for the Air treated, the Sa was equal to 0.07 m. For
individual specimens, the increased roughness from the as-received samples based on the
power and velocity of the laser was not too high where the values were 0.29 m, 0.17 m,
0.19 m and 0.07 m for SSL-01, SSL-02, SSL-03 and SSL-04 respectively

142
Figure 6-2 Graph of height parameter on 316L and Ti6Al4V with respect to a) Sa and
Sq, b) Sku and Ssk and c) Sp (max peak height), Sv (max valley depth) and Sz (max
height of surface)
For Argon gas treated surface, the Sa was equal to 0.56 m, 0.20 m, 0.21 m
and 0.18 m for SSL-01 (Ar), SSL-02 (Ar), SSL-03 (Ar) and SSL-04(Ar), respectively.
Hence, the overall percentage increase from Air treated and Argon treated 316L was
between 9.5% to 61%. For the height surface distribution, surface kurtosis shows values
greater than 3 except for SSL-04 (Ar) with 2.39. All SSL-(Ar) had negative skewness
compared to SSL-(Air) where only SSL-01 and SSL-02 had negatively skewed surfaces.
On the summit value, SP (max height peak) for Air treatment, SSL-01 to SSL-03 showed
high values of peaks ranging between 4.82 to 9.46 m and low on SSL-04 with 1.48 m
of peak height. For the valley depth (Sv), SSL-03 showed a deep valley with a value of -
6.68 m while the others showed -2.74 m, -2.52 m and 1.32 m for SSL-01, SSL-02
and SSL-04 respectively. In contrast, for Argon treatment laser fabrication stainless-steel,
0.0
7
0.2
9
0.1
7
0.1
9
0.0
7
0.5
6
0.2
0
0.2
1
0.1
8
S S -
0 1
S S -
0 2
S S -
0 3
S S -
0 4
S S -
0 1
S S -
0 2
S S -
0 3
S S -
0 4
R E F 3 1 6 L- A IR 3 1 6 L - A R G O N
A)
Sa
10
.72
3.6
0
4.2
6
3.7
3 5.9
8
2.3
9 3.9
8
3.9
0
4.0
6
0.1
8
-0.4
4
-0.0
3
0.1
5
0.8
0
-0.0
7
-0.0
4
-0.1
3
-0.4
0
S S -
0 1
S S -
0 2
S S -
0 3
S S -
0 4
S S -
0 1
S S -
0 2
S S -
0 3
S S -
0 4
R E F 3 1 6 L- A IR 3 1 6 L - A R G O N
B)
Sku Ssk
0.9
6
9.4
6
7.1
3
4.8
2
1.4
8
4.5
7
7.6
8
6.0
9
3.0
2
-0.9
9
-2.7
4
-2.5
2
-6.6
8
-1.3
2
-8.6
2
-2.2
8
-3.3
3
-2.2
6
1.9
4
12
.20
9.6
4 11
.50
2.8
0
13
.19
9.6
0
9.4
2
5.2
8
S S - 0 1 S S - 0 2 S S - 0 3 S S - 0 4 S S - 0 1 S S - 0 2 S S - 0 3 S S - 0 4
R E F 3 1 6 L- A IR 3 1 6 L - A R G O N
C)
Sp Sv Sz
143
all specimens showed high peak height with values of 4.57 m, 7.68 , 6.09 m
and 3.02 m for SSL-01, SSL-02, SSL-03 and SSL-04, respectively. For the
valley depth, it showed values of 8.62 m, 2.28 m, 3.33 m and 2.26 m for
SSL-01, SSL-02, SSL-03 and SSL-04, respectively.
When comparing Air and Argon treated surfaces, the max height surface (Sz) for
SSL-(Air) showed a fluctuation by height values according to the laser-scanned
parameters. Sz values when compared to SSL-(Argon) and SSL-01 (Air) recorded a value
of 12.20 m followed by 9.64 m, 11.50 m and 2.80 m for SSL-02 (Air), SSL-03 (Air)
and SSL-04 (Air), respectively. Conversely, the same laser fabrication treatment with
Argon gas showed values of 13.19 m, 9.60 m, 9.42 m and 5.28 m for SSL-01 (Ar),
SSL-02 (Ar), SSL-03 (Ar) and SSL-04 (Ar) respectively. SSL-01 indicated an increase
in Sa by 7.5% from Air to Argon treated surfaces. Unfortunately for SSL-03, Sa for Argon
decreased by 16.5% roughness. In general, Argon gas treatment had no influence on the
average roughness, Sz parameter. On the whole, as a reflection from the Sku and Ssk
values, all specimens exhibited higher peak surfaces with deep valleys. This type of
profile will be investigated towards the cell-adhesion phenomenon.
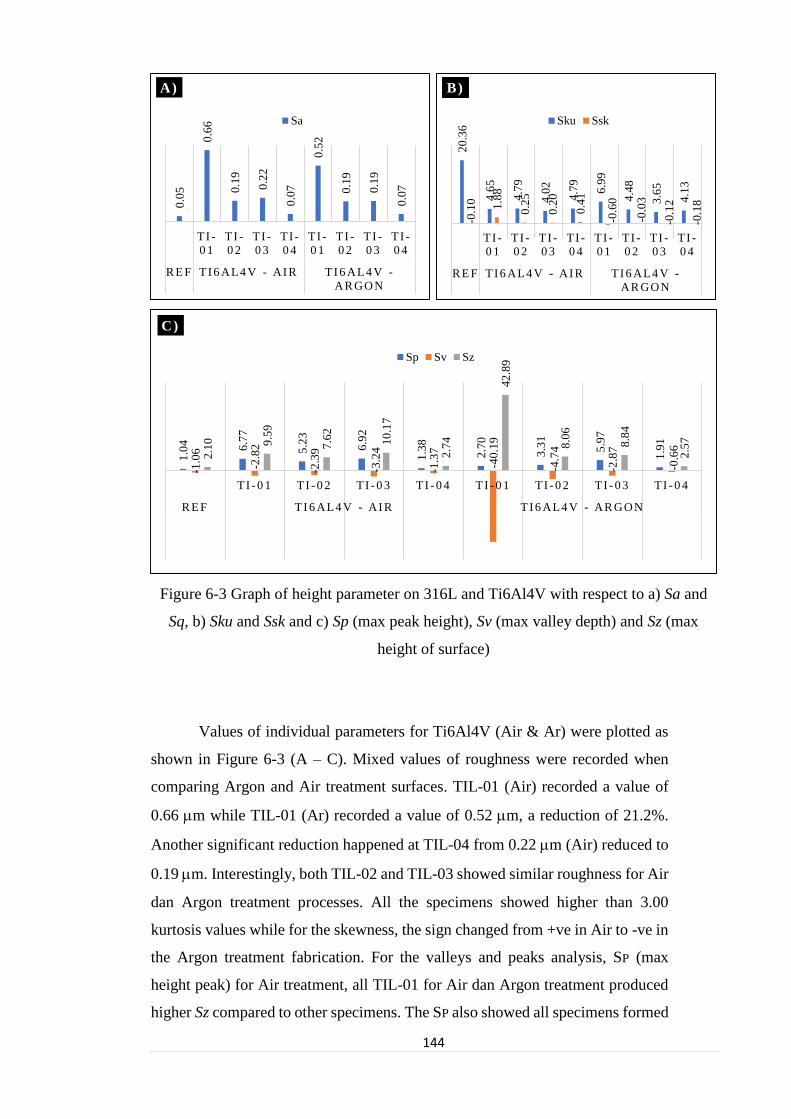
144
Figure 6-3 Graph of height parameter on 316L and Ti6Al4V with respect to a) Sa and
Sq, b) Sku and Ssk and c) Sp (max peak height), Sv (max valley depth) and Sz (max
height of surface)
Values of individual parameters for Ti6Al4V (Air & Ar) were plotted as
shown in Figure 6-3 (A – C). Mixed values of roughness were recorded when
comparing Argon and Air treatment surfaces. TIL-01 (Air) recorded a value of
0.66 m while TIL-01 (Ar) recorded a value of 0.52 m, a reduction of 21.2%.
Another significant reduction happened at TIL-04 from 0.22 m (Air) reduced to
0.19 m. Interestingly, both TIL-02 and TIL-03 showed similar roughness for Air
dan Argon treatment processes. All the specimens showed higher than 3.00
kurtosis values while for the skewness, the sign changed from +ve in Air to -ve in
the Argon treatment fabrication. For the valleys and peaks analysis, SP (max
height peak) for Air treatment, all TIL-01 for Air dan Argon treatment produced
higher Sz compared to other specimens. The SP also showed all specimens formed
0.0
5
0.6
6
0.1
9
0.2
2
0.0
7
0.5
2
0.1
9
0.1
9
0.0
7
T I -
0 1
TI -
0 2
TI -
0 3
TI -
0 4
TI -
0 1
TI -
0 2
TI -
0 3
TI -
0 4
R E F TI 6 AL4 V - AI R TI 6 AL4 V -
AR GO N
A)
Sa
20
.36
4.6
5
4.7
9
4.0
2
4.7
9
6.9
9
4.4
8
3.6
5
4.1
3
-0.1
0 1.8
8
0.2
5
0.2
0
0.4
1
-0.6
0
-0.0
3
-0.1
2
-0.1
8
T I -
0 1
TI -
0 2
TI -
0 3
TI -
0 4
TI -
0 1
TI -
0 2
TI -
0 3
TI -
0 4
R E F TI 6 AL4 V - AI R TI 6 AL4 V -
AR GO N
B)
Sku Ssk
1.0
4 6.7
7
5.2
3
6.9
2
1.3
8
2.7
0
3.3
1
5.9
7
1.9
1
-1.0
6
-2.8
2
-2.3
9
-3.2
4
-1.3
7
-40
.19
-4.7
4
-2.8
7
-0.6
6
2.1
0 9.5
9
7.6
2
10
.17
2.7
4
42
.89
8.0
6
8.8
4
2.5
7
TI - 0 1 TI - 0 2 TI - 0 3 TI - 0 4 T I - 0 1 TI - 0 2 TI - 0 3 TI - 0 4
R E F TI 6 AL4 V - AI R TI 6 AL4 V - AR GO N
C)
Sp Sv Sz

145
higher peaks with values ranging between 1.38 m to 17.84 m while on valley
depth (Sv), all the specimens formed low -ve valleys except for TIL-01 (Ar) which
had an extremely high Sv value of -40.19 m.
6.2.2 Laser scan Speed correlation with Sa and Sv
Figure 6-4 below shows a graph of the correlation between laser scan speed and
average roughness, Sa whereas all materials shows strong negative correlations with laser
scan-speed. 316L (Ar) gives regression values of 0.9799 while for 316L (Air) the R2 is
equal to 0.8386. On Ti6Al4V, both metal treatment whether in Air or Argon, showed a
R2 close to 1.00. Therefore, laser scan speed plays an important role in average roughness,
Sa either in Air or Argon gas treatment.
Figure 6-4 Correlation between A) average roughness, Sa and laser scan speed (mms-1)
on 316L (air) and 316L (argon), B) average roughness, Sa and laser scan speed (mms-1)
on Ti6Al4V (air) and Ti6Al4V (argon)..
Figure 6-5 shows the correlation between laser scan speed and maximum height
surfaces (Sz). From the graph, 316L (Air) showed a moderate correlation while 316L(Ar)
showed a strong correlation with the scan speed. For Ti6Al4V, both treatments show a
strong correlation with scan speed with regression values 0.9553 and 0.9957 for Air and
R² = 0.8386
R² = 0.9799
0
0.1
0.2
0.3
0.4
0.5
0.6
0 20 40 60 80
m
mms-1
A)
316L (Air) 316L(Arg)
R² = 0.9963
R² = 0.993
0
0.1
0.2
0.3
0.4
0.5
0.6
0.7
0 20 40 60 80
m
mms-1
B)
Ti (Air) Ti(Arg)

146
Argon treatments respectively. In conclusion, laser scan speed highly influences the Sa
and Sz of 316L stainless-steel and Ti6Al4V titanium surfaces.
Figure 6-5 Correlation between A) max height surface, Sz and laser scan speed (mms-1)
on 316L (air) and 316L (argon), B) max height surface, Sz and laser scan speed (mms-1)
on Ti6Al4V (air) and Ti6Al4V (argon).
6.2.3 Spatial and Hybrid Parameter Characterisation
In section 6.2.1, the discussion covered how surface height parameters were
influenced by laser scan speed where the results showed a strong influence on both metals.
Besides that, for the surface texture analysis, spatial and hybrid parameters provide the
spacing and texture information such as isotropic or anisotropic [156]. Therefore, in
Table 6-3, data on spatial and hybrid parameters for laser-assisted on 316L and
Ti6Al4V presented with the information on the auto-correlation length (Sal), texture
direction (Std), texture aspect ratio (Str), developed interfacial area ratio (Sdr) and summit
density (Sds).
R² = 0.4374
R² = 0.8101
0
2
4
6
8
10
12
14
16
0 20 40 60 80
m
mms-1
A)
316L (Air) 316L(Arg)
R² = 0.9553
R² = 0.9957
0
10
20
30
40
50
0 20 40 60 80
m
mms-1
B)
Ti (Air) Ti(Arg)
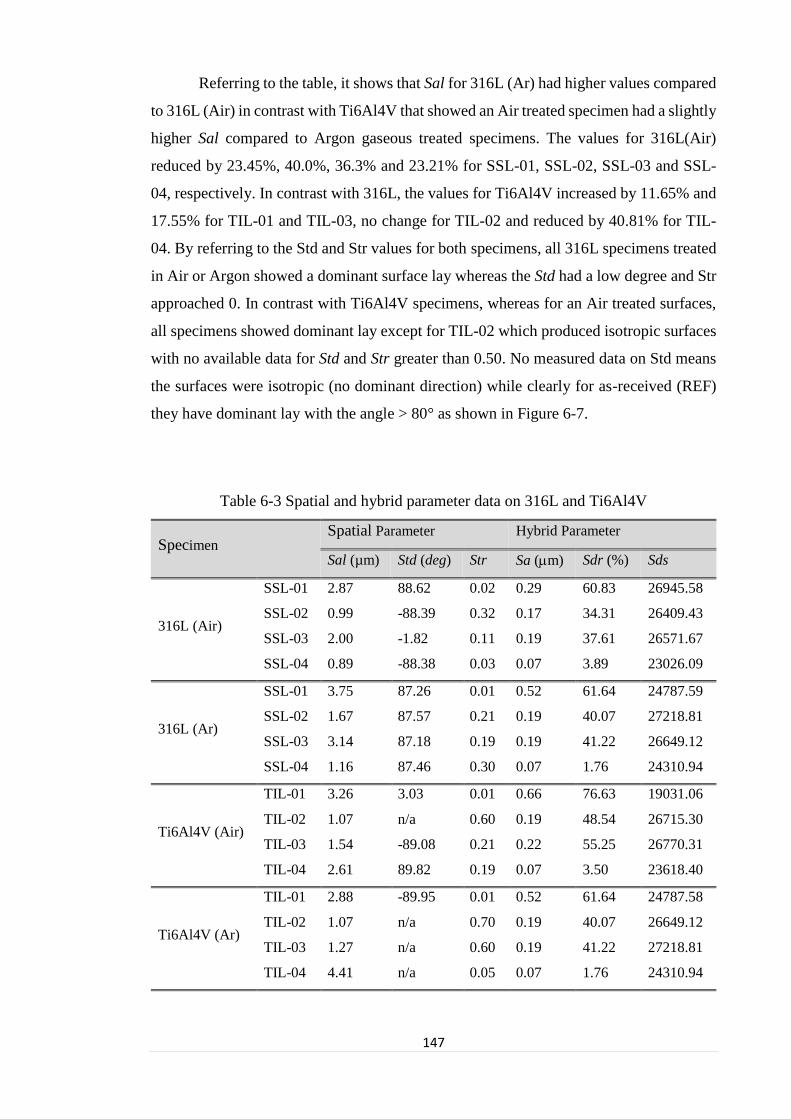
147
Referring to the table, it shows that Sal for 316L (Ar) had higher values compared
to 316L (Air) in contrast with Ti6Al4V that showed an Air treated specimen had a slightly
higher Sal compared to Argon gaseous treated specimens. The values for 316L(Air)
reduced by 23.45%, 40.0%, 36.3% and 23.21% for SSL-01, SSL-02, SSL-03 and SSL-
04, respectively. In contrast with 316L, the values for Ti6Al4V increased by 11.65% and
17.55% for TIL-01 and TIL-03, no change for TIL-02 and reduced by 40.81% for TIL-
04. By referring to the Std and Str values for both specimens, all 316L specimens treated
in Air or Argon showed a dominant surface lay whereas the Std had a low degree and Str
approached 0. In contrast with Ti6Al4V specimens, whereas for an Air treated surfaces,
all specimens showed dominant lay except for TIL-02 which produced isotropic surfaces
with no available data for Std and Str greater than 0.50. No measured data on Std means
the surfaces were isotropic (no dominant direction) while clearly for as-received (REF)
they have dominant lay with the angle > 80° as shown in Figure 6-7.
Table 6-3 Spatial and hybrid parameter data on 316L and Ti6Al4V
Specimen Spatial Parameter Hybrid Parameter
Sal (µm) Std (deg) Str Sa (m) Sdr (%) Sds
316L (Air)
SSL-01 2.87 88.62 0.02 0.29 60.83 26945.58
SSL-02 0.99 -88.39 0.32 0.17 34.31 26409.43
SSL-03 2.00 -1.82 0.11 0.19 37.61 26571.67
SSL-04 0.89 -88.38 0.03 0.07 3.89 23026.09
316L (Ar)
SSL-01 3.75 87.26 0.01 0.52 61.64 24787.59
SSL-02 1.67 87.57 0.21 0.19 40.07 27218.81
SSL-03 3.14 87.18 0.19 0.19 41.22 26649.12
SSL-04 1.16 87.46 0.30 0.07 1.76 24310.94
Ti6Al4V (Air)
TIL-01 3.26 3.03 0.01 0.66 76.63 19031.06
TIL-02 1.07 n/a 0.60 0.19 48.54 26715.30
TIL-03 1.54 -89.08 0.21 0.22 55.25 26770.31
TIL-04 2.61 89.82 0.19 0.07 3.50 23618.40
Ti6Al4V (Ar)
TIL-01 2.88 -89.95 0.01 0.52 61.64 24787.58
TIL-02 1.07 n/a 0.70 0.19 40.07 26649.12
TIL-03 1.27 n/a 0.60 0.19 41.22 27218.81
TIL-04 4.41 n/a 0.05 0.07 1.76 24310.94

148
The discussion on hybrid parameters focuses on summit density (Sds) and
developed interfacial area ratio (Sdr). Sds is the number of summits per unit area making
up the surface while Sdr is an expressed percentage of additional surface area contributed
by the texture as compared to an ideal plane the size of the measurement region.
Typically, Sdr will increase with the spatial intricacy of the texture, whether Sa changes
or otherwise. From Table 6-3, the Sdr for 316L(Air) was lower compared to 316L(Ar)
except for SSL-04. The Sdr for 316L(Air) were 60.83%, 34.31%, 37.61%, and 3.89%
while for 316L(Ar), the Sdr were 61.64%, 40.07%, 41.22%, and 1.76% for SSL-01, SSL-
02, SSL-03 and SSL-04 respectively. The Sds for 316L demonstrated higher values
compared to polished and WEDM specimens with 26945, 26409, 26571, and 23026 for
Air treated specimens and 24787, 26649, 27218, and 24310 for Argon treated specimens.
In contrast, Ti6Al4V showed Sdr with values of 76.63%, 48.54%, 55.25% and 3.50% for
Air treated surfaces and 61.64%, 40.07%, 41.22% and 1.76% for Argon treated surfaces.
Figure 6-6 3D optical profilometry images on SSL-01 (Air) and SSL-01 (Ar)
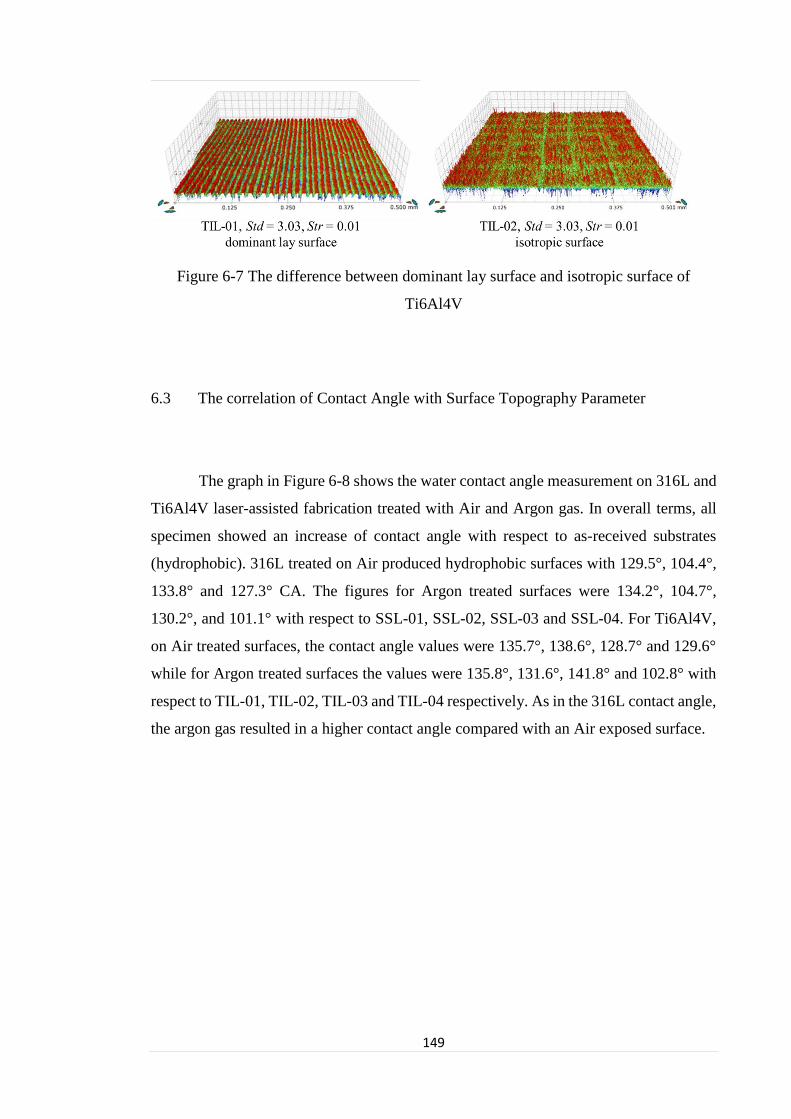
149
Figure 6-7 The difference between dominant lay surface and isotropic surface of
Ti6Al4V
6.3 The correlation of Contact Angle with Surface Topography Parameter
The graph in Figure 6-8 shows the water contact angle measurement on 316L and
Ti6Al4V laser-assisted fabrication treated with Air and Argon gas. In overall terms, all
specimen showed an increase of contact angle with respect to as-received substrates
(hydrophobic). 316L treated on Air produced hydrophobic surfaces with 129.5°, 104.4°,
133.8° and 127.3° CA. The figures for Argon treated surfaces were 134.2°, 104.7°,
130.2°, and 101.1° with respect to SSL-01, SSL-02, SSL-03 and SSL-04. For Ti6Al4V,
on Air treated surfaces, the contact angle values were 135.7°, 138.6°, 128.7° and 129.6°
while for Argon treated surfaces the values were 135.8°, 131.6°, 141.8° and 102.8° with
respect to TIL-01, TIL-02, TIL-03 and TIL-04 respectively. As in the 316L contact angle,
the argon gas resulted in a higher contact angle compared with an Air exposed surface.
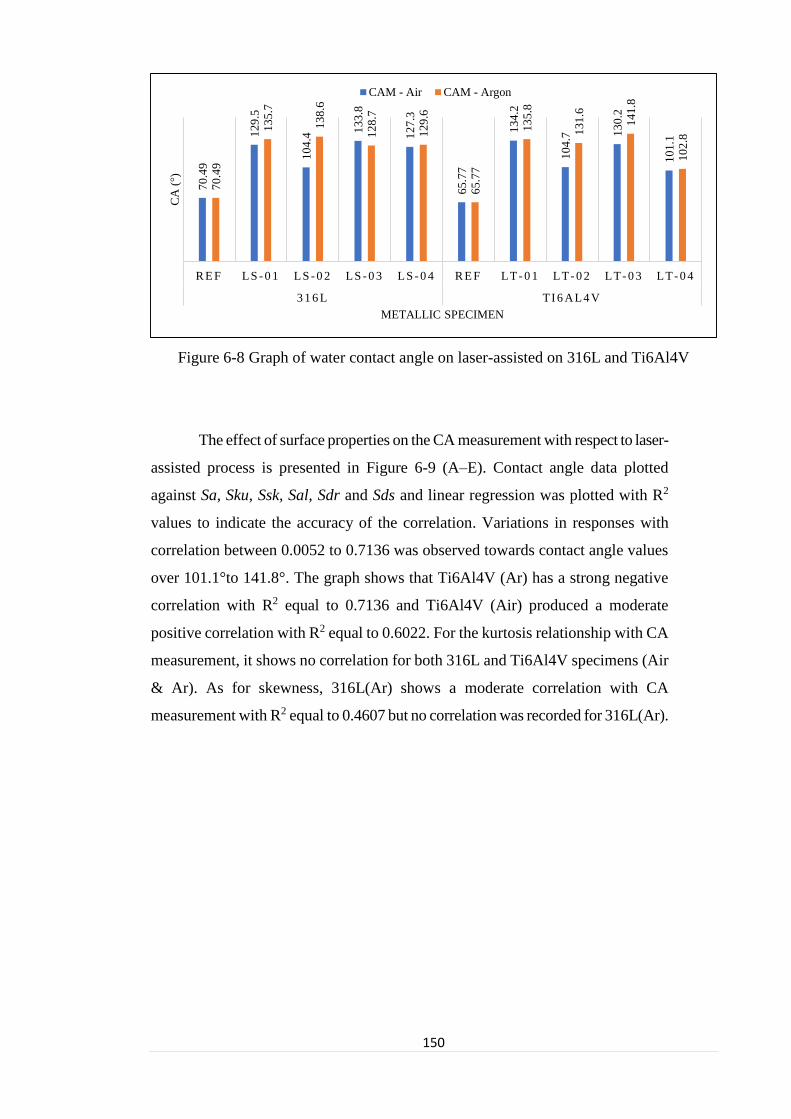
150
Figure 6-8 Graph of water contact angle on laser-assisted on 316L and Ti6Al4V
The effect of surface properties on the CA measurement with respect to laser-
assisted process is presented in Figure 6-9 (A–E). Contact angle data plotted
against Sa, Sku, Ssk, Sal, Sdr and Sds and linear regression was plotted with R2
values to indicate the accuracy of the correlation. Variations in responses with
correlation between 0.0052 to 0.7136 was observed towards contact angle values
over 101.1°to 141.8°. The graph shows that Ti6Al4V (Ar) has a strong negative
correlation with R2 equal to 0.7136 and Ti6Al4V (Air) produced a moderate
positive correlation with R2 equal to 0.6022. For the kurtosis relationship with CA
measurement, it shows no correlation for both 316L and Ti6Al4V specimens (Air
& Ar). As for skewness, 316L(Ar) shows a moderate correlation with CA
measurement with R2 equal to 0.4607 but no correlation was recorded for 316L(Ar).
70
.49
12
9.5
10
4.4
13
3.8
12
7.3
65
.77
13
4.2
10
4.7 1
30
.2
10
1.1
70
.49
13
5.7
13
8.6
12
8.7
12
9.6
65
.77
13
5.8
13
1.6
14
1.8
10
2.8
R E F LS - 0 1 LS - 0 2 LS - 0 3 LS - 0 4 R E F LT- 0 1 LT- 0 2 LT- 0 3 LT- 0 4
3 1 6 L TI 6 AL4 V
CA
(°)
METALLIC SPECIMEN
CAM - Air CAM - Argon

151
Figure 6-9 Correlation between contact angle and A) average roughness, Sa on 316L C)
surfaces kurtosis, Sku on 316L, E) surface skewness, Ssk on 316L, B) average
roughness, Sa on Ti6Al4V, D) surface kurtosis, Sku, F) surface skewness, Ssk.
R² = 0.0222
R² = 0.1273
100
105
110
115
120
125
130
135
140
145
0 0.2 0.4 0.6 0.8
CA
(°)
Sa (m)
A)
Air Arg
R² = 0.6022
R² = 0.7136
90
100
110
120
130
140
150
0 0.2 0.4 0.6 0.8 1
CA
(°)
Sa (m)
B)
Air Arg
R² = 0.0052
R² = 0.1204
80
90
100
110
120
130
140
150
0 2 4 6 8
CA
(°)
Sku
C)
Air Argon
R² = 0.3456
R² = 0.2792
80
90
100
110
120
130
140
150
2 4 6 8
CA
(°)
Sku
D)
Air Argon
R² = 0.0128
R² = 0.4607
100
105
110
115
120
125
130
135
140
145
-1 -0.5 0 0.5 1
CA
(°)
Ssk
E)
Air Argon
R² = 0.3394
R² = 0.0242
0
20
40
60
80
100
120
140
160
-1 0 1 2 3
CA
(°)
Ssk
F)
Air Argon

152
In the other groups of parameters (Sdr and Sds), Sds shows a highly strong
correlation with surface hydrophobicity with R2 equal to 0.9792 and 0.9468 for
Ti6Al4V and 316L respectively. Sdr shows a poor correlation for Ti6Al4V but a
strong correlation for 316L for both types of surface treatment (Air and Argon).
In summary, it can be concluded on the correlation between CA measurement and
surface profile parameters that summit density (Sds) plays an important role in
determining the hydrophobicity of the surfaces in laser-assisted methods.
Figure 6-10 Correlation between contact angle and A) summit density, Sds, C)
developed interfacial area ratio, Sdr on 316L, B) summit density, Sds, D) developed
interfacial area ratio, Sdr on Ti6Al4V.
R² = 0.9931
R² = 0.8447
0
20
40
60
80
100
120
140
160
22000230002400025000260002700028000
CA
(°)
Sds
A)
Air Argon
R² = 1
R² = 0.9453
90
100
110
120
130
140
150
24000 25000 26000 27000 28000
CA
(°)
Sds
B)
Air Argon
R² = 0.8635
R² = 0.7811
100
105
110
115
120
125
130
135
140
145
0 20 40 60 80 100
Axis
Tit
le
Sdr
C)
Air Argon
R² = 0.2883
R² = 0.1736
90
100
110
120
130
140
150
0 20 40 60 80 100
Axis
Tit
le
Sdr
D)
Air Argon
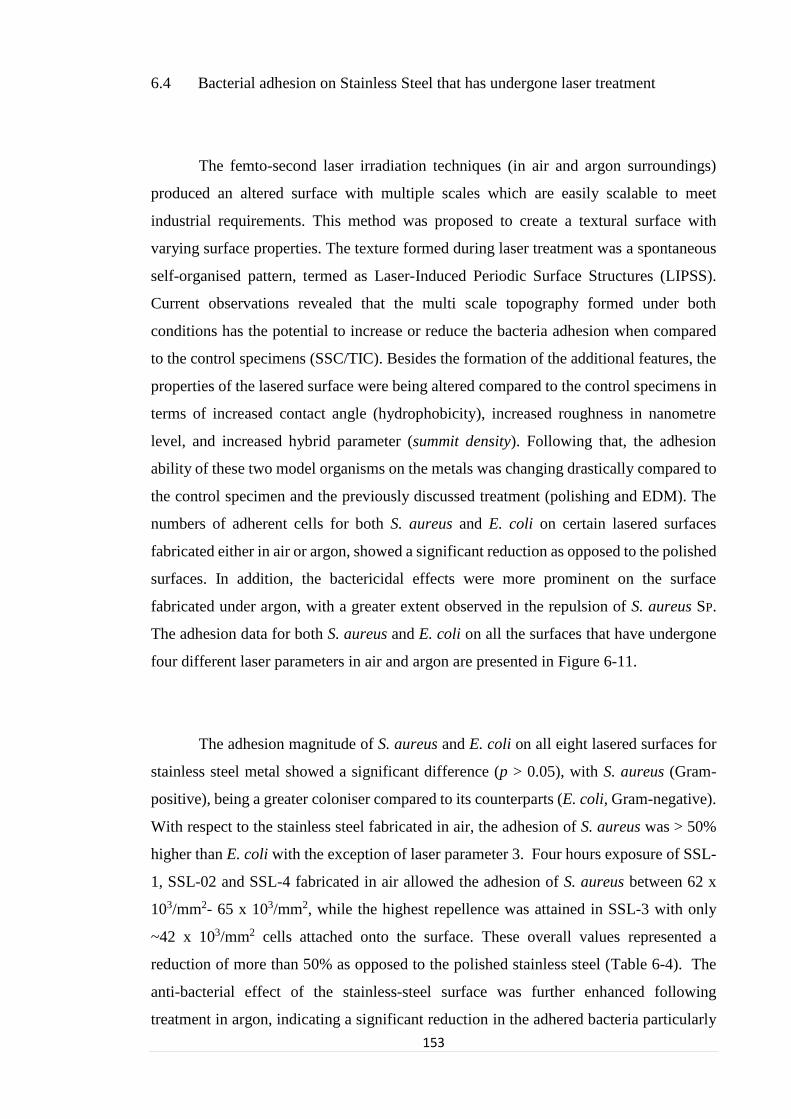
153
6.4 Bacterial adhesion on Stainless Steel that has undergone laser treatment
The femto-second laser irradiation techniques (in air and argon surroundings)
produced an altered surface with multiple scales which are easily scalable to meet
industrial requirements. This method was proposed to create a textural surface with
varying surface properties. The texture formed during laser treatment was a spontaneous
self-organised pattern, termed as Laser-Induced Periodic Surface Structures (LIPSS).
Current observations revealed that the multi scale topography formed under both
conditions has the potential to increase or reduce the bacteria adhesion when compared
to the control specimens (SSC/TIC). Besides the formation of the additional features, the
properties of the lasered surface were being altered compared to the control specimens in
terms of increased contact angle (hydrophobicity), increased roughness in nanometre
level, and increased hybrid parameter (summit density). Following that, the adhesion
ability of these two model organisms on the metals was changing drastically compared to
the control specimen and the previously discussed treatment (polishing and EDM). The
numbers of adherent cells for both S. aureus and E. coli on certain lasered surfaces
fabricated either in air or argon, showed a significant reduction as opposed to the polished
surfaces. In addition, the bactericidal effects were more prominent on the surface
fabricated under argon, with a greater extent observed in the repulsion of S. aureus SP.
The adhesion data for both S. aureus and E. coli on all the surfaces that have undergone
four different laser parameters in air and argon are presented in Figure 6-11.
The adhesion magnitude of S. aureus and E. coli on all eight lasered surfaces for
stainless steel metal showed a significant difference (p > 0.05), with S. aureus (Gram-
positive), being a greater coloniser compared to its counterparts (E. coli, Gram-negative).
With respect to the stainless steel fabricated in air, the adhesion of S. aureus was > 50%
higher than E. coli with the exception of laser parameter 3. Four hours exposure of SSL-
1, SSL-02 and SSL-4 fabricated in air allowed the adhesion of S. aureus between 62 x
103/mm2- 65 x 103/mm2, while the highest repellence was attained in SSL-3 with only
~42 x 103/mm2 cells attached onto the surface. These overall values represented a
reduction of more than 50% as opposed to the polished stainless steel (Table 6-4). The
anti-bacterial effect of the stainless-steel surface was further enhanced following
treatment in argon, indicating a significant reduction in the adhered bacteria particularly

154
for S. aureus. Over 50% improvements in terms of reduced S. aureus adhesion were
obtained for all stainless-steel surfaces fabricated in argon relative to the SSL-Air. The
adhesion of S. aureus in the SSL-01-Ar, SSL-02-Ar, SSL-03-Ar and SSL-04-Ar were
further reduced to ~17 x 103/mm2, ~19 x 103/mm2, ~22 x 103/mm2 and ~32 x 103/mm2,
respectively. This indicated an improvement of over 72%, 70%, 47% and 48% compared
to SSL-01-Air, SSL-02-Air, SSL-03-Air and SSL-04-Air, respectively.
Figure 6-11 Numbers of adhered bacteria on lasered surfaces (stainless steel) after
exposure to bacterial suspension (1 x 10⁸ CFU/mL) for four hours at 37oC. (SA- S.
aureus; EC – E. coli)
Being the least adhesive species, the adhesion of E. coli on the stainless-steel
surface was much lower compared to the adhesion of S. aureus. In contrast with S. aureus,
the adhesion of E. coli was enhanced in the all the lasered stainless steel fabricated in air
with the exception of SSL-03-Air (Table 6-4). E. coli adhesion increased between 87%
to 32% for SSL-01-Air, SSL-03-Air and SSL-04-Air relative to the control sample.
Except for SSL-02-Air, adhesion was reduced by 10% but it was not statistically
significant. Comparing the effect of exposure during laser treatment, our finding for E.
coli adhesion revealed a similar pattern to those of S. aureus where the repulsion in SSL-
Ar was further increased compared to SSL-Air. E. coli retention was improved by 71%,
25%, 18 and 67% in SSL-01-Ar, SSL-02-Ar, SSL-03-Ar and SSL-04-Ar, respectively,
0
10
20
30
40
50
60
70
80
90
1 2 3 4
Nu
mb
er o
f ad
her
ent
cell(
10
3 / m
m2 )
Laser parameter
SA-air SA-argon EC-air EC-argon
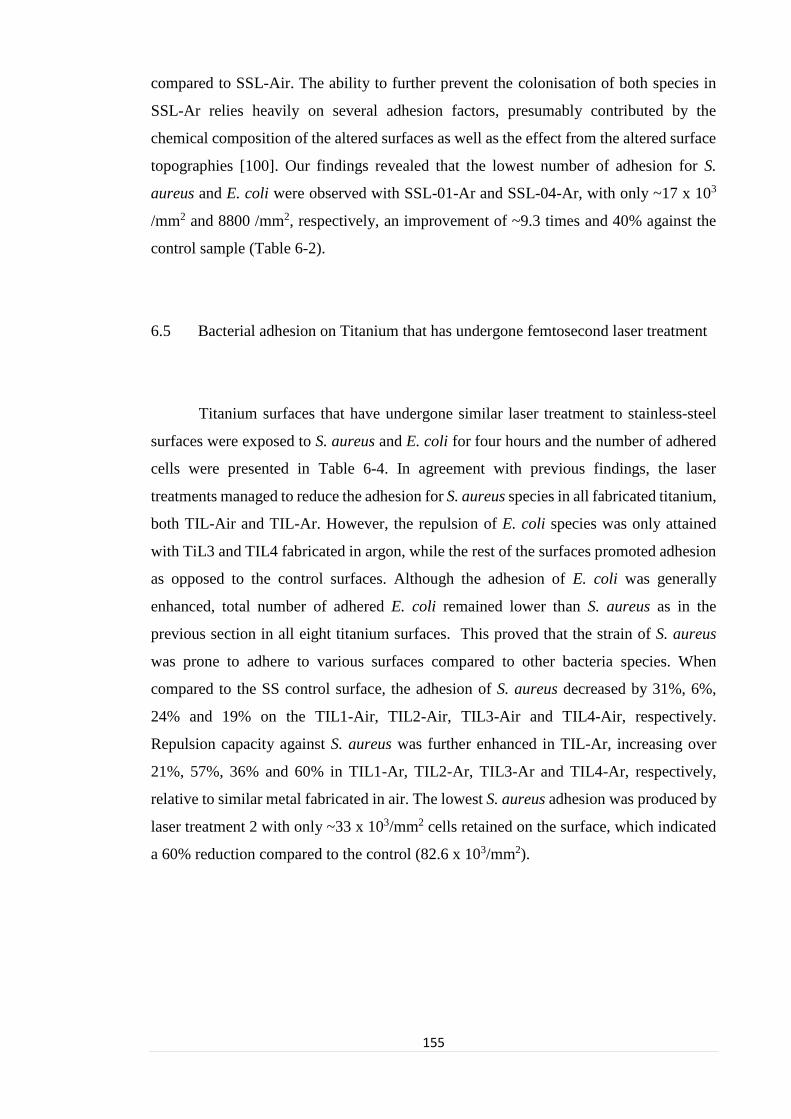
155
compared to SSL-Air. The ability to further prevent the colonisation of both species in
SSL-Ar relies heavily on several adhesion factors, presumably contributed by the
chemical composition of the altered surfaces as well as the effect from the altered surface
topographies [100]. Our findings revealed that the lowest number of adhesion for S.
aureus and E. coli were observed with SSL-01-Ar and SSL-04-Ar, with only ~17 x 103
/mm2 and 8800 /mm2, respectively, an improvement of ~9.3 times and 40% against the
control sample (Table 6-2).
6.5 Bacterial adhesion on Titanium that has undergone femtosecond laser treatment
Titanium surfaces that have undergone similar laser treatment to stainless-steel
surfaces were exposed to S. aureus and E. coli for four hours and the number of adhered
cells were presented in Table 6-4. In agreement with previous findings, the laser
treatments managed to reduce the adhesion for S. aureus species in all fabricated titanium,
both TIL-Air and TIL-Ar. However, the repulsion of E. coli species was only attained
with TiL3 and TIL4 fabricated in argon, while the rest of the surfaces promoted adhesion
as opposed to the control surfaces. Although the adhesion of E. coli was generally
enhanced, total number of adhered E. coli remained lower than S. aureus as in the
previous section in all eight titanium surfaces. This proved that the strain of S. aureus
was prone to adhere to various surfaces compared to other bacteria species. When
compared to the SS control surface, the adhesion of S. aureus decreased by 31%, 6%,
24% and 19% on the TIL1-Air, TIL2-Air, TIL3-Air and TIL4-Air, respectively.
Repulsion capacity against S. aureus was further enhanced in TIL-Ar, increasing over
21%, 57%, 36% and 60% in TIL1-Ar, TIL2-Ar, TIL3-Ar and TIL4-Ar, respectively,
relative to similar metal fabricated in air. The lowest S. aureus adhesion was produced by
laser treatment 2 with only ~33 x 103/mm2 cells retained on the surface, which indicated
a 60% reduction compared to the control (82.6 x 10³/mm2).

156
Table 6-4 Data for control and laser specimen (stainless steel).
Metal CA
(o)
Sa
(m)
Sq
(m) Ssk Sku Sds (1/mm2)
S. aureus
(103/mm2)
E. coli
(103/mm2)
SSC 70.49 0.07 0.102 0.18 10.72 17600 158.1 14.5
SSL-01-Air 129.5 0.29 0.37 -0.44 3.61 26900 63.0 33.6
SSL-02-Air 104.4 0.17 0.22 -0.03 4.26 26400 65.0 12.9
SSL-03-Air 133.8 0.19 0.25 0.15 3.73 26600 42.0 31.3
SSL-04-Air 127.3 0.07 0.10 0.80 5.97 23000 62.7 27.1
SSL-01-Ar 135.7 0.56 0.67 -0.07 2.39 25000 17.0 9.9
SSL-02-Ar 138.6 0.20 0.26 -0.04 3.98 27200 18.9 9.7
SSL-03-Ar 128.7 0.21 0.27 -0.13 3.90 26800 22.3 25.8
SSL-04-Ar 129.6 0.18 0.23 -0.40 4.06 26100 32.5 8.8
All data are represented as average taken from three replications
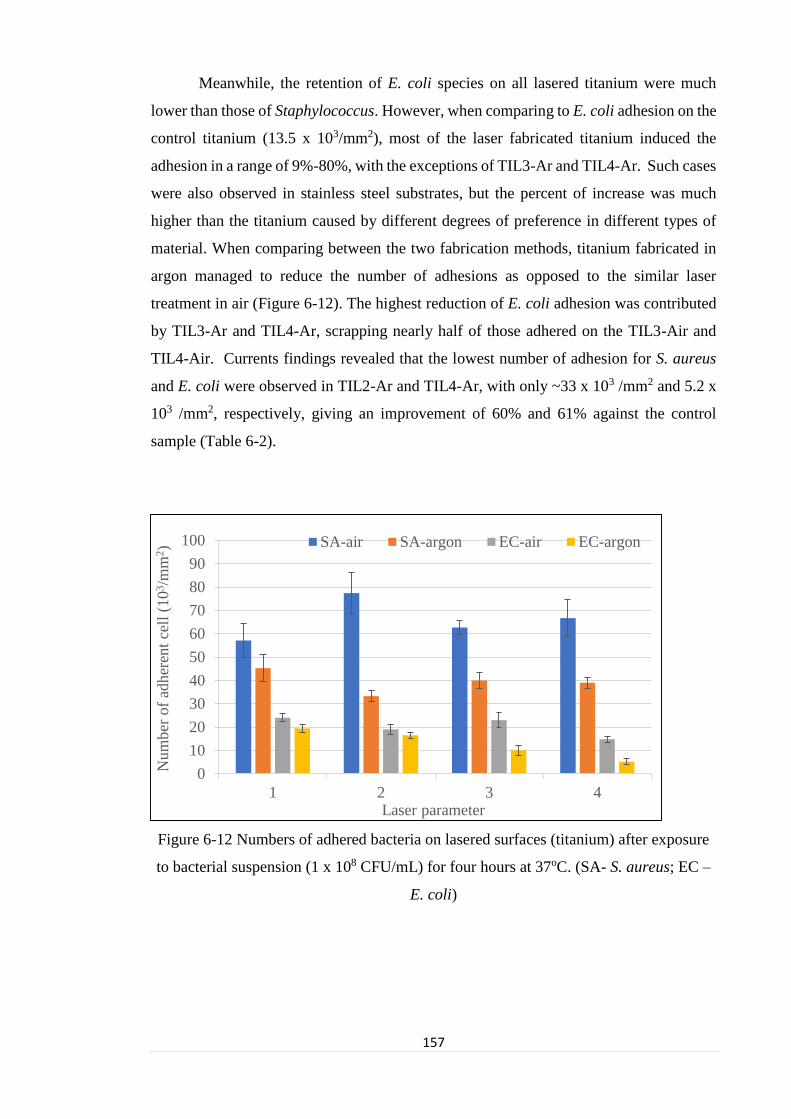
157
Meanwhile, the retention of E. coli species on all lasered titanium were much
lower than those of Staphylococcus. However, when comparing to E. coli adhesion on the
control titanium (13.5 x 10³/mm2), most of the laser fabricated titanium induced the
adhesion in a range of 9%-80%, with the exceptions of TIL3-Ar and TIL4-Ar. Such cases
were also observed in stainless steel substrates, but the percent of increase was much
higher than the titanium caused by different degrees of preference in different types of
material. When comparing between the two fabrication methods, titanium fabricated in
argon managed to reduce the number of adhesions as opposed to the similar laser
treatment in air (Figure 6-12). The highest reduction of E. coli adhesion was contributed
by TIL3-Ar and TIL4-Ar, scrapping nearly half of those adhered on the TIL3-Air and
TIL4-Air. Currents findings revealed that the lowest number of adhesion for S. aureus
and E. coli were observed in TIL2-Ar and TIL4-Ar, with only ~33 x 103 /mm2 and 5.2 x
103 /mm2, respectively, giving an improvement of 60% and 61% against the control
sample (Table 6-2).
Figure 6-12 Numbers of adhered bacteria on lasered surfaces (titanium) after exposure
to bacterial suspension (1 x 10⁸ CFU/mL) for four hours at 37oC. (SA- S. aureus; EC –
E. coli)
0
10
20
30
40
50
60
70
80
90
100
1 2 3 4
Num
ber
of
adher
ent
cell
(10
3/m
m2)
Laser parameter
SA-air SA-argon EC-air EC-argon

158
Table 6-5 Data of bacterial adhesion for control and laser Specimen (titanium)
T CA
(o)
Sa
m)
Sq
(m) Ssk
Sku
Sds (1mm2) S. aureus
(103/mm2)
E. coli
(103/mm2)
TIC 65.77 0.05 0.08 -0.10 20.36 13000 82.6 13.5
TIL1-Air 134.2 0.66 0.80 1.88 4.65 19000 57.1 24.0
TIL2-Air 104.7 0.19 0.25 0.25 4.79 26700 77.4 19.0
TIL3-Air 130.2 0.22 0.29 0.20 4.02 26800 62.7 23.0
TIL4-Air 101.1 0.07 0.09 0.41 4.79 23600 66.7 14.7
TIL1-Ar 135.8 0.52 0.60 -0.60 6.99 24800 45.2 19.4
TIL2-Ar 131.6 0.19 0.24 -0.03 4.48 26600 33.3 16.5
TIL3-Ar 141.8 0.19 0.24 -0.12 3.65 27200 40.0 10.0
TIL4-Ar 102.8 0.07 0.01 -0.18 4.13 24300 39.0 5.2
All data are represented as average taken from three replications

159
6.6 Discussion on the effect of modified properties towards bacterial adhesion
Laser treatment with the parameters summarised in Table 6-5 had significantly
modified the properties of both stainless steel and titanium. Overall, these treatments
increased the roughness (0.07-0.66 m), CAM (>d101.1o-141.8o), and the summit density
of the hybrid parameter (23000 -27200/mm2) as opposed to the SS control (CA = 70.49o,
Sa = 0.07m, Sds = 17600/mm2) and TI (CA = 65.77o, Sa = 0.05 m, Sds = 13000/mm2).
Any surface with CA > 70o were considered hydrophobic [64, 91, 160], therefore, the
control surfaces for both stainless steel and titanium were considered as slightly
hydrophilic. When comparing between the control surfaces of these two metals, the
adhesion of S. aureus (158.3 x 10³/mm2) and E. coli (14.5 x 10³/mm2), showed higher
retention onto stainless steel, with a significant difference observed in S. aureus (p < 0.05)
(Table 6-6). The CA of the stainless steel was more hydrophobic than titanium, thus
attracting more cells to the surface and securing the adhesion. Although both species
showed a preference towards stainless steel, the difference between the number of
adhered bacteria was very significant (p < 0.05). This finding aligned with the general
rule where hydrophobic bacteria (S. aureus) were better colonisers than hydrophilic
species (E. coli), thus adhering best on hydrophobic surfaces [64]. Besides that,
hydrophobic-hydrophobic interaction had attracted S. aureus and contributed to the
largest number that colonised the control surface (SS). Alam and Balani [91]reported that
adhesion of S. aureus onto stainless steel surfaces (CAM = 48.7o) was stronger than on
titanium (68.8o) with relatively similar roughness (Sa = 0.22 m–0.29 m), retaining
more S. aureus on the SS surface. The force needed to remove S. aureus from the SS
using AFM cantilever was 15.21 mN giving a pull distance of 425 nm, which was
significantly higher than on titanium. S. aureus bonding with the surface was established
within seconds–hours after contact with the surfaces, thereby preventing detachment from
shear. A similar finding was observed for the metals that have undergone laser treatment,
where the number of bacterial adhesions differed significantly from metal to metal,
fabrications and strains. The total numbers of adhered bacteria in the four laser surfaces
(Surface 1-4) with respect to air and argon exposure are summarised as follows (Table
6-6).

160
Table 6-6 Summations of bacteria in all process with respect to metal
Fabrication/Metal S. aureus (103/mm2) E. coli (103/mm2)
Polished
(Mirror)
Stainless steel 158.1 + 7.5 14.5 + 2.1
Titanium 82.6 + 4.6 13.5 + 1.9
Air Stainless steel 232.7 + 5.4 104.9 + 4.6
Titanium 263.9 + 4.3 80.7 + 2.1
Argon Stainless steel 90.7 + 3.5 54.2 + 4.1
Titanium 157.5 + 2.1 51.1 + 3.2
The mechanism for bacterial adhesion works differently with different types of
bacteria or surfaces [161]. The current findings produced almost similar trends with
previous data following femtosecond laser fabrication. Chik et al. (2018) reported that S.
aureus and E. coli provided opposite trends towards adherence preference on different
metal surfaces. Previous findings showed that higher E. coli retention was observed on
titanium, while S. aureus was attracted towards stainless steel surfaces, with respect to
similar fabrication methods. Following the laser modification in air and argon, more S.
aureus was recorded on the titanium surfaces compared to stainless steel, with an increase
of between 14% to ~ 98% (Table 6-6). In contradiction with S. aureus, E. coli showed a
preference towards stainless steel surfaces in both fabrication methods, however the
differences were relatively low, between 6%–25% (Table 6-5). It is noteworthy that even
though the repulsion ability of the SS (SSL-Air) with respect to the control surface was
quantitatively higher than TI that has undergone a similar process, the average number of
the attached bacteria counted on the surface remained relatively equivalent for both
metals. Adhered S. aureus cells marked between 42 x 103/mm2 – 65 x 103/mm2 and 57 x
103/mm2 - 77 x 103/mm2 for stainless steel and titanium, respectively, showing that a
significant difference between these surfaces was not observed. However, a marked
reduction of retained S. aureus relative to control surface/SSL-Air/TiL-Air provided
significant differences between treatment methods (p < 0.05) for both metal surfaces that
have undergone laser-argon fabrication. The drastic changes in the adhesion numbers
were probably contributed by the differences in surface chemistry (not evaluated), and
the skewness of the surface, since the other parameters, i.e Sa, Sq, Sds and CA were not
significantly different. Surface chemistry and/or atomic ordering had a very strong
influence on the magnitude of adhesion for a surface with roughness below submicron

161
level, while highly coarse surfaces were dictated by the degree of Sa [162]. Oxidation of
the SSL and TIL fabricated in air might have increased biocompatibility of the bacteria
with the surfaces, thus increasing the adhesion.
To search for the hidden details regarding the contribution of the modified surface
properties towards reducing the bacterial adhesion, an assessment of the S. aureus on
stainless steel was discussed in detail to explain the underlying phenomenon. The
hydrophobicity was long thought to be the driving factor that encouraged the preliminary
adhesion between bacterial and inert surfaces. Being the dominant factor, this property
was assessed to search for reasons how the adhesion mechanism worked out after any
surface modifications. According to the Katsikogianni [163], surface hydrophobicity had
a superior impact than the CSH of the bacteria in determining the adhesion mechanism
and magnitude. The current study revealed both properties works synergistically and
affecting the adhesion. Referring to Table 6-4, SSL-02-Air and SSL-03-Air, both have
nearly similar Sa and Sds but different CA. Owing to the high scanning rate (50 mm/s),
the wettability of SSL-02-Air (CAM = 104.4o) increased thus retaining more S. aureus
(65.0 x 10³/mm2) than in SSL-03-Air (42.0 x 10³/mm2, CAM = 138.8o) (Rajab et al.,
2018). Referring to similar metals, the adhesion of E. coli was much lower than S. aureus,
contributing to more than 40% differences, owing to its hydrophilic properties which
naturally made it appear as a less adhesive strain, but can pose a stronger bond than the
hydrophobic-hydrophobic interaction after prolonged incubation.
A modification of the metal surfaces has been reported following treatment with
microsecond, nanosecond, femtosecond, and picosecond lasers using various parameters
to achieve either more hydrophobic or hydrophilic surfaces Cunha, Elie [54], Bagherifard,
Hickey [164], Rajab F. [165]. Treatment with picosecond laser produces hydrophobic SS
surfaces with CA between 99.6o – 160.0o and Sa in a range of 0.02 mm – 1.16 mm Rajab
F. [165]. Exposure to E. coli suspension followed by a washing step reduced the number
of retained bacteria on all modified surfaces relative to polished SS (control). They also
reported that a surface with CA = 154o and Sa = 1.16 m, encouraged the highest
detachment of E. coli with only 4.2 x 10⁴/cm2 retained on the surface, while polished
surfaces showed the greatest number of bacteria (1.1 x 10⁴/cm2), thus concluding that the
superhydrophobic surfaces was not always effective to prevent bacterial adhesion.

162
The ability of the lasered surface to repel S. aureus might be contributed by the
reduced wettability. After laser fabrication, all surfaces exhibited higher hydrophobicity
with high surface roughness compared to polished surfaces, but in varying degrees.
Increasing the hydrophobicity of the surface would attract more cells due to the
hydrophobic-hydrophobic interaction, but the adhesion force was jeopardised, therefore
resulting in lower cells remaining on the surface. The higher wettability of the control SS
and TI (CA < 75o) encouraged a stronger bonding of the bacteria with the surface, thus
retaining more cells on the surfaces after four-hour exposure to bacterial suspension. In
addition, the increase in roughness of all the lasered surfaces for both SS and TI but no
greater than the size of the S. aureus (< 0.6 m), presumably was a strong factor that
contributed towards repelling the adhesion. Increased roughness without exceeding the
size of the bacteria is beneficial for reducing the adhesion. This was achieved because the
contact area/point between the bacteria and the original surfaces was reduced which made
the adhered cells susceptible. The loosely bound cells can be easily removed with minimal
force by shear stress.
The adhesion of bacteria on stainless steel materials has been studied with many
reporting a positive correlation between bacterial hydrophobicity with increased degree
of adhesion. The adhesion on the hydrophobic stainless steel was governed by the
hydrophobicity of the bacteria and will increase with increased CSH of the individual
strain within the S. aureus group [166]. In order to reduce adhesion of hydrophobic
bacteria on the hydrophobic surfaces, a modification of the surface must be carried out to
increase the surface properties to superhydrophobic level. These results suggested that
when super hydrophobicity was achieved after the laser treatment, the surface may have
worked as self-cleaning surface where it prevented water from sticking to the surface.
The water was presumably rolled on the surface, thus preventing the nutrients from
reaching the adhered bacteria, subsequently reducing the rate of growth. The water rolling
effect also prevented the bacteria from reaching the surface, thus preventing adhesion.
Besides that, there is the possibility that the additional surfaces and grooves of the 3D
features have triggered the trapping of air between its nano peaks, thereby reducing the
contact area between the bacteria and the surfaces.

163
The current finding revealed that the attachment of E. coli in all titanium surfaces
was higher than the control process. Recent data suggested that the adhesion of E. coli
increased in all surfaces with SaL > SaP, except for TL3-Ar and TL4-Ar. Increase of
adhesion in E. coli was also reported by many authors due to roughened surfaces, where
cells begin their attachment at the textured surface Rajab F. [165] Almaguer-Flores A. [162]
reported that reduced roughness to a size lower than the bacteria size was beneficial for
decreasing adhesion while the ratio of roughness: bacterial size > 1 will facilitate the
adhesion process. In addition, a high surface roughness to few micrometres away would
enhance the adhesion of bacteria Braem, Mellaert [167] due to i) additional effective
surface area for securing adhesion, ii) 3D features providing protection towards
detachment by external forces and iii) the non-regularities of the surface i.e. crack and
grooves will act as sinks to entrap the bacteria within its cavities. Some authors reported
that roughness plays an important role to control adhesion, but it works differently with
different strain types and bacteria shape [64]. Increased surface roughness generally
enhances the bacterial adhesion, while roughness less than 400 nm reduced the adhesion
of S. aureus, B. cereus, E. coli and P. aeruginosa. Adhesion of E. coli and S. aureus on
nano surfaces of titanium with controlled roughness Sq = 2.3 nm–6.1 nm provided a
contradictory trend towards adhesion [168]. The number of adhered E. coli increased
proportionally with surface roughness, while S. aureus declined gradually with increasing
nanometre roughness. Braem, Mellaert [167] reported that S. aureus adhesion was
facilitated when Sa ranged between 5–8 m, far exceeding the adhesion on the polished
surface with Sa = 30 nm. In contrast, Ludecke C. [168] found that the greatest number of
S. aureus adhesion was achieved with a polished surface with Sa = 2 nm.
Sa values higher than the size of the bacteria might facilitate the adhesion by
providing protection towards shear stress, especially for bacteria located at the grooves
and the valleys of the microstructures. According to Ortega MP [169] the surface
roughness does not affect the adhesion of the E. coli on the stainless steel (Sa = 0.14-1.37
m), but is highly influential for securing adhesion when external force was applied
during rinsing. The ability to retain the adhered bacteria was contributed by the surface
with highest surface roughness where the peak served as a shield to prevent the cell from
detachment. In agreement with the findings, De Giorgi, Furlan [170] also reported that E.
coli retention on stainless steel AISI 304 was the lowest with the smoothest surface (Sa=
34 nm) attained using laser micro-polishing. The current study revealed that Sa less than

164
sub-micro-meter and negatively skewed surfaces has successfully prevented the adhesion
of S. aureus in SS and TI fabricated in argon, thus depicting a reduction of bacteria on its
surface relative to control surfaces (Table 6-4 and Table 6-5).
Decreased adhesion of E. coli onto TL3-Ar was presumably contributed by the
high CA (141.8o) while the TL4-Ar (CA= 102.8o, Sa = 0.07 m, Sds = 24300/mm2) could
be coming from the synergistic effect of a higher hybrid area, with reduced roughness and
increased CA (discussed later). However, when comparing the surface characteristics for
the same metal treated in air (TL4-Air, CA= 101.1o, Sa = 0.07 m, Sds = 24800/mm2),
the adhesion of E. coli increased by 10% compared to the control titanium. With almost
similar properties, the possibility of reduced adhesion achieved in TL4-Ar was most
likely to be enhanced because of the different chemical compositions. Reduced oxidation
for samples fabricated in argon might have reduced the attraction towards the surfaces.
Cunha, Elie [54] reported that an oxidised layer was observed in a SS surface after
undergoing femtosecond laser fabrication which might facilitate the adhesion. In contrast,
De Giorgi, Furlan [170] reported that significant changes in surface chemistry were not
observed for lasered titanium exposed to nitrogen at different power levels, P = 0.14–0.47
mJ, where oxidation had been successfully suppressed. In this case, the oxidation of metal
fabricated in argon had been successfully controlled thereby suppressing the bacterial
adhesion compared to the metal treated in air. In the current study, it was expected that
changes in chemical surface properties between air and argon-laser fabrication were
significant enough to control the adhesion mechanism for both S. aureus and E. coli.
When comparing laser fabrication regarding exposure to air and argon that
affected the rate of adhesion, the discussion was focused on the contribution of the oxide
layer. The probability of the TI metal to change to TiO, TiO2 or Ti2O3 upon exposure to
air during laser treatment was very high, but unfortunately not covered in this study. A
study by Shiau [100] proved that titanium implants undergoing the oxygen-plasma ion
immersion managed to increase the clotting of blood responses whilst hindering the
adhesion of Streptococcus mutans due to the presence of a TiO2 layer. The increased
negativity value of the TiO2 layer promotes repulsion of the bulk properties of S. mutans
due to electrostatic repulsion between similar charges of the two surfaces. Exposure to
nitrogen results in the formation of nitride on titanium surfaces, which increased

165
resistance towards bacterial adhesion [171]. Works by Cunha, Elie [54] confirmed that
femtosecond laser irradiation in air altered the surface chemistry of the LIPSS, by
thickening the oxide layer with TiO2 while reducing the portions of Ti2O3 relative to a
polished sample. The effects of an oxide layer partly increased the anti-bacterial
properties of the modified surfaces and roughness was claimed to be the primary factor
for reduced adhesion.
6.7 Viewing the adhesion patterns using SEM
The results presented in section 6.5 and section 6.6 revealed promising data on
the ability of the lasered surface to reduce the adhesion of S. aureus and E. coli in both
stainless steel and titanium. Bohinc [64] and the reference therein mentioned that the
ability of the surfaces to remove more than 60% of the bacteria was often termed as self-
cleaning surfaces and would draw much interest in the commercial scale. Apart from
quantitative analysis (determination of the adhered cell), it is important to examine how
these bacteria positioned themselves on the fabricated surfaces before any correlation
with the surface properties, particularly the surface topographies and CAM can be
derived. Figure 6-13 to Figure 6-16 show the adhesion of S. aureus on the lasered surfaces
at various spots on stainless steel and titanium metals, while Figure 6-17 to Figure 6-20
depicts the images for E. coli. It was speculated that bacterial cells actively choose the
initial position to settle on the smoother surface rather than spatially organised contour
lines, while avoiding the area with protruding nano-meter grains. By rough estimation,
the density of bacteria per square area was often 5-15% higher than the bacteria settling
on the LIPSS. Focusing on the LIPSS area, generally both bacteria prefer to find their
best spots at the valley/crevices between two macro-topographies, which was extensively
observed for the E. coli (Figure 6-17 to Figure 6-20). The flat area of the valley may
provide the maximum contact point with the surfaces, where the bacteria established
contact with the surface, while providing protection from hydrodynamic forces due to
hydrodynamic force [64, 122].

166
In general, the presence of the textured surface, for both stainless steel and
titanium altered the behaviour of the S. aureus. When referring to Figure 6-13 (a) and
Figure 6-15 (a), it can be clearly seen that the unstructured surfaces allowed the formation
of clusters, where the bacteria attached closely to each other forming a group of cells of
more than 20 after 4 hours of exposure to bacterial suspension. This was a common view
in most of the stainless steel and titanium fabricated in air in all four laser parameters.
However, large cell clusters were almost absent in all stainless and titanium surfaces
fabricated in argon (Figure 6-14 and Figure 6-16), replaced by either individuals/pairs or
by smaller groups or clusters of less than 10 ten cells. Apart from that, it is best to
emphasise that the textured surface might prevent the formation of cell clusters in both
air and argon fabrication. In all eight stainless steel surfaces, the presence of cell clusters
was not detected, replaced by a small number of cells attached onto the micro-
topographies and onto individual contour lines. Quite often, but not always, S. aureus
attached individually or in pairs and located themselves on top of the contour lines. It is
believed than the topographies played an important role that forbids cell to cell
communication, thus eliminating the formation of cell clusters. Other than that, owing to
its size, shape and super-adhesive membrane structure, the attachment of S. aureus was
not limited to valleys and crevices, in fact, it can easily position itself at any location on
the structured area. The steepness of the convex micro-surfaces does not prevent the
attachment of cells, where cells adhered easily on single or two contour line(s), as
depicted in Figure 6-13 (c) and Figure 6-15 (d) and securing themselves from detachment.
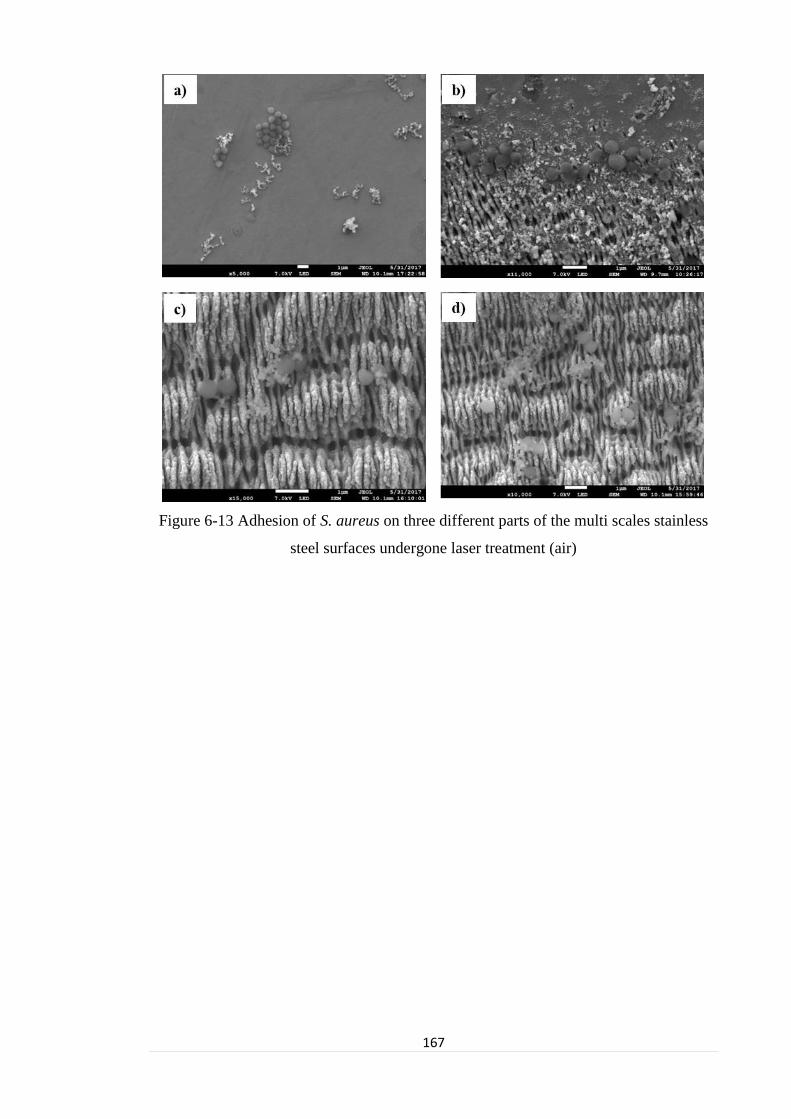
167
Figure 6-13 Adhesion of S. aureus on three different parts of the multi scales stainless
steel surfaces undergone laser treatment (air)

168
Figure 6-14 Adhesion of S. aureus on three different parts of the multi scales stainless
steel surfaces undergone laser treatment (argon)
Figure 6-15 Adhesion of S. aureus on three different parts of the multi scales titanium
surfaces undergone laser treatment in (air)

169
Figure 6-16 Adhesion of S. aureus on three different parts of the multi scales titanium
surfaces undergone laser treatment in (argon).
Being a slow biofilm former, retention of E. coli on the lasered surfaced was very
few and difficult to observe. Cells appeared individually with no sign of the formation of
cell clusters (Figure 6-17 to Figure 6-20). No distinguished features were observed in the
E. coli adhesion pattern between either two different metals or two different treatments.
However, it was interesting to note that the adhesion of E. coli on the structured surface
might have been prevented due to various factors. Firstly, the size and the shape of E. coli
limits the contact point with the surface owing to the multi-contours, multi-size, and multi
steepness of the surfaces. Referring to Figure 6-17 (b & c) Figure 6-18 (c), E. coli tends
to position themselves by intersecting with the contour lines, where maximum contact
area can be attained. This arrangement is the best position as E. coli seems to avoid the
multiple heights variations, if they aligned their position parallel to contour lines. The
waviness and the multiple steepness of the individual lines on the laser direction may
limit the contact point as well as the strength (adhesion force). It was speculated that the
E. coli will avoid multi contour areas and would prefer to position themselves on the

170
flattened surface, as it will provide a maximum contact area, although it would not
guarantee the detaching effect due to hydrodynamic forces. In all SEM images, there was
no E. coli adhering onto the contour lines in the laser direction observed in this study in
all samples. The intersecting positioning of E. coli on the LIPSS area was observed in all
SS and titanium, irrespective of the exposure towards air and argon.
Cracks, non-regular surface and grooves have been widely reported to attract more
cells compared to flat surfaces [64]. Adhesion of the bacteria on the structured section of
the surfaces often takes place within the valley of the LIPSS and also depending on the
size and shapes of the bacteria. The coccoidal shapes of S. aureus with submicron sizes
enables the bacteria to securely adhere to the grooves of the LIPSS (Figure 6-1). The
presence of the valley serves as a basin which trap the bacteria, thus providing additional
protection from shear stress while strengthening the bonding. It is interesting to mention
that very often S. aureus appeared either individually or in a small number of cells (less
than five) in all SSL and TIL fabricated in argon. Besides that, S. aureus was also
observed on top of the microgrooves and scattered on the LIPSS. The crucial important
feature of the LIPSS is that it might prevent the proliferation of the adhered bacteria,
because it might cause certain damage to the cells, therefore preventing further formation
of the biofilms. Meanwhile, the smooth surfaces at the unstructured area (Figure 6-13)
allowed S. aureus to form big clusters/colonies (within 20-50 cells), thus maintaining the
rigidity and survival rate of the bacteria species. Smaller colonies of S. aureus were also
observed at the boundary layers due to increased roughness of the surfaces, where
particles of molten metal grains were marked on the smooth unstructured location.
It is interesting to note that the formation of big colonies of S. aureus on all four
types of stainless steel fabricated in argon was arrested, in both structured and
unstructured areas. In SSL-Ar and TIL-Ar, cells attached either individually or less than
5 cells at the same spots, and the reason for this behaviour was not explored. When the
number of adhered bacteria were counted based on the adhesion on structured and
unstructured areas, the domination was obvious in the unstructured surfaces, showing an
increase of 5-20% higher than cells in the LIPSS area. The ability to expel adhesion was
enhanced with LIPSS in both air and argon fabrication. The presence of cell clusters was
negligible, replaced by small numbers of cells attached onto the micro-topographies and

171
onto individual contour lines. Quite often, but not always, S. aureus attached individually
or in pairs, and located themselves on top of the contour lines. It is believed than the
topographies played an important role that forbids cell to cell communication, thus
eliminating the formation of cell clusters. Other than that, owing to its size, shape and
super-adhesive membrane structure, the attachment of S. aureus was not limited to valley
and crevices, in fact, it can easily position itself at any location on the structured area.
The steepness of the convex micro-surfaces does not prevent the attachment of cells,
where cells adhered easily on single or two contour line(s), as depicted in Figure 6-13 (c)
Figure 6-14 (d) and securing themselves from detachment.
Figure 6-17 Adhesion of E. coli on three different parts of the multi scales stainless steel
surfaces undergone laser treatment (air)

172
Figure 6-18 Adhesion of E. coli on three different parts of the multi scales stainless steel
surfaces undergone laser treatment (argon)
a) b)
c) d)

173
Figure 6-19 Adhesion of E. coli on three different parts of the multi scales titanium
surfaces undergone laser treatment (air)
Figure 6-20 Adhesion of E. coli on three different parts of the multi scales titanium
surfaces undergone laser treatment (argon)
a) b)
c) d)
a) b)
c) d)

174
Figure 6-21 Formation of cells clusters by S. aureus on the unstructured area of a) SS
and b) TI fabricated in air.
Preliminary works by Epperlein, Menzel [161] reported the LIPSS of stainless
steel facilitated the adhesion of S. aureus within 3 hours of exposure, with a denser
population observed on the LIPSS area than the unmodified area. In contrast to S. aureus,
the E. coli adhesion was successfully prevented, where more cells were retained on the
unmodified surfaces. The reduction was partly contributed by its rod shape, which
increased the difficulty to position itself on the LIPSS structure, thus reducing the
adhesion. Referring to fluorescence images in Figure 6-22, the LIPSS for SSL-02-Ar and
TIL4-Ar repelled the adhesion of both S. aureus and E. coli, where a denser population
was observed on the unstructured area. This presented a 5-15% reduction of bacteria
settling on the LIPSS against the unstructured area in most of the lasered metal, but the
results were not statistically significant (data not shown).
a) b
)

175
Figure 6-22 Fluorescence images of S. aureus on the SSL-02-Ar (a-b) and E. coli on the
TIL4-Ar (c-d) showing more cells were retained on the unstructured area than the LIPSS.
A thorough observation of the close-up images on the bacterial shape in Figure
6-23, show clear evidence that the micro and nanostructures of the LIPSS were effective
in deforming the bacterial membrane structures. The malformed membrane cells
probably occurred because of the sharp contours of the LIPSS, which ruptured and lysed
the cells, causing the leaking of the cell components. If this continues, the cells will lose
the ability to reproduce and subsequently leads to death. It is presumed that the brushing
effect between the cells and the surface due to hydrodynamic forces increased the chance
of membrane deformation. It is very clear that the effect of nano grains on the LIPPS were
more severe for the rod shaped bacteria, E. coli rather than S. aureus (Figure 6-23). This
could be attributed to the very thin peptidoglycan of the Gram-negative bacteria; thus it
can easily disrupt the outer membrane causing the leakage of the cell components and
shrinking the cell envelope. However, the effects were less pronounced in the S. aureus
where the shape remained intact, which could be attributed to its thick membrane
structure. The nano-grains on the top of the LIPPS were responsible for rupturing the
membrane cells, while the variables contour of the LIPPS limited the attachment of the
both S. aureus and E. coli. The geographical limitations for aiding the adhesion were
more severe for E. coli due to its size and shape. Although the effect of nano grains was
a) b)
c) d)

176
most unlikely to disrupt the surface integrity of the S. aureus, our observations revealed
that the LIPPS were efficient for preventing colonisation thus also reducing the overall
number of the adhered cells when compared with a polished surface. Therefore, the
lasered surfaces have excellent capability to control the adhesion, growth and colonisation
of both E. coli and S. aureus in the long run.
6.8 Correlation of Wettability and Surface Topographies with Bacterial Adhesion
Surface contact angle, nano structures, and chemical composition have been
reported to be determining factors contributing to either attachment or detachment of
bacteria on solid surfaces [172]. Most authors claimed that the changes towards adhesion
magnitudes was contributed by the synergistic effect of two or more factors. It was
difficult to derive a concrete conclusion towards determining the utmost influential factor
which dictates the adhesion due to lack of information on the overall characterisation of
either bacteria or the surface properties. The current finding revealed that all 16 lasered
surfaces that have undergone significant changes in terms of surface properties relative
to the control, subsequently affected the adhesion of S. aureus and E. coli. The correlation
between surface properties were plotted using linear regression and presented in Figure
6-24 and Figure 6-25.

177
Figure 6-23 The SEM images showing the shape of S. aureus and E. coli on the structured (LIPSS) and unstructured stainless steel and
titanium fabricated in air and argon. a) Polished sample, b) S. aureus-air, c) S. aureus -argon, d) E. coli air and e) E. coli-argon

178
Figure 6-24 Correlation between CA, Sa and Sds on the adhesion of S. aureus and E.
coli on SS (a, c, and e) and TI (b, d and f) in air and argon fabrication. ( ) SA-Air, (
) SA- AR, (an ) EC-Air and ( X ) EC-AR.
R² = 0.343
R² = 0.9323
R² = 0.4744
R² = 0.69320
10
20
30
40
50
60
70
80
100 110 120 130 140
No.
bact
eria
(x
10
3/m
m2
)
CA (o)
a)
R² = 0.6288
R² = 0.8884
R² = 0.027
R² = 0.4289
0
10
20
30
40
50
60
70
80
90
90 110 130 150
No b
act
eria
(x
10
3/m
m2
)
CA (o)b)
R² = 0.0045
R² = 0.1282
R² = 0.3539
R² = 0.5153
0
10
20
30
40
50
60
70
0.05 0.15 0.25 0.35 0.45
No.
bact
eria
(x
10
3/m
m2
)
Sa (mm)
c)
R² = 0.4301
R² = 0.5972
R² = 0.483
R² = 0.6946
0
10
20
30
40
50
60
70
80
90
0 0.2 0.4 0.6 0.8
No.
bact
eria
(x
10
3/m
m2
)
Sa (mm)d)
R² = 0.0744
R² = 0.0012
R² = 0.0084
R² = 0.0769
0
10
20
30
40
50
60
70
22000 24000 26000 28000
No.b
act
eria
(x
10
3/m
m2
)
Sds (1/mm2)e)
R² = 0.4867
R² = 0.0684
R² = 0.2056
R² = 0.0205
0
10
20
30
40
50
60
70
80
90
18000 23000 28000
No.
bact
eria
(x
10
3/m
m2
)
Sds (1/mm2)f)

179
The effect of surface properties on bacterial adhesion with respect to metal types
and fabrication in air/argon were presented in Figure 6.24 and Figure 6.25. The number
of adhered S. aureus and E. coli were plotted against CA, Sa, Sds, Ssk and Sku and linear
regression was plotted to represent the data. The regression (R2) value was displayed to
indicate the accuracy of the correlation. The R2 value between 0.7 – 1.0 represented a
strong correlation, R2 = 0.50 – 0.69 for moderate, R2 = 0.3 - 0.49 for poor and R2 < 0.29
as no correlation observed with the responses. Variations in responses with correlation
between 0.04 to 1.0 was observed towards the surfaces. The correlation of adhesion with
the CA (Figure 6.24 a & b) was moderate to strongly influenced by surface wettability
within the range tested (101.1o – 141.1o). E. coli adhesion on SS and TT in air-laser
fabrication provided the strongest correlation with R2 of 0.89 and 0.93, respectively,
showing increased adhesion with increased hydrophobicity. Much lower R2 values was
observed for the E. coli responses for SSL-Ar and TL-Ar but was still moderately
correlated. On the other hand, the responses of the hydrophobic bacteria with CA was
poorly to moderately interrelated. With the exception of TTL-Ar, the adhesion of SA was
inversely correlated with increasing CA.
Surface roughness parameter was one the most important features that has been
reported to affect adhesion mechanism [54]. The effect of roughness, occasionally write-
off the influence of surface wettability, thus dictating the adhesion. Like the effect of
wettability, adhesion of E. coli increased with increasing Sa, at values below submicron
level on both SSL-Ar and TI-Ar but was moderately interrelated (R2 = 0.52 – 0.69). The
contribution of Sa and CA with respect to S. aureus adhesion onto all four surfaces
provided similar trends for both SS and TI surfaces. Interestingly, although the properties
of hybrid parameter (Sds) strongly represented and proportionally increased with
increasing surface hydrophobicity, the adhesion of both S. aureus and E. coli were
independent of this factor (Figure 6.24 e & f). With the exception of the S. aureus
adhesion onto TIL-Air, all correlation showed very low R2, thus indicating that adhesion
was not affected by the values of summit density (Sds) for surfaces.

180
Skewness contributed towards adhesion of S. aureus on SSL and TIL fabricated
in Argon, with R2 = > 0.80, showing a strong correlation existed between the number of
adhered bacteria and Ssk. The skewness of the metal differed significantly with respect
to the fabrication method. Air fabrication produced positively skewed surfaces, while
argon fabrication was negatively skewed for both SS and TI. In conjunction with Sa <
bacteria size, the increase of pitting on the surface reduced the adhesion while the shorter
peak height does not provide protection from hydrodynamic forces. The other possibility
was that the S. aureus adhesion on the contour surface was weakened (comparative to SS
control) because surface-bacteria contact area was reduced, thereby decreasing the
adhesion. Focusing on the surface with skewness < 0, it was shown that the ability of the
surface to repel adhesion (SA-Ar) was more pronounced with reducing Ssk negativity
(Figure 6.25 a & b).
Surface kurtosis for TIL in argon provided the highest correlation with S. aureus
adhesion. The S. aureus indicated that the adhered cell proportionally increased with
increasing Sku in both SSL and TIL, with the highest regression achieved with the latter.
It is interesting to note that the correlation adhesion of both S. aureus and E. coli with all
parameters studied, were either poorly correlated or independently related for all surfaces
fabricated in air. On the other hand, adhesion onto surfaces fabricated in Argon produced
a moderate to strong correlation with surface topographies especially for the S. aureus.
This finding might support the hypothesis that the adhesion may not only be affected by
the surface topography but also by the chemical surface composition. A strong correlation
was produced and might have suggested that in Argon fabrication, the foundation of
adhesion was based on the changes of topographies, with no implication/synergistic effect
arising from the differences with respect to chemical compositions. However, the
adhesion of E. coli was too complicated to be discussed thoroughly presumably because
the bacteria employed a different mechanism (in comparison with S. aureus) arising from
the hydrophobic-hydrophilic interaction which often induced repulsion towards the
adhesion mechanism (E. coli-hydrophilic, SSL/TIL- hydrophobic).

181
Figure 6-25 Correlation between Ssk and Sku on the adhesion of S. aureus and E. coli
on SS (a and b) and TI (c and d) in air and argon fabrication. ( ) SA-Air, ( ) SA-
AR, (an ) EC -Air and ( X ) EC-AR. R2 > 0.7 indicated strong correlation, R2 = 0.5 –
0.69 represented moderate correlation and R2 = 0.49 – 0.3 poorly correlated and R2 <
0.29 provided no correlation.
R² = 0.0046
R² = 0.0093
R² = 0.9582
R² = 0.77560
10
20
30
40
50
60
70
-0.5 0 0.5 1
No
. b
acte
ria
(x 1
03/m
m2)
Ssk
R² = 0.4733
R² = 0.2616
R² = 0.8067
R² = 0.24290
10
20
30
40
50
60
70
80
90
-1 0 1 2
No
. b
acte
ria
(x 1
03/m
m2)
Ssk
R² = 0.1386
R² = 0.039
R² = 0.3543
R² = 0.5083
0
10
20
30
40
50
60
70
2 3 4 5 6
No
. b
acte
ria
(x 1
03/m
m2)
Sku
R² = 0.1584
R² = 0.3358
R² = 1
R² = 0.5686
0
10
20
30
40
50
60
70
80
90
0 2 4 6 8
No
. b
acte
ria
(x 1
03/m
m2)
Skuc) d)
))
a) b)
)
Stainless-steel Titanium
182
6.9 Chapter Summary
Toward minimising the bacterial colonisation of surfaces, this chapter presented
a laser fabrication technique that not only produced a surface with micro- and nano-scale
roughness, but also a slight change towards surface composition that was able to change
the rate of adhesion of both S. aureus and E. coli. Such a multi-scale surface (LIPSS)
topography exhibited enhanced antibacterial effect against a range of pathogens, both
from Gram-positive and Gram-negative types. This chapter showed that the laser
fabrication managed to reduce the adherence of S. aureus on the control sample by more
than 50% compared to control. The lowest adhesion was attained with SSL-Ar with
retained bacteria of 17.0 x 10³/mm2, depicting the lowest value for S. aureus throughout
the study. SS and TI that underwent laser parameter 4 in argon showed a reduced
biocompatibility of E. coli with the surface. It was presumably contributed by the LIPSS
surface, where the impact for multi-height variation was reduced, and the protruding
nanograins increased resistance for the adhesion, thereby preventing the bacteria from
retaining on the surface. This contributed to the lowest E. coli adhesion on the all metal
surfaces tested (including with polished and WEDM samples), with only 3.3 x 10³/mm2
retained on the surface.

183
Conclusions and Recommendations
7.1 Conclusions
The aims of this research were to study the effect of surface topography
parameters (with respect to its modified properties) towards the surface wettability and
bacterial adhesion of Gram-positive and Gram-negative bacteria. To achieve a surface
with the ability to influence wettability and suppressing bacterial adhesion, a deep
understanding of the behaviour of the bacteria needs to be addressed prior to commencing
work. Therefore, the study involved three important scopes, i) bacterial characterisations,
ii) surface fabrication and characterisation and iii) adhesion study and analysis of the
contributing factors.
The first part of the research was focused on evaluating the behaviours of the
selected bacteria when exposed to inert surfaces. A preliminary study involved the
selection and partial characterisation of the bacteria, where CSH, Gram types, surface
charge, sizes and shapes were determined prior to adhesion work. The study was carefully
aligned to observe the responses of bacteria towards adhesion, where changes in bacterial
surface properties were determined beforehand. Three types of bacteria were used, two
Gram-positive (S. aureus and B. subtilis) and E. coli (Gram-negative). The adhesion was
studied on glass substrates and the effects of exposure time; cell density bacterial age was
successfully explored and a correlation between affinity towards adhesion was assessed.
Adhesion on glass provided an insight that adhesion behaviour was contributed by the
properties of the bacteria and can largely influence the adhesion, before taking an effect
from the substrate's properties. The information gathered in this part was compared with
adhesion on metallic surfaces.

184
The second part involved the selection of surface fabrication techniques to
produce metallic samples (Stainless steel 316L and titanium Ti6Al4V) with micro and
sub-micro roughness. Grinding method (polished), wired electro-erosive discharge
machine (WEDM) and laser-assisted techniques were chosen to produce the surfaces of
interest. Utilising simple mechanical polishing by grinding with different grit paper
produced hydrophilic surfaces with sub-micron sizes, displaying Sa between 0.10 to
0.20µm. Meanwhile, WEDM fabrication was carried out by varying the machine feed
rate (10 mm/min - 22 mm/min), producing mild hydrophobic to hydrophobic surfaces and
Sa between 2.00 to 4.00 µm. When femtosecond laser was used, the parameter process
was varied in terms of power, scan speed and number of repetitions, and textural surfaces
with nanograins were produced. The roughness of the surface for SSL and TIL ranged
between 0.01 - 0.66 µm, with increased wettability, higher than the previous two methods.
Therefore, the study tested the behaviour of the surface with Sa from 0.01 to 4.00 um with
the different machine approaches. Without limiting Sa values, the fabrication approach
also produced two types of surfaces, surface with dominant lay (Str approaches 1) and
surfaces with isotropic texture (Str approaching 0).
The third part of the study was to identify the degree of correlation between the
surface parameters (Sa, Sku, Ssk, Sal, Sdq, Str, Sdr and Sds) with water contact towards
the number of cells attached to the modified surfaces. In previous studies, Sa was
considered as the main influential parameter towards hydrophobicity. However, we
unexpectedly we found that summit density showed a strong correlation for all fabrication
techniques (polished, WEDM and Laser-assisted).
Polished specimens showed a strong correlation with Sa, Sal and Sds. As reported
in Chapter 5, the surfaces of polished specimens were flattened with negative skewed
distribution and higher Sds values. For WEDM, all parameters showed moderate and poor
correlation except Sds with a strong correlation for both metals’ specimens. But the value
of Sds was relatively lower compared to the polished specimen. Therefore, the influential
factor contribution may come from the surface roughness. And finally, for the third
technique, laser-assisted showed a high correlation with Sds for both metals treated with
185
Air and Argon gas. Therefore, it was evident in this study that summit density played an
important role towards the hydrophobicity of the metallic surfaces with respect to the
structure of the surfaces (smooth and rough).
The adhesion study on the metallic surfaces that underwent polishing, WEDM
and laser-assisted techniques were compared with the adhesion onto mirror-finish-
polished stainless steel (SSC) and titanium (TIP). Following a similar fabrication process,
the adhesions of most bacterial species on the SS were much higher than those on
titanium. Most of the polished and WEDM surfaces managed to reduce the adhesion of
S. aureus but failed to produce any significant effects on the E. coli adhesion. Instead,
more E. coli were retained on all stainless steel and titanium surfaces that underwent
polishing and WEDM as opposed to controlling. Meanwhile, B. subtilis adhesion was
varied, where some surfaces reduced the adhesion while other promoted more cell
attachment. The study on these two fabrication methods revealed that S. aureus
contributed to the highest population, followed by B. subtilis and E. coli. This was true
for most SSP, TIP, SSE and TIE surfaces.
Failure to remove E. coli in the previous two methods was continuously
investigated using metallic surfaces that have undergone the laser-assisted technique. At
this stage, the study of B. subtilis was omitted since investigation on Gram-positive
bacteria can be carried out with S. aureus alone. From previous findings, it was speculated
that the effect from oxidised surfaces controlled the adhesion, resulting in poor control
towards adhesion. Moreover, oxidised surfaces reduced the consequences from varying
surface properties. i.e. CA, SA, Ssk and Sku showing very poor correlations with several
adhered bacteria. Thereby, two types of fabrication methods were proposed in the study,
i) Air fabrication and ii) Argon fabrication. The use of Argon gas as a shielding gas was
proposed to cease the formation of an oxidation layer and successfully controlled the
adhesion by augmenting other parameters that affected the bacterial behaviour.

186
The ability of TIL-Ar to suppress adhesion was contributed by the textural LIPSS
organisation, where the gap between individual contours lines reduced the contact point
of the bacteria and surfaces, minimising adhesion strength, thereby encouraging bacterial
detachment from the surface. However, the gap width must be maximised but must not
exceed the size/diameter of the bacteria to prevent the trapping of bacteria especially for
E. coli species. Viewing with SEM confirmed that the grooves or valleys trapped the
bacteria and protects them against detachment, thus initiating the colonisation of bacteria.
This problem was eliminated when the scan speed was increased to 50 mm/s whilst
maintaining the laser power at 120 mW, as in SSL2-TIL2 and SSL4-TIL4 where the
number of E. coli retained on the surface was reduced up to ~69% in contrast to the same
metal at V = 10 mm/s. However, the reduced microwaviness and flattened LIPSS did not
improve the repellence towards S. aureus. In fact, more S. aureus was retained on the
flattened LIPSS surfaces (V = 50 mm/s), marking up to a 50% increase compared to the
surface at V=10 mm/s. The impact of increased bacterial adhesion was more severe on
SS surfaces than on the TI, and independent with respect to air or argon-fabrication.
Overall, the objective of the present work was successfully achieved. The current
findings confirmed that using laser fabrication with surface texturing while controlling
the surface oxidation using Argon gas has successfully combatted the adhesion of both S.
aureus and E. coli. The TIL-Ar fabrications provided the lowest adhesion for S. aureus
and E. coli, with only 17.2 x 10³/mm2 and 3.3 x 10³/mm2 cells retained on the surface,
respectively. The effect of fabrication method, surface properties and bacterial properties
were successfully linked and discussed. In addition, the following conclusions may be
drawn from this study:

187
The properties of S. aureus as a hydrophobic bacterium proved that Gram-positive
bacterium was always a greater coloniser, while the hydrophobic character
enhanced its adhesive property. Throughout this study, surfaces were exposed to
a similar number of bacteria, but the density for S. aureus adhesion was always
the highest compared to other bacteria. It is possible to conclude that the abilities
of S. aureus to be a higher coloniser on a surface are independent of surface
finishing, textures, wettability, topography, features, surface chemical and
surrounding factors.
In addition, it may be appropriate to suggest that the behaviour of adhesion is,
firstly, governed by interaction between two similar surfaces, either hydrophobic-
hydrophobic or hydrophilic-hydrophilic surfaces. When the hydrophilic surface
was used, only bacteria with hydrophilic CSH (B. subtilis) would correspond to
changes in surface parameters (CA and Sa) which were observed in the polishing
study. When mild hydrophobic to hydrophobic (80° < CA < 100°) surfaces from
WEDM fabrications were used, no correlation was observed for gram-
negative/hydrophilic bacteria. Following laser fabrication, the adhesion of S.
aureus provided a strong correlation with the surface properties of TIL.
Although certain polishing and WEDM surfaces provide better control for the
bacterial adhesion, laser fabrication offered advantages over these processes. Laser
processing offers flexibility with control elements to produce a surface for a specific
property, repeatable with high accuracy. Unlike polishing, laser fabrication does not
produce any waste elements since this process only involved the remitting, reorganisation
and restructuring of the affected area, thereby is considered as a clean process. Besides
that, the increased hydrophobicity level of the lasered fabricated surface reduces the
friction coefficient and minimises the contact of particles onto the surface, thereby
prolonging the shelf life of the materials. This leads to increasing resistance for mass
transfer, subsequently reducing the adhesion. Current observations on the impact of
surface engineering revealed that there is a possibility that the outer structure of the
bacterial surface was damaged due to the brushing effect with the coarse surface that

188
emerged from the nano structures (grains). The ruptured membrane may cause leakage of
the cell content, consequently reducing the chance of survival and proliferation. However,
care should be taken related to its contact killing mode as upon prolonged exposure to
bacterial suspension, the dead bacteria can serve as a conditioning film and provide a new
platform for subsequent bacterial adhesion.
7.2 Recommendations for future studies
The purpose of this study was to develop a surface with certain characteristics that
would repel most of the bacteria species, with the ability to carry on the appropriate task
with the materials. Before deriving any conclusion relating to surfaces with such criteria,
a more thorough study must be carried out for such cases to strengthen the understanding
on the adhesion mechanism. Interactions between bacteria and surface are time-
dependent, therefore, a continuity study based on a prolonged exposure must be carried
out whilst changing the environmental factors i.e. medium types, pH, salinity, etc.
Prolonged adhesion to 72 hours might assist to provide better insights into the adhesion
capability of the slow binding bacteria. Furthermore, the surface should be tested with
different strains of bacteria to test its true capability to reduce bacterial adhesion. It might
be beneficial to study Gram-positive and Gram-negative bacteria with different
hydrophobicity levels from the current study, i.e. hydrophobic bacteria for Gram-
negative, and hydrophilic species for Gram-positive.
Detailed surface and bacteria characterisation should be embarked to gain more
information on the adhesion directions. Analysis of surface properties inclusive of surface
energy, surface charge, chemical composition (EDX, XPS, FTIR, Raman, NMR) will
help to give a better conclusion on the possible factors that are more dominant for the
bacterial adhesion. Besides that, AFM and TEM analysis will prove whether the modified
surface would be able to reduce the adhesion strength of the bacteria whilst the latter
would be able to confirm whether the cell of the bacteria was damaged due to the surface

189
texture. Data collection also will be beneficial if bacterial count can be distinguished by
the number of live and dead bacteria (dead and live cells dye instead of general
fluorescent) which will reconfirm the ability of the surface to serve as a contact-mode-
killing surface. A study on the bacteria molecular structure and its contribution to the
adhesion i.e.: the-EPS-mediated-adhesion, where the composition of polysaccharides and
proteins has been reported to facilitate the binding process on the surface. Analysis on the
surface protein and carbohydrate would benefit the most especially when employing the
chemical functionalisation, which will help in choosing the best chemical that will resist
the protein/carbohydrate adsorption.
Surface modification under laser treatment can be directed towards producing a
texture with more nanograins on the LIPSS area but with fewer valleys and crevices.
Besides that, it is best if the width between two control lines can be controlled between
0.4 – 0.5 m that will not only increase the resistance for adhesion, but also avoid
trapping cells between these features. This surface can be achieved by controlling the
laser pulses, scanning speed, the BET and the energy fluence of the laser. Besides that,
varying the surface structure with the specific patterns (3D shape) can be achieved from
a wide array of modifications from those proposed in the study. Special lithography and
plasma techniques with different types of gas exposure can be employed not only to
produce surfaces with different texture and roughness, but also may modify the chemical
composition that might increase the wettability of the surface without changing its
topography. Increasing hydrophobicity can also be modified using different types
shielding gas such as fluorocarbons, but it might well increase the overall cost. On top of
this, laser fabrication can also be aligned with a chemical modification to provide a
surface with specific functionalisation. Embedding special chemical or biological
compounds would be very advantageous field to be explored in the future that will
increase the ability of the surface to combat bacterial adhesion while enhancing the
growth of any tissue for the development of implants. Further coating with materials with
low surface energy may be beneficial in combating the bacterial adhesion.
190
REFERENCES
1. Paul Dunne, E.N., Ron Smith, Military Spending, Investment and Economic Growth in Small Industrialising Economics, in African Econometrics Society Conference. 2002: University of Witwatersrand,Johannesburg, South Africa.
2. H.C.Flemming, Microbial Biofouling: Unsolved Problems, Insufficient Approaches, and Possible Solutions. Biofilm Highlights, Springer Series on Biofilms, 2011. 5: p. 81 - 109.
3. Szewzyk, U., et al., Microbiological safety of drinking water. Annu Rev Microbiol, 2000. 54: p. 81-127.
4. Ralph Jimenez, G.R.F., P. V. Kumar & M. Maroncelli, Femtosecond solvation dynamics of water. Nature: International Journal of Science, 1994. 369: p. 471-473.
5. Jonah Erlebacher, M.J.A., Alain Karma, Nikolay Dimitrov & Karl Sieradzki, Evolution of nanoporosity in dealloying. Nature: International Journal of Science, 2001. 410: p. 450-453.
6. Brendan Drumm, A.W.N., Zdenka Policova, Philip M.Sherman, Bacterial Cell Surface Hydrophobicity Properties in the Mediation of In Vitro Adhesion by the Rabbit Enteric Pathogen Escherichia coli strain RDEC-1. The American Society for Clinical Investigation, Inc, 1989. 84: p. 1588 - 1594.
7. Technology, A.C.o.S.a., Developments in biotechnology. 1990, HMSO: London. 8. Julian F.V. Vincent, O.A.B., Nikolaj R. Bogatyrev, Adrian Bowyer, Anja-Karina Pahl,
Biomimetics: its practice and theory. Journal of The Royal Society Interface, 2006. 3: p. 471 - 482.
9. Gebeshuber, I.C., Biotribology inspires new technologies. nanotoday, 2007. 2(5): p. 30 - 37.
10. Bhushan, B., Biomimetics: lessons from nature - an overview. Philosophical Transactions of The Royal Society A, 2009. 367: p. 1445 - 1486.
11. Bhushan, B., Biomimetics: lessons from nature--an overview. Philos Trans A Math Phys Eng Sci, 2009. 367(1893): p. 1445-86.
12. Bar-Cohen, Y., Biomimetics: Biologically Inspired Technologies. 2006, United States of America: Taylor & Francis Group, LLC.
13. DAI Zhendong, T.J., Ren Luquan, Researches and developments of biomimetics in tribology. Chinese Science Bulletin, 2006. 51(22): p. 2681 - 2689.
14. Vincent, J.F., et al., Biomimetics: its practice and theory. J R Soc Interface, 2006. 3(9): p. 471-82.
15. T.D Morgan, M.W., The effects of surface roughness and type of denture acrylic on biofilm formation by Streptococcus oralis in a constant depth film fermentor. Journal of Applied Microbiology, 2001. 91: p. 47 - 53.
16. Xi Zhang, F.S., Jia Niu, Yugui JIang, Zhiqiang Wang, Superhydrophobic surfacesL from structural control to functional application. Journal of Materials Chemistry, 2007. 18: p. 621 - 633.
17. Michael Nosonovsky, B.B., Superhydrophobic surfaces and emerging applications: non-adhesion, energy, green engineering. Current Opinion in Colloid & Interface Science, 2009. 14: p. 270 - 280.
18. Gu, Z.Z., et al., Structural color and the lotus effect. Angewandte Chemie International Edition, 2003. 42(8): p. 894-897.
19. Barry, T.N. and D.A. Forss, The condensed tannin content of vegetative Lotus pedunculatus, its regulation by fertiliser application, and effect upon protein solubility. Journal of the Science of Food and Agriculture, 1983. 34(10): p. 1047-1056.
20. Barthlott, W. and C. Neinhuis, Purity of the sacred lotus, or escape from contamination in biological surfaces. Planta, 1997. 202(1): p. 1-8.
21. Patankar, N.A., Mimicking the lotus effect: influence of double roughness structures and slender pillars. Langmuir, 2004. 20(19): p. 8209-8213.

191
22. Spori, D.M., et al., Beyond the lotus effect: roughness influences on wetting over a wide surface-energy range. Langmuir, 2008. 24(10): p. 5411-5417.
23. Spaeth, M. and W. Barthlott, Lotus-Effect®: Biomimetic Super-Hydrophobic Surfaces and their Application. Advances in Science and Technology, 2009. 60: p. 38-46.
24. Koch, K. and W. Barthlott, Superhydrophobic and superhydrophilic plant surfaces: an inspiration for biomimetic materials. Philos Trans A Math Phys Eng Sci, 2009. 367(1893): p. 1487-509.
25. Bhushan B, K.K., Jung YC, Nanostructures for superhydrophobicity and low adhesion. Soft Matter, 2008. 4: p. 1799 - 804.
26. Nosonovsky M, B.B., Multiscale Dissipative Mechanisms and Hierarchical Surfaces: Friction, Superhydrophobicity, and Biomimetics. 2008, Heidelberg, Germany: Springer-Verlag.
27. Guo, Z., W. Liu, and B.L. Su, Superhydrophobic surfaces: from natural to biomimetic to functional. J Colloid Interface Sci, 2011. 353(2): p. 335-55.
28. Watson, G.S., et al., A gecko skin micro/nano structure – A low adhesion, superhydrophobic, anti-wetting, self-cleaning, biocompatible, antibacterial surface. Acta Biomaterialia, 2015. 21: p. 109-122.
29. Peifu Tang, W.Z., Yan Wang, Boxun Zhang, Hao Wang, Changjian Lin, Lihai Zhang, Effect of Superhydrophobic Surface of Titanium on Staphylococcus aureus Adhesion. JOurnal of Nanomaterials, 2011. 2011: p. 1 - 8.
30. Stephen L.Hodson, T.E.L., Christopher M.Burke, Biofouling of fish-cage netting: efficacy and problems of in situ cleaning. Aquaculture, 1997. 152: p. 77 - 90.
31. Minglin Ma, R.M.H., Superhydrophobic Surfaces. Current Opinion in Colloid & Interface Science, 2006. 11: p. 193 - 202.
32. Toumey, C., Apostolic Succession, in Engineering & Science. 2005. 33. Roukes, M., Plenty of Room Indeed, in Sci Am. 2001, Scientific American, Inc. p. 48 - 57. 34. Breton, P.J., From microns to nanometers: early landmarks in the science of scanning
electron microscope imaging. Scanning Microsc., 1999. 13(1): p. 1 - 6. 35. Weilie Zhou, Z.L.W., Scanning Microscopy for Nanotechnology: Techniques and
Applications. 2007: Springer. 36. Jiang, K., Qunqing Li, Shoushan Fan, Nanotechnology: spinning continous carbon
nanotube yarns. Nature, 2002. 419: p. 801. 37. Yu, M., Mark J. Dyer, George D. Skidmore, Henry Q. Rohrs, XueKun Lu, Kevin D.
Ausman, James R. Von Ehr, Rodney S. Ruoff, Three-dimensional manipulation of carbon nanotubes under a scanning electron microscope. Nanotechnology, 1999. 10(3): p. 244.
38. Wang, Z.L., New developments in transmission electron microscopy for nanotechnology. Advanced Materials, 2003. 15(18): p. 1497-1514.
39. Bhushan, B. and Y.C. Jung, Natural and biomimetic artificial surfaces for superhydrophobicity, self-cleaning, low adhesion, and drag reduction. Progress in Materials Science, 2011. 56(1): p. 1-108.
40. Forbes, P., The Gecko's Foot: Bio-inspiration : Engineering New Materials from Nature. 2005: W W Norton & Company Incorporated.
41. Mukherjee, P.K., Debaijyoti Mukherjee, Amal K. Maji, S. Rai, Michael Heinrich, The sacred lotus (Nelumbo nucifera) - phytochemical and therapeutic profile. Journal of Pharmacy and Pharmacology, 2009. 61(4): p. 407 - 422.
42. Waldron, K.J. A Brief History of Biomimetic Robotics. in International Symposium on History of Machines and Mechanisms Proceedings HMM 2000. 2000. Springer Netherlands.
43. Mohammad Shateri Khalil-Abad, M.E.Y., Superhydrophobic antibacterial cotton textiles. J Colloid Interface Sci, 2010. 351: p. 293 - 298.
44. Borsellino, C., G. Di Bella, Paper-reinforced biomimetic cellular structures for automotive applications. Materials & Design, 2009. 30(10): p. 4054 - 4059.
192
45. Pang, J.W.C., I.P.Bond, Bleeding composites - damage detection and self-repair using a biomimetic approach. Composites Part A: Applied Science and Manufacturing, 2005. 36(2): p. 183 - 188.
46. Ghasemi-Varnamkhasti, M., Seyed Saeid Mohtasebi, Maryam Siadat, Biomimetic-based odor and taste sensing systems to food quality and safety characterisation: An overview on basic principles and recent achievements. Journal of Food Engineering, 2010. 100(3): p. 377 - 387.
47. Tang, Z., Ying Wang, Paul Podsiadlo, Nicholas A. Kotov, Biomedical Applications of Layer-by-Layer Assembly: From Biomimetics to Tissue Engineering. Advanced Materials, 2006. 18(24): p. 3203 - 3224.
48. Badilescu, S. and M. Packirisamy, BioMEMS : science and engineering perspectives. 2011, Boca Raton: CRC Press. xvii, 329 p.
49. Kowalczyk, S.W., T.R. Blosser, and C. Dekker, Biomimetic nanopores: learning from and about nature. Trends in biotechnology, 2009. 29(12): p. 607-614.
50. Dufrene, Y.F., Vermeiren, H., Van der Leyden, J., Rouxhet, P.G, Direct evidence for the involvement of extracellular proteins in the adhesion of Azospirillum brasilence. Microbiology, 1996. 142: p. 855 - 865.
51. Dr. Mortimer L. Downey, D.D.T.M., Gary R. Bachula, Delores M. Etter, Dr. E. Fenton Carey, Lori A. Perine, National Nanotechnology Initiave: Leading to the Next Industrial Revolution, C.o.T.N.S.a.T. Council, Editor. 2000, Interagency Working Group on Nanoscience, Engineering and Technology: Washington D.C.
52. Nosonovsky, M. and B. Bhushan, Superhydrophobic surfaces and emerging applications: Non-adhesion, energy, green engineering. Current Opinion in Colloid & Interface Science, 2009. 14(4): p. 270-280.
53. Hu, X., et al., Bacterial and osteoblast behaviour on titanium, cobalt–chromium alloy and stainless steel treated with alkali and heat: A comparative study for potential orthopedic applications. Journal of Colloid and Interface Science, 2014. 417: p. 410-419.
54. Cunha, A., et al., Femtosecond laser surface texturing of titanium as a method to reduce the adhesion of Staphylococcus aureus and biofilm formation. Applied Surface Science, 2016. 360: p. 485-493.
55. Jing, H., E. Sahle-Demessie, and G.A. Sorial, Inhibition of biofilm growth on polymer-MWCNTs composites and metal surfaces. Science of The Total Environment, 2018. 633: p. 167-178.
56. Shuai, C., et al., Microstructure, biodegradation, antibacterial and mechanical properties of ZK60-Cu alloys prepared by selective laser melting technique. Journal of Materials Science & Technology, 2018. 34(10): p. 1944-1952.
57. Wenzel, R.P., Health Care–Associated Infections: Major Issues in the Early Years of the 21st Century. Clinical Infectious Diseases, 2007. 45(Supplement_1): p. S85-S88.
58. Godoy-Gallardo, M., et al., Covalent immobilization of hLf1-11 peptide on a titanium surface reduces bacterial adhesion and biofilm formation. Acta Biomaterialia, 2014. 10(8): p. 3522-3534.
59. Askeland, D.R., The Science and Engineering of Materials. 1991: Springer, Dordrecht. 60. Donald M, B., Pentti Tengvall, Marcus Textor, Peter Thomsen Titanium in Medicine:
material science, surface science, engineering, biological responses and medical applications. Formatex Research Center ed. 2001: Springer Verlag Berlin Heidelberg.
61. Liam Blunt, X.J., Advanced Techniques for Assessment Surface Topography
Development of a Basis for 3D Surface Texture Standards “SURFSTAND”. 2003, Kogan Page Limited.
62. X. Liu, F.G., A novel multi-function tribological probe microscope for mapping surface properties. Measurement Science and Technology, 2004. 15: p. 91 - 102.
63. Loredana Santo, J.P.D., Surface Engineering Techniques and Applications: Research Advancements. IGI Global, 2014.

193
64. Bohinc, K., Drazic G., Abram A., Jevsnik M., Jersek B., Nipic D., Kurincic M and Raspor P. , Metal surface characteristics dictate bacterial adhesion capacity. International Journal of Adhesion & Adhesives, 2016. 68: p. 39-46.
65. Kaushik, R.M., A.B. Bhandakkar, and T.U. Patro, Solution of emulsifiable oil and hydrogen peroxide for chemical–mechanical polishing of Ti alloy—A green approach. Materials Letters, 2014. 122: p. 252-255.
66. Heimer, S., et al., Surface properties of polyetheretherketone after different laboratory and chairside polishing protocols. The Journal of Prosthetic Dentistry, 2017. 117(3): p. 419-425.
67. Chegdani, F., S.T.S. Bukkapatnam, and M.E. Mansori, Thermo-mechanical Effects in Mechanical Polishing of Natural Fiber Composites. Procedia Manufacturing, 2018. 26: p. 294-304.
68. Yang N, Z.W., L Z and Sun T Wear process of single crystal diamond affected by sliding velocity and contact pressure in mechanical polishing. Diamond and Related Material, 2015.
69. Ozdemir, Z., A. Ozdemir, and G.B. Basim, Application of chemical mechanical polishing process on titanium based implants. Materials Science and Engineering: C, 2016. 68: p. 383-396.
70. Skovager, A., et al., A comparative study of fine polished stainless steel, TiN and TiN/Ag surfaces: Adhesion and attachment strength of Listeria monocytogenes as well as anti-listerial effect. Colloids and Surfaces B: Biointerfaces, 2013. 109: p. 190-196.
71. Kang, D.-H., et al., Effect of polishing method on surface roughness and bacterial adhesion of zirconia-porcelain veneer. Ceramics International, 2017. 43(7): p. 5382-5387.
72. Hu, L., et al., Fabrication of biomimetic superhydrophobic surface based on nanosecond laser-treated titanium alloy surface and organic polysilazane composite coating. Colloids and Surfaces A: Physicochemical and Engineering Aspects, 2018. 555: p. 515-524.
73. Kulkarni, O. and S. Kulkarni, Process Parameter Optimisation in WEDM by Grey Wolf Optimiser. Materials Today: Proceedings, 2018. 5(2, Part 1): p. 4402-4412.
74. Tejas Ajay, B., P. Mayur Vitthal, and G. Rajyalakshmi, WEDM machining on Aerospace Materials for improving Material Properties. Materials Today: Proceedings, 2017. 4(8): p. 9107-9116.
75. Choudhuri, B., et al., Modelling of Surface Roughness and Tool Consumption of WEDM and Optimisation of Process Parameters Based on Fuzzy-PSO. Materials Today: Proceedings, 2018. 5(2, Part 2): p. 7505-7514.
76. Mouralova, K., et al., Analysis of surface morphology and topography of pure aluminium machined using WEDM. Measurement, 2018. 114: p. 169-176.
77. Zhang, Z., et al., Study on machining characteristics of WEDM with ultrasonic vibration and magnetic field assisted techniques. Journal of Materials Processing Technology, 2016. 234: p. 342-352.
78. Torres, A., I. Puertas, and C.J. Luis, Modelling of surface finish, electrode wear and material removal rate in electrical discharge machining of hard-to-machine alloys. Precision Engineering, 2015. 40: p. 33-45.
79. Pramanik, A. and A.K. Basak, Sustainability in wire electrical discharge machining of titanium alloy: Understanding wire rupture. Journal of Cleaner Production, 2018. 198: p. 472-479.
80. Cheng, X., et al., Development of ultra-precision machining system with unique wire EDM tool fabrication system for micro/nano-machining. CIRP Annals, 2008. 57(1): p. 415-420.
81. Ma, Q., et al., Fabricating robust and repairable superhydrophobic surface on carbon steel by nanosecond laser texturing for corrosion protection. Applied Surface Science, 2018. 455: p. 748-757.

194
82. Cunha A., E., AM, Plawinski L., Serro, A.P, do Rego A.M., Almeida A., Urdaci M.C., Durrieu M.C and Vilar R, Femtosecond laser surface texturing of titanium as a method to reduce the adhesion of Staphlococcus aureus and biofilm formation. Applied Surface, 2016. 360(485 - 493).
83. Giorgi, C.D., Furlan V., Demir, A.G, Tallarita E., Candiani G., and Previtali B, Laser micropolishing of AISI304 stainless steel surfaces for cleanability and bacteria removal capability. Applied surface science, 2017. 406: p. 199-211.
84. Liu, X. and H.C. Man, Laser fabrication of Ag-HA nanocomposites on Ti6Al4V implant for enhancing bioactivity and antibacterial capability. Materials Science and Engineering: C, 2017. 70: p. 1-8.
85. Maragkaki, S., et al., Wavelength dependence of picosecond laser-induced periodic surface structures on copper. Applied Surface Science, 2017. 417: p. 88-92.
86. Du, Q., et al., Fabrication of superhydrophobic/superhydrophilic patterns on polyimide surface by ultraviolet laser direct texturing. Journal of Materials Processing Technology, 2018. 251: p. 188-196.
87. Katsutoshi Hori, N.H., Mari Nannbu, Kei Kanie, Mina Okochi, Hiroyuki Honda,
Hisami Watanabe, Drastic change in cell surface hydrophobicity of a new bacterial
strain, Pseudomonas sp. TIS1-127, induced by growth temperature and its effects on the
toluene-conversion rate Journal of Bioscience and Bioengineering, 2009. 107(3): p. 250-255.
88. van Hoogmoed, C.G., et al., Inhibition of <em>Streptococcus mutans</em> NS Adhesion to Glass with and without a Salivary Conditioning Film by Biosurfactant- Releasing <em>Streptococcus mitis</em>Strains. Applied and Environmental Microbiology, 2000. 66(2): p. 659-663.
89. Garrett, T.R., M. Bhakoo, and Z. Zhang, Bacterial adhesion and biofilms on surfaces. Progress in Natural Science, 2008. 18(9): p. 1049-1056.
90. Al-Abbas, F.M., Spear, J. R., Kakpovbia, A., Balhareth, N. M., Olson, D. L., and Mishra, B, Bacterial attachment to metal substrate and its effects on microbiologically-influenced corrosion in transporting hydrocarbon pipelines. Journal of pipeline engineering, 2012. 11: p. 63-72.
91. Alam, F. and K. Balani, Adhesion force of staphylococcus aureus on various biomaterial surfaces. Journal of the Mechanical Behaviour of Biomedical Materials, 2017. 65: p. 872-880.
92. Hermansson, M., The DVLO theory in microbial adhesion. Colloids and Surfaces B: Biointerfaces, 1999. 14: p. 105 - 119.
93. Shaikh, S., et al., Femtosecond laser induced surface modification for prevention of bacterial adhesion on 45S5 bioactive glass. Journal of Non-Crystalline Solids, 2018. 482: p. 63-72.
94. Faisal M AlAbbas, J.R.S., Anthony Kakpovbia, Nasser M Balhareth, David L Olson, and Brajendra Mishra, Bacterial attachment to metal substrate and its effects on microbiologically-influenced corrosion in trasporting hydrocarbon pipelines. The Journal of Pipeline Engineering, 2012: p. 63 - 72.
95. Han, A., et al., Bacterial adhesion mechanisms on dental implant surfaces and the influencing factors. International Journal of Adhesion and Adhesives, 2016. 69: p. 58-71.
96. Yang, M., et al., Control of bacterial adhesion and growth on honeycomb-like patterned surfaces. Colloids and Surfaces B: Biointerfaces, 2015. 135: p. 549-555.
97. Nguyen, D., et al., Adhesion and surface energy of shale rocks. Colloids and Surfaces A: Physicochemical and Engineering Aspects, 2017. 520: p. 712-721.
98. Zhu, C., et al., Antimicrobial design of titanium surface that kill sessile bacteria but support stem cells adhesion. Applied Surface Science, 2016. 389: p. 7-16.
99. Yoon, S.H., et al., Superhydrophobic and superhydrophilic nanocomposite coatings for preventing Escherichia coli K-12 adhesion on food contact surface. Journal of Food Engineering, 2014. 131: p. 135-141.
195
100. Shiau, Plasma -chemical improvements 2018. 101. Alam, F. and K. Balani, Role of silver/zinc oxide in affecting de-adhesion strength of
Staphylococcus aureus on polymer biocomposites. Materials Science and Engineering: C, 2017. 75: p. 1106-1114.
102. Lu, N., et al., Fabrication of PDMS surfaces with micro patterns and the effect of pattern sizes on bacteria adhesion. Food Control, 2016. 68: p. 344-351.
103. Truong, V.K., et al., The influence of nano-scale surface roughness on bacterial adhesion to ultrafine-grained titanium. Biomaterials, 2010. 31(13): p. 3674-3683.
104. Korber, D.R., et al., Substratum topography influences susceptibility of Salmonella enteritidis biofilms to trisodium phosphate. Applied and Environmental Microbiology, 1997. 63(9): p. 3352-3358.
105. Little, E.B., G.M. Edelman, and B.A. Cunningham, Palmitoylation of the Cytoplasmic Domain of the Neural Cell Adhesion Molecule N-CAM Serves as an Anchor to Cellular Membranes. Cell Adhesion and Communication, 1998. 6(5): p. 415-430.
106. Sheng, X., Y.P. Ting, and S.O. Pehkonen, The influence of ionic strength, nutrients and pH on bacterial adhesion to metals. Journal of Colloid and Interface Science, 2008. 321(2): p. 256-264.
107. Dewald, C., et al., Gold nanoparticle contact point density controls microbial adhesion on gold surfaces. Colloids and Surfaces B: Biointerfaces, 2018. 163: p. 201-208.
108. Morgan, T.D. and M. Wilson, The effects of surface roughness and type of denture acrylic on biofilm formation by Streptococcus oralis in a constant depth film fermentor. Journal of Applied Microbiology, 2001. 91(1): p. 47-53.
109. Doyle R.J., N.-H.F., Singh J.S., Hydrophobic characteristics of Bacillus spores. Current Microbiology, 1984. 10: p. 329 - 332.
110. Harimawan, A. and Y.-P. Ting, Investigation of extracellular polymeric substances (EPS) properties of P. aeruginosa and B. subtilis and their role in bacterial adhesion. Colloids and Surfaces B: Biointerfaces, 2016. 146: p. 459-467.
111. Ribeiro, M.C., et al., Preconditioning of the stainless steel surface affects the adhesion of Bacillus cereus spores. International Dairy Journal, 2017. 66: p. 108-114.
112. C.A Huang, C.C.H., H.H Kuo, The surface characteristics of P/M high-speed steel (ASP 23) multi-cut with wire electrical discharge machine (WEDM). Journal of Materials Processing Technology, 2003. 140(1 - 3): p. 298 - 302.
113. S. Mahendran, D.R. Micro-EDM: Overview and Recent Developments. in National Conference in Mechanical Engineering Research and Postgraduate Students (NCMER). 2010. FKM Conference Hall, UMP Kuantan Pahang: Universiti Malaysia Pahang.
114. Xiong, Y.Q., et al., Influence of pH on adaptive resistance of Pseudomonas aeruginosa to aminoglycosides and their postantibiotic effects. Antimicrobial Agents and Chemotherapy, 1996. 40(1): p. 35-39.
115. Beveridge, T., Use of the Gram stain in microbiology. Biotechnic & Histochemistry, 2009. 76(3).
116. Habimana, O., Semião, A. J.C., and Casey, E, The role of cell-surface interactions in
bacterial initial adhesion and consequent biofilm formation on nanofiltration/reverse
osmosis membranes. Journal of Membrane Science, 2014. 454: p. 82-96. 117. Schöler, A., et al., Analysis of soil microbial communities based on amplicon sequencing
of marker genes. Biology and Fertility of Soils, 2017. 53(5): p. 485-489. 118. Yang, H., et al., Characterisation of Multiple-Antimicrobial-Resistant <em>Escherichia
coli</em> Isolates from Diseased Chickens and Swine in China. Journal of Clinical Microbiology, 2004. 42(8): p. 3483-3489.
119. Barton, L.L., Structural and Functional Relationships in Prokaryotes. 2005: Springer New York.
120. Sharon L. Walker, J.E.H., 2 Jeremy A. Redman,and Menachem Elimelech, Influence of
Growth Phase on Adhesion Kinetics of Escherichia coli D21g. APPLIED AND
ENVIRONMENTAL MICROBIOLOGY, 2005. 71(6): p. 3093-3099.

196
121. N. O. Kjeldgaard , O.M., M. Schaechter*, The Transition Between Different Physiological States During Balanced Growth of Salmonella typhimurium. Microbiology, 1958. 19: p. 607-616.
122. Vadia, S. and P.A. Levin, Growth rate and cell size: a re-examination of the growth law. Current Opinion in Microbiology, 2015. 24: p. 96-103.
123. Vázquez-Juárez, R., T. Andlid, and L. Gustafsson, Cell surface hydrophobicity and its relation to adhesion of yeasts isolated from fish gut. Colloids and Surfaces B: Biointerfaces, 1994. 2(1): p. 199-208.
124. Hilal, N. and W.R. Bowen, Atomic force microscope study of the rejection of colloids by membrane pores. Desalination, 2002. 150(3): p. 289-295.
125. Jones, D.S., et al., Standardisation and comparison of methods employed for microbial cell surface hydrophobicity and charge determination. International Journal of Pharmaceutics, 1996. 131(1): p. 83-89.
126. M. Rosenberg, D.G.a.E.R., Adherence of Bacteria to Hydrocarbons: A simple method for Measuring Cell-Surface Hydrophobicity. FEMS Microbiology Letters, 1980. 9: p. 29-33.
127. Toranzo, I.B.Y.S.J.L.B.A.E., Influence of the growth conditions on the hydrophobicity of Renibacterium salmoninarum evaluated by different methods. FEMS Microbiology Letters, 1989. 60(1).
128. Ahimou, F., et al., Influence of electrical properties on the evaluation of the surface hydrophobicity of Bacillus subtilis. Journal of Microbiological Methods, 2001. 45(2): p. 119-126.
129. Hamadi F., a.L.H., Comparison of contact angle measurement and microbial adhesion
to solvents for assaying electron donor-electron acceptor (acid-base) properties of
bacterial surface. . Colloids and Surfaces B: Biointerfaces, 2008. 65(1): p. 134-139. 130. Kilonzo, P., A. Margaritis, and M. Bergougnou, Effects of surface treatment and process
parameters on immobilization of recombinant yeast cells by adsorption to fibrous matrices. Bioresource Technology, 2011. 102(4): p. 3662-3672.
131. Hamadi, A., et al., Regulation of focal adhesion dynamics and disassembly by phosphorylation of FAK at tyrosine 397. Journal of Cell Science, 2005. 118(19): p. 4415-4425.
132. Mitik-Dineva N1, W.J., Mocanasu RC, Stoddart PR, Crawford RJ, Ivanova EP., Impact of nano-topography on bacterial attachment. Biotechnol, 2008(April): p. 536-544.
133. Morra, M. and C. Cassinelli, Bacterial adhesion to polymer surfaces: A critical review of surface thermodynamic approaches. Journal of Biomaterials Science, Polymer Edition, 1998. 9(1): p. 55-74.
134. Hamadi, F. and H. Latrache, Comparison of contact angle measurement and microbial adhesion to solvents for assaying electron donor–electron acceptor (acid–base) properties of bacterial surface. Colloids and Surfaces B: Biointerfaces, 2008. 65(1): p. 134-139.
135. Geertsema-Doornbusch, G.I., H.C. van der Mei, and H.J. Busscher, Microbial cell surface hydrophobicity The involvement of electrostatic interactions in microbial adhesion to hydrocarbons (MATH). Journal of Microbiological Methods, 1993. 18(1): p. 61-68.
136. Zikmanis P., S.L., Auzina L. and Andersone, Hydrophobicity of bacteria Zymomonas mobilis under varied environmental conditions. Process Biochemistry 42(4): p. 745-750.
137. Werner-Washburne, M., et al., Stationary phase in the yeast Saccharomyces cerevisiae. Microbiological Reviews, 1993. 57(2): p. 383-401.
138. Ranu, B.C., A. Hajra, and U. Jana, Indium(III) Chloride-Catalyzed One-Pot Synthesis of Dihydropyrimidinones by a Three-Component Coupling of 1,3-Dicarbonyl Compounds, Aldehydes, and Urea: An Improved Procedure for the Biginelli Reaction. The Journal of Organic Chemistry, 2000. 65(19): p. 6270-6272.
139. Yen, M.-T., J.-H. Yang, and J.-L. Mau, Physicochemical characterisation of chitin and chitosan from crab shells. Carbohydrate Polymers, 2009. 75(1): p. 15-21.

197
140. Warth, A.D., Relationship between the heat resistance of spores and the optimum and maximum growth temperatures of Bacillus species. Journal of Bacteriology, 1978. 134(3): p. 699-705.
141. Rose, A.H. and G.M. J, Advances in Microbial Physiology. 1978: Elsevier Science. 142. Zhenyong Zhao, A.S., Jonathan Woon-Chung Wong, Effects of rhamnolipids on cell
surface hydrophobicity of PAH degrading bacteria and the biodegradation of
phenanthrene. Bioresource Technology 2011. 102: p. 3999-4007. 143. Jana, N.R., et al., Polyglutamine length-dependent interaction of Hsp40 and Hsp70
family chaperones with truncated N-terminal huntingtin: their role in suppression of aggregation and cellular toxicity. Human Molecular Genetics, 2000. 9(13): p. 2009-2018.
144. Baikun Li, B.E.L., Bacterial adhesion to glass and metal-oxide surfaces. Colloids and
Surfaces B: Biointerfaces 2004. 36: p. 81-90. 145. Yea-Ling Ong, A.R., George Georgian, Mukl M. Sharma, Adhesion forces between e.coli
bacteria and biomaterial surfaces. Langmuir, 1999. 15(8): p. 2714 - 2725. 146. Cunliffe, D., et al., Bacterial Adhesion at Synthetic Surfaces. Applied and Environmental
Microbiology, 1999. 65(11): p. 4995-5002. 147. Chan, C.-W., et al., Enhancing the antibacterial performance of orthopaedic implant
materials by fibre laser surface engineering. Applied Surface Science, 2017. 404: p. 67-81.
148. Bellon-Fontaine, M.N., J. Rault, and C.J. van Oss, Microbial adhesion to solvents: a novel method to determine the electron-donor/electron-acceptor or Lewis acid-base properties of microbial cells. Colloids and Surfaces B: Biointerfaces, 1996. 7(1): p. 47-53.
149. Hogan, D.A., Quorum Sensing: Alcohols in a Social Situation. Current Biology, 2006. 16(12): p. 457-458.
150. Fan, L.-J., Karinp, T., Effect of serum concentration on adhesion of monocytic THP-1 cells onto cultured EC monolayer and EC-SMC co-culture. Journal of Zhejiang University SCIENCE B, 2008. 9(8): p. 623 - 629.
151. Fletcher, S.M.M., The effect of temperature and relative humidity on the survival of bacteria attached to dry solid surfaces. JOurnal of Applied Microbiology, 1988. 7(4).
152. Kerro Dego, J.E.v.D.a.H.N., Factors involved in the early pathogenesis of bovine
Staphylococcus aureus mastitis with emphasis on bacterial adhesion and invasion A
review. 24, 2002. 4(181-198). 153. G. Harkes, J.F.a.J.D., Adhesion of Escherichia coli on to a series of poly(
methacrylates) differing in charge and hydrophobicity Biomaterials, 1991. 12: p. 109-122.
154. van Loosdrecht, M.C., et al., Influence of interfaces on microbial activity. Microbiological Reviews, 1990. 54(1): p. 75-87.
155. Whitehouse, D.J., Handbook of Surface Metrology. 1994: CRC Press. 156. Bhusan, B., Surface Roughness Analysis and Measurement Technique, in Modern
Tribology Handbook, B. Bhusan, Editor. 2001, CRC Press Taylor & Francis Group. 157. Pragya Shandilya, P.K.J., N. K. Jain, Parametric optimisation during wire electrical
discharge machining using response surface methodology. SciVerse ScienceDirect - Procedia Engineering, 2012. 38(2012): p. 2371 - 2377.
158. Aniza Alias, B.A., Norliana Mohd Abbas, Influence of Machine Feed Rate in WEDM of Titanium Ti-6Al-4v with constant current (6A) using Brass Wire. SciVerse ScienceDirect - Procedia Engineering, 2012. 41(2012): p. 1806 - 1811.
159. Bohinc, K., et al., Metal surface characteristics dictate bacterial adhesion capacity. International Journal of Adhesion and Adhesives, 2016. 68: p. 39-46.
160. Bernardes, P.C., et al., Assessment of hydrophobicity and roughness of stainless steel adhered by an isolate of Bacillus cereus from a dairy plant. Brazilian Journal of Microbiology, 2010. 41: p. 984-992.

198
161. Epperlein, N., et al., Influence of femtosecond laser produced nanostructures on biofilm growth on steel. Applied Surface Science, 2017. 418: p. 420-424.
162. Almaguer-Flores A., S.-B.P., Galicia R and Rodil S.E. , Bacterial adhesion on amorphous and crystalline metal oxide coatings. Materials Science and Engineering C. , 2015. 57: p. 88-89.
163. Katsikogianni, Y.F.M.M., Theoretical and experimental approaches of bacteria‐biomaterial interactions. JOurnal of Recommendation Service, 2007. 38(12).
164. Bagherifard, S., et al., The influence of nanostructured features on bacterial adhesion and bone cell functions on severely shot peened 316L stainless steel. Biomaterials, 2015. 73: p. 185-197.
165. Rajab F., L., C.M., Benson P.S. Li L. and Whitehead K.A, Picosecond laser treatment production of hierarchical structured stainless steel to reduce bacterial fouling. Food and Bioproducts processing, 2018. 109: p. 29-40.
166. Q.Zhao, Y.L., C.Wang, S.Wang, N.Peng, C.Jeynes, Bacterial Adhesion on ion-implanted stainless steel surfaces. Applied Surface Science, 2007. 253: p. 8674 - 8681.
167. Braem, A., et al., Staphylococcal biofilm growth on smooth and porous titanium coatings for biomedical applications. Journal of Biomedical Materials Research Part A, 2014. 102(1): p. 215-224.
168. Ludecke C., R.M., Yu W., Horn U., Bossert J and Jandt K.D Colloids and Surfaces B: Biointerfaces, 2016. 145: p. 617-625.
169. Ortega MP, H.T., Watanabe H and Sakiyama T, Adhesion behaviour and removability of Escherichia coli on stainless steel surface. Food Control, 2010. 21: p. 573-578.
170. De Giorgi, C., et al., Laser micropolishing of AISI 304 stainless steel surfaces for cleanability and bacteria removal capability. Applied Surface Science, 2017. 406: p. 199-211.
171. Garson, M.J., et al., A sponge/dinoflagellate association in the haplosclerid sponge Haliclona sp.: cellular origin of cytotoxic alkaloids by Percoll density gradient fractionation. Cell and Tissue Research, 1998. 293(2): p. 365-373.
172. Niaa, S.R.A.A.D., Chemical composition and evolution of the garnets in the Astamal Fe-LREE distal skarn deposit, Qara-Dagh–Sabalan metallogenic belt, Lesser Caucasus, NW Iran. Ore Geology Review, 2016. 78(October): p. 166.175.

199
APPENDIX
A-1.0: Stainless steel surfaces fabricated in air using femtosecond laser. Figures represented
a) SSL-01-Air, b) SSL-02-Air, c) SSL-03-Air and d) SSL-04-Air.

200
A-1.1: Stainless steel surfaces fabricated in argon using femtosecond laser. Figures represented
a) SSL-01-AR, b) SSL-02-AR, c) SSL-03-AR and d) SSL-04-AR

201
A-1.2: Titanium surfaces fabricated in air using femtosecond laser. Figures represented
a) TTL1-Air, b) TTL2-Air, c) TTL3-Air and d) TTL4-Air.

202
A-1.2: Titanium surfaces fabricated in argon using femtosecond laser. Figures represented
a) TTL1-Air, b) TTL2-Air, c) TTL3-Air and d) TTL4-Air.