writing a report on experiments with algorithmskbuchin/teaching/2io90/... · 2013-11-20 · 3.1...
TRANSCRIPT
Writing a report on experiments with algorithms
Herman HaverkortEindhoven University of Technology∗
DBL algorithms (2IO90), spring 2013
About this document
This document is a part of a document written by Herman Haverkort for the instance of DBLAlgorithms that ran in Spring 2013. In that instance the task was to design algorithms forclustering a set of points in the plane. However, the writing tips in this document are alsouseful for the current instance of DBL Algorithms. Note: in case this documents containsinformation that contradicts the information in other documentation for the currentinstance, the latter information has precedence.
Contents1 Contents of the report 41.1 Abstract 41.2 Introduction: describing the problem 41.3 Describing algorithms 51.3.1 Describing input and output 51.3.2 Describing the algorithm 51.3.3 Making things precise 61.3.4 Analyzing the output quality of your algorithm 71.3.5 Analyzing the efficiency (running time and memory usage) 71.3.6 Formulating theorems 71.4 Notation 81.5 Writing proofs 91.5.1 Equivalence proofs 91.5.2 Proof by contradiction 91.6 Describing and discussing experiments 91.6.1 Describing the test environment 91.6.2 Describing the test data 101.6.3 Describing the algorithms tested 101.6.4 Describing the experiments and the results 101.6.5 Discussing the results 101.7 Conclusions/discussion/recommendations 11
∗ Some material in this document may have been taken from several texts for classroom use by several currentand former instructors of the Eindhoven University of Technology, including Mark de Berg, Bettina Speckmann,and Alexander Wolff.
1
1.8 Acknowledgements 111.9 Bibliography 121.10 Structure 131.10.1 Sections and subsections 131.10.2 Paragraphs 132 Lay-out and typography 142.1 (No) Cover page 142.2 Titles of the document, sections, subsections and paragraphs 142.3 Text 142.4 Bibliography 143 Language 153.1 Style: personal versus impersonal 153.1.1 You becomes we 153.1.2 I becomes we 153.1.3 It becomes we 153.1.4 Her, him, and it 153.2 Style: variation versus monotonicity 163.3 Grammar and structure of sentences 163.3.1 Length of sentences 163.3.2 Much, many, amount, and number 163.3.3 Then and than 163.3.4 To be done and to have been done 173.3.5 References 173.3.6 Type consistency 173.4 Words and concepts to be careful with 173.4.1 Miljard, billion etc. 173.4.2 Maximum and maximal 183.4.3 Worst-case complexity 183.4.4 Average-case complexity 183.4.5 Best-case complexity 183.4.6 Expected running time 183.4.7 It is easy to see 193.4.8 Respectively 193.5 Spelling 193.6 Numbers 193.7 Punctuation 203.7.1 Commas (,) 203.7.2 Colons (:) versus commas 203.7.3 Semicolons (;) versus commas 203.7.4 Apostrophes (’) 213.7.5 Hyphens 213.8 Typesetting formulas 213.9 Mixing mathematical symbols and text 224 Pseudocode 234.1 Loops 234.2 Branching 244.3 Operators 244.4 Variables and arrays 244.5 Function calls 25
2

4.6 Comments 254.7 Length and integration in the text 255 Charts 266 Tables 28
3
1 Contents of the report
1.1 Abstract
In the abstract you give an overview, typically one short paragraph, of the contents of yourreport: you describe the problem you have studied, and what the main results are. Make it asconcise as possible. To motivate your studying the problem it suffices to mention an applicationarea (for example, “data mining”) with one word.
1.2 Introduction: describing the problem
The introduction should be written such that it can be understood without reading anotherdocument first. In particular, you cannot assume the reader to be familiar with the problemdescription that was provided to you at the beginning of this dbl course. Take the introductionvery seriously: this should be the best-written part of the whole report. For your report to beconvincing, the reader has to be willing to believe that you implemented your algorithms andexperiments correctly, so you really have to convince the reader that you know what you aredoing.
The introduction usually starts with a description of and a motivation for the general problemarea. In this project, that could be data mining. You may refer to previous or related work here.This way you can explain why the problem is interesting.
After introducing the general problem area, you zoom in to the specific problem studied in thereport. Then you change to a more abstract point of view, describing the problem in an abstractway that omits all details and context that are irrelevant for the study of its algorithmic solution.For example, whereas before you might have been writing about records in a database, you maynow limit the discussion to a problem on points in the plane. Describe what is the input to yourcomputational problem, and what properties the output of your computation should have.
You may refer to more previous work on the abstract problem here. You may also mention anyprevious work on very similar problems here, and mention whether or not the algorithms fromthat previous work are applicable to your problem.
Ideally, the discussion of the previous work culminates in a clear statement about what is stillmissing in the current state-of-the-art (namely an answer to the specific problem you study),and why (what are the principal problems to overcome).
Then you give an overview of your results. Try to include a high-level, but comprehensible,description of the approach(es) you have used to obtain those results, and relate them to ap-proaches found in the literature. State any theoretical guarantees (on running time, for instance,or on other aspects) that you may have proved for your algorithms and mention the main con-clusions from the experiments. Include references to sections of the rest of your report, wherethe results are explained in detail.
4
1.3 Describing algorithms
1.3.1 Describing input and output
Before describing an algorithm, specify clearly:
• what is the input to your algorithm; what properties does it have?• what is the output of your algorithm; what properties should it certainly have (strict
requirements)?• if multiple valid outputs are possible, what properties of the output should your algorithm
try to realize (soft requirements) or optimize (optimization criteria)?
Most algorithms should not ignore the input: the output should somehow depend on the input.Therefore, check that the requirements on the output are formulated such that they depend onthe input.
1.3.2 Describing the algorithm
Your main challenge is now to describe the algorithm such that its description is not only com-plete, accurate, and implementable, but also understandable to human beings. Usually it is bestto first describe the basic idea of the algorithm on a conceptual level, without implementationdetails. Make sure that this description can be understood without reading the details first: youshould not refer to concepts that will only be explained later.
The high-level conceptual description is typically followed by a number of paragraphs thatdescribe each step of the algorithm and each of the necessary data structures in detail. Makesure you give plenty of “intuition”: describe what is the meaning and purpose of all stepsin the algorithm and describe what operations should be performed efficiently by supportingdata structures. Alternatively, you can develop the algorithm in an incremental way: start froman algorithm that is simple to understand but not good enough (for example, too slow, or notentirely correct); then describe how to improve the algorithm step by step to obtain an algorithmthat is efficient and fully correct. In any case, you do not need to describe the details of standarddata structures from the literature: it is sufficient to explain how exactly you employ the datastructures in your algorithm, and include a reference to the literature where more details aboutthe data structure can be found.
After describing the details of a complicated algorithm, the reader may be overwhelmed andunsure about how everything fits together. This is especially true if you described the algorithmin an incremental way. You can make sure the reader is still with you by finishing with a concisedescription of the complete algorithm from beginning to end, this time with most details in, butwithout explaining why things as they are and without arguing why the algorithm is correct.This concise description could also be given in pseudocode (see Section 4).
At any stage in the description (initial conceptual description, details, final concrete description)you may use pseudocode to clarify your explanation, and to show how to deal with some specialcases that would not be interesting enough to describe in the main text. However, do not usepseudocode as a replacement for normal text: your explanation should still make sense if thereader decides to skip all pseudocode.
5
1.3.3 Making things precise
Throughout the description your algorithm, its input, its output, and its analysis, you shoulddefine all concepts you use clearly and precisely.
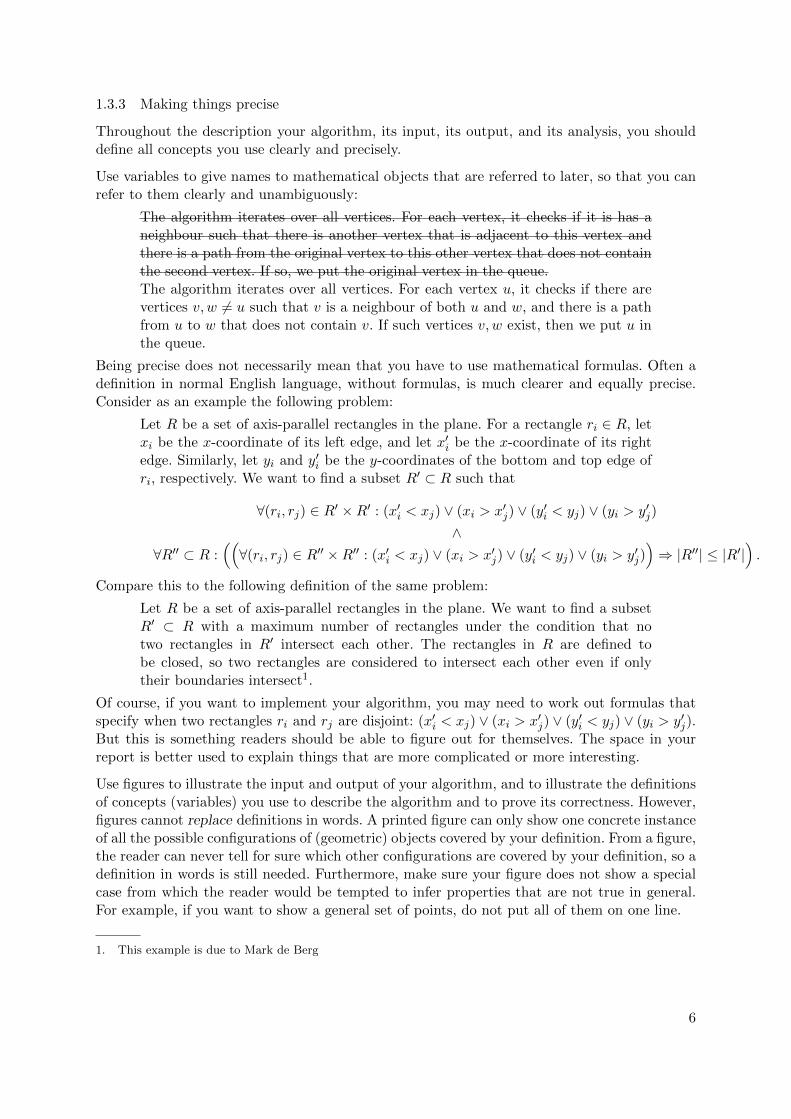
Use variables to give names to mathematical objects that are referred to later, so that you canrefer to them clearly and unambiguously:
The algorithm iterates over all vertices. For each vertex, it checks if it is has aneighbour such that there is another vertex that is adjacent to this vertex andthere is a path from the original vertex to this other vertex that does not containthe second vertex. If so, we put the original vertex in the queue.The algorithm iterates over all vertices. For each vertex u, it checks if there arevertices v, w 6= u such that v is a neighbour of both u and w, and there is a pathfrom u to w that does not contain v. If such vertices v, w exist, then we put u inthe queue.
Being precise does not necessarily mean that you have to use mathematical formulas. Often adefinition in normal English language, without formulas, is much clearer and equally precise.Consider as an example the following problem:
Let R be a set of axis-parallel rectangles in the plane. For a rectangle ri ∈ R, letxi be the x-coordinate of its left edge, and let x′i be the x-coordinate of its rightedge. Similarly, let yi and y′i be the y-coordinates of the bottom and top edge ofri, respectively. We want to find a subset R′ ⊂ R such that
∀(ri, rj) ∈ R′ ×R′ : (x′i < xj) ∨ (xi > x′j) ∨ (y′i < yj) ∨ (yi > y′j)
∧∀R′′ ⊂ R :
((∀(ri, rj) ∈ R′′ ×R′′ : (x′i < xj) ∨ (xi > x′j) ∨ (y′i < yj) ∨ (yi > y′j)
)⇒ |R′′| ≤ |R′|
).
Compare this to the following definition of the same problem:
Let R be a set of axis-parallel rectangles in the plane. We want to find a subsetR′ ⊂ R with a maximum number of rectangles under the condition that notwo rectangles in R′ intersect each other. The rectangles in R are defined tobe closed, so two rectangles are considered to intersect each other even if onlytheir boundaries intersect1.
Of course, if you want to implement your algorithm, you may need to work out formulas thatspecify when two rectangles ri and rj are disjoint: (x′i < xj) ∨ (xi > x′j) ∨ (y′i < yj) ∨ (yi > y′j).But this is something readers should be able to figure out for themselves. The space in yourreport is better used to explain things that are more complicated or more interesting.
Use figures to illustrate the input and output of your algorithm, and to illustrate the definitionsof concepts (variables) you use to describe the algorithm and to prove its correctness. However,figures cannot replace definitions in words. A printed figure can only show one concrete instanceof all the possible configurations of (geometric) objects covered by your definition. From a figure,the reader can never tell for sure which other configurations are covered by your definition, so adefinition in words is still needed. Furthermore, make sure your figure does not show a specialcase from which the reader would be tempted to infer properties that are not true in general.For example, if you want to show a general set of points, do not put all of them on one line.
1. This example is due to Mark de Berg
6
1.3.4 Analyzing the output quality of your algorithm
The description of the algorithm should already explain what is the purpose and meaning ofeach step in the algorithm. In some cases this already makes it clear that the algorithm iscorrect. In other cases, a proof of correctness is needed. See Section 1.5 for some basic adviceon how to write proofs.
If your algorithm is an optimization algorithm, you should try to analyze the quality of theoutput. Can the quality of the output be measured by a well-defined quality measure? Doesyour algorithm return optimal output according to this measure, or close-to-optimal output?Carefully distinguish between what you can prove and what you hope to be true. “The algorithmreturns an optimal clustering” is not the same as “We did our best to make the algorithm dothings that result in good clusterings and it seems to work”. To an algorithms researcher, “Thealgorithm returns an optimal clustering”, means: “It can be proven that the algorithm alwaysreturns an optimal clustering”, and if you make such a claim, you should prove it.
If you cannot prove that the algorithm returns an optimal solution, then try to give someexamples of inputs on which the algorithm should typically be expected to perform well, andof inputs on which the algorithm may perform badly.
1.3.5 Analyzing the efficiency (running time and memory usage)
Typically, the description of the algorithm does not mention running times of individual steps,because this would be too distracting: when reading the description of the algorithm, the readerneeds to concentrate on understanding what the algorithm does and why it works. Thereforeit is usually best to defer the analysis of the running time and memory usage of an algorithmcompletely until after the final description of the complete algorithm. Make sure that all variablesyou use in the analysis are well-defined: do not forget to define n.
1.3.6 Formulating theorems
You may summarize the theoretical properties of your algorithm in a theorem. This is especiallyappropriate if these properties belong to the main results of your work. A typical theorem aboutan algorithm has the following form:
Theorem 1 There is an algorithm that, given an (input) of n (things), computes an (out-put) that satisfies (some conditions depending on the input) in O(some function of n) time andO(some function of n) memory.
Indicate clearly what part of your text constitutes the proof of your theorem. Typically this isdone in one of the following ways:
• (only if the proof is short) state the theorem, start the proof with “Proof:” and concludethe proof with “”;
• state the theorem, write “We will now prove this theorem”, give the proof, and concludewith “This concludes the proof of Theorem (number)”;
• give the proof, write “This leads to the following theorem:”, and state the theorem.
7
1.4 Notation
To be able to describe your algorithms and/or state theorems accurately and concisely, you mayneed to introduce some notation. Choose notation that is easy to read and easy to remember.Here are some guidelines for how to accomplish this.
Use similar notation for similar concepts, and follow conventions as much as possible. Whatworks best depends on the needs of your text, but here are some ideas:
• lowercase greek letters for real numbers and angles; in particular, ε and δ are often usedfor small real numbers;
• lowercase latin letters for natural numbers and basic objects such as points (p, q), vertices(u, v, w), lines (`); in particular, i and j are usually indices of elements in a vector (array)or a matrix; input size is usually denoted by n; in the case of graphs, n is usually thenumber of vertices and m is usually the number of edges;
• capital letters for sets;• calligraphic letters for sets of sets and for structures such as graphs (G) and trees (T ).
Do not make notation more complicated than necessary. For example, you may define δG(u, v)to be the distance from vertex u to vertex v in the weighted graph G. But if, for any pair ofvertices u and v, it is always clear which graph is meant, then the notation δ(u, v) will do justfine.
You have some freedom to choose between parentheses, subscripts and superscripts to identifyproperties of objects. Compare:
• Let p1, ..., pn be the vertices of a polygon P . We denote the x-coordinate of pi by xpi .• Let p1, ..., pn be the vertices of a polygon P . We denote the x-coordinate of pi by x(pi).• Let p1, ..., pn be the vertices of a polygon P . We denote the x-coordinate of pi by xi.
Avoid the first solution: the second subscript is so small that it is barely readable. The secondsolution is acceptable, but, when used in a complex formula that contains many parenthesesalready, this solution may burden the reader with even more nested parentheses to match. Thethird solution may therefore be preferable, but it may not always be possible (for example, whatif you are discussing two polygons P and Q with vertices p1, ..., pm and q1, ..., qn?)
Use short names only for concepts that are only defined and referred to within one subsection orproof. Use longer, more descriptive names for concepts that are used throughout the document.Names of variables and functions can be longer than one letter. The notation “weight(v)” isclearer than “w(v)”. Compare also:
Given a set of points P and a line `, let P1, P2, and P3 be the sets of points tothe left of `, on `, and to the right of `, respectively.Given a set of points P and a line `, let P<`, P`, and P>` be the sets of points tothe left of `, on `, and to the right of `, respectively.
Think about where you want to introduce your notation. In principle any notation should beintroduced at the highest level in the document that includes all places where you need to usethe notation: if you need the notation in only one paragraph, define it in that paragraph; if youneed the notation in two paragraphs of the same (sub)section, define it in that (sub)section; ifyou need the notation in multiple sections of the document, define it in the introduction (orin a separate section after the introduction). No matter where you define your notation, thereader is likely to forget it if it has not been used for more than a page, or if the reader has beendoing something else and resumes reading your report in the middle. It can be very helpful tothe reader if you occasionally repeat a definition just before it is used, by writing things like:“Recall that δ(u, v) is the distance from u to v in G.”
8
1.5 Writing proofs
You may need to prove properties of your problem or your algorithms in your report. Below area few tips for some types of proofs you may need to write.
1.5.1 Equivalence proofs
To prove that a statement A is true if and only if a statement B is true, you always need toprove two things. Prove one of the following combinations:
• (i) if A is true, then B is true; (ii) if B is true, then A is true• (i) if A is true, then B is true; (ii) if A is not true, then B is not true• (i) if B is not true, then A is not true; (ii) if B is true, then A is true• (i) if B is not true, then A is not true; (ii) if A is not true, then B is not true
Make it clear that you will prove both parts, and make clear which part of your proof proveswhat:
Theorem 2 A triangle T is equilateral if and only if all angles of T are π/3.
Proof: We will have to prove that (i) if T is equilateral, all angles of T are π/3,and (ii) if all angles of T are π/3, then T is equilateral.To prove (i), ... This concludes the proof of part (i).To prove (ii), ... This concludes the proof of part (ii).
1.5.2 Proof by contradiction
The typical form of a proof by contradiction is: “For the sake of contradiction, assume (as-sumption A, which is the opposite of want we want to prove) (reasoning leading to conclusionB). However, by our assumption that we have (assumption A), we have (reasoning leading tothe conclusion that B is false). This contradicts (conclusion B); hence, (assumption A) is falseand (what we want to prove) is true.
1.6 Describing and discussing experiments
A description of experiments and results should include the following:
• a description of the test environment• a description of the test data• a description of the algorithms tested• a presentation of the experiments and results• a discussion of the results
1.6.1 Describing the test environment
Describe the test environment to the extent that is relevant for your experiments. If runningtime matters, mention what machine was used (processors, amount of memory), and whatprogramming language was used.
9
1.6.2 Describing the test data
Describe how the test data was obtained:
• Specify what files were downloaded from what sources: give enough details so that otherscould repeat your experiments with the same results.
• Specify how random data was generated. You should always give enough detail (includeall parameter settings) so that a skilled programmer could implement an algorithm thatgenerates random data with the same properties as your random data.
Give data sets clear names that could be used as labels in charts and tables. Include figuresto give the reader an impression what each data set looks like. With big data sets it is oftenimpossible to print a figure of the complete data set: in that case you can show a small part ofit, or a random sample of it (indicate clearly what you do).
1.6.3 Describing the algorithms tested
You probably described your algorithms earlier in the report already. Sometimes these descrip-tions still left things open (implementation choices, parameter settings) that were irrelevant tothe theoretical description of your algorithm, but could nevertheless influence the results of yourexperiments. Describe all such details: give enough detail so that a skilled programmer couldimplement your algorithms, repeat your experiments, and obtain the same results.
Give algorithms clear names that could be used as labels in charts and tables.
1.6.4 Describing the experiments and the results
Present the results of your experiments in charts and/or tables. Make sure that for each ex-periment it is clear what test data was used, what exact algorithm was tested, and how youralgorithm was evaluated. If the algorithm is non-deterministic (making random choices), specifyhow many times you ran each algorithm on each data set, and how you aggregated the results(for example: did you take the average, the best result, or the worst result).
1.6.5 Discussing the results
Describe the general trends that can be observed in your charts and tables, as well as outliers(results that do not correspond to the general trends, or results that are somehow suspicious).Check and double-check that your observations are clearly visible in the data you present incharts and tables. If you cannot find a reasonable way to draw the charts such that the trendsare clearly visible and can be verified by the reader, then you should ask yourself if the supposedtrend is not merely a product of wishful thinking.
Discuss how your experimental results relate to the theoretical analysis and expectations youhad of your algorithm: do the results confirm your expectations, or do they contradict yourexpectations?
10
1.7 Conclusions/discussion/recommendations
In the last section of your report, you relate your results to the problem statement in theintroduction. This means you have to do more than simply copying your results from theabstract, the introduction, and the rest of your report. The last section of your report shouldclarify to what extent you solved the problem presented in the introduction. Ask yourself thefollowing questions:
• In what aspects and for what types of input is your algorithm very good?• In what aspects and for what types of input is your algorithm not good?• Do you have an idea what may be the cause of bad performance of your algorithm on
certain types of input?• If yes, how could you (or somebody else, in future research) test if this idea is correct?• What would be the main problem to overcome if you want to get a better algorithm?• Could your algorithm also be used to solve other (possibly similar) problems that are
beyond the scope of your original problem statement?
Any claims you make should be supported by the material presented in the report before. Keepa clear distinction between claims for which you have a theoretical proof, claims for which youhave evidence, and claims which may be true by lack of evidence to the contrary. “Our algorithmalways produces the correct result” should mean that for this claim, you have a theoretical proofthat is valid for all possible inputs. If you do not have theoretical proof, you may be able towrite: “In our experiments, our algorithm always produced the correct result”.
In your evaluation, you may also consider aspects of the algorithm that may not be covered bythe problem statement, but in hindsight, should have been. For example, if your algorithm solvesthe problem as presented in the introduction perfectly, but in hindsight in turns out that theoutput is useless for practical applications, then there was something wrong with the problemstatement. In that case, you could discuss how the problem statement might be improved.
Note that lazy readers only read the introduction and the conclusions of a report. This is whereyou can show that you really have a good understanding of the topic.
1.8 Acknowledgements
Many reports have a brief section called “Acknowledgements”. Here you acknowledge any typeof help you got from other people, for example, useful comments, software tools or test datathat are not publicly available, help with technical problems etc.
11
1.9 Bibliography
At the end of the report, there is a bibliography or reference list. Here you list all written sourcesthat are referred to in the main text and give more details on the problem area, previous work,data structures used etc. The main “rules” for the bibliography are:
• only list sources that are explicitly referred to in the main text (this rule is strict);• verify that each of these sources gives the information for which it is referred to;• give the most reliable sources;• try to use sources that are easily accessible;• give enough publication details so that it is absolutely unambiguous which source (and
which version of it) you refer to, and so that the reader can retrieve it.
Verifying the source means that each item in the bibliography must have been seen by at leastone author of the report with her own eyes. The source must be written in a language that isunderstood by the author who verified the source.
Sources can be, from generally reliable to generally unreliable:
• well-known text books and publications in well-known international academic journals;• PhD theses;• long papers (more than six pages) in peer-reviewed international conferences;• technical reports;• any other printed publications;• websites.
If you used knowledge from lesser sources, always try to replace them by more reliable sources.Wikipedia can be very helpful: if you are lucky, the article you are reading has been editedthoroughly by experts on the topic, and then a Wikipedia article can be more helpful than aprinted publication. However, on Wikipedia you are not always lucky, and moreover, informationon Wikipedia can change any time. Always look for printed, stable sources that confirm whatyou found on Wikipedia.
Try to use sources that can at least be ordered on-line, and are written in a language mostreaders understand.
Publication details include:
• names of the authors;• title;• publisher, journal, or institute (depending on the type of source)• volume and number (if the publication is part of a series)• article number or page numbers (when referring to a book, indicate on which pages or
in which section the reader can find the information for which you refer to the book)• date (for a website, give the exact date on which you studied the website; for other
publications the year suffices)
12
1.10 Structure
1.10.1 Sections and subsections
Make sure your report is divided into sections and subsections in a way that helps the readerunderstand where to find what in your report. Every section and subsection should have aclear topic that sets it apart from the other sections, or from the other subsections in the samesection, respectively. Try to give similar parts of the report similar structure: for example, if youdescribe two complicated algorithms, and the description of one algorithm is divided into threesubsections (approach, implementation, and analysis), then you should use the same subdivisioninto subsections for the other algorithm.
Give each section or subsection a concise title that describes the contents of section. Do notmake the titles too concise. Suppose your document describes, for example, an incrementalalgorithm and a divide-and-conquer algorithm, each in its own section with subsections forapproach, implementation and running time analysis. Then a subsection title “Running timeof the divide-and-conquer algorithm” is more useful than a subsection title that just reads:“Analysis”.
Start each section with a paragraph that gives an overview over the whole section, rather thanimmediately diving into the first subsection.
Avoid having too many small subsections, and avoid too large subsections: at the lowest levelof subdivision, a ((sub)sub)section should be at most a few pages.
1.10.2 Paragraphs
Divide the text within each section, subsection or subsubsection into meaningful paragraphs.Typically a paragraph starts with a sentence that defines the topic of the paragraph. The rest ofthe paragraph then develops that topic. In paragraphs in which you give arguments to supporta certain statement, this usually builds up to the last sentence in which you conclude that thestatement is true.
The first sentence of a paragraph should also clarify how the paragraph relates to the previousparagraph: use appropriate linking words or phrases such as: “however”, “moreover”, “never-theless”, “as a result”, “this is caused by”, “in particular”, “in conclusion”, “to prove/compute/solve/test this”, “next” etc. Avoid linking paragraphs together by writing things such as “An-other thing we should mention is ...”: this does not help the reader to understand the structureof your text. If the paragraph is part of a list, for example a series of three paragraphs eachdiscussing a particular problem with a certain algorithm, then you should introduce that listwith a sentence that explains that there are three problems, and start the paragraphs withwords such as “firstly”, “secondly”, and “lastly”.
Paragraphs should not be too long. Paragraphs longer than 1/4 of a page should definitely bebroken up into smaller paragraphs. Paragraphs should not be too short either. It is possiblethat the structure of the text results in some very short paragraphs, but if you have severalparagraphs in a row that each consist of only one or two sentences, then the paragraph structurewill not help the reader much, and you should probably join some of these paragraphs into oneparagraph.
13
2 Lay-out and typography
2.1 (No) Cover page
With larger reports, it may be good to have a separate cover page, to include a table of contents(and maybe even a list of tables and figures) and to make sure that every chapter starts at thetop of an odd-numbered page. However, in a report of only a few dozen pages this would bea waste of paper: a cover page, a table of contents and white pages are not necessary and notappreciated.
2.2 Titles of the document, sections, subsections and paragraphs
For the typography of titles of sections, tables, and the report as a whole there are many options:you can make use of different fonts, different font sizes, upper- and lowercase letters, and whitespace below and above the titles. My advice is to stick to the LATEX defaults: titles are typesetin boldface; higher-level titles are typeset in bigger fonts with more white space around. Use acapital for the first letter of the first word of a title.2
2.3 Text
If you want to emphasize certain words or phrases in your text, use italics (boldface and un-derlining is considered over the top); in LATEX you can do this with the command \emph. Whenyou define a concept, emphasize it (only the first time):
A spanning tree of a graph G is a tree whose vertices are the vertices of G,and whose edges are a subset of the edges of G. A minimum spanning tree of aweighted graph G is a spanning tree of G that has minimum total edge weightamong all spanning trees of G.
2.4 Bibliography
Use a consistent lay-out for the bibliography. Format all sources of the same type in the sameway. It is common practice to put the title of the whole publication in italics. Thus, if you referto an article in a journal or an abstract in the proceedings of a conference, it is the title of thejournal or the proceedings (conference) that is in italic font, while the title of the paper itselfis in normal font. Here are examples of how you could typeset references to a journal paper, aconference paper, and a PhD thesis, respectively:
• Herman Haverkort and Freek van Walderveen: Locality and bounding-box quality oftwo-dimensional space-filling curves, Computational Geometry (CGTA), 43(2):131–147(2010).
• Mark de Berg, Otfried Cheong, Herman Haverkort, Jung-Gun Lim, and Laura Toma:I/O-efficient flow modeling on fat terrains, Proc. 10th Int. Workshop on Algorithms andData Structures (WADS), 2007, LNCS 4619:239-250.
• Micha Streppel: Multifunctional geometric data structures, PhD thesis Eindhoven Uni-versity of Technology, Dept. of Computer Science, 2007.
2. Different publishers and style guides give different rules for which words in a title should start with a capital.Some publishers and style guides prefer to capitalize only the first word of the title. Another common style is touse capitals for the first letters of all “important” words in the title. Unfortunately this raises many questionsabout which words get a capital and which words do not. To stay on the safe side, only capitalizing the first wordis a good choice.
14
3 Language
In this section you will find some advice on how to write your report in proper English, in theproper style, and how to avoid common pitfalls in mathematical writing.
3.1 Style: personal versus impersonal
3.1.1 You becomes we
In technical writing, we avoid the second person (“you”, “your”). To address the reader, use“we”. In this case “we” can be understood as: the reader(s) and I/we, the author(s).
In Section 2, we have seen how to ...In Section 2, you have seen how to ...
3.1.2 I becomes we
The singular first person (“I”, “me”, “my”) is also avoided. If a text has multiple authors, theyare all responsible for the complete text, and write as if they did everything together:
We have tested our algorithm on ...I have tested my algorithm on ...
3.1.3 It becomes we
Do not overuse the passive form: it can make your text look clumsy.
First, a heap is built from the input elements. Then a loop is executed: in eachiteration, an element is extracted from the heap, the element is appended tothe sorted list, and the heap property is restored by calling MinHeapify. This isrepeated until the heap is empty.The algorithm first builds a heap from the input elements. Then we execute aloop: in each iteration, we extract an element from the heap, append the elementto the sorted list, and call MinHeapify to restore the heap property. We repeatthis until the heap is empty.
In my opinion, the second description is much more pleasant to read. I believe the use of “thealgorithm”, and then even “we”, invites the reader to identify himself with the computer thatis running the algorithm: the reader is invited to be in the middle of the action and to imaginewhat would happen if he would perform the steps of the algorithm himself.
3.1.4 Her, him, and it
In English, “him” and “her” are only used to refer to persons. Objects (and, usually, even ani-mals) are referred to by “it”. However, when using “it” in mathematical writing, it is importantthat you make absolutely sure that it is absolutely clear (even for the slightly careless reader)what “it” refers to. Often it is better to give the object that is being referred to a name:
If the vertex extracted from the queue has the same label as the starting vertex,he is coloured blue and his neighbours are enqueued.If the vertex v extracted from the queue has the same label as the starting vertex,then we colour v blue and enqueue its neighbours.
15
In case you need to refer to single third persons, an easy and non-obtrusive way to do this in agender-neutral way is to sometimes use “she” and “her”, and sometimes use “he”, “him” and“his”—but keep it locally consistent, as people do not usually change gender from one sentenceto another. Another non-obtrusive solution is to use the plural. This is not always possible, butoften it is.
3.2 Style: variation versus monotonicity
In literary writing, repeating words and phrases in consecutive sentences is sometimes consideredevidence of poor style or a poorly-educated author’s small vocabulary. However, in mathematicalwriting, precision is everything. When referring to the same concept, use the same word: avoidsynonyms, so that the reader does not have to worry about any subtle differences between thedefinitions of the two words:
If u is a vertex of G, then we colour u blue, whereas if u is a node of H, we colouru red.If u is a vertex of G, then we colour u blue, whereas if u is a vertex of H, wecolour u red.
When two things are analogous, then use analogous wording to describe them:
If u is a vertex of G, then we colour u blue, whereas we colour u red, if u is avertex of H.If u is a vertex of G, then we colour u blue, whereas if u is a vertex of H, wecolour u red.
3.3 Grammar and structure of sentences
3.3.1 Length of sentences
Make sentences not too short and not too long. Occasionally a long sentence is hard to avoid,but as a rule, three lines is too long.
3.3.2 Much, many, amount, and number
The words “many” and “number” are used with the plural forms of countable concepts. Thewords “much” and “amount” are used with uncountable concepts, which do not have pluralforms:
many memory, many time, many money, the number of memory, the number oftime, the number of moneymuch memory, much time, much money, the amount of memory, the amount oftime, the amount of moneymuch vertices, much points, the amount of vertices, the amount of pointsmany vertices, many points, the number of vertices, the number of points
3.3.3 Then and than
In comparisons, use “than”, not “then”:
The number of edges of G is greater then the number of edges of HThe number of edges of G is greater than the number of edges of H
16

3.3.4 To be done and to have been done
When describing algorithms, it is important to be clear about what has been done, what isbeing done, and what still remains to be done. Note that the Dutch “is berekend” does nottranslate to “is computed”:
Dutch English
is berekend has been computed (computation is complete and results are available)wordt berekend is computed (computation is ongoing and results are still to come)
3.3.5 References
A common mistakes is to use references to the bibliography as words. This cannot be done:
In [4] it is proven that...De Berg et al. [4] prove that...
Note how the second sentence is also more informative to the reader, making it much easier forhim to guess or remember which publication is meant by reference [4].
3.3.6 Type consistency
Avoid type mismatches, like you would when programming. Often the result of a type mismatchis that it is unclear what the author means. Here are some examples:
Wrong: “We assume the set of points S does not have the same x-coordinate.”Problem: a set does not have an x-coordinate.Correct: “We assume that no two points from S have the same x-coordinate.”
Wrong: “If the weight of edge e is more than f , then we change f to e.”Problem: is f a weight or an edge?Correct: “If the weight of edge e is more than the weight of f , then we change the weight of fto the weight of e.” Or: “If weight(e) > weight(f), then we change weight(f) to weight(e).”
Wrong: “The algorithm runs in O(n).”Problem: O(n) of what? time? memory? something else?Correct: “The algorithm runs in O(n) time.” Or: “The algorithm runs in O(n) memory.”
Wrong: “This algorithm is the easiest to solve.”Problem: an algorithm is not something that can be solved; an algorithm is something that isused to solve a problem.Correct: “This problem is the easiest to solve.” Or: “This algorithm is the easiest solution.”
3.4 Words and concepts to be careful with
3.4.1 Miljard, billion etc.
Unfortunately, the English-speaking world got confused about the meaning of the word “billion”.It seems that by now, in English this is practically always taken to mean 109. However, the non-English speaking part of Europe still believes that a billion is 1012. To avoid confusion in aninternational context, do not use words for any numbers greater than 999 999 999.
17
3.4.2 Maximum and maximal
In mathematical writing, there is a subtle difference between “maximum” and “maximal”.“Maximum” means: as large as possible. “Maximal” means: cannot be enlarged. Consider,for example, independent sets in graphs: a subset S of the nodes of a graph G = (V,E) isindependent if and only if there is no pair of nodes u, v ∈ S that is connected by an edge(u, v) ∈ E. A maximum independent set is an independent set I such that no independent setis larger than I. A maximal independent set is an independent set I such that, if you wouldadd any vertex of V \ I to I, then I would not be an independent set anymore.
3.4.3 Worst-case complexity
Be precise when making statements about the asymptotic running times of algorithms. Thefollowing five statements all mean something different:
• “The algorithm needs O(n2) operations.” This statement gives an upper bound on thenumber of operations in the worst case (and thus, also in the best case). It is possiblethat the bound is not tight and the algorithm is actually faster, even in the worst case.
• “The algorithm needs Ω(n2) operations in the worst case.” This statement gives a lowerbound on the number of operations in the worst case. In the best case, the algorithmmay be faster.
• “The algorithm needs Ω(n2) operations.” This statement gives a lower bound on thenumber of operations in the best case (and thus, also in the worst case).
• “The algorithm needs Θ(n2) operations in the worst case.” This statement says thatfor any n that is large enough, there are inputs for which the algorithm actually needsa quadratic number of operations (never more). However, there may also be inputs onwhich the algorithm is faster.
• “The algorithm needs Θ(n2) operations.” This statement says that the algorithm alwaysuses a quadratic number of operations when n is large enough, even in the best case.
Note that, for example, if one algorithm uses O(n3) operations, and another algorithm usesO(n2) operations, there is no way to know which algorithm is faster, not even for large n. BigO’s only give upper bounds on the running time—without lower bounds (Θ- or Ω-bounds), itis very well possible that, for example, both algorithms actually run in O(n log n) time.
3.4.4 Average-case complexity
Do not mention it. Analyzing the average-case running time of an algorithm is only conceivableif you know the probability distribution of all possible inputs. This is almost never the case.
3.4.5 Best-case complexity
Do not mention it.
3.4.6 Expected running time
“Expected running time” is a technical term which means: the average running time over agiven (possibly infinite) set of runs of a randomized algorithm on the same input; note that thisinput may be a worst-case input.
When explaining the workings of your algorithm, it is perfectly fine to give your intuition aboutwhat you expect the running time of your algorithm to be in practice. However, do not use the
18
exact phrase “expected running time” then. Do not make any statements about the “expectedrunning time” of an algorithm, unless you can do the necessary (and usually very difficult) mathto back it up.
3.4.7 It is easy to see
Never write “It is easy to see that...”. If it is, it is also easy to explain, and you should just dothat. If you do not know how to explain it, then, apparently, it is not easy, and claiming thatit is easy will make the reader either suspicious or insecure.
3.4.8 Respectively
“Respectively” is used for the same purpose as “respectievelijk” in Dutch, but in English, it isput in a different place in the sentence:
The blue and the red points lie respectively inside and outside the rectangle.The blue and the red points lie inside and outside the rectangle, respectively.
Often it is clearer to avoid using “respectively” altogether:
The blue points lie inside the rectangle whereas the red points lie outside therectangle.
3.5 Spelling
There are some things your spell checker may not catch: note the difference between “to prove”(the verb “bewijzen”) and “the proof” (the noun “het bewijs”).
Do not use “thru” and “til(l)”: these are informal short forms of “through” and “until”, respec-tively.
Note the following irregular plurals: leaf–leaves, vertex–vertices, index–indices. However, whenusing “index” in the meaning of “data structure”, then the plural is simply “indexes”.
Avoid abbreviations. Abbreviations that you defined yourself are always much harder to remem-ber for the reader than they are for the authors. Also avoid abbreviations such as “i.e.”, “e.g.”,“w.l.o.g.”, “iff”: many readers (and many authors) do not know exactly what they mean. Tocommunicate most clearly, it is much better to write the words out completely.
3.6 Numbers
In some countries, the number three thousand two hundred one is usually written as “3.201”and the number three and two hundred one thousandths is written as “3,201”, while in othercountries it is exactly the other way around. To reduce the risk of confusion, use narrow spaces(\, in LATEX) to separate the thousands, and use a point to separate the fractional part fromthe integral part:
3.201 and 3,2013,201 and 3.2013 201 and 3.201
Use words for quantities up to twelve:
This graph contains at most 8 nodes.This graph contains at most eight nodes.
19
3.7 Punctuation
3.7.1 Commas (,)
As a rule of thumb, use commas wherever a pause would help the reader in parsing the sentencecorrectly. In case of doubt, insert a comma: it is better to have too many commas than to havetoo few.
In particular, commas are often used around words or expressions that interrupt the normalflow of a sentence:
This is, of course, not straightforward to implement.
Commas are also used at the end of subordinate clauses, especially if they are long:
If all children of u are coloured red, we colour u blue.
Relative clauses start with a comma if the clause gives identifying information about its an-tecedent, but not if the clause only gives additional information that does not contribute toidentifying the antecedent. The difference can be quite subtle. For example, consider three dotsin a row: the leftmost dot and the dot in the middle are blue, and we do not know the colourof the rightmost dot yet. Now, if we would write: “u is the rightmost dot, which is blue” (witha comma), then the relative clause “which is blue” does not contribute to identifying u, so thereader must assume that u is simply the rightmost dot, and in addition, we inform the readerthat the rightmost dot is blue. However, if we would write: “u is the rightmost dot which isblue” (without a comma), then the relative clause “which is blue” is part of the definition of u.Then there are two possibilities: either the rightmost dot is blue, and then u is the rightmostdot, or the rightmost dot is not blue, and then u is the middle dot.
Commas are used to separate items in a list, but usually not if the list contains only two simpleitems:
The data structure stores vertices, edges, and faces.The data structure stores the vertices of degree at least five that have a neighbourof degree one, and the edges between those vertices.The data structure stores vertices, and edges.The data structure stores vertices and edges.
If the items in a list are each on a separate line, or if the items are grammatically complex (inparticular if they contain commas themselves), then semicolons can be used instead of commas.
Commas cannot be used between grammatically complete sentences. There one should use afull stop, a colon, or a semicolon, according to the rules explained below.
3.7.2 Colons (:) versus commas
Colons are used to indicate that what follows gives an explanation or more details of what camebefore. Commas cannot be used in this way:
Take the introduction very seriously, this should be the best-written part of thewhole report.Take the introduction very seriously: this should be the best-written part of thewhole report.
3.7.3 Semicolons (;) versus commas
Semicolons provide a way to separate expressions that is stronger than a comma, but less strongthan a full stop.
20
Semicolons are frequently used instead of commas to separate items in a list, if the items aregrammatically complex (especially if they contain commas) or if they are on separate lines.
3.7.4 Apostrophes (’)
Apostrophes are used to make possessive forms of nouns:
the point’s coordinates meaning: the coordinates of the pointthe points’ coordinates meaning: the coordinates of the points
In formal writing, do not use apostrophes to make contractions:
it’s, we’ll, we’ve, we’re, don’t, doesn’t, can’t, won’t, isn’tit is, it has, we will, we have, we are, do not, does not, cannot, will not, is not
Never write “it’s” in formal writing: the neutral possessive pronoun (“zijn”) is “its” (withoutapostrophe); “it’s” means “it is” or “it has” and should be written out completely:
It’s impossible to compute the original key from it’s hash valueIt is impossible to compute the original key from its hash value.
3.7.5 Hyphens
When combining words in English, there are no clear rules about when to keep the wordsseparated by spaces (“data base”), when to combine them with a dash (“data-base”), and whento write them as one word (“database”). In case of doubt, use spaces, or use Google to see howthe rest of the world writes it. However, in some cases, hyphens are necessary.
When combining words with spaces, the combinations are right-associative. This can be changedwith hyphens: a hyphen has the effect of putting parentheses around the words connected bythe hyphen. Compare:
spelling with parentheses meaning
worst case analysis (worst (case analysis)) a case analysis that is reallybadly done, for example withlots of mistakes
worst-case analysis ((worst case) analysis) an analysis of the worst case
3.8 Typesetting formulas
Use a consistent typography for mathematical symbols: use italics for variables (in LATEX: usethe math environment):
x-axisx-axis
Make sure that symbols in figures are typeset in the same way as in the main text (consider touse ipe: this is a figure editor that uses LATEX for typesetting).
Put names of standard functions in normal font. You can also define your own “standard”functions. If LATEX has a command for your function, use it (for example, \sin), otherwise youcan use \mathrm to put text in normal font:
sin(x+ width(y))sin(x+ width(y))
21

For variable names of more than one letter, you can use \mathit. Without \mathit there willbe too much space between the letters. Do not use dashes in variable names, because these canbe confused with minus signs:
Cluster −QualityClusterQuality
Use double-stroke letters for the standard sets of numbers (in LATEX, use \mathbb):
N,Z,Q,R,C
3.9 Mixing mathematical symbols and text
Do not start a sentence with a mathematical symbol, and separate symbols in different formulasby words:
f(x) is positive for all x ≥ 1, g(x) is negative for all x ≥ 0, and h(x) is at least 0and at most 1 for all x ≥ 0.The function f(x) is positive for all x ≥ 1, the function g(x) is negative for allx ≥ 0, and h(x) is at least 0 and at most 1 for all x ≥ 0.
22
4 Pseudocode
Explaining an algorithm in paragraphs of normal English text is difficult. Therefore it is oftenuseful to include a description in pseudocode as well—as well, that is, not instead of an intuitivetextual description. The main goal of using pseudocode is to clarify the flow of control (loopsand branching) in an algorithm. Pseudocode should be readable by anybody who understandsbasic algorithmic concepts such as loops, variables, and function calls. In particular, it shouldbe readable by anybody who understands the basic concepts but does not know C++, Java,Pascal, or whatever your favourite programming language is. Remember that pseudocode isused to explain how an algorithm works; not to explain how to code it.
For typesetting pseudocode, there are several LATEX packages available, for example algorithm2e.
4.1 Loops
You can use the following structures for loops:
• A for loop in which variable starts at firstValue, is increased by one after each iteration,and which terminates as soon as variable > lastValue:for variable = firstValue to lastValue do
statement...
• A for loop in which variable starts at firstValue, is decreased by one after each iteration,and which terminates as soon as variable < lastValue:for variable = firstValue down to lastValue do
statement...
• A for loop in which variable takes on the values of the elements of a sequence (such asa linked list), in order:for each variable in sequence do
statement...
• A while loop:while condition do
statement...
• A repeat-until loop:repeat
statement...
until condition
There are many other formats for loops in pseudocode that are equally acceptable. However, donot use Java/C-style for-loops (for (...; ...; ...)) and switch-statements in pseudocode: they arenot universally understood. Avoid using a while-statement when the same loop can be writtenas a for-loop.
23
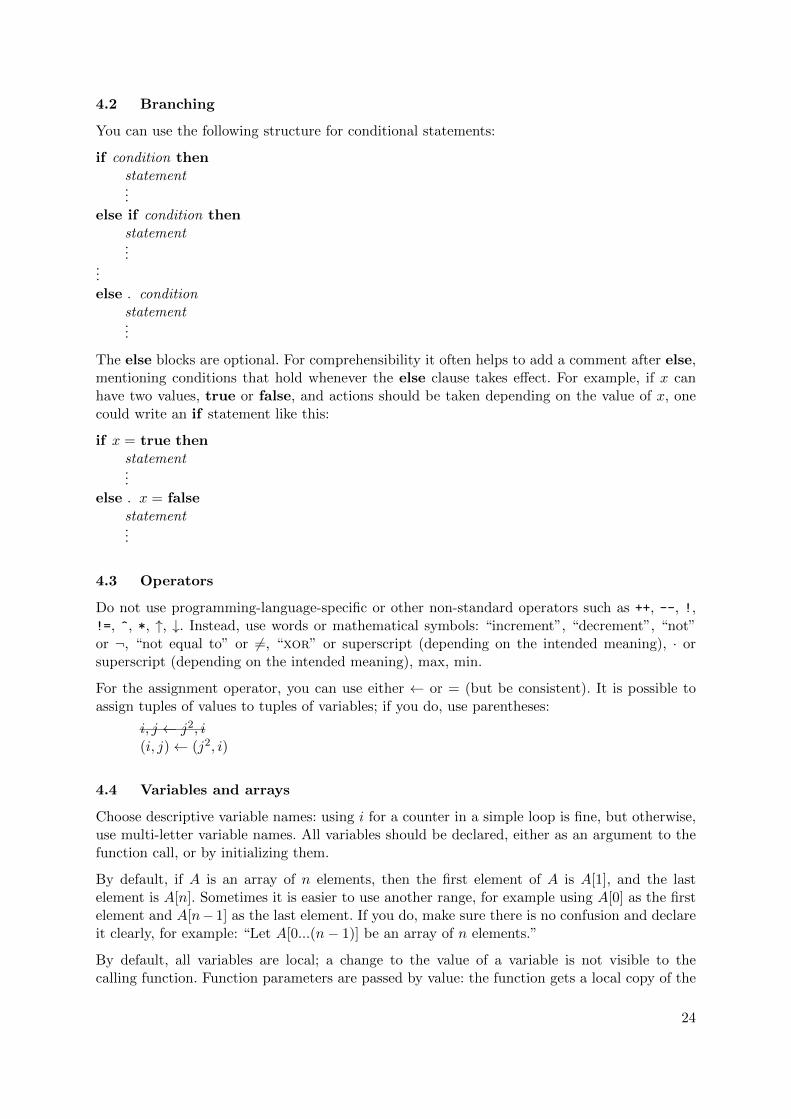
4.2 Branching
You can use the following structure for conditional statements:
if condition thenstatement...
else if condition thenstatement...
...else . condition
statement...
The else blocks are optional. For comprehensibility it often helps to add a comment after else,mentioning conditions that hold whenever the else clause takes effect. For example, if x canhave two values, true or false, and actions should be taken depending on the value of x, onecould write an if statement like this:
if x = true thenstatement...
else . x = falsestatement...
4.3 Operators
Do not use programming-language-specific or other non-standard operators such as ++, --, !,!=, ^, *, ↑, ↓. Instead, use words or mathematical symbols: “increment”, “decrement”, “not”or ¬, “not equal to” or 6=, “xor” or superscript (depending on the intended meaning), · orsuperscript (depending on the intended meaning), max, min.
For the assignment operator, you can use either ← or = (but be consistent). It is possible toassign tuples of values to tuples of variables; if you do, use parentheses:
i, j ← j2, i(i, j)← (j2, i)
4.4 Variables and arrays
Choose descriptive variable names: using i for a counter in a simple loop is fine, but otherwise,use multi-letter variable names. All variables should be declared, either as an argument to thefunction call, or by initializing them.
By default, if A is an array of n elements, then the first element of A is A[1], and the lastelement is A[n]. Sometimes it is easier to use another range, for example using A[0] as the firstelement and A[n− 1] as the last element. If you do, make sure there is no confusion and declareit clearly, for example: “Let A[0...(n− 1)] be an array of n elements.”
By default, all variables are local; a change to the value of a variable is not visible to thecalling function. Function parameters are passed by value: the function gets a local copy of the
24
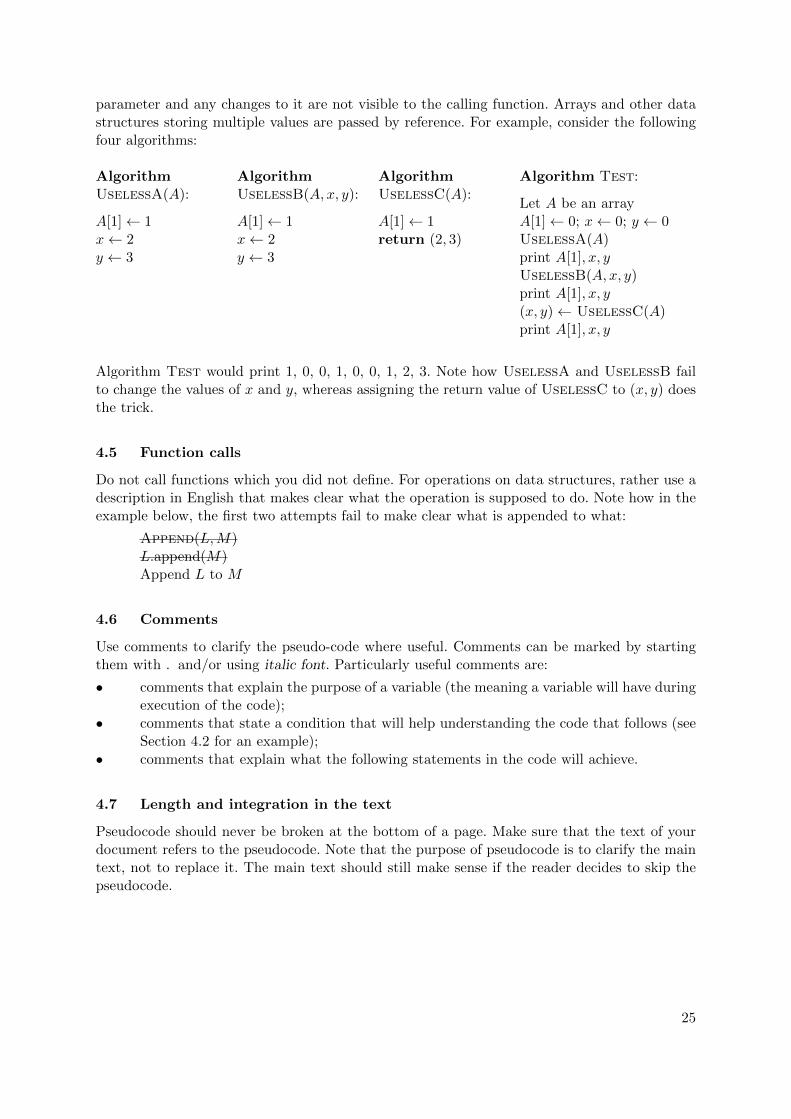
parameter and any changes to it are not visible to the calling function. Arrays and other datastructures storing multiple values are passed by reference. For example, consider the followingfour algorithms:
AlgorithmUselessA(A):
A[1]← 1x← 2y ← 3
AlgorithmUselessB(A, x, y):
A[1]← 1x← 2y ← 3
AlgorithmUselessC(A):
A[1]← 1return (2, 3)
Algorithm Test:
Let A be an arrayA[1]← 0; x← 0; y ← 0UselessA(A)print A[1], x, yUselessB(A, x, y)print A[1], x, y(x, y)← UselessC(A)print A[1], x, y
Algorithm Test would print 1, 0, 0, 1, 0, 0, 1, 2, 3. Note how UselessA and UselessB failto change the values of x and y, whereas assigning the return value of UselessC to (x, y) doesthe trick.
4.5 Function calls
Do not call functions which you did not define. For operations on data structures, rather use adescription in English that makes clear what the operation is supposed to do. Note how in theexample below, the first two attempts fail to make clear what is appended to what:
Append(L,M)L.append(M)Append L to M
4.6 Comments
Use comments to clarify the pseudo-code where useful. Comments can be marked by startingthem with . and/or using italic font. Particularly useful comments are:
• comments that explain the purpose of a variable (the meaning a variable will have duringexecution of the code);
• comments that state a condition that will help understanding the code that follows (seeSection 4.2 for an example);
• comments that explain what the following statements in the code will achieve.
4.7 Length and integration in the text
Pseudocode should never be broken at the bottom of a page. Make sure that the text of yourdocument refers to the pseudocode. Note that the purpose of pseudocode is to clarify the maintext, not to replace it. The main text should still make sense if the reader decides to skip thepseudocode.
25
5 Charts
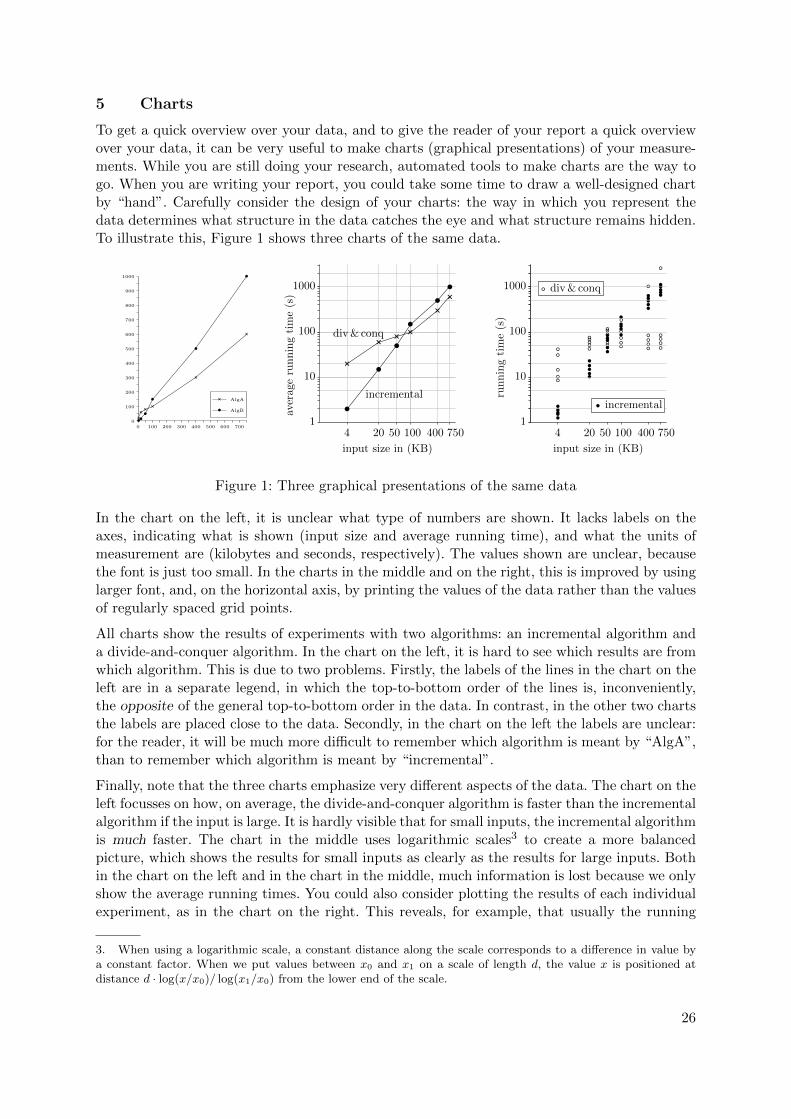
To get a quick overview over your data, and to give the reader of your report a quick overviewover your data, it can be very useful to make charts (graphical presentations) of your measure-ments. While you are still doing your research, automated tools to make charts are the way togo. When you are writing your report, you could take some time to draw a well-designed chartby “hand”. Carefully consider the design of your charts: the way in which you represent thedata determines what structure in the data catches the eye and what structure remains hidden.To illustrate this, Figure 1 shows three charts of the same data.
0 100 200 300 400 600500 7000
100
200
300
400
500
600
700
AlgA
AlgB
800
900
1000
4 20 50 100 400 7501
10
100
1000
incremental
div& conq
input size in (KB)
averag
erunningtime(s)
runningtime(s)
4 20 50 100 400 7501
10
100
1000
input size in (KB)
div& conq
incremental
Figure 1: Three graphical presentations of the same data
In the chart on the left, it is unclear what type of numbers are shown. It lacks labels on theaxes, indicating what is shown (input size and average running time), and what the units ofmeasurement are (kilobytes and seconds, respectively). The values shown are unclear, becausethe font is just too small. In the charts in the middle and on the right, this is improved by usinglarger font, and, on the horizontal axis, by printing the values of the data rather than the valuesof regularly spaced grid points.
All charts show the results of experiments with two algorithms: an incremental algorithm anda divide-and-conquer algorithm. In the chart on the left, it is hard to see which results are fromwhich algorithm. This is due to two problems. Firstly, the labels of the lines in the chart on theleft are in a separate legend, in which the top-to-bottom order of the lines is, inconveniently,the opposite of the general top-to-bottom order in the data. In contrast, in the other two chartsthe labels are placed close to the data. Secondly, in the chart on the left the labels are unclear:for the reader, it will be much more difficult to remember which algorithm is meant by “AlgA”,than to remember which algorithm is meant by “incremental”.
Finally, note that the three charts emphasize very different aspects of the data. The chart on theleft focusses on how, on average, the divide-and-conquer algorithm is faster than the incrementalalgorithm if the input is large. It is hardly visible that for small inputs, the incremental algorithmis much faster. The chart in the middle uses logarithmic scales3 to create a more balancedpicture, which shows the results for small inputs as clearly as the results for large inputs. Bothin the chart on the left and in the chart in the middle, much information is lost because we onlyshow the average running times. You could also consider plotting the results of each individualexperiment, as in the chart on the right. This reveals, for example, that usually the running
3. When using a logarithmic scale, a constant distance along the scale corresponds to a difference in value bya constant factor. When we put values between x0 and x1 on a scale of length d, the value x is positioned atdistance d · log(x/x0)/ log(x1/x0) from the lower end of the scale.
26

time of the divide-and-conquer algorithm in this experiment hardly depends on the input size,but sometimes it is much slower than the other algorithm.
Scale the charts in your report to the right size: do not waste a full page if, with a bit of care,an equally informative and equally clear chart could be drawn that is much smaller. Do nottry to save space by letting a linear vertical axis start at any other value than zero: this wouldmake the chart really confusing.
It is allowed to use colours for clarity, but do not rely on them: readers and reviewers may printyour report in black-on-white.
Just like with pseudocode and figures, always refer to the chart from the main text of thedocument. A chart that is never referred to is easily overlooked by the reader, because thereader will usually not miss it.
27
6 Tables
When putting numbers in tables, make sure that it is clear what the numbers mean. What isthe unit of measurement? (for example: milliseconds, seconds, or minutes?). Label the table sothat it is clear what data is shown in the table.
Do not give more digits than necessary: often everything after the second digit is uninterestingbecause these digits are unreliable (the result of random fluctuations in the tests) and irrelevantfor comparisons.
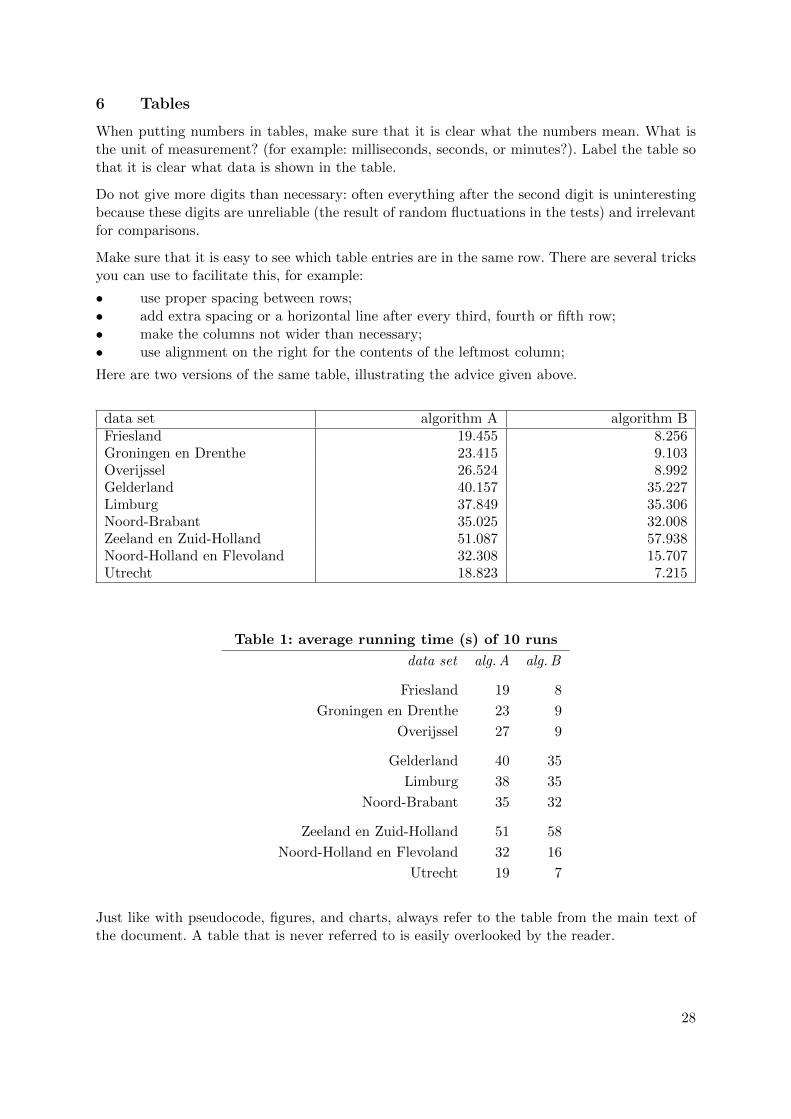
Make sure that it is easy to see which table entries are in the same row. There are several tricksyou can use to facilitate this, for example:
• use proper spacing between rows;• add extra spacing or a horizontal line after every third, fourth or fifth row;• make the columns not wider than necessary;• use alignment on the right for the contents of the leftmost column;
Here are two versions of the same table, illustrating the advice given above.
data set algorithm A algorithm BFriesland 19.455 8.256Groningen en Drenthe 23.415 9.103Overijssel 26.524 8.992Gelderland 40.157 35.227Limburg 37.849 35.306Noord-Brabant 35.025 32.008Zeeland en Zuid-Holland 51.087 57.938Noord-Holland en Flevoland 32.308 15.707Utrecht 18.823 7.215
Table 1: average running time (s) of 10 runs
data set alg. A alg. B
Friesland 19 8
Groningen en Drenthe 23 9
Overijssel 27 9
Gelderland 40 35
Limburg 38 35
Noord-Brabant 35 32
Zeeland en Zuid-Holland 51 58
Noord-Holland en Flevoland 32 16
Utrecht 19 7
Just like with pseudocode, figures, and charts, always refer to the table from the main text ofthe document. A table that is never referred to is easily overlooked by the reader.
28