wsda specialty crop block grant program 2013 final ... · specialty crop block grant program 2013...
TRANSCRIPT

1
WSDA
SPECIALTY CROP BLOCK GRANT PROGRAM
2013
FINAL PERFORMANCE REPORTS
TABLE of CONTENTS
PART ONE
Grant Recipient: Washington State Fruit Commission (WSFC)
Project: Cherry Powder Placebo Development Page 2
Grant Recipient: Washington State Wine Commission (WSWC)
Project: Reverse Trade Mission – Canada and China Page 6
Grant Recipient: Pear Bureau Northwest
Project: USA Pear Show in China Page 23
Grant Recipient: Washington Blueberry Commission (WBC)
Project: Market Research to Support Blueberries to Asia Page 26
Grant Recipient: Viva Farms
Project: A model for Incubating Beginning Growers & Teaching Sustainability Practices Page 30
Grant Recipient: Washington State University (WSU)
Project: Promoting BioControl through Hands-On and Web-Based Training Page 62
Grant Recipient: Organic Seed Alliance (OSA)
Project: Expanding Access to Specialty Produce in the NW through Variety Trials Page 70
Grant Recipient: Northwest Cider Association (NWCA)
Project: Market Development and Production Research for the Cider/Perry Industry Page 76
Grant Recipient: Whatcom Farm Friends
Project: Spotted Wing Drosophila and the Asian Blueberry Markets Page 81
Grant Recipient: Washington Red Raspberry Commission (WRRC)
Project: Mechanizing Red-Raspberry Pruning Page 84

2
Project Title: Cherry Powder Placebo Development
Partner Organization: Washington State Fruit Commission (WSFC)
PROJECT SUMMARY
The purpose of this project was for the Washington State Fruit Commission (WSFC) to utilize funds from the
Washington State Department of Agriculture (WSDA) Specialty Crop Block Grant (SCBG) program to develop a
freeze-dried placebo cherry powder. This placebo powder would then be used for testing in human trials against actual
Bing cherry powder. The lack of a placebo powder, as well as a standardized cherry powder, has constrained the
Washington State cherry industry’s ability to conduct health and nutrition research on sweet cherries. The intention of
this project was to create a placebo that would match a standardized cherry powder product that WSFC was, at that time,
in the process of developing. The placebo powder would match the standardized cherry powder in terms of taste, smell,
consistency, and caloric content, but would be absent of any whole cherry or cherry components. This placebo would
then be available to utilize in trials along with the WSFC cherry powder, and serve to demonstrate the health and
nutrition benefits of consuming sweet cherries.
The Washington State cherry industry has been investing in health and nutrition research since 2005. However, each
study that has been conducted since then has cited the lack of a standardized product as a limiting factor. Furthermore,
this impacts the timing of when research studies can be conducted, given that Washington fresh sweet cherries are
unavailable year-round. Prior to the funding of this SCBG, WSFC funded a study on the effects of cherry consumption
on prostate health in men. However, the research timeline was delayed due to a lack of available product, and variances
in anthocyanin content contributed to gaps in study findings. Researchers agreed that a standardized product and a
placebo were necessary if WSFC were to have success in its health research efforts. Furthermore, with growing
production, the Washington State cherry industry is concerned about building lasting demand for fresh sweet cherries
in the U.S. and abroad. Communicating the health benefits of consuming cherries is seen as a key market development
strategy, and WSFC would like to make investments in this area to solidify cherries’ position as a healthy option for
consumers.
At the time this project was proposed, WSFC was in the process of developing a standardized cherry powder using
industry funds. WSFC then sought assistance from the WSDA Specialty Crop Block Grant program to fund the
development and production of a placebo powder, a critical step towards the successful execution of research studies.
Because additional research studies could not take place without the development of a placebo, this project was of great
importance to the industry and its health and nutrition research efforts.
This project was new and did not have links to previously-funded SCBGP projects.
PROJECT APPROACH
In October 2013, upon approval of the project, WSFC contracted with the United States Department of Agriculture’s
Agricultural Research Service (USDA/ARS) to begin formulation of the cherry placebo. The standardized cherry
powder, which was developed independently by WSFC, was sent to USDA/ARS for analysis. From October 1, 2013
through October 31, 2014, WSFC worked with the USDA/ARS Western Human Nutrition Research Center (WHNRC)
to develop the formula for the placebo powder. Dr. Tara McHugh at the USDA/ARS consulted with Don Olson, a food
technologist, to develop a powder that matched the standardized cherry powder product in terms of taste, smell,
consistency, and caloric content when dissolved in water. As a result of their work, a formula for the placebo powder in
addition to a standardized freeze drying process was completed in August 2014.
In November 2014, WHNRC assessed how the placebo reacted in the planned water soluble delivery method when
compared to the cherry powder, completing the first phase of the approved Project Plan. The results of this test are
crucial for researchers preparing samples for participants in advance of consumption. Several experiments were
conducted, and the placebo tested positive for the presence of soluble phenolics. Follow up experiments resulted in the
identification of maltodextrin as the cause of the false positive. In addition, the USDA/ARS conducted a side-by-side
comparison of the anti-oxidant content and total soluble phenolic content of the cherry powder and placebo. The placebo
was found to contain no anti-oxidant content.
Following the favorable outcomes of both tests, WSFC selected Columbia Phyto Technology (PowderPure) as the
powder manufacturer. Columbia Phyto Technology (PowderPure) was the producer of the standardized cherry powder
and this allowed for consistency in product development for the placebo. However, the processes of obtaining a quote
for production of the placebo powder proved to be an arduous and time consuming process. Under WSFC’s original
timeline, the placebo was to be produced by October 2014 with RFPs issued to potential researchers starting in

3
November 2014. However, because of the change in how the final product will be administered (in a water soluble form
rather than in powder form), additional formulation was required. This delayed the timeline and ultimately the placebo
was not produced until May 2016. The formulation was tweaked to ensure that all differences between the cherry powder
and placebo were minimized. Furthermore, additional reformulation was required to ensure that the powders did not
clump, and the final processing was completed in August 2016. The placebo and cherry powders are now ready for
packaging and WSFC is working to identify a packer that can work in a temperature-controlled environment and insert
the powder into 25-gram metal film bags. Once packaged, these powders will be available for future research studies.
Despite the delays in the manufacturing of the placebo powder, the WSFC and the California Cherry Marketing &
Research Board (CCMRB) convened a one-day Health & Nutrition Committee (HNC) meeting and a gathering of the
sweet cherry industry’s Scientific Advisory Board (SAB) on January 8, 2015 at the UC Davis Western Human Nutrition
Research Center. The meeting was organized to gain consensus from the SAB and industry to identify top health research
objectives and receive feedback on the development of a Request for Proposal that will be utilized for research that will
be conducted using the powders. The objectives and feedback laid out will be instrumental in advancing the sweet cherry
industry’s research agenda once the powder is packaged in the 25-gram bags. While it finalizes arrangements related
to packaging, WSFC is already overseeing an initial study with the bulk powder.
Through a separate WSDA SCBG, in the 2015 funding year, WSFC entered into a contract with Texas Agricultural &
Mechanical University to begin conducting research as soon as the powders were available for use. Research is currently
ongoing, and progress will be reported in the Annual Performance Report for that grant.
Researchers at USDA/ARS played the primary role in development of the placebo powder formula. The USDA/ARS
team has experience developing similar placebos for other fresh fruit products. USDA/ARS’s work on this project was
completed on March 31, 2015.
Another partner that has an interest in WSFC’s health and research efforts is CCMRB. Together, WSFC and CCMRB
representatives participate in joint meetings to discuss research priorities that affect the entire cherry industry. When
available, results of research studies will be communicated to these groups at future SAB and HNC meetings.
After formulation of the powder, WSFC selected Columbia Phyto Technology (PowderPure) as the manufacturer of the
placebo powder formula. The WSFC’s primary contact at this company changed abruptly, delaying the negotiation of
the contract. Nevertheless, in September 2015, through constant communication initiated by WSFC, a plan was put into
place to move forward with the development of the powder. The powder was produced in May 2016 and Columbia
Phyto Technology (PowderPure) worked to tweak the formulation to prevent clumping, as well as match the placebo to
the cherry powder. Columbia Phyto Technology (PowderPure) is now working with WSFC to determine an acceptable
packaging solution for both powders. Once packaged, these powders will be available for future research studies.
Because of the nature of this project, it has only benefitted the fresh sweet cherry industry.
GOALS AND OUTCOMES ACHIEVED
As outlined in the project proposal, this project had three goals:
1. To generate interest among the scientific research community to conduct research on the health benefits of
eating fresh sweet cherries
2. To increase media publicity about the health benefits of eating fresh sweet cherries
3. To increase sales of Washington State fresh sweet cherries
In order to achieve performance goals and Expected Measurable Outcomes, WSFC focused on completing project
activities within designated timeframes. Unfortunately, these objectives were not met due to delays in manufacturing
the powder. That being said, the most fundamental component of this project was the development of the cherry placebo
powder. As a direct result of this grant, WSFC was able to formulate and produce the placebo powder to be used in
research trials. Ultimately, WSFC now has the foundation in place to meet the above objectives, and plans to do so,
albeit after the grant period has concluded.
While no measures have been met at this time, significant progress has been made to enable WSFC to conduct future
research trials on fresh sweet cherries. The development and manufacturing of a placebo powder is a critical step towards
conducting successful research projects. WSFC has already applied and received funding for another WSDA SCBG
project to conduct research on the effects of cherry consumption on modulation of intestinal bacterial populations,
inflammation, and obesity markers. WSFC plans to meet the Expected Measurable Outcomes and will report progress
through the Annual Performance Report for that grant project.

4
Project Activity Responsible
Party
Timeframe Completed
(month and year)
Contract with USDA/ARS initiated WSFC October, 2013
Standardized cherry powder samples sent to USDA/ARS for
analysis
BCI and
USDA/ARS
October, 2013
Analysis, sensory testing, and product formulation USDA/ARS November 2013 – March 2015
Placebo manufacturing partner identified BCI December 2014
Placebo produced PowderPure January 2016
Final sensory tests conducted and placebo available for use USDA/ARS May 2016
Proposals selected and placebo distributed BCI and WSFC March 2016
Interim report prepared with results for Goal 1 provided BCI November 2015
Project completed and final report written which includes Goal 2
and Goal 3, along with any update on Goal 1.
BCI November 2016
Much of the project plan has been completed, as outlined above. Additional steps that remain, as noted, have encountered
unexpected delays. Remaining work plan activities include: packaging the powders, issuing a Request for Proposal to
qualified research institutions, selecting researchers and distributing the placebo, conducting research, and publishing
research results. WSFC plans to complete all project activities within the work plan and achieve project goals, though
not within the grant period.
The Expected Measurable Outcomes for this project were designed to take place after the placebo is produced and
packaged. At the end of the grant period, the cherry powder and placebo had not yet been packaged, and therefore
research utilizing these powders was unable to begin under this grant. Because of this, there are no key results to report
at this time. However, achievement of the targets set in the proposal will still come after the conclusion of this grant
period. Despite the delays (discussed above) which prevented multiple research projects to be completed and reported
on during the grant period, WSFC has already initiated research into the effects of sweet cherry consumption on gut
health (with the support of a SCBG in FY15). The placebo powder is a critical component for this project. Although it
has not been packaged yet, WSFC was able to send a portion of the powder to the researcher at Texas A&M University
so that studies may begin on the impact of sweet cherry consumption on obesity-related disorders. Furthermore, more
studies will be conducted after the powder has been individually packaged. Ultimately, this will form the basis for
scholarly findings that WSFC anticipates will generate media interest and increased sales of fresh, sweet cherries.
Upon the completion of the ongoing research, WSFC expects to garner approximately $500,000 in media discussion
about cherry health benefits. Given that the timeline for research has been extended, this will take some time to achieve.
Successful research studies will contribute to market development efforts, and ultimately increase the sales value of
Washington State fresh sweet cherries. WSFC expects that this will begin providing significant impact to cherry sales
during the 2018 season (once initial studies are completed and results are publicized).
BENEFICIARIES
While no research studies have been completed yet, this project was an important step towards that goal. This project
directly affects 1,480 sweet cherry growers in Washington State who produce around $600 million worth of cherries
each year. Development of a cherry placebo, a critical component for cherry research and nutrition trials, will allow
WSFC to conduct studies that aim to prove health benefits of consuming fresh cherries. Positive study results will be an
important marketing tool and will affect the entire Washington cherry industry.
As previously indicated, this project benefits sweet cherry growers who produce around $600 million worth of cherries
each year. Successful research and nutrition studies will contribute to an increase in consumer awareness and demand
for Washington sweet cherries. Furthermore, WSFC expects that positive health benefits evidenced by research studies
could drive a 10% increase in crop value.
LESSONS LEARNED
Even with appropriate planning, projects can nevertheless encounter interruptions or delays. For example, this project
encountered delays in the beginning phase with the formulation of the cherry powder. Additional interruptions included
negotiating a contract with a manufacturer and additional powder reformulation before the manufacturing could begin.
Furthermore, unexpectedly, finding a packer for the placebo and cherry powders has been quite challenging. While a
crucial part of the project, it is not something that was anticipated to be a difficult task. To keep the integrity of the
powders intact, a specialized packaging process is required. Many packers have been unwilling to take on such a small
project and therefore the powder remains packed into 15 kg boxes at this time. Ultimately, WSFC needs to have the

5
powders packaged into 25 gram packets for easy use in research trials. WSFC is exploring alternative packaging options,
and remains optimistic that this part of the project can be completed, albeit not within the grant period. Most importantly,
WSFC now has key components needed to conduct future research on cherry nutrition benefits. This project has laid the
foundation for success in cherry health research efforts.
No unexpected outcomes or results were observed in the implementation of this project.
While the goals and outcomes have not yet been achieved, WSFC has taken important steps to further the soundness of
cherry research efforts through the formulation and development of a cherry placebo powder. The goals outlined in the
project proposal have not been met during this particular grant timeline, but will certainly be met in the foreseeable
future. WSFC has already taken steps to ensure that the placebo powder and standardized cherry powders are being used
in research efforts funded with the support of a separate WSDA SCBG project. In terms of “lessons learned”, this project
is a great example of why it is important to remain adaptable as timelines shift. Furthermore, delving further into
miniscule details of a project before implementing it may help predicting challenges before they arise. Finally, having
a backup plan to fund and advance project efforts after the conclusion of the grant period, if needed, is critical to ensuring
that the overall impact remains positive and significant.
ADDITIONAL INFORMATION
WSFC has utilized $38,982.80 in SCBG funds towards this project. WSFC has contributed $26,000 in industry funds
and another $10,000 in in-kind contributions towards the completion of this project. Funds were utilized to develop and
manufacture the cherry placebo powder. It is expected that WSFC will spend additional funds to complete the packaging
of the placebo and cherry powders following the submission of this report. Because a packer has not yet been identified,
the amount of additional industry expenditures is not known at this time; however, contribution already exceeds the
match that was indicated in the project proposal.
CONTACT INFORMATION
Teresa Baggarley
Washington State Fruit Commission
(509) 453-4837

6
Project Title: Reverse Trade Mission – Canada and China
Partner Organization: Washington State Wine Commission (WSWC)
PROJECT SUMMARY
This project primarily sought to address the issue of too few Washington State wines available in high potential export
markets, as well as the need for a more robust, coordinated effort to capitalize on the opportunities for wine tourism
with foreign visitors. Washington’s state wine industry has an $8.5 billion economic impact on Washington State’s
economy and supports more than 14,000 jobs in the State, but exports only total approximately 2% of annual wine
production. By contract, California wineries export approximately 16% of their wines. The WSWC targeted improved
sales and tourism from Canada and China for this project, because those two markets have the highest potential for
Washington wine.
The project was important and timely because, in spite of the accolades that Washington wines receive, awareness
among trade, media, and consumers overseas is limited. As a result, sales, distribution, and wine tourism are limited
too. Thus, at the time of application, only 20 Washington State wineries (out of 750) had distribution in Canada, and
only 13 had distribution in China. These numbers are low, but actually represent a significant increase compared with
prior years. Interest in Washington wines in both markets is growing, thanks to targeted marketing outreach. But a
more comprehensive program was important to generate more significant attention for the Washington producers.
Moreover, it was timely because the Washington State wine industry is not the only wine industry seeking to expand
sales in Canada and China. Wine associations from around the world, including both those representing Old World
European producers and New World producers are focusing their attention on these high-potential markets. Without a
robust program to bring influential trade and media to an event like Taste Washington, the WSWC risked missing an
opportunity to increase its market share through more sales, distribution, and wine tourism.
This project did not build upon a previous SCBGP-funded initiative.
PROJECT APPROACH
Below is a summary of tasks by target market.
Canada
The WSWC hosted six major wine journalists from the provinces of British Columbia, Ontario, and Quebec. Combined,
these three provinces represent approximately 80% of the Canadian wine industry. One of these journalists arrived in
advance of the Taste Washington wine tasting event and visited several wineries in Eastern Washington. The others
arrived for Taste Washington and focused their attention on learning about Washington wines at the event itself. Their
visit included not only significant tasting opportunities with 200 wineries pouring, but also educational opportunities
through seminars and two wine-and-food pairing dinners with WSWC staff and representatives.
China
The WSWC hosted 11 members of the Chinese trade and media, primarily from Shanghai but also from other cities
where Washington wine has distribution. In contrast to the Canadian delegation, there was a greater focus on trade
because Washington wine has less of a presence in the Chinese market. Participants arrived for the Taste Washington
wine tasting event, and as with the Canadian group, also gained the opportunity for education through seminars and
wine-and-food pairing lessons through meals with WSWC staff and representatives. After Taste Washington, the
majority of attendees visited four wineries in Washington State to gain a greater understanding of the wine production
process and the unique nature of the Washington State wine industry.
The visit yielded gains in both trade and distribution. Export growth is discussed in the sections below. Regarding
media, the following articles were prepared as a direct result of the project:
(1) Kurtis Kolt in Westender Vancouver (53,671 circulation, valued at $10,000)
(2) Bill Zacharkiw in Montreal Gazette (116,446 circulation, valued at $10,000)
(3) Ruby Gao in Shanghai Daily (100,000 circulation, valued at $20,926.58)
(4) Beijing TV News Live Beijing Segment (estimated 50,000 viewership, valued at $2,575.58)
(5) Monica Zhu in Modern Weekly (estimated 50,000 circulation, valued at $10,000)
(6) Monica Zhu in Restaurant Review (estimated 50,000 circulation, valued at $10,000)
(7) Monica Zhu in Horizon (estimated 50,000 circulation, valued at $10,000)
(8) Monica Zhu in Urban Space (estimated 50,000 circulation, valued at $10,000)

7
The WSWC had several key contributors to this project, including the United States Department of Agriculture
(USDA)’s overseas staff, Visit Seattle, Nantel & Associates (the WSWC’s retainer-based contractor), and several
Washington State wineries. In order to select the most influential trade and media for the reverse mission, the WSWC
took nominations from the USDA Agricultural Trade Offices (ATO) in Shanghai and Hong Kong, as well as Nantel &
Associates and Washington wineries. Because of the quality of the nominees, the WSWC decided to expand the size
of its mission and fund 17 guests (6 from Canada and 11 from China) through SCBG funds. ATO Shanghai assisted
with travel logistics for some of the guests, which ensured they could participate. Visit Seattle provided interpretation
for the three non-English speaking guests from China. Nantel & Associates helped host the visitors from Canada, and
four Washington wineries (Columbia Crest, Hedges Family Estate, Milbrandt Vineyards, and Chateau Ste. Michelle)
hosted guests from China following Taste Washington, to give the trade and media visitors an opportunity to see
Washington wine country firsthand.
The project did not benefit commodities other than wine grapes.
GOALS AND OUTCOMES ACHIEVED
The activities that were completed as part of this project were all described in the previous section. They included
participation in Taste Washington, seminars, wine dinners, and a tour of Washington wine country. The trade and media
visitors were selected thanks to their influence in the Canadian and Chinese wine markets, and their ability to position
Washington wine brands for exposure and new business. Ultimately the goals for the project were to support new
distribution and attention for Washington wines in both countries.
The Expected Measurable Outcome goals for the project were (1) Washington wineries with distribution in Canada and
China will expand significantly, (2) Washington wineries will report increased sales as a result of new distribution
agreements that greatly exceed cost of activity, (3) Online and print articles secured through activity will expose
consumers to Washington State wine industry, (4) Online and print article advertising value equivalent secured through
activity will greatly exceed cost of activity, (5) over half of tasting room managers will report an increase in Canadian
and/or Chinese visitors over a two year period.
Gains are expected to be made for all Expected Measurable Outcomes in the long-term, but the WSWC is able to report
on current progress below.
A comparison of the activities and goals established for the project and the actual accomplishments are listed below:
Expected Measurable Outcome Goal Baseline Actual
Washington wineries with distribution in Canada and China will
expand significantly 70 33 55
Washington wineries will report increased sales as a result of new
distribution agreements that greatly exceed cost of activity $300,000 0 $5,468,055
Online and print articles secured through activity will expose
consumers to Washington State wine industry
1 million
consumers
reached 0 520,117
Online and print article advertising value equivalent secured
through activity will greatly exceed cost of activity $200,000 NA $83,502.16
Over half of tasting room managers will report an increase in
Canadian and/or Chinese visitors over a two year period 55% NA ~100%
WSWC’s project expanded distribution, generated media, and increased wine tourism in Washington State. With
respect to distribution, the number of wineries exporting to Canada and China increased by 67% during the lifetime of
the project. While this expansion did not quite reach the goal set at the beginning of the project, it is still a significant
success for the Washington wine industry. At the same time, the value of exports more than exceeded the goal thanks
to new, high-value distribution in Canada and China.
Meanwhile, the goals set for media were estimates that turned out to be overly ambitious. WSWC’s generated eight
quality media placements, reaching an estimated 520,117 people with a value of $83,502.16. The placements were
primarily in leading trade and lifestyle magazines that are critical for expanding awareness of the Washington State
wine industry. Thus, WSWC’s remains satisfied with the media results. Finally, the WSWC has learned from its
wineries that international tourist visits are increasing with China in particular having a large increase. While this

8
information is anecdotal, it demonstrates that Canadian and Chinese wine tourism has increased following from the
project.
The Washington State wine industry in general benefited from the project. Hundreds of wineries had the opportunity
to share their wines with the visiting trade and media at Taste Washington. Meanwhile, the visitors also had the
opportunity to obtain more in-depth knowledge about Washington State wine via educational seminars, winery visits,
and wine and food pairing dinners.
The project helped ensure that (1) wineries that exported before saw demand increase in Canada and China, (2) wineries
that were looking to export had new distribution opportunities and began exporting to the target markets, and (3) non-
exporting wineries benefited from media exposure and the expansion of wine tourism.
As discussed in the Expected Measurable Outcomes section above, the project generated eight high-quality media
placements that reached an estimated 520,117 people. The value of these placements is estimated at $83,502.16.
Meanwhile, during the time period of the project, the number of Washington State wineries exporting to Canada and
China increased from 33 to 55. Many of exporters developed strong relationships with their importers, which led to the
value of wine exported rising more than $5 million.
LESSONS LEARNED
A key lesson learned was the importance of effective planning and a strong nomination process for the reverse trade
mission. WSWC began preparing for the visit months in advance, which allowed it to develop a robust agenda and
select the most influential candidates in each target market. As a result, the visit was a success at advancing the interest
of the Washington State wine industry.
Managing the logistics of the visit could have been streamlined in certain areas. Specifically, the WSWC allowed
attendees to RSVP after its initial deadline. This led to a higher-than-expected number of participants on the reverse
trade mission. In addition, the WSWC did not build in winery visits until late in the process. Winery visits are important
for reverse trade missions and should have been included in the project proposal. Instead, those visits were not covered
by SCBG funding.
There were no significant unexpected outcomes or results from the project. The WSWC successfully implemented the
reverse trade and media missions in both markets and there was solid interest among participants. As expected, the
project generated interest, distribution, and media exposure for Washington wineries in Canada and China. This is not
only evident from the data that has been reported to date, but should also result in gains in the coming years as some of
the reverse trade mission participants essentially become ambassadors for Washington State wine.
As discussed above, three of the expected measurable outcomes were not attained. Despite this, all three results for
these outcomes were successes for the Washington State wine industry. Distribution increased 67%, while eight
significant media hits were generated. Thus, the key lesson learned for WSWC is to set goals that are not only aggressive
but also attainable.
ADDITIONAL INFORMATION
The WSWC, along with its partner Visit Seattle, met the matching commitment to this project. Contributions totaled
$26,398.86.
For its cash match, the WSWC contributed $9,398.86 in wine, dinner, and hotel charges that were not paid for with
grant funds. For its in-kind match, WSWC staff and contractors devoted $12,000.00 in time (approximately 120 hours
in salary/benefits) to activity planning, coordination, and implementation. Visit Seattle staff devoted $2,000.00 in time
(approximately 20 hours in salary/benefits) to activity planning, coordination, and implementation, and also covered 20
hours of interpretation services valued at $3,000.00 for Chinese guests.
Bill Zacharkiw: Washington needn’t stand in California’s shadow BILL ZACHARKIW, GAZETTE WINE CRITIC 04.10.2014 |

9
About as green as it gets. Washington State’s southeastern grape growing regions, like Red Mountain, are technically
deserts. B I L L Z A C H A R K I W / T H E G A Z E T T E
For up and coming wine regions, creating an identity can be a tough slog. Choosing the appropriate grapes for a particular climate and soil can take a long time. Vines take years to establish themselves, so any change of course is a timeconsuming, and costly, endeavour. Washington State is well into this process and for the most part has done a pretty solid job. I first visited this northwestern state, which is second to California in terms of wine production in the U.S., in 2008, and left feeling pretty bullish. After spending a week there recently, I’m even more so. I tasted Bordeaux styled blends that were worthy of the reference to the fabled French region. The Rhône grape varieties — syrah, grenache, mourvèdre, counoise, cinsault — were arguably even better, as well as being unique and interesting. The same could be said for many of the whites. I tasted some very good viognier, grenache blanc and riesling. All good, and at times, really good.
The one greyish cloud was the reliance on the state’s most planted red grape, cabernet sauvignon. I did taste some great examples. But in many instances the results were excessively tannic wines that left me staring bleakly into my glass, wondering why there wasn’t more of that delicious syrah, or some other Rhône styled blend. I was reminded by a few winemakers that “nobody” in the U.S. drinks syrah: If you can’t sell it, then why grow it? I would argue that it’s a longterm investment, because people will eventually figure out that syrah really isn’t all that different from cabernet sauvignon. Then, Washington State will be leading the way. But I don’t pay the bills.

10
I also got a sense that there exists a bit of a complex with respect to California winemakers, who have made their name with cabernet. Despite the fact that there is little to compare the two states when talking grape growing conditions — latitude and soils in particular — I heard California comparisons uttered way too many times during my visit. Winemakers seemed almost apologetic when talking about cooler vintages like 2011, when in fact the wines were in many cases absolutely stellar, unless of course you were looking to make a Californiastyle wine. All too often, I felt as though many winemakers were trying to squeeze too much out of the grapes, rather than making the more elegant and finessed wines of a cool growing season. Ultimately, it’s a case of moving beyond what kind of wine you “want” to make, and accepting what kind of wine most authentically represents the land, soil and vintage. But that is coming. So while the fine tuning continues, here’s what Washington State has going for it. The vast majority of grape growing happens in the Columbia Valley, which covers 4.4 million hectares of land (about nine times the size of Montreal). Due to two coastal mountain ranges, which keep Seattle and other coastal areas drenched, the interior is starved of rain. Some subregions are technically deserts with less than 30 centimetres of rain per year. So irrigation is necessary nearly everywhere. But because of the lack of humidity, there is very little disease pressure. One thing I didn’t realize was that Washington State has little or no phylloxera, the sapsucking insect that wiped out vineyards across the wine world. This is due to the soils, which tend to be predominately silt and sand on top of basalt (hardened lava), which the little pests hate. So much of the state’s vines are planted on their own roots, which puts Washington State in a very small group of wine growing regions. Is it better? When I tasted at Cayuse, one of my favourite wineries in Washington, I much preferred the wine made from the original rootstock grapes. Washington State also has a unique mix of latitude, altitude and heat. Like many of the world’s top growing regions, the higher latitude means long summer days filled with sunlight to ripen grapes. The altitude means cool nights that allow grapes to keep their acidity. Summer temperatures, however, can reach over 37C, which can make vines shut down and stop ripening. This might be one of the reasons cabernet and merlot, which aren’t heatloving grapes, aren’t always the best choice. Conversely, syrah, mourvèdre, counoise and other Rhône grapes can flourish in this climate. One of the particularities of the wineries in Washington State is that they tend to source grapes for their wines from a number of different subregions. Most of the wines I tasted used the broad Columbia Valley AVA (American Viticultural Area) on the label. An AVA is much like a European appellation, though it only defines the geography of a region. European appellations rules about which grapes you can grow and deal with such qualitative issues as yields. The most memorable wines I tasted during my trip were sourced from grapes grown solely from the smaller AVAs that make up the larger Columbia Valley AVA. The Hedges syrah from Red Mountain and Cayuse single vineyard Bionic Frog syrah from “The Rocks,” are two examples of great syrah. The Ancient Lakes region is the source of some exceptional riesling, and Sleight of Hand made one of my favourites. My favourite AVA was Yakima Valley. Located on the western side of the Columbia Valley, its cooler temperatures and higher altitudes made for some pretty elegant wines. The Bordeaux styled blends from Fall Line Winery, Eight Bells and Côte Bonneville were phenomenal. The grenache blanc from Two Vintners was a model of finesse. So maybe the next step is really dialing down and making more wines from the smaller AVAs to really show the character of these sub regions. However, many already are. Here’s hoping that even more will embrace what they have, because in many ways, it’s pretty special.

11
The writer was a guest of the Washington Wine Commission. The organization did not review or approve this article. Twitter: BillZacharkiw Facebook: billzacharkiwwine You can hear Bill Zacharkiw talk about wine on CHOMFM (97.7) every Friday at 7:45 a.m. A few choice growths from the Evergreen State Riesling 2013, Kung Fu Girl, Charles Smith Wines, Washington State white, $19.65, SAQ #11629787. Nice balance between riper fruit, with tropical notes of pineapple and peach. Minerality is there, subtly pumping and driving the wine. A hint of lime rind bitterness on the finish balances out the sweet fruit. Great job. Serve at 68C. Drink now2016. Food pairing idea: apéritif, spicy seafood stirfries. Hedges C.M.S. 2012, Sauvignon Blanc/Chardonnay/Marsanne, Washington State white, $20.20, SAQ #11035655. Sauvignon blanc dominates the blend with its blend of citrus and herbal notes. But then the chardonnay and marsanne add some richness to the finish. Easy drinking and totally dry. Serve at 810C. Drink now2015. Food pairing idea: apéritif, mussels. Riesling 2011, Eroica, Chateau SteMichelle, Washington State white, $28.50, SAQ #10749681. Nice to see this wine evolve over the years. Lemony pineapple, just a hint of residual sweetness, mineral, juicy. I tasted a 2008 recently and these wines evolve nicely. Serve at 8C. Drink now2017. Food pairing: apéritif, Thai curries with coconut milk. Syrah 2012, Boom Boom, Columbia Valley, Charles Smith Wines, Washington State red, $24.65, SAQ #11208561. Well named. No lack of power, but not overblown, and the fruit stays pretty fresh. Reminds me of a CrozesHermitage, though with darker fruit. The peppery spice, bacon, add to the depth. Oak is nicely integrated with none of that excessive vanilla. Serve at 1618C. Drink now2015. Food pairing idea: braised beef, leg of lamb. Syrah 2010, Columbia Valley, L'École No 41, Washington State red, $33.25, SAQ #10709030. Shows the fruitdriven style of western Washington State. This is pure fruit with blackberry and dark raspberry with spice on the finish. Tannins are soft and cuddly, but with a vibrant acidity. Serve at 18C. Drink now2018. Food pairing idea: grilled steak, pepper sauce. Red Willow 2009, Yakima Valley, Fall Line Winery, Washington State red, $38, SAQ #12185575. In the spirit of a SaintÉmilion, this cabernet franc and merlot dominated blend is a beautiful example of the cooler Yakima region. Despite the ripe and complex fruit, there is an underlying minerality that grounds the wine, keeping it fresh. The tannins, ripe yet grippy, give great length. Beautiful wine. Serve at 18C. Drink now2020. Food pairing idea: lamb chops, filet mignon with spice.
APRIL 18, 2014
CITY CELLAR: FIVE‐STAR WINES FOR YOUR WEEKEND
Kurtis Kolt — Westender

12
1. Charles Smith 2. Franc Arman 3. Le Vieux Pin 4. Domaine Maby 5. Barda
Whether jotting notes of wines I’m tasting in a Moleskine notebook or tapping away on my iPhone, I’ll usually star particular wines that I think would be good to share in this column. When I look to profile a certain grape variety, region, style or theme; they almost always slide into place. Too often though, there are a handful of starred bottles that I haven’t been able to pigeonhole into a particular theme, but they hover top of mind nonetheless. This week, a handful of those wines for you, with nothing in common except being delicious, charismatic, and dinner tableworthy. Charles Smith 2012 Kung Fu Girl Riesling | Columbia Valley, Washington | $19.99 | BC Liquor Stores Year in, year out, this is one of those wines you can always count on. Crisp and shimmering with candied lemon, grapefruit, pomelo and lemongrass. Don’t dismiss Charles Smith’s celebrated Riesling because the label’s so fun and cheery; that’s exactly the way Riesling’s supposed to be. This highwire act between dry and offdry will have you grabbing for chopsticks and anything they traditionally tuck into. Franc Arman 2012 ‘Jano’ Malvasia | Istria, Croatia | $30ish | Private Wine Stores So it turns out I’m a fan of Croatian Malvasia. Who knew? The aromatic white grape in question comes from mature vines quite close to the Adriatic Sea, a short commute away from more famous Italian takes on the variety. A smattering of fresh, citrusy herbs like lemon balm and sorrel envelope Mandarin oranges and Meyer lemons with a hint of an oily richness that will have it stand up to lighter curries and similar fare. Look for it at Kitsilano Wine Cellar or 16th Street Liquor Store in West Van. Le Vieux Pin 2011 Syrah | South Okanagan, BC | $22/375ml or $45/750ml | Winery Direct/Private Stores I’ve long been a fan of Syrah in British Columbia, often earthy and layered, chockablock with blackberries, currants, pepper and sage. Le Vieux Pin champions the variety quite well vintage after vintage, and I’m loving how this year they’ve done a slight departure from their usual big and muscular style, towards an elegant lift and a very civilized 12.7 per cent alcohol. The result still shares hallmark complexity and nuance, but now with a little more spring in its step. Domaine Maby 2011 La Fermade Rouge | Lirac, Rhône, France | $27.97 | BC Liquor Stores This blend of Grenache, Syrah and Mourvèdre grows a stone’s throw from ChâteauneufduPape and bursts with violets, lilacs, currants and Concord grapes. There’s a slight dusting of dried thyme and just enough oak to lend backbone and overall structure. Smoked duck breast, charcuterie and sausage should fit alongside well. Barda 2011 Pinot Noir | Patagonia, Argentina | $35ish | Private Wine Stores This Pinot Noir is grown way down in Patagonia, a breezy, cool climate region that treats the grape just fine. Put big, meaty Argentinian reds out of mind, because this little lady’s light, bright and lively, with silky plums, a bowl of cherries and a pinch of nutmeg to finish things off. Put in the fridge for ten minutes before opening and start to think about revving up that barbecue.

13
As always, if you’re having trouble tracking something down or just want to say hi, find me via KurtisKolt.com (http://www.KurtisKolt.com) or Tweet me @KurtisKolt. © 2015 Vancouver Westender

14
15

16

17
牡蛎之约
刚从 码头 运 来 的 新 鲜 牡 蛎 让 人 大
饱口福。牡 蛎 的 摊 位 上,十几 米 的
展台 站 了 7、8 个工作人 员,马 不 停
到壮 年肥硕的 — — 码在餐盘 上,然
后拐入 酒展的柜台。捧 着 一盘 牡 蛎
的架势实在 壮 观,于是 一路 被热 情
的酒庄庄主拦下:
“牡 蛎!”有人惊叫,“要配 我们
华盛顿州的葡萄酒产区 华盛顿州
主要的“美国法定种植 区”(AVA)
包括亚基马AVA、沃拉 沃拉AVA
、哥伦比亚山谷 AVA、 普捷湾
盆地(Puget Sound )

18
蹄 地 开 牡 蛎。他 们 带 着手 套,用刀 家的长相思!” AVA、红山(Red Mountain)
划 开贝 壳,动 作 干净 利 落,软体 动 “我这里有绿皮诺,也不错,要 AVA和哥伦比亚河谷(Columbia
物 的 奶香 弥漫 在 整 个角落。人们彬 不要试试看?” Gorge)AVA。以上种植区都具有
彬 有 礼,排 到 了 就伸 手 拿一只,挤 我 最 终选了一 款 雷司 令,躲 到 其独特的气候、土壤和地理特征,
点 柠 檬 汁,一 口 吃 掉,一 个 种 类 就 会 场边的 餐桌 上慢 慢享受。这 是 一 其中,哥伦比亚山谷是比较著名
尝一只,其余 的 份 额 要留给后面的 顿朴素 又惊 艳 的 牡 蛎 大 餐,新鲜度 的一个AVA,当地的夏季气候温
食客,这仿佛是一条不成文的规定。 警醒大脑,咸味和矿物感相处融洽。 和,温度适中,白昼较长,夜晚凉
不解馋 的人会重 新 排 队,排到了依 略带海盐的柔软真适合与雷司令的 风习习,如此温和的天气中诞生了
旧 每 种只 拿一只。 有的 牡 蛎 狂 热 冰 甜 交 织 啊!M ilb rand t 酒庄的 雷 华盛顿最杰出的一些葡萄酒品种。
者 循 环排队吃 了一 天,估 计 晚 上 睡 司令种植于哥伦比亚谷的高地斜坡 觉都会带着海水味的鼾声。 上,酸度高,口感通透。我咂了一口,
我是酒鬼,当然 不会错过 这样 意 识 到自己坐在 北 纬 47度,西雅图 的 机 会。所 以 并没 像 别 人 那 样,抡 市 南大 街 8 0 0 号,舌尖 上涌 起 又散 西雅图的美食
起 一只马上干 掉,而是 把 搜 集 好7、 去 的不是牡 蛎 和冰白,而是 皮吉特 RN74
8 种 不同的 牡 蛎 — 从 三个月大 的 湾的海水和哥伦比亚谷的砾石。 http://w w w.michaelmina.net
Theochocolate
https://w w w.theochocolate.
com/locator
Salty's Seafood Grill
http://saltys.com
好酒 衫牛仔裤,大多子承父业,自小学酿
酒,其他兄弟姐妹则负责市场,销售。 作 为 红 酒 产区,华盛 顿 州 产区 靠 近 这种家庭式酿酒传统竟然得益于美 加拿大,是北美的高纬度寒冷之地,
在 主要生长 季节的日照时间平均每
日要比加州多出2小时。平均17.4小
国1920年禁酒时期的法令。即使如
今在华盛顿州Milbrant这样的大型红
酒公司,引进了技术人才和专业市场
西雅图美酒
1.Ste.Michelle
https://www.ste-
时 的日照时间,温和 的 气候使 葡 萄 运营模式,但它们的核心成员依然是 michelle.com
得以 完全成熟,而温度 较低 的夜晚 家族。展会上我遇到三个年轻人,一 使得 果 实中酸 度 较 高。比起 加州的
napa酒“饱含情欲”的果味,华盛顿
起创立了名为Sleight Of Hand的酒
窖。每年产量大概也就够分亲朋好友
2.Milbrandt
http://www.
州产区简直文艺坏了。雷司令清丽,
赤霞珠高酸度,香气丰腴口感平衡。
在“华 盛 顿 美 食 节”(T A S T E
的,却兴致勃勃地为新酒的品鉴制作
了一张CD。酒标是一个诡异的印度
人像涂鸦,呼应了几百米外的西雅图
milbrand
tvineyards.com
WASHINGTON)我 真是大开眼界。 音乐博物馆里Jimi Hendrix画像上错 3.Hedges Family
整个州的葡萄酒人从山谷里驱车而
来,在西雅图南大街800号体育馆摆
愕的神态。
IT 和 摇 滚 乐 是 西 雅 图 的 肋 骨,
Hedges
http://www.
出自己的摊位,热烈讨论着种植和酿 咖啡是它的血液,红 酒却 把青 春 的 hedgesfamilyestate.
造。这里的酿酒师们大多穿着格子衬 棱角都酿了进去。 com

19

20

21
Taste Washington Canada‐China Photos
Taste Washington visit. Taste Washington visit.

22
Wine and food pairing dinner. Visit to Columbia Crest winery.
Visit to Milbrandt Vineyards winery. Visit to Milbrandt Vineyards winery.
CONTACT INFORMATION
Doug Marshall
Washington State Wine Commission
(206)326-5753

23
Project Title: USA Pear Show in China
Partner Organization: Pear Bureau Northwest
PROJECT SUMMARY
After 20 years of efforts by the pear industry, Northwest Horticultural Council, and USDA APHIS, market access to
China was granted for the first time for USA Pears in January 2013. Because Chinese consumers are accustomed to the
crisp Asian pear varieties, the Pear Bureau was faced with introducing USA Pears as a new product to the market, with
the top constraint being the lack of consumer awareness regarding the multiple varieties available, flavor attributes,
nutrition information, and ripening attributes of USA Pears – addressing the constraint will continue to require a lot of
education. USA Pears – or western pear varieties – are very different in taste, appearance and eatability (i.e. western
pears need to ripen) than the Asian pear varieties grown in China. Therefore consumers may not have ever seen a
western pear variety and it is considered an exotic fruit to them.
The USA Pear Road Show in China capitalized on the timing of the market opening to take advantage of the opportunity
to kick off the second full season in the market. On top of the Pear Bureau’s existing plans and promotional activities
for the season – which included in-store promotions, public relations, and technical trade assistance – the extra push
provided by the Road Show generated interest, enthusiasm, and excitement for both consumers and retailers. The Road
Show was a focal point of the Pear Bureau’s promotional program and initial launch into the Chinese market. It also
served as a demonstration to the trade of the Pear Bureau’s dedication to providing promotional support in the market.
PROJECT APPROACH
The opening ceremony for the USA Pear Road Show promotion in China was held on November 15, 2014 in Beijing.
By the end of the activity on January 28, 2015, 55 promotion days were completed in Beijing and Shanghai at 20
locations of participating retailers including Sam’s Club, Yi Tong Long, Bei Chen, Jenny Wang, Aeon, RT Mart, Nong
Gong Shang, E-Mart, CenturyMart, and Walmart.
The first stop of the truck’s mobile showcase was the Sam’s Club located in Shijingshan district of Beijing. An
inauguration ceremony was organized and officiated by representatives from the Pear Bureau, Sam’s Club, and the US
Embassy in China. Several thousand consumers visited the Road Show and over 3,000 samples were distributed in the
opening weekend alone. Media also attended the event and press briefing that followed.
Approximately 60,000 Chinese consumers sampled USA Pears over the course of the promotion. In addition to singing
and dancing performances (paid with matching funds) that helped attract consumers’ attention to the Road Show, the
most popular activity throughout the period was the USA Pear Coloring Activities. Over 5,000 children with their
family members participated at the activity throughout the show period. Over 90,000 USA Pear leaflets were distributed
to Chinese consumers and the Road Show video was exposed to approximately 150,000 consumers. The Road Show
generated good media exposure through PBNW’s public relations efforts in China. The event was also featured in the
USA Pears Newsletter distributed to the fruit trade in the country.
Participating retailers were pleased to have participated in the events to promote USA Pears, with many commenting on
the innovative approach of PBNW in conducting such an activity in China – the first of its kind among all imported fruit
to organize a large-scale, open-air activity outside their stores in Beijing and Shanghai.
The consumer evaluation was conducted via a total of 180 face to face interviews completed at the Road Show venues
between November 16 to January 14 in Beijing and Shanghai. Consumers were randomly interviewed immediately after
they sampled USA Pears on the spot to collect their opinion and preference regarding USA Pears, if they will purchase
USA Pears in the future, which household members consume USA Pears, if parents will feed USA Pears to their
children, their rating of the USA Pear Road Show, etc.
The Pear Bureau’s representative in China, Louis Ng & Associates (LNA) oversaw the day-to-day development and
implementation of the activity, negotiated with retailers, coordinated the promotional schedule, and supervised the
agency executing the promotions.
The Pear Bureau home office had an oversight and project management role in the activity, approving the selection of
the promotional company, truck design, and retail partners. PBNW worked closely with LNA to manage the budget
and on reporting for the project.
This project did not benefit any non-specialty crops.

24
GOALS AND OUTCOMES ACHIEVED
The Road Show promotions had a direct impact on the performance measure results, educating consumers about the
attributes of USA Pears and influencing their purchase decisions. Throughout the promotions, the Master of Ceremonies
introduced USA Pears to the audience and explained USA Pear varieties, availability, ripening characteristics, and recipe
usage ideas. Demonstrators distributed leaflets with key information and provided the opportunity for consumers to
sample ripe USA Pears. A USA Pear video also played throughout the promotions. The children’s coloring contest kept
families at the promotion for an extended period of time, maximizing their exposure to USA Pears.
After just 2.5 years of market access, USA Pears are still new to the China market. The Road Show activity served as
a way to generate excitement for the product and introduce USA Pears to both consumers and the trade. The positive
results of the expected measurable outcomes demonstrate the vast potential for continued growth not only in the featured
cities of Beijing and Shanghai, but throughout the country.
PBNW’s strategy for the Road Show was to conduct an activity that could introduce USA Pears to consumers on a large
scale and provide promotional support to retailers to encourage the trade to increase their volumes of USA Pears. The
Road Show achieved these goals, and in some cases, exceeded expectations: an estimated 120,000 consumers visited
the 55-day promotion, with 60,000 samples being distributed. Retailers reported an average of 80.31% sales growth for
USA Pears during the promotion. Export volumes for the two-month period were nearly triple the initial target.
In order to evaluate progress towards the achievement of the Road Show targets, 180 consumer interviews were
conducted onsite during the promotions in Beijing and Shanghai. Results were as follows:
Target Result
A. % increase of Northwest Pear sales during the promotional period over
the previous sales period 50% 80.31%
B. % of consumers who purchased USA Pears for the first time after the
Road Show 5% 17.91%
C. % of consumers who consider health and nutrition important purchase
decision motivators 10% 11.5%
D. # of consumers who became more educated about Northwest pears after
staying 1-2 minutes 35,000 35,000
E. # of consumers who became more educated about Northwest pears after
staying longer than 2 minutes 13,500 50,000
F. # of children who became more educated about Northwest pears during
school promotions 6,500 N/A
G. % of more educated consumers who reported that the information will
influence their purchase behavior positively to buy more USA pears 5% 76%
H. USA Pear exports for the promotional period (mid-November 2014
through mid-January 2015) 33,000 boxes 96,512 boxes
BENEFICIARIES The Oregon and Washington growers and shippers of USA Pears are the beneficiaries of this project and the further
development of the China market as a top export destination. The Road Show activity succeeded in reaching a large
number of consumers with USA Pears’ educational message, with 76% reporting that the information provided will
influence their purchase decisions and 17.91% of purchases during the promotion period being new customers.
Activities with this type of broad reach are essential to continue to develop the Chinese market and maximize growth
in a market that has potential to become a top 3 market for the industry. PBNW anticipates that export volumes to China
will surpass 500,000 boxes in the next 3-5 seasons.
During the 2014/15 season, Russia – formerly the 3rd largest market for USA Pears – closed the market to U.S. products.
The industry turned to China and other export markets to increase their volumes and fill the void left by an over 450,000-
box market. In addition, the West Coast port strike delayed shipments during a key period of USA Pears’ window in
many export markets. In spite of these challenges, the Global Trade Atlas shows that China imported 204,750 boxes of
USA Pears worth $4.8 million during the season, and the overall average price per box for the season’s exports reached
the second highest level of $22.66. The USA Pear Road Show and PBNW’s promotional support inspired confidence
in the trade to handle increased volumes of USA Pears.
25
LESSONS LEARNED
PBNW experienced challenges in the timing of the Road Show, learning to anticipate unexpected issues arising in the
Chinese market. While the kickoff event was initially planned for early November, the APEC meeting November 10-
11 in China created a delay because of restrictions and measures in Beijing due to the number of Presidents and Heads
of countries visiting. As a result, the start date of the Road Show was postponed to November 15.
In addition, due to the new rules launched by the Beijing government in April 2014, trucks that are over 5 metric tons
are not allowed to enter the 5th Inner Ring Road of the city of Beijing. Nearly all of the planned Road Show venues
were located within the 5th Inner Ring Road. Therefore, a smaller truck had to be secured for the events. The deposit
for the initial truck rental was transferred towards the new truck. The initial designs were adapted to the new truck’s
specifications. In addition, it was negotiated to get two free big outdoor tents for the Road Show with tables and chairs.
The weather conditions and smog pollution were also a challenge for an outdoor activity. Due to the delayed kickoff,
the promotion was pushed into mid-January, when weather turned colder and smog warnings increased. PBNW plans
for future activities in the region to take place in October and November for improved weather conditions.
PBNW also learned that activities attracting kids and families are key elements to a successful promotion. In spite of
weather and smog issues, an estimated 45,000 participated in the children’s coloring contest, which kept families
engaged and provided PBNW a more extended period to communicate information to the consumers.
ADDITIONAL INFORMATION
Project Cash Match: $18,919.88
Video clips and photos are available in the following link:
14-15 Road Show Photos and Videos.zip
CONTACT INFORMATION
Lyndsey Kennedy
Pear Bureau Northwest
(503) 652-9720

26
Project Title: Market Research to Support Blueberries to Asia
Partner Organization: Washington Blueberry Commission (WBC)
PROJECT SUMMARY
Washington blueberry growers and exporters need detailed information on the market for blueberries in Korea, China,
and India. These Asian markets are likely to be important outlets for Washington’s growing blueberry production in
the years ahead, but without detailed information on distribution, importers, retailers, handling and storage, competition,
consumer purchase behavior and other factors, the WBC is not in a position to choose where to invest its own resources
in market development and promotion.
The project is timely because Washington blueberries are likely to soon gain access to these new markets. In Korea,
other U.S. states have access and have started shipping product. Oregon was the first and year one exports of Oregon
fresh blueberries to Korea totaled approximately 500,000 pounds. The recent implementation of the U.S.-South Korea
Free Trade Agreement has given a boost to these market access requests. Based on Oregon’s experience, Washington
recently requested to be added to the list of states eligible to ship blueberries to Korea and the WBC expects to receive
approval within the year. (IMPORTANCE). Washington does not have market access to China as yet, but expects that
market to open within a few years. And with ongoing negotiations for the Trans Pacific Partnership agreement likely
to come to fruition within a year or two, there could be a real opportunity for market access in Vietnam. All three are
solid markets for other U.S. fresh fruits and vegetables and should offer tremendous opportunity for Washington’s
blueberry growers. The WBC prefers to approach new markets with research studies first. Formal research will increase
the likelihood that WBC and its members enter each market successfully. Researchers can assess potential import,
wholesale, and retail partners to determine the most suitable trade partners for Washington blueberries. Similarly, the
research can help identify the most effective promotional tools for each market. The health benefits of blueberries will
likely be a major emphasis of future WBC promotions in all three markets but how best should the WBC convey health
benefit messages?
This project does not build on previously funded work.
PROJECT APPROACH
The Washington Blueberry Commission completed activities related to this project over a three-year period. Activity
commenced in 2014 with research and a market visit to China. A second market visit to China occurred in early 2015
and the final report on that country was delivered in May 2015.
The second study (on India) began following completion of the China project. A market visit to India took place in
October 2015 and the study on that market was delivered at the end of the 2015 calendar year.
The third research project (Korea) was initiated in early 2016. A market visit to Korea took place in March 2016 and
the final study on the Korean market was delivered in June.
For each market study, the Commission’s work included:
a. Desk research – a contractor conducted desk research on each market for blueberries. That research included an
examination of domestic production, consumption, imports and exports, consumer trends, market access, and
other factors. Sources for this effort included the Global Trade Atlas, USDA/FAS Attaché and GAIN Reports,
U.S. Commercial Service reports, the CIA World Factbook, the Food and Agriculture Organization, and a
variety of other online trade and consumer publications. For information related to blueberry market access,
the researcher consulted the USDA’s Phytosanitary Issuing and Tracking System (PCIT), World Tariff, and the
GlobalMRL database. That last system was used to develop a report on pesticide maximum residue level gaps
and regulatory discrepancies that could affect U.S. blueberry exports.
b. Market visits – For each country study, desk research was followed by market visits that included blueberry
industry representatives from the state. Meetings were held with leading importers, wholesalers, retailers, food
manufacturers and government officials covering fresh fruit, dried fruit, frozen products, and processed
ingredients. Cities targeted included Shanghai, Beijing, and Guangzhou in China, New Delhi and Mumbai in
India, and Seoul in Korea.
The research studies and market visits all confirmed that opportunities exist for Washington State blueberries in each
market. However, the scope of opportunity varies by market and product. In China and Korea, trade opportunities for
Washington blueberries will improve greatly once market access is secured for fresh berries. The availability of fresh

27
blueberries from Washington would likely strengthen awareness of Washington as a blueberry supplier and reinforce
demand for frozen and dried product.
In India, Washington State is already able to ship fresh blueberries but the logistics are a challenge to ensure product
freshness and quality. That market appears to offer greater immediate potential for frozen and dried product. These
and other findings are detailed in the final reports delivered for each country.
Industry members and in-country contractors played significant roles in each country study. As mentioned, a delegation
of industry members accompanied researchers to each country for market visits and trade meetings. These included:
• Brenton Roy – Oasis Farms (fresh, organic blueberry grower)
• Terry Dorsing – Royal Ridge Fruits (fresh and processed blueberry supplier)
• Alan Schreiber – Washington Blueberry Commission
• Rebecca Weber – Washington State Department of Agriculture
• Steve Mowat – Washington blueberry broker/exporter
Researchers also relied on in-country contacts for assistance with trade meeting arrangements and logistics. These
partners included:
• LiHai Dong (China) – Washington State Department of Agriculture representative in that market
• Danny Kim (Korea) - Washington State Department of Agriculture representative in that market
• Devna Khanna, i2i Group, India – Western US Agricultural Trade Association representative in India.
The scope of the project only benefitted blueberries.
GOALS AND OUTCOMES ACHIEVED
For each country study, the project consisted of the following activities:
a. Desk research – a contractor conducted desk research on each market for blueberries. That research included an
examination of domestic production, consumption, imports and exports, consumer trends, market access, and
other factors. Sources for this effort included the Global Trade Atlas, USDA/FAS Attaché and GAIN Reports,
U.S. Commercial Service reports, the CIA World Factbook, the Food and Agriculture Organization, and a
variety of other online trade and consumer publications. For information related to blueberry market access,
the researcher consulted the USDA’s Phytosanitary Issuing and Tracking System (PCIT), World Tariff, and the
GlobalMRL database. That last system was used to develop a report on pesticide maximum residue level gaps
and regulatory discrepancies that could affect U.S. blueberry exports.
b. Market visits – For each country study, desk research was followed by market visits that included blueberry
industry representatives from the state. Meetings were held with leading importers, wholesalers, retailers, food
manufacturers and government officials covering fresh fruit, dried fruit, frozen products, and processed
ingredients. Cities targeted included Shanghai, Beijing, and Guangzhou in China, New Delhi and Mumbai in
India, and Seoul in Korea.
c. Analysis and Reporting – following the market visit, the research contractor analyzed all collected data,
including market access and MRL reports, to determine findings related to market opportunities, challenges,
and risks. The findings were detailed in a comprehensive market report per country.
The original grant proposal included the following Expected Measurable Outcomes:
The goal of this project is to provide research that enables the WBC to develop an export market development strategy
in key Asian target markets. Ultimately, success will be determined by increased exports.
Washington state blueberry producers do not currently export to any of the three markets targeted with this project.
Therefore the benchmark for export sales value to each market is $0. By the end of the three years of the project,
Washington blueberry exports will exceed $1,000,000 in value to Korea, $2,000,000 in value to China and $200,000 to
India. These value figures represent the target.
Progress has been made toward these export goals though precise export figures for the start are difficult to obtain.
Blueberry exports are recorded at the national level and will combine figures for all exporting states. However,
Washington and Oregon are market leaders for export of frozen and dried blueberries to Asia. When looking at recent
trade statistics through the Global Trade Atlas and USDA GATS, the following exports have been recorded:
28
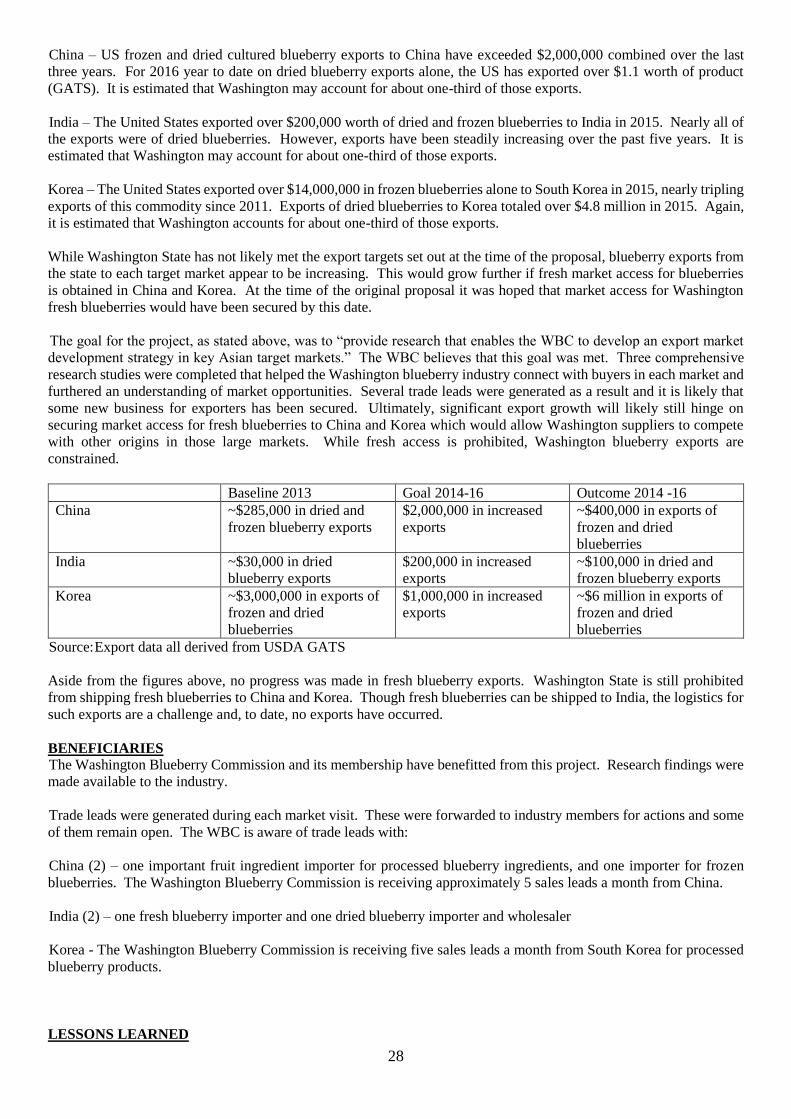
China – US frozen and dried cultured blueberry exports to China have exceeded $2,000,000 combined over the last
three years. For 2016 year to date on dried blueberry exports alone, the US has exported over $1.1 worth of product
(GATS). It is estimated that Washington may account for about one-third of those exports.
India – The United States exported over $200,000 worth of dried and frozen blueberries to India in 2015. Nearly all of
the exports were of dried blueberries. However, exports have been steadily increasing over the past five years. It is
estimated that Washington may account for about one-third of those exports.
Korea – The United States exported over $14,000,000 in frozen blueberries alone to South Korea in 2015, nearly tripling
exports of this commodity since 2011. Exports of dried blueberries to Korea totaled over $4.8 million in 2015. Again,
it is estimated that Washington accounts for about one-third of those exports.
While Washington State has not likely met the export targets set out at the time of the proposal, blueberry exports from
the state to each target market appear to be increasing. This would grow further if fresh market access for blueberries
is obtained in China and Korea. At the time of the original proposal it was hoped that market access for Washington
fresh blueberries would have been secured by this date.
The goal for the project, as stated above, was to “provide research that enables the WBC to develop an export market
development strategy in key Asian target markets.” The WBC believes that this goal was met. Three comprehensive
research studies were completed that helped the Washington blueberry industry connect with buyers in each market and
furthered an understanding of market opportunities. Several trade leads were generated as a result and it is likely that
some new business for exporters has been secured. Ultimately, significant export growth will likely still hinge on
securing market access for fresh blueberries to China and Korea which would allow Washington suppliers to compete
with other origins in those large markets. While fresh access is prohibited, Washington blueberry exports are
constrained.
Baseline 2013 Goal 2014-16 Outcome 2014 -16
China ~$285,000 in dried and
frozen blueberry exports
$2,000,000 in increased
exports
~$400,000 in exports of
frozen and dried
blueberries
India ~$30,000 in dried
blueberry exports
$200,000 in increased
exports
~$100,000 in dried and
frozen blueberry exports
Korea ~$3,000,000 in exports of
frozen and dried
blueberries
$1,000,000 in increased
exports
~$6 million in exports of
frozen and dried
blueberries
Source: Export data all derived from USDA GATS
Aside from the figures above, no progress was made in fresh blueberry exports. Washington State is still prohibited
from shipping fresh blueberries to China and Korea. Though fresh blueberries can be shipped to India, the logistics for
such exports are a challenge and, to date, no exports have occurred.
BENEFICIARIES
The Washington Blueberry Commission and its membership have benefitted from this project. Research findings were
made available to the industry.
Trade leads were generated during each market visit. These were forwarded to industry members for actions and some
of them remain open. The WBC is aware of trade leads with:
China (2) – one important fruit ingredient importer for processed blueberry ingredients, and one importer for frozen
blueberries. The Washington Blueberry Commission is receiving approximately 5 sales leads a month from China.
India (2) – one fresh blueberry importer and one dried blueberry importer and wholesaler
Korea - The Washington Blueberry Commission is receiving five sales leads a month from South Korea for processed
blueberry products.
LESSONS LEARNED

29
The WBC considers this project to have been a success. An important contributing factor to that success was the direct
engagement of industry members in the market outreach. Industry members traveled to each market and participated in
meetings. This allowed for clear representation of Washington’s blueberry industry and products and an honest
assessment by exporters of each market’s potential. Industry participation should be encouraged in all such research
projects.
On the negative side, however, it could be argued that these research studies were potentially completed prematurely.
China and Korea are not yet open to fresh blueberry shipments from Washington State and market visits to those two
markets could have been stronger if participants were in a position to also represent fresh exports. Without knowing
the timeline for a market access agreement importers could not commit to interest.
There were no unexpected outcomes or results.
Export goals that were set as expected measurable outcomes were not achieved however there are no real lessons learned
that would apply to others. The original goals were largely dependent upon Washington State securing market access
for fresh blueberries to China and Korea. That has not yet happened. Nevertheless, Washington continues to ship frozen
and dried blueberries to all markets and those exports appear to be increasing. Moreover, the three projects helped raise
awareness of the availability of Washington blueberries, which should help increase demand in the years ahead.
ADDITIONAL INFORMATION
In 2014, 2015 and 2016 the Washington Blueberry Commission contributed to travel costs for three trade missions. The
cost were $6,070.69 for the trip to China, $4,260.36 for the trip to India and $5,291.70. Additionally, the Commission
spent approximately $2,000 on development of promotional materials and sample shipping costs.
Additionally, the WBC provided significant in-kind contribution to this effort in terms of donation of industry time for
the travel time of the various members of the industry that went on the trade mission. It is hard to place a time value
on, but three members for three trips for 8 days or 72 person days.
During the course of this SCBG the Washington Blueberry Commission decided to expand this effort with the contractor
and provide additional funds to work to open up these three markets for additional exports in 2015 and 2016. For China
and South Korea the focus is on allowing fresh blueberries to enter both markets and for India the focus is for tariff
reductions. The fee for South Korea is $10,000, China is $10,000 and for India it is $5,000 for each year so the
combination of two years is an additional $50,000 spent in the general area of expanding export markets in China, South
Korea and India.
CONTACT INFORMATION
Alan Schreiber
Washington Blueberry Commission
(509) 266-4303

30
Project Title: A model for Incubating Beginning Growers & Teaching Sustainability Practices
Partner Organization: Viva Farms
PROJECT SUMMARY
The average age of the Washington farmer is 57, and many farmers will retire in the next 20 years. Young people and
Latino farm workers have great potential to carry the specialty crop industry into the future, but confront financial,
educational, cultural, and language barriers.
Viva Farms, a bilingual agricultural business incubator in Skagit County, will increase the success of beginning and
Latino specialty crop growers by providing in-depth assistance in every aspect of specialty crop production. The project
will focus on providing training in organic production; tractor/equipment use, safety, and maintenance; accessing
wholesale markets; food safety/Good Agricultural Practices (GAP) and business development. Viva Farms will incubate
25 new specialty crop producers and host workshops that will reach an additional 80 regional producers. Viva Farms
will also work with WSU Small Farms Program to carry out a program assessment measuring the community, social,
and economic impact of the incubator. The assessment will culminate in a published case study, and will be presented
and distributed at industry outlets and conferences throughout Washington. The study will document a replicable
incubator model and will inform the development of beginning and immigrant farmer training programs throughout the
state.
Washington’s specialty crop production faces a generational crisis: Per the 2007 agricultural census, the average age of
farmers in Washington is 57, which is on par with the national average. In the next 20 years, 70% of all farmers are
expected to retire. To replace retiring farmers and meet the market demand for local and organic specialty crops,
Washington needs well-trained new producers, both operators and labor. Fortunately, there are two demographics that
have the potential to carry agriculture, and specifically specialty crop production, into the next generation: young people
and Latino farm workers.
However, beginning and Latino farmers face many challenges when trying to establish a new specialty crop operation,
including gaining access to land, education, equipment, capital, and marketing channels. Latino farmers face additional
language and cultural barriers. In Washington, only 4.1% of all farms are owned and operated by Latino farmers (USDA
Agricultural Census, 2007), even though Latinos provide 83% of all US agricultural labor (US Department of Labor,
National Agricultural Workers Survey, 2002). Furthermore, Latinos are extremely underrepresented in organic specialty
crop production. Skagit County is the largest producer of specialty crops in western Washington, and organic production
alone is valued at $11,520,913, the highest value west of the Cascades (WSU, Current State of Organic Agriculture in
Washington State, 2012). Yet out of Skagit’s 44 WSDA certified organic farms, only two are Latino owned and
operated, even though 17.3% of Skagit population is Latino, and most work in agriculture (US Census, 2010). While
Latinos clearly have the agricultural experience and motivation needed to start specialty crop operations, the financial,
cultural, and language barriers that stand in the way are often insurmountable. Given the foundational role that Latinos
play in specialty crop production and the problem of impending farmer retirement, Washington needs more experiential
and enterprise-based educational bridges to help Latino farm workers become highly skilled farm owners and farm
managers.
Viva Farms was founded in 2009 to address the specific needs of new and Latino farmers, and to cultivate the next
generation of Washington farmers. Viva Farms is Washington’s most comprehensive bilingual farm business incubator,
and addresses each of these barriers by leveraging high-quality technical assistance and providing access to land,
education, equipment, capital, and markets.
The proposed project complements, but does not overlap with, the 2012 WSU Small Farms Team SCBG titled
Increasing Latino Farmer Specialty Crops Sales through Intensive Direct Marketing and Cross Cultural Training. The
2012 project focuses specifically on direct marketing for existing Latino producers. This project uses a farm incubator
model to help launch new farmers and train farm labor.
PROJECT APPROACH
Project Administration:
During the period of this grant, Viva Farms staff went through several staff changes, including Farm Manager, Produce
and Sales Manager, Development and Communications Manager, and Executive Director. Two founding staff members
left, including the Executive Director. Some of these changes resulted in delays in Project Administration, especially
from late 2014 through early 2015.

31
In October 2015, an Amendment to the grant agreement was approved. This amendment covered three sections: Period
of Performance, Agreement Management, and The Project Plan. The Period of Performance was extended to September
29, 2016. This extension allowed for completion of previously delayed or missed activities, including the hiring of the
grad student and completion of the case study. The Agreement Management section was amended to list Executive
Director Michael Frazier as the Viva Farms Agreement Manager. Finally, the Project Plan was amended to reflect new
targets for some of the expected Measurable Outcomes; new dates of completion for certain activities; and extended the
dates for all the activities related to the graduate student.
Work Plan Activities:
Meet with subcontractors and partners to finalize work plan. In January 2014, then Executive Director Ethan
Schaffer reported that Viva Farms met with subcontractors and partners to finalize work plan. At that time, Viva Farms
was expecting to work with WSU to find a graduate student to make a case study on the efficacy of Viva Farms. The
partners began developing case study parameters by creating 2014 annual goals and metrics for measuring success. They
identified strategies and measurable outcomes for each of the following goals, with the intention that the graduate student
would evaluate them in the fall of 2014:
• Incubate successful farmers by increasing their profits and commitment to farming.
• Provide excellent education programs.
• Grow the farm stand into a financial supporter of Viva Farms as well as an outreach and educational tool for
customers and Viva farmers.
• Increase fundraising efforts through effective grant writing and donor management.
• Develop long-term and strategic vision for Viva Farms.
• Assist farmers in achieving success post-Viva.
• Provide support for Latino and beginning farmers throughout Skagit Valley.
Despite discussing this plan early in the grant period, hiring a graduate student did not occur for the 2014 school year,
in part due to injury of the ED over the holidays. In fact, recruiting a WSU grad student for the project did not occur at
all during 2014, despite plans first for a spring 2014 start, then a spring 2015 start. In third quarter 2015, a contract
amendment was negotiated with WSDA that included an extension of the period of performance to September 2016 to
allow time for a graduate student to complete the study with a January 2016 start date. Kate Smith was recruited to
complete the study. By that time, many priorities had shifted at Viva Farms, especially with respect to the farm stand.
Efforts to turn the farm stand into a source of financial support for the farm had failed. In fact, the farm stand operated
at considerable loss in 2014, due to both a large staff and waste of perishable inventory. Further, the farm stand was
seen by many local farmers as a source of unfair competition. To ensure a large inventory, produce was being
purchased from Charlie’s Produce, the same company that supplies most of the local grocery stores in the area. It was
selling conventional, non-local food far more than any local organic food grown at Viva Farms. It was also an outdoor
farm stand lacking proper cold storage, which contributed to large quantities of waste. As a seven days per week, 10
hours per day operation, the farm stand required a large staff to operate it. For these reasons, the farm stand was scaled
back considerably in 2015, only open 3 days per week, and only selling produce from Viva Farmers and a few other
small local farms with whom Viva has a relationship. The marketing focus was shifted to wholesale markets.
Co-facilitate Skagit’s WSU Cultivating Success Ag Entrepreneurship course; provide additional business
planning assistance to incubator applicants enrolled in the course.
Viva Farms facilitated WSU’s Cultivating Success class in winter of 2014. The course ran from Jan 9, 2014 to Mar 24,
2014. Student enrollment was 24, with an attendance average of 18 students. This class was also offered to students at
Skagit Valley College (SVC) as part of the Sustainable Agriculture Education (SAgE) certificate. Four students
enrolled in SAgE completed the course. Area farmers, business owners, and distributors were engaged to lead
discussions and presentations.
Viva Farms facilitated the course a second time during the winter of 2015, from Jan 8, 2015 – Mar 26, 2015. Student
enrollment was 28, with an attendance average of 19 students. Nine SVC SAgE students completed the class.
Review applicants’ business plans; self-assessment surveys, select producers; sign leases; assist with and submit
applications for business licenses, farmer’s markets, organic certification, WIC Farmers Market Program, and
insurance coverage. Hold farmer orientation meeting.

32
Twelve farm businesses signed leases in early 2014. Each farm business went through an orientation meeting that
covered organic practices and standards, Viva Farms policies, and a review of crop selections.
1. Pure Nelida: Owned & operated by Nelida Martinez & Lizette Flores. Pure Nelida grows 72 Varieties of
veggies and flowers.
2. Lozano Farms: Owned and operated by Santiago Lozano. Lozano Farms specializes in strawberries and
raspberries.
3. Martina & Regino's Farm: Owned and operated by Martina Gutierrez. Martina and Regino's farm sells
strawberries and green beans.
4. Funny Farm: Owned and operated by Britany Fink. Funny Farm grows beets, onions, carrots, and cauliflower.
5. Ali's Farm: Owned and operated by Dr. Ali Inad and Ghazi Adood. Ali's Farm sells a variety of vegetables
and fava beans.
6. Ladyfield Farm: Owned and operated by Abbey Bloom-Esposito. Ladyfield grows ornamental plants for
wholesale.
7. Buena Berry: Owned and operated by Mauricio Soto. Buena Berry grows blackberries, raspberries, and
strawberries.
8. Sustenance: Owned and operated by Beth Meenaghan. Sustenance specializes in artichokes, winter squash,
tomatoes, okra, chard, kale, and beans.
9. Arguta: Owned and operated by Anne Baxter. Arguta specializes in cold hardy kiwis.
10. Sabino's Farm: Owned and operated by Sabino Flores. Sabino's Farm grows chilacayote, chiles, beets,
lettuce, and squash.
11. Lucy's Nursery: Owned and operated by Lucia Villegas. Lucy specializes in flowers and lilies.
12. Earthfire Farm: Owned and operated by Bruce Lindsay. Bruce grows lettuce, kale, onions, garlic and peas.
Outreach fellow Leigh Newman-Bell assisted four farmers to apply for WIC; five farmers apply for farmer’s market
vending. She also helped Pura Nelida get additional insurance to bring prepared foods to the farmer’s market.
During the first two calendar quarters of 2015, fifteen farm businesses signed leases at Viva Farms. Each farm
business went through an orientation meeting that covered organic practices and standards, Viva Farm policies, and a
review of plant selections. 2015 farm businesses include:
1. Pure Nelida: Owned & operated by Nelida Martinez & Lizette Flores. Pure Nelida grows 72 Varieties of veggies
and flowers.
2. Sustenance: Owned and operated by Beth & Kevin Meenaghan. Sustenance specializes in artichokes, winter
squash, tomatoes, and cucumbers.
3. Sabino's Farm: Owned and operated by Sabino Flores. Sabino's Farm grows chilacayote, chiles, beets, lettuce,
and squash.
4. Lucy's Nursery: Owned and operated by Lucia Villegas. Lucy specializes in flowers and lilies.
5. Matthew Cioni and Giana Walkim: Matt and Giana grow a variety of market vegetables, including mixed
greens and peas.
6. Jason Crowell: Jason grows a variety of mixed market vegetables.
7. David Kim: A variety of mixed Asian herbs.
8. James Hanika: James grows a variety of mixed vegetables, including beans, peas, squash, corn and tomatoes.
9. Lozano Farms: Owned and operated by Santiago Lozano. Lozano Farms specializes in strawberries and
raspberries.
10. Martina & Regino's Farm: Owned and operated by Martina Gutierrez. Martina and Regino's farm sells
strawberries and green beans.
11. Buena Berry: Owned and operated by Mauricio Soto. Buena Berry grows blackberries, raspberries, and
strawberries.
12. Earthfire Farm: Owned and operated by Bruce Lindsay. Bruce grows lettuce, kale, onions, garlic and peas.
13. Arguta Farm: Owned and operated by Anne Baxter. Arguta specializes in cold-hearty Kiwi’s.
14. Boldly Grown Farm: Owned and operated by Jacob Slosberg and Amy Frye. Amy and Jacob grow cut flowers
and winter storage crops. They operate a winter CSA.
15. Jonquil Farm: Owned and operated by Jonelle Schermerhorn. Jonelle grows squash and cucumbers.
James Hanika, who signed his lease early in 2015, decided not to farm at Viva after all due to his time commitment at
a new job, bringing the total number of signed leases to 14.

33
During the first two calendar quarters of 2016, twelve farm businesses signed leases at Viva Farms. Each farm
business went through an orientation meeting that covered organic practices and standards, Viva Farms policies, and a
review of crop selections. 2016 farm businesses include:
1. Pure Nelida: Owned & operated by Nelida Martinez. Pure Nelida grows 72 Varieties of veggies and flowers.
2. Sustenance: Owned and operated by Beth & Kevin Meenaghan. Sustenance moved to a monocrop model,
growing ½ acre of perennial artichokes and selling wholesale only.
3. Sabino's Farm: Owned and operated by Sabino Flores. Sabino's Farm grows chilacayote, chiles, beets,
lettuce, and squash.
4. Matthew Cioni and Giana Walkim: Matt and Giana specialize in culinary herbs and some mixed market
vegetables.
5. David Kim: A variety of mixed Asian herbs.
6. Lozano Farms: Owned and operated by Santiago Lozano. Lozano Farms specializes in strawberries and
raspberries.
7. Martina & Regino's Farm: Owned and operated by Martina Gutierrez. Martina and Regino's farm sells
strawberries and green beans.
8. Arado Farm: Owned and operated by Mauricio Soto. Formerly Buena Berry, Arado grows blackberries,
raspberries, and strawberries.
9. Arguta Farm: Owned and operated by Anne Baxter. Arguta specializes in cold-hearty Kiwi’s.
10. Boldly Grown Farm: Owned and operated by Jacob Slosberg and Amy Frye. Amy and Jacob grow cut flowers
and winter storage crops. They operate a winter CSA.
11. Jonquil Farm: owned and operated by Jonelle Schermerhorn. Jonelle grows squash and cucumbers.
12. Cabrera Farms: Francisco Cabrera. Francisco Cabrera grows several varieties of lettuce.
Review/finalize production plans; coordinate group purchases of spring supplies (propagation materials, tools,
seeds, etc.); provide 1-on-1 field preparation support to new tractor operators.
In spring of 2014, Viva Farms coordinated group buying for berry flats and pints, as well as produce boxes. Four
farmers purchased 700 raspberry half pint flats, 2,400 pint flats, 9660 pints, and 40 waxed produce boxes. In early
June, Viva Farms purchased a shipping container for storage to make better use of bulk purchasing and long-term dry
storage.
In 2015, all the farmers had production meetings with new Produce and Sales Manager Erin Mercier regarding
expected production, marketing and sales. Operations Manager Rob Smith coordinated the purchase of spring
supplies, such as composted horse manure, wood chips, and organic fertilizer.
Hold two 30-hour Tractor and Farm Safety courses at Viva Farms, once per grant year.
Tractor safety courses were originally intended to be held during spring of 2014 and 2015. However, the 2014 class
was cancelled due to low registration. Farm and Tractor Safety was held at WSU Skagit County extension during
April – May 2015. This is the usual location for this course, although Viva Farmers are required to attend this course
to use the tractors at Viva Farms, unless they can show they have prior experience driving tractors. Amendment 1 to the
grant agreement amended this workplan activity to tractor safety courses being held in spring of 2015 and 2016.
WSU Skagit Extension director Don McMoran writes: “We had 22 participants this year in the 2016 WSU Skagit
County Extension Gearing Up for Safety Course. There was a nice mix of youth, adults and Latino participants. All
participants were able to pass the 70-question written test with a 70% or better, 80% on the pre-operational exam and
90% or better on the driving skills test over the 5 weeks and 20 hours of the course. This was one of the best groups
we have ever had and I think it shows in the evaluations.”
Ongoing: Daily, request-based assistance with pest, disease, weed, irrigation and field equipment management;
organic compliance questions; marketing/sales and business management.
These activities comprise most of the day-to-day work at Viva Farms. Here are some highlights from the 2nd quarter
of 2014.
Consultation with WSU entomologists: In early spring, Viva Farmer Nelida Martinez noticed severe plant damage
around the roots of her squash. She discovered Crane Fly Larva, something previously unseen at Viva Farms.
Through the established partnership with the Washington State University Mount Vernon Research Center, the help of
WSU entomologists Dr. Lynell Tanigoshi and Dr. Beverly S. Gerdeman was brought in, they were able to identify the

34
pest and help Nelida and other Viva Farmers develop an immediate solution as well as a remediation plan for next
year. Nelida was already aware of one way to organically treat the pest using an organic approved product called
Entrust. This product is incredibly expensive, but Nelida and other Viva Farmers were able to reduce the cost
significantly by purchasing in bulk then divvying up amongst the farms. Additionally, farm manager Mauricio Soto
provided expert guidance and training on using concentrated organic sprays to ensure that farmers used the product
safely and effectively. Viva Farmers saw immediate results and were able to salvage their plantings. In the Skagit
Valley, farmers have excellent resources at the Washington State.
Washington State University Northwest Extension and Research Center. However, research and extension services are
not always accessible to beginning or Spanish speaking farmers. Viva Farms plays an essential role in the community
by connecting and building relationships between the Latino farming community and WSU researchers and resources.
The joint use of Entrust is a great example of how operating in close proximity at the incubator facilitates
collaboration and allows multiple small farms to achieve economies of scale often unobtainable by new farms.
Cover Cropping: Vacant plots were planted with nearly four acres of buckwheat. This planting will help manage
weeds and the long-term health of the farm. With the new organic certification it is essential to establish good soil
building practices.
Demonstration Garden: New methods for planting systems were demonstrated to farmers. By setting up a half acre of
beds mulched in plastic and planted in squash, farmers can understand the costs of using mulches versus manpower to
maintain weeds. Viva is showing farmers how to find customers before planting, by preselling the squash planting to
Pagliacci’s, a pizza chain in Seattle.
Organic Certification: Finally, the most important achievement this quarter was becoming certified organic! The
inspection was conducted on May 13, all farmers met with the inspector to go over their recordkeeping and farming
operations. As a group, Viva will need to work on better record keeping for seed purchases and record keeping in
general.
Sales: Viva Farms operates a retail farm stand and a wholesale program that sells to local restaurants, grocery stores,
ice cream makers, and schools. The wholesale program has seen 23% growth in sales this year. There are several new
clients and a frozen sherbet sold at Molly Moon’s in Seattle made exclusively from Viva Farms Strawberries. These
sales greatly increase the likelihood of success among the farmers.
Here are some highlights from the 3rd quarter of 2014.
Cover Cropping: Cover crop from 2nd quarter buckwheat planting was disked in, and have been worked in two
additional times from dropped seed. Viva is currently with farmers to get fields cleaned and prepped for a winter rye
planting.
Organic Certification: The certified transitional acres transitioned into organic this quarter.
New and Growing Farmers: Viva has signed a lease for one new farm business – The Crow’s Farm. Matthew Cioni
and Giana Wakim are growing on one acre with fall plantings like garlic and mixed vegetables for spring. They plan to
sell to restaurants. Lucia Villegas, of Lucy’s Nursery will expand her farm from .25 acre to .50 of an acre. Mauricio
and Senaida Soto of Buena Berry, will expand from .60 acre to 2.6 at Viva Farms.
In 2015 – and in general – request-based assistance is a major part of the job at Viva Farms during the growing
season. Both Operations Manager Rob Smith and Farm Manager Mauricio Soto are busy every day helping with
equipment, offering advice about weed and pest management and irrigation. The Produce Manager works full time at
marketing and sales.
Ongoing: Monthly incubator farmer meetings covering topics such as organic production, food safety and post-
harvest management.
This activity was originally written as Bi-weekly, but amended to Monthly with Amendment 1 to reflect reality. Bi-
weekly meetings are challenging with respect to both farmer time and staff time. Most of the incubator participants
have jobs in addition to running their farm at Viva Farms. However, during the period covered by this grant, the
monthly meetings have become more organized and useful, and have an agenda. During the growing season, there is

35
usually more to discuss than there is time for, including production and planning issues. Sales processes often take up
much of the time, as the meetings are a good time to answer questions with as many farmers as possible present.
Quarterly individual meetings on production, marketing/sales and business administration progress and
challenges.
Quarterly meetings with individual farmers are informal and generally held on an as-needed basis. Some farmers
engage frequently with Viva Farms staff, and may be in the office weekly. Other farmers are less present, and may
interact only by phone or email. Factors affecting the amount of time staff interact with any particular farmer include
the size of the farm business, type of crop grown, and whether the farmer also has another job, whether that job is full
time or part time, and what kind of shift they work. Typically, the berry farmers with multiple acres in production are
frequently interacting with staff about these issues during the berry season.
Quarterly individual records check in to assist with record keeping and compliance.
These meetings began formally during the spring of 2014, when farmers met one-on-one with Operations Director,
Shannon Carmody, to organize and prepare for the initial organic inspection. Each farmer also met one- on-one with
the Oregon Tilth Organic Certified inspector to discuss their farming practices and business.
All the farmers met with the Operations Director again in September 2014 to discuss sales and record keeping as they
relate to organic certification. Many of these meetings focused on creating systems to differentiate between
conventional sales and organic sales.
In 2015, the organic certification for Viva Farms was renewed on April 1. The organic inspection was conducted on
May 19th. Farmers were encouraged to bring their records up-to-date before that date. Organic certification and record
keeping was discussed later in 2015 at the December 2 farmer’s meeting.
Prepare quarterly progress reports for WSDA on project outcomes.
Quarterly reports were submitted to WSDA throughout the period of performance.
Assist WSDA organic inspectors with interpretation as needed.
Originally, Viva Farms expected to become certified organic under the WSDA. However, WSDA does not offer
certification for incubator programs now, and Oregon Tilth has an established program. Oregon Tilth inspector John
Hollinrake has worked with incubator farms and speaks basic Spanish. Viva Farms staff helped translate as needed,
but encouraged the interaction and relationship building between Hollinrake and each farmer.
Hire WSU graduate student. Develop case study parameters and create study work plan. Finalize research
methods and data collection timeline.
This activity was delayed again and again throughout the grant period for reasons that were discussed earlier in the
report. In January 2016, Kate Smith began the case study. As the Northwest Small and Latino Farm Educator with the
WSU Extension Small Farms Program/Skagit County Extension, Kate was already very actively involved with Viva
Farms. She serves as the translator at farmer meetings and many of the workshops, and works directly with many of
the Latino farmers on paperwork or other areas where they need assistance and translation. Due to the nature of the
surveys and interviews being conducted for the case study, this was ideal because there was already a level of trust
between Kate and the Latino farmers.
For the period of Quarter 1 2016, Kate’s tasks included:
• Conducting a literature review of current publications on Farm Incubators, Participatory Learning, Program
Evaluation, etc.
• Refining research questions, project design and methods; accumulating data from past surveys; conducting
interviews with previous participants to add to the data, using a revised version of the Viva End of Year Survey.
• Contacting NIFTI (National Incubator Farm Training Initiative). Kate intended to include some questions on
her surveys from the upcoming national farm incubator survey.
• Applying through the WSU Internal Review Board to get the evaluation approved as an ethical approach to
research. Kate found that an evaluation would be counted as exempt from going through the elongated process.
36
For her dissertation, Kate plans to write about the Contributions of Farm Incubators to Sustainable Food Systems.
For the 2nd quarter of 2016, WSU graduate student Kate Smith reported:
• Data Collection is currently underway with interviews with current and past Viva Farms participants
• Data analysis platform has been chosen and data entry has begun
• Draft of case study has been started
• She applied to present at the Tilth conference leading a panel session on Farm Incubators (after approved she
will reach out to have someone from Viva participate on the panel)
Kate completed her work study plan during this timeframe. It is included as an attachment.
Coordinate, aggregate and transport bi-weekly product deliveries to retailers, restaurants and institutions in
North Puget Sound.
In 2014, Viva Farms completed the wholesale program on October 1. Sales increased nearly 15%, from $39,791 in
2013, to $46,468 in 2014. Viva Farms sold more produce through the Puget Sound Food Hub, adding two more
delivery days to the wholesale delivery schedule. The wholesale program added several new customers in Bellingham
and Seattle, including Molly Moon’s ice cream, which accounted for 10% of 2014’s wholesale sales and provided
wonderful promotional opportunities.
Increased sales also brought more challenges. Viva Farms exceeded the capacity of the delivery van, which is a
standard size passenger van with the seats removed. The farm partnered with Community Action to rent a larger
delivery van when delivering more products. Organic certification provided access to new customers in higher- end
markets. One lesson learned was that farmers needed training in grading and packing to be prepared for these new
markets.
In 2015, the Produce Manager brokered sales and deliveries for farmers through three different wholesale markets:
The Puget Sound Food Hub, Viva Farms wholesale, and the Viva Farms farm stand. Viva Farms purchased $12,443
worth of produce from incubator participants for sales through the Puget Sound Food Hub. The Food Hub provides
web-based centralized purchasing, invoicing, and distribution for farmers and buyers throughout the Puget Sound
region. Deliveries from Viva were made twice per week to the Food Hub distribution center at Bow Hill Blueberries.
Viva Farms also runs a wholesale program directly to several locations in Seattle, including Molly Moon’s Ice Cream
and Stockbox Grocery. Produce was delivered to Seattle customers every Tuesday and Friday.
Viva Farms changed the business model of the farm stand somewhat in 2015, committing to selling only produce
from Viva farmers and a few other local farms. For this reason, the ability to stock the farm stand fully was limited
compared to other years, and so the hours of operation were reduced. The farm stand was open Thursday, Friday, and
Saturday from 11 am to 7 pm. An unseasonal storm with high winds damaged the farm stand in August, abruptly
ending the strawberry season and causing the farm stand to be closed for one weekend in August. Viva Farms
purchased $14,643 worth of produce from Viva farmers for sale at the farm stand. That amount breaks down to $6,803
for July, $5,668 for August, and $2,172 for September.
Due to the unusually warm and dry summer in 2015, wholesale produce sales continued into October, and sales on the
Puget Sound Food Hub continued into November. At the end of 2015, sales had increased nearly 41% over 2014 –
from $46,468 to $70,473.
2016 was not actually a reporting period for this activity, but at this writing, 2016 sales are at $127,464, an 81%
increase over 2015.
Quarterly meetings on case study data collection.
The first meeting was held on April 29th. WSU graduate student Kate Smith presented her research to date. After this
meeting, her project plan was approved by her advisors at WSU.

37
Annual review (generate and/or review each farmer’s Profit/Loss report, revise business plan for next season,
discuss spin-off readiness); pre-CPA tax preparation.
During Oct-Dec 2013, Viva Farms staff met with all 12 farm businesses to evaluate their farms and businesses for
2013. The total acreage in production by Viva Farmers was 47.675 (up from 44 in 2012). This includes land both on
and off-site – Viva Farms itself was not fully leased. Most farmers saw increases in their profits. However, Viva’s
most successful farm, Lozano Farms, saw little increase due to pest problems. This sparked discussion of better farm-
wide pest, weed, and disease management. The staff planned to implement an Organic Systems Plan (OSP) for 2014,
to outline preventive measures, expectations of Viva incubator participants, and record keeping requirements. The
OSP will allow Viva Farms and all incubator participants to become organically certified, increase profit, and find new
markets.
Operations Director Shannon Carmody met with each farmer in September of 2014 to discuss sales and
recordkeeping, and to evaluate farm businesses for 2014. Two farm businesses left Viva at the end of 2014. This
includes Ali’s Farm, owned and operated by Dr. Ali Inad and Ghazi Adood. Ali and Ghazi found they lived too far
away from Viva to be present at the farm often enough to care for their crops. Brittany and Craig Fink- Minklin, who
owned and operated Funny Farm, also left at the end of 2014 due to a move to Wenatchee, WA.
End-of-season annual reviews were conducted with 13 of 14 farm businesses at the end of 2015. Of the 14, two left
and 12 remained for the 2016. The farms that left included Earthfire Farm, owned by Bruce Lindsay. A retired USDA
soils scientist, Bruce found that working ½ acre on his own was too much work. He had a change of heart early in
2016, but Viva was fully leased by then. However, another farmer who was not using all her land allowed Bruce to use
a portion. Bruce also volunteered his time at Viva in many areas, especially helping with the land- based practicum,
which was in its first year in 2016. As a volunteer, he is a valued asset to the Viva team. He will again be leasing ¼
acre in 2017. The other farmer who left at the end of 2015 was Jason Crowell. Jason’s experience at Viva Farms
convinced him that farming was not what he wants to do. In some ways, this counts as a success for an incubator farm
- it allowed Jason to give farming a try for a season without too much financial commitment, and helped him make a
lifestyle choice.
Fifteen farmers began farming at Viva Farms in 2015. Lucy’s Nursery, a cut-flower business, left much earlier in the
season after she could acquire land off-site.
Final Data Collection Meeting
In 2016 the final data collection meeting for the case study by WSU graduate student Kate Smith was held September
23rd at Viva Farms. The discussion included:
• Update on data collection progress
• Ask for support following up with a few past participants that Kate had not been able to reach
• Scheduling of 2 staff interviews
• Create a calendar for drafts, edits, proofs and final draft of case study
• Plan for presentation at Tilth Conference
• Brainstorm case study distribution plan
During the meeting, Kate and the staff decided that Executive Director Michael Frazier would be the Viva
representative on the panel discussion at Kate’s presentation at the Tilth Conference in November in Wenatchee, WA.
Analyze data and draft case study report
Edit, proof, fact check final draft of case study. Publish case study.
WSU graduate student Kate Smith compiled the results of her case study into a Preliminary Report, which is attached.
Kate also produced a one page infographic to illustrate the results of the study. This document is also attached.
Distribute case study to agriculture organizations, publish online (Viva Farms, WSU SFT and other websites)
and present at conferences. Amendment 1 noted: Report will be presented at appropriate conference that may
fall outside of grant timeline.
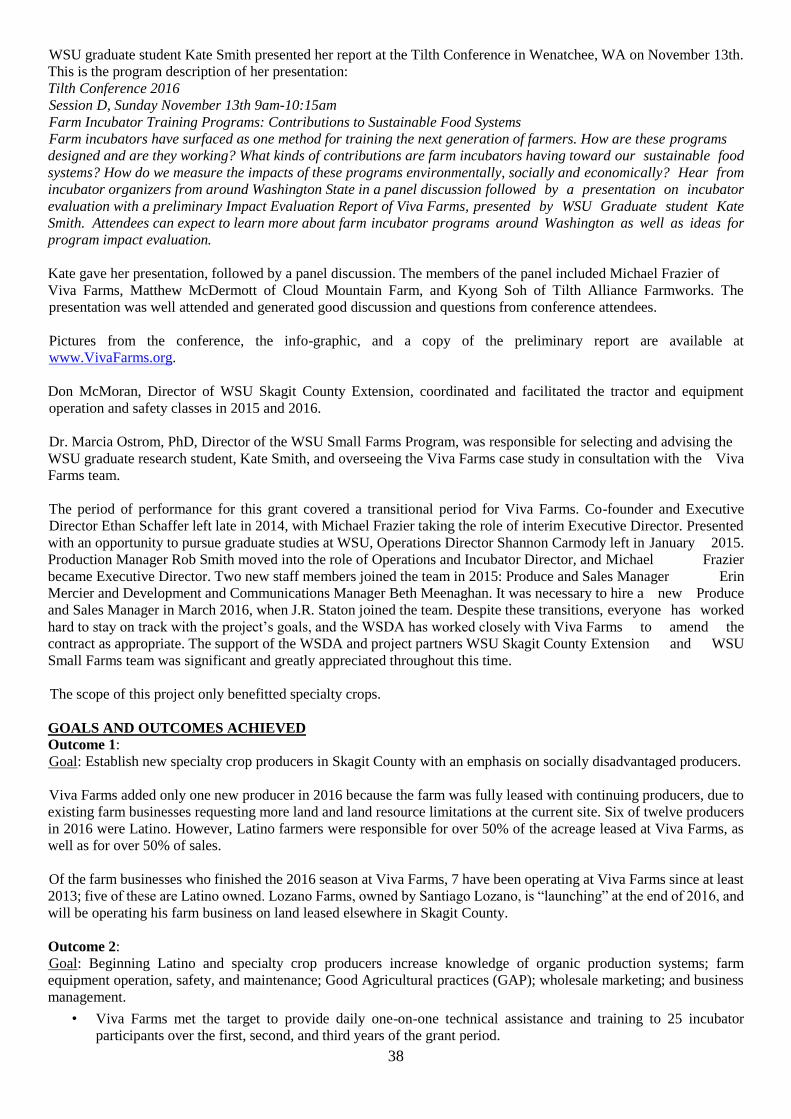
38
WSU graduate student Kate Smith presented her report at the Tilth Conference in Wenatchee, WA on November 13th.
This is the program description of her presentation:
Tilth Conference 2016
Session D, Sunday November 13th 9am-10:15am
Farm Incubator Training Programs: Contributions to Sustainable Food Systems
Farm incubators have surfaced as one method for training the next generation of farmers. How are these programs
designed and are they working? What kinds of contributions are farm incubators having toward our sustainable food
systems? How do we measure the impacts of these programs environmentally, socially and economically? Hear from
incubator organizers from around Washington State in a panel discussion followed by a presentation on incubator
evaluation with a preliminary Impact Evaluation Report of Viva Farms, presented by WSU Graduate student Kate
Smith. Attendees can expect to learn more about farm incubator programs around Washington as well as ideas for
program impact evaluation.
Kate gave her presentation, followed by a panel discussion. The members of the panel included Michael Frazier of
Viva Farms, Matthew McDermott of Cloud Mountain Farm, and Kyong Soh of Tilth Alliance Farmworks. The
presentation was well attended and generated good discussion and questions from conference attendees.
Pictures from the conference, the info-graphic, and a copy of the preliminary report are available at
www.VivaFarms.org.
Don McMoran, Director of WSU Skagit County Extension, coordinated and facilitated the tractor and equipment
operation and safety classes in 2015 and 2016.
Dr. Marcia Ostrom, PhD, Director of the WSU Small Farms Program, was responsible for selecting and advising the
WSU graduate research student, Kate Smith, and overseeing the Viva Farms case study in consultation with the Viva
Farms team.
The period of performance for this grant covered a transitional period for Viva Farms. Co-founder and Executive
Director Ethan Schaffer left late in 2014, with Michael Frazier taking the role of interim Executive Director. Presented
with an opportunity to pursue graduate studies at WSU, Operations Director Shannon Carmody left in January 2015.
Production Manager Rob Smith moved into the role of Operations and Incubator Director, and Michael Frazier
became Executive Director. Two new staff members joined the team in 2015: Produce and Sales Manager Erin
Mercier and Development and Communications Manager Beth Meenaghan. It was necessary to hire a new Produce
and Sales Manager in March 2016, when J.R. Staton joined the team. Despite these transitions, everyone has worked
hard to stay on track with the project’s goals, and the WSDA has worked closely with Viva Farms to amend the
contract as appropriate. The support of the WSDA and project partners WSU Skagit County Extension and WSU
Small Farms team was significant and greatly appreciated throughout this time.
The scope of this project only benefitted specialty crops.
GOALS AND OUTCOMES ACHIEVED
Outcome 1:
Goal: Establish new specialty crop producers in Skagit County with an emphasis on socially disadvantaged producers.
Viva Farms added only one new producer in 2016 because the farm was fully leased with continuing producers, due to
existing farm businesses requesting more land and land resource limitations at the current site. Six of twelve producers
in 2016 were Latino. However, Latino farmers were responsible for over 50% of the acreage leased at Viva Farms, as
well as for over 50% of sales.
Of the farm businesses who finished the 2016 season at Viva Farms, 7 have been operating at Viva Farms since at least
2013; five of these are Latino owned. Lozano Farms, owned by Santiago Lozano, is “launching” at the end of 2016, and
will be operating his farm business on land leased elsewhere in Skagit County.
Outcome 2:
Goal: Beginning Latino and specialty crop producers increase knowledge of organic production systems; farm
equipment operation, safety, and maintenance; Good Agricultural practices (GAP); wholesale marketing; and business
management.
• Viva Farms met the target to provide daily one-on-one technical assistance and training to 25 incubator
participants over the first, second, and third years of the grant period.
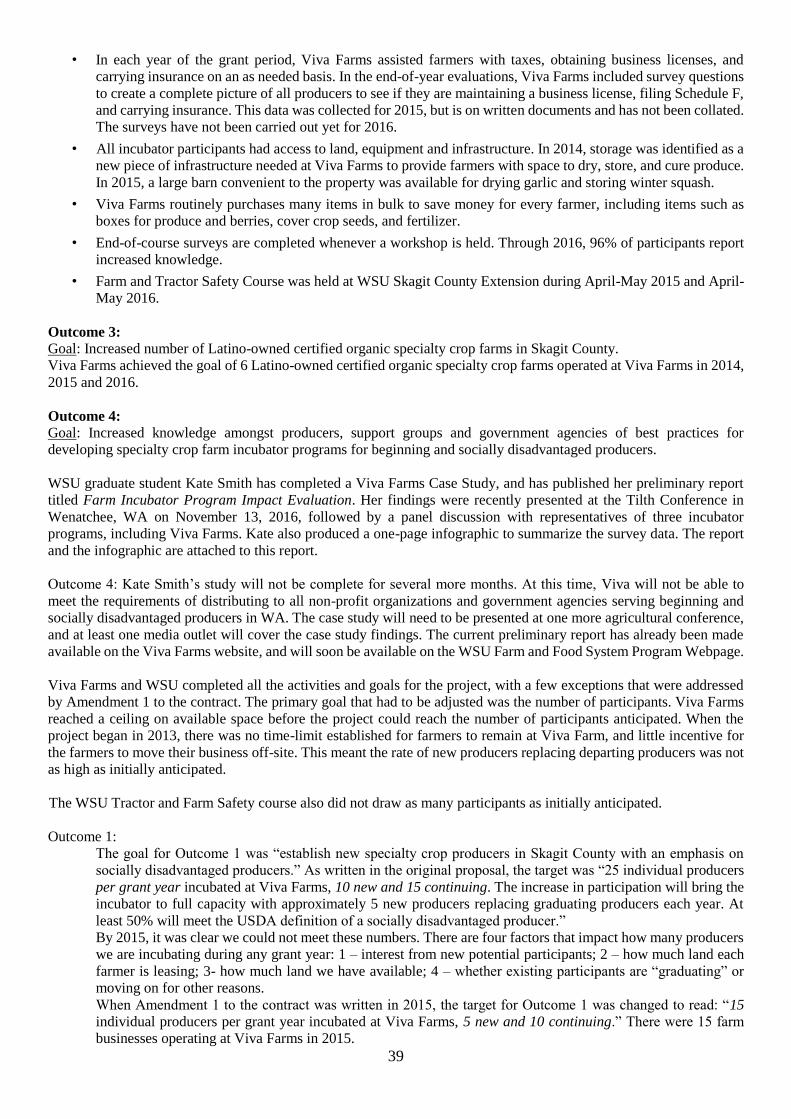
39
• In each year of the grant period, Viva Farms assisted farmers with taxes, obtaining business licenses, and
carrying insurance on an as needed basis. In the end-of-year evaluations, Viva Farms included survey questions
to create a complete picture of all producers to see if they are maintaining a business license, filing Schedule F,
and carrying insurance. This data was collected for 2015, but is on written documents and has not been collated.
The surveys have not been carried out yet for 2016.
• All incubator participants had access to land, equipment and infrastructure. In 2014, storage was identified as a
new piece of infrastructure needed at Viva Farms to provide farmers with space to dry, store, and cure produce.
In 2015, a large barn convenient to the property was available for drying garlic and storing winter squash.
• Viva Farms routinely purchases many items in bulk to save money for every farmer, including items such as
boxes for produce and berries, cover crop seeds, and fertilizer.
• End-of-course surveys are completed whenever a workshop is held. Through 2016, 96% of participants report
increased knowledge.
• Farm and Tractor Safety Course was held at WSU Skagit County Extension during April-May 2015 and April-
May 2016.
Outcome 3:
Goal: Increased number of Latino-owned certified organic specialty crop farms in Skagit County.
Viva Farms achieved the goal of 6 Latino-owned certified organic specialty crop farms operated at Viva Farms in 2014,
2015 and 2016.
Outcome 4:
Goal: Increased knowledge amongst producers, support groups and government agencies of best practices for
developing specialty crop farm incubator programs for beginning and socially disadvantaged producers.
WSU graduate student Kate Smith has completed a Viva Farms Case Study, and has published her preliminary report
titled Farm Incubator Program Impact Evaluation. Her findings were recently presented at the Tilth Conference in
Wenatchee, WA on November 13, 2016, followed by a panel discussion with representatives of three incubator
programs, including Viva Farms. Kate also produced a one-page infographic to summarize the survey data. The report
and the infographic are attached to this report.
Outcome 4: Kate Smith’s study will not be complete for several more months. At this time, Viva will not be able to
meet the requirements of distributing to all non-profit organizations and government agencies serving beginning and
socially disadvantaged producers in WA. The case study will need to be presented at one more agricultural conference,
and at least one media outlet will cover the case study findings. The current preliminary report has already been made
available on the Viva Farms website, and will soon be available on the WSU Farm and Food System Program Webpage.
Viva Farms and WSU completed all the activities and goals for the project, with a few exceptions that were addressed
by Amendment 1 to the contract. The primary goal that had to be adjusted was the number of participants. Viva Farms
reached a ceiling on available space before the project could reach the number of participants anticipated. When the
project began in 2013, there was no time-limit established for farmers to remain at Viva Farm, and little incentive for
the farmers to move their business off-site. This meant the rate of new producers replacing departing producers was not
as high as initially anticipated.
The WSU Tractor and Farm Safety course also did not draw as many participants as initially anticipated.
Outcome 1:
The goal for Outcome 1 was “establish new specialty crop producers in Skagit County with an emphasis on
socially disadvantaged producers.” As written in the original proposal, the target was “25 individual producers
per grant year incubated at Viva Farms, 10 new and 15 continuing. The increase in participation will bring the
incubator to full capacity with approximately 5 new producers replacing graduating producers each year. At
least 50% will meet the USDA definition of a socially disadvantaged producer.”
By 2015, it was clear we could not meet these numbers. There are four factors that impact how many producers
we are incubating during any grant year: 1 – interest from new potential participants; 2 – how much land each
farmer is leasing; 3- how much land we have available; 4 – whether existing participants are “graduating” or
moving on for other reasons.
When Amendment 1 to the contract was written in 2015, the target for Outcome 1 was changed to read: “15
individual producers per grant year incubated at Viva Farms, 5 new and 10 continuing.” There were 15 farm
businesses operating at Viva Farms in 2015.

40
Between existing farmers increasing acreage, and some experienced new farmers starting with relatively high
acreage, Viva Farms was fully leased in 2016 with only 12 incubating farms participating – and the farm had to
turn away interested individuals. In many cases, the incubator farms are operated by more than one individual
– usually two family members, but in some cases, business partners. In that way, Viva Farms has met the metric
of “15 individual producers.” Fifty percent of the 2016 farm businesses meet the USDA definition of socially
disadvantaged.
Outcome 2:
The goals and targets of this outcome were broad and varied. Goals include:
Beginning and Latino specialty crop producers increase knowledge of organic production systems
Farm equipment operation, safety, and maintenance
Good Agricultural Practices (GAP)
Wholesale marketing
Business management
The targets are listed below. Progress towards those targets is indicated in bold. Unfortunately, Viva Farms
does not have baseline data from 2013 for this data, and 2016 surveys have not yet been conducted. The
information below reflects data from 2014 and 2015.
Deliver daily one-on-one technical assistance and training to 25 incubator participants over the 2-year grant
period. Amendment 1 extended the project through the 2016 growing season, so Viva Farms is
counting three years for the project.
o All 25 will gain access to land, equipment and infrastructure
o Viva Farms has met this goal. There has been a total of 26 independent farm businesses
operating at Viva Farms in the time frame spanning from 2013, the baseline year.
Additionally, many of the businesses have two or more active participants in the program.
Obtain WA state business licenses. In 2014, 12 farmers completed end-of-year surveys. Of these, 10
reported having a WA state business license. In 2015, out of 13 surveyed farmers, 9 reported having
business licenses. One farmer had one formerly but had not renewed.
Report farming income on IRS Schedule F. In 2014, 3 farmers reported filing Schedule F. In 2015, 7
farmers reported they planned to file Schedule F for the 2015 tax year.
Carry comprehensive liability and product insurance (group and/or individual). In 2014, 2 farm businesses
reported carrying liability and product insurance. The number remained the same for 2015.
Reduce input and marketing supply expenditures by 15% through group purchase. Viva Farms has
established regular group purchasing of both marketing supplies and field inputs such as fertilizer,
manure, and seeds. Most farmers are taking advantage of the group purchasing, and buying their
supplies from Viva Farms. This is especially true of the smaller businesses. However, the
recordkeeping from the farmers is insufficient to determine how much they have reduced their
expenditures for these items.
Collectively, farmers will sell more than $200,000 in produce. The incubator participants at Viva Farms
reached this metric in 2015. Viva Farms is getting close to exceeding this value in a single year, and
is on target to reach it in 2017.
All 25 will report increased knowledge and application of topics covered in a self-assessment. Farmers
report increasing knowledge in most areas – unless they considered themselves fully knowledgeable
already. Both Viva Farms and the farmers continue to identify new areas where they need to improve
knowledge.
80 (later amended to 50) beginning specialty crop producers attend a 30-hour Tractor and Farm safety course
and receive a passing grade. 20 participants attended tractor safety in 2015. 22 participants attended
tractor safety in 2016. Outcome 3:
The goal was to increase the number of Latino-owned certified organic farms in Skagit County. The baseline
was 2 Latino-owned certified organic farms operating in Skagit County in 2013. The target was to increase that
number to 6.
There are currently 6 Latino-owned farms at Viva Farms that have organic certification under Viva Farms
“umbrella.” This means that Viva Farms holds the certification. All of the farm businesses at Viva Farms are
farmed organically, and do all of the necessary recordkeeping, which is all part of the organic certification

41
process for Viva Farms. Two of the non-Latino owned businesses have obtained their independent organic
certification. Viva Farms expects four more farms to obtain independent organic certification in 2017, and
further expects one or two of those to be Latino-owned.
Outcome 4:
The goal and target for outcome four are related to the research project conducted by WSU graduate student
Kate Smith. Ms. Smith accessed the program impact of the incubator program at Viva Farms, including the
economic impact and effective practices. Because her research was conducted later in the project than initially
intended, she has not quite met all targets. However, her preliminary report has been distributed and the findings
are attached to this report. Ms. Smith presented her preliminary findings at the Tilth Producers Conference in
Wenatchee, WA on November 13, 2016. To meet the requirements of her graduate program, her project is still
ongoing.
BENEFICIARIES
Socially disadvantaged and beginning farmers and ranchers have benefitted from this project.
The following information is from Kate Smith’s “Viva Farms Case Study” report, beginning on page 4. The full report
is attached.
Age
Participants reported mean (average) age of 42 years old. 25.9% of participants were 35 years of age or younger while
74.1% 35 to 64 years of age, and no participants were older than 65 years of age. The average age for all primary farm
operators nationally is 58.3 years old (USDA Ag Census, 2012).
AGE VIVA FARMS
PARTICIPANTS %
(2015)
BEGINNING FARMERS
NATIONALLY 1 TO 5
YEARS ON CURRENT
FARM (2012)
Less than 35
years
25.9%
14%
35 to 64 years 74.1% 70%
65 years + 0% 16%
Gender
Participant respondents at Viva Farms were 40.7% female farmers, while the nationally women represent only 18% of
farmers (Ag Census 2012 Highlights, 2014). Generally, Incubator farms nationally support higher numbers of female
farmers than the national percentage, with an average of 48% female farmer participants reported in 2015 (National
Incubator Farm Training Initiative, 2015).
GENDER VIVA FARMS
PARTICIPANTS
(2015)
BEGINNING FARMERS
NATIONALLY 1 TO 5
YEARS ON CURRENT
FARM (2012)
INCUBATOR FARMS
NATIONALLY (2015)
Male 59.3%
82% 52%
Female 40.7% 18% 48%
Race/Ethnicity
Race/Ethnicity (n=27) Viva Farms
participants
% (2015)
Beginning Farmers
Nationally 1 to 5 years on
current farm (2012)
White 48.1% 90%
Minority 51.9% 10%
Latino 22.2%
Indigenous Latino 22.2%
Asian American 3.7%
Other 3.7%

42
Education level
Viva Farm participants have a range of educational backgrounds from less than third grade education to university
master degrees. Field programming has been shown as an effective educational strategy accessible to all, even those
with limited or low levels of education (Davis et al., 2012).
EDUCATION LEVEL (N=26) VIVA FARMS
PARTICIPANTS
Less than High School 46.2%
Some College/Associates Degree 7.7%
College Graduate 30.8%
Graduate Degree 15.4%
PhD 0%
Previous farming experience before Viva Farms
As a program open to all aspiring farmers, participants of Viva Farms have a wide variety of experiences in agriculture
previously ranging from no experience to those that have been farming all their lives. Experience ranged from no
experience to 45 years (since childhood) with an average of 10 years of experience farming. As several participants
worked as farmworkers before transitioning to farm owners, the level of field experience contributed to a high average.
EXPERIENCE FARMING (N=22) YEARS
Average 10
Median 6
Minimum 0
Maximum 45
Goals for Farming
Participants enter the program with different initial goals for agriculture. Eleven (52.4%) of participants indicated that
their goal when they started at their farm business was to eventually have farming be their primary source of income.
Eight (38.1%) of participants identified their farming goal to have it be a secondary source of income while only two
(9.5%) cited their goal for farming as quality of life. Many farmers commented that quality of life was part of their farm
goals. No participants indicated that they started the program without the goal of owning their own farm but only to get
a job in agriculture, although several participants since participating have worked in agriculture (see Table 5).
GOALS FOR FARMING N=21 PERCENT
Primary Source of Income 11 52.4
Secondary Source of Income 8 38.1
Quality of Life 2 9.5
Job in Agriculture 0 0
Work on the Farm
31% of those farming in 2015 reported Full Time Seasonal work (more than 35hrs per week per operator) while 69%
reported Part-Time work on their farm with work off the farm. Nationally, 77% of beginning farmers on current farm
for 1 to 5 years worked off the farm (Ag Census 2012 Highlights, 2014)
Data was reported by program participants and/or collected by Viva Farms staff over the period of the project.
Unfortunately, due to many personnel changes, especially during late 2013 and through January 2015 time frame, data
collection was inconsistent, and there was loss of continuity in information. For example, solid baseline data for 2013
is incomplete either because it never existed, or no one knows where it is.
However, a consistent end-of-year survey process was established in 2014 and has been carried forward since that time.
Survey questions have been adjusted as needed. For example, if the questions were not providing the information needed
or intended, or participants were reluctant to answer them, the surveys may be adjusted from year-to-year.
Kate Smith describes her evaluation methods for the Case Study on page 3 of her report as follows:
“We used qualitative and quantitative methods to conduct the impact evaluation for this research project. This evaluation
was conducted through interviews and surveys with current and past participants, participant observation as well as Viva
Farms staff interviews. We analyzed responses and data from end of season interviews with 12 current participants and
10 interviews with past Viva Farms participants. The selection of our interview participants included all current and past
participants.

43
Interview and survey questions were designed after Agriculture and Land-Based Training Association’s End of Year
Interviews and a study of University of Santa Cruz Apprenticeship in Ecological Horticulture conducted by Perez et al.
in 2010 (Martin, Bernau, Lindsy, Perez, & Landeck, n.d.)
We analyzed responses and data from 2015 End of Year Surveys conducted in November and December 2015 with 14
2015 Viva Farms Participants as well as conduct interviews with 8 previous participants and 13 follow up interviews
with current participants during spring and summer 2016. The case study also included unstructured interviews with
Viva Farms Staff members and general participant observation. Ongoing participant observation included shadowing
farmers during operations, attending professional development meetings and Monthly Viva Farmer meetings, all of
which helped develop themes for analysis. This also allowed development of trust with participants to fill out farmer
narratives. Data gathered from surveys and interviews was analyzed to create an impact analysis. Results were
additionally compared and supported with data from National Incubator Farm Training Initiative annual survey results,
USDA Agriculture Census data and Small Farm Viability research data.
Viva Farm staff contacted past Viva Farms participants via phone and email in May 2016 to share the purpose of the
study and invite to participate in the study with a scheduled interview at their farm. In June 2016, we sent follow up
emails and phone calls. Additional follow up included phone calls, messages, email invitations, and contact again from
Viva Farms and from previous leadership. The interviews consisted of a visit and a structured interview that was audio-
recorded with participant consent. We conducted structured interviews in person and over the phone when necessary.
Interviews were recorded. Interviews ranged from 20min to 60 minutes. Interviews were conducted in Spanish (9) and
English (13). I collected secondary data through survey results and Viva Farms materials. (Goldberger, 2008).”
LESSONS LEARNED
The staff at Viva Farms and WSU have not yet had the opportunity to discuss, as a group, the lessons learned from the
WSDA SCBG grant. Since this project has run for three years, there are certainly lessons learned, some that have come
up along the way and changes have been implemented. But there has not been a formal compilation of the lessons
learned. Some of the biggest lessons learned have come to light while putting this final report together. These thoughts
will be compiled and communicated to the staff, in order to develop improved processes moving forward.
No unexpected outcomes or results affected the project.
ADDITIONAL INFORMATION
Total In-kind match for Year 1: $37,492.00
Farm manager and produce manager at .25 FTE for one
year:
$17,600.00
15% administrative overhead for one year $6,392.00
use of Viva Farms land and facilities for one year $8,000.00
Tractor and equipment use for one year $2,500.00
WSU small farms team administrative overhead for one
year
$3,000.00
Total In-kind match for Year 2: $37,492.00
Farm manager and produce manager at .25 FTE for one
year:
$17,600.00
15% administrative overhead for one year $6,392.00
use of Viva Farms land and facilities for one year $8,000.00
Tractor and equipment use for one year $2,500.00
WSU small farms team administrative overhead for one
year
$3,000.00
Total In-kind match for Year 3: $37,492.00
Farm manager and produce manager at .25 FTE for one
year:
$17,600.00
15% administrative overhead for one year $6,392.00
use of Viva Farms land and facilities for one year $8,000.00
Tractor and equipment use for one year $2,500.00
WSU small farms team administrative overhead for one
year
$3,000.00
Total In-kind match over three years: $112,476.00

44

45
WSDA SPECIALTY CROP BLOCK GRANT VIVA FARMS INCUBATOR CASE STUDY Kate Selting Smith
Study Work Plan
In this project I will conduct a Case Study of Viva Farms as an incubator farm evaluating the social, economic and environmental impacts of the program. This will include a description of program operations and an in depth analysis of data collected from end of year interviews and surveys from current farmers, past participants and incubator staff.
Research Methods
We will use qualitative and quantitative methods in this research project. The selection of the study participants will include all current and past participants of Viva Farms. We will analyze responses and data from 2015 End of Year Surveys conducted in November and December 2015 with 13 current Viva Farms Participants as well as conduct interviews with 15 previous participants in May 2016. The case study will also include digital storytelling with current farm incubator participants in May 2016, interviews with Viva Farms Staff members, and general participant observation. Data gathered from surveys and interviews will be analyzed to create an impact analysis. Results will be compared and supported with data from National Incubator farm Training Initiative annual survey results, USDA Agriculture Census data and Small Farm Viability research data.
Data Collection Timeline
Phase 1- January-March Literature review of Incubator project evaluations Determine parameters of evaluation project Phase 2- April-June Data collection from 2015 End of Season Interviews Farmer Interviews- Previous Viva Farmers -Digital Storytelling interviews with current farmers -Follow up surveys with current Viva Farmers Phase 3- July-August Compile results from farmer interviews and surveys Analyze results Apply to present at regional conferences Phase 4- August- September Design info graphics to display impact results for 2015 season impact Write Impact Evaluation Initial Findings Submit Initial findings to WSDA under Specialty Crop Block Grant
Case Study Parameters
Viva Farms Training impact
• # of Viva Participants (current and past) farming in 2015/2016 (On/Off site)
• # of Viva Participants (current and past) working in Food System jobs
• Number of trainings provided per year by topic
• Number of total attendees and participants in trainings throughout 2015
• Total Farmer produce purchased and sold
• Number of markets reached
• Average years of Farming experience/average years at incubator Economic indicators: Training new farmers

46
• Farmer Profitability Value of Assets
o Sales and Expenses (Average) o Expense to Sales Ratio o Percent of operators with net gain
• Jobs created/maintained
• Worked off the farm/Primary Occupation
• Sales range categorized for part-time, full-time etc.
• # Farmers accessing grants and loans Social Indicators: Improving access to food and farming
• Contributions to Community Food Security o Quantity of food donated (Viva totals) o Quantity of food sold to food banks, daycares, schools (Viva Totals) o Contribution to family food security for participants
• Leadership roles taken in the community
• Increased access to farming o Racial and ethnic diversity of participants o Gender of participants o Age of participants
• Farmer Support Network o Membership in Farmer Organizations o Farmer Mentor
Environmental Indicators: Producing food in an ecologically sustainable manner
• Contribution to organic production o Number of Certified Organic Farms
• Implementation of sustainable production methods o Water conservation practices o Cover cropping o Soil testing and nutrient management o Utilization of practices that promote soil quality and health o Physical, cultural, and biological controls for pest and disease management o Planting of pollinator habitat o Improved nutrient cycling o Crop Rotation plan o Improved energy efficiency/green energy sources o Use of approved organic inputs o Non-use of synthetic or petrochemicals o Other environmental sustainability practices
Focus on environmental topics in training (Viva training topics)
Development of an environmental ethic- anecdotal
Self-evaluation of knowledge
Data collection Tools
End of Year Surveys with 2015 Viva Farms Incubator participants: End of Year survey interviews were conducted in December and November of 2015 with 2015 Viva Farms participants by Viva Farms staff. Surveys questions were created in collaboration with Viva Farm Staff and Kate Smith and were modeled after questions in from ALBA Farm Incubator End of Season Survey and the UCSC CASFS 2010 Alumni survey. Data will be compiled without participant names or business names and will be analyzed for economic, social and environmental impact indicators. See Appendix A for survey. Follow up interviews will be conducted with current farm participants in June 2016. Past Viva Farms participant surveys:

47
In May and June 2016 we will conduct interviews with previous Viva Farms participants in reference to the 2015 growing season. Responses and data will be recorded on paper and with participant approval, through voice recording. Data will be compiled without names and analyzed for economic, social and environmental impact indicators. See Appendix B for survey. Digital storytelling interview questions: May 9th-13th, 2016 digital storytelling interviews will be conducted with incubator participants by Kate Smith in collaboration with WSU English Department Professor and six WSU English department students. Interviews will be conducted with three primary farm participants and additional participants secondarily. Video interviews may be included in the final case study report with participant approval.
• Tell us about your farm business.
• Why do you farm at Viva/why did you start farming at Viva Farms?
• What do you like most about farming at Viva?
• Why do you farm organically?
• Has the programming at Viva Farms helpful or useful?
• Has Viva changed the amount of risk you’ve had to take in opening your business?
• Has running your own farm improved the quality of food you and your family eat at home?
• Has participating at Viva Farms changed the way you farm?
• What does your farm look like 5 years from now? Incubator Staff interview questions: Incubator staff interviews will be conducted in May and June 2016 with 2 staff members to gather supporting data for the evaluation case study.
• How many participants farmed at Viva in 2015? In 2016?
• How did land use change at Viva Farms from 2015-2016?
• How many trainings were facilitated in 2015? What were the focus topics?
• How many total attendees participated in Viva Farms trainings throughout 2015?
• What was the total dollar value of produce purchased from Viva Farmers by Viva in 2015? Sold?
• How much produce ($value) was donated in 2015?
• How much food was sold to food banks daycares, schools in 2015?
• How many clients did Viva sell to that were food banks, daycares, schools, hospitals, and other community markets that increase food access?
• How many farms used cover crops in 2015?
• Did Viva do soil tests in 2015? How were the results used?
• What are some of the environmental farming practices that Viva promotes?
• Do you have any success stories that you have observed in farmer growth?

48
Viva Farms Case Study
FARM INCUBATOR PROGRAM IMPACT EVALUATION PRELIMINARY REPORT SMITH, KATE
Prepared by Kate Smith
Masters Candidate Environmental Science Washington State University
November 2016

49
Background and Context Viva Farms is a non-profit farm incubator organization in Skagit County, Washington. The Viva Farms Incubator is located on a 33-acre piece of land leased from the Port of Skagit Property near Burlington, approximately 70 miles from Seattle and 30 miles from Bellingham. The farm incubator was founded in 2010 as a collaboration between the Viva Farms founders, Washington State University (WSU) Skagit County Extension, and the Port of Skagit. The Viva Farms mission is to launch the next generation of farmers. With the goal to reduce the barriers to entry for beginning farmers, Viva Farms provides access to the top five essentials for farming including land, infrastructure, markets, capital, and training. Infrastructure includes access to a greenhouse, barn storage space, water, cooler, wash pack station, and computer access. Viva Farms collaborates with WSU Extension and other local organizations and agencies to offer farming workshops for the public and participant farmers. The Incubator Program is open to all beginning farmers who qualify and is structured and offered bilingually in Spanish to meet the needs of the Latino population in Skagit County. Viva Farms became Certified Organic in 2014. By 2016, all farmable land was leased by farm incubator participants. Since 2010, Viva Farms has incubated 28 individual farm businesses. Since the founding, Viva Farms has helped support over 500 beginning farmers through trainings and workshops. Viva Farms operates a wholesale marketing program and a seasonal farm stand to sell participant farmers’ produce. In 2015 Viva sold 75% of the produce it purchased from Viva farmers through wholesale markets, with another 25% of sales through the farm stand. Farmers also market their own produce through local farmers markets, CSAs, and wholesale accounts. In order to participate in the Viva Farms program, participants must present a production plan and farm business plan. This can be achieved by taking the WSU Cultivating Success courses or through previous experience. Starting in 2016, Viva began facilitating the FIELD Program, a hands-on farming practicum program offered for credit through Skagit Valley College Sustainable Agriculture Education Program. Participants are required to take the practicum course to farm a ½ acre of land as a group before leasing their own farm plot. Extensive farm experience can count towards fulfilling these requirements. After completing these requirements, participants are eligible to lease between ¼ acre and 5 acres of land through Viva when available. The question of who will be the next generation of farmers has been a recent focus of national discussion and funding programs. In the United States, our current farmer population is aging with 62% over the age of 55 (USDA Agriculture Census, 2012). By 2030, it is estimated that 500,000 US farmers will retire, 25% of current American farmers (Lusher Shute, 2011). Farm Incubator programs have emerged as farmer training initiatives to support the new generation of farmers, with 119 operational programs around the United States in 2015 (National Incubator Farm Training Initiative, 2015). Farm Incubators are programs that aim to support new farmers gaining skills to launch a farm business by reducing barriers to entry including access to land, infrastructure, equipment, markets, capital and training (Massey, Sullivan, & Creamer, 2014). Although there has been much growth in beginning farmer training programs, there is little research that has focused on understanding the role they play in food systems and community development (Niewolny & Lillard, 2010). In 2013 Viva Farms collaborated with the WSU Extension Small Farms Program on a Specialty Crop Block Grant funded by the Washington State Department of Agriculture to fund a graduate project to conduct an impact evaluation of the Viva Farms Program. This case study of the Viva Farms Incubator Program aims to evaluate the social, economic and environmental impacts of the program. This evaluation was conducted through interviews and surveys with current and past participants, participant observation as well as Viva Farms staff interviews. Our descriptive case study aims to assess the extent to which the Viva Farms Incubator Program contributes to a sustainable food system through successful training and support of beginning organic farmers.

50
As farm incubators surface across the country as a method to train the next generation of farmers, it is important to evaluate the effectiveness and impact of these programs to improve future programming and to share best practices. Funders and other partners are also eager to assess the value of investing in these burgeoning numbers of farm incubator programs.
Evaluation Methods We used qualitative and quantitative methods to conduct the impact evaluation for this research project. This evaluation was conducted through interviews and surveys with current and past participants, participant observation, and Viva Farms staff interviews. We analyzed responses and data from the end-of-season interviews with 12 current participants and 10 interviews with past Viva Farms participants. The selection of our interview participants included all current and past participants. Interview and survey questions were designed after Agriculture and Land-Based Training Association’s End of Year Interviews and a study of the University of Santa Cruz Apprenticeship in Ecological Horticulture conducted by Perez et al. in 2010 (Martin, Bernau, Lindsy, Perez, & Landeck, n.d.) We analyzed responses and data from 2015 End of Year Surveys conducted in November and December with fourteen 2015 Viva Farms Participants as well as conduct interviews with eight previous participants and thirteen follow-up interviews with current participants during spring and summer 2016. The case study also included unstructured interviews with Viva Farms Staff members and general participant observation. Ongoing participant observation included shadowing farmers during operations, attending professional development meetings and Monthly Viva Farmer meetings, all of which helped develop themes for analysis. This also allowed development of trust with participants to fill out farmer narratives. Data gathered from surveys and interviews was analyzed to create an impact analysis. Results were additionally compared with national data from the USDA Agriculture Census data. Viva Farm staff contacted past Viva Farms participants via phone and email in May 2016 to share the purpose of the study and invite to participate in the study with a scheduled interview at their farm. In June 2016, we sent follow-up emails and phone calls. Additional follow-up included phone calls, messages, email invitations, and contact again from Viva Farms and from the previous leadership. The interviews consisted of a visit and a structured interview that was audio-recorded with participant consent. We conducted structured interviews in person and over the phone when necessary. Interviews ranged from 20min to 60 minutes. Interviews were conducted in Spanish (9) and English (13). Additionally, secondary data was collected through survey results and Viva Farms materials. (Goldberger, 2008)
Response Rate According to Viva Farms records, 28 farm businesses have participated in the program since 2010. The program transitioned leadership in 2014 and the new practicum program began in 2016. Viva Farms provided contact information for all 28 farm businesses. We were able to contact and conduct interviews with 22 of the 28 farm businesses, a response rate of 79%. The remaining six participant farms were unreachable through various outreach methods including phone, email, and contact with previous organizational leadership. One participant declined participation in the interview, stating that her husband was no longer involved at Viva Farms. Two past participants who were unreachable appear to be currently farming. There was no observable pattern or response bias in the reason for not participating in the evaluation. If the total is adjusted for the two phone numbers that could not receive messages, 22 of the 26 farmers who were invited to participate in the study chose to do so. This leaves an adjusted response rate of 85% which is quite high and increases the likelihood that these results are representative.
TABLE 1. REASON FOR NOT PARTICIPATING IN INTERVIEW NUMBER OF PEOPLE
Disconnected phone number 1
No answer and no message 1
No response to phone or email message 3
Declined interview 1
Participant demographics Age

51
Participants reported a mean (average) age of 42 years old. 25.9% of participants were 35 years of age or younger while 74.1% were 35 to 64 years of age, and no participants were older than 65 years of age. The average age for all primary farm operators nationally is 58.3 years old (USDA Ag Census, 2012).
TABLE 2. AGE VIVA FARMS PARTICIPANTS % (2015)
BEGINNING FARMERS NATIONALLY 1 TO 5 YEARS ON CURRENT FARM (2012 AG CENSUS)
Less than 35 years 25.9% 14%
35 to 64 years 74.1% 70%
65 years + 0% 16%
Gender Participant respondents at Viva Farms were 40.7% female farmers, while nationally women represent only 18% of farmers (Ag Census 2012 Highlights, 2014). Generally, incubator farms nationally support higher numbers of female farmers than the national percentage, with an average of 48% female farmer participants reported in 2015 (National Incubator Farm Training Initiative, 2015).
TABLE 3. GENDER VIVA FARMS PARTICIPANTS (2015)
BEGINNING FARMERS NATIONALLY 1 TO 5 YEARS ON CURRENT FARM (2012)
INCUBATOR FARMS NATIONALLY (2015)
Male 59.3% 82% 52%
Female 40.7% 18% 48%
Refugee/Immigrant While we included this demographic metric in the interviews, we decided not to include these participant ratios in the report. There are no current national statistics on refugee/immigrant farmer ratios and additionally participant responses showed that the identification of the label immigrant or refugee varied based on the participant’s own perspective of the reason for migrating to the US.
Race/Ethnicity Race/Ethnicity varied greatly from nationally demographic breakdown. While nationally minority farmers make up only 10% of the population, 51.9% of Viva farmers are minorities.
TABLE 4. Race/Ethnicity (n=27) Viva Farms participants % (2015)
Beginning Farmers Nationally 1 to 5 years on current farm (2012 Ag Census)
White 48.1% 90% Minority 51.9% 10%
Latino 22.2%
Indigenous Latino 22.2%
Asian American 3.7%
Other 3.7%
Education level Viva Farm participants have a range of educational backgrounds from less than third-grade education to university master degrees. Field programming has been shown as an effective educational strategy accessible to all, even those with limited or low levels of education (Davis et al., 2012).
TABLE 5. EDUCATION LEVEL (N=26) VIVA FARMS PARTICIPANTS
Less than High School 46.2%
Some College/Associates Degree 7.7%

52
College Graduate 30.8%
Graduate Degree 15.4%
PhD 0%
Previous farming experience before Viva Farms and Goals for Farming As a program open to all aspiring farmers, participants of Viva Farms have a wide variety of experiences in agriculture previously ranging from no experience to those that have been farming all their lives. Experience ranged from no experience to 45 years (since childhood) with an average of 10 years of experience farming. As several participants worked as farmworkers before transitioning to farm owners, therefore that level of field experience contributed to a high average.
TABLE 6. EXPERIENCE FARMING (N=22) YEARS
Average 10
Median 6
Minimum 0
Maximum 45
Participants enter the program with different initial goals for agriculture. Eleven (52.4%) of the participants indicated that their goal when they started at their farm business was to eventually have farming be their primary source of income. Eight (38.1%) of the participants identified their farming goal was to have it be a secondary source of income while only two (9.5%) cited their goal for farming as the quality of life. Many farmers commented that quality of life was part of their farm goals. No participants indicated that they started the program only to get a job in agriculture (without the goal of owning their own farm) although several participants since participating have worked in agriculture (see Table 8).
TABLE 7. GOALS FOR FARMING N=21 PERCENT
Primary Source of Income 11 52.4
Secondary Source of Income 8 38.1
Quality of Life 2 9.5
Job in Agriculture 0 0
Work on the Farm 31% of those farming in 2015 reported Full Time Seasonal work (more than 35hrs per week per operator) while 69% reported Part-Time work on their farm with work off the farm. Nationally, 77% of beginning farmers on the current farm for 1 to 5 years worked off the farm (Ag Census 2012 Highlights, 2014).

53
Program Impacts
Percent of Participants Farming A full 77% of respondents (current and past Viva Farms participants) reported farming in 2015, including three participants indicating that they farmed mostly for home consumption that year. That percent increased to 82% (eighteen) that farmed in 2016 and 90% of participants (nineteen) reported planning to farm in the future. Those that did not farm in 2015 or 2016, but indicated that they planned to farm in the future included those currently looking for land, planning to purchase land and/or developing their production plans.
Acres Farmed in 2015 and 2016 In 2015 Viva Farms participants reported farming on a total of 32.78 acres including 13.2 acres outside of Viva. The average acreage farmed was 1.56 acres with the smallest acreage at .03acres and the largest acreage at 10 acres. For the 2016 season, Viva Farms participants reported farming on a total of 47.71 acres. One participant shared the important role Viva Farms played in access to acreage:

54
The biggest thing that Viva has done is in terms of entry, to have a farm at all. Without Viva, I wouldn't have done it. I looked at leasing from a farmer but it was in horse pasture and it would have been difficult and maybe wouldn't have had water or equipment and would spend time trying to find implements.
Economic Impacts of the Program
Years to Profit Five (24%) participants responded earning a profit in the first year while two (10%) stated they were able to cover expenses and breakeven year one. Two (10%) farm businesses shared they were able to earn a profit and four (19%) were able to break even during year two. Two (10%) more participants reported earning a profit starting year three and six (29%) participants shared that it took more than three years to earn a profit.
Total Assets Participants reported an average total farm asset value of $11,581 with a median of $4,000. Participant assets include tractors, implements, tools, greenhouses, irrigation systems, storage containers, processing equipment and more. One farm shared the role Viva Farms played in their farm investments:
Being at Viva I think is the reason we could invest so much and acquire assets that are very specific to our business model and not have to acquire the basics. And I guess we will have to go back and acquire those basics once we move out on our own but it is partly what has allowed us to scale up to a certain stage that will hopefully allow us to reach financial viability sooner.
Participants accessing capital: Grants and loans

55
Since starting at Viva Farms, 32% of participants reported having applied for grant funding while 43% reported having applied for financing for their farm business. These access to capital opportunities have included USDA NRCS, USDA Value Added Producer, Community and local foundation grants. Financing has included local banks and credit unions, and the Viva Farms Matching Funds Program. Ten participants (45%) stated they had received financing or grants since participating at Viva Farms.
Farm Revenue Fifteen farmers reported farm revenue for 2015, with average total sales of $6,945.70, average expenses of $5,197.86 and an average net farm income of $2,865.75. These numbers are self-reported and may not include all sales outside of Viva Farms. The USDA average agricultural sales for beginning farmers with 1-5 years on the current farm was $106,197 with average expenses at $96,673 (Ag Census 2012 Highlights, 2014). Economically, the small scale of plots and operations does not currently compare with national averages of gross sales and income for farmers on current land 1-5 years in the USDA Agriculture Census, but we must take into account that national averages include generational farms with much larger tracts of land and infrastructure. National census average also indicates only years on the current farm and could include those that have previous farm management experience and have transitioned onto a new farm. These averages are comparable with other farm incubators. Average gross revenue per acre for Viva Farms participants farming in 2015 was $8860 and ranged from as little as $0 for a perennial crop not in production yet up to a high of $43,600 per acre.
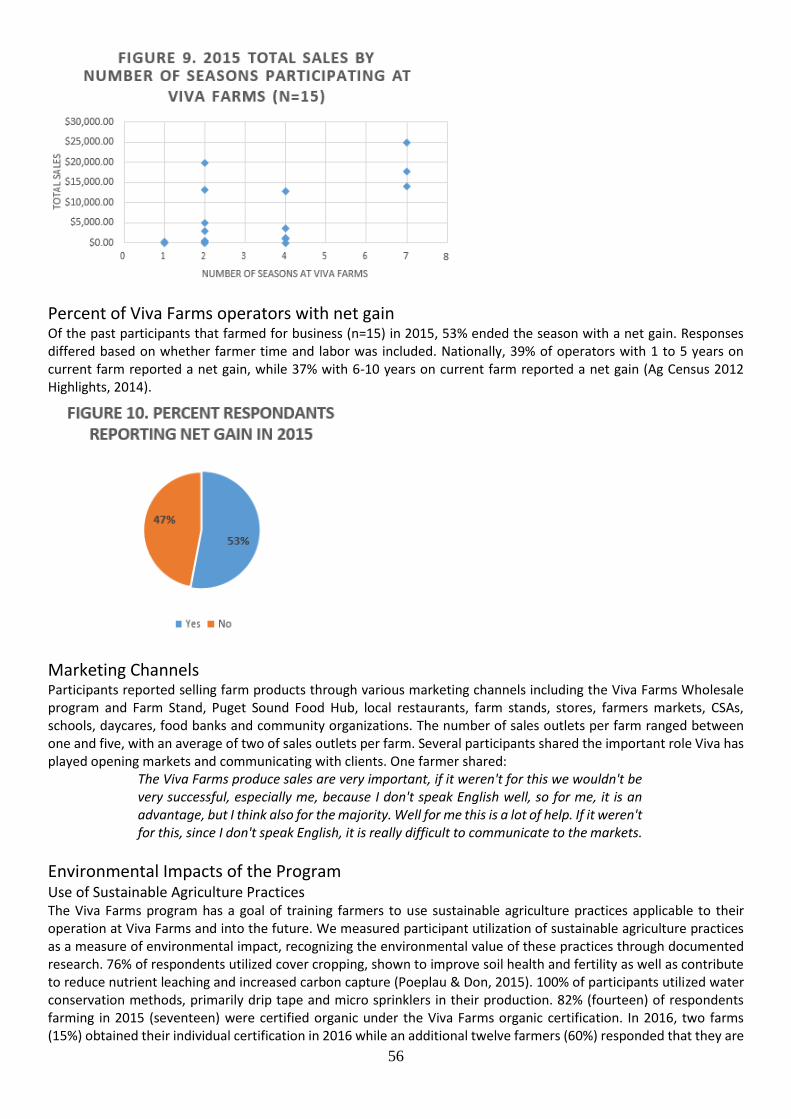
56
Percent of Viva Farms operators with net gain Of the past participants that farmed for business (n=15) in 2015, 53% ended the season with a net gain. Responses differed based on whether farmer time and labor was included. Nationally, 39% of operators with 1 to 5 years on current farm reported a net gain, while 37% with 6-10 years on current farm reported a net gain (Ag Census 2012 Highlights, 2014).
Marketing Channels Participants reported selling farm products through various marketing channels including the Viva Farms Wholesale program and Farm Stand, Puget Sound Food Hub, local restaurants, farm stands, stores, farmers markets, CSAs, schools, daycares, food banks and community organizations. The number of sales outlets per farm ranged between one and five, with an average of two of sales outlets per farm. Several participants shared the important role Viva has played opening markets and communicating with clients. One farmer shared:
The Viva Farms produce sales are very important, if it weren't for this we wouldn't be very successful, especially me, because I don't speak English well, so for me, it is an advantage, but I think also for the majority. Well for me this is a lot of help. If it weren't for this, since I don't speak English, it is really difficult to communicate to the markets.
Environmental Impacts of the Program Use of Sustainable Agriculture Practices The Viva Farms program has a goal of training farmers to use sustainable agriculture practices applicable to their operation at Viva Farms and into the future. We measured participant utilization of sustainable agriculture practices as a measure of environmental impact, recognizing the environmental value of these practices through documented research. 76% of respondents utilized cover cropping, shown to improve soil health and fertility as well as contribute to reduce nutrient leaching and increased carbon capture (Poeplau & Don, 2015). 100% of participants utilized water conservation methods, primarily drip tape and micro sprinklers in their production. 82% (fourteen) of respondents farming in 2015 (seventeen) were certified organic under the Viva Farms organic certification. In 2016, two farms (15%) obtained their individual certification in 2016 while an additional twelve farmers (60%) responded that they are

57
interested in individual organic certification in the future. Even those that did not currently have their certification stated that they practice non-use of synthetic and petrochemicals on their farms. Additionally, 76% of respondents shared that they plant pollinator habitat, contributing to crop and pollinator diversity. While not a direct measurement of the environmental impact of these farms, the high adoption rates of these agricultural practices indicate a more sustainable and lower impact farming system in reference to soil health, water conservation, pollinator habitat, synthetic residues and water contamination, and carbon sequestration.
Social Impacts of the Program Social contributions to a Sustainable Food and Agriculture System Outside of economic and environmental impacts, farm incubator programs and the participating farms have substantial social impacts. Participants shared impacts of the program for both the community and for them personally. In terms of food access, 90.5% of respondents shared that through their farm and/or work they had increased access to healthy food for those with limited access. Additionally, 60% of respondents shared that they had increased the worker safety for workers, often times including themselves and their families as previous farmworkers.

58
In 2015, 73% of respondents (n=21) reported that their family consumed produce they grew, 64% reported sharing, bartering or selling produce to friends and family and 41% sold or donated produce to food banks, schools, daycares and community organizations. In 2015 Viva Farms reported selling $9,045.40 in produce to local food banks. Although it is difficult to estimate the impact that these farmers and the Viva Farms program has on community food security, it is apparent that the fruits and vegetables produced at Viva Farms contribute to the local consumption of healthy food. Additionally, 68% of participants have worked in Sustainable Food System Field outside of running their own farm businesses and 50% of participants (eleven) volunteered in the community for a more sustainable food and agriculture system. These work and volunteer positions include work at food banks, farm stores, seed companies, service on community organizational boards, farmers market management, farm management and more. The contributions of these participants go beyond the farm and play a role in shaping a community food system that integrates sustainable agriculture and healthy food.
Skills useful in other areas of life When asked whether the skills received and built upon at Viva were useful in other areas of life outside of business, 59% participants responded “yes.” The two most common responses included improved financial and budgeting skills and community involvement and networking. Other responses included helping to get a better job, gaining new knowledge to be used in the current job, and agricultural experience. Specific responses included:
General skills in entrepreneurship, collaboration and working within a system and responding to challenges and barriers. One thing that comes to mind immediately is the immense outreach and the community of people that I was able to meet, including farmers across the state.

59
Financial skills and budgeting skills as well as managing and making lists. Those skills helped me be able to buy a house with land last year.
Beyond these social contributions, participants shared other ways the program had impacted them personally. These included the creation of community and a support network with other participants and local farmers, cross-cultural interaction, and an improved understanding of the food system. Additional observations included improvements in housing status of participants including purchase of land and houses. One farmer mentioned he was able to purchase a doublewide trailer with his first year earnings from Viva Farms. Three other farmers were able to purchase a house and land in 2016. A few additional comments from participants are listed below:
Culturally I learned more about farmworkers in the county…I realized how privileged I am and so many things that I take for granted. Part of the community aspect was that it drew in farmers from the area that were interested in what was going on. We wound up getting connected with some people that had really valuable advice to give or were able to offer services to other farmers for a reasonable rate. Connecting with the broader community. I think it has been a really good education for me as far as the logistics of food. We wouldn’t be doing what we’re doing without Viva. It’s great having neighbors to exchange ideas and create friendships.
Reasons for leaving the program Past participants were asked about reasons for leaving the program. Responses varied case by case but included reasons such as the family moved, they purchased land, they were ready to launch and lease their own farmland, they realized it was financially and physically unsustainable at their age, and they had frustrations or miscommunications with management. A common difficulty shared by several past participants was the time during the transition in organizational management, which impacted participants’ decisions to continue with the program. Another participant cited a conflict with an organizer over crop management. Another participant that has been at the incubator since the founding shared “I wouldn’t still be here if I had access to another place to transition to”. This brings to attention the need for continued support after the incubator and recognition that the incubator alone cannot solve issues of access to resources for socially disadvantaged and beginning farmers (Calo & De Master, 2016). There must be collaboration and support from the farming community and agencies to aid in the transition after participation at the incubator. This also supports the need for a Viva Farms 2, an additional plot of land for experienced incubator farmers to transition to with less support but continued access to resources.
Program Reflections Throughout the interview process, participants shared reflections on the value of the program. Some of the comments are shared below:
The program opened doors for those that want to continue experimenting. The program was very useful. Although some of the projects were difficult due to my limited English skills, Viva Farms has everything to help a person start their farm business. The program is very helpful for any farmer who wants to continue. You learn everything, I think that I'm lacking a little bit on business and pricing, but we're learning. What helps me here from Viva, there is water, the cooler, there's a lot that helps me, the cooler, the tractor, these important things, including for me who doesn't have a tractor, for just starting I think it is a lot of help for everyone, for those who are starting. Because to buy a tractor it’s, wow, a lot of money. Viva was paramount in helping me get started. It pushed me to have a farm plan and figure out what I was doing.
Recommendations

60
Participants shared various recommendations during the interviews and surveys for improving the Viva Farms program. These recommendations are from both past and current participants and may not take into account changes that staff have recently put in place.
• More technical assistance on farm and integrated support. One participant shared that it would have been helpful to have had the Practicum Program available previously, as it would have given the support needed for an introduction to farming on a scale larger than gardening.
• Increased long-term support for and communication with graduates.
• More structured activities to bridge cultural gaps and community building activities.
• Incorporation of other farming techniques outside of the commercial farming focus.
• More sessions on business planning and updating business plans in the offseason.
• Recognize and remember the work that went into creating Viva Farms and the efforts that farmers put in initially to build the opportunity. One farmer shared “We are here because of the people who extended their hearts and hands to create this. They opened the doors and markets, we built everything together. With unity there is strength.”
Conclusions
The Viva Farms program is a unique program that provides access to critical resources for beginning farmers. Viva Farms has been successful in training and supporting organic beginning farmers in Northwestern Washington, as shown by the 77% of participants who were farming in 2015 of which 82% were certified organic. The overwhelming responses showing that 90% of participants plan to continue farming in the future shows a commitment of participants to farming and the process of launching and building a farm business. Additionally, the Viva Farms Incubator has increased access to farming for minorities, those with limited levels of education, and women. The lower average farmer age also contributes to successfully meeting the mission of training the next generation of farmers. Through participant responses, it has been determined that the program contributes significantly to community food systems as well as the adoption and utilization of sustainable agriculture practices. Findings suggest that the Viva Farms program is meeting its goals and is contributing environmentally, socially, and economically to a sustainable food system. These findings can be utilized for future program improvements and also for setting realistic baselines for farm incubator outcomes nationally. The sharing of this information will help to understand the challenges and successes of beginning farmers and improve future training. Additionally, this information and future evaluations can support programs to effectively communicate impact to funders, future farmer participants, and the community.
References Ag Census 2012 Highlights. (2014). Beginning Farmers: Characteristics of Farmers by Years on Current Farm,
(Table 2), 1–4. Retrieved from http://www.nfu.org/education/beginning-farmer-institute
Calo, A., & De Master, K. T. (2016). After the incubator: Factors impeding land access along the path from farmworker to proprietor. Journal of Agriculture Food Systems, and Community Development, 6(62), 111–127. https://doi.org/10.5304/jafscd.2016.062.018
Davis, K., Nkonya, E., Kato, E., Mekonnen, D. A., Odendo, M., Miiro, R., & Nkuba, J. (2012). Impact of Farmer Field Schools on Agricultural Productivity and Poverty in East Africa. World Development, 40(2), 402–413. https://doi.org/10.1016/j.worlddev.2011.05.019
Goldberger, J. R. (2008). Diffusion and Adoption of Non-Certified Organic Agriculture: A Case Study from Semi-Arid Makueni District, Kenya. Journal of Sustainable Agriculture, 32(December), 531–564. https://doi.org/10.1080/10440040802257371
Lusher Shute, L. (2011). Building a Future With Farmers: Challenges Faced by Young American Farmers and a National Strategy to Help Them Succeed. National Young Farmers’ Coalition Report, 1–44. https://doi.org/November 2011
Martin, O., Bernau, C., Lindsy, A., Perez, J., & Landeck, J. (n.d.). UCSC Apprentice Alumni Survey.

61
Massey, J., Sullivan, J. O., & Creamer, N. (2014). Incubator Farms as Beginning Farmer Support. Journal of Extension, 52(1).
National Incubator Farm Training Initiative. (2015). Retrieved from http://nesfp.org/food- systems/national-incubator-farm-training-initiative
Niewolny, K. L., & Lillard, P. T. (2010). Expanding the boundaries of beginning farmer training and program development : A review of contemporary initiatives to cultivate a new generation of American farmers. Journal of Agriculture, Food Systems, and Community Development, 1(1), 65–88. https://doi.org/10.5304/jafscd.2010.011.010
Poeplau, C., & Don, A. (2015, February 1). Carbon sequestration in agricultural soils via cultivation of cover crops - A meta-analysis. Agriculture, Ecosystems and Environment. Elsevier.
USDA Ag Census. (2012). Farm Demographics 2012 Census Highlights (Vol. 46). https://doi.org/10.1097/00010694-193811000-00010
USDA Agriculture Census 2012 Preliminary Report. (2012). Retrieved from http://www.agcensus.usda.gov/Publications/2012/Preliminary_Report/Full_Report.pdf
CONTACT INFORMATION
Beth Meenaghan
Viva Farms
(425) 359-8046
62
Project Title: Promoting BioControl through Hands-On and Web-Based Training
Partner Organization: Washington State University (WSU)
PROJECT SUMMARY
Biological control has always been a part of tree fruit Integrated Pest Management (IPM) in Washington, but for four
decades it has operated in an organophosphate dominated environment. Over the past decade, the insecticides used to
control key pests in tree fruit production have transitioned to those safer to humans. However, an unanticipated result
has been a destabilization of biological control in IPM programs, which has resulted in secondary pest outbreaks and
additional pest control costs. Many crop consultants and orchard managers do not have an understanding of how
biological control functions and how to conserve natural enemies within the new IPM programs. There is a great need
to address the lack of knowledge of biological control and its value in tree fruit systems.
A five-year Specialty Crop Research Initiative (SCRI) funded grant, “Enhancing Biological Control in Western Orchard
Systems”, generated new information on the effects of organophosphate-alternative insecticides on biocontrol agents,
developed new monitoring tools for natural enemies revealing their presence in orchards, and is developing models to
predict when natural enemies are present in orchards. However, with the completion of that SCRI grant in 2013, its
outreach activities also ended. Because of the persistent need for continued education about biological control in
orchards the WSU Enhanced Biocontrol Outreach Team was determined to provide more outreach and education
through this project. Crop consultants and growers need a means to determine the status of biological control in their
orchards, knowledge of which organophosphate-alternative insecticides disrupt biological control and how that happens,
and how to mitigate potential secondary pest flare-ups. Knowing what natural enemies are in the orchard is a first step,
however, based on interactions during the SCRI project, many crop consultants, growers, and orchard managers do not
recognize the different life stages of common natural enemies.
This project was not built on a previously funded SCBGP project.
PROJECT APPROACH
Goal 1: Increased knowledge and adoption of conservation biological control as part of IPM.
Workshops: The WSU Enhanced Biocontrol Outreach Team conducted five biocontrol training workshops (each 4
hours long) in various locations in Washington State with a total of 67 participants (growers and consultants). To gauge
how much knowledge participants gained from the training activities, survey answers given before the workshop were
compared to results from quizzes held during the workshops. The participants already had a relatively sound knowledge
of natural enemies prior to the workshop (66% correct answers before and 72% after), partly because some had taken
this workshop during the previous year. Participants significantly increased their knowledge in other areas related to
natural enemies, such as habitat needs and insecticide effects (53% and 25% increase in correct answers, respectively).
All workshops were held in English, although there were a number of Hispanic participants who then helped one another
in Spanish to comprehend the materials.
Online course: The online course, which is based on the content of the workshops, was partially developed. It is divided
into two modules: the first module teaches about common natural enemies in orchards, their developmental stages and
characteristics, their prey or hosts, and it lets users hone their skills in identifying important natural enemies; the second
module describes monitoring tools and phenology models for natural enemies as well as effects of certain insecticides
on them. The course ends with a case study that applies many of the new principles learned. Users will be able to earn
pesticide applicator recertification credits upon passing a test. The completion of this online course has been delayed,
but additional resources are being secured to complete it. To date, the online course version of the course’s introduction
has been completed and reviewed, with only minor edits needed. The storyboard, narration and video/image materials
for the remainder of the first module are finalized as well as the storyboard and script for the second module. Narration
and image materials still need to be compiled for the second module, before the storyboards can be transformed into the
online course format.
In addition, the team has catalogued available images and documented any additional media needs. Numerous insect
specimens were collected from the field and photos and videos have been taken. This activity overlaps with the
development of a mobile ID app, where insect images and videos collected will be used.
Pesticide use analysis: USDA NASS data was gathered and analyzed for trends for the period of 2007-2011. The main
focus for the analysis was the change in insecticide use for codling moth control in tree fruit. No NASS data were
recorded in 2013, and the 2014 NASS records were not available at the time of this report.

63
The pesticide survey data show that the number of acre applications of organophosphate insecticides for codling moth
control, the major pest in apples, decreased over the years 1991-2011 with a plateau between 1999 and 2007. The
decrease in use of organophosphate insecticides was due to a reduction in the acres treated, a reduction in number of
applications and an increased use of organophosphate-alternative insecticides that replaced organophosphate
insecticides for codling moth control.
The total pounds of active ingredient of organophosphate insecticides has been steadily reduced since 1991, but declined
dramatically in 1999 and in following years due to the adoption of codling moth mating disruptions and
organophosphate-alternatives. The major change resulting from adoption of organophosphate-alternatives for codling
moth control (insect growth regulators (IGR), spinosyns, diamides, and neonicotinoids) has been the reduction in pounds
of active ingredients applied to orchards.
For 2009 and 2011, insecticide use data was compared between regions: Chelan/ Okanogan/ Douglas counties vs.
Yakima/Benton counties vs. the rest of Washington State. The survey data indicated that more applications of
organophosphates and organophosphate-alternatives (diamides, neonicotinoids, spinosyns, and insect growth
regulators) to every acre for codling moth control in the Yakima/Benton region compared to the Chelan/Okanogan/
Douglas region. More focused outreach on effective codling moth control in the Yakima and Benton counties may help
reduce the number of potentially unnecessary insecticide applications without jeopardizing fruit quality.
Goal 2: Online and mobile ID guide for main tree fruit pests and natural enemies (eng & esp).
Overlapping with the activities for the online workshop, the biocontrol outreach team has started the process of
cataloguing media needs for developing an orchard insect pest and natural enemy mobile app. Also, insect specimens
have been collected in the field to take photos that can be used in the online course as well as in the app. This objective
has not been completed due to time constraints that arose from delays in the online course.
Goal 3: Direct technology transfer of natural enemy monitoring tools to crop consultants.
Seven cooperators participated in the natural enemy monitoring study in 2014. The cooperators were supplied with
traps, lures, and other materials needed to monitor the green lacewing Chrysoperla plorabunda. Monitoring was
conducted from March through September 2014. Five of the cooperators submitted monitoring data as well as spray
records from their two orchard blocks they intended to compare. Data from four cooperators were analyzed, while one
cooperator’s information could not be used due to an incomplete data set combined with very low lacewing counts.
Three of the cooperators were video-interviewed to capture their feedback regarding the new natural enemy traps as
well as general considerations about biological control in orchards. Parts of those video interviews will be published
after editing on http://enhancedbiocontrol.org.
Lacewing numbers captured in most pairs of orchard blocks did not reveal large differences due primarily to the similar
insecticide control programs used. However, a general trend was that orchards using very “soft” pest control programs
had the most lacewings, which confirms previous research findings. The general feedback from cooperators on use of
traps was positive, similar to those from pest management consultants in 2012. The cooperators said they would embrace
new monitoring tools for natural enemies once commercially available, but would like more clarification on the
relationship between lacewing numbers in traps and the success of biological control. Additional research into these
areas is needed.
J.F. Brunner, PI: Dr. Brunner oversaw the project, reviewed project activities, timelines, budget and reports, coordinated
contacts with stakeholders, and provided conceptual guidance for objectives and goals.
A. Gadino, Co-PI: Dr. Gadino was involved in project management and activity coordination. She developed online
course content, planned and conducted workshops and outreach, coordinated crop consultant collaboration activities
and analyzed collected information from those collaborations.
U. Chambers, Co-PI: Dr. Chambers oversaw the project, reviewed and coordinated project activities and timelines. She
generated course content and coordinates course development and implementation, plans and conducts workshops and
outreach. She coordinated crop consultant collaboration activities and analyzed collected information from those
collaborations during the second project year. She also generated the project reports.
W. Jones, web & communications coordinator: Mrs. Jones provided technical expertise for the online course
development and compiled, generated and edited course materials, such as images and videos. She also assisted in
workshop activities.

64
WSU Global Campus: WSU Global Campus, who has been a key partner in this activity, is the group that develops
online courses for Washington State University and has expertise the original project team did not possess. This group
has been assisting in assembling the course content into an interactive online format for this project.
Some of the natural enemies in tree fruit orchards also occur in other cropping systems and biological control principles
are generally relevant to other cropping systems. However, the activities in this project solely address and focus on
biological control in tree fruit orchards. Most non-specialty crops could benefit from the general principles of biological
control presented in the online course but the more specific educational information would not directly apply to cropping
systems, especially non-specialty crop systems. Workshops, on-farm natural enemy monitoring trials, online course and
the natural enemy ID guide were only executed and promoted in the tree fruit industry in Washington State.
GOALS AND OUTCOMES ACHIEVED
Goal 1: Increased knowledge and adoption of conservation biological control as part of IPM.
Workshops: Biological training workshops increased the knowledge about biological control of the 67 participants. The
participants honed their skills in identifying common natural enemies in orchards and significantly increased their
knowledge in other areas related to natural enemies, such as habitat needs and pesticide effects.
Online course: The first online course version of the course introduction has been completed. About 90% of the
materials for the remaining parts of the online course are assembled for their conversion into the online course format.
USDA NASS data from apple in Washington for the reporting period of 2007-2011 were used in the analysis and within
these data only pesticides used for codling moth control were used. This analysis provides a baseline that can be
compared with future NASS data to assess the trends in pesticide use and potential change in practice spurred by this
and previous teams’ efforts to promote biological control and use of softer, more selective pesticides for codling moth
control.
Goal 3: Direct technology transfer of natural enemy monitoring tools to crop consultants.
The participating cooperators were able to become familiar with the novel way of monitoring for green lacewings in
their orchards. During the video interviews, all cooperators indicated that the new lure-baited traps were easy to use, but
require additional time to check. The cooperators also said that the information the traps captured made it easy to “see”
biological control activity in the monitored blocks. However, they did wonder how the number of lacewing caught in
traps might relate to biological control of aphids, the common prey of green lacewings. Further research is needed to
address this question.
The data collected from the cooperators were analyzed and summarized in conjunction with the spray records they
provided. Information sheets with graphs and tables showing the seasonal changes in lacewing captures in the two
different apple blocks were sent to each of the cooperators. These information sheets highlighted the pesticides that
negatively impacted lacewing numbers. Data of the other cooperators were included (anonymously) to provide
comparison to other pest management programs and resulting lacewing captures. The team has not inquired if this
information may have influenced subsequent pest management decisions in order to conserve lacewing populations.
A long-term goal of this project was to increase the knowledge and value of biological control in the tree fruit industry.
The hands-on workshops that were conducted did measurably increase the knowledge base of the participants. Similarly,
the team expects to broaden the knowledge and boost the implementation of biological control for the rest of the WA
tree fruit industry once the online course is available to the public.
Another medium to a longer-term outcome of this project was that the developed online course would provide a
foundational framework on biological control principles and training materials that could apply to online training courses
for other cropping systems and localities. This is still possible once the online course is complete. Materials that were
developed, expertise gained, and lessons learned could be applied to other cropping systems or even in urban horticulture
settings.
Established Goals Accomplished Goals
Goal 1 A: Conduct 10 workshops or have 100 people
attending (offer in Spanish if requested)
Analyze participants’ knowledge gain. Compare
knowledge before and after taking the workshops.
5 workshops held (total of 67 participants), all
workshops in English
6-53% knowledge gain, depending on subject area.
No follow-up surveys or interviews conducted.

65
Follow up with interviews/surveys to document how
participants may have altered their pest management
practices.
USDA NASS data comparison between 2007-2011 and
2013
USDA NASS data were only available for 2007-2011
and analyzed for that period; data for 2013 were not
available as expected.
Goal 1 B: Create online course (English and Spanish)
used by 50 individuals by September 2015.
Course development (in English) to approximately
90% complete (plus conversion into online format by
WSU Global Campus). Monitoring course use will
begin when the online course is completed and
implemented.
Goal 2: Develop mobile ID guide for major tree fruit
pests and natural enemies.
Goal not accomplished. However, images and videos
for this guide compiled and catalogued.
Goal 3: Recruit 20 volunteers to evaluate natural enemy
monitoring tools.
Collect trapping data and pesticide use records.
Seven volunteers committed to participate; monitoring
complete. Data and pesticide records provided by five
collaborators; three collaborators were video-
interviewed.
Workshops: With the hands-on workshops completed, about 60% (5 events with 67 participants) of the target audience
(10 workshops or 100 participants) was reached. The workshop participants increased their knowledge about certain
aspects of conservation biological control.
Online course: About 90% of the workshop materials have been prepared for conversion into an online format. This
aspect of the project was certainly the most time-consuming phase, mainly as the team members went through a learning
curve on how to best make slides come “alive” for an online and self-directed audience in a clear and intuitive, but
engaging way.
Technology transfer: Many potential cooperators were contacted, but only seven volunteers (of the targeted 20
cooperators) committed to this additional effort in their daily operations. Nonetheless, the cooperators appreciated this
hands-on learning opportunity and provided valuable feedback that will be shared with the tree fruit industry.
BENEFICIARIES
This project directly benefits the growers, crop consultants and pest managers in virtually the entire Washington state
tree fruit industry with its roughly 233,000 acres. In addition, the online course will be available to the general public
(not only in Washington state) and can be relevant to students and other groups not directly associated with the tree fruit
industry, but who are also interested in conservation biological control.
To date, 74 crop consultants and pest managers have directly benefitted from this project by participating in the
workshops or the on-farm lacewing monitoring trial. In addition, the video-interviews of collaborators from a previous
on-farm trial (same setup as in this project) have been viewed 138 times on YouTube alone (videos were also viewed
on the enhanced biocontrol website, but numbers are not available). With the rollout of the online course, the number
of beneficiaries will increase significantly. As a longer-term outcome, this project can save costs by reducing the number
of pesticide applications and protect worker health and the environment. However, no quantitative data on regarding the
number of course users and pesticide applications before and after taking the course could be collected during this
project period as the online course was not completely finished.
LESSONS LEARNED
The hands-on biocontrol workshops showed that most participants had adequate knowledge of natural enemies in
orchards, but were less aware of the different developmental stages and the natural enemies’ biology. Many workshop
participants had misconceptions about some pesticides’ negative effects on natural enemies. Overall, the workshop
participants were very eager to learn more about biological control and felt that the workshops provided practical
knowledge the participants would be able to apply to their orchard management. The workshop participants were very
interested in using natural enemy traps and models and wanted to know when those new tools would be available to
them.
Making an online course proved to be more time-consuming than initially expected. It takes a slightly different approach
and skill to visualize the end result without having prior experience of developing an asynchronous online course. Clear
communication of expectations and possibilities between the team developing the materials and Global Campus

66
converting everything into the online format was crucial and resulted in the excellent implementation of the course
introduction.
For the on-farm trials the volunteer cooperators were asked to choose pairs of apple blocks that were managed differently
and in which to monitor lacewings. However, based on the provided spray records, most orchard block pairs turned out
to use very similar management programs. Therefore the orchard pairs did not reveal large differences in lacewing
numbers. The general trend was that orchards managed with “soft” pesticides (those known to have no or a low negative
impact on natural enemies) had the most lacewings, confirming previous research findings. The general feedback was
positive and the cooperators would embrace this new monitoring tool.
The online course, in particular the parts dealing with natural enemy life stages and identification, required more effort
to gather visual media (photos, videos, images) than expected. This was especially true for the identification exercises
and self-assessment and credit tests as it was important to use different images of the same natural enemy so that users
would actually learn to identify an insect instead of just recognizing the same image use over and over. The number of
in-house media resources was often limited, low in quality or just did not exist. Searching for adequate resources,
obtaining permission to use them, and creating new media consumed more time than initially expected, contributing to
the delay of the completion of the online course.
Although interested in new natural enemy monitoring tools, many crop consultants that were contacted were unable to
commit to weekly monitoring of 10 lacewing traps in two different blocks due to their already busy schedule. This
limited the number of participating collaborators from twenty to seven, a number further reduced to five due to
incomplete sets of provided data.
ADDITIONAL INFORMATION
To date $56,381.18 of in-kind match has been utilized. This match comes from Dr. Brunner’s salary for the time he
contributed to this project. There was also in-kind contribution from WSU Extension to support WSU Global Campus
personnel, but the exact dollar value spent so far for their time was not available for this report. However, the
development of the entire course through WSU Global Campus is budgeted for $20,000.
Fig. 1. Total acres applied for organophosphates (OP) and OP-alternatives to control codling moth in Washington State.
(Acre applications = percent acres treated x average number of applications.)
Fig. 2. Total amount of organophosphate (OP) and OP-alternative pesticides applied to control codling moth in
Washington State.

67
Fig. 3. Total acre applications of organophosphates (OP) and OP-alternatives (OP alt) to control codling moth in
Washington State by region. (Acre applications = percent acres treated x average number of applications.)
Fig. 4. Examples of cooperator lacewing trapping data. Blue and red line represent total lacewing numbers in two apple
blocks that are differently managed for codling moth.
Below are screenshots from the online course introduction:

68


70
Project Title: Expanding Access to Specialty Produce in the NW through Variety Trials
Partner Organization: Organic Seed Alliance (OSA)
PROJECT SUMMARY
There is a high demand for year round availability of locally grown specialty vegetable crops in Oregon and Washington.
The two states hold similar climatic and agronomic challenges as well as highly sophisticated produce buyers that
demand superior culinary qualities. Four key crops were identified by stakeholders as prime opportunities for expanding
year round production in OR and WA - overwintering chicories, overwintering sprouting broccoli, winter cabbage, and
storage onions. This multi-state project addressed the need by, 1) evaluating and promoting the agronomic and culinary
qualities of these four priority crops, 2) developing markets for these crops by convening tasting/networking events and
providing promotional marketing materials, and 3) facilitating access to seed of appropriate varieties. Market
introduction of these crops provides farmers with increased sales during winter and early spring when income is
normally low, and chefs, retailers, and consumers with expanded access to locally grown food. This project built off
project partner’s Northern Organic Vegetable Improvement Collaborative (NOVIC) and Organic Broccoli and Onion
Trials (OBOT), two networks of breeders and farmers developing crops for the northern tier and NW region of the US.
The long-term aim of this project was to address the need for developing organic and sustainable production practices
and regionally-based domestic markets.
Washington and Oregon agriculture excels in production of high value specialty vegetable crops during the prime
growing seasons, but the produce industry remains dependent on imported crops during the winter and early spring
months. Farmers are eager to expand production of overwintering and storage crops to retain customers through the
winter, “off-season”. Chefs, produce retailers and the general public (through CSAs and farmers markets) increasingly
demand locally grown vegetables of exceptional flavor and culinary qualities throughout the entire year representing a
significant market opportunity. Overwintering chicories, overwintering purple sprouting broccoli, storage onions, and
winter cabbage are four crops identified as prime opportunities to expand winter vegetable production by farmers,
breeders and chefs in focus groups hosted at agricultural conferences and farmer’s meetings in the Northwest (NW).
Stakeholders also identified the need to identify varieties that meet both agronomic and superior culinary qualities
adding value for both farmers and chefs alike. Winter crops often hold superior flavor in the NW, as cool temperatures
tend to concentrate plant sugars offering superior culinary value. A NW produce distributor identified NW-grown
cabbage as a priority in part due to impacts on the CA cabbage industry due to a new pest (the Bagrada bug). Produce
industry experienced peak prices and gaps in availability of cabbage in 2013 due to this pest. Winter crop of purple
sprouted broccoli is ideally suited to the NW climate and growing in popularity among chefs and retailers. OR and WA
are major producers of onions, but growers have expressed a lack of access to well-adapted, good tasting storage
varieties for the region. Farmers have been frustrated by loss of availability of some hybrid onion varieties. Regional
farmers and seed companies are eager to identify open pollinated varieties of these crops that could be grown for seed
facilitating regional seed security. Chicories are in high demand by NW chefs and gaining popularity among the gourmet
food buyers. The goal of this project was to facilitate production and market expansion of the four prioritized crops by
conducting variety trials, hosting farmer-chef variety evaluation and networking meetings, and supporting market
introduction through promotion of these regionally produced crops. Farmers and produce sellers stand to benefit from
access to optimum varieties of these crops as well as the marketing support to educate and promote these crops to
consumers.
This project was the first of its kind supported by SCBGP.
PROJECT APPROACH
On-farm, replicated variety trials of purple sprouted broccoli, chicory, onion, and cabbage were conducted on organic
farms in Western WA for two production cycles from 2014-2016. The variety trials provided produce of a wide range
of varieties of each crop to use for the outreach and marketing events. Trial results supported farmers’ introduction of
appropriate varieties. All trials included both agronomic and culinary evaluations including participatory input from
farmers and chefs on appearance and flavor evaluations. Trials were planted in a randomized, replicated design with
three replications, and approximately 8-15 entries per crop in large enough plots to provide ample product for tasting,
evaluations, and marketing purposes. Each year farmers were invited to view the crops in the field during the agronomic
evaluations. A final report of results was published in the last year of the project and is being disseminated to
stakeholders. The final trial report includes information on agronomic and culinary (flavor) evaluations and discussion
of variety recommendations, production information, marketing information, and seed purchasing guidance to help
facilitate introduction of these crops. The report includes information on seed sources and organic seed availability to
facilitate access to the varieties by farmers and regional seed companies interested in incorporating them into their
production.

71
Several public events were hosted each year to engage farmers, chefs and retailers in the project. Varieties from the
trials were presented for taste evaluation and feedback at the events, but the events were also highly social with chef-
prepared dishes of the focus crops and a social atmosphere to encourage networking among participants. These events
were hosted at regional conferences and on- farm field days to facilitate broad participation. These networking events
served several purposes, 1) engaging participants in the evaluation of the crops, 2) serving as a networking opportunity
for farmers and produce buyers to meet and develop relationships to foster market introduction, and 3) to generate press
about the crops and project intent to facilitate marketing efforts.
Organic Seed Alliance (OSA) researchers McKenzie and Colley managed all project research activities including
coordinating and evaluating variety trials and authoring final trial report. Several farmers participated by hosting the
trials on-farm and collaborating in variety evaluations. Culinary evaluation methods were developed in coordination
with Selman at Oregon State University (OSU). Selman also assisted in coordinating and hosting outreach events and
engaging press and related project marketing activities. Selman hosts the annual Culinary Breeding Network in Portland,
OR and through that event developed several promotional opportunities. Grondin served as a contracted support to plan
and facilitate outreach events in WA hosted at OSA research field days and at several conferences including the Farmer
Fisher Chef Connection. WSU and OSA partner on programs in Jefferson County, WA. Through this partnership WSU
assisted in promoting and hosting farmer involvement in field evaluations and outreach events. Pacific Consumer Coop
(PCC) supported promotion of the project through an article in the PCC sound consumer publication. The Port Townsend
Food Coop supported the project by participating in several outreach events and working with local growers on
introduction of the crops to market. Organically Grown Company greatly supported the project by providing financial
support and collaboration in the development of purple sprouted broccoli, expanding trials and production of this crop
under contract with their growers, and collaborating on development of marketing materials to facilitate product
introduction into retail stores.
This project focused solely on specialty vegetable crops. All research and associated variety evaluation/ networking
events only presented specialty crops for farmers and chef’s to engage in tasting sessions. All project promotion
emphasized the target project crops and seasonal expansion of produce availability.
GOALS AND OUTCOMES ACHIEVED
7. Describe the activities that were completed in order to achieve the performance goals and Expected
Measurable Outcomes for the project.
Research activities/outcomes:
Variety trials of all four crops were successfully grown and evaluated on organic farms in WA for two production cycles
between 2014 and 2016. Data was collected on all crops and a final report of trial results was written in fall 2016. The
report is available on the OSA website and will be promoted through a press release and social media throughout fall of
2016.
Outreach activities/outcomes:
A total of 13 variety tasting events were hosted in OR and WA during the project period (6 in WA).
Tasting events were frequently hosted in conjunction with a conference or other event that would help draw the target
audience. Participants completed tasting ballots evaluating the varieties for flavor and to provide feedback on qualities.
The events were highly social to facilitate networking among participants. Facilitated discussions were led, when
appropriate, about the crop and varieties of choice. It is estimated that at least 1500 participants engaged in the tasting
events during the project period. Details of the tasting events included:
2013
2/2/13 - 2/7/13, Organicology (tasting and roundtable), Portland, OR. 850 participants (estimated at least 400 attended
tasting). Chicory and Cabbage. Cabbage prepared three ways, raw, in cole slaw, and in sauerkraut.
2014
1/30/14 - 2/2/14, 7th Organic Seed Growers Conference (tasting and sessions), Corvallis, OR. 450 participants,
(estimated at least 250 attended tasting). Chicory and Cabbage.
2/24/14, Farmer-Fisher-Chef Connection, Seattle, WA (30 participants in focused tasting session).
Cabbage.
3/14. OSA Port Townsend tasting event. 10 participants. Purple Sprouted Broccoli and chicory.
2015
2/5/15 - 2/7/15, Organicology (tasting and session), Portland, OR. 850 participants, (estimated at least 400 attended
tasting). Chicory and Cabbage.
3/25/15 – Organically Grown Company. 10 participants. Purple Sprouted Broccoli.
9/22/15, On-farm Variety Trial Workshop and tasting, Orcas Island, WA (25 participants). Onions.

72
9/28/15, Culinary Breeding Network, Variety Showcase, Portland, OR. 100 participants. Onions.
10/3/15, Orcas Island Farm Tour, Orcas Island, WA. 25 participants. Onions.
10/14/15, Organic Seed Alliance Farm Tour, Chimacum, WA. 100 participants. Cabbage, onions.
2016
2/4/16 - 2/6/16, 8th Organic Seed Growers Conference, Corvallis, OR. 450 participants (estimated at least 300
participated in tasting). Cabbage and chicory.
3/9/16, NWREC Winter Vegetable Field Day, Aurora, OR. 75 participants. Purple Sprouted Broccoli, Cabbage,
Chicory.
3/21/16, Farmer-Fisher-Chef Connection (session and tasting), Kenmore, WA. 100 participants. Purple Sprouted
Broccoli.
9/27/16, OSA research farm field day, Chimacum, WA. 75 participants. Cabbage and onions.
Marketing activities/outcomes:
The food and farming media has been very interested and engaged in project promotion with a major push on press over
the winter 2015-2016. OSA’s communications team has covered the project extensively on social media and newsletters
and engaged press in project promotion including food blogs, agricultural news outlets, radio shows, and retail news
outlets including the Capital Press and PCC Sound Consumer. A marketing flier was created in winter 2015-2016 to
promote purple sprouted broccoli and chicory. The flier was distributed at project outreach events, and distributed to
retail outlets through sales of these two crops by produce distributor, Organically Grown Company. Media interest is a
strong indication that the timing of the project was in alignment with trends in the NW food scene. Media related to the
project since the project start included:
2013
• 10/1/13, Seed Broadcast http://blog.seedalliance.org/2013/10/01/4097/
• 4/8/13, Seed Broadcast http://blog.seedalliance.org/2013/04/08/purple-is-the-new-green-winter-sprouting-
broccoli/
2014
• 3/5/14, Seed Broadcast http://blog.seedalliance.org/2014/03/05/taste-panel-tests-cabbage- varieties-and-
discusses-seed-needs-of-the-pnw/
• 12/6/14, Edible Portland http://edibleportland.com/a-better-tomato-a-better-tomorrow/
2015
• 4/3/15, OPB.fm, http://www.opb.org/news/article/npr-plant-breeders-aim-to-save-northwest- from-bland-
veggies/
• 4/3/15, Northwest News Network http://nwnewsnetwork.org/post/plant-breeders-aim-save- northwest-bland-
veggies
• 4/9/15, Seed Broadcast http://blog.seedalliance.org/2015/04/09/expanding-spring-palates- through-
participatory-breeding/
• 4/13/15, Voice of America http://www.voanews.com/content/plant-breeders-aim-to-save-diners-from-bland-
veggies/2717061.html
• 7/1/15, ATTRA Newsletter https://attra.ncat.org/newsletter/weekly_harvest_070115.htm
• 7/6/15, Seed Broadcast http://blog.seedalliance.org/2015/07/06/new-purple-sprouting-broccoli- variety-trial-
report/
• 10/16/15, Seed Broadcast http://blog.seedalliance.org/2015/10/16/osa-community-helps-evaluate-and-
celebrate-fall-harvest/
• 12/8/15, Seed Broadcast http://blog.seedalliance.org/2015/12/08/new-2015-western- Washington-variety-trial-
report/
2016
• 2/11/16, Heritage Radio Network http://heritageradionetwork.org/podcast/bridging-the-gap-from-plant-
breeders-to-eaters/
• 2/22/16, SeedQuest
https://www.seedquest.com/news.php?type=news&id_article=73802&id_region=&id_category=&id_crop=
• 3/10/16, Capital Press http://www.capitalpress.com/20160310/seed-alliance-helps-develop- better-organic-
varieties
• 3/28/16, Seed Broadcast http://blog.seedalliance.org/2016/03/28/purple-sprouting-broccoli-now- in-season/

73
• 4/1/16, PCC Sound Consumer http://www.pccnaturalmarkets.com/sc/1604/breeding-better- organic-produce-
locally.html
• 4/2/16, Good Food NW http://www.goodstuffnw.com/2016/04/new-kid-on-block-purple-sprouting.html
The long-term project goal was to expand year-round access to regionally grown vegetable crops in the NW supporting
farmers, food industry and eaters in the region. This project facilitated expansion of a select number of crops and
promoted regionally grown foods, but there are certainly many more crops that could additionally be expanded in the
future through additional research and marketing efforts. The long-term success of these four crops may also be
supported through additional research to refine production practices, address pest and disease issues, and continue to
breed for improved traits for the region. The long-term market success of storage crops (onion and cabbage) may also
depend on improved infrastructure for successful handling and holding of these crops in the winter.
The impacts of this project were assessed by conducting an online survey and through direct interviews and feedback
from project participants including the farmers who hosted trials and event attendees (farmers, chefs, retailers).
Participants were asked whether they have increased production of the four focus crops since 2012 and if so, then by
what percentage. Of the respondents 58% reported an increase in cabbage production, 42% reported in increase in
chicory production, 42% reported an increase in onion production, and 50% reported an increase in purple sprouted
broccoli production. Interestingly, the lowest percent increase was in scale of cabbage production ranging from 15 to
75% increase while chicory and purple sprouted broccoli levels were 100-900% increase. The significant growth in
production of these two crops is likely a reflection of the fact that these crops were much less common in 2012 and has
significantly expanded in the market over the last 4 years. It is also promising that on average more than half of the
growers surveyed have increased production in the four project focus crops indicating a significant increase in access to
winter produce in the PNW. One farmer reported an increase in production of Purple Sprouted Broccoli from 2 to 20
beds representing a 10-fold increase. Another farmer commented, “chicories have proven to be a wonderful crop-
extremely diverse, hardy and seasonal. (We are) trying out Purple Sprouting Broccoli for the first time this year, however
it is hard to justify the lower return per square foot of broccoli and cabbage given the high risk of clubroot and black leg
in the area, particularly overwintered.” This comment does point out that winter Brassica production in OR and WA can
pose additional disease management risks particularly with the outbreak of Black leg (Phoma lingum) in 2014. Farmer’s
feedback also included comments that there is a need for more organic cabbage and onion varieties bred for
overwintering and storage qualities.
Project partners collaborated closely with Organically Grown Company (OGC) throughout the project period on
breeding, variety trials and market introduction of purple sprouted broccoli. In 2016 OGC and OSA created a marketing
flier to support retailers introducing the crop. OGC also expanded production with three growers in OR and sold over
1341 cases of the crop for the first time representing nearly $38,000 in farm-gate value and higher for retail sales. OGC
marketing staff were thrilled with the response from retailers and the high demand for the product. OGC also reported
a 10% increase in onion sales and 15% in cabbage sales during the project period, but flat on chicory sales. The produce
buyers report a steady demand for storage onions, but a lack of sufficient supply to fill the gap.
Overall the project goals of expanding production of the four crops were achieved as indicated by grower surveys and
verbal feedback. Growth in purple sprouted broccoli and chicory sales are much higher in terms of percent growth than
cabbage and onion reflecting the fact that these crops are newer to the market offering a greater potential for increase in
production. The cabbage and onion market are much larger than the other two crops, so a modest increase potentially
represents a more significant total increase in quantity and value. Lastly the positive reception of the food and farming
press covering this topic is an indicator that this trend will continue into the future.
The original project goal was to result in increased production of winter cabbage, storage onions, overwintering sprouted
broccoli and chicories. It was projected that at least 30 farmers would adopt or expand these crops or varieties during
the project period. It was anticipated that this number would expand in the coming years as buyers (eaters) gain
awareness of the superior qualities and local availability of these crops resulting in increased demand. It was also
projected that the project would result in a 30% increase in sale of these four key winter crops by the end of the project
period compared to a baseline of sales in 2012. Based on a survey of project participants farmers reported expanding
production of all four crops more than 30%. Produce retailers however reported expanded sales of purple sprouted
broccoli and chicory by more than 100%, but much less expansion of cabbage (15%) and onion sales (10%) according
to a large distributor and less growth reported by smaller retail buyers.
BENEFICIARIES

74
The primary beneficiary of this project is specialty organic produce growers in OR and WA. It is estimated that the
project outreach activities reached at least 1500 target beneficiaries including farmers, chefs and retailers. This project
additionally benefited eaters, particularly those seeking locally grown and organic food year around. Expanding
production of these crops has the potential to expand income through critical off-season months when farmers
traditionally experience low income and high expenses as they invest in inputs for the following season. This project
also extended linkages in the food community among those who introduce new germplasm, to those who grow the crops,
to those who prepare the food with the outcome of increased regional production, marketing and knowledge of specialty
vegetable crops resulting in long term regional food production and economic security.
Sales of purple sprouted broccoli clearly made the greatest gain in economic impact based on market growth with OGC
reporting an estimated $38,000 farm gate value in their purchases alone in 2015. This crop was not part of their market
in 2012. One retailer, the Food Coop, reported an increase of 277 of PSB valued at over $1,000 retail value sourced
from a single farm. The percent growth in cabbage and onions seems to be unclear with 10-15% growth reported by one
source and flat sales from another. However these two crops represent a very large potential market where a modest
increase may have a larger financial impact.
LESSONS LEARNED
A strength of this project was engaging a large number of stakeholders in networking events in a social context which
raised awareness and even created a buzz around the core project goals of increasing access to regionally grown produce
year around and introducing new, regionally adapted crops. The social networking aspect also posed a minor challenge
in tracking the true outcomes of the project as it is difficult to say how many new sales or production contracts were a
direct result of the project versus the general trend in the local food movement. An interesting learning moment was the
importance of engaging retailers and distributors in conversations about crop traits in addition to the farmers and chefs.
Many prior variety-tasting events have focused more on the farmer-chef interaction and discussion about culinary
qualities, which is valuable. However the retailers often asked different questions such as, “How long will it be available
for? How would we present it on a market shelf? Will the buds hold up in a bulk bin?” These are different questions
that demonstrate the need for a crop to fit the full chain of stakeholders to become a mainstay in the marketplace.
One thing this project did not do is exploring what other crops might also serve the winter market need. OSA also did
not consider how these crops fit ergonomically into rotations or other potential impacts of increasing production of these
four crops, such as the disease management of overwintering brassicas. It would be interesting to follow up this project
with research that addresses the whole farm impact of winter production and explore additional crops that could expand
year round access to produce in the Pacific Northwest.
The level of interest and participation from retail produce-industry participants stimulated conversations about which
traits they prefer in the crops. This provided good feedback to the seed company and plant breeding participants and
broadened their perspective of the importance of engaging this sector in breeding for a new crop or new market niche
and facilitating market introduction of new varieties.
Tracking the contact information for all participants at the variety tasting/ networking sessions was difficult because
many of these sessions were hosted at conferences or other events where participants were attending the broader event
and chose to participate in the tasting event, but had not signed up for the tasting in advance. For this reason, it was a
challenge to follow up with each individual participant to measure project impacts. OSA did reach out to the participants
that could be tracked. Most of these contacts were from smaller events or those hosted at the OSA research farm where
registration was in greater control. The responses from these participants in the impact assessment survey correspond
well with the feedback from individual farmers, chefs and retailers that provided feedback in conversations.
This project was a two-state project combining funding and outcome objectives for the Oregon Department of
Agriculture and Washington State Department of Agriculture Specialty Crops Grants. Support from the two states was
beneficial as it did allow broader outreach to achieve impacts by working with stakeholders across both states and
developing complimentary activities prioritized by each agency’s program. Coordinating project activities and budgets
across two separate sources of funding was also a challenge at some points and good clarity and coordination of activities
and budgets is recommended.
ADDITIONAL INFORMATION
A total of $21,200 in matching funds were contributed as in-kind donations of OSA staff time and financial contributions
from Organically Grown Company as originally proposed in the project budget: $9,000 Funds for purple sprouted
broccoli variety development from Organically Grown Company ($3,000/yr). $13,200 Partial salary and fringe for
Micaela Colley, PI, to lead in development of a NW variety improvement collaborative, developing network of

75
stakeholders for project events and facilitating new production/marketing activities ($3,960). Kristina Hubbard, OSA
Communications Director to lead in project promotion and communications ($6,600). Cathleen McCluskey, OSA
outreach associate to design, layout, and publish report of project results for public outreach $2,640 total.
Additional in-kind services were provided by Organically Grown Company for support of on-farm field trials of purple
sprouted broccoli; hosting a variety tasting at the OGC headquarters, and co-developing and distributing a marketing
flier to promote the crop introduction into retail sales, valued at $5,000.
The publication of results from the on-farm trials, Vegetable Crops for Season Extension in the Pacific Northwest:
Variety trial results 2014-2016, is available on the OSA website at:
http://seedalliance.org/index.php?mact=DocumentStore,cntnt01,download_form,0&cntnt01pid=54&
cntnt01returnid=129
CONTACT INFORMATION
Micaela Colley
Organic Seed Alliance
360-385-7192

76
Project Title: Market development and production research for the Cider/Perry Industry.
Partner Organization: Northwest Cider Association (NWCA)
PROJECT SUMMARY
Washington is the largest producer of apples in the U.S. (156,000 acres) and accounted for 48% of the U.S. supply in
2011 (U.S. Department of Agriculture, 2014), and has the potential to become the leading cider apple producing state.
Cider (0.5% to 8.5% alcohol by volume) remains the fastest growing alcohol market segment in the U.S., and the volume
of cider produced in Washington State grew by over 17-fold between 2007 and 2014, from 44,387 to 759,282 gallons,
a 48% growth rate per year. This project addressed constraints to the expansion of the cider industry in Washington, i.e.,
lack of significant quantities of affordable cider apples, effective management options for apple anthracnose canker in
western Washington, and post-harvest quality of machine harvested cider apples.
The number of cideries in Washington increased from 4 in 2008 to 59 in 2015, a 15-fold increase, and accounts for 9%
of the cideries currently in the U.S. (Brown, 2014; Miles and Peck, 2014; Northwest Cider Association, 2014; U.S.
Association of Cider Makers, 2016). However, since the only use of specialized cider apple cultivars is for making cider,
growers need reliable information regarding orchard management systems and impact of harvest methods on juice and
cider characteristics before planting significant acreages.
Project K 741 (2011-2013) provided basic information to a cider industry in need of supporting research to continue its
development. The current project K 1270 expanded the range of information available to growers and cider makers,
particularly in the areas of variety selection and mechanical harvest.
PROJECT APPROACH
Varietal evaluation: During the project period the WSU team harvested, pressed, and collected juice samples from 70
cider apple varieties. Juice samples were analyzed for tannins (%), oBrix, pH, specific gravity (SG), and malic acid
(g.L-1). The cider variety orchard was maintained (pruned, weeded, and fertilized). Full bloom date and bloom
abundance were recorded in April and May. Trees were rated for productivity (except 2015) as well as recording the
actual weight of fruit at harvest for each variety. Additionally, a new replicated research orchard planted 2014-2016 was
maintained, trees surveyed for anthracnose infection, and treated with insecticide for an infestation of leafhoppers. The
new orchard planting was completed in February 2016 (planting was split into two phases due to a shortage of rootstocks
in 2013). Results were recorded and summarized in presentations at state and national meetings (Appendix:
Presentations). A listing of nurseries specializing in cider apple varieties was updated. Varietal evaluation data is
complete through 2015 and a publication has been drafted in 2016.
Machine harvesting: On September 29 2015 and 2016 a machine harvest trial was conducted using a Littau over-the-
row mechanical small fruit harvester designed for raspberry harvest. The cultivar was ‘Brown Snout’ in a closely spaced
trellis planting on strongly dwarfing rootstock. The goal was to compare the time and labor needed for hand harvest vs.
machine harvest. Juice analysis was done of fruit pressed immediately at harvest, and after storage of 2 and 4 weeks,
respectively, to determine the effects, if any, on storage of machine harvested fruit (which suffers considerable bruising
in the harvest process) compared to hand harvested fruit. The data for 2015 and 2016 were analyzed and compared, and
a journal article has been published (see Appendix). C. Miles and T. Alexander attended CiderCon 2016 in Portland,
OR February 2-5, 2016 and gave presentations on machine harvesting at the Advanced Orchard Workshop on February
3. They also attended and gave presentations at the American Society for Horticultural Science (ASHS) Annual
Conference in Atlanta, GA, August 8, 2016.
Production cost models: An enterprise budget for cider apple production in central Washington has been published as
an extension bulletin (see Appendix). The assumptions and key results of the enterprise budget for western Washington
serves as the baseline for a partial budget analysis on the costs and benefits of mechanical harvest, and this Extension
publication is in press. S. Galinato attended CiderCon 2016 in Portland, OR February 2-5, 2016 and gave a presentation
on production costs at the Advanced Orchard Workshop on February 3.
Review and compile research about anthracnose of cider apples in marine climates: Apple anthracnose canker is
caused by the fungus Neofabraea malicorticis and is the primary disease impacting apple production in western
Washington. Since anthracnose canker does not occur in eastern Washington, there is limited information regarding
management of this disease in Washington. A literature search was conducted and information regarding control and
management of this disease was compiled, and the web page http://treefruit.wsu.edu/crop-protection/disease-
management/apple- anthracnose/ was updated with this new information. The cider orchard at NWREC was managed
in accordance with this new information, and experiments have been designed to test methods to control apple

77
anthracnose cankers. W. Garton gave a presentation on management of apple anthracnose canker at the Advanced
Orchard Workshop on February 3 at CiderCon 2016 in Portland, OR February 2-5, 2016, at the American
Phytopathological Society Division meeting in LaConner, WA, on June 29, 2016, and at the American Society for
Horticultural Science (ASHS) Annual Conference in Atlanta, GA, August 8, 2016.
The WSU team is a significant partner on this project. They have collected all data outlined under the Research Project
Activity workplan and have analyzed data and published final results. Preliminary findings have been published in
reports and presented at workshops and conferences in Washington and nationally. C. Miles attended CiderCon 2014
and 2015 in Chicago, IL, and the entire cider team attended CiderCon 2016 in Portland, OR February 2-5, 2016. Miles,
Garton, and Alexander gave presentations at the CiderCon Advanced Orchard Workshop on February 3, 2016 and also
gave poster session presentations at CiderCon and at ASHS.
This project does not benefit non-specialty crops.
GOALS AND OUTCOMES ACHIEVED
2014-2015: The established cider research orchard was maintained, and a new replicated cider research orchard was
planted April 4, 2014, which included 58 varieties previously established and 6 recommended varieties not previously
evaluated. Full bloom date and bloom abundance was recorded for all varieties. Harvest of the cider variety trial was
completed by November 10, 2014; the machine harvest trial was conducted on October 16, 2014. Harvested fruit was
stored briefly and pressed within 4-7 days of harvest for each variety. Fruit samples were chopped in a shredder
(MuliMax 30, Zambelli Enotech, Camisano Vicentino, Italy) and pressed in a bladder press (40 liter Enotechnica Pillan,
Camisano Vicentino, Italy). Juice samples were collected in 500 ml plastic bottles at the time of pressing and frozen
(5oF; -15oC) until harvest of all varieties was completed. Pressing of all samples was completed by November 18, 2014.
Juice samples were thawed to 68oF (20oC) and analyzed for tannins (%), oBrix, pH, and malic acid (g.L-1). Juice
analysis was completed by December 12, 2014, and data entered and analyzed. Preliminary results were presented at
the national CiderCon (Chicago, IL), February 2015. Orchard maintenance was performed in the cider test block and in
the new orchard.
2015-2016: Harvest of the cider variety trial was completed by October 26, 2015; the machine harvest trial was
conducted on September 29, 2015. Juice was pressed by November 2, 2015 and analyzed following the same procedures
as in 2014-2015. Juice of 12 selected varieties were fermented as single varietal ciders, bottled, and stored for future
sensory evaluation. Planting of the new cider research orchard, consisting of 2 replications, 3 trees each, of 65 different
varieties, was completed with the addition of trees to fill in all replications. Regular orchard maintenance, e.g. pruning,
spraying, etc. was performed in both established and new cider research orchards. An Extension publication on the costs
and benefits of mechanical harvest is in press. S. Galinato attended CiderCon 2016 in Portland, OR February 2-5, 2016
and gave a presentation on production costs at the Advanced Orchard Workshop on February 3. A literature search was
conducted and information regarding control and management of apple anthracnose canker was compiled, and the
information was updated on the web page http://treefruit.wsu.edu/crop-protection/disease-management/apple-
anthracnose/. Results of this project were presented at CiderCON, the national meeting of cider makers, orchardists, and
researchers held in Portland, OR, February 2-5, 2016, at the Advanced Orchard Workshop (February 3) and at poster
sessions February 4-5. Approximately 200 participants at the Orchard Workshop, and 1,200 at the conference. In
addition, a production cost model was completed to present at cider workshops. Presentations on mechanical harvest
and apple anthracnose canker were given at the American Society for Horticultural Science Annual Conference. Atlanta,
GA, August 8-11, 2016.
The long-term goal of increasing the Washington market share for cider apples (target: by 2033 there will be at least 40
cider orchards in the region, encompassing 400 acres) is still to be met. According to Statista Research and Analysis, as
of September 2016 there were a total of 53 cider producers operating in Washington
(https://www.statista.com/statistics/300851/us-number-of-cider-manufacturers-by-state/). There were an estimated 204
acres of cider apples produced in Washington State in 2010 and 256 acres in 2011 (Northwest Agriculture Business
Center informal survey 2013).

78
All research data has been analyzed and two publications are complete, two are in press, and one is in preparation. The
number of cideries and acreage of cider apples have increased over the course of this project.
BENEFICIARIES
Cider apple growers and cider makers have benefited from the information resulting from this project, as well as the
support industries that serve cider production, and the staff employed at cideries and orchards.
Variety evaluation: Data collected on bloom date and bloom density help growers to select varieties that bloom together
to assure cross pollination; data collected on productivity and harvest date help to estimate the potential yield of each
specific variety, to time the harvest, and to select varieties with more reliable fruit production. Juice analysis helps
growers and cider makers to select varieties with a desired mix of juice characteristics for their cider fermentations.
Mechanical harvest: Data collected on juice quality and the time per person to harvest each plot (machine vs. hand
harvested plots), efficiency of fruit picking (ground falls, machine/hand harvest, post- machine cleanup), juice analysis
of post-harvest storage fruit, and damage to fruit and trees are all significant in the consideration of growers to adopt a
form of machine harvest for cider apples.
Production cost models: Information incorporated in the production cost models allows current and potential growers
to assess the viability and potential success of cider orchard plantings involving different variables of orchard design
and management.
LESSONS LEARNED
Project staff improved the timing of optimum fruit harvest for each cultivar in the variety trial by tracking the weekly
field observations of soluble solids and other ripeness criteria (e.g. seed color, skin color, fruit drop) and recording them
for comparison to establish full ripeness. This was critical to harvest timing in 2015 and 2016 because climate conditions
at harvest both years were not typical of previous years.
Positive results of the project include: 1.) the completion of an extension bulletin on production costs for cider apple
orchards in central Washington, 2.) a partial budget for machine harvest compared to hand harvest with Extension
publication in press, 3.) update of web page http://treefruit.wsu.edu/crop- protection/disease-management/apple-

79
anthracnose/, 4.) collection of data for the ongoing evaluation of specific cultivars for hard cider production, including
the fermentation of selected ciders and evaluation of varietal ciders, and 5.) publication of mechanical harvest paper.
Negative results were the problems, budgetary and logistical, associated with obtaining a mechanical harvester more
appropriately designed for tree fruit to test for cider apple harvest.
In the new replicated cider research orchard, anthracnose cankers were observed in the young trees that potentially
damaged their growth. Multiple anthracnose cankers were also observed in the established cider apple research orchard.
The presence of new anthracnose cankers was an ongoing serious problem and research is needed to develop effective
management options.
A new mechanical harvester to test in the research orchard was not secured. The Littau mechanical harvester belonging
to the station which had been used in previous mechanical harvest trials to complete the mechanical trials was utilized.
Adoption of mechanical harvest appears unlikely without significant additional information. Information gaps include
long term potential impacts of mechanical harvest on tree health and productivity. Additionally, lack of suitable,
available equipment, and high capital investment cost of equipment are primary factors limiting adoption, especially
when equipment has not been tested on cider apples.
ADDITIONAL INFORMATION
Publications Galinato, S., C.A. Miles and T. Alexander. 2016. Feasibility of different harvest methods for cider apples:
Case study for western Washington. Extension Bulletin TB32E, Washington State University, online only
at http://cru.cahe.wsu.edu/CEPublications/TB32/TB32.pdf (9/2016).
Alexander, T., J. King, E. Scheenstra, and C.A. Miles. 2016. Yield, fruit damage, yield loss and juice quality
characteristics of machine and hand harvested 'Brown Snout' specialty cider apple stored at ambient
conditions in northwest Washington. HortTechnology 26(5): in press.
Alexander, T., E. Scheenstra, J. King, and C.A. Miles. 2016. Abstract: Innovations in mechanical harvest For
cider apples. American Society for Horticultural Science Annual Conference. HortScience: in press.
Miles, C., T. Alexander, J. King, and E. Scheenstra. 2016. Comparison of juice quality of hand and machine
harvested cider apples. In Cider Handbook 2016-17, Scott Laboratories, Inc., Petaluma, CA 94955/Scott
Laboratories, Ltd., Pickering, Ontario L1W2A1, p. 16.
Galinato, S., T. Alexander, J. King, and C. Miles. 2016. Poster: Mechanical harvest for cider apples.
CiderCON 2016, Portland, OR, 3-5 February.
Miles, C., T. Alexander, J. King, and E. Scheenstra. 2016. Comparison of juice quality of hand and machine
harvested cider apples. In Cider Handbook 2016-17, Scott Laboratories, Inc., Petaluma, CA 94955/Scott
Laboratories, Ltd., Pickering, Ontario L1W2A1, p. 16.
Peck, G. and C. Miles. 2015. Assessing the production scale and research and extension needs of U.S. hard cider
producers. Journal of Extension. 53(5): Article 5FEA10.
Miles, C., J. King, A. Zimmerman, and E. Scheenstra. 2015. Recent Advances in Cider Research: Characteristics
of Northwest Washington Cider Apple Juice and Varietal Ciders. In Cider Handbook 2015-16, Scott
Laboratories, Inc., Petaluma, CA 94955/Scott Laboratories, Ltd., Pickering, Ontario L1W2A1, p. 16.
Tozer, P., S. Galinato, C. Ross, C. Miles, and J. McCluskey. 2015. Sensory analysis and willingness to pay for craft
cider. J. Wine Eco.
Miles, C. and J. King. 2015. Innovations in mechanical harvest for cider apples. Proceedings, New England
Vegetable and Fruit Conference, December 15-17, 2015, Manchester, NH, pp. 192-194.

80
Presentations Galinato, S., and G. Peck. 2016. The economics of growing cider apples. Advanced Cider Orchard Production
Workshop, CiderCON 2016, Portland, OR, 3 February.
Miles, C., T. Alexander, E. Scheenstra, and J. King. 2016. Innovations in mechanical harvest for cider apples.
Advanced Cider Orchard Production Workshop, CiderCON 2016, Portland, OR, 3 February.
Ross, C. 2016. Sensory analysis of craft ciders: What do consumers perceive in apple ciders? Advanced Cider Orchard
Production Workshop, CiderCON 2016, Portland, OR, 3 February.
Miles, C. and W. Garton. 2016. Managing Pests and Diseases in Cider Orchards: Special Considerations for the Pacific
Coast. Advanced Cider Orchard Production Workshop, CiderCON 2016, Portland, OR, 3 February.
Alexander, T., A. Zimmerman, E. Scheenstra, J. King, and C. Miles. 2016. Regional Cider Apple Juice
Characteristics. (Poster) CiderCON, Portland, OR, 4-5 February.
Miles, C., J. King, E. Scheenstra, and T. Alexander. 2016. Cider apple varieties and mechanical harvest.
California Small Farm Conference, Sacramento, CA, 7 March.
Miles, C., J. King, E. Scheenstra, and T. Alexander. 2016. Building a cider industry. Wisconsin Apple Growers
Association Cider Apple Field Day, Gays Mills, WI, 10 May.
Miles, C., J. King, E. Scheenstra, and T. Alexander. 2016. Cider orchard establishment, management, and
mechanization. 2016 Cider Industry Conference, Batlow, Australia, 20 May.
Miles, C., J. King, E. Scheenstra, and T. Alexander. 2016. U.S. hard cider industry and the WSU cider
characterization program. 2016 Cider Industry Conference, Batlow, Australia, 20 May.
Alexander, T. et al. 2016. Washington Regional Cider Apple Juice Characteristics. American Society for Horticultural
Science Annual Conference. Atlanta, GA. 11 August.
Alexander, T. et al. 2016. Innovations in Mechanical Harvest for Cider Apples. American Society for Horticultural
Science Annual Conference. Atlanta, GA. 09 August.
Alexander, T. et al. 2016. Mechanized harvest: an opportunity for sustainable cider apple production, Scholars
Ignite Competition. American Society for Horticultural Science Annual Conference. Atlanta, GA. 08
August.
Garton, W. et al. 2016. Apple anthracnose canker life cycle and disease cycle. American Society for Horticultural
Science Annual Conference. Atlanta, GA. 11 August.
Garton, W., M. Mazzola, and C. Miles. 2016. Apple anthracnose canker life cycle and disease cycle.
American Phytopathological Society Pacific Division Annual Meeting, LaConner, WA. 29 June. Garton, W. 2016.
Apple anthracnose canker. Snohomish Fruit Society Meeting, Snohomish, WA, 04
April.
Garton, W. 2016. Apple anthracnose canker. WSU Mount Vernon NWREC Summer Field Day, Mount Vernon, WA,
07 July.
Miles, C. 2015. Innovations in mechanical harvest for cider apples, New England Vegetable and Fruit Conference,
Manchester, NH. December 15-17.
Miles, C. 2015. Introduction to the various research projects at WSU Mount Vernon NWREC. Skagit Valley
College undergraduate tour. WSU Mount Vernon NWREC. 12 November.
Garton, W. 2015. Apple anthracnose canker in western Washington. Skagit Men’s Garden Club, WSU Mount
Vernon NWREC. 05 November.
Alexander, T. 2015. Cider apples: from branch to bottle. Snohomish County Fruit Society. Snohomish,
WA. 8 October 8.
Web Pages Garton, W., F.Dugan, M. Mazzola, and C. Miles 2016. Apple anthracnose. Web page added to WSU Tree Fruit site.
http://treefruit.wsu.edu/crop-protection/disease-management/apple-anthracnose/
Miles, C., E. Scheenstra, A. Zimmerman, T. Alexander, and J. King. 2016. Juice analysis of varietal ciders in western
Washington. Web page handout added to WSUCiderpage http://ext100.wsu.edu/maritimefruit/wp-
content/uploads/sites/36/2016/05/CiderJuiceAnalysis.pdf
Zimmerman, A., J. King, E. Scheenstra, and C. Miles. 2016. Evaluation of varietal ciders produced at WSU Mount
Vernon NWREC. Web page handout added to WSUCiderpage http://ext100.wsu.edu/maritimefruit/wp-
content/uploads/sites/36/2016/05/CiderEvaluations2016.pdf
CONTACT INFORMATION
Emily Ritchie
Northwest Cider Association
(503)-887-8960

81
Project Title: Control of Spotted Wing Drosophila and the Asian Blueberry Markets
Partner Organization: Whatcom Farm Friends
PROJECT SUMMARY
Blueberries have become Washington State’s most rapidly growing commodity. With 7,000 acres of full bearing
blueberries in production and an additional 4,000 acres of non-bearing to not yet fully bearing plantings, it is critical
that Washington State not only keeps its current market share but expands it as rapidly as possible. Washington State’s
proximity to established markets in the Pacific Rim provides an excellent opportunity to increase export sales in Asia.
Unfortunately, the recent incursion of a small insect into Washington State has severely jeopardized the ability of
farmers to market blueberries into this new market. The spotted wing drosophila (SWD), which is the first insect to
directly attack the fruit, does so just prior to harvest. At this critical time, the blueberry industry is lacking adequate
tools to deal with this new threat. Chemical treatments to fight SWD do not have adequate MRLs necessary to ship
fruit to Canada, South Korea, Japan, the EU and Taiwan while maintaining insect control.
In 2012, Washington as well as California and Oregon had fresh blueberries rejected from Pacific Rim countries due to
SWD control efforts that resulted in MRLs over the acceptable limit. As a result of these events, USDA APHIS has
told the blueberry industry that countries that did not have detections in 2012 would increase their scrutiny of blueberries
in 2013. Countries that did have detections over violative MRLs in fresh blueberries expanded surveillance to include
processed blueberries.
The goals of this project were to: 1) conduct field research to generate residue decline curves which will allow the
blueberry industry to develop more effective pesticide use patterns using currently registered products to control SWD
without violating MRLs and 2) fund field trials to generate efficacy data for new products for control of SWD. This
included separate trials for organic blueberries. Organic blueberries have an especially large challenge with SWD
control as they have a single product, spinosad (Entrust) and the over reliance on a single product threatens to result in
levels that could exceed established MRLs.
The primary goal for this project was to generate pesticide residue data so that degradation curves could be generated
that would allow growers to make informed decisions on how to meet MRL (maximum residue levels) for various
pesticides required to grow blueberries for export markets. It was estimated that two years of data was needed to
complete this project. The project was outlined in the fall of 2013 and data was generated in the 2014 and 2015 growing
seasons. Data was disseminated at the 2014 and 2015 Washington Small Fruit Conference held in Lynden each
December. A set of recommendations for the Washington blueberry industry on how to meet foreign MRLs based on
the results of this project was completed in the spring of 2016.
This project was not built on a previous SCBGP project.
PROJECT APPROACH
Field trials were set up in the three major growing regions of Washington for a three year period. These projects were
coordinated with scientists in Oregon and Michigan so that results could be compared with those states. At regular
intervals the samples were collected (seven times per location) and shipped to a pesticide analytical lab and the residues
were analyzed. Each year a summary report was prepared for the five locations. At the end of the three year period a
final report was prepared and distributed to the industry. The reports included residue decline curves for each
insecticides for each location. The final report included a summary residue decline curve that was the combination of
all of the data from all of the locations and it provided recommendations to the blueberry industry on how to apply
insecticides in a manner that would allow export to specific markets. In some cases the report recommended some
pesticides to not be used by growers if the blueberries were destined to certain markets. The insecticides used in the
trial were malathion, methomyl (Lannate) imidacloprid, spinosad (Entrust) and zeta cypermethrin (Mustang Max),
phosmet (Imidan), carbaryl, thiamethoxam (Actara) and spinetoram (Radiant). The markets that were considered
included Canada, Japan, Korea, Hong Kong, Taiwan and Australia. Although there were six countries prioritized, the
results could be applied to any country’s MRLs.
Alan Schreiber, Lynell Tanigoshi and Steve Midboe conducted field trials in Franklin, Skagit and Whatcom counties,
respectively. Samples were shipped to the Synergistic Pesticide Laboratory for analysis. These results were provided
to Dr. Schreiber and Oregon State University’s Joe DeFrancesco. Camille Holladay of Synergistic Pesticide Laboratory
and Alan Schreiber developed a final report for the industry including how to meet MRLs with the generated data.
No other commodities but blueberries will benefit from this project.

82
GOALS AND OUTCOMES ACHIEVED
The report does not include long term outcomes other than exports are expected to increase over time as a result of this
project and other factors.
On December 1st there was a report given to the Washington blueberry industry describing important issues from 2015.
Imports for 2016 will not be available until a little under a year from now. Blueberry exports appear to be increasing
but it is too soon to calculate how much has occurred since the conclusion of this trial.
As a result of this project, Washington blueberry exports now have tools that allow them to “deal” with a large number
of blueberry MRLs that formerly were trade impediments. Growers can use insecticides that they previously were not
able to use in certain export markets.
BENEFICIARIES
The beneficiaries of this project include growers raising blueberries for the export market, handlers who export
blueberries, exporters who ship the fruit and those entities that receive Washington exported blueberries.
It is too soon to quantify the economic impact of this project. Overwhelmingly, Washington exports processed
blueberries, most frozen, but also dried, concentrate and some pureed products. The 2015 crop has and is being shipped.
The 2016 crop is still in storage and a significant amount has not been processed and or packaged.
LESSONS LEARNED
WA Blueberry growers benefited through the cooperation with Oregon and Michigan. Growers are very, very
appreciative of this project and the data that were generated from it. For growers active in the export market this project
is like gaining several new insecticide registrations. One problem discovered during this project is that some MRLs for
some countries are so low that the growers cannot possibly meet them and growers need to work with the registrants of
those products and the individual companies to work with those countries to try and get those MRLs raised. This project
could only address about half of the insecticide MRL obstacles the industry faces.
Project Activity Responsible
Party
Timeline Progress Status
Contracts prepared with all
project contributors
Henry Bierlink October 2013 Contracts are signed complete
Conduct telephone interviews to
assess tonnage that sustained
rejections due to MRLs for use
as baseline information in
evaluating project
Alan Schreiber
Henry Bierlink
November
2013
Interviews
Conducted
complete
Continue tonnage information
collection
Alan Schreiber
Henry Bierlink
12/5-6/2013 Finished
phone
interviews
complete
Conduct field trials that generate
residue decline curves for the
leading 10 active ingredients in
three locations: Skagit,
Whatcom and Franklin counties
Alan Schreiber
Lynell Tanigoshi
Steve Midboe
During
growing
seasons of ’14
and ‘15
Field trials set up
First evaluation was
completed
Second evaluation
completed
2014 field work
completed, 2015
field work
completed.
Data would be disseminated at
annual meeting for growers’
benefit.
Henry Bierlink,
Alan Schreiber,
Lynell Tanigoshi
Winter 2013-
2014
First mtg on October
22, annual grower
meeting on Dec 5th
complete
Reports documenting the
accumulated data from 2 yr.
given at annual meeting
Alan Schreiber,
Lynell Tanigoshi
Winter 2014-
2015
First mtg on October
22, annual grower
meeting on Dec 5th
2014 and 2015
Reporting
complete
Final reports disseminated at
annual meeting
Bierlink,
Schreiber
Winter 2015-
2016
December Small Fruit
Conference in 2014
and 2015 featured a
report on the project.
completed
Submit reports to WSDA Bierlink,
Schreiber
Quarterly,
Annual, Final
Quarterly and Annual
reports are submitted.
Ongoing, final
report submitted

83
There weren’t any unexpected outcomes or results that affected the project.
All goals were achieved except quantifying the beneficial outcomes and not enough time has passed to quantify those
benefits.
ADDITIONAL INFORMATION
Farmers provided $32,000 in in-kind match by cooperating with Research on their farms. The WBC invested $77,000
in cash to advance the research project.
COST CATEGORY Grant Funds Invoiced to
Date Balance
Total Project
Cost
Salaries $3,210 $3,127.50 $82.50 $3,210
Benefits $481 $469.13 $11.87 $481
Contractual $96,309 $96,403.37 -$94.37 $96,309
TOTAL $100,000 $100,000 $0.00 $100,000
CONTACT INFORMATION
Henry Bierlink
Whatcom Farm Friends
(360) 354-1337

84
Project Title: Mechanizing red raspberry pruning and cane tying
Partner Organization: Washington Red Raspberry Commission (WRRC)
PROJECT SUMMARY
Cane management in red raspberry production is highly labor intensive. Labor availability is uncertain at best and labor
cost is increasing. Currently, Washington growers estimate the pruning and tying (Fig. 1) cost in red-raspberry
production to be from $600 to $800 per acre. In addition, labor is at risk for chronic and acute injury. Mechanization
has the potential to substantially reduce labor use from cane management. In this project, WRRC contracted with WSU
to develop a systematic approach for cane management through horticultural modifications and engineering solutions.
New horticultural systems for physically separating one-year and two-year old canes were investigated. These systems
were evaluated for their feasibility to allow mechanized pruning of two-year old canes while maintaining the desired
level of yield. In addition, techniques were developed to bundle one-year old canes together and tie them to the trellis
wires. WSU expects that the successful completion of the project will lead to a practical cane management system. In
the long term, commercial adoption of the system will improve economic sustainability of WA red raspberry production.
The system will also have potential to be adapted to other WA specialty crops such as black raspberry and blackberry.
This project impacts all red raspberry growers in WA who use the floricane production system - the entire industry relies
on manual labor to prune and tie canes. This combined operation represents about 35% of the total variable costs of
production (MacConnell and Kansiger, 2007). The project generated industry-applicable techniques to improve labor
productivity and reduce labor demand. The project's main emphasis was in researching and developing technologies to
mechanize or automate training and pruning operations. Success in this objective will lead to a machine that can
dramatically reduce labor demand and costs, amounting to as much as $300 to $500 per acre per year for combined
pruning and cane tying. These savings will lead to millions of dollars of economic benefit to the $30+ million dollar per
year WA red raspberry industry, which will substantially improve the competitiveness and long-term sustainability of
the industry. Farmers were expected to see the benefit from engineering solutions within four to five years of this
funding.
This project addressed the “Preserving Key Resources – Labor, [Land, or Water]” priority by developing horticultural
and mechanization technologies for reducing labor requirements for red raspberry production. Increased mechanization
will create higher skilled jobs (with higher pay) in a safer work environment. In addition, mechanization will reduce
direct involvement of humans in fruit production, which has a potential for “Improving Food Safety.”
The project was not built on a previously funded SCBGP project.
PROJECT APPROACH
Horticultural Study:
Test red raspberry plots were planted in the beginning of this project and have been maintained following commercial
practices in field operations including irrigation, nutrient application and cultivation. A red raspberry plot established
and maintained at WSU Prosser (Fig. 2) included several red-raspberry varieties, which provided a test ground for

85
various engineering and horticultural studies in eastern WA thus avoiding the need for frequently travel to western
Washington for prototype evaluation.
In collaboration with WSU weed scientist Dr. Tim Miller, yield data was collected weekly in 2015 by variety based on
different cane burning chemistries (Table 1). It was found that three varieties tested had significantly different acidity
(TA, titratable acidity) following the cane burning which was highest in the variety Wakefield (2.06% acidity).
Table 1: Cane Burning Fruit Quality by Cultivar (2015 Harvest Season). Bri is a measure of sweetness (soluble
solids), TA is titratable acidity which, along with pH measures fruit acidity, anthocyanin measure fruit color,
with higher numbers indicating darker fruit, and phenolics are an indicator of fruit antioxidants.
Cane weight was measured in June, 2016 across the three varieties (Table 2). Biomass of primocane and fruiting lateral
differed by cultivar but not by herbicide treatment, while floricane biomass did not differ by either cultivar or herbicide
treatment. These results indicate that the herbicide treatments had neither a negative nor positive effect on plant growth.
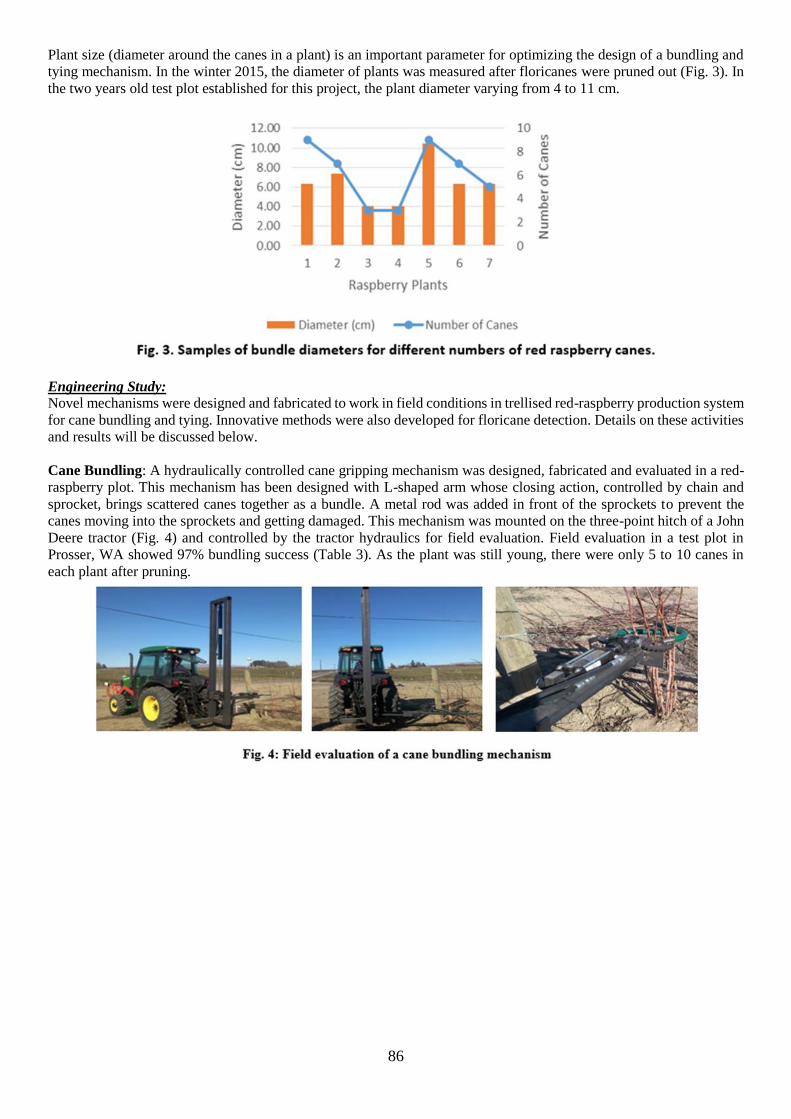
86
Plant size (diameter around the canes in a plant) is an important parameter for optimizing the design of a bundling and
tying mechanism. In the winter 2015, the diameter of plants was measured after floricanes were pruned out (Fig. 3). In
the two years old test plot established for this project, the plant diameter varying from 4 to 11 cm.
Engineering Study:
Novel mechanisms were designed and fabricated to work in field conditions in trellised red-raspberry production system
for cane bundling and tying. Innovative methods were also developed for floricane detection. Details on these activities
and results will be discussed below.
Cane Bundling: A hydraulically controlled cane gripping mechanism was designed, fabricated and evaluated in a red-
raspberry plot. This mechanism has been designed with L-shaped arm whose closing action, controlled by chain and
sprocket, brings scattered canes together as a bundle. A metal rod was added in front of the sprockets to prevent the
canes moving into the sprockets and getting damaged. This mechanism was mounted on the three-point hitch of a John
Deere tractor (Fig. 4) and controlled by the tractor hydraulics for field evaluation. Field evaluation in a test plot in
Prosser, WA showed 97% bundling success (Table 3). As the plant was still young, there were only 5 to 10 canes in
each plant after pruning.

87
Cane Tying: A circular gear-teeth end-effector was designed to wrap an adhesive tape around bundled canes (Fig. 5).
Canes enter into the wrapper through an opening in the wrapper. The circular wrapper was motorized using a stepper
motor connected on the top of one of the vertical shafts. A half-scale prototype was fabricated using a 3D printer. The
tape tying end-effector prototype was evaluated in the field along with the bundling mechanism discussed before. The
prototype accommodated cane bundles with a maximum of 7 canes. After this field test, the tying mechanism has been
improved by adding a rack and pinion-based arm, which can cut the tape as well as grab and hold the tape for next plant
to be bundled. With this mechanism, the tape wrapper goes around the bundled raspberry canes for several rounds
(currently programmed for three rounds but no. of rounds can be adjusted as needed). Once the switch is on, wrapper
will go around the bundled canes. Tape is released from the grabbing end during the first round of the wrapper. During
the final round of the wrapper, the forward movement of the motor will extend rack, letting the tape pass between the
cutting blade and the grabbing end. When the tape wrapper stops completely, the extended arm will close, cutting the
tape from the end near the plant while the other end of the tape is being pulled and held by the cutter for next round of
wrapping. The improved prototype was also fabricated using a 3D printer and was evaluated in the laboratory
environment earlier this fall (Fall 2016).
Some features of this mechanism include:
• This newly added tape cutting and grabbing mechanism is fully automated and is controlled by a single dc
motor.
• The tape wrapper design has been improved by adding supports for guiding the tape for grabbing and cutting
mechanism. Opening in the new tape wrapper has been increased to let up-to nine canes enter inside it.
• Special attention has been given to synchronize the movement of wrapping and cutting mechanisms.

88
Automated Detection of Floricanes: Automated pruning requires a sensing system for automated detection of
Floricanes (two year old canes). During pruning season, it is not always easy to distinguish Floricanes and Primocanes
(one year old canes). In this work, a hyperspectral camera was used to estimate spectral signature of different types of
canes (Fig. 6). The hyperspectral imaging system used was a line scanner Hyperspec® VNIR 1003A-10143, with a
spectral range of 350nm to 1006nm, divided into 881 channels with 0.72 nm interval between channels. Hyperspectral
images of primocanes and floricanes were obtained in laboratory environment. The spectral signature for primocanes
and floricanes showed some differences (Fig. 7), which was utilized in automatically detecting floricanes in the complex
scene of primocanes, floricanes, and background surfaces such as ground and sky. K-means classification algorithm was
used to detect floricanes using the spectral signatures, which resulted in an accuracy of 85%.
Feasibility of another approach of using color painting of canes during bundling was also explored. Food grade colors
were used to paint floricanes in June, 2015 and were evaluated qualitatively over several months. Out of different colors
painted, orange showed more promise for longevity and prominence compared to yellow, blue, or white.
Robotic Pruning: A robotic end-effector or a hand was designed and fabricated using a scissor mechanism (Fig. 8). The
end-effector was then integrated with a robotic manipulator or arm and was automatically controlled to achieve a pruning
cut in the laboratory environment.
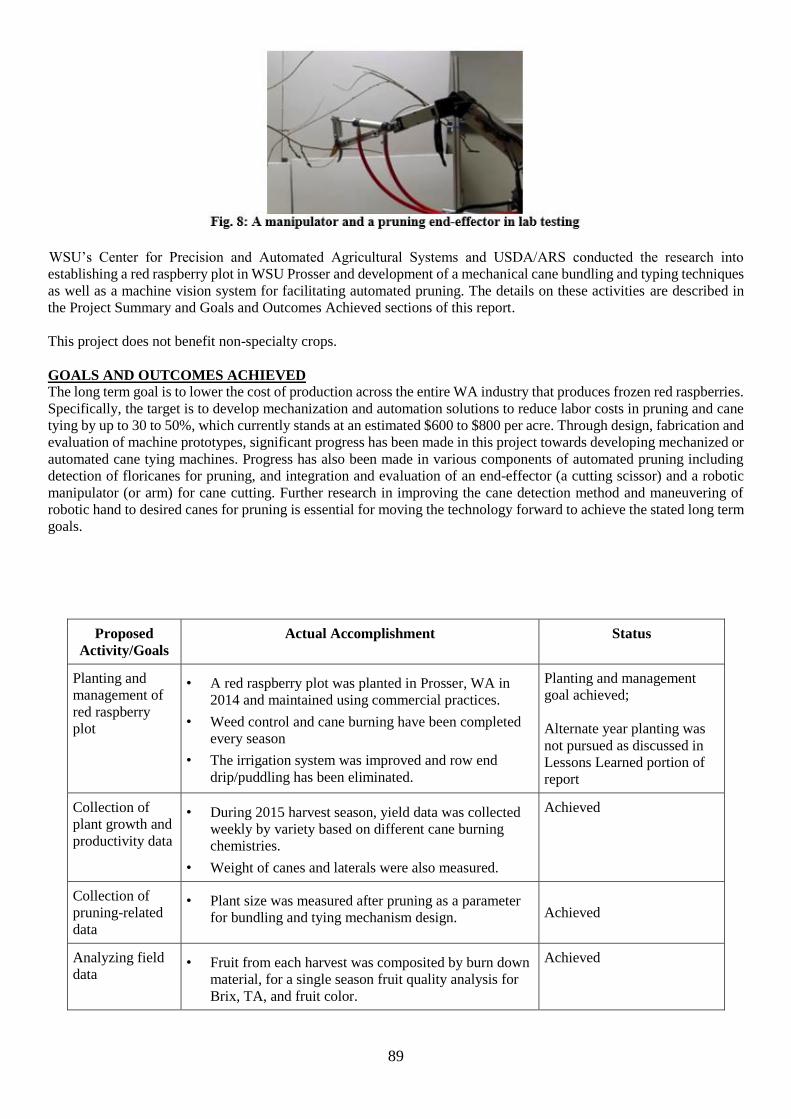
89
WSU’s Center for Precision and Automated Agricultural Systems and USDA/ARS conducted the research into
establishing a red raspberry plot in WSU Prosser and development of a mechanical cane bundling and typing techniques
as well as a machine vision system for facilitating automated pruning. The details on these activities are described in
the Project Summary and Goals and Outcomes Achieved sections of this report.
This project does not benefit non-specialty crops.
GOALS AND OUTCOMES ACHIEVED
The long term goal is to lower the cost of production across the entire WA industry that produces frozen red raspberries.
Specifically, the target is to develop mechanization and automation solutions to reduce labor costs in pruning and cane
tying by up to 30 to 50%, which currently stands at an estimated $600 to $800 per acre. Through design, fabrication and
evaluation of machine prototypes, significant progress has been made in this project towards developing mechanized or
automated cane tying machines. Progress has also been made in various components of automated pruning including
detection of floricanes for pruning, and integration and evaluation of an end-effector (a cutting scissor) and a robotic
manipulator (or arm) for cane cutting. Further research in improving the cane detection method and maneuvering of
robotic hand to desired canes for pruning is essential for moving the technology forward to achieve the stated long term
goals.
Proposed
Activity/Goals
Actual Accomplishment Status
Planting and
management of
red raspberry
plot
• A red raspberry plot was planted in Prosser, WA in
2014 and maintained using commercial practices.
• Weed control and cane burning have been completed
every season
• The irrigation system was improved and row end
drip/puddling has been eliminated.
Planting and management
goal achieved;
Alternate year planting was
not pursued as discussed in
Lessons Learned portion of
report
Collection of
plant growth and
productivity data
• During 2015 harvest season, yield data was collected
weekly by variety based on different cane burning
chemistries.
• Weight of canes and laterals were also measured.
Achieved
Collection of
pruning-related
data
• Plant size was measured after pruning as a parameter
for bundling and tying mechanism design.
Achieved
Analyzing field
data • Fruit from each harvest was composited by burn down
material, for a single season fruit quality analysis for
Brix, TA, and fruit color.
Achieved

90
Design cane
bundling and
tying machine
• Several alternative designs for cane bundling were
conceptualized.
• Three conceptual designs were created for tying
mechanism.
• 3D computer models of tying mechanisms were
developed.
• A few raspberry fields were visited in Lynden, WA in
2013 and 2015 to learn more about floricane growth,
which helped optimize the designs.
Achieved
Develop and
evaluate
bundling and
tying mechanism
• Two to three versions of bundling and tape tying
prototypes were fabricated.
• Prototypes were first evaluated in the lab, improved,
and further evaluated in the field in 2016.
• Based on the experience and knowledge from the field
work, both bundling and tying mechanisms were
further improved.
Achieved
Develop sensing
system for
floricane
identification
• Hyperspectral camera images were used to distinguish
floricanes and primocanes.
• Floricanes were painted with food grade and water-
based colors to investigate the potential of using color-
camera for automated floricane identification.
• Orange color showed more promise than other colors.
Goal achieved;
The team also hypothesized
that further improvement in
detection accuracy may be
achieved using a
spectroradiometer with wider
spectrum than the currently
used hyperspectral camera.
Develop and
evaluate pruning
mechanism
• Pruning machine conceptual design was explored.
• A scissor type end-effector was integrated with a
robotic arm and evaluated in the lab.
Lab evaluation was
completed;
Because of additional focus
in detecting floricanes with
different methods and also
change in the horticultural
studies, field evaluation of
pruning mechanism was not
pursued.
Outreach
activities • Update to Small Fruit Conference in December 2013
and 2014.
• A presentation was also given in WA Red Raspberry
Commission Meeting in October, 2014.
• Team participated in the Raspberry Research
Roundtable held on Oct 8, 2014, November 4, 2015
and October 12, 2016.
• Team members also presented their work in expos and
meetings including Washington Hort Show (Yakima,
2015), precision farming expo (Kennewick, 2016) and
WSU CPAAS open house (Prosser, 2015).
Achieved
As discussed before, novel engineering solutions for red-raspberry cane bundling, tying and floricane identification was
developed and evaluated. As there have been limited effort in the past towards solving this important problem for red-
raspberry industry, this outcome leads the industry much closer to meeting the long term target of reducing labor use in
red raspberry pruning and tying by 30 to 50%.
BENEFICIARIES
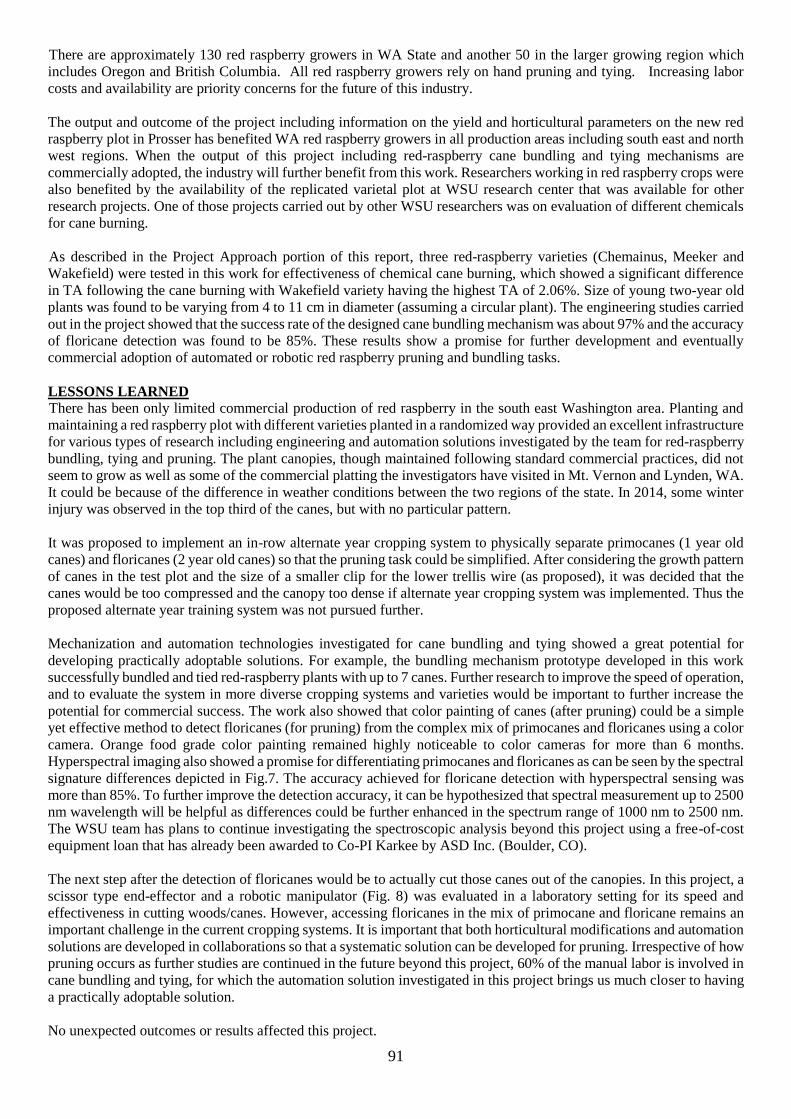
91
There are approximately 130 red raspberry growers in WA State and another 50 in the larger growing region which
includes Oregon and British Columbia. All red raspberry growers rely on hand pruning and tying. Increasing labor
costs and availability are priority concerns for the future of this industry.
The output and outcome of the project including information on the yield and horticultural parameters on the new red
raspberry plot in Prosser has benefited WA red raspberry growers in all production areas including south east and north
west regions. When the output of this project including red-raspberry cane bundling and tying mechanisms are
commercially adopted, the industry will further benefit from this work. Researchers working in red raspberry crops were
also benefited by the availability of the replicated varietal plot at WSU research center that was available for other
research projects. One of those projects carried out by other WSU researchers was on evaluation of different chemicals
for cane burning.
As described in the Project Approach portion of this report, three red-raspberry varieties (Chemainus, Meeker and
Wakefield) were tested in this work for effectiveness of chemical cane burning, which showed a significant difference
in TA following the cane burning with Wakefield variety having the highest TA of 2.06%. Size of young two-year old
plants was found to be varying from 4 to 11 cm in diameter (assuming a circular plant). The engineering studies carried
out in the project showed that the success rate of the designed cane bundling mechanism was about 97% and the accuracy
of floricane detection was found to be 85%. These results show a promise for further development and eventually
commercial adoption of automated or robotic red raspberry pruning and bundling tasks.
LESSONS LEARNED
There has been only limited commercial production of red raspberry in the south east Washington area. Planting and
maintaining a red raspberry plot with different varieties planted in a randomized way provided an excellent infrastructure
for various types of research including engineering and automation solutions investigated by the team for red-raspberry
bundling, tying and pruning. The plant canopies, though maintained following standard commercial practices, did not
seem to grow as well as some of the commercial platting the investigators have visited in Mt. Vernon and Lynden, WA.
It could be because of the difference in weather conditions between the two regions of the state. In 2014, some winter
injury was observed in the top third of the canes, but with no particular pattern.
It was proposed to implement an in-row alternate year cropping system to physically separate primocanes (1 year old
canes) and floricanes (2 year old canes) so that the pruning task could be simplified. After considering the growth pattern
of canes in the test plot and the size of a smaller clip for the lower trellis wire (as proposed), it was decided that the
canes would be too compressed and the canopy too dense if alternate year cropping system was implemented. Thus the
proposed alternate year training system was not pursued further.
Mechanization and automation technologies investigated for cane bundling and tying showed a great potential for
developing practically adoptable solutions. For example, the bundling mechanism prototype developed in this work
successfully bundled and tied red-raspberry plants with up to 7 canes. Further research to improve the speed of operation,
and to evaluate the system in more diverse cropping systems and varieties would be important to further increase the
potential for commercial success. The work also showed that color painting of canes (after pruning) could be a simple
yet effective method to detect floricanes (for pruning) from the complex mix of primocanes and floricanes using a color
camera. Orange food grade color painting remained highly noticeable to color cameras for more than 6 months.
Hyperspectral imaging also showed a promise for differentiating primocanes and floricanes as can be seen by the spectral
signature differences depicted in Fig.7. The accuracy achieved for floricane detection with hyperspectral sensing was
more than 85%. To further improve the detection accuracy, it can be hypothesized that spectral measurement up to 2500
nm wavelength will be helpful as differences could be further enhanced in the spectrum range of 1000 nm to 2500 nm.
The WSU team has plans to continue investigating the spectroscopic analysis beyond this project using a free-of-cost
equipment loan that has already been awarded to Co-PI Karkee by ASD Inc. (Boulder, CO).
The next step after the detection of floricanes would be to actually cut those canes out of the canopies. In this project, a
scissor type end-effector and a robotic manipulator (Fig. 8) was evaluated in a laboratory setting for its speed and
effectiveness in cutting woods/canes. However, accessing floricanes in the mix of primocane and floricane remains an
important challenge in the current cropping systems. It is important that both horticultural modifications and automation
solutions are developed in collaborations so that a systematic solution can be developed for pruning. Irrespective of how
pruning occurs as further studies are continued in the future beyond this project, 60% of the manual labor is involved in
cane bundling and tying, for which the automation solution investigated in this project brings us much closer to having
a practically adoptable solution.
No unexpected outcomes or results affected this project.

92
As discussed in above, in-row alternate year cropping system is a challenging horticultural problem and may require an
innovative solution. A simpler solution to the proposed in-row alternative year cropping would be spatially separating
crop for alternate years, such as alternate rows or even alternate plots used for alternate year cropping. Total yield and
economic analysis of such a system are being evaluated by other scientists and one of the grower collaborators (Maberry
Packing). It was also discussed above that use of a spectrometer that can provide spectral signature from 400 nm to 2500
nm could help improve the accuracy of floricane detection.
ADDITIONAL INFORMATION
All funds were contracted with Washington State University. WRRC contributed an additional $30,000 to the contract.
WSU used the funds to partially or fully support salaries of one post-doc and two graduate students. WSU also used the
funds to establish and maintain a red raspberry plot at WSU Prosser. Some part of the funds were also used to purchase
materials and supplies to build and evaluate prototypes in red-raspberry fields. WRRC administration of the project was
valued at $7,500 in in-kind match, two farms where the research took place contributed $102,000 in in-kind services
supporting the project, and WSU added $72,675 in in-kind support.
Publications and Posters:
Shrestha, A., Karkee, M. and Zhang, Q., 2016. Mechanism for Bundling and Tying of Red Raspberry Primocanes. IFAC-
PapersOnLine, 49(16), pp.166-170.
Shrestha, A., M. Karkee and Q. Zhang, 2015 (Poster). Automation of Red Raspberry Bundling and Pruning. 2016
Precision Farming Expo, 6-7 January, 2016; Kennewick, WA.
Shrestha, A., M. Karkee and Q. Zhang, 2015 (Poster). Efforts Toward Automation of Red Raspberry Bundling and
Pruning. 2015 Washington State Tree Fruit Association Annual Meeting, 7-9 December, 2015; Yakima, WA.
Additional Pictures:
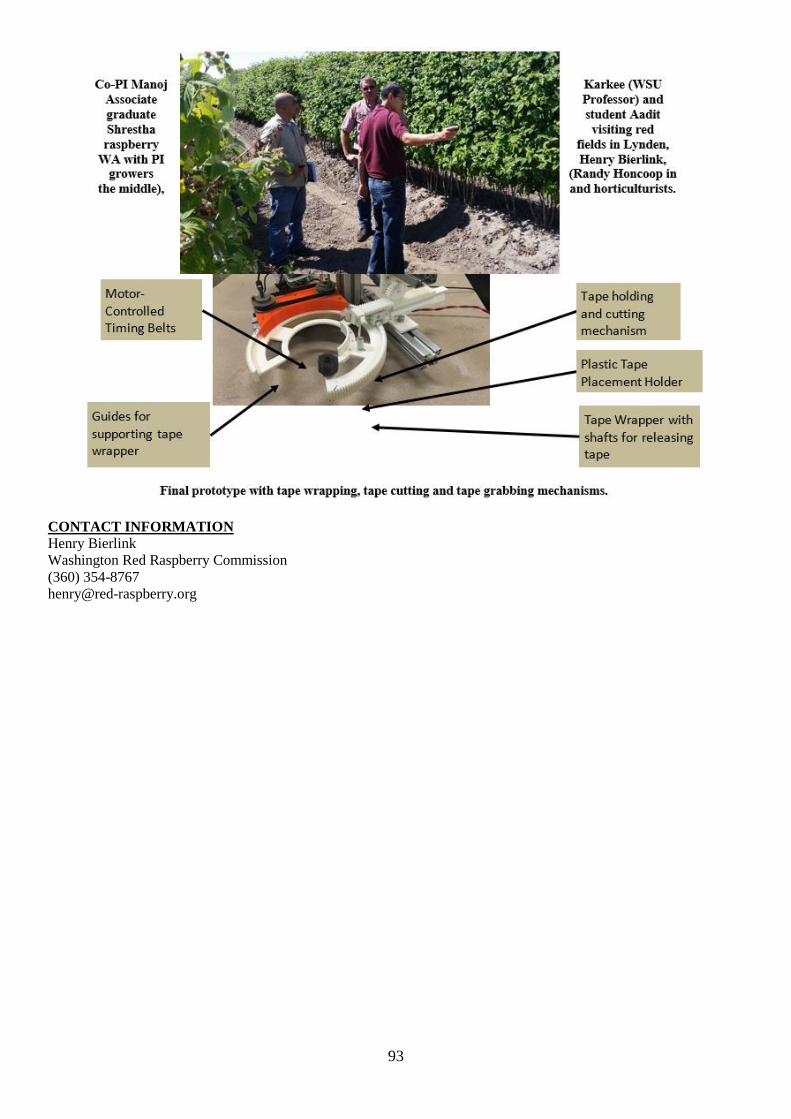
93
CONTACT INFORMATION
Henry Bierlink
Washington Red Raspberry Commission
(360) 354-8767