wwe q2 2017 results july 27, 2017/media/files/w/wwe/... · excluding feature film and television...
TRANSCRIPT

W W E Q 2 2 0 1 7 R E S U LT S – J U LY 2 7 , 2 0 1 7
This presentation contains forward-looking statements pursuant to the safe harbor provisions of the Securities Litigation Reform Act of 1995, which are subject to
various risks and uncertainties. These risks and uncertainties include, without limitation, risks relating to: WWE Network (including the risk that we are unable to
attract, retain and renew subscribers); major distribution agreements; our need to continue to develop creative and entertaining programs and events; the
possibility of a decline in the popularity of our brand of sports entertainment; the continued importance of key performers and the services of Vincent K. McMahon;
possible adverse changes in the regulatory atmosphere and related private sector initiatives; the highly competitive, rapidly changing and increasingly fragmented
nature of the markets in which we operate and greater financial resources or marketplace presence of many of our competitors; uncertainties associated with
international markets; our difficulty or inability to promote and conduct our live events and/or other businesses if we do not comply with applicable regulations; our
dependence on our intellectual property rights, our need to protect those rights, and the risks of our infringement of others’ intellectual property rights; the
complexity of our rights agreements across distribution mechanisms and geographical areas; potential substantial liability in the event of accidents or injuries
occurring during our physically demanding events including, without limitation, claims relating to CTE; large public events as well as travel to and from such events;
our feature film business; our expansion into new or complementary businesses and/or strategic investments; our computer systems and online operations; privacy
norms and regulations; a possible decline in general economic conditions and disruption in financial markets; our accounts receivable; our indebtedness; litigation;
our potential failure to meet market expectations for our financial performance, which could adversely affect our stock; Vincent K. McMahon exercises control over
our affairs, and his interests may conflict with the holders of our Class A common stock; a substantial number of shares are eligible for sale by the McMahons and
the sale, or the perception of possible sales, of those shares could lower our stock price; and the relatively small public “float” of our Class A common stock. In
addition, our dividend is dependent on a number of factors, including, among other things, our liquidity and historical and projected cash flow, strategic plan
(including alternative uses of capital), our financial results and condition, contractual and legal restrictions on the payment of dividends (including under our
revolving credit facility), general economic and competitive conditions and such other factors as our Board of Directors may consider relevant. Forward-looking
statements made by the Company speak only as of the date made and are subject to change without any obligation on the part of the Company to update or revise
them. Undue reliance should not be placed on these statements. For more information about risks and uncertainties associated with the Company’s business,
please refer to the “Management’s Discussion and Analysis of Financial Condition and Results of Operations” and “Risk Factors” sections of the Company’s SEC
filings, including, but not limited to, our annual report on Form 10-K and quarterly reports on Form 10-Q.
This presentation contains non-GAAP financial information, including OIBDA. We define OIBDA as operating income before depreciation and amortization,
excluding feature film and television production amortization and related impairments. OIBDA is a non-GAAP financial measure and may be different than similarly-
titled non-GAAP financial measures used by other companies. A limitation of OIBDA is that it excludes depreciation and amortization, which represents the periodic
charge for certain fixed assets and intangible assets used in generating revenues for the Company's business. OIBDA should not be regarded as an alternative to
operating income or net income as an indicator of operating performance, or to the statement of cash flows as a measure of liquidity, nor should it be considered in
isolation or as a substitute for financial measures prepared in accordance with GAAP. We believe that operating income is the most directly comparable GAAP
financial measure to OIBDA. Reconciliations of OIBDA to operating income can be found in the Company’s earnings release dated July 27, 2017.
Forward-Looking Statements
2

2017 Q2: Highlights
▪ Revenue increased 8% to a record $214.6 million
▪ Live event revenue achieved quarterly record of $53 million; to-date, global attendance increasedmore than 100,000 (with 28 additional events)
▪ Network segment also reached record revenue as WWE Network’s average paid subscribersincreased 8% to more than 1.63 million over the second quarter 2017
▪ Launched localized weekly TV shows for India and Middle East
▪ Completed multi-year agreement to televise Raw and SmackDown on SuperSport, Africa’s premieresports broadcaster
▪ Mae Young Classic women’s tournament to premiere on WWE Network in August, with a live finalethat will be shown on the network in September
▪ Through the first six months of the year, digital engagement metrics continued to grow with videoviews up 18% to 9.1 billion and social media followers increased 19% to 800 million
▪ Global sponsorship revenue increased 25% year-to-date, driven by new deals with blue-chipcompanies (KFC, Nestle & AT&T) and gaming partners (Psyonix, Square Enix & Activision)
▪ Selected Lagardère Sports, a best-in-class sports marketing agency, to further develop theCompany’s global sponsorship business
▪ Announced return to China with first event ever in Shenzhen on September 17
3

▪ Adjusted OIBDA of $18.1 million was essentially in line with guidance of $13 to $17 million2
▪ Revenue and earnings growth reflect increased monetization of content across pay-television, direct-to-consumer (WWE Network) as well as digital and social platforms
▪ Continue to target record financial results for 2017, specifically Adjusted OIBDA1 of $100 million
Q2 2017: WWE Financial Highlights($ in millions)
4
$199.0$214.6
+8%
Q2 2017Q2 2016 Q2 2016
$10.7
$1.5
NM
Q2 2017 Q2 2017Q2 2016
$18.1+141%
$7.5
Revenue Operating Income Adjusted OIBDA1
1 A definition of Adjusted OIBDA and a reconciliation to Operating Income can be found in the Company’s Q2 2017 earnings materials and in the appendix to this presentation2 Q2 Adjusted OIBDA guidance as presented in the Company’s Q1 2017 earnings release, May 4, 2017

2017 Q2: Financial Highlights ($ in millions)
132.2
51.952.8
117.5
24.625.2
+8%
1.2
214.6
3.51.5199.0
3.2
MediaLive EventsConsumer ProductsWWE StudiosCorporate & Other
Revenue Adjusted OIBDA1
5
34.3
21.6
(51.4) (53.6)
19.9
23.4
9.2
NM10.7
9.1
(0.7)
1.5
0.4
(48.2) (50.2)
22.737.2
23.4
21.6
7.5 0.4
9.20.4
18.1+141%
9.1
Operating Income
1 A definition of Adjusted OIBDA and a reconciliation to Operating Income can be found in the Company’s Q2 2017 earnings materials and in the appendix to this presentation
Q2 2016 Q2 2016Q2 2016Q2 2017 Q2 2017 Q2 2017
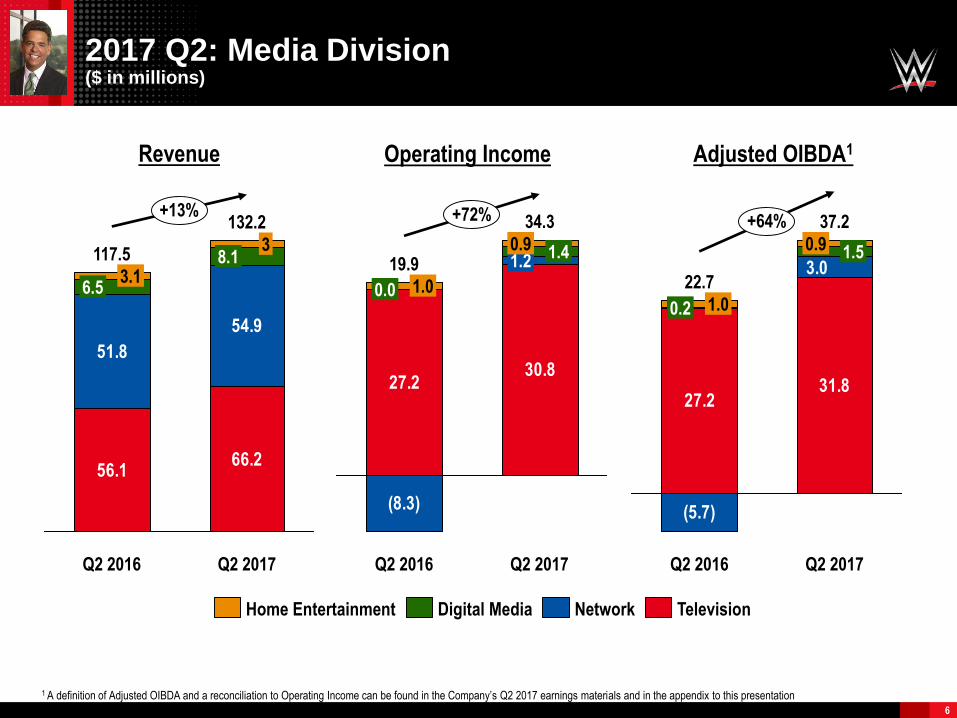
2017 Q2: Media Division ($ in millions)
56.166.2
51.8
54.9
6.53.1
+13%132.2
8.13
117.5
TelevisionNetworkDigital MediaHome Entertainment
Revenue Adjusted OIBDA1
6
(8.3)
30.827.2
34.3
1.21.40.9
19.9
0.0 1.0
+72%
31.827.2
(5.7)
3.0
37.2+64%
1.50.9
22.7
0.2 1.0
Operating Income
Q2 2016 Q2 2016Q2 2016Q2 2017 Q2 2017Q2 2017
1 A definition of Adjusted OIBDA and a reconciliation to Operating Income can be found in the Company’s Q2 2017 earnings materials and in the appendix to this presentation
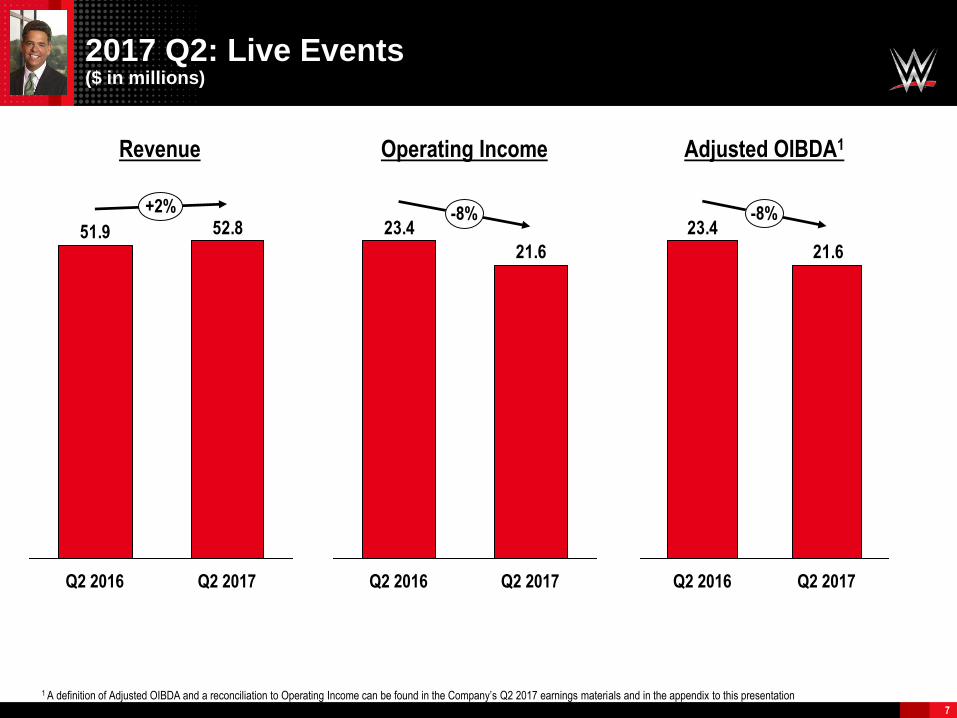
2017 Q2: Live Events($ in millions)
Revenue Adjusted OIBDA1
7
52.851.9
+2%
Q2 2016 Q2 2017
21.6
23.4
Q2 2016
-8%
Q2 2017
21.6
23.4-8%
Q2 2016 Q2 2017
Operating Income
1 A definition of Adjusted OIBDA and a reconciliation to Operating Income can be found in the Company’s Q2 2017 earnings materials and in the appendix to this presentation
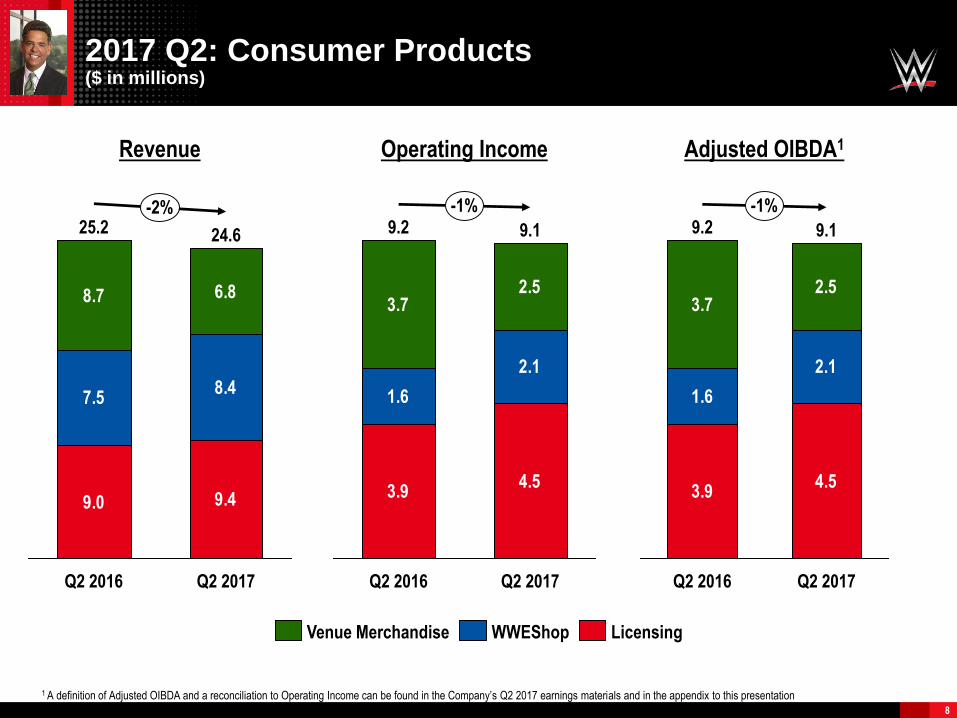
2017 Q2: Consumer Products($ in millions)
Revenue Adjusted OIBDA1
8
9.0 9.4
7.58.4
8.7 6.8
-2%
Q2 2017
24.6
Q2 2016
25.2
3.94.5
1.6
2.1
3.72.5
-1%
Q2 2017
9.1
Q2 2016
9.2
3.94.5
1.6
2.1
3.72.5
-1%
Q2 2017
9.1
Q2 2016
9.2
Operating Income
WWEShopVenue Merchandise Licensing
1 A definition of Adjusted OIBDA and a reconciliation to Operating Income can be found in the Company’s Q2 2017 earnings materials and in the appendix to this presentation

Capital Structure ($ in millions)
▪ As of June 30, WWE held ~$260M in cash and short-term investments and had ~$100 million indebt capacity under the Company’s revolving credit facility
▪ Free Cash Flow year-to-date improved ~$14 million as favorable changes in our working capital requirements and capital expenditures offset lower operating performance
9
Cash & ST Investments Free Cash Flow
$262.2$267.1 $1.3
$12.7
+$14.0
($4.9)
2016 Jun 2016 YTDQ2 2017 Jun 2017 YTD

2017 Q2: WWE Operational Highlights
▪ Q2 2017 reflected important progress in efforts tooptimize the value of WWE content, including year-over-year growth of WWE Network
▪ Produced more than 75 hours of original content forWWE Network, including 205 LIVE
▪ Produced UK Championship Special and developedour first action-packed women’s tournament, theMae Young Classic
▪ Launched localized weekly TV shows for India andthe Middle East
▪ Bella Twins YouTube channel exceeded 750,000subscribers, 50% higher than last quarter
▪ Attracted an increasing level of blue-chip andgaming partners, contributing to a 25% increase inGlobal Sponsorship revenue to date
▪ Selected Lagerdère Sports to further developWWE’s sponsorship business outside the U.S.
▪ Completed agreements to develop new mobilegames with Glu Mobile and Sega
10
1,6341,517
Q2 2016
+8%
Q2 2017
Average Paid Subscribers (000s)

Q3 2017 Business Outlook*
11
▪ For the third quarter, project average paid
subscribers to WWE Network of 1.54 million,
plus or minus 2%
▪ Estimate third quarter 2017 Adjusted OIBDA1 of
approximately $31 million to $35 million,
representing an expected year-over-year
increase primarily due to the contractual
escalation of television rights fees and continued
growth of WWE Network subscribers
1 A definition of Adjusted OIBDA and a reconciliation to Operating Income can be found in the Company’s Q2 2017 earnings materials and in the appendix to this presentation* The Company’s business model and expected results will continue to be subject to significant execution risks, including those risks outlined in the Company’s Form 10-K filing with the SEC. See
additional notes on page 17 of this presentation
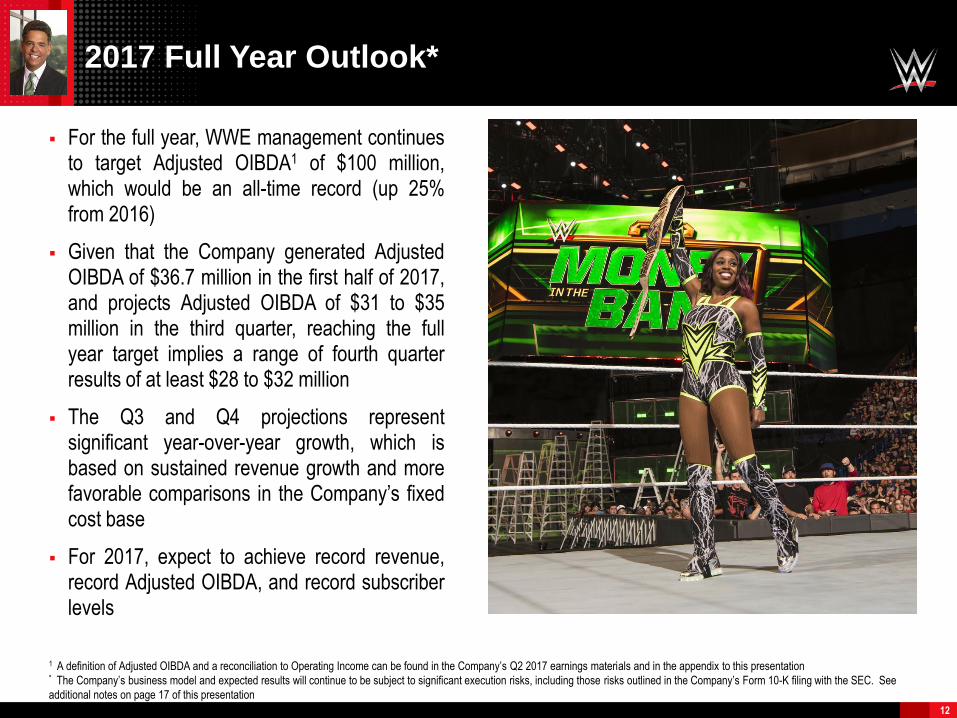
▪ For the full year, WWE management continuesto target Adjusted OIBDA1 of $100 million,which would be an all-time record (up 25%from 2016)
▪ Given that the Company generated AdjustedOIBDA of $36.7 million in the first half of 2017,and projects Adjusted OIBDA of $31 to $35million in the third quarter, reaching the fullyear target implies a range of fourth quarterresults of at least $28 to $32 million
▪ The Q3 and Q4 projections representsignificant year-over-year growth, which isbased on sustained revenue growth and morefavorable comparisons in the Company’s fixedcost base
▪ For 2017, expect to achieve record revenue,record Adjusted OIBDA, and record subscriberlevels
2017 Full Year Outlook*
1 A definition of Adjusted OIBDA and a reconciliation to Operating Income can be found in the Company’s Q2 2017 earnings materials and in the appendix to this presentation* The Company’s business model and expected results will continue to be subject to significant execution risks, including those risks outlined in the Company’s Form 10-K filing with the SEC. See
additional notes on page 17 of this presentation
12

A P P E N D I X
Reconciliation of Non-GAAP Measures
14
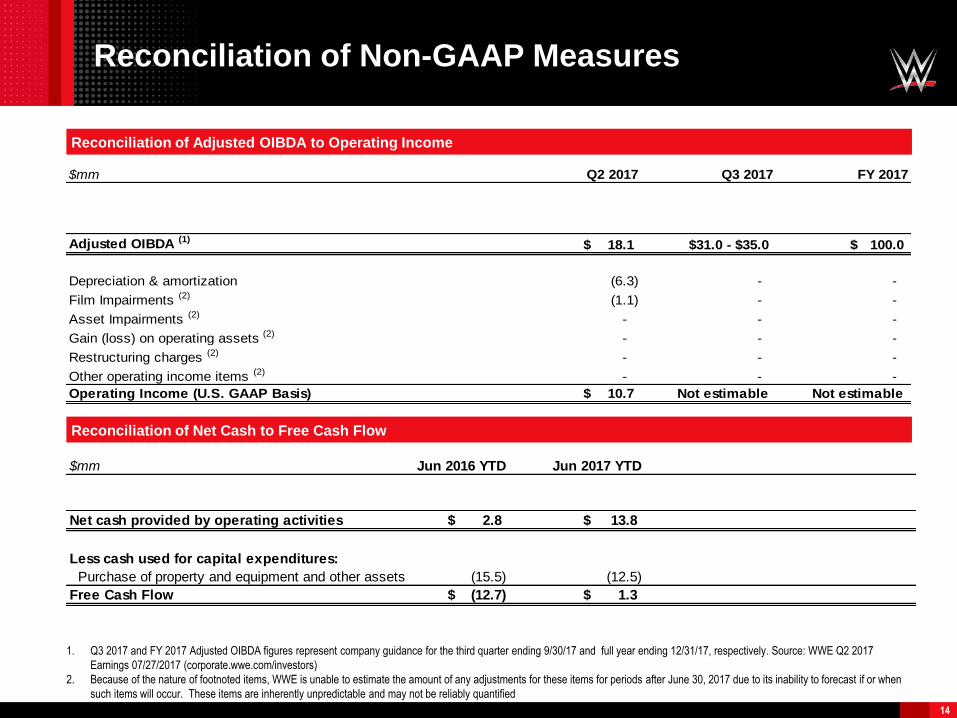
Reconciliation of Adjusted OIBDA to Operating Income
1. Q3 2017 and FY 2017 Adjusted OIBDA figures represent company guidance for the third quarter ending 9/30/17 and full year ending 12/31/17, respectively. Source: WWE Q2 2017
Earnings 07/27/2017 (corporate.wwe.com/investors)
2. Because of the nature of footnoted items, WWE is unable to estimate the amount of any adjustments for these items for periods after June 30, 2017 due to its inability to forecast if or when
such items will occur. These items are inherently unpredictable and may not be reliably quantified
Reconciliation of Net Cash to Free Cash Flow
$mm Q2 2017 Q3 2017 FY 2017
Adjusted OIBDA (1)18.1$ $31.0 - $35.0 100.0$
Depreciation & amortization (6.3) - -
Film Impairments (2) (1.1) - -
Asset Impairments (2) - - -
Gain (loss) on operating assets (2) - - -
Restructuring charges (2) - - -
Other operating income items (2) - - -
Operating Income (U.S. GAAP Basis) 10.7$ Not estimable Not estimable
$mm Jun 2016 YTD Jun 2017 YTD
Net cash provided by operating activities 2.8$ 13.8$
Less cash used for capital expenditures:
Purchase of property and equipment and other assets (15.5) (12.5)
Free Cash Flow (12.7)$ 1.3$
Reconciliation of Non-GAAP Measures
15
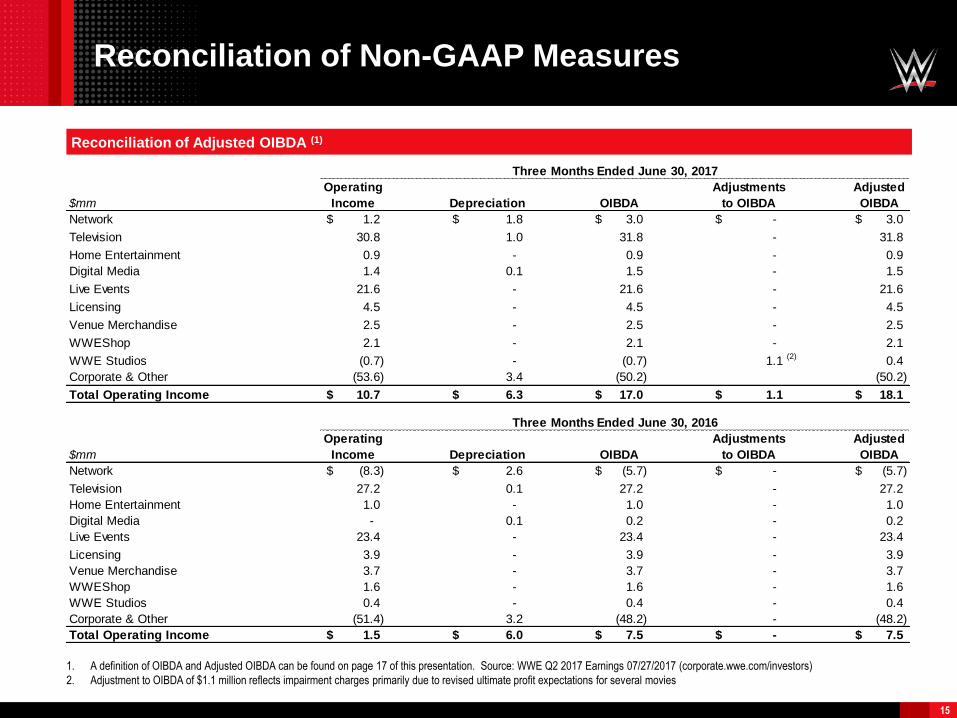
Reconciliation of Adjusted OIBDA (1)
1. A definition of OIBDA and Adjusted OIBDA can be found on page 17 of this presentation. Source: WWE Q2 2017 Earnings 07/27/2017 (corporate.wwe.com/investors)
2. Adjustment to OIBDA of $1.1 million reflects impairment charges primarily due to revised ultimate profit expectations for several movies
(2)
$mm
Operating
Income Depreciation OIBDA
Adjustments
to OIBDA
Adjusted
OIBDA
Network 1.2$ 1.8$ 3.0$ -$ 3.0$
Television 30.8 1.0 31.8 - 31.8
Home Entertainment 0.9 - 0.9 - 0.9
Digital Media 1.4 0.1 1.5 - 1.5
Live Events 21.6 - 21.6 - 21.6
Licensing 4.5 - 4.5 - 4.5
Venue Merchandise 2.5 - 2.5 - 2.5
WWEShop 2.1 - 2.1 - 2.1
WWE Studios (0.7) - (0.7) 1.1 0.4
Corporate & Other (53.6) 3.4 (50.2) (50.2)
Total Operating Income 10.7$ 6.3$ 17.0$ 1.1$ 18.1$
Three Months Ended June 30, 2017
$mm
Operating
Income Depreciation OIBDA
Adjustments
to OIBDA
Adjusted
OIBDA
Network (8.3)$ 2.6$ (5.7)$ -$ (5.7)$
Television 27.2 0.1 27.2 - 27.2
Home Entertainment 1.0 - 1.0 - 1.0
Digital Media - 0.1 0.2 - 0.2
Live Events 23.4 - 23.4 - 23.4
Licensing 3.9 - 3.9 - 3.9
Venue Merchandise 3.7 - 3.7 - 3.7
WWEShop 1.6 - 1.6 - 1.6
WWE Studios 0.4 - 0.4 - 0.4
Corporate & Other (51.4) 3.2 (48.2) - (48.2)
Total Operating Income 1.5$ 6.0$ 7.5$ -$ 7.5$
Three Months Ended June 30, 2016
Reconciliation of Non-GAAP Measures
16
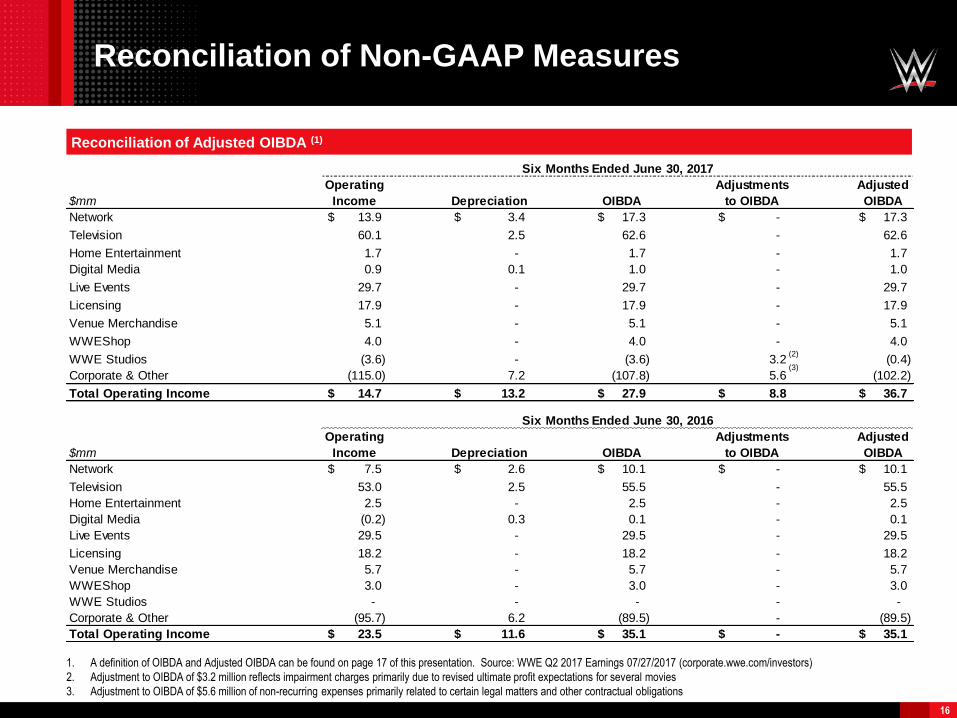
Reconciliation of Adjusted OIBDA (1)
1. A definition of OIBDA and Adjusted OIBDA can be found on page 17 of this presentation. Source: WWE Q2 2017 Earnings 07/27/2017 (corporate.wwe.com/investors)
2. Adjustment to OIBDA of $3.2 million reflects impairment charges primarily due to revised ultimate profit expectations for several movies
3. Adjustment to OIBDA of $5.6 million of non-recurring expenses primarily related to certain legal matters and other contractual obligations
(2)
$mm
Operating
Income Depreciation OIBDA
Adjustments
to OIBDA
Adjusted
OIBDA
Network 13.9$ 3.4$ 17.3$ -$ 17.3$
Television 60.1 2.5 62.6 - 62.6
Home Entertainment 1.7 - 1.7 - 1.7
Digital Media 0.9 0.1 1.0 - 1.0
Live Events 29.7 - 29.7 - 29.7
Licensing 17.9 - 17.9 - 17.9
Venue Merchandise 5.1 - 5.1 - 5.1
WWEShop 4.0 - 4.0 - 4.0
WWE Studios (3.6) - (3.6) 3.2 (0.4)
Corporate & Other (115.0) 7.2 (107.8) 5.6 (102.2)
Total Operating Income 14.7$ 13.2$ 27.9$ 8.8$ 36.7$
Six Months Ended June 30, 2017
(3)
$mm
Operating
Income Depreciation OIBDA
Adjustments
to OIBDA
Adjusted
OIBDA
Network 7.5$ 2.6$ 10.1$ -$ 10.1$
Television 53.0 2.5 55.5 - 55.5
Home Entertainment 2.5 - 2.5 - 2.5
Digital Media (0.2) 0.3 0.1 - 0.1
Live Events 29.5 - 29.5 - 29.5
Licensing 18.2 - 18.2 - 18.2
Venue Merchandise 5.7 - 5.7 - 5.7
WWEShop 3.0 - 3.0 - 3.0
WWE Studios - - - - -
Corporate & Other (95.7) 6.2 (89.5) - (89.5)
Total Operating Income 23.5$ 11.6$ 35.1$ -$ 35.1$
Six Months Ended June 30, 2016
Notes: Non-GAAP Measures
▪ The Company defines OIBDA as operating income before depreciation and amortization, excluding feature film and television
production amortization and related impairments. OIBDA is a non-GAAP financial measure and may be different than similarly-titled
non-GAAP financial measures used by other companies. A limitation of OIBDA is that it excludes depreciation and amortization,
which represents the periodic charge for certain fixed assets and intangible assets used in generating revenues for the Company's
business. OIBDA should not be regarded as an alternative to operating income or net income as an indicator of operating
performance, or to the statement of cash flows as a measure of liquidity, nor should it be considered in isolation or as a substitute for
financial measures prepared in accordance with GAAP. We believe that operating income is the most directly comparable GAAP
financial measure to OIBDA
▪ Adjusted OIBDA, Adjusted Operating income, Adjusted Net income and Adjusted Earnings per share exclude certain material items,
which otherwise would impact the comparability of results between periods. These should not be considered as an alternative to net
income, cash flows from operations or any other indicator of WWE's performance or liquidity, determined in accordance with U.S.
GAAP
▪ The Company defines Free Cash Flow as net cash provided by operating activities less cash used for capital expenditures. Although
it is not a recognized measure of liquidity under U.S. GAAP, Free Cash Flow provides useful information regarding the amount of
cash our continuing business is generating after capital expenditures, available for reinvesting in the business, debt service, and
payment of dividends
17