wwf ukassets.wwf.org.uk/downloads/electric_vehicles_research.pdf · wwf uk august 2010 element...
TRANSCRIPT
Project Name Document Name
1
Electric vehicles in the UK
and Republic of Ireland:
Greenhouse gas emission
reductions &
infrastructure needs
Final report
for
WWF UK
August 2010
Element Energy Limited
20 Station Road
Cambridge CB1 2JD
Tel: 01223 227764
Fax: 01223 356215

EVs in the UK & Republic of Ireland Final report for WWF
About the authors
Element Energy Limited is a low carbon consultancy providing a full suite of services from
strategic advice to engineering consultancy in the low carbon energy sector. Element Energy’s
strengths include techno-economic forecasting and delivering strategic advice to clients on all
opportunities connected to the low carbon economy.
For comments or queries please contact:
01223 852494
01223 852492
Acknowledgements
The authors are grateful to all who helped with this study. Particular thanks are due to: Keith
Allott, Jillian Anable, Keith Buchan, Sam Gardner, David Joffe, Andrea Kaszewski, and Jean
Leston.
Caveat
While the authors consider that the data and opinions contained in this report are sound, all
parties must rely upon their own skill and judgement when using it. The authors do not make
any representation or warranty, expressed or implied, as to the accuracy or completeness of
the report.
EVs in the UK & Republic of Ireland Final report for WWF
Contents
1 Highlights ............................................................................................................................. 1
1.1 Overview ......................................................................................................................... 1
1.2 Greenhouse gas emissions reductions .......................................................................... 1
1.3 Suitability of EVs for the car market and recharging infrastructure requirements .......... 2
1.4 Grid impacts ................................................................................................................... 3
1.5 Oil dependence .............................................................................................................. 5
1.6 Policy incentives and business opportunities ................................................................. 6
1.7 Priorities for innovation ................................................................................................... 6
2 Introduction .......................................................................................................................... 8
2.1 National and international context .................................................................................. 8
2.2 Aims of study ................................................................................................................ 11
2.3 Overall methodology .................................................................................................... 11
3 Scenarios for EV uptake, GHG emissions impacts and implications for oil demand ........ 12
3.1 Definition ....................................................................................................................... 12
3.2 Greenhouse gas emission reductions .......................................................................... 16
3.3 Impact on demand for oil .............................................................................................. 19
4 Recharging infrastructure requirements ............................................................................ 23
4.1 Driving pattern analysis ................................................................................................ 23
4.2 Infrastructure requirements .......................................................................................... 25
5 Grid impacts ...................................................................................................................... 30
5.1 Overview ....................................................................................................................... 30
5.2 Additional loads from EVs ............................................................................................ 30
5.3 Impact of EVs on peak electricity demands ................................................................. 33
5.4 Opportunities for EVs to contribute to grid balancing: storage potential of EVs and
vehicle to grid ........................................................................................................................ 41
6 Policy incentives and business opportunities .................................................................... 50
6.1 UK and international EV policy context ........................................................................ 50
6.2 Business opportunities ................................................................................................. 56
6.3 Barriers to exploiting opportunities ............................................................................... 57

EVs in the UK & Republic of Ireland Final report for WWF
6.4 Policy incentives and business opportunities: conclusions .......................................... 58
7 Policy recommendations ................................................................................................... 59
7.1 Demand management and consumer choices............................................................. 59
7.2 Electric vehicles and supporting infrastructure............................................................. 59
7.3 National electricity grid ................................................................................................. 60
8 Appendix ............................................................................................................................ 61
8.1 Literature review: national EV studies and other relevant publications........................ 61
8.2 Details of methodology ................................................................................................. 68
8.3 Key assumptions .......................................................................................................... 79
8.4 Electric vehicles in context ........................................................................................... 91
8.5 National Travel Survey analysis – further results ......................................................... 94
8.6 Supplementary results .................................................................................................. 98
8.7 Results tables ............................................................................................................. 105
EVs in the UK & Republic of Ireland Final report for WWF
Table of Figures
Figure 1: Historical emissions from the transport sector from 1990 in the UK and Republic of
Ireland .......................................................................................................................................... 9
Figure 2: Emissions projections under each scenario for cars in the UK (emissions are
calculated in the years of interest, with the dashed lines indicating the trajectories) ................ 17
Figure 3: Emissions projections for cars in the UK under alternative traffic demand
assumptions – Extended scenario ............................................................................................ 18
Figure 4: Petroleum flow chart (2008) – figures in million tonnes ............................................. 20
Figure 5: Projected fossil fuel demands from the passenger car sector in the UK ................... 20
Figure 6: Projected energy consumption in the passenger car sector by fuel type (UK) .......... 21
Figure 7: Trips by distance band and trip purpose for eight most frequent trip types ............... 24
Figure 8: Contribution of most frequent trip purposes to total car-km in Great Britain .............. 24
Figure 9: Proportion of parked time spent at home, at work, and at other locations based on
analysis of commuter drivers from the NTS .............................................................................. 26
Figure 10: Length of time parked at a selection of destinations ................................................ 27
Figure 11: Ratio of number of EVs in Great Britain to households with off-street parking under
each scenario in years of interest.............................................................................................. 28
Figure 12: Ratio of number of EVs in Ireland to households with off-street parking under each
scenario ..................................................................................................................................... 29
Figure 13: Average annual electricity demands from EVs in Britain under each scenario in
years of interest ......................................................................................................................... 31
Figure 14: Average annual electricity demands from EVs in Ireland under each scenario in
years of interest ......................................................................................................................... 32
Figure 15: Number of drivers arriving home from final trip of day by period for a typical
weekday .................................................................................................................................... 35
Figure 16: Estimated additional demands on the British electricity grid due to EVs in 2020
under the Extended scenario for a typical weekday (1.7m EVs in the parc)............................. 36
Figure 17: Estimated additional demands on the British grid due to EVs in 2020 under the
Extended scenario for a typical weekday with and without charge delay ................................. 37
Figure 18: Peak demands on the electricity grid in Britain with 25.5 million EVs in stock
(Stretch scenario in 2030) based on average charging rate of 3kW per EV ............................. 39
Figure 19: Maximum storage capacity offered by EVs – Great Britain ..................................... 42
Figure 20: Maximum storage capacity offered by EVs under each scenario – Ireland ............. 42
EVs in the UK & Republic of Ireland Final report for WWF
Figure 21: Estimation of likelihood of cars being driven / parked through the day ................... 44
Figure 22: Comparison of peak demands from EVs in Britain with total installed wind capacity
according to the Committee on Climate Change’s power sector indicators ............................. 45
Figure 23: Example price duration curve for wholesale electricity market ................................ 46
Figure 24: Interdependencies that impact EV uptake and annual CO2 emissions from cars ... 69
Figure 25: Representative annual new car sales by car type under BAU................................. 72
Figure 26: Change in car stock over time under BAU ............................................................... 73
Figure 27: Representative annual new car sales by car type - Extended scenario .................. 73
Figure 28: Change in car stock over time under the Extended scenario .................................. 74
Figure 29: Representative annual new car sales by car type - Stretch scenario ...................... 75
Figure 30: Change in car stock over time under the Stretch scenario ...................................... 75
Figure 31: Growth in sales of the Toyota Prius (mild hybrid vehicle) in Europe ....................... 76
Figure 32: Growth in sales of HEVs in the USA ........................................................................ 76
Figure 33: Average annual distance per BEV as a function of usable range ........................... 77
Figure 34: Proportion of PHEVs’ annual mileage done in electric mode .................................. 78
Figure 35: Indicative CO2 emission levels (hence savings) from the passenger car sector
under a 34% UK-wide 2020 target, based on CCC indicators .................................................. 80
Figure 36: Impact of improvements in ICEVs, non-drivetrain measures and demand
management on total emissions from cars ............................................................................... 84
Figure 37: Demand for car travel in Great Britain – historical data ........................................... 86
Figure 38: Trips by distance band and trip purpose for eight most frequent trip types - England
................................................................................................................................................... 94
Figure 39: Trips by distance band and trip purpose for eight most frequent trip types - Scotland
................................................................................................................................................... 94
Figure 40: Trips by distance band and trip purpose for eight most frequent trip types - Wales 95
Figure 41: Contribution of most frequent trip purposes to total car-km in England ................... 95
Figure 42: Contribution of most frequent trip purposes to total car-km in Scotland .................. 96
Figure 43: Contribution of most frequent trip purposes to total car-km in Wales ...................... 96
Figure 44: Number of drivers arriving home from final trip of day by period – weekend and
weekday results ......................................................................................................................... 97
EVs in the UK & Republic of Ireland Final report for WWF
Figure 45: Emissions projections under each scenario for cars in the UK – medium demand
reduction sensitivity ................................................................................................................... 99
Figure 46: Emissions projections under each scenario for cars in the UK – extreme demand
reduction sensitivity ................................................................................................................. 100
Figure 47: Emissions projections under each scenario for cars in the UK – high grid CO2
sensitivity ................................................................................................................................. 101
Figure 48: Grid CO2 intensity profile against proportion of EVs that demand charge for a
typical weekday in summer ..................................................................................................... 102
Figure 49: Grid CO2 intensity profile against proportion of EVs that demand charge for a
typical weekday in summer, with charge delay ....................................................................... 103
Figure 50: Carbon impact of the daily drive of 1,000 average vehicles in 2030 under alternative
charging scenarios .................................................................................................................. 104
Notes
‘Ireland’ in this report refers to the island of Ireland – i.e. both Northern Ireland and the
Republic of Ireland.
‘Britain’ or ‘Great Britain’ refers to England, Scotland and Wales.
Unless otherwise stated percentage emission reductions are relative to 1990 emission
levels.
EVs in the UK & Republic of Ireland Final report for WWF
Glossary
BAU Business as usual
BEV Battery electric vehicle
BWEA British Wind Energy Association
CCC The Committee on Climate Change
CSO Central Statistics Office Ireland
DfT Department for Transport
EPA Environmental Protection Agency
GHG Greenhouse gas
GWh Gigawatt hour (unit of energy) 1GWh = 106kWh
EV Electric vehicle (used as a generic term to refer to BEVs and PHEVs)
ICEV Internal combustion engine vehicle (used to refer to traditional cars)
kt Kilo tonne (one thousand tonnes)
kWh Kilowatt hour (unit of energy)
LATIS Land Use and Transport Integration in Scotland
LGV Light goods vehicle
Mt Mega tonne (one million tonnes)
Mtoe Mega tonne of oil equivalent
MW Megawatt (unit of power)
NAEI National Atmospheric Emissions Inventory
NGL Natural gas liquids
NI Northern Ireland
NTS National Travel Survey
OLEV Office for low emission vehicles
ONS Office for National Statistics
PHEV Plug-in hybrid electric vehicle
ROI Republic of Ireland
SEAI Sustainable Energy Authority Ireland
SMMT Society of motor manufacturers and traders
US ABC United States Advanced Battery Consortium
V2G Vehicle to grid
VED Vehicle excise duty
EVs in the UK & Republic of Ireland Final report for WWF
1
1 Highlights
1.1 Overview
The UK is legally committed to reduce its greenhouse gas emissions, with binding targets of at
least 80% reduction by 2050 set out in the Climate Change Act. As a minimum, a 34% cut in
emissions relative to 1990 levels must be achieved by 2020. This target could rise to 42%
following an EU agreement to raise the current 20% to a 30% target and the recommendations
made by the UK Committee on Climate Change. The passenger car sector must play a
commensurate role if these targets are to be met.
In addition to incremental improvements in traditional vehicles (stop-start, light-weighting,
improved aerodynamics etc), the main technologies which could achieve significant carbon
savings in the transport sector include increased use of biofuels (subject to source), a move to
hydrogen-fuelled vehicles, and electric vehicles (EVs). The focus of this work is on electric
vehicles (pure battery electric vehicles and plug in hybrid electric vehicles) and the contribution
they could make to emissions reductions in the period to 2030. The specific aims of the study
are to:
Assess the CO2 emissions of cars in the UK in 2015, 2020 and 2030, and the role of
EVs in meeting CO2 reduction targets.
Evaluate the challenges and opportunities for the national electricity grids of Great
Britain and Ireland that may arise due to increased EV uptake.
Assess the infrastructure requirements for the roll-out of EVs across the UK and
Republic of Ireland.
Three scenarios of EV uptake in the UK and Republic of Ireland have been defined to meet
these objectives: Business as Usual (BAU) (low EV uptake), Extended (medium EV uptake in
line with Committee on Climate Change indicators), and Stretch (upper bound on EV uptake).
1.2 Greenhouse gas emissions reductions
A model of the passenger car sector was used to derive emissions trajectories under each
scenario of EV uptake. The key conclusions are:
EVs provide the greatest CO2 savings when the grid CO2 intensity is low and the stock
of EVs is high. With high market growth rates, the CO2 emission reduction potential of
EVs could begin to emerge in the period 2020–2030.
While benefits of EV deployment aggregate in the longer term, there are two reasons
why action is required in the near term. First, near term deployment is required to
improve the technology, reduce cost and risks, and build market share. The second
factor is the need to plan for widespread EV uptake in the future, including
assessment of infrastructure requirements, which should feed into electricity
infrastructure investment decisions.
To achieve meaningful emissions reductions in the next 10–15 years, two elements
are vital:
EVs in the UK & Republic of Ireland Final report for WWF
2
o Compliance with EU-legislated new car emission levels.1
o Achieving stabilisation or reduction in overall demand for car travel.
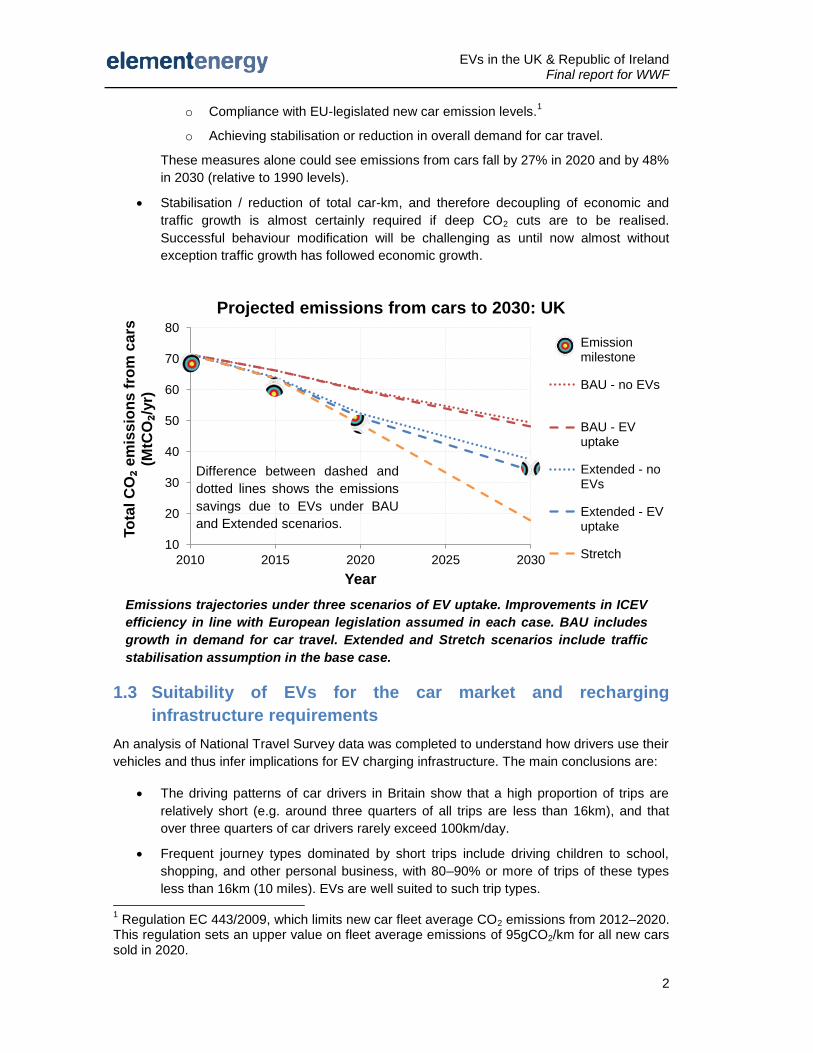
These measures alone could see emissions from cars fall by 27% in 2020 and by 48%
in 2030 (relative to 1990 levels).
Stabilisation / reduction of total car-km, and therefore decoupling of economic and
traffic growth is almost certainly required if deep CO2 cuts are to be realised.
Successful behaviour modification will be challenging as until now almost without
exception traffic growth has followed economic growth.
1.3 Suitability of EVs for the car market and recharging
infrastructure requirements
An analysis of National Travel Survey data was completed to understand how drivers use their
vehicles and thus infer implications for EV charging infrastructure. The main conclusions are:
The driving patterns of car drivers in Britain show that a high proportion of trips are
relatively short (e.g. around three quarters of all trips are less than 16km), and that
over three quarters of car drivers rarely exceed 100km/day.
Frequent journey types dominated by short trips include driving children to school,
shopping, and other personal business, with 80–90% or more of trips of these types
less than 16km (10 miles). EVs are well suited to such trip types. 1 Regulation EC 443/2009, which limits new car fleet average CO2 emissions from 2012–2020.
This regulation sets an upper value on fleet average emissions of 95gCO2/km for all new cars sold in 2020.
10
20
30
40
50
60
70
80
2010 2015 2020 2025 2030
To
tal C
O₂
em
iss
ion
s f
rom
ca
rs
(MtC
O₂/
yr)
Year
Projected emissions from cars to 2030: UK
Emissionmilestone
BAU - no EVs
BAU - EVuptake
Extended - noEVs
Extended - EVuptake
Stretch
Difference between dashed and
dotted lines shows the emissions
savings due to EVs under BAU
and Extended scenarios.
Emissions trajectories under three scenarios of EV uptake. Improvements in ICEV
efficiency in line with European legislation assumed in each case. BAU includes
growth in demand for car travel. Extended and Stretch scenarios include traffic
stabilisation assumption in the base case.
EVs in the UK & Republic of Ireland Final report for WWF
3
The most important locations for recharging EVs will be at homes and workplaces
since these are where most vehicles spend the majority of their time parked.
Commuting is the most common trip purpose and commuting journeys account for
around a quarter of total car-km in Britain. Workplace charge points will increase the
potential market for BEVs by alleviating commuters’ range anxiety. Furthermore, the
economic case for workplace charging is stronger than for public charge points as a
reasonably high utilisation could be expected.
In all but the Stretch scenario there are sufficient households with off-street parking to
accommodate the number of EVs in the stock across Britain and Ireland as a whole.
While it is unlikely that on-street charge points outside people’s homes will be needed
in the short to medium term, such infrastructure may be required if EVs become the
dominant vehicle type in the passenger car market.
Publicly available charge points, and fast charge points in particular, require relatively
high capital investment (compared to home based charging).
Public charge points also risk low utilisation factors, which means that revenues from
electricity sales could be limited. For these reasons public charge points should not be
the primary means of recharging EVs.
Public charge points may have a role to play in sending signals to the market and
increasing the profile of EVs. They could be used in conjunction with other support
incentives for EVs (e.g. dedicated EV parking in congested areas, allocated EV
parking spaces with charge points close to shop entrances, reduced road taxes, free
parking).
1.4 Grid impacts
1.4.1 Impact of EVs on average and peak electricity demands
Additional average annual electricity demands from EVs do not exceed around 1.5%
of total forecast demands in 2020 in any of the scenarios considered.
The maximum additional annual energy demand due to EVs occurs in 2030 under the
Stretch scenario. Even then, with EVs representing three-quarters of the total car
stock, the additional demands are less than 10% of forecast electricity demand for all
end uses.
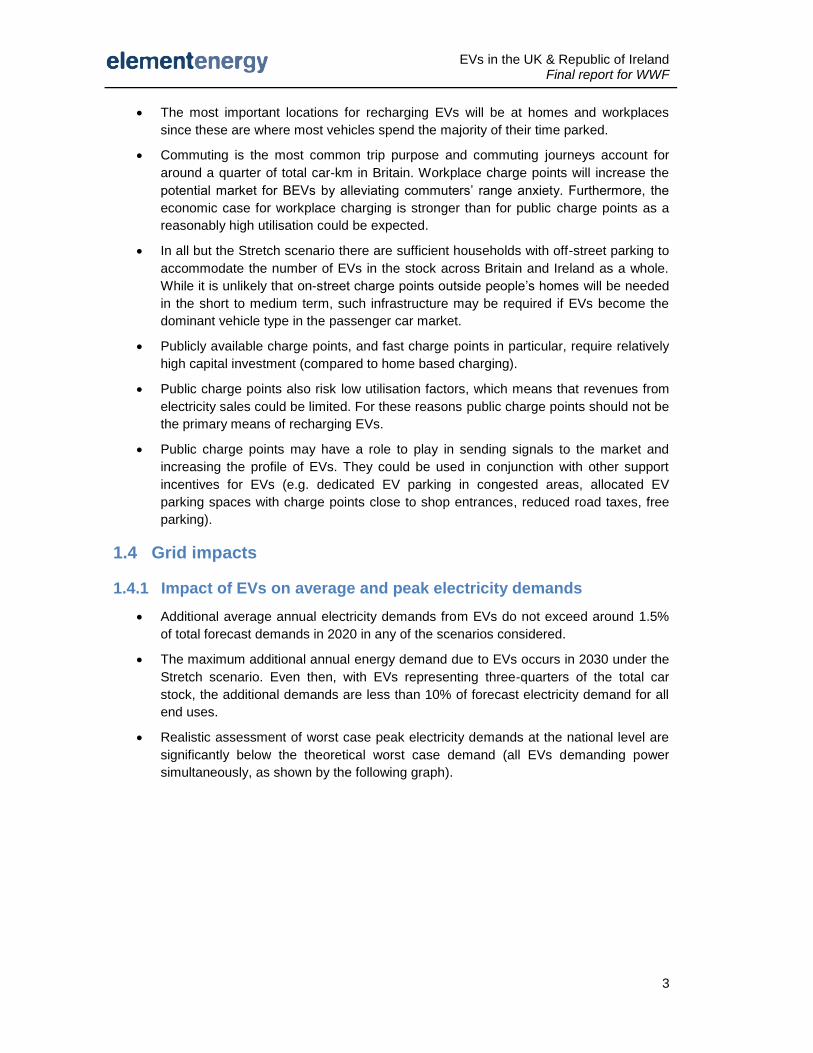
Realistic assessment of worst case peak electricity demands at the national level are
significantly below the theoretical worst case demand (all EVs demanding power
simultaneously, as shown by the following graph).
EVs in the UK & Republic of Ireland Final report for WWF
4
Reductions in peak demands from the theoretical worst case arise since not all
vehicles are used each day and as a result of diversity factors (i.e. the spread of
timings of arrival at charge points).
Peak demands can be curbed further through simple measures such as delayed
charging (which can be encouraged through time of day electricity pricing), or through
intelligent charging on a smart grid. However, such approaches will require consumer
education and cooperation to realise maximum benefits.
Even under the Stretch scenario in 2030, where EVs make up three-quarters of the
car stock, a realistic assessment shows that worst case peak demands due to EVs are
below 10GW. To put this in context, 10GW is within the range of National Grid
forecasts for load growth (based on forward extrapolation of medium term projections).
The equivalent figure for the Extended scenario in 2030 is 2.5GW, i.e. this is a realistic
worst case peak demand due to EVs, including adjustment for cars not driven,
diversity of time of arrival home, and load shifting.
The need for flexible charging of EVs is increased in the context of electrification of
other sectors, for example heat pumps for domestic heating. Delaying EV charging to
times of low demand from other sources could reduce peaking plant requirements at
the national level and minimise impacts on the distribution grid at the local level.
1.4.2 Opportunities for grid balancing and vehicle to grid
The total storage capacity of EVs in the stock in the Extended scenario by 2020 is
around 23GWh, which is equivalent to around 30 minutes’ average national electricity
demand in Britain.
The maximum technical storage potential of EVs in Britain under the Stretch scenario
reaches around 460GWh (by 2030), which is around 50 times the storage capacity of
Britain’s largest pumped hydro facility (nearly 11 hours’ worth of average national
electricity demand).
76.5
54.6
12.3 9.3
0
10
20
30
40
50
60
70
80
90
Worst case(theoretical only)
Adjusted for carsthat require charge
Adjusted forarrival time
With loadshifting
Peak d
em
an
ds d
ue t
o E
Vs (
GW
)Estimated peak demands on British grid in 2030 due to EVs
under the Stretch scenario
Impact of simple
charge delay
Impact of diversity (spread
of time of arrival home)
Reduction due to proportion of EVs
not driven on any particular day
Theoretical worst case = all EVs demand power simultaneously
EVs in the UK & Republic of Ireland Final report for WWF
5
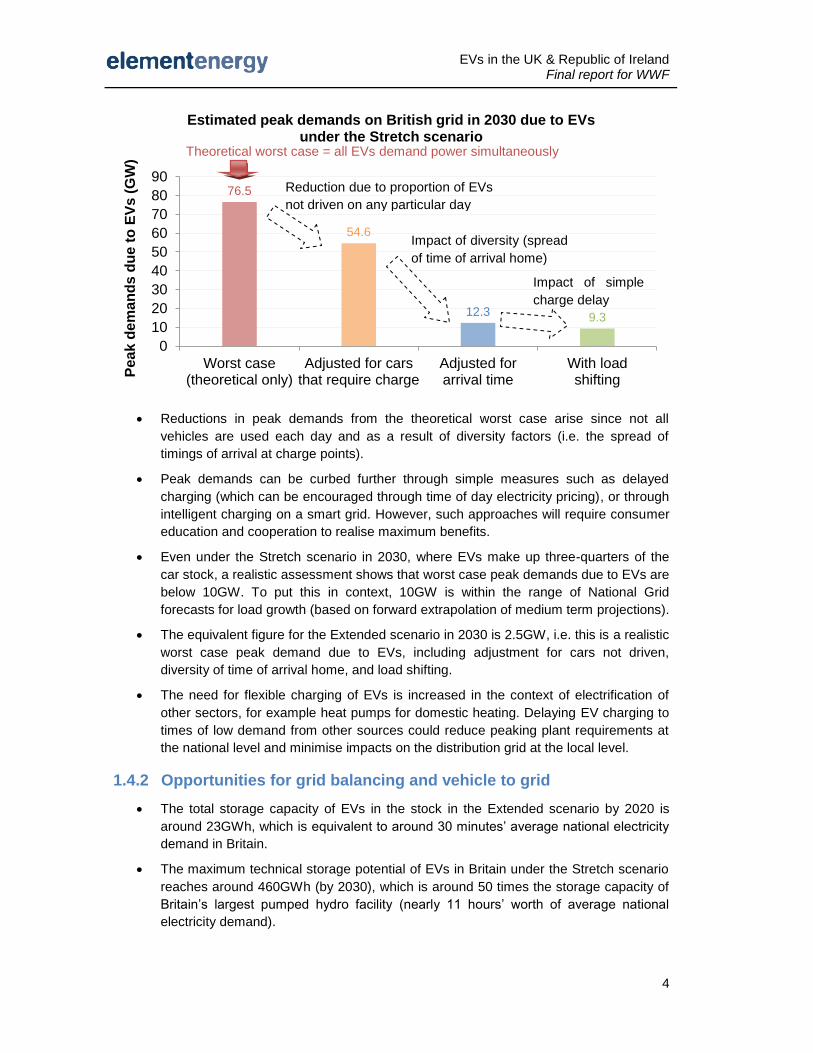
Analysis of the driving habits of a sample of drivers from the National Travel Survey
suggests that there is a high chance that at least 90% of cars will be parked at any
time throughout the day or night. This suggests that with sufficient infrastructure (e.g.
home and workplace charge points with grid connected inverters) a high proportion of
the EV stock could in theory be grid connected at any one time.
EVs may help in grid balancing either by accepting charge during times of excess
generation (acting as a dispatchable load), or by feeding power to the grid at times of
high demand (vehicle to grid, V2G).
Either high EV uptake or widespread utilisation of fast charging (or both) is required for
EVs to play a significant role in a dispatchable load capacity.
Electricity provided to the grid by EVs in vehicle to grid will have to have a relatively
high price to recoup the cost of reduced battery life which would result. However, the
marginal cost of electricity (when V2G might be required) is also likely to be high.
The ability of EVs to serve the grid in vehicle to grid applications depends on battery
cost reductions being achieved and development of intelligent grid management
systems (e.g. a smart grid).
To facilitate V2G, grid-tie inverters (not required for normal charging) would also be
required. These could represent a significant extra cost.
1.5 Oil dependence
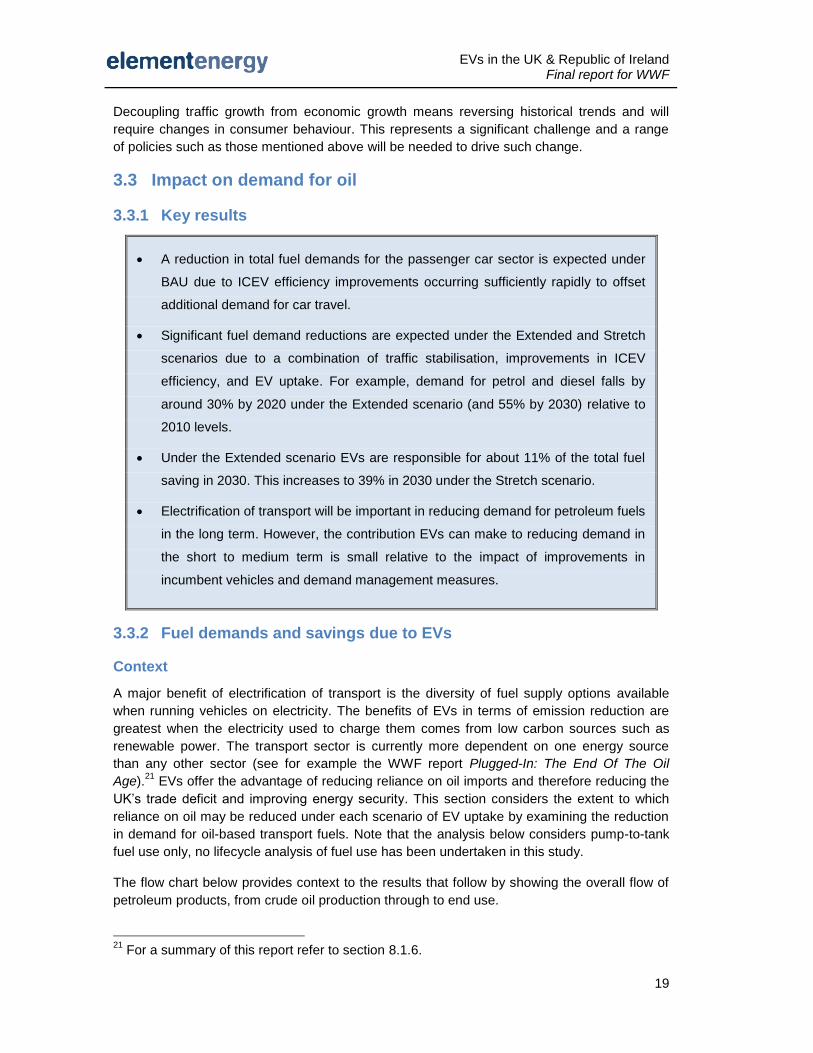
A reduction in total fuel demands for the passenger car sector is expected under BAU
due to ICEV efficiency improvements occurring sufficiently rapidly to offset additional
demand for car travel.
Significant fuel demand reductions are expected under the Extended and Stretch
scenarios due to a combination of traffic stabilisation, improvements in ICEV
efficiency, and EV uptake. For example, demand for petrol and diesel falls by around
30% by 2020 under the Extended scenario (and 55% by 2030) relative to 2010 levels.
0%
2%
4%
6%
8%
10%
12%
14%
00
:00
01
:00
02
:00
03
:00
04
:00
05
:00
06
:00
07
:00
08
:00
09
:00
10
:00
11
:00
12
:00
13
:00
14
:00
15
:00
16
:00
17
:00
18
:00
19
:00
20
:00
21
:00
22
:00
23
:00
00
:00P
erc
en
tag
e o
f cars
bein
g d
riven
Time of day
Percentage of all cars within a sample being driven by time of day(sample size = 17,971 (Saturday) and 19,656 (Monday))
Saturday
Monday
Commuting signals
can be seen on
weekday
No more than 13%
of cars were being
driven at any one
time through the day
EVs in the UK & Republic of Ireland Final report for WWF
6
Under the Extended scenario EVs are responsible for about 11% of the total fuel
saving in 2030. This increases to 39% in 2030 under the Stretch scenario.
Electrification of transport will be important in reducing demand for petroleum fuels in
the long term. However, the contribution EVs can make to reducing demand in the
short to medium term is small relative to the impact of improvements in incumbent
vehicles and demand management measures.
1.6 Policy incentives and business opportunities
International examples show that there are various approaches to supporting EVs.
Capital cost of vehicles is the primary issue and most support programmes aim to
address this, either through subsidies or tax incentives.
The electric vehicle industry in the UK is supported through national and regional
schemes. Capital grants of up to £5,000 per vehicle are expected from 2011 and EV
trials and infrastructure programmes are being developed through the Plugged-In
Places Infrastructure Framework.2
However, the UK has yet to develop a strategic infrastructure plan to support EVs.
More could be done to grow the market through public sector procurement of low
carbon vehicles in the UK.
Countries that have shown significant commitment to EVs include Japan, where the
government is investing heavily in supporting infrastructure; and France, where the
public sector is adopting EVs in significant numbers and planning laws require charge
facilities in new buildings.
In the near term EVs require significant subsidy due to their high capital cost. This
could be mitigated in the future by new business models, including battery leasing.
The use of fast track planning applications for EV infrastructure could remove red tape
and increase the speed at which EV infrastructure could be built. The mandatory
installation of EV charging points for new buildings (as proposed in France) could be
used to send clear signals to the market.
1.7 Priorities for innovation
High uptake is required for the full potential of EVs to be realised in terms of CO2 emission
reduction, reduced reliance on fossil fuels, and grid balancing functions. EVs are currently a
niche technology and a number of developments are required to make them more attractive to
the mass market. Key priorities for innovation are summarised below.
Near term
Battery cost reduction – high battery costs remain a significant restriction to EV
uptake. Costs must fall for EVs to become an attractive option to the mass market.
2 The government has committed £43m to EV support in the period 2011–2012. This is well
below the original budget of £230m allocated for capital cost support for EVs. The levels of funding beyond 2012 will be established during the government spending review in autumn 2010. Further financial support for EVs will be required beyond 2012 to continue growing the market for EVs.
EVs in the UK & Republic of Ireland Final report for WWF
7
Battery performance improvements – as well as cost reductions, improvements in
battery performance are needed. These include achieving a higher energy density
(kWh/kg) for greater range for a given battery mass and increased power density
(kW/kg), which will allow faster charging and discharging.
Continued electrification of the drive train – electric motors offer a more efficient
propulsion method than traditional internal combustion engines. The learning that
results from electrifying drive trains could prove valuable in other vehicle markets such
as hydrogen fuel cell powered vehicles.
New business models – EVs are likely to remain more expensive than incumbent
vehicles, at least in the short to medium term. New approaches are required to
remove the additional capital cost faced by consumers. For example, battery leasing
business models through the manufacturer or a third party company.
Decarbonisation of electricity grid – carbon benefits of EVs improve as the CO2
intensity of electricity decreases. While the UK has a long term goal of significant grid
decarbonisation, near term action is also required.
There is also a need to improve consumer confidence in EVs. This could be achieved through
further trials to gather empirical data on real-world performance (e.g. EV efficiency (kWh/km),
recharge times, EV performance) to validate manufacturers’ claims.
Longer term
Smarter electricity grid – this study has shown that there are advantages to be
gained through active management of when EVs demand power from the grid (e.g.
minimising demand peaks, delaying charging to times of lower grid carbon intensity).
Integrating an intelligent communication network with the national grid would allow
these benefits to be delivered.
Grid-tie inverter sharing – one of the barriers to V2G is the need to convert DC
power from the battery to AC power at the correct voltage and frequency. If distributed
generation increases, these inverters will be more common (e.g. to feed electricity
from photovoltaic systems into the grid). There could be an opportunity to share grid-
tie inverters to avoid the need to invest in this hardware especially for EVs, subject to
overcoming issues such as DC power matching, and the need for additional cabling in
the home.
EVs in the UK & Republic of Ireland Final report for WWF
8
2 Introduction
2.1 National and international context
2.1.1 CO2 reduction targets
The Climate Change Act 2008 sets legally binding greenhouse gas reduction targets for the
UK, including a carbon reduction target of at least 80% by 2050 compared to 1990 levels. A
2020 target of a 34% cut in total UK emissions has been set for the UK to make its
contribution towards an EU-wide target of a 20% reduction in emissions.3 In the event of an
uplift of the EU-wide 2020 target to 30%, which is looking likely with cross-EU and UK
government support, the UK’s target will increase to 42%. The Committee on Climate Change
has also recommended this higher target for domestic action. There is a clear need to achieve
significant cross-sector emission reductions and the transport sector, which was responsible
for around a quarter of the UK’s CO2 emissions in 2009, will have to play its role.4
2.1.2 Historical trends in emissions from the transport sector
Emissions from the transport sector have been on an upward path for around two decades to
2007. Provisional emissions results for 2009 suggest that the fall in UK emissions from the
transport sector from 2007 to 2008 continued in 2008 to 2009 as a result of the recession.
3 All emission reduction percentages are relative to 1990 levels unless otherwise stated.
4 Provisional emissions data for 2009:
www.decc.gov.uk/en/content/cms/statistics/climate_change/gg_emissions/uk_emissions/2009_prov/2009_prov.aspx.
EVs in the UK & Republic of Ireland Final report for WWF
9
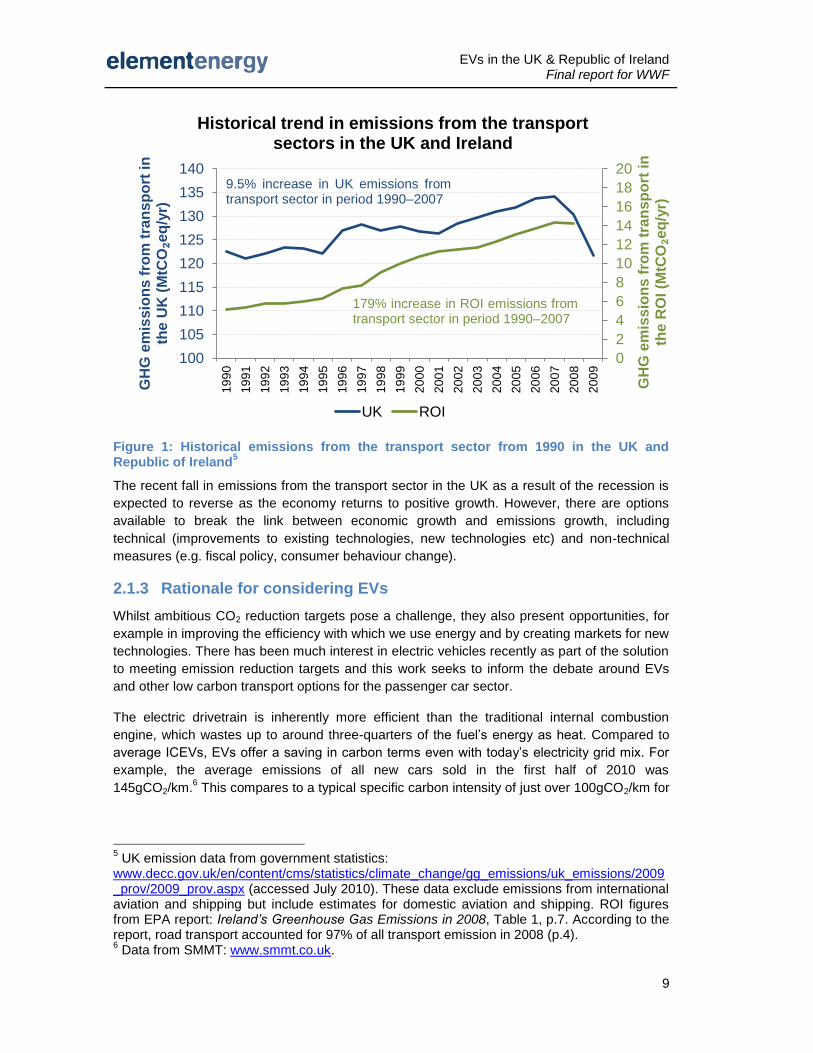
Figure 1: Historical emissions from the transport sector from 1990 in the UK and Republic of Ireland
5
The recent fall in emissions from the transport sector in the UK as a result of the recession is
expected to reverse as the economy returns to positive growth. However, there are options
available to break the link between economic growth and emissions growth, including
technical (improvements to existing technologies, new technologies etc) and non-technical
measures (e.g. fiscal policy, consumer behaviour change).
2.1.3 Rationale for considering EVs
Whilst ambitious CO2 reduction targets pose a challenge, they also present opportunities, for
example in improving the efficiency with which we use energy and by creating markets for new
technologies. There has been much interest in electric vehicles recently as part of the solution
to meeting emission reduction targets and this work seeks to inform the debate around EVs
and other low carbon transport options for the passenger car sector.
The electric drivetrain is inherently more efficient than the traditional internal combustion
engine, which wastes up to around three-quarters of the fuel’s energy as heat. Compared to
average ICEVs, EVs offer a saving in carbon terms even with today’s electricity grid mix. For
example, the average emissions of all new cars sold in the first half of 2010 was
145gCO2/km.6 This compares to a typical specific carbon intensity of just over 100gCO2/km for
5 UK emission data from government statistics:
www.decc.gov.uk/en/content/cms/statistics/climate_change/gg_emissions/uk_emissions/2009_prov/2009_prov.aspx (accessed July 2010). These data exclude emissions from international aviation and shipping but include estimates for domestic aviation and shipping. ROI figures from EPA report: Ireland’s Greenhouse Gas Emissions in 2008, Table 1, p.7. According to the report, road transport accounted for 97% of all transport emission in 2008 (p.4). 6 Data from SMMT: www.smmt.co.uk.
0
2
4
6
8
10
12
14
16
18
20
100
105
110
115
120
125
130
135
140
19
90
19
91
19
92
19
93
19
94
19
95
19
96
19
97
19
98
19
99
20
00
20
01
20
02
20
03
20
04
20
05
20
06
20
07
20
08
20
09
GH
G e
mis
sio
ns
fro
m t
ran
sp
ort
in
th
e R
OI (M
tCO₂e
q/y
r)
GH
G e
mis
sio
ns
fro
m t
ran
sp
ort
in
th
e U
K (
MtC
O₂e
q/y
r)
Historical trend in emissions from the transport sectors in the UK and Ireland
UK ROI
9.5% increase in UK emissions from transport sector in period 1990–2007
179% increase in ROI emissions from transport sector in period 1990–2007
EVs in the UK & Republic of Ireland Final report for WWF
10
an EV charged with grid electricity.7 Some of the issues with relying on vehicles that require
petroleum-derived fuels include:
Long term sustainability issues – fossil fuel supplies are limited and the
environmental impact of extracting fuels can be severe.
Carbon impact – the combustion of fossil fuels releases CO2 to the atmosphere,
contributing to climate change.
Price volatility – traditional transportation fuel prices are linked to the price of oil,
which is highly volatile and expected to increase in the medium to long term as
supplies diminish.
Security of fuel supply – the world’s oil reserves are concentrated in a relatively
small number of countries.
For these reasons a shift to EVs, powered by electricity (which can come from a wide range of
sources, including renewables), appears beneficial. However, the role of EVs in cutting CO2
emissions and reducing our reliance on fossil fuels must be considered in the broader context
of other available measures. At present EVs are significantly more expensive than traditional
vehicles in terms of capital cost. Pure BEVs also offer lower utility compared to ICEVs, so the
EV market requires subsidies to incentivise consumers. Furthermore, the EV market is
currently immature, which means uptake will be limited in the short to medium term, limiting
the potential impact of EVs on meeting CO2 reduction targets.
This study was commissioned by WWF UK, building on previous work undertaken for WWF
Scotland8, and considers the role that EVs may play in:
1. achieving the carbon savings from the car sector required for compliance with national
targets in line with an 80% reduction in greenhouse gas emissions by 20509, and
2. reducing reliance on oil as the primary energy source for the road transport sector.10
Total emissions from cars depend on the average specific emissions of all cars on the road
(gCO2/km) and total demand for car travel (km/yr). The primary role of EVs will be in reducing
the average specific emissions of the car fleet (in parallel with numerous other measures).
Demand control measures, in addition to being a simple and cost effective method of emission
reduction, will be required in conjunction with an increase in EVs in order to counteract the
propensity to drive more, given the lower operating costs of EVs.
7 Emissions from EVs based on typical grid to wheel efficiency of 0.2kWh/km and an average
grid CO2 intensity of 517gCO2/kWh, which is the figure used in the government’s latest tool for assessing the carbon impact of new dwellings. 8 Electric vehicles in Scotland: Emission reductions and infrastructure needs, Element Energy
for WWF Scotland (November 2009). 9 This study focuses on the car sector only. In 2007 around 57% of the UK’s transport
emissions were due to cars. 10
For further context see the WWF report: Plugged In: The End Of The Oil Age (March 2008), which is summarised in section 8.1.6.
EVs in the UK & Republic of Ireland Final report for WWF
11
2.2 Aims of study
This study considers the role of electric cars in contributing towards UK CO2 reduction targets
in the period to 2030. The study follows a scenario-based approach to EV uptake, with three
core scenarios: Business as Usual (BAU), Extended and Stretch.
The aims of this study are to:
Assess the CO2 reduction potential of cars in the UK in 2015, 2020 and 2030, and the
role of EVs in meeting CO2 reduction targets.
Evaluate the challenges and opportunities for the national electricity grids of Great
Britain and Ireland that may arise due to increased EV uptake.
Assess the infrastructure requirements for the roll-out of EVs across the UK and
Republic of Ireland.
2.3 Overall methodology
2.3.1 Scenarios
This study follows a similar methodology to the previous project undertaken for WWF Scotland
in that a scenario-based approach is used. In each scenario the total number of BEVs and
PHEVs in the UK is defined in the years of interest (2015, 2020 and 2030).
This research is forward-looking and considers the passenger car sector up to 2030. Taking a
scenario-based approach allows us to reflect the fact that the future is uncertain as a wide
range of alternative futures can be defined. Useful insights into the impact of EVs on GHG
emissions, and other associated issues (e.g. grid impacts) can be made in the knowledge that
the future is likely to lie somewhere between the scenarios defined.
It should be noted that the scenarios are indicative (representing a range of EV uptake levels
and low carbon futures). This study does not to attempt to forecast future EV uptake levels
and no consumer choice modelling has been undertaken in this study.
2.3.2 Scope
The focus of this study in terms of GHG emissions reductions is on the United Kingdom, for
which data are available on the short to medium term CO2 reductions required for overall
targets to be met, and indicative contributions that the car sector will have to provide.
Indicative CO2 emission milestones for the years of interest (2015, 2020 and 2030) were
derived based on detailed analysis by the CCC on the relative contributions of each sector
towards overall emission reduction targets (see section 8.3.1). Carbon reduction targets by
sector for the Republic of Ireland are currently less clear, so the ROI is included only in the
grid impacts and infrastructure analysis.
In terms of vehicles, the study relates to the passenger car sector only. There may be an
opportunity for early EV deployment in the light commercial vehicle sector, where the duty
cycles of light vans are within the technical capabilities of EVs. This is discussed further in
section 6.2.3.
Full details of the methodology, including all assumptions made, are given in the appendix.
EVs in the UK & Republic of Ireland Final report for WWF
12
3 Scenarios for EV uptake, GHG emissions impacts and
implications for oil demand
3.1 Definition
Three scenarios for the passenger car market have been defined. These include
assumptions on demand for car travel, emission reductions through non-drivetrain
measures, and the stock of EVs in future years.
Demand for car travel increases under the BAU scenario and EV uptake is
relatively low (0.5% of car stock by 2020). However, efficiency improvements in
ICEVs are realised through EU legislation that limits average emissions of new
cars.
The Extended scenario sees a higher level of EV uptake, with EV sales increasing
such that the CCC’s indicator figure for EV stock (1.7 million vehicles) by 2020 is
met. Other measures also come into effect, including demand management so
that there is no growth in total car-km, improvements in ICEV efficiency, and CO2
savings from eco driving and speed limit enforcement.
EV uptake under the Stretch scenario is driven by a 2020 CO2 emission milestone
for cars in line with the UK meeting a 42% emission cut overall by 2020. This
requires very high levels of EV uptake (4.2 million vehicles) , constrained only by
supply-side considerations.
The Stretch scenario represents an upper bound on EV uptake, with strong sales
growth over the next decade leading to 13% of the car fleet being plug-in vehicles
by 2020. With continued sales of EVs through the 2020s, plug-in vehicles
represent around three-quarters of the total car fleet by 2030.
The scenarios developed for this study are presented below in terms of market penetration of
EVs in the UK by the years of interest. In order to calculate the emissions from cars in future
years it is necessary to make a range of related assumptions (e.g. on efficiency of all car
types, EV range, carbon intensity of grid electricity etc.). In this study the scenarios are, as far
as possible ‘internally consistent’ such that all assumptions are congruent. Further background
to the scenarios is given in the appendix, section 8.2, which includes the results of a simple
sales and stock model used to generate representative sales required over time. Details of the
penetration levels of EVs in the Republic of Ireland are also given in the appendix, section
8.2.1.
EVs in the UK & Republic of Ireland Final report for WWF
13
3.1.1 Business as Usual
This scenario represents the level of EV uptake with existing and announced policies in place,
with no further support for EVs. Improvements to ICEVs in line with EU legislation are
assumed to come into effect but demand for car travel continues to grow with no new demand
management policy in place, and total car-km in the UK therefore increases by 8% and 13%
by 2020 and 2030 respectively (based on DfT and LATIS model forecasts, see section 8.3.4).
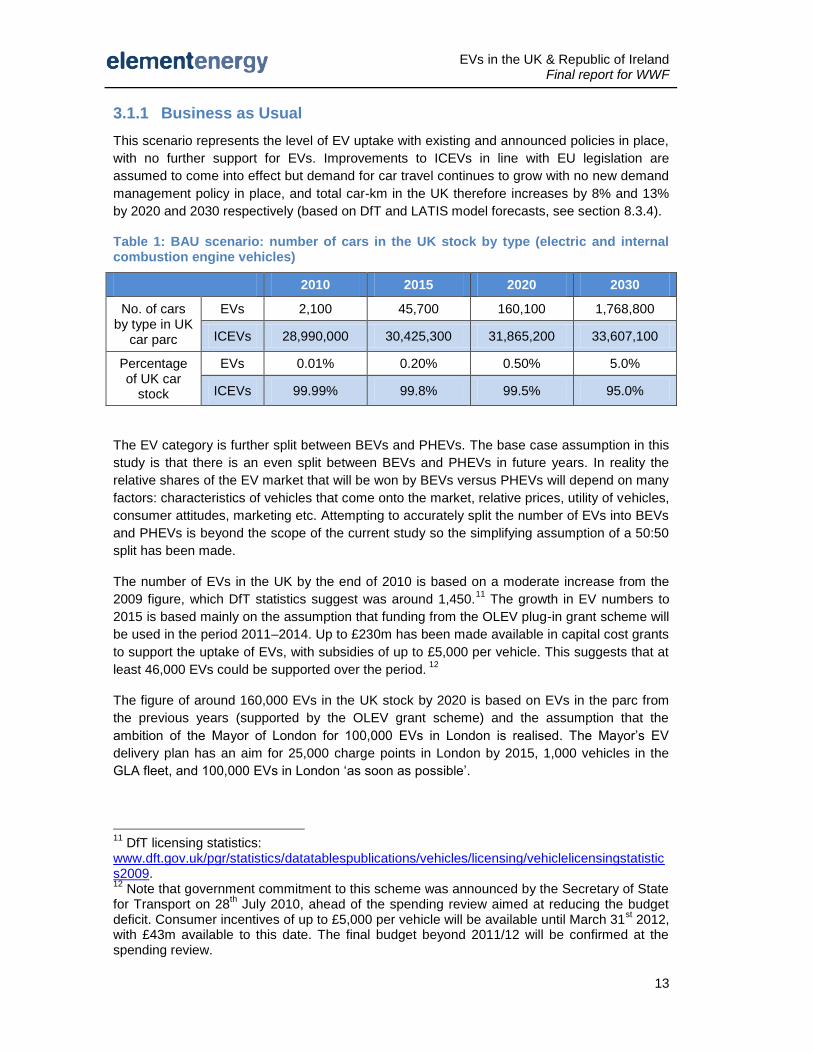
Table 1: BAU scenario: number of cars in the UK stock by type (electric and internal combustion engine vehicles)
2010 2015 2020 2030
No. of cars by type in UK
car parc
EVs 2,100 45,700 160,100 1,768,800
ICEVs 28,990,000 30,425,300 31,865,200 33,607,100
Percentage of UK car
stock
EVs 0.01% 0.20% 0.50% 5.0%
ICEVs 99.99% 99.8% 99.5% 95.0%
The EV category is further split between BEVs and PHEVs. The base case assumption in this
study is that there is an even split between BEVs and PHEVs in future years. In reality the
relative shares of the EV market that will be won by BEVs versus PHEVs will depend on many
factors: characteristics of vehicles that come onto the market, relative prices, utility of vehicles,
consumer attitudes, marketing etc. Attempting to accurately split the number of EVs into BEVs
and PHEVs is beyond the scope of the current study so the simplifying assumption of a 50:50
split has been made.
The number of EVs in the UK by the end of 2010 is based on a moderate increase from the
2009 figure, which DfT statistics suggest was around 1,450.11
The growth in EV numbers to
2015 is based mainly on the assumption that funding from the OLEV plug-in grant scheme will
be used in the period 2011–2014. Up to £230m has been made available in capital cost grants
to support the uptake of EVs, with subsidies of up to £5,000 per vehicle. This suggests that at
least 46,000 EVs could be supported over the period. 12
The figure of around 160,000 EVs in the UK stock by 2020 is based on EVs in the parc from
the previous years (supported by the OLEV grant scheme) and the assumption that the
ambition of the Mayor of London for 100,000 EVs in London is realised. The Mayor’s EV
delivery plan has an aim for 25,000 charge points in London by 2015, 1,000 vehicles in the
GLA fleet, and 100,000 EVs in London ‘as soon as possible’.
11
DfT licensing statistics: www.dft.gov.uk/pgr/statistics/datatablespublications/vehicles/licensing/vehiclelicensingstatistics2009. 12
Note that government commitment to this scheme was announced by the Secretary of State for Transport on 28
th July 2010, ahead of the spending review aimed at reducing the budget
deficit. Consumer incentives of up to £5,000 per vehicle will be available until March 31st 2012,
with £43m available to this date. The final budget beyond 2011/12 will be confirmed at the spending review.
EVs in the UK & Republic of Ireland Final report for WWF
14
Finally, the uptake of EVs by 2030 is based on forward extrapolation from the sales and stock
data of previous years (see section 8.2.4 for further details).
3.1.2 Extended
EV uptake under the Extended scenario is above that of the BAU and would require additional
policy support. The numbers of EVs in the stock in 2015 and 2020 are based on indicator
figures from the Committee on Climate Change.13
The CCC has not published indicators
beyond 2022, so the 2030 EV stock is based on continued growth in market penetration of
EVs through the 2020s.
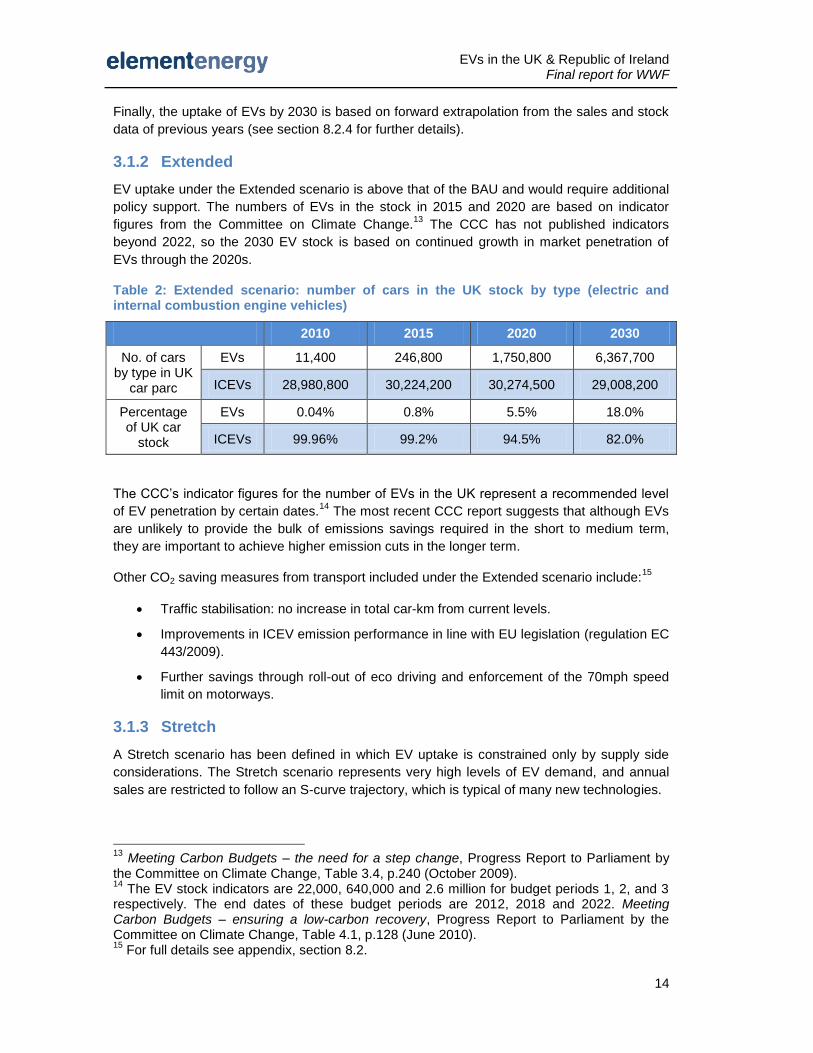
Table 2: Extended scenario: number of cars in the UK stock by type (electric and internal combustion engine vehicles)
2010 2015 2020 2030
No. of cars by type in UK
car parc
EVs 11,400 246,800 1,750,800 6,367,700
ICEVs 28,980,800 30,224,200 30,274,500 29,008,200
Percentage of UK car
stock
EVs 0.04% 0.8% 5.5% 18.0%
ICEVs 99.96% 99.2% 94.5% 82.0%
The CCC’s indicator figures for the number of EVs in the UK represent a recommended level
of EV penetration by certain dates.14
The most recent CCC report suggests that although EVs
are unlikely to provide the bulk of emissions savings required in the short to medium term,
they are important to achieve higher emission cuts in the longer term.
Other CO2 saving measures from transport included under the Extended scenario include:15
Traffic stabilisation: no increase in total car-km from current levels.
Improvements in ICEV emission performance in line with EU legislation (regulation EC
443/2009).
Further savings through roll-out of eco driving and enforcement of the 70mph speed
limit on motorways.
3.1.3 Stretch
A Stretch scenario has been defined in which EV uptake is constrained only by supply side
considerations. The Stretch scenario represents very high levels of EV demand, and annual
sales are restricted to follow an S-curve trajectory, which is typical of many new technologies.
13
Meeting Carbon Budgets – the need for a step change, Progress Report to Parliament by the Committee on Climate Change, Table 3.4, p.240 (October 2009). 14
The EV stock indicators are 22,000, 640,000 and 2.6 million for budget periods 1, 2, and 3 respectively. The end dates of these budget periods are 2012, 2018 and 2022. Meeting Carbon Budgets – ensuring a low-carbon recovery, Progress Report to Parliament by the Committee on Climate Change, Table 4.1, p.128 (June 2010). 15
For full details see appendix, section 8.2.
EVs in the UK & Republic of Ireland Final report for WWF
15
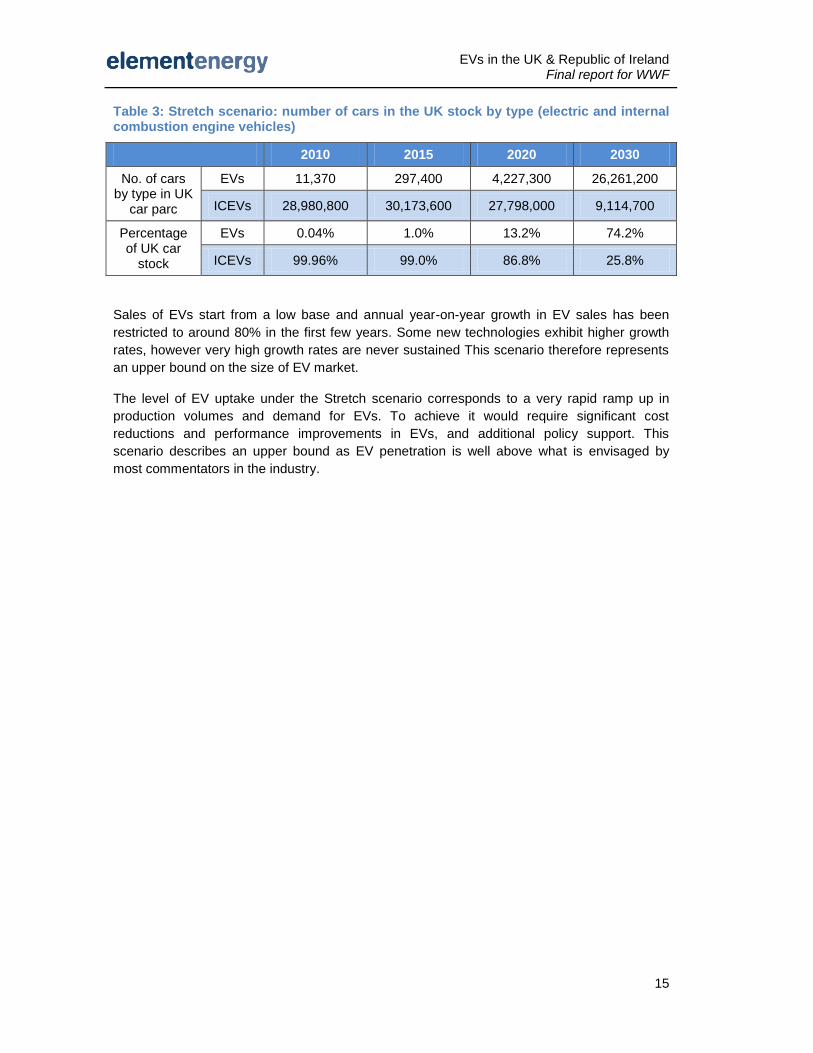
Table 3: Stretch scenario: number of cars in the UK stock by type (electric and internal combustion engine vehicles)
2010 2015 2020 2030
No. of cars by type in UK
car parc
EVs 11,370 297,400 4,227,300 26,261,200
ICEVs 28,980,800 30,173,600 27,798,000 9,114,700
Percentage of UK car
stock
EVs 0.04% 1.0% 13.2% 74.2%
ICEVs 99.96% 99.0% 86.8% 25.8%
Sales of EVs start from a low base and annual year-on-year growth in EV sales has been
restricted to around 80% in the first few years. Some new technologies exhibit higher growth
rates, however very high growth rates are never sustained This scenario therefore represents
an upper bound on the size of EV market.
The level of EV uptake under the Stretch scenario corresponds to a very rapid ramp up in
production volumes and demand for EVs. To achieve it would require significant cost
reductions and performance improvements in EVs, and additional policy support. This
scenario describes an upper bound as EV penetration is well above what is envisaged by
most commentators in the industry.
EVs in the UK & Republic of Ireland Final report for WWF
16
3.2 Greenhouse gas emission reductions16
3.2.1 Key results
EVs provide the greatest CO2 savings when the grid CO2 intensity is low and the
stock of EVs is high. With high market growth rates, the CO2 emission reduction
potential of EVs could begin to emerge in the period 2020–2030.
While benefits of EV deployment aggregate in the longer term, there are two
reasons why action is required in the near term. First, near term deployment is
required to improve the technology, reduce cost and risks, and build market share.
The second factor is the need to plan for widespread EV uptake in the future,
including assessment of infrastructure requirements, which should feed into
electricity infrastructure investment decisions.
To achieve meaningful emissions reductions in the next 10–15 years, two
elements are vital. The first is compliance with EU-legislated new car emission
levels for all new cars added to the stock. The second is achieving stabilisation or
reduction in overall demand for car travel.
These measures alone could see emissions from cars fall by 27% in 2020 and by
48% in 2030.
Stabilisation / reduction of total car-km, and therefore decoupling of economic and
traffic growth is almost certainly required if deep CO2 cuts are to be realised.
Successful behaviour modification will be challenging as until now almost without
exception traffic growth has followed economic growth.
16
All emissions reductions are relative to 1990 levels.
EVs in the UK & Republic of Ireland Final report for WWF
17
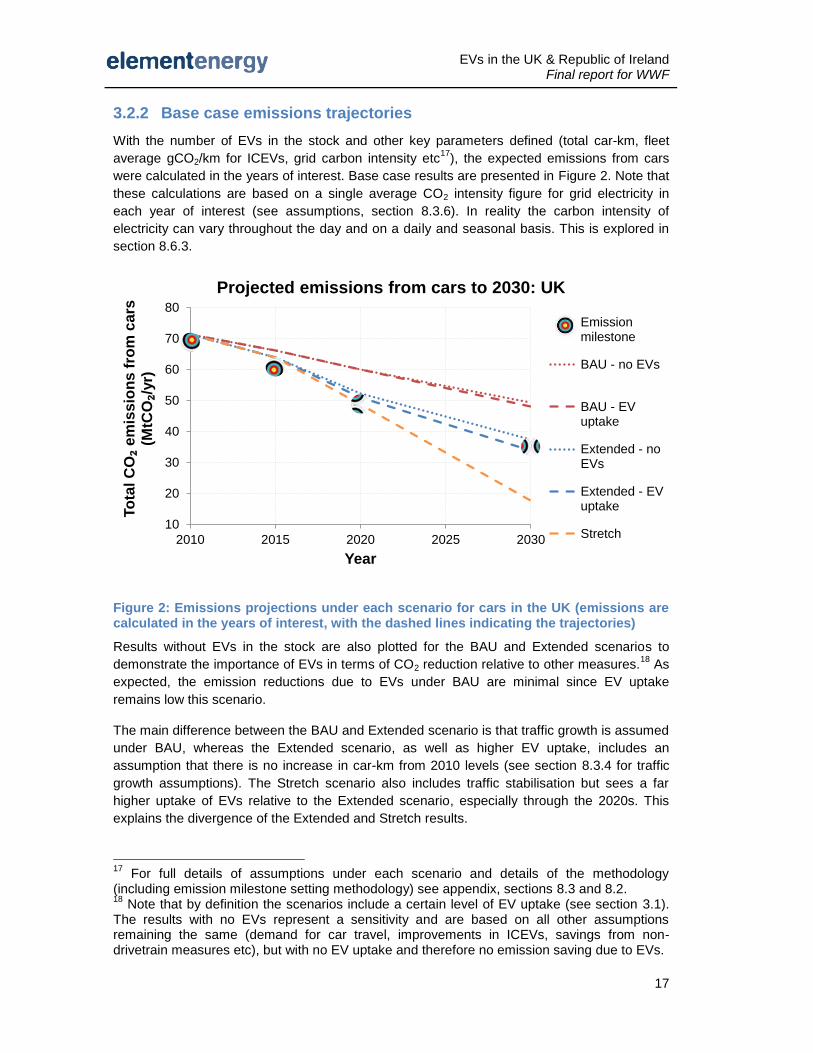
3.2.2 Base case emissions trajectories
With the number of EVs in the stock and other key parameters defined (total car-km, fleet
average gCO2/km for ICEVs, grid carbon intensity etc17
), the expected emissions from cars
were calculated in the years of interest. Base case results are presented in Figure 2. Note that
these calculations are based on a single average CO2 intensity figure for grid electricity in
each year of interest (see assumptions, section 8.3.6). In reality the carbon intensity of
electricity can vary throughout the day and on a daily and seasonal basis. This is explored in
section 8.6.3.
Figure 2: Emissions projections under each scenario for cars in the UK (emissions are calculated in the years of interest, with the dashed lines indicating the trajectories)
Results without EVs in the stock are also plotted for the BAU and Extended scenarios to
demonstrate the importance of EVs in terms of CO2 reduction relative to other measures.18
As
expected, the emission reductions due to EVs under BAU are minimal since EV uptake
remains low this scenario.
The main difference between the BAU and Extended scenario is that traffic growth is assumed
under BAU, whereas the Extended scenario, as well as higher EV uptake, includes an
assumption that there is no increase in car-km from 2010 levels (see section 8.3.4 for traffic
growth assumptions). The Stretch scenario also includes traffic stabilisation but sees a far
higher uptake of EVs relative to the Extended scenario, especially through the 2020s. This
explains the divergence of the Extended and Stretch results.
17
For full details of assumptions under each scenario and details of the methodology (including emission milestone setting methodology) see appendix, sections 8.3 and 8.2. 18
Note that by definition the scenarios include a certain level of EV uptake (see section 3.1). The results with no EVs represent a sensitivity and are based on all other assumptions remaining the same (demand for car travel, improvements in ICEVs, savings from non-drivetrain measures etc), but with no EV uptake and therefore no emission saving due to EVs.
10
20
30
40
50
60
70
80
2010 2015 2020 2025 2030
To
tal C
O₂
em
iss
ion
s f
rom
ca
rs
(MtC
O₂/
yr)
Year
Projected emissions from cars to 2030: UK
Emissionmilestone
BAU - no EVs
BAU - EVuptake
Extended - noEVs
Extended - EVuptake
Stretch
EVs in the UK & Republic of Ireland Final report for WWF
18
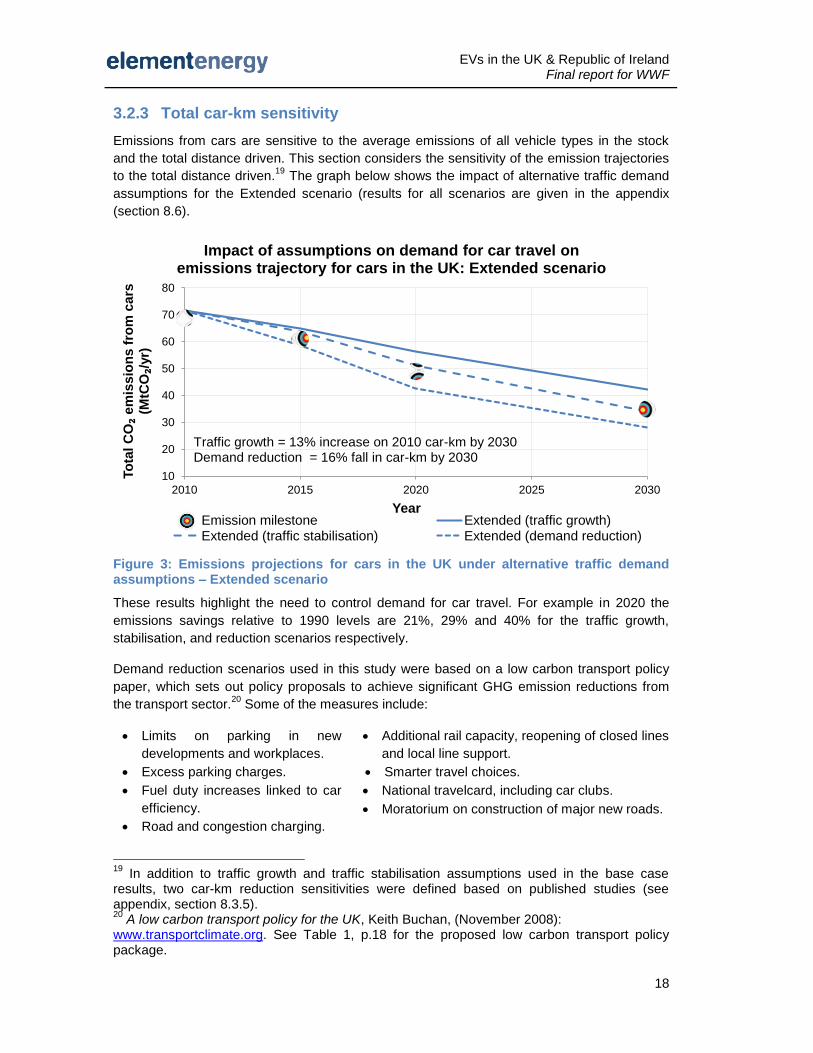
3.2.3 Total car-km sensitivity
Emissions from cars are sensitive to the average emissions of all vehicle types in the stock
and the total distance driven. This section considers the sensitivity of the emission trajectories
to the total distance driven.19
The graph below shows the impact of alternative traffic demand
assumptions for the Extended scenario (results for all scenarios are given in the appendix
(section 8.6).
Figure 3: Emissions projections for cars in the UK under alternative traffic demand assumptions – Extended scenario
These results highlight the need to control demand for car travel. For example in 2020 the
emissions savings relative to 1990 levels are 21%, 29% and 40% for the traffic growth,
stabilisation, and reduction scenarios respectively.
Demand reduction scenarios used in this study were based on a low carbon transport policy
paper, which sets out policy proposals to achieve significant GHG emission reductions from
the transport sector.20
Some of the measures include:
Limits on parking in new
developments and workplaces.
Excess parking charges.
Fuel duty increases linked to car
efficiency.
Road and congestion charging.
Additional rail capacity, reopening of closed lines
and local line support.
Smarter travel choices.
National travelcard, including car clubs.
Moratorium on construction of major new roads.
19
In addition to traffic growth and traffic stabilisation assumptions used in the base case results, two car-km reduction sensitivities were defined based on published studies (see appendix, section 8.3.5). 20
A low carbon transport policy for the UK, Keith Buchan, (November 2008): www.transportclimate.org. See Table 1, p.18 for the proposed low carbon transport policy package.
10
20
30
40
50
60
70
80
2010 2015 2020 2025 2030
To
tal C
O₂
em
issio
ns f
rom
cars
(M
tCO₂/
yr)
Year
Impact of assumptions on demand for car travel on emissions trajectory for cars in the UK: Extended scenario
Emission milestone Extended (traffic growth)Extended (traffic stabilisation) Extended (demand reduction)
Traffic growth = 13% increase on 2010 car-km by 2030 Demand reduction = 16% fall in car-km by 2030
EVs in the UK & Republic of Ireland Final report for WWF
19
Decoupling traffic growth from economic growth means reversing historical trends and will
require changes in consumer behaviour. This represents a significant challenge and a range
of policies such as those mentioned above will be needed to drive such change.
3.3 Impact on demand for oil
3.3.1 Key results
A reduction in total fuel demands for the passenger car sector is expected under
BAU due to ICEV efficiency improvements occurring sufficiently rapidly to offset
additional demand for car travel.
Significant fuel demand reductions are expected under the Extended and Stretch
scenarios due to a combination of traffic stabilisation, improvements in ICEV
efficiency, and EV uptake. For example, demand for petrol and diesel falls by
around 30% by 2020 under the Extended scenario (and 55% by 2030) relative to
2010 levels.
Under the Extended scenario EVs are responsible for about 11% of the total fuel
saving in 2030. This increases to 39% in 2030 under the Stretch scenario.
Electrification of transport will be important in reducing demand for petroleum fuels
in the long term. However, the contribution EVs can make to reducing demand in
the short to medium term is small relative to the impact of improvements in
incumbent vehicles and demand management measures.
3.3.2 Fuel demands and savings due to EVs
Context
A major benefit of electrification of transport is the diversity of fuel supply options available
when running vehicles on electricity. The benefits of EVs in terms of emission reduction are
greatest when the electricity used to charge them comes from low carbon sources such as
renewable power. The transport sector is currently more dependent on one energy source
than any other sector (see for example the WWF report Plugged-In: The End Of The Oil
Age).21
EVs offer the advantage of reducing reliance on oil imports and therefore reducing the
UK’s trade deficit and improving energy security. This section considers the extent to which
reliance on oil may be reduced under each scenario of EV uptake by examining the reduction
in demand for oil-based transport fuels. Note that the analysis below considers pump-to-tank
fuel use only, no lifecycle analysis of fuel use has been undertaken in this study.
The flow chart below provides context to the results that follow by showing the overall flow of
petroleum products, from crude oil production through to end use.
21
For a summary of this report refer to section 8.1.6.
EVs in the UK & Republic of Ireland Final report for WWF
20
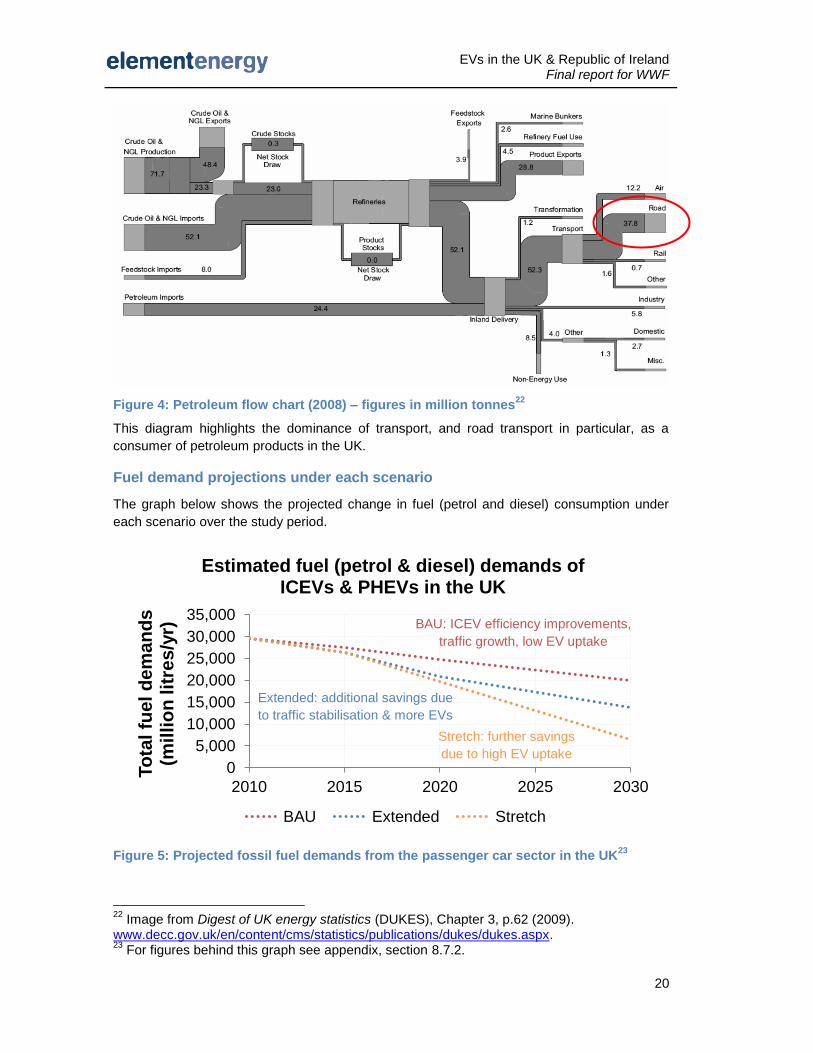
Figure 4: Petroleum flow chart (2008) – figures in million tonnes22
This diagram highlights the dominance of transport, and road transport in particular, as a
consumer of petroleum products in the UK.
Fuel demand projections under each scenario
The graph below shows the projected change in fuel (petrol and diesel) consumption under
each scenario over the study period.
Figure 5: Projected fossil fuel demands from the passenger car sector in the UK23
22
Image from Digest of UK energy statistics (DUKES), Chapter 3, p.62 (2009). www.decc.gov.uk/en/content/cms/statistics/publications/dukes/dukes.aspx. 23
For figures behind this graph see appendix, section 8.7.2.
0
5,000
10,000
15,000
20,000
25,000
30,000
35,000
2010 2015 2020 2025 2030
To
tal fu
el d
em
an
ds
(mil
lio
n lit
res/y
r)
Estimated fuel (petrol & diesel) demands of ICEVs & PHEVs in the UK
BAU Extended Stretch
BAU: ICEV efficiency improvements,
traffic growth, low EV uptake
Extended: additional savings due
to traffic stabilisation & more EVs
Stretch: further savings
due to high EV uptake
EVs in the UK & Republic of Ireland Final report for WWF
21
The overall trajectories mirror those for CO2 emissions shown in Figure 2 in the previous
section. This is to be expected given the direct link between fuel consumption and carbon
emissions. These results show that reductions in overall fuel demands are expected in each
scenario, even under BAU, which includes an increase total car-km and relatively low EV
uptake. This is due to the assumptions on efficiency improvements of ICEVs.
The results above suggest that improvements to the efficiency of ICEVs, and limiting (or
eliminating) increases in demand for car travel, are the most important factors in reducing
demands for fossil fuel in the short to medium term. EVs could significantly contribute to
reduced fuel demands if they achieve high market penetration (e.g. Stretch scenario in 2030)
in combination with no growth in demand for car travel.
Another way of considering future energy demands for car transport is to calculate the energy
requirements of all vehicles of each type and express the results in a common unit. The graph
below shows the expected change in total energy consumption for the passenger car market
under each scenario, split by energy in petroleum fuel (petrol and diesel) and electricity
consumed by EVs.
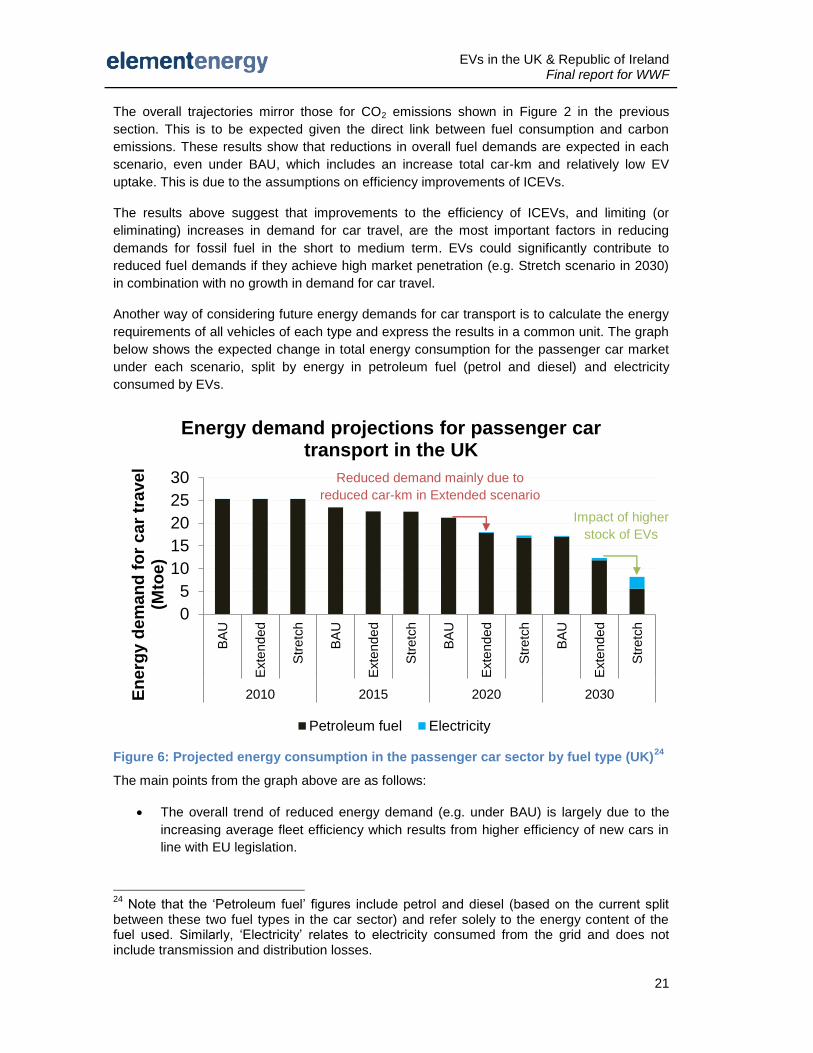
Figure 6: Projected energy consumption in the passenger car sector by fuel type (UK)24
The main points from the graph above are as follows:
The overall trend of reduced energy demand (e.g. under BAU) is largely due to the
increasing average fleet efficiency which results from higher efficiency of new cars in
line with EU legislation.
24
Note that the ‘Petroleum fuel’ figures include petrol and diesel (based on the current split between these two fuel types in the car sector) and refer solely to the energy content of the fuel used. Similarly, ‘Electricity’ relates to electricity consumed from the grid and does not include transmission and distribution losses.
0
5
10
15
20
25
30
BA
U
Exte
nded
Str
etc
h
BA
U
Exte
nded
Str
etc
h
BA
U
Exte
nded
Str
etc
h
BA
U
Exte
nded
Str
etc
h
2010 2015 2020 2030En
erg
y d
em
an
d f
or
car
travel
(Mto
e)
Energy demand projections for passenger car transport in the UK
Petroleum fuel Electricity
Reduced demand mainly due to
reduced car-km in Extended scenario
Impact of higher
stock of EVs

EVs in the UK & Republic of Ireland Final report for WWF
22
The difference in total energy demand in 2020 between the BAU and Extended
scenarios is partly due to the higher stock of EVs in the Extended scenario (5.5%
rather than 0.5%), but is mainly a result of lower demand for car travel (total car-km
are 9% lower in 2020 under the Extended scenario).
In 2030 EVs account for 18% and 74% of the car parc under the Extended and Stretch
scenarios respectively. This accounts for the fall in total energy demand between
these two scenarios in 2030.
With EVs representing around three-quarters of the stock in 2030, 60% of all car-km
are done by EVs in electric mode. However, electricity demands account for only a
third of total energy demands for car transport. This is a result of the higher efficiency
of EVs relative to ICEVs.
EVs in the UK & Republic of Ireland Final report for WWF
23
4 Recharging infrastructure requirements
4.1 Driving pattern analysis
4.1.1 Key results
The driving patterns of car drivers in Great Britain show that a high proportion of
trips are relatively short (e.g. around three quarters of all trips are less than 16km),
and that most car drivers rarely exceed 100km/day (e.g. over three quarters did
not exceed 100km on any day of a seven day travel diary week).
However, consumers currently place a high value on vehicles with high range,
even though the full range is rarely required. This suggests that initially pure BEVs
are more likely to be taken up by households with a second (non-BEV) car.
Frequent journey types dominated by short trips include driving children to school,
shopping, and other personal business, with 80–90% or more of trips of these
types less than 16km (10 miles). EVs are well suited to such trip types.
Commuting is the most common trip purpose and commuting journeys account for
around a quarter of total car-km in Great Britain. Workplace charge points will
increase the potential market for BEVs by alleviating commuters’ range anxiety.
Furthermore, the economic case for workplace charging is stronger than for public
charge points as a reasonably high utilisation could be expected.
4.1.2 National Travel Survey analysis: highlights
The National Travel Survey (NTS) is a continuous survey conducted by DfT, designed to
monitor long-term trends in travel patterns. The survey is limited to Great Britain only, and
provides detailed information on households, vehicles owned by participating households,
individuals, and trips undertaken by all participants.25
Analysis of NTS data provides insight into the travel patterns of the residents of Great Britain,
and an understanding of the habits of car drivers can be gained by considering appropriate
sub-sets of data. Results presented below relate to analyses at the GB level. A selection of
disaggregated results (by country) is included in the appendix, section 8.5.
The following graph shows the proportion of trips in given distance bands by trip purpose for
the eight most common trip purposes undertaken by car drivers in the sample analysed.
25
Full details of the survey can be found in technical reports published on the Department for Transport website: http://www.dft.gov.uk/pgr/statistics/datatablespublications/personal/methodology/ntstechreports/
EVs in the UK & Republic of Ireland Final report for WWF
24
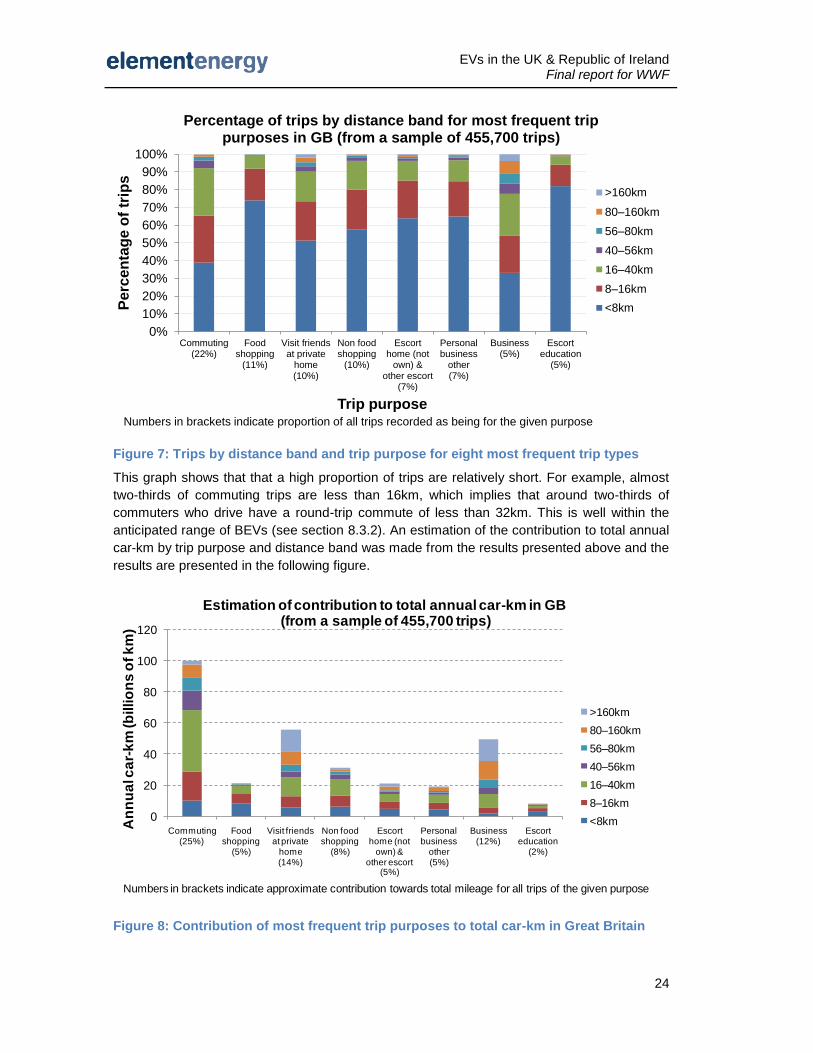
Figure 7: Trips by distance band and trip purpose for eight most frequent trip types
This graph shows that that a high proportion of trips are relatively short. For example, almost
two-thirds of commuting trips are less than 16km, which implies that around two-thirds of
commuters who drive have a round-trip commute of less than 32km. This is well within the
anticipated range of BEVs (see section 8.3.2). An estimation of the contribution to total annual
car-km by trip purpose and distance band was made from the results presented above and the
results are presented in the following figure.
Figure 8: Contribution of most frequent trip purposes to total car-km in Great Britain
0%
10%
20%
30%
40%
50%
60%
70%
80%
90%
100%
Commuting(22%)
Foodshopping
(11%)
Visit friendsat private
home(10%)
Non foodshopping
(10%)
Escorthome (not
own) &other escort
(7%)
Personalbusiness
other(7%)
Business(5%)
Escorteducation
(5%)
Perc
en
tag
e o
f tr
ips
Trip purpose
Percentage of trips by distance band for most frequent trip purposes in GB (from a sample of 455,700 trips)
>160km
80–160km
56–80km
40–56km
16–40km
8–16km
<8km
Numbers in brackets indicate proportion of all trips recorded as being for the given purpose
0
20
40
60
80
100
120
Commuting(25%)
Food shopping
(5%)
Visit friends at private
home(14%)
Non food shopping
(8%)
Escort home (not
own) & other escort
(5%)
Personal business
other(5%)
Business(12%)
Escort education
(2%)
An
nu
al c
ar-
km
(b
illio
ns
of k
m)
Estimation of contribution to total annual car-km in GB(from a sample of 455,700 trips)
>160km
80–160km
56–80km
40–56km
16–40km
8–16km
<8km
Numbers in brackets indicate approximate contribution towards total mileage for all trips of the given purpose
EVs in the UK & Republic of Ireland Final report for WWF
25
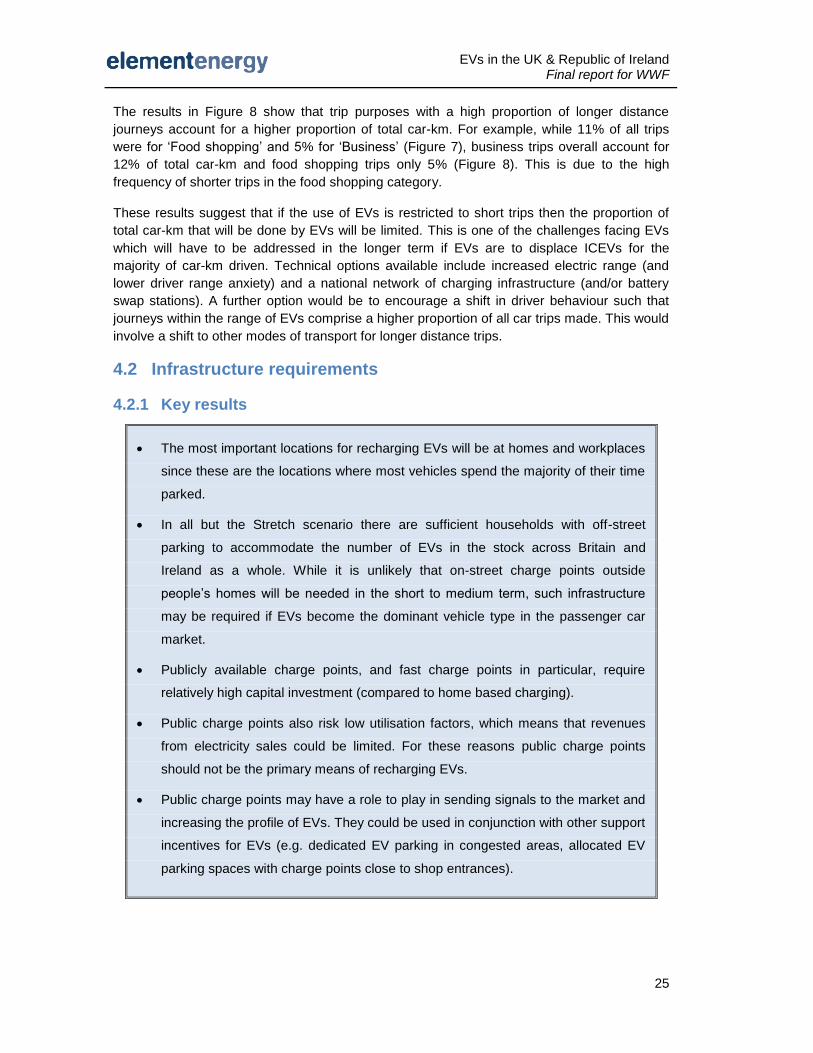
The results in Figure 8 show that trip purposes with a high proportion of longer distance
journeys account for a higher proportion of total car-km. For example, while 11% of all trips
were for ‘Food shopping’ and 5% for ‘Business’ (Figure 7), business trips overall account for
12% of total car-km and food shopping trips only 5% (Figure 8). This is due to the high
frequency of shorter trips in the food shopping category.
These results suggest that if the use of EVs is restricted to short trips then the proportion of
total car-km that will be done by EVs will be limited. This is one of the challenges facing EVs
which will have to be addressed in the longer term if EVs are to displace ICEVs for the
majority of car-km driven. Technical options available include increased electric range (and
lower driver range anxiety) and a national network of charging infrastructure (and/or battery
swap stations). A further option would be to encourage a shift in driver behaviour such that
journeys within the range of EVs comprise a higher proportion of all car trips made. This would
involve a shift to other modes of transport for longer distance trips.
4.2 Infrastructure requirements
4.2.1 Key results
The most important locations for recharging EVs will be at homes and workplaces
since these are the locations where most vehicles spend the majority of their time
parked.
In all but the Stretch scenario there are sufficient households with off-street
parking to accommodate the number of EVs in the stock across Britain and
Ireland as a whole. While it is unlikely that on-street charge points outside
people’s homes will be needed in the short to medium term, such infrastructure
may be required if EVs become the dominant vehicle type in the passenger car
market.
Publicly available charge points, and fast charge points in particular, require
relatively high capital investment (compared to home based charging).
Public charge points also risk low utilisation factors, which means that revenues
from electricity sales could be limited. For these reasons public charge points
should not be the primary means of recharging EVs.
Public charge points may have a role to play in sending signals to the market and
increasing the profile of EVs. They could be used in conjunction with other support
incentives for EVs (e.g. dedicated EV parking in congested areas, allocated EV
parking spaces with charge points close to shop entrances).
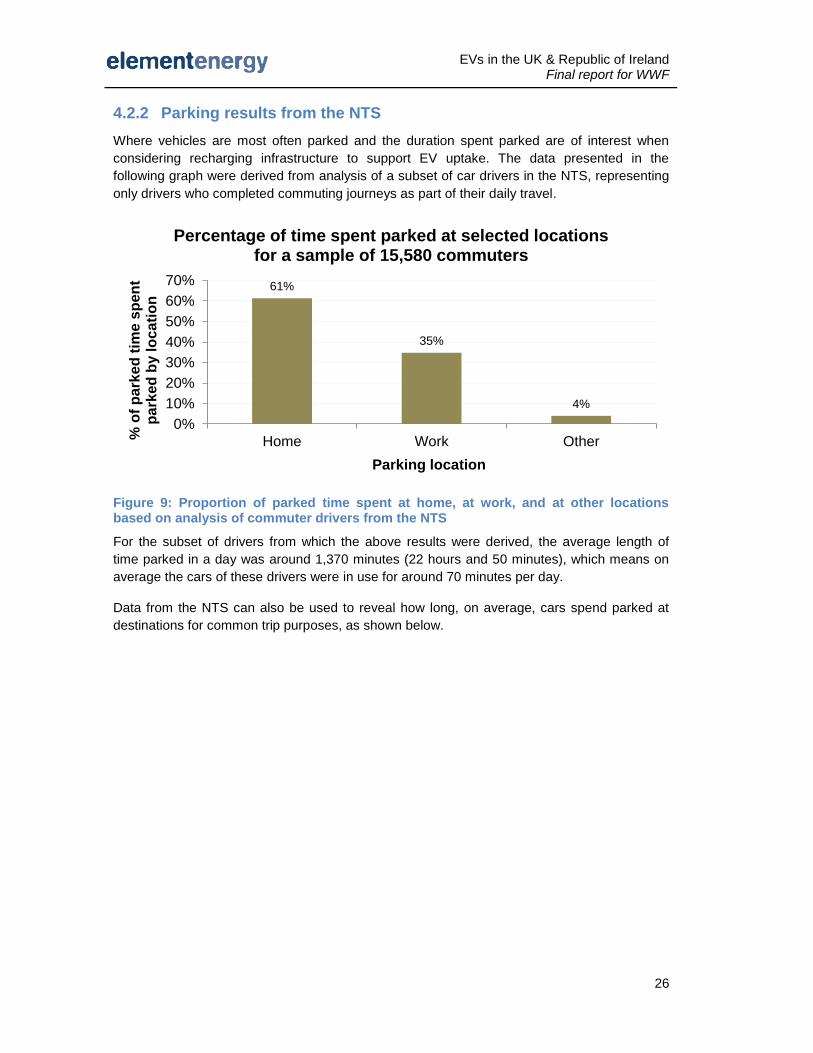
EVs in the UK & Republic of Ireland Final report for WWF
26
4.2.2 Parking results from the NTS
Where vehicles are most often parked and the duration spent parked are of interest when
considering recharging infrastructure to support EV uptake. The data presented in the
following graph were derived from analysis of a subset of car drivers in the NTS, representing
only drivers who completed commuting journeys as part of their daily travel.
Figure 9: Proportion of parked time spent at home, at work, and at other locations based on analysis of commuter drivers from the NTS
For the subset of drivers from which the above results were derived, the average length of
time parked in a day was around 1,370 minutes (22 hours and 50 minutes), which means on
average the cars of these drivers were in use for around 70 minutes per day.
Data from the NTS can also be used to reveal how long, on average, cars spend parked at
destinations for common trip purposes, as shown below.
61%
35%
4%
0%
10%
20%
30%
40%
50%
60%
70%
Home Work Other% o
f p
ark
ed
tim
e s
pen
t p
ark
ed
by l
oca
tio
n
Parking location
Percentage of time spent parked at selected locations for a sample of 15,580 commuters
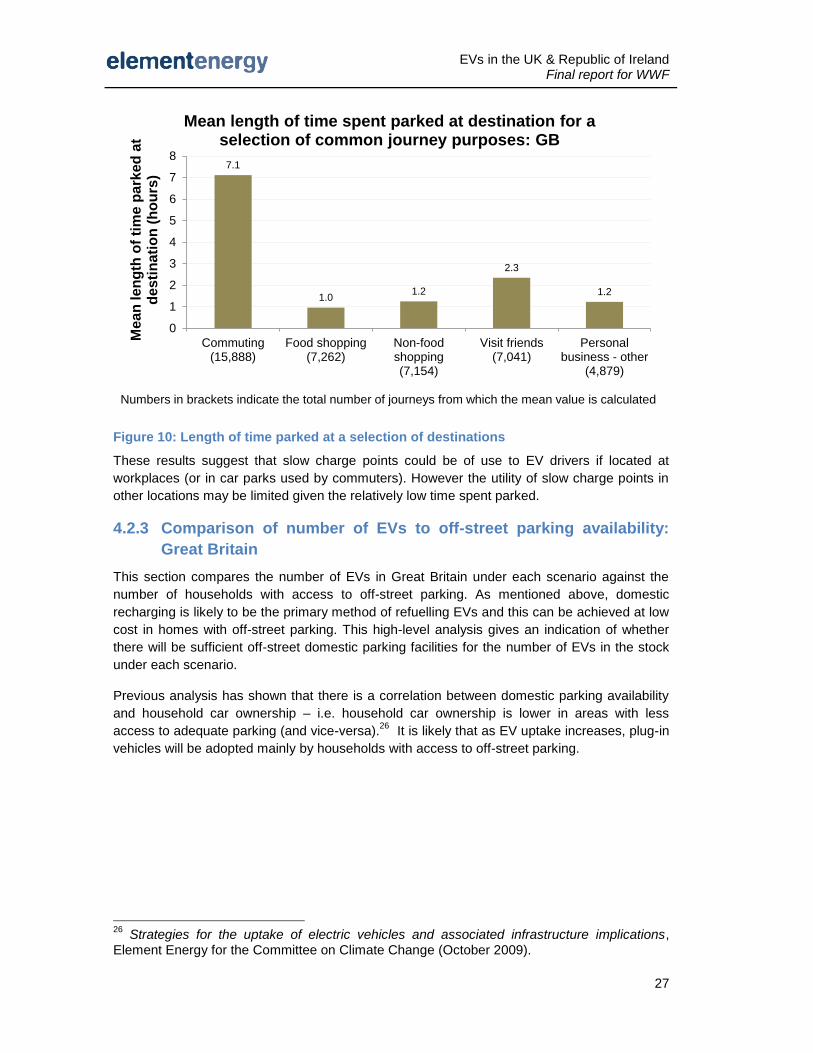
EVs in the UK & Republic of Ireland Final report for WWF
27
Figure 10: Length of time parked at a selection of destinations
These results suggest that slow charge points could be of use to EV drivers if located at
workplaces (or in car parks used by commuters). However the utility of slow charge points in
other locations may be limited given the relatively low time spent parked.
4.2.3 Comparison of number of EVs to off-street parking availability:
Great Britain
This section compares the number of EVs in Great Britain under each scenario against the
number of households with access to off-street parking. As mentioned above, domestic
recharging is likely to be the primary method of refuelling EVs and this can be achieved at low
cost in homes with off-street parking. This high-level analysis gives an indication of whether
there will be sufficient off-street domestic parking facilities for the number of EVs in the stock
under each scenario.
Previous analysis has shown that there is a correlation between domestic parking availability
and household car ownership – i.e. household car ownership is lower in areas with less
access to adequate parking (and vice-versa).26
It is likely that as EV uptake increases, plug-in
vehicles will be adopted mainly by households with access to off-street parking.
26
Strategies for the uptake of electric vehicles and associated infrastructure implications, Element Energy for the Committee on Climate Change (October 2009).
7.1
1.01.2
2.3
1.2
0
1
2
3
4
5
6
7
8
Commuting(15,888)
Food shopping(7,262)
Non-foodshopping(7,154)
Visit friends(7,041)
Personalbusiness - other
(4,879)
Me
an
le
ng
th o
f ti
me
pa
rke
d a
t d
es
tin
ati
on
(h
ou
rs)
Mean length of time spent parked at destination for a selection of common journey purposes: GB
Numbers in brackets indicate the total number of journeys from which the mean value is calculated
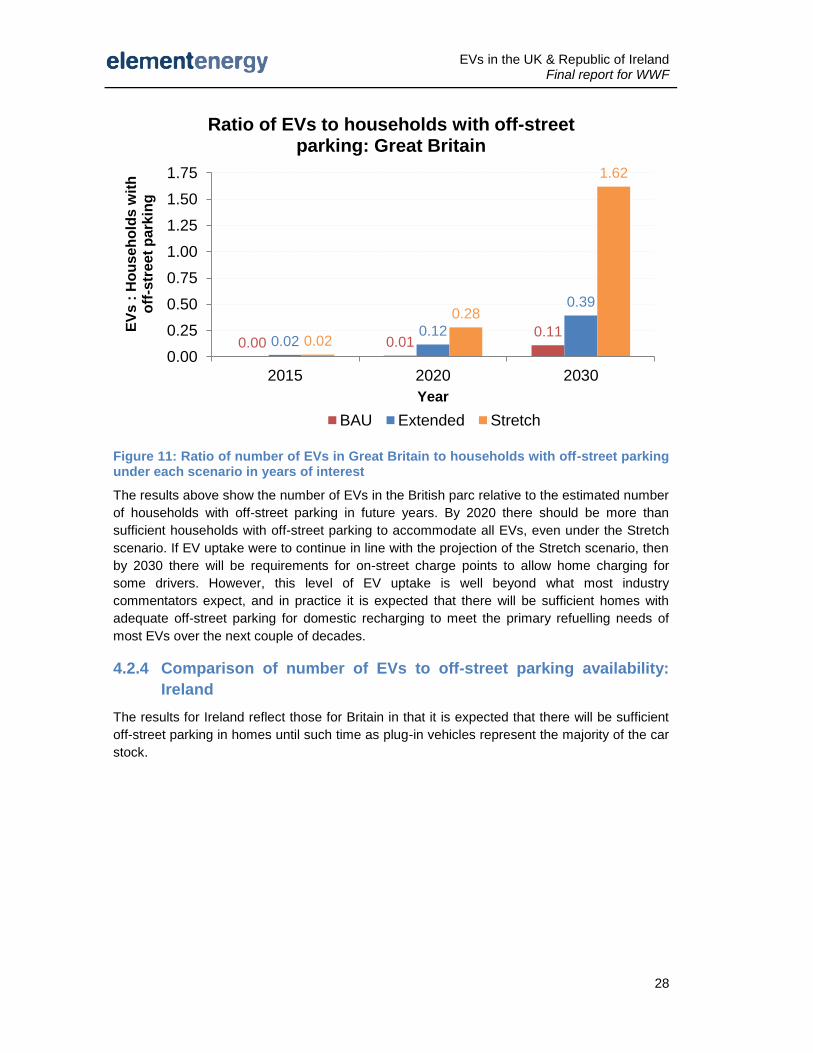
EVs in the UK & Republic of Ireland Final report for WWF
28
Figure 11: Ratio of number of EVs in Great Britain to households with off-street parking under each scenario in years of interest
The results above show the number of EVs in the British parc relative to the estimated number
of households with off-street parking in future years. By 2020 there should be more than
sufficient households with off-street parking to accommodate all EVs, even under the Stretch
scenario. If EV uptake were to continue in line with the projection of the Stretch scenario, then
by 2030 there will be requirements for on-street charge points to allow home charging for
some drivers. However, this level of EV uptake is well beyond what most industry
commentators expect, and in practice it is expected that there will be sufficient homes with
adequate off-street parking for domestic recharging to meet the primary refuelling needs of
most EVs over the next couple of decades.
4.2.4 Comparison of number of EVs to off-street parking availability:
Ireland
The results for Ireland reflect those for Britain in that it is expected that there will be sufficient
off-street parking in homes until such time as plug-in vehicles represent the majority of the car
stock.
0.00 0.010.11
0.020.12
0.39
0.02
0.28
1.62
0.00
0.25
0.50
0.75
1.00
1.25
1.50
1.75
2015 2020 2030
EV
s :
Ho
us
eh
old
s w
ith
off
-str
eet
park
ing
Year
Ratio of EVs to households with off-street parking: Great Britain
BAU Extended Stretch
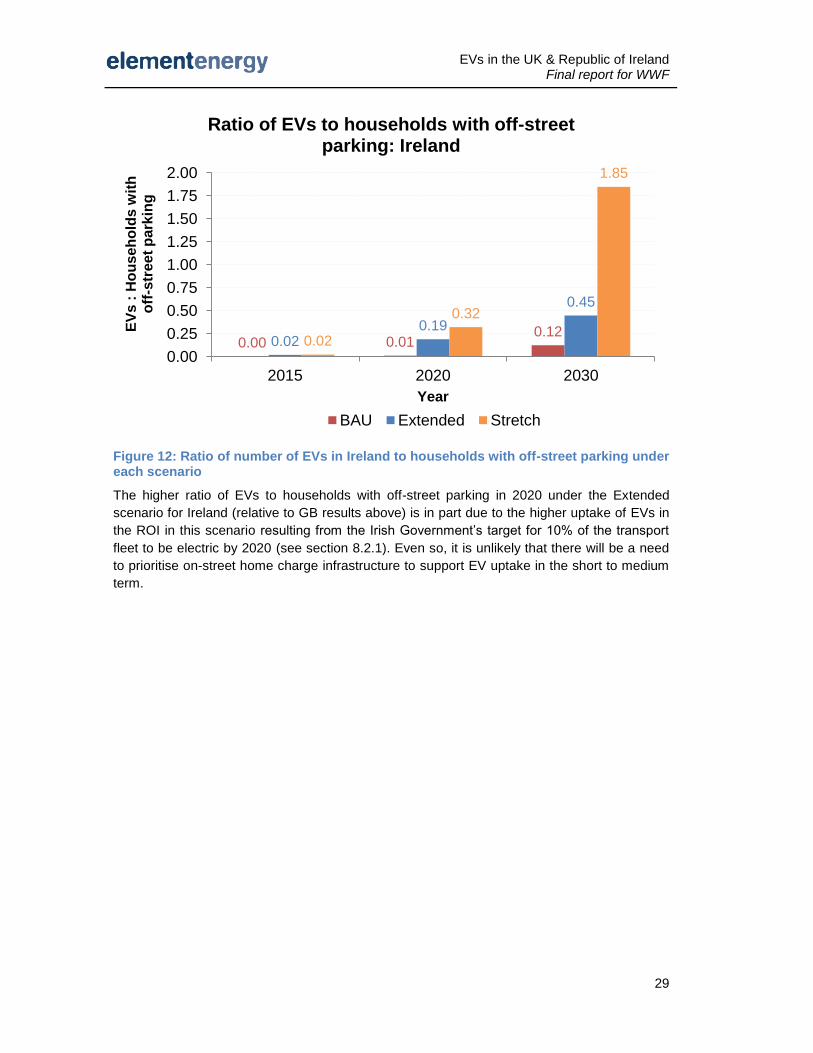
EVs in the UK & Republic of Ireland Final report for WWF
29
Figure 12: Ratio of number of EVs in Ireland to households with off-street parking under each scenario
The higher ratio of EVs to households with off-street parking in 2020 under the Extended
scenario for Ireland (relative to GB results above) is in part due to the higher uptake of EVs in
the ROI in this scenario resulting from the Irish Government’s target for 10% of the transport
fleet to be electric by 2020 (see section 8.2.1). Even so, it is unlikely that there will be a need
to prioritise on-street home charge infrastructure to support EV uptake in the short to medium
term.
0.00 0.010.12
0.020.19
0.45
0.02
0.32
1.85
0.00
0.25
0.50
0.75
1.00
1.25
1.50
1.75
2.00
2015 2020 2030
EV
s :
Ho
us
eh
old
s w
ith
off
-str
eet
park
ing
Year
Ratio of EVs to households with off-street parking: Ireland
BAU Extended Stretch
EVs in the UK & Republic of Ireland Final report for WWF
30
5 Grid impacts
5.1 Overview
Electrification of transport offers advantages in terms of higher efficiency of energy use
(inherently more efficient drivetrain), emissions reductions, and greater fuel flexibility, i.e.
electricity can be produced from various sources, whereas petrol and diesel products are all oil
derivatives. Plug-in electric vehicles will be recharged from the national grid, which means that
the impacts on the electricity grid must be considered when modelling EV uptake scenarios.
There are two main issues to consider. First, what the additional annual electricity demands
due to EVs will be and second, how EVs might affect and balance the peak electricity
demands. These questions should be considered in the broader context of efforts to reduce
CO2 emissions in other sectors also relying in part on increased energy from a decarbonised
electricity grid (e.g. promotion of high efficiency electric heating (heat pumps) for the domestic
housing sector).
It is important to distinguish between the generation and the distribution systems. Generation
refers to the generating plants that produce electricity and total capacity in the UK in 2009/10
was around 82.6GW, compared to a winter peak demand of around 59GW.27
Simultaneous
demands on the grid can add to peak loads and generation capacity must be planned
accordingly. The electricity distribution system consists of high voltage electricity transmission
(the National Grid) from generating plants to substations located close to population centres
and local distribution networks from substations to individual buildings.28
Localised peaks in
demand for power can have an impact on local infrastructure such as transformers, so effects
should be considered both at the national and at the local level.
5.2 Additional loads from EVs
5.2.1 Key results
Additional average annual electricity demands from EVs do not exceed around
1.5% of total forecast electricity demands in 2020 in any of the scenarios
considered in Britain or Ireland.
The maximum additional annual demand due to EVs occurs in 2030 under the
Stretch scenario. Even in this case, with EVs representing three-quarters of the
total car stock, the additional demands are less than 10% of forecast electricity
demand for all end uses.29
27
Data from National Grid Seven Year Statement: www.nationalgrid.com/uk/Electricity/SYS/current/. 28
The National Grid in the UK for bulk electricity transfer includes grids at 400kV, 275kV, and 132kV. Main substations step the voltage down from 132kV to 33kV or 11kV and secondary substations are used for the final step-down to 415V for distribution to buildings. 29
See section 8.3.6 for assumptions on electricity demand forecasts.
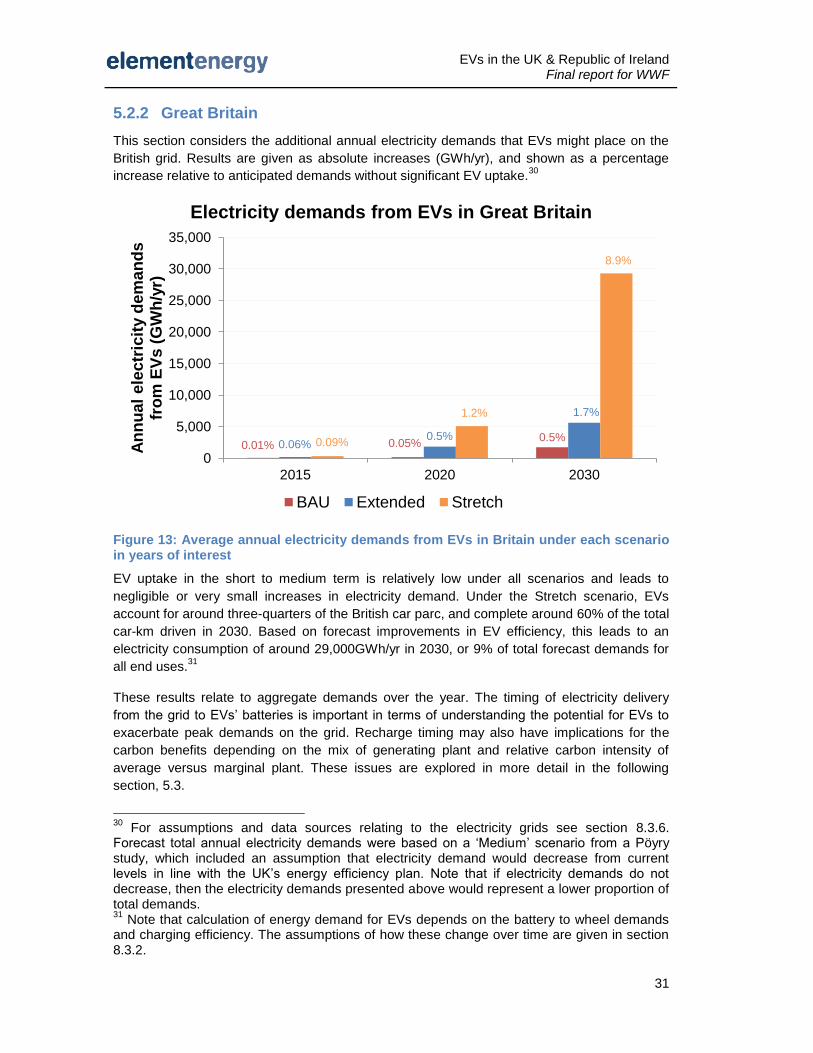
EVs in the UK & Republic of Ireland Final report for WWF
31
5.2.2 Great Britain
This section considers the additional annual electricity demands that EVs might place on the
British grid. Results are given as absolute increases (GWh/yr), and shown as a percentage
increase relative to anticipated demands without significant EV uptake.30
Figure 13: Average annual electricity demands from EVs in Britain under each scenario in years of interest
EV uptake in the short to medium term is relatively low under all scenarios and leads to
negligible or very small increases in electricity demand. Under the Stretch scenario, EVs
account for around three-quarters of the British car parc, and complete around 60% of the total
car-km driven in 2030. Based on forecast improvements in EV efficiency, this leads to an
electricity consumption of around 29,000GWh/yr in 2030, or 9% of total forecast demands for
all end uses.31
These results relate to aggregate demands over the year. The timing of electricity delivery
from the grid to EVs’ batteries is important in terms of understanding the potential for EVs to
exacerbate peak demands on the grid. Recharge timing may also have implications for the
carbon benefits depending on the mix of generating plant and relative carbon intensity of
average versus marginal plant. These issues are explored in more detail in the following
section, 5.3.
30
For assumptions and data sources relating to the electricity grids see section 8.3.6. Forecast total annual electricity demands were based on a ‘Medium’ scenario from a Pöyry study, which included an assumption that electricity demand would decrease from current levels in line with the UK’s energy efficiency plan. Note that if electricity demands do not decrease, then the electricity demands presented above would represent a lower proportion of total demands. 31
Note that calculation of energy demand for EVs depends on the battery to wheel demands and charging efficiency. The assumptions of how these change over time are given in section 8.3.2.
0
5,000
10,000
15,000
20,000
25,000
30,000
35,000
2015 2020 2030
An
nu
al
ele
ctr
icit
y d
em
an
ds
fro
m E
Vs (
GW
h/y
r)
Electricity demands from EVs in Great Britain
BAU Extended Stretch
0.01% 0.06% 0.09% 0.05%0.5%
1.2%
0.5%
1.7%
8.9%
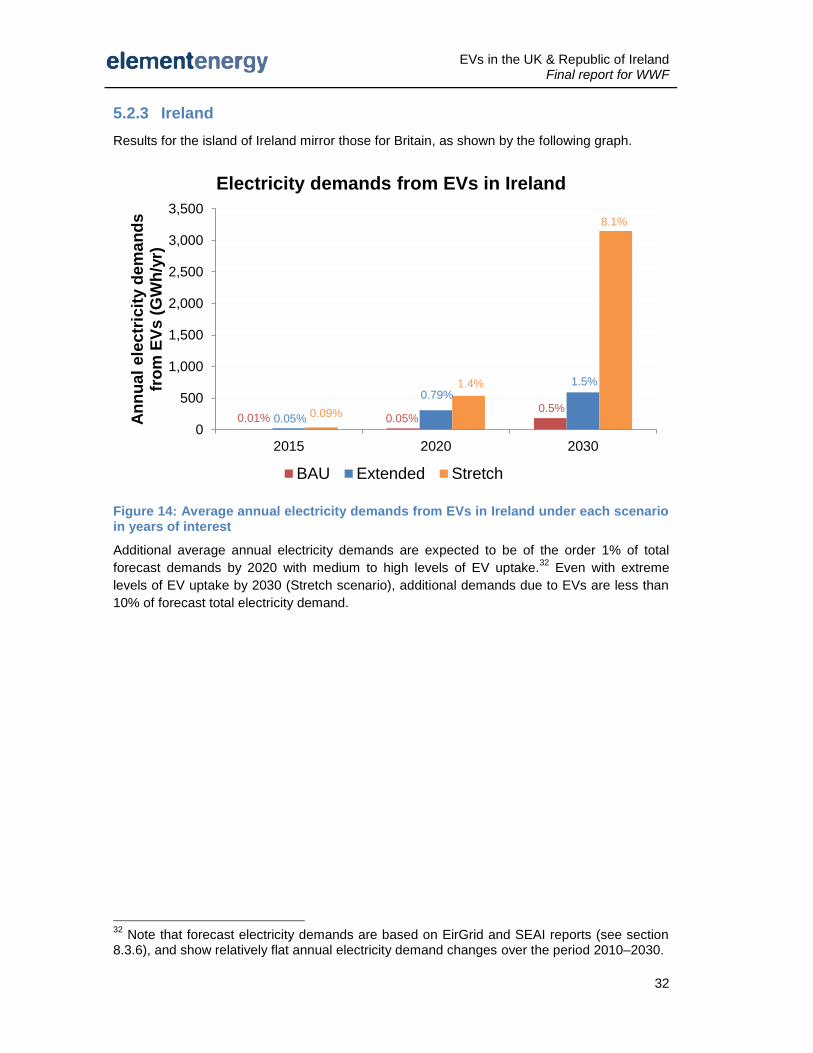
EVs in the UK & Republic of Ireland Final report for WWF
32
5.2.3 Ireland
Results for the island of Ireland mirror those for Britain, as shown by the following graph.
Figure 14: Average annual electricity demands from EVs in Ireland under each scenario in years of interest
Additional average annual electricity demands are expected to be of the order 1% of total
forecast demands by 2020 with medium to high levels of EV uptake.32
Even with extreme
levels of EV uptake by 2030 (Stretch scenario), additional demands due to EVs are less than
10% of forecast total electricity demand.
32
Note that forecast electricity demands are based on EirGrid and SEAI reports (see section 8.3.6), and show relatively flat annual electricity demand changes over the period 2010–2030.
0
500
1,000
1,500
2,000
2,500
3,000
3,500
2015 2020 2030
An
nu
al
ele
ctr
icit
y d
em
an
ds
fro
m E
Vs (
GW
h/y
r)
Electricity demands from EVs in Ireland
BAU Extended Stretch
0.05%0.01% 0.09% 0.05%
0.79%1.4%
0.5%
1.5%
8.1%
EVs in the UK & Republic of Ireland Final report for WWF
33
5.3 Impact of EVs on peak electricity demands
5.3.1 Key results
A realistic assessment of worst case peak electricity demands at the national level
show demands significantly below the theoretical worst case (all EVs demanding
power simultaneously).
Reductions in peak demands from the theoretical worst case arise since not all
vehicles are used each day and as a result of diversity factors (i.e. the spread of
timings of arrival at charge points).
Peak demands can be curbed further through simple measures such as delayed
charging, or through intelligent charging on a smart grid. However, such
approaches will require consumer education and cooperation to deliver maximum
benefits.
Even under the Stretch scenario in 2030, where EVs make up three-quarters of
the car stock, a realistic assessment of worst case peak demands due to EVs
shows peak demands below 10GW. This figure is within the range of National
Grid forecasts of load growth by 2030 (based on forward extrapolation of medium
term projections).
The need for flexible charging of EVs is increased in the context of electrification
of other sectors, for example heat pumps for domestic heating. Delaying EV
charging to times of low demand from other sources could reduce peaking plant
requirements at the national level and minimise impacts on the distribution grid at
the local level.
5.3.2 Car usage patterns and implications for charging
Introduction
The previous section (5.2) considered the additional electricity demands that would arise from
EVs under each scenario over the course of a year. Another important consideration from the
grid’s point of view is how much power EVs might demand at any point in time – i.e. the effect
EVs could have on the grid in terms of exacerbating peak demands. This is needed to plan
peak generation capacity at the national level. At a more local level, it is important to
understand whether distribution networks (<33kV) will require upgrading to cope with
additional demands, for example where there is a high concentration of EVs in an area already
operating near or above peak capacity.
EVs in the UK & Republic of Ireland Final report for WWF
34
Impacts at the local distribution network level
A study for the CCC that modelled the impacts of EVs on distribution networks showed that
typical networks could accommodate reasonable levels of EV uptake (e.g. up to a third of
households owning EVs).33
Furthermore, demand side management techniques offer the
potential to allow high levels of EV penetration without the need for network reinforcement.
The modelling work of the study showed that the first technical constraint encountered was the
thermal rating of the 11/0.4kV transformer. However, it should be noted that although the case
study networks considered were representative of real UK low voltage networks, there is a
wide range of possible network configurations and alternative loading conditions. Some
networks are therefore more susceptible to issues than others when put under strain from
additional loads such as those from EVs.
Impacts at the national grid level
A worst case load can be calculated based on the total number of plug-in vehicles in the stock
within a given region (e.g. Great Britain / Ireland), and assumptions of typical charging loads
per vehicle. For example, 3kW represents a standard charge rate for slow charge and EVs
could be comfortably charged at this rate at home.
Taking the example of the Extended scenario in 2020, simply multiplying the number of EVs in
the stock in Britain (1.7m) by a typical charging rate per car of 3kW suggests that the worst
case additional load on the grid could reach around 5GW.34
To put this figure in context, the
peak demand on the British grid in the winter of 2009/10 was 59.3GW.35
Electricity demands
on the British grid currently range from around 25–40GW. In this context the figure of 5GW
from 1.7m EVs (5.5% of the car fleet) seems high. However, this is the upper bound of
additional peak demands from EVs. In reality diversity effects will mean that expected peak
demands will be significantly lower. The remainder of this section investigates what the typical
additional demands might be.
Results from the NTS
National Travel Survey data can be used to show when drivers arrive home from their final trip
of the day. The graph below shows the home arrival profile for a typical weekday.36
33
Strategies for the uptake of electric vehicles and associated infrastructure implications, chapter 4, Element Energy for the CCC (2009). 34
Results for the Stretch scenario are presented below – see section 5.3.4. 35
Peak demand in the period 01/11/09 to 28/02/10, which occurred at 5pm on the 7th of
January 2010. Based on Indicative Triad Demand Information from: www.bmreports.com/bsp/bsp_home.htm. 36
Weekend results show some variation – see appendix, section 8.5.2.
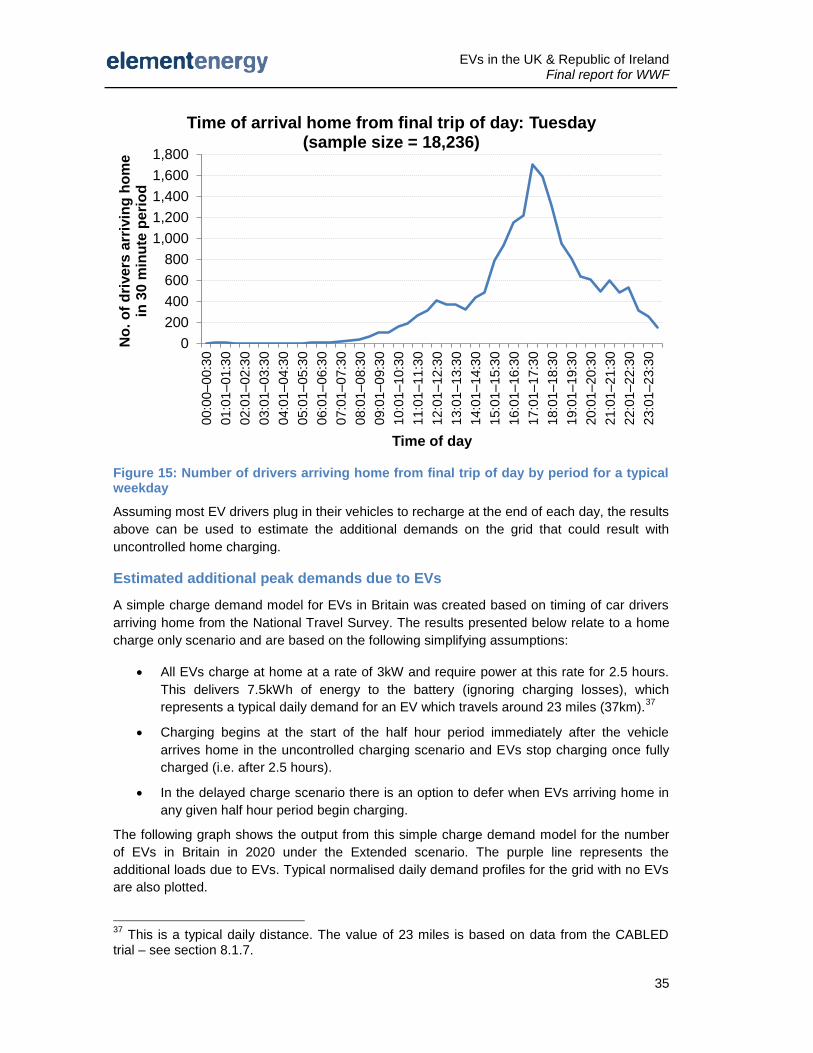
EVs in the UK & Republic of Ireland Final report for WWF
35
Figure 15: Number of drivers arriving home from final trip of day by period for a typical weekday
Assuming most EV drivers plug in their vehicles to recharge at the end of each day, the results
above can be used to estimate the additional demands on the grid that could result with
uncontrolled home charging.
Estimated additional peak demands due to EVs
A simple charge demand model for EVs in Britain was created based on timing of car drivers
arriving home from the National Travel Survey. The results presented below relate to a home
charge only scenario and are based on the following simplifying assumptions:
All EVs charge at home at a rate of 3kW and require power at this rate for 2.5 hours.
This delivers 7.5kWh of energy to the battery (ignoring charging losses), which
represents a typical daily demand for an EV which travels around 23 miles (37km).37
Charging begins at the start of the half hour period immediately after the vehicle
arrives home in the uncontrolled charging scenario and EVs stop charging once fully
charged (i.e. after 2.5 hours).
In the delayed charge scenario there is an option to defer when EVs arriving home in
any given half hour period begin charging.
The following graph shows the output from this simple charge demand model for the number
of EVs in Britain in 2020 under the Extended scenario. The purple line represents the
additional loads due to EVs. Typical normalised daily demand profiles for the grid with no EVs
are also plotted.
37
This is a typical daily distance. The value of 23 miles is based on data from the CABLED trial – see section 8.1.7.
0
200
400
600
800
1,000
1,200
1,400
1,600
1,800
00:0
0–0
0:3
0
01:0
1–0
1:3
0
02:0
1–0
2:3
0
03:0
1–0
3:3
0
04:0
1–0
4:3
0
05:0
1–0
5:3
0
06:0
1–0
6:3
0
07:0
1–0
7:3
0
08:0
1–0
8:3
0
09:0
1–0
9:3
0
10:0
1–1
0:3
0
11:0
1–1
1:3
0
12:0
1–1
2:3
0
13:0
1–1
3:3
0
14:0
1–1
4:3
0
15:0
1–1
5:3
0
16:0
1–1
6:3
0
17:0
1–1
7:3
0
18:0
1–1
8:3
0
19:0
1–1
9:3
0
20:0
1–2
0:3
0
21:0
1–2
1:3
0
22:0
1–2
2:3
0
23:0
1–2
3:3
0
No
. o
f d
rive
rs a
rriv
ing
ho
me
in 3
0 m
inu
te p
eri
od
Time of day
Time of arrival home from final trip of day: Tuesday (sample size = 18,236)
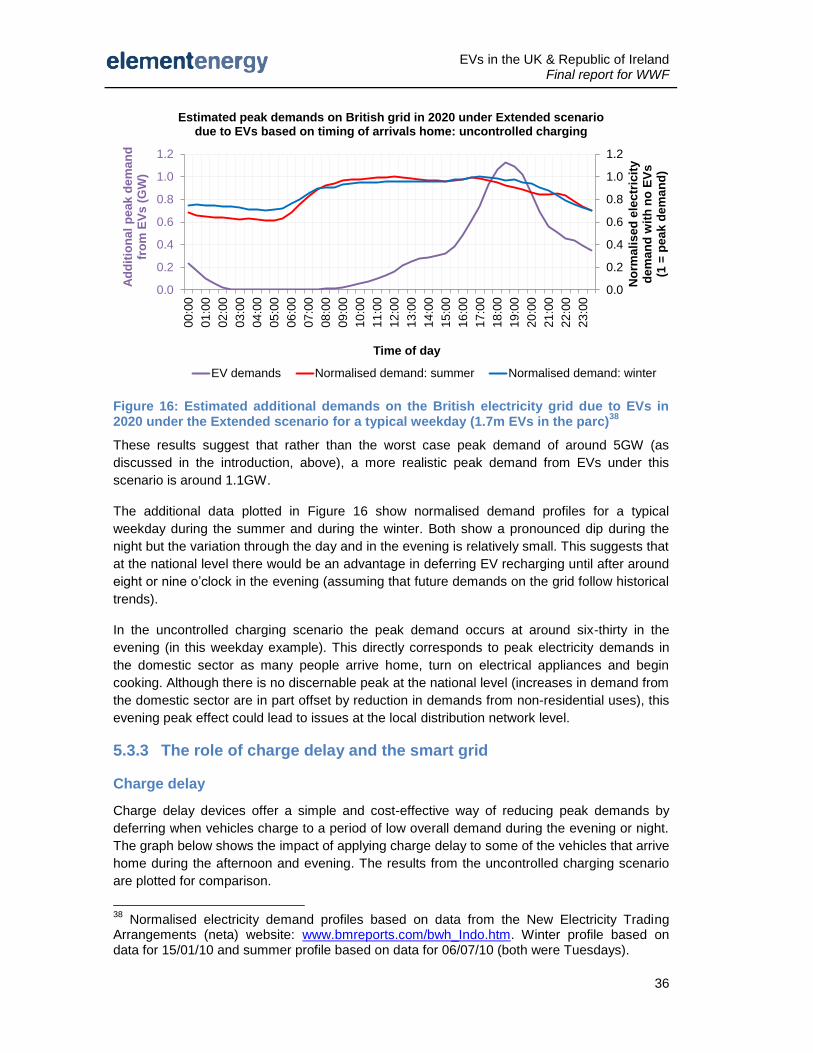
EVs in the UK & Republic of Ireland Final report for WWF
36
Figure 16: Estimated additional demands on the British electricity grid due to EVs in 2020 under the Extended scenario for a typical weekday (1.7m EVs in the parc)
38
These results suggest that rather than the worst case peak demand of around 5GW (as
discussed in the introduction, above), a more realistic peak demand from EVs under this
scenario is around 1.1GW.
The additional data plotted in Figure 16 show normalised demand profiles for a typical
weekday during the summer and during the winter. Both show a pronounced dip during the
night but the variation through the day and in the evening is relatively small. This suggests that
at the national level there would be an advantage in deferring EV recharging until after around
eight or nine o’clock in the evening (assuming that future demands on the grid follow historical
trends).
In the uncontrolled charging scenario the peak demand occurs at around six-thirty in the
evening (in this weekday example). This directly corresponds to peak electricity demands in
the domestic sector as many people arrive home, turn on electrical appliances and begin
cooking. Although there is no discernable peak at the national level (increases in demand from
the domestic sector are in part offset by reduction in demands from non-residential uses), this
evening peak effect could lead to issues at the local distribution network level.
5.3.3 The role of charge delay and the smart grid
Charge delay
Charge delay devices offer a simple and cost-effective way of reducing peak demands by
deferring when vehicles charge to a period of low overall demand during the evening or night.
The graph below shows the impact of applying charge delay to some of the vehicles that arrive
home during the afternoon and evening. The results from the uncontrolled charging scenario
are plotted for comparison.
38
Normalised electricity demand profiles based on data from the New Electricity Trading Arrangements (neta) website: www.bmreports.com/bwh_Indo.htm. Winter profile based on data for 15/01/10 and summer profile based on data for 06/07/10 (both were Tuesdays).
0.0
0.2
0.4
0.6
0.8
1.0
1.2
0.0
0.2
0.4
0.6
0.8
1.0
1.2
00:0
0
01:0
0
02:0
0
03:0
0
04:0
0
05:0
0
06
:00
07:0
0
08:0
0
09
:00
10:0
0
11:0
0
12
:00
13:0
0
14:0
0
15
:00
16:0
0
17:0
0
18
:00
19:0
0
20:0
0
21
:00
22:0
0
23:0
0
No
rmali
sed
ele
ctr
icit
yd
em
an
d w
ith
no
EV
s(1
= p
eak d
em
an
d)
Ad
dit
ion
al
peak d
em
an
dfr
om
EV
s (
GW
)
Time of day
Estimated peak demands on British grid in 2020 under Extended scenario due to EVs based on timing of arrivals home: uncontrolled charging
EV demands Normalised demand: summer Normalised demand: winter
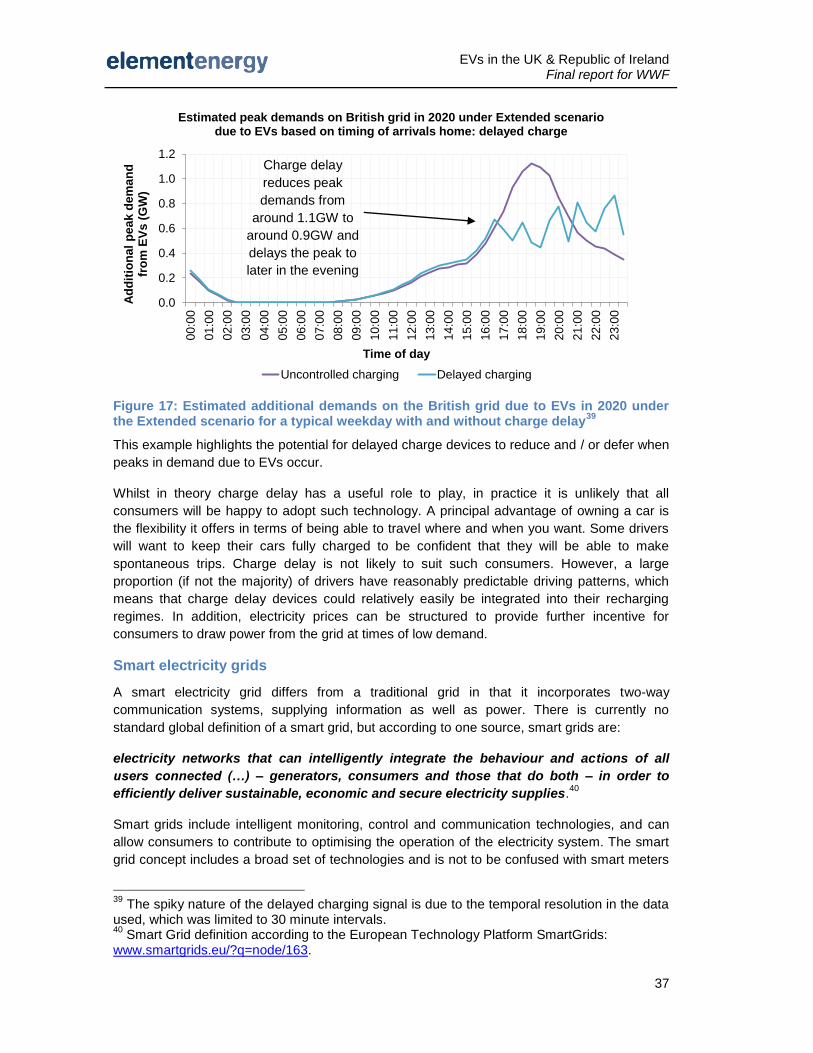
EVs in the UK & Republic of Ireland Final report for WWF
37
Figure 17: Estimated additional demands on the British grid due to EVs in 2020 under the Extended scenario for a typical weekday with and without charge delay
39
This example highlights the potential for delayed charge devices to reduce and / or defer when
peaks in demand due to EVs occur.
Whilst in theory charge delay has a useful role to play, in practice it is unlikely that all
consumers will be happy to adopt such technology. A principal advantage of owning a car is
the flexibility it offers in terms of being able to travel where and when you want. Some drivers
will want to keep their cars fully charged to be confident that they will be able to make
spontaneous trips. Charge delay is not likely to suit such consumers. However, a large
proportion (if not the majority) of drivers have reasonably predictable driving patterns, which
means that charge delay devices could relatively easily be integrated into their recharging
regimes. In addition, electricity prices can be structured to provide further incentive for
consumers to draw power from the grid at times of low demand.
Smart electricity grids
A smart electricity grid differs from a traditional grid in that it incorporates two-way
communication systems, supplying information as well as power. There is currently no
standard global definition of a smart grid, but according to one source, smart grids are:
electricity networks that can intelligently integrate the behaviour and actions of all
users connected (…) – generators, consumers and those that do both – in order to
efficiently deliver sustainable, economic and secure electricity supplies.40
Smart grids include intelligent monitoring, control and communication technologies, and can
allow consumers to contribute to optimising the operation of the electricity system. The smart
grid concept includes a broad set of technologies and is not to be confused with smart meters
39
The spiky nature of the delayed charging signal is due to the temporal resolution in the data used, which was limited to 30 minute intervals. 40
Smart Grid definition according to the European Technology Platform SmartGrids: www.smartgrids.eu/?q=node/163.
0.0
0.2
0.4
0.6
0.8
1.0
1.2
00:0
0
01:0
0
02:0
0
03:0
0
04:0
0
05:0
0
06:0
0
07:0
0
08:0
0
09:0
0
10:0
0
11:0
0
12:0
0
13:0
0
14:0
0
15:0
0
16:0
0
17:0
0
18:0
0
19:0
0
20:0
0
21:0
0
22:0
0
23:0
0
Ad
dit
ion
al
peak d
em
an
dfr
om
EV
s (
GW
)
Time of day
Estimated peak demands on British grid in 2020 under Extended scenario due to EVs based on timing of arrivals home: delayed charge
Uncontrolled charging Delayed charging
Charge delay
reduces peak
demands from
around 1.1GW to
around 0.9GW and
delays the peak to
later in the evening

EVs in the UK & Republic of Ireland Final report for WWF
38
(which have a narrower scope). Smart grids are not expected to look significantly different
from traditional electricity grids and the implementation of smart grid technologies is expected
to be an evolutionary process (rather than revolutionary change).
SmartGrids European Technology Platform for Electricity Networks of the Future is a
programme designed to ‘foster and support the deployment of SmartGrids in Europe’.41
It
began in 2005 and seeks to create a shared vision for the European electricity networks of
2020 and beyond. This includes a programme of research, development and demonstration to
create an electricity supply network that will meet future needs.
Smart electricity grids are potentially useful for balancing supply and demand, and could be
particularly relevant in the context of high EV uptake. EVs represent a load on the grid which
could, for the majority of consumers, be shifted in time with no impact on the consumer.
However, the benefits for the local distribution grid and at the national level (e.g. reduced need
for peaking plant) could be significant. There is much research still to be done in relation to
smart grids, and current timescales suggest that they are not likely to be widespread in the
short term. However, large scale EV uptake is also not expected until the medium to longer
term, so potential synergies exist and the interaction of EVs with smart grids should be
considered as both develop.
41
www.smartgrids.eu/?q=node/28.
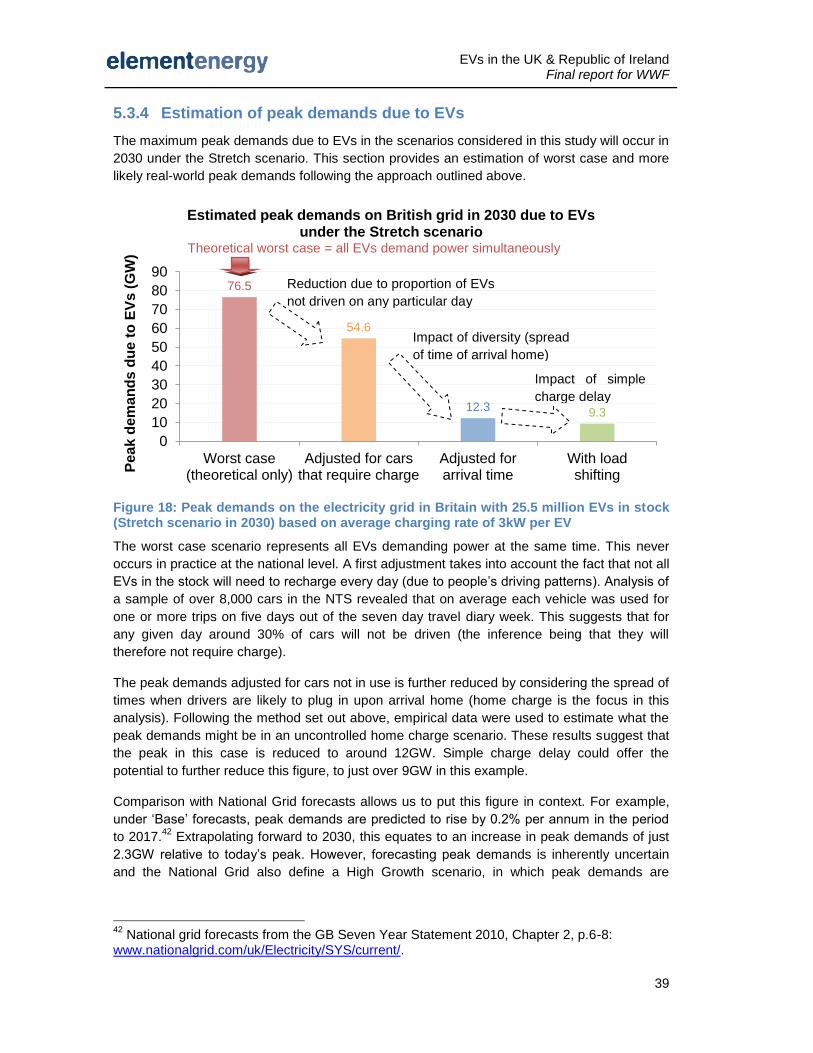
EVs in the UK & Republic of Ireland Final report for WWF
39
5.3.4 Estimation of peak demands due to EVs
The maximum peak demands due to EVs in the scenarios considered in this study will occur in
2030 under the Stretch scenario. This section provides an estimation of worst case and more
likely real-world peak demands following the approach outlined above.
Figure 18: Peak demands on the electricity grid in Britain with 25.5 million EVs in stock (Stretch scenario in 2030) based on average charging rate of 3kW per EV
The worst case scenario represents all EVs demanding power at the same time. This never
occurs in practice at the national level. A first adjustment takes into account the fact that not all
EVs in the stock will need to recharge every day (due to people’s driving patterns). Analysis of
a sample of over 8,000 cars in the NTS revealed that on average each vehicle was used for
one or more trips on five days out of the seven day travel diary week. This suggests that for
any given day around 30% of cars will not be driven (the inference being that they will
therefore not require charge).
The peak demands adjusted for cars not in use is further reduced by considering the spread of
times when drivers are likely to plug in upon arrival home (home charge is the focus in this
analysis). Following the method set out above, empirical data were used to estimate what the
peak demands might be in an uncontrolled home charge scenario. These results suggest that
the peak in this case is reduced to around 12GW. Simple charge delay could offer the
potential to further reduce this figure, to just over 9GW in this example.
Comparison with National Grid forecasts allows us to put this figure in context. For example,
under ‘Base’ forecasts, peak demands are predicted to rise by 0.2% per annum in the period
to 2017.42
Extrapolating forward to 2030, this equates to an increase in peak demands of just
2.3GW relative to today’s peak. However, forecasting peak demands is inherently uncertain
and the National Grid also define a High Growth scenario, in which peak demands are
42
National grid forecasts from the GB Seven Year Statement 2010, Chapter 2, p.6-8: www.nationalgrid.com/uk/Electricity/SYS/current/.
76.5
54.6
12.3 9.3
0
10
20
30
40
50
60
70
80
90
Worst case(theoretical only)
Adjusted for carsthat require charge
Adjusted forarrival time
With loadshifting
Peak d
em
an
ds d
ue t
o E
Vs (
GW
)
Estimated peak demands on British grid in 2030 due to EVs under the Stretch scenario
Impact of simple
charge delay
Impact of diversity (spread
of time of arrival home)
Reduction due to proportion of EVs
not driven on any particular day
Theoretical worst case = all EVs demand power simultaneously
EVs in the UK & Republic of Ireland Final report for WWF
40
expected to rise by 1.4% per annum (to 2017).43
Forward extrapolation based on this higher
figure leads to an increase in peak demands of 18.5GW.
The anticipated maximum additional peak loads due to EVs are therefore within the range of
peak demand forecasts derived from forward-extrapolation of National Grid projections.
5.3.5 EV uptake in the context of increased electrification of other
sectors
It is important to consider the potential future impact of EVs on the grid in the wider context of
other demands. For example, in a future with medium to high penetration of electric vehicles it
is likely that efforts will be made to decarbonise other sectors. The transport sector is not
alone in relying to some extent on the decarbonisation of the electricity grid as part of the
solution to achieving significant emissions cuts. For example, electrification of domestic
heating using high efficiency heat pumps is seen as a viable method to reduce emissions from
the built environment.
It is expected that heat pumps will be supported by the Renewable Heat Incentive (RHI),
which is due to begin in 2011 and will offer guaranteed levels of support for a range of
renewable heating technologies. The purpose of the RHI is to stimulate uptake of low carbon
technologies, which suggests that if it is successful we could reasonably expect an increased
number of heat pumps on the grid in future.
For the purposes of demonstration, we could make a reasonable estimate that the number of
heat pumps in Britain totals two million by 2020.44
Based on an average power consumption of
5kW, this equates to a maximum additional load on the grid of 10GW. This is a worst case
demand and diversity factors mean that the actual peak due to heat pumps may be lower.
Having said that, there is less diversity in when peak heating demands occur than, for
example, in when drivers arrive home (as considered above). An additional, low diversity load
of 5kW per house would cause significant problems at the distribution level.
An additional peak load of 10GW by 2020 is significant (e.g. the peak demand so far in 2010
was around 60GW), and being due to a heating technology, it is likely to occur in the late
afternoon / early evening. This further highlights the need for flexible charging of EVs to
minimise the impact on peak demands both at the national grid level and at the local
distribution network level.
43
Key factors that determine forecast electricity demands (average and peak) include economic growth projections, predicted savings from energy efficiency measures and the level of embedded generation (e.g. CHP). 44
To put this figure in context, around 15-20% of homes in Britain are off the gas grid, which would equate to around four million homes by 2020. This is a useful comparator since the economic and carbon benefits of heat pumps tend to be enhanced in areas off the gas grid.
EVs in the UK & Republic of Ireland Final report for WWF
41
5.4 Opportunities for EVs to contribute to grid balancing: storage
potential of EVs and vehicle to grid
5.4.1 Key results
The total storage capacity of EVs in the stock in the Extended scenario is
equivalent to around 30 minutes’ average national electricity demand in Britain by
2020.
The maximum technical storage potential of EVs in Britain under the Stretch
scenario reaches around 460GWh, which is around 50 times the storage capacity
of Britain’s largest pumped hydro facility.
Analysis of the driving habits of a sample of drivers from the National Travel
Survey suggests that there is a high chance that at least 90% of cars will be
parked at any time throughout the day or night.
EVs may help in grid balancing either by accepting charge during times of excess
generation (acting as a dispatchable load), or by feeding power to the grid at times
of high demand (vehicle to grid, V2G).
Either high EV uptake or widespread utilisation of fast charging (or both) is
required for EVs to play a significant role in a dispatchable load capacity.
Electricity provided to the grid by EVs (V2G) will have to have a relatively high
price to offset the cost of additional battery degradation, shortening its useful life in
the vehicle. However, the marginal cost of electricity (when V2G might be
required) is also likely to be high.
The ability of EVs to serve the grid in vehicle to grid applications depends on
battery cost reductions being achieved and development of intelligent grid
management systems (e.g. a smart grid).
5.4.2 Storage potential of EVs
A potential advantage of a large stock of EVs comes about through the storage potential
offered. EVs could in theory prove beneficial to the grid in contributing towards balancing
supply and demand. This is particularly true in a future where electricity grids rely to a greater
extent on renewables (with more uncertain generation profiles than traditional thermal plant).
This section considers the total storage capacity offered by EVs under each scenario in terms
of maximum capacity and anticipated spare capacity at any point in time.
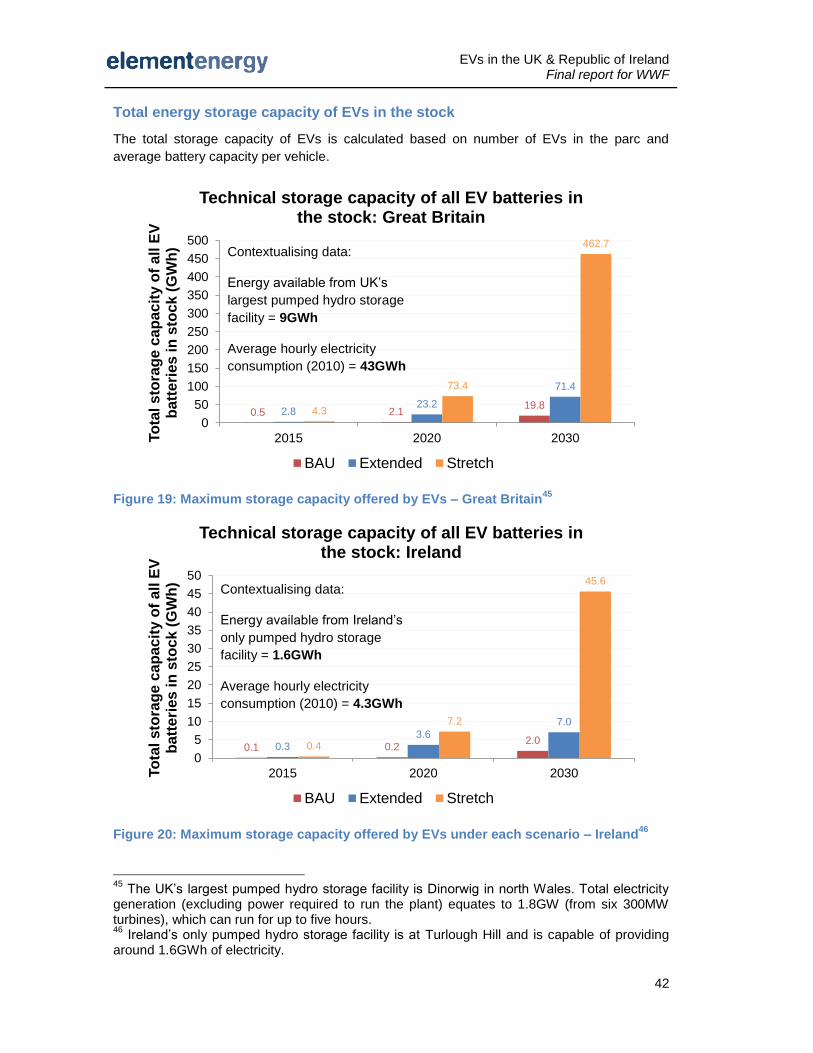
EVs in the UK & Republic of Ireland Final report for WWF
42
Total energy storage capacity of EVs in the stock
The total storage capacity of EVs is calculated based on number of EVs in the parc and
average battery capacity per vehicle.
Figure 19: Maximum storage capacity offered by EVs – Great Britain45
Figure 20: Maximum storage capacity offered by EVs under each scenario – Ireland46
45
The UK’s largest pumped hydro storage facility is Dinorwig in north Wales. Total electricity generation (excluding power required to run the plant) equates to 1.8GW (from six 300MW turbines), which can run for up to five hours. 46
Ireland’s only pumped hydro storage facility is at Turlough Hill and is capable of providing around 1.6GWh of electricity.
0.5 2.119.8
2.823.2
71.4
4.3
73.4
462.7
0
50
100
150
200
250
300
350
400
450
500
2015 2020 2030To
tal sto
rag
e c
ap
acit
y o
f all
EV
b
att
eri
es in
sto
ck (
GW
h)
Technical storage capacity of all EV batteries in the stock: Great Britain
BAU Extended Stretch
0.1 0.22.0
0.33.6
7.0
0.4
7.2
45.6
0
5
10
15
20
25
30
35
40
45
50
2015 2020 2030To
tal s
tora
ge
ca
pa
cit
y o
f a
ll E
V
ba
tte
rie
s in
sto
ck
(G
Wh
)
Technical storage capacity of all EV batteries in the stock: Ireland
BAU Extended Stretch
Contextualising data:
Energy available from UK’s
largest pumped hydro storage
facility = 9GWh
Average hourly electricity
consumption (2010) = 43GWh
Contextualising data:
Energy available from Ireland’s
only pumped hydro storage
facility = 1.6GWh
Average hourly electricity
consumption (2010) = 4.3GWh
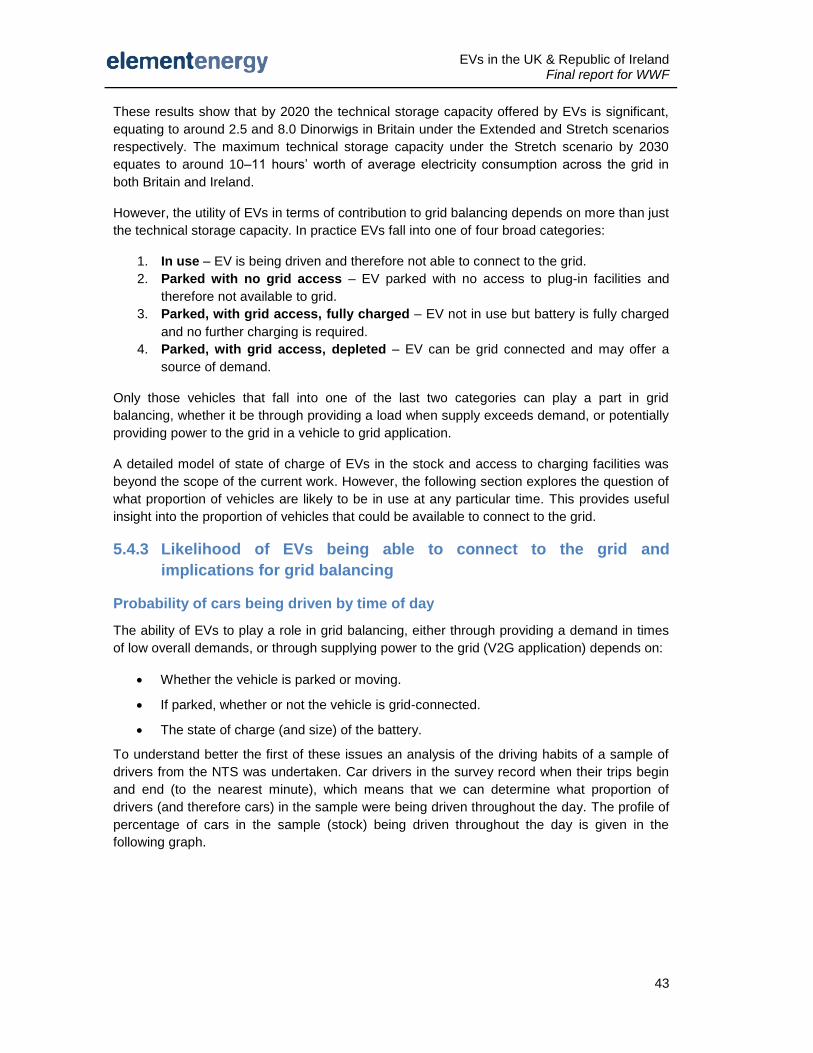
EVs in the UK & Republic of Ireland Final report for WWF
43
These results show that by 2020 the technical storage capacity offered by EVs is significant,
equating to around 2.5 and 8.0 Dinorwigs in Britain under the Extended and Stretch scenarios
respectively. The maximum technical storage capacity under the Stretch scenario by 2030
equates to around 10–11 hours’ worth of average electricity consumption across the grid in
both Britain and Ireland.
However, the utility of EVs in terms of contribution to grid balancing depends on more than just
the technical storage capacity. In practice EVs fall into one of four broad categories:
1. In use – EV is being driven and therefore not able to connect to the grid.
2. Parked with no grid access – EV parked with no access to plug-in facilities and
therefore not available to grid.
3. Parked, with grid access, fully charged – EV not in use but battery is fully charged
and no further charging is required.
4. Parked, with grid access, depleted – EV can be grid connected and may offer a
source of demand.
Only those vehicles that fall into one of the last two categories can play a part in grid
balancing, whether it be through providing a load when supply exceeds demand, or potentially
providing power to the grid in a vehicle to grid application.
A detailed model of state of charge of EVs in the stock and access to charging facilities was
beyond the scope of the current work. However, the following section explores the question of
what proportion of vehicles are likely to be in use at any particular time. This provides useful
insight into the proportion of vehicles that could be available to connect to the grid.
5.4.3 Likelihood of EVs being able to connect to the grid and
implications for grid balancing
Probability of cars being driven by time of day
The ability of EVs to play a role in grid balancing, either through providing a demand in times
of low overall demands, or through supplying power to the grid (V2G application) depends on:
Whether the vehicle is parked or moving.
If parked, whether or not the vehicle is grid-connected.
The state of charge (and size) of the battery.
To understand better the first of these issues an analysis of the driving habits of a sample of
drivers from the NTS was undertaken. Car drivers in the survey record when their trips begin
and end (to the nearest minute), which means that we can determine what proportion of
drivers (and therefore cars) in the sample were being driven throughout the day. The profile of
percentage of cars in the sample (stock) being driven throughout the day is given in the
following graph.
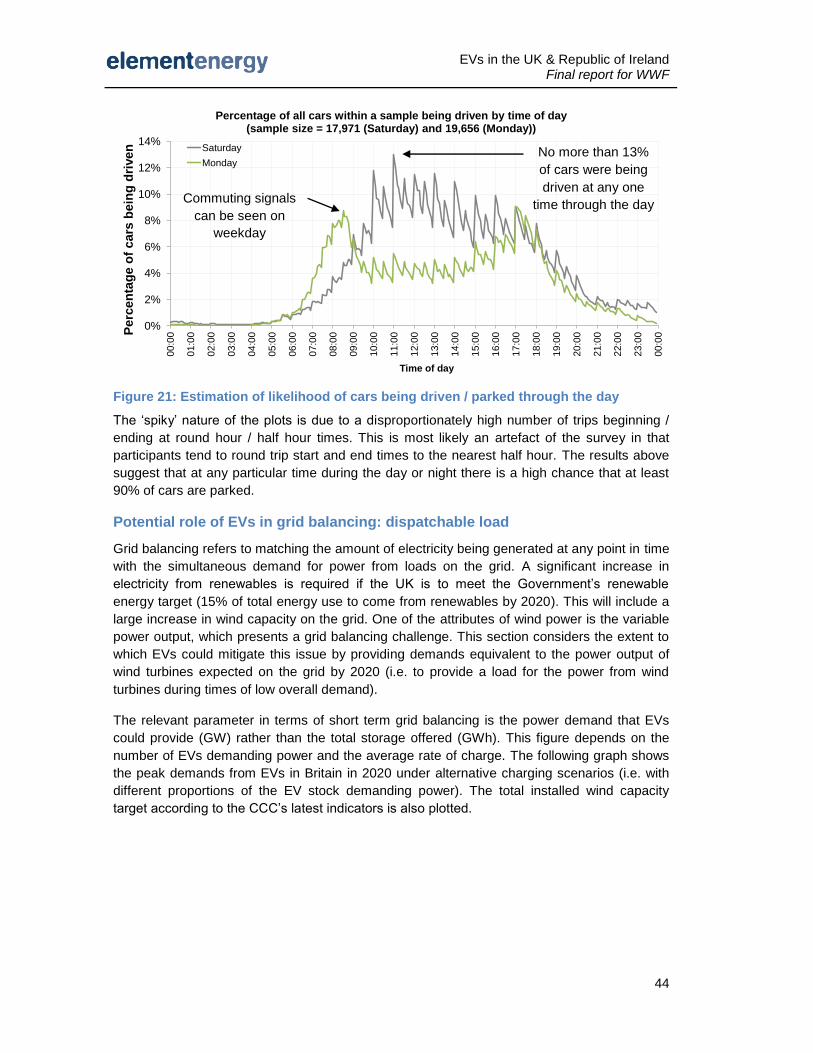
EVs in the UK & Republic of Ireland Final report for WWF
44
Figure 21: Estimation of likelihood of cars being driven / parked through the day
The ‘spiky’ nature of the plots is due to a disproportionately high number of trips beginning /
ending at round hour / half hour times. This is most likely an artefact of the survey in that
participants tend to round trip start and end times to the nearest half hour. The results above
suggest that at any particular time during the day or night there is a high chance that at least
90% of cars are parked.
Potential role of EVs in grid balancing: dispatchable load
Grid balancing refers to matching the amount of electricity being generated at any point in time
with the simultaneous demand for power from loads on the grid. A significant increase in
electricity from renewables is required if the UK is to meet the Government’s renewable
energy target (15% of total energy use to come from renewables by 2020). This will include a
large increase in wind capacity on the grid. One of the attributes of wind power is the variable
power output, which presents a grid balancing challenge. This section considers the extent to
which EVs could mitigate this issue by providing demands equivalent to the power output of
wind turbines expected on the grid by 2020 (i.e. to provide a load for the power from wind
turbines during times of low overall demand).
The relevant parameter in terms of short term grid balancing is the power demand that EVs
could provide (GW) rather than the total storage offered (GWh). This figure depends on the
number of EVs demanding power and the average rate of charge. The following graph shows
the peak demands from EVs in Britain in 2020 under alternative charging scenarios (i.e. with
different proportions of the EV stock demanding power). The total installed wind capacity
target according to the CCC’s latest indicators is also plotted.
0%
2%
4%
6%
8%
10%
12%
14%
00
:00
01
:00
02
:00
03
:00
04
:00
05
:00
06
:00
07
:00
08
:00
09
:00
10
:00
11
:00
12
:00
13
:00
14
:00
15
:00
16
:00
17
:00
18
:00
19
:00
20
:00
21
:00
22
:00
23
:00
00
:00P
erc
en
tag
e o
f cars
bein
g d
riven
Time of day
Percentage of all cars within a sample being driven by time of day(sample size = 17,971 (Saturday) and 19,656 (Monday))
Saturday
Monday
Commuting signals
can be seen on
weekday
No more than 13%
of cars were being
driven at any one
time through the day
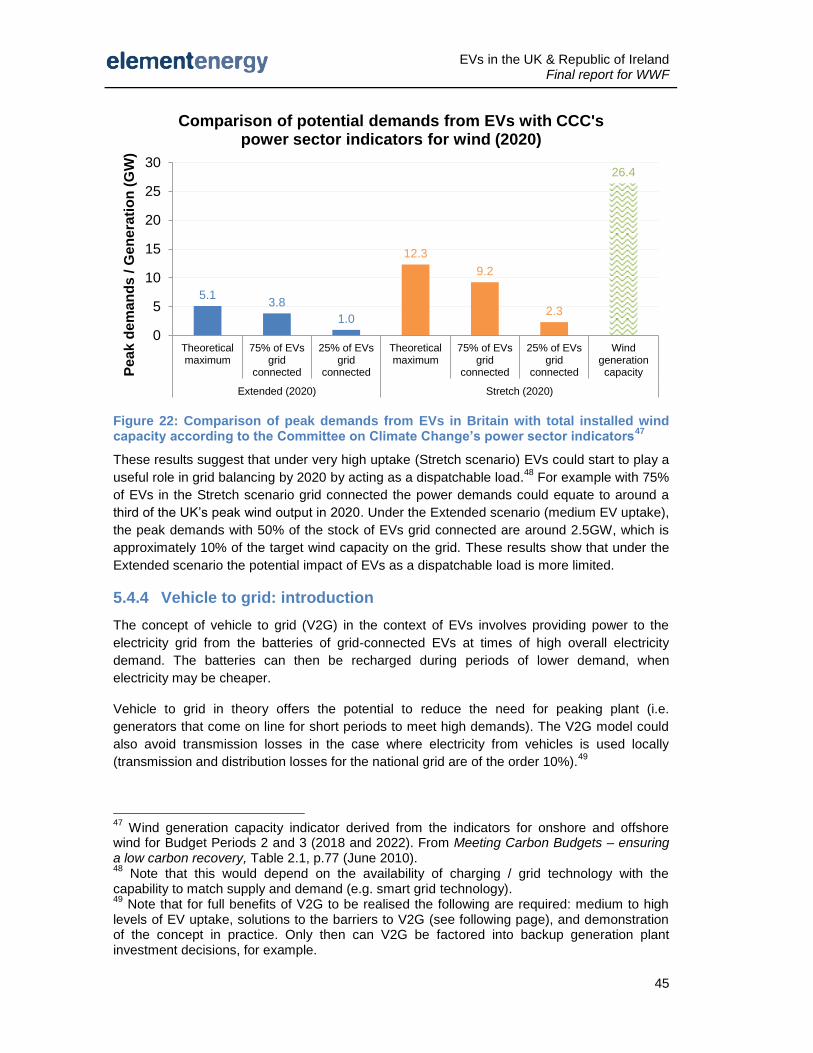
EVs in the UK & Republic of Ireland Final report for WWF
45
Figure 22: Comparison of peak demands from EVs in Britain with total installed wind capacity according to the Committee on Climate Change’s power sector indicators
47
These results suggest that under very high uptake (Stretch scenario) EVs could start to play a
useful role in grid balancing by 2020 by acting as a dispatchable load.48
For example with 75%
of EVs in the Stretch scenario grid connected the power demands could equate to around a
third of the UK’s peak wind output in 2020. Under the Extended scenario (medium EV uptake),
the peak demands with 50% of the stock of EVs grid connected are around 2.5GW, which is
approximately 10% of the target wind capacity on the grid. These results show that under the
Extended scenario the potential impact of EVs as a dispatchable load is more limited.
5.4.4 Vehicle to grid: introduction
The concept of vehicle to grid (V2G) in the context of EVs involves providing power to the
electricity grid from the batteries of grid-connected EVs at times of high overall electricity
demand. The batteries can then be recharged during periods of lower demand, when
electricity may be cheaper.
Vehicle to grid in theory offers the potential to reduce the need for peaking plant (i.e.
generators that come on line for short periods to meet high demands). The V2G model could
also avoid transmission losses in the case where electricity from vehicles is used locally
(transmission and distribution losses for the national grid are of the order 10%).49
47
Wind generation capacity indicator derived from the indicators for onshore and offshore wind for Budget Periods 2 and 3 (2018 and 2022). From Meeting Carbon Budgets – ensuring a low carbon recovery, Table 2.1, p.77 (June 2010). 48
Note that this would depend on the availability of charging / grid technology with the capability to match supply and demand (e.g. smart grid technology). 49
Note that for full benefits of V2G to be realised the following are required: medium to high levels of EV uptake, solutions to the barriers to V2G (see following page), and demonstration of the concept in practice. Only then can V2G be factored into backup generation plant investment decisions, for example.
5.13.8
1.0
12.3
9.2
2.3
26.4
0
5
10
15
20
25
30
Theoreticalmaximum
75% of EVsgrid
connected
25% of EVsgrid
connected
Theoreticalmaximum
75% of EVsgrid
connected
25% of EVsgrid
connected
Windgenerationcapacity
Extended (2020) Stretch (2020)
Pe
ak
de
ma
nd
s /
Ge
ne
rati
on
(G
W)
Comparison of potential demands from EVs with CCC's power sector indicators for wind (2020)
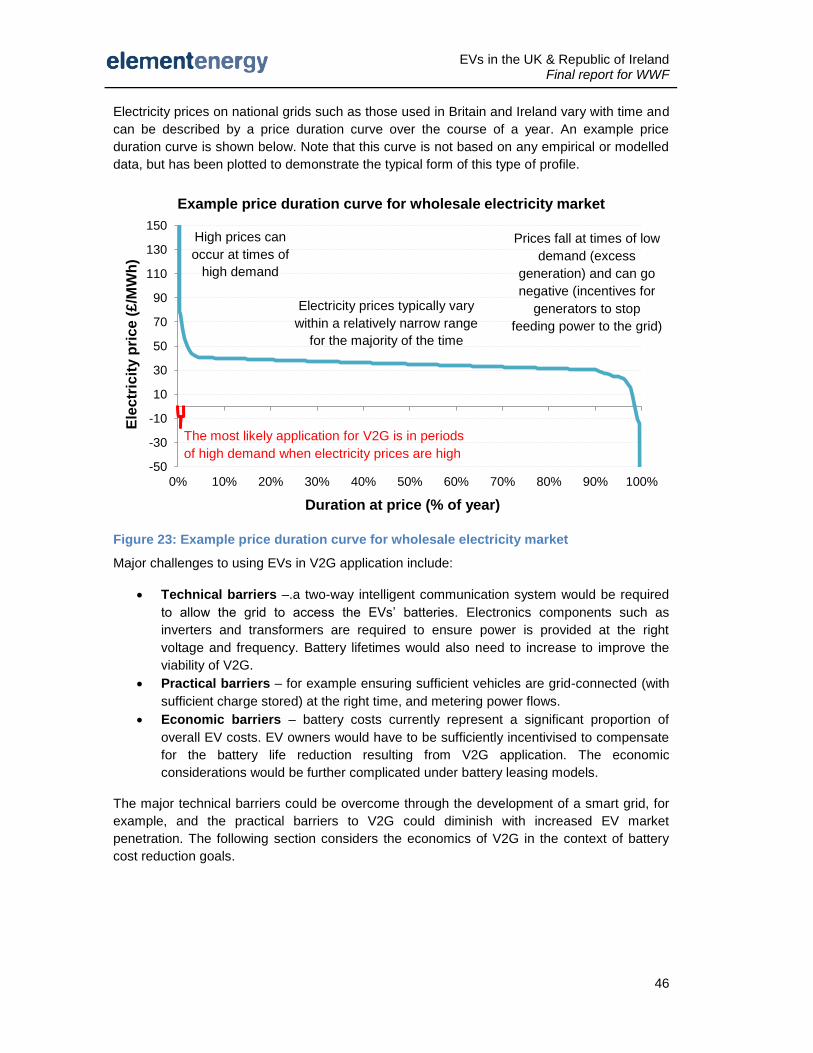
EVs in the UK & Republic of Ireland Final report for WWF
46
Electricity prices on national grids such as those used in Britain and Ireland vary with time and
can be described by a price duration curve over the course of a year. An example price
duration curve is shown below. Note that this curve is not based on any empirical or modelled
data, but has been plotted to demonstrate the typical form of this type of profile.
Figure 23: Example price duration curve for wholesale electricity market
Major challenges to using EVs in V2G application include:
Technical barriers –.a two-way intelligent communication system would be required
to allow the grid to access the EVs’ batteries. Electronics components such as
inverters and transformers are required to ensure power is provided at the right
voltage and frequency. Battery lifetimes would also need to increase to improve the
viability of V2G.
Practical barriers – for example ensuring sufficient vehicles are grid-connected (with
sufficient charge stored) at the right time, and metering power flows.
Economic barriers – battery costs currently represent a significant proportion of
overall EV costs. EV owners would have to be sufficiently incentivised to compensate
for the battery life reduction resulting from V2G application. The economic
considerations would be further complicated under battery leasing models.
The major technical barriers could be overcome through the development of a smart grid, for
example, and the practical barriers to V2G could diminish with increased EV market
penetration. The following section considers the economics of V2G in the context of battery
cost reduction goals.
-50
-30
-10
10
30
50
70
90
110
130
150
0% 10% 20% 30% 40% 50% 60% 70% 80% 90% 100%
Ele
ctr
icit
y p
ric
e (
£/M
Wh
)
Duration at price (% of year)
Example price duration curve for wholesale electricity market
Electricity prices typically vary
within a relatively narrow range
for the majority of the time
Prices fall at times of low
demand (excess
generation) and can go
negative (incentives for
generators to stop
feeding power to the grid)
High prices can
occur at times of
high demand
The most likely application for V2G is in periods
of high demand when electricity prices are high
EVs in the UK & Republic of Ireland Final report for WWF
47
5.4.5 Financial considerations of vehicle to grid
Overview
There is some optimism surrounding plug-in vehicles regarding their potential role in supplying
electricity to the grid during times of high demand, thus reducing the requirements for fast
response plant to meet peak loads. This section considers the economic implications of using
EVs in vehicle-to-grid applications.
Estimating cost of electricity in V2G application
Batteries have a finite life in terms of number of cycles, after which performance degrades.
Feeding electricity back into the grid in V2G applications represents cycling of the battery and
the cost of this (small) loss of battery life must be accounted for when considering the
economics. Three main cost elements set the price that would have to be charged for
electricity from EVs supplying the grid under V2G:
Battery degradation – based on amortising the capital cost of the battery over its
lifetime.
Electricity price – V2G involves supplying electricity back to the grid, but the electricity
would have to be purchased from the grid in the first place.
Grid-tie inverter – providing power from DC batteries to the (AC) grid requires an
inverter to ensure the power is at the correct voltage and frequency.
A grid-tie inverter is not an item that would typically be required or on board an EV. As V2G
will only be cost effective at times of unusually high electricity prices, an inverter dedicated to
V2G could have a very low utility which means that the cost per use could be very high.
The example below demonstrates the minimum price that would have to be charged for
electricity sold to the grid in a V2G application (i.e. the minimum price for the EV owner to
break even). The calculation includes only the costs of using up some of the battery’s life and
electricity costs (costs of additional items such as inverters are ignored).
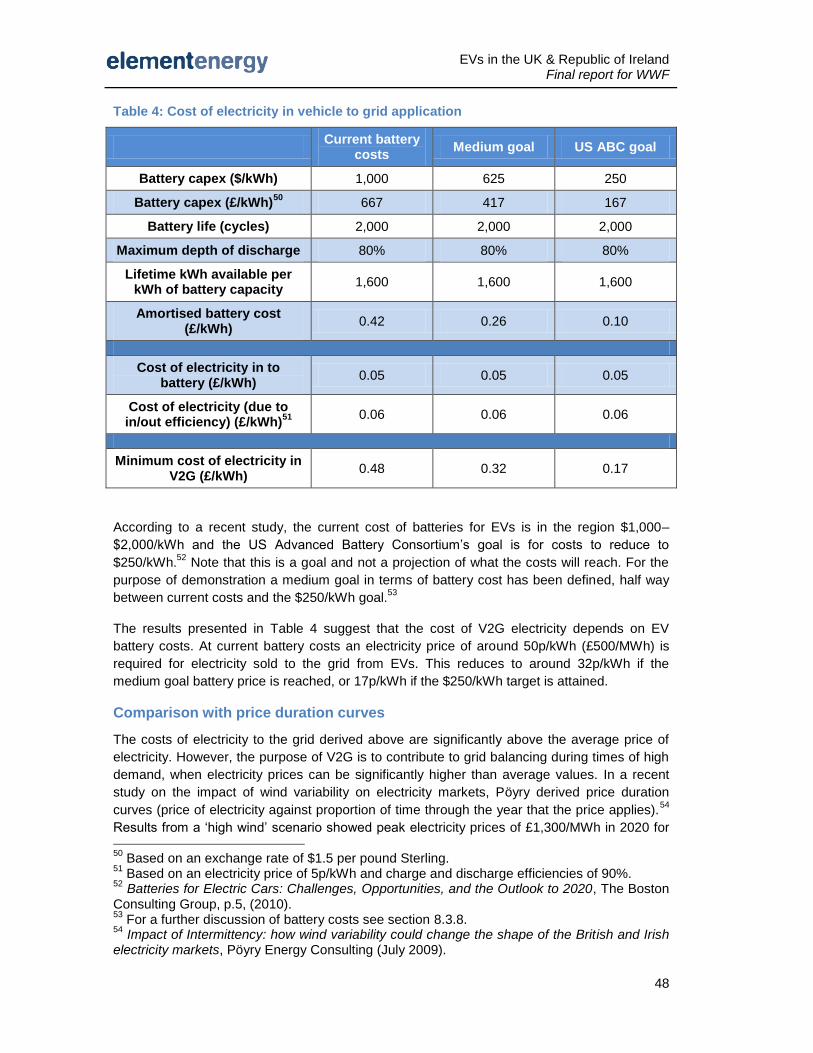
EVs in the UK & Republic of Ireland Final report for WWF
48
Table 4: Cost of electricity in vehicle to grid application
Current battery
costs Medium goal US ABC goal
Battery capex ($/kWh) 1,000 625 250
Battery capex (£/kWh)50
667 417 167
Battery life (cycles) 2,000 2,000 2,000
Maximum depth of discharge 80% 80% 80%
Lifetime kWh available per kWh of battery capacity
1,600 1,600 1,600
Amortised battery cost (£/kWh)
0.42 0.26 0.10
Cost of electricity in to battery (£/kWh)
0.05 0.05 0.05
Cost of electricity (due to in/out efficiency) (£/kWh)
51
0.06 0.06 0.06
Minimum cost of electricity in V2G (£/kWh)
0.48 0.32 0.17
According to a recent study, the current cost of batteries for EVs is in the region $1,000–
$2,000/kWh and the US Advanced Battery Consortium’s goal is for costs to reduce to
$250/kWh.52
Note that this is a goal and not a projection of what the costs will reach. For the
purpose of demonstration a medium goal in terms of battery cost has been defined, half way
between current costs and the $250/kWh goal.53
The results presented in Table 4 suggest that the cost of V2G electricity depends on EV
battery costs. At current battery costs an electricity price of around 50p/kWh (£500/MWh) is
required for electricity sold to the grid from EVs. This reduces to around 32p/kWh if the
medium goal battery price is reached, or 17p/kWh if the $250/kWh target is attained.
Comparison with price duration curves
The costs of electricity to the grid derived above are significantly above the average price of
electricity. However, the purpose of V2G is to contribute to grid balancing during times of high
demand, when electricity prices can be significantly higher than average values. In a recent
study on the impact of wind variability on electricity markets, Pöyry derived price duration
curves (price of electricity against proportion of time through the year that the price applies).54
Results from a ‘high wind’ scenario showed peak electricity prices of £1,300/MWh in 2020 for 50
Based on an exchange rate of $1.5 per pound Sterling. 51
Based on an electricity price of 5p/kWh and charge and discharge efficiencies of 90%. 52
Batteries for Electric Cars: Challenges, Opportunities, and the Outlook to 2020, The Boston Consulting Group, p.5, (2010). 53
For a further discussion of battery costs see section 8.3.8. 54
Impact of Intermittency: how wind variability could change the shape of the British and Irish electricity markets, Pöyry Energy Consulting (July 2009).
EVs in the UK & Republic of Ireland Final report for WWF
49
the British grid.55
However, the price in 2020 remained below around £100/MWh (10p/kWh) for
around 95% of the time.
Comparing the minimum price of £500/MWh (from Table 4) with current battery costs against
the price duration curve for 2020 from the Pöyry study suggests that the grid electricity price
exceeds this level for no more than about 0.25% of the year (just over 20 hours per year). If
the US Advanced Battery Consortium goal of $250/kWh battery costs is reached, this figure
increases to between 0.5–1.0% (up to around 90 hours per year).
Vehicle to grid: conclusions
Electricity provided to the grid by EVs will have to have a relatively high price to
recoup the initial electricity cost and the cost of degrading the battery.
With current battery prices EV owners would have to be paid at least around
£500/MWh (50p/kWh) for electricity delivered to the grid. This does not include the
cost of additional equipment such as inverters to allow EVs to feed in to the grid.
With ‘medium’ battery cost reductions (37.5%), this price falls to £320/MWh.
Comparison with published forecast price duration curves for 2020 suggests that the
electricity price may only exceed this level for <0.5% of the time.
The ability of EVs to serve the grid in vehicle to grid applications depends on battery
cost reductions being achieved and development of intelligent grid management
systems (e.g. a smart grid).
55
Poyry (2009), Figure 11, p.13.
EVs in the UK & Republic of Ireland Final report for WWF
50
6 Policy incentives and business opportunities
6.1 UK and international EV policy context
6.1.1 Key results
The electric vehicle industry in the UK is supported through national and regional
schemes. Capital grants of up to £5,000 per vehicle are expected from 2011 and
EV trials and infrastructure programmes are being developed through the
Plugged-In Places Infrastructure Framework.
However, the UK has yet to develop a strategic infrastructure plan to support EVs.
More could be done to grow the market through public sector procurement of low
carbon vehicles.
International examples show that there are various approaches to supporting EVs.
Capital cost of vehicles is the primary issue and most support programmes aim to
address this, either through subsidies or through tax incentives.
Further support for the EV market includes investment in infrastructure, research
and development, and manufacturing facilities.
Countries that have shown significant commitment to EVs include Japan, where
the government is investing heavily in supporting infrastructure; and France,
where the public sector is adopting EVs in significant numbers and planning laws
require charge facilities in new buildings.
6.1.2 National EV policy context
The UK currently has several policies to support the uptake of EVs, including national policies
and region-specific schemes supported by local government. National policy includes a capital
cost subsidy of up to £5,000 for EVs (from 2011). Originally the scheme was to provide up to
£250m in support for EVs (including c.£20m towards recharging infrastructure). At the time of
writing the Government had committed £43m to EV support up to March 31st 2012. The final
budget for the scheme beyond 2011/12 will be confirmed at the spending review in autumn
2010.
Other national incentives include an exemption from road tax.56
The regional incentives mainly
consist of free parking in central city locations, free charging point access with no charging
cost57
and in London exemption from the congestion charge.58
56
http://www.direct.gov.uk/en/Motoring/OwningAVehicle/HowToTaxYourVehicle/DG_10012524. 57
http://www.westminster.gov.uk/services/transportandstreets/parking/masterpark/electric/.

EVs in the UK & Republic of Ireland Final report for WWF
51
The UK government has supported the development of EV production technologies through
various pathways. Funding for technology development in small to medium enterprises
(SMEs) has been through local government, the technology strategy board (TSB) and other
low carbon funds. In the UK there has been little consolidation of funding means for EVs. The
main area of government support has been loan guarantees for new vehicle manufacturing
plants and (EV) battery manufacturing plants. An example of this is the Nissan plant due to
open in 2013 in which funding came from a grant from Grant for Business Investment (GBI)
and in a finance package from the European Investment Bank.59
EV recharging infrastructure deployed in the UK to date has been due to regional support and
small trial programs with very few public charging points being installed. London has the
largest amount of publicly available charging points and with a target of 25,000 charging points
in London’s workplaces, retail outlets, streets, public car parks and station car parks by
201560
, it is likely to remain the UK leader in EV deployment for the near term.
6.1.3 International EV policy context
Capital subsidies and other supportive policies
The UK’s policies and incentives for EVs described above are comparable to those in place in
many other countries pursuing EV technologies in terms of overall approach. There are
numerous means of stimulating EV uptake and EV production, however most have one
element in common: the subsidy of the upfront capital cost of the vehicle. These subsidies can
be through tax breaks (Denmark 61
) or through a capital grant. Germany is one exception, as
the government has refused to subsidise the capital cost of EVs and is instead focusing
funding on EV manufacturing, where it has allocated up to €500m for R&D. A summary of
electric vehicle subsidy and support policies for a selection of countries is shown below.
58
http://www.tfl.gov.uk/roadusers/congestioncharging/6733.aspx. 59
http://www.nissanpress.co.uk/environmental/isu11_1.html. 60
Electric Vehicle Delivery Plan for London http://www.london.gov.uk/electricvehicles/. 61
http://www.autoevolution.com/news/amsterdam-introduces-ev-subsidies-think-says-thank-you-16987.html.
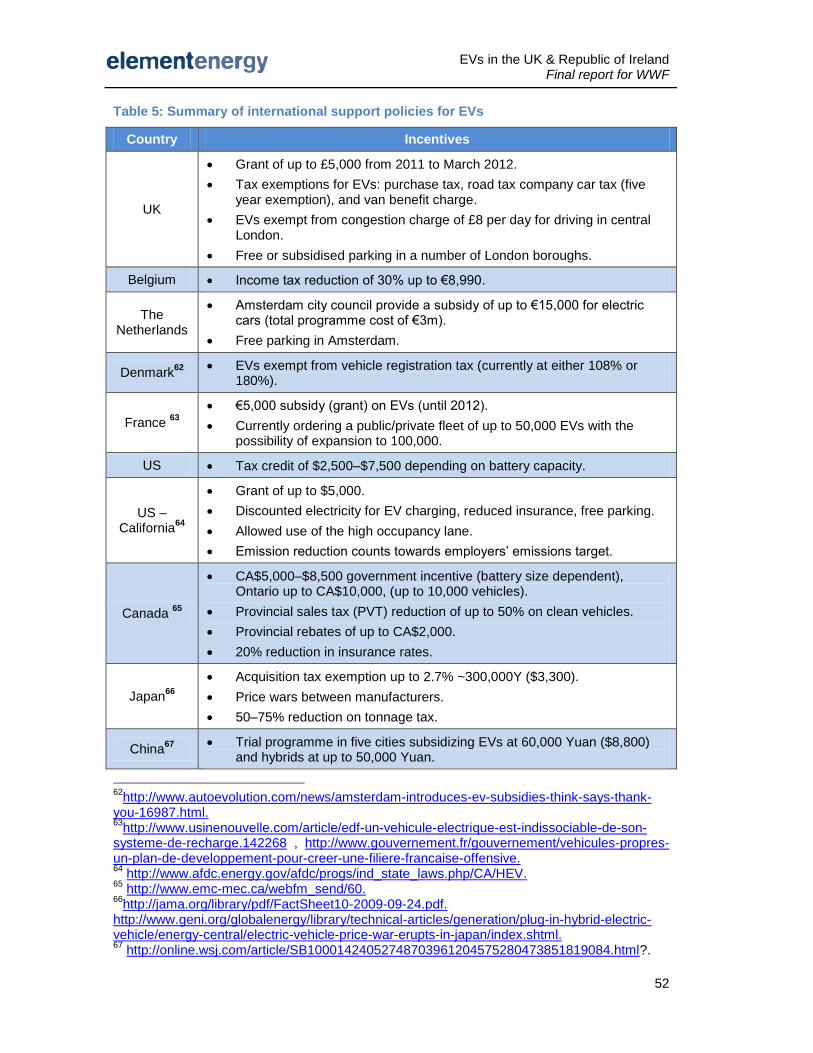
EVs in the UK & Republic of Ireland Final report for WWF
52
Table 5: Summary of international support policies for EVs
Country Incentives
UK
Grant of up to £5,000 from 2011 to March 2012.
Tax exemptions for EVs: purchase tax, road tax company car tax (five year exemption), and van benefit charge.
EVs exempt from congestion charge of £8 per day for driving in central London.
Free or subsidised parking in a number of London boroughs.
Belgium Income tax reduction of 30% up to €8,990.
The Netherlands
Amsterdam city council provide a subsidy of up to €15,000 for electric cars (total programme cost of €3m).
Free parking in Amsterdam.
Denmark62
EVs exempt from vehicle registration tax (currently at either 108% or
180%).
France 63
€5,000 subsidy (grant) on EVs (until 2012).
Currently ordering a public/private fleet of up to 50,000 EVs with the possibility of expansion to 100,000.
US Tax credit of $2,500–$7,500 depending on battery capacity.
US – California
64
Grant of up to $5,000.
Discounted electricity for EV charging, reduced insurance, free parking.
Allowed use of the high occupancy lane.
Emission reduction counts towards employers’ emissions target.
Canada 65
CA$5,000–$8,500 government incentive (battery size dependent), Ontario up to CA$10,000, (up to 10,000 vehicles).
Provincial sales tax (PVT) reduction of up to 50% on clean vehicles.
Provincial rebates of up to CA$2,000.
20% reduction in insurance rates.
Japan66
Acquisition tax exemption up to 2.7% ~300,000Y ($3,300).
Price wars between manufacturers.
50–75% reduction on tonnage tax.
China67
Trial programme in five cities subsidizing EVs at 60,000 Yuan ($8,800)
and hybrids at up to 50,000 Yuan.
62
http://www.autoevolution.com/news/amsterdam-introduces-ev-subsidies-think-says-thank-you-16987.html. 63
http://www.usinenouvelle.com/article/edf-un-vehicule-electrique-est-indissociable-de-son-systeme-de-recharge.142268 , http://www.gouvernement.fr/gouvernement/vehicules-propres-un-plan-de-developpement-pour-creer-une-filiere-francaise-offensive. 64
http://www.afdc.energy.gov/afdc/progs/ind_state_laws.php/CA/HEV. 65
http://www.emc-mec.ca/webfm_send/60. 66
http://jama.org/library/pdf/FactSheet10-2009-09-24.pdf. http://www.geni.org/globalenergy/library/technical-articles/generation/plug-in-hybrid-electric-vehicle/energy-central/electric-vehicle-price-war-erupts-in-japan/index.shtml. 67
http://online.wsj.com/article/SB10001424052748703961204575280473851819084.html?.
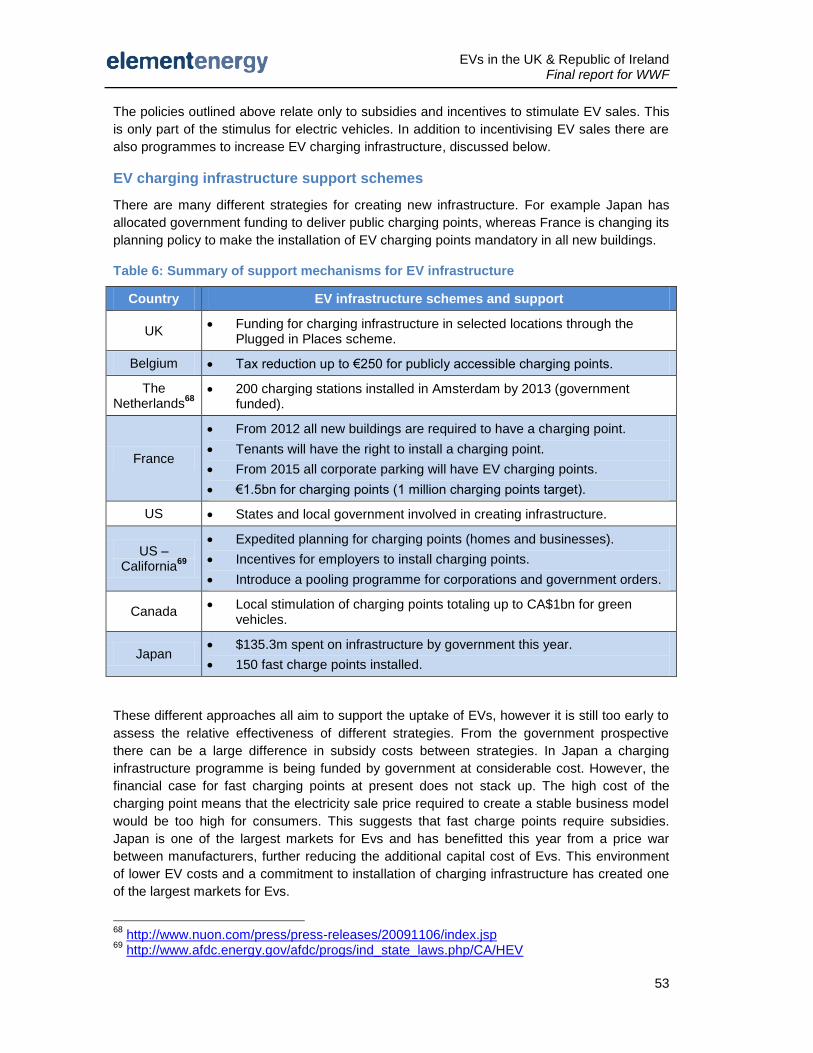
EVs in the UK & Republic of Ireland Final report for WWF
53
The policies outlined above relate only to subsidies and incentives to stimulate EV sales. This
is only part of the stimulus for electric vehicles. In addition to incentivising EV sales there are
also programmes to increase EV charging infrastructure, discussed below.
EV charging infrastructure support schemes
There are many different strategies for creating new infrastructure. For example Japan has
allocated government funding to deliver public charging points, whereas France is changing its
planning policy to make the installation of EV charging points mandatory in all new buildings.
Table 6: Summary of support mechanisms for EV infrastructure
Country EV infrastructure schemes and support
UK Funding for charging infrastructure in selected locations through the
Plugged in Places scheme.
Belgium Tax reduction up to €250 for publicly accessible charging points.
The Netherlands
68 200 charging stations installed in Amsterdam by 2013 (government
funded).
France
From 2012 all new buildings are required to have a charging point.
Tenants will have the right to install a charging point.
From 2015 all corporate parking will have EV charging points.
€1.5bn for charging points (1 million charging points target).
US States and local government involved in creating infrastructure.
US – California
69
Expedited planning for charging points (homes and businesses).
Incentives for employers to install charging points.
Introduce a pooling programme for corporations and government orders.
Canada Local stimulation of charging points totaling up to CA$1bn for green
vehicles.
Japan $135.3m spent on infrastructure by government this year.
150 fast charge points installed.
These different approaches all aim to support the uptake of EVs, however it is still too early to
assess the relative effectiveness of different strategies. From the government prospective
there can be a large difference in subsidy costs between strategies. In Japan a charging
infrastructure programme is being funded by government at considerable cost. However, the
financial case for fast charging points at present does not stack up. The high cost of the
charging point means that the electricity sale price required to create a stable business model
would be too high for consumers. This suggests that fast charge points require subsidies.
Japan is one of the largest markets for Evs and has benefitted this year from a price war
between manufacturers, further reducing the additional capital cost of Evs. This environment
of lower EV costs and a commitment to installation of charging infrastructure has created one
of the largest markets for Evs.
68
http://www.nuon.com/press/press-releases/20091106/index.jsp 69
http://www.afdc.energy.gov/afdc/progs/ind_state_laws.php/CA/HEV
EVs in the UK & Republic of Ireland Final report for WWF
54
In France the approach has been quite different, with the city planners and government
playing a crucial role. The introduction of legislation making it easy to install charging points,
mandatory installation for new buildings and corporate parking by 2015, should create
considerable charging infrastructure over the coming years with less strain on the government
purse (although the government expects the addition of one million charging points will require
€1.5bn in public spending). The approach in France to stimulating EV uptake has been led by
government with a public / private order for 50,000 Evs with the possibility of expansion to
100,000. Orders of this scale, combined with the €5,000 subsidy on privately purchased Evs,
have the potential to make the French EV fleet one of the largest in the world.
Manufacturing support
In addition to stimulating EV uptake, considerable sums are being reserved for investment in
EV research and manufacture. These funds have been created mainly by countries that have
existing vehicle manufacturing plants to help stimulate the automotive industry in their
respective countries. A summary of some of the countries investing in EV is given below.
Table 7: Summary of support for EV manufacture
Country Support for EV manufacture
UK Funding allocated to a new training centre for the low carbon vehicle
industry. The National Skills Academy for Sustainable Manufacturing and Innovation will be situated in Sunderland.
Austria Collective investment of €50m.
France €625m funding for battery plant.
Germany R&D funding up to €500m.
Sweden €90m for innovative projects.
US70
$2bn to fund US based manufacturers of EVs and EV batteries.
$400m for demonstration projects.
US – Michigan Tax credits for manufactures researching EV batteries.
Reduced property tax on industry involving EV manufacture.
US – other Demonstration grants funded locally (state or local administration).
China 71
10bn Yuan for automotive innovation, which includes EVs.
European strategy on clean and energy efficient vehicles
In April 2010 the European Commission published a communication on its strategy on clean
and energy efficient vehicles, which aims to contribute to the 2020 Europe target of ‘smart and
sustainable growth’.72
EVs are mentioned as one of a range of measures that form the
strategy, which recognises the need for common standards to allow all EVs to be charged and
to communicate with the electricity grid throughout the EU. The strategy document states that
the Commission will:
70
http://apps1.eere.energy.gov/news/progress_alerts.cfm/pa_id=152 71
http://www.nytimes.com/2009/04/11/business/energy-environment/11electric.html?_r=1 72
http://ec.europa.eu/enterprise/sectors/automotive/competitiveness-cars21/energy-efficient/communication_en.htm.
EVs in the UK & Republic of Ireland Final report for WWF
55
‘within the framework of Directive 98/34/EC, mandate the European standardisation
bodies in 2010 to develop by 2011 a standardised charging interface to ensure
interoperability and connectivity between the electricity supply point and the charger of
the electric vehicle, to address safety risks and electromagnetic compatibility and to
consider smart charging (the possibility for users to take advantage of the use of
electricity during" off peak hours";
identify a method to implement that standard, so that the interoperable interface is
adopted by all industry players, including vehicle manufacturers, electricity providers
and electricity distribution network operators;
constantly monitor global technological and market developments to update European
standards if necessary.’73
The strategy also recognises that any publicly assessable charging network requires definition
of standards on safety, interoperability and payment. The Commission has also state that it
will:
‘provide a leading role in working with Member States at national and regional level on
the build-up of charging and refuelling infrastructure in the EU;
explore with the European Investment Bank how to provide funding to stimulate
investment in infrastructure and services build-up for green vehicles.’74
6.1.4 UK policy context: summary
The UK has shown some commitment to supporting EV uptake, with a capital subsidy of up to
£5,000 per vehicle from 2011, and some regional spending on charging infrastructure.75
However, the UK has no uniform EV infrastructure policy or EV policy for public fleets. As in
the US, EV deployment is very region specific. The UK currently has no plans for creating
specific planning regulations for electric vehicle charging points; the current legislation means
planning actions are done on an ad-hoc basis for new developments. There are some clearer
details in the new draft London plan (currently under consultation) but these are still vague.
London has the highest concentration of charging points and EVs, which is mainly due to the
mayor’s office having sufficient control and funding to increase support for EV.
73
Communication from the Commission to the European Parliament, the Council and the European Economic and Social Committee: A European strategy on clean and energy efficient vehicles, p.10 (April 2010). 74
A European strategy on clean and energy efficient vehicles, p.11 (April 2010). 75
Of the original £230m budget for the capital cost grant scheme, only £43m has been committed from 2011 to March 2012. The level of additional funding will be assessed during the Government’s forthcoming spending review.
EVs in the UK & Republic of Ireland Final report for WWF
56
6.2 Business opportunities
6.2.1 Overcoming high capital cost of EVs
According to Frost and Sullivan, three out of four EVs sold in 2015 will be through new
business models.76
Business opportunities arising from the increased uptake of EV include
novel approaches to vehicle and battery leasing, and battery swap business models. These
new business models are likely to be similar to those of a mobile phone contract where the
high upfront capital cost is only partially paid for by the consumer, typically 10–60%, with the
remaining cost of the system being paid by a monthly charge which may include a certain
amount of electricity. Utility companies are likely to play a large role in this type of business
model but it will also present an opportunity for new players to enter the automotive market.
Battery leasing and swap technology has had considerable interest with Better Place providing
a public face to the battery swap community. There has been considerable resistance to
creating a common battery standard, but this will be required for the battery swap model to
reach its full potential. The use of battery swap technology could reduce range anxiety and
allow EVs to be used on longer journeys. The creation of battery swap stations would require
significant capital investment, which could only be recouped by achieving sufficiently high
utilisation factors. The battery swap model also requires some sort of battery leasing scheme
so that the consumer and vehicle manufactures would not have the potential to lose value or
warranty by swapping batteries.
6.2.2 Load balancing: vehicle to grid
Using EVs’ batteries as a storage medium for the grid (see section 5.4) is difficult to build a
business case around for balancing the grid for long periods. This is because the cost of
cycling the battery (battery degradation) would make the price of electricity too high. However
the use of batteries to meet short term grid fluctuations with high response times could be
possible and even profitable as the cost to the grid of meeting very short timescale fluctuations
is high. The cost of this fast response time electricity may rise over the coming years as more
of the high response fossil fuel power stations are taken off line and the share of renewables
on the grid increases. Increasing costs of fast response electricity will tend to increase the
viability of vehicle to grid as a peak lopping option.
6.2.3 Other opportunities
There are considerable opportunities for new supply chain or supporting industries such as
servicing companies not only for EVs but also for the charging points. These companies must
be created as the EV industry develops in the UK.
The UK has the potential to be a world leader in new battery technologies. With a strong
research background in solid state and ionic chemistry, the UK is ideally placed to develop
domestic manufacturing plants (such as the Renault Nissan plant scheduled for 2013 in
Sunderland) and research centres that specialise in EV battery technologies.
In addition to the passenger car market, the light goods vehicle (LGV) market offers some
potential for EVs. Given the limited range of pure BEVs, they will not be suited to all duty
76
http://www.frost.com/prod/servlet/market-insight-top.pag?Src=RSS&docid=165187779
EVs in the UK & Republic of Ireland Final report for WWF
57
cycles of LGVs. However, where the technical capability of EVs is sufficient for the vehicles to
meet the typical daily driving patterns of LGVs, the following advantages may be realised:
Many LGVs are used predominately for local journeys and it can be easier to predict
the expected driving patterns of LGVs than cars.
Businesses can typically take a longer term view than individuals in terms of time for
investments to pay back. This means that EVs, with relatively high capital costs but
lower running costs, are better suited to business consumers.
EVs can offer significant advantages over ICEVs in city driving, which can be
dominated by stop-start traffic. The EV drivetrain is far better suited to such conditions
than ICEVs.
Reasonably high utilisation of charge points may be achieved where EVs are
recharged centrally (e.g. depot charging).
Further trials of EVs in the LGV sector are required to prove the technology and provide
empirical data on the potential benefits of switching to EVs. Provided that trials of EVs for the
LGV sector are successful, it could represent an opportunity for early EV roll-out, both in the
private sector and in public sector organisations such as local councils.
6.3 Barriers to exploiting opportunities
A major barrier to EV uptake and therefore to exploitation of the opportunities outline above is
the high cost of batteries, which leads to high EV capital costs. This is recognised by
governments around the world, hence those with a commitment to supporting EVs are
providing subsidies (see section 6.1.3).
Battery swap technology requires considerable start-up funding for trials but also requires
some level of battery standardisation. Without cooperation from manufacturers, battery swap
operations on a large scale will remain difficult. Where battery leasing is used the potential to
use battery swapping is considerably increased. New business models surrounding battery
leasing are required with possible focus on the smart grid response potential along with the
potential for battery swap to be incorporated within the lease agreement.
Currently in the UK there are no planning structures specifically associated with EV charging.
This can make planning applications for EV charging points difficult for the developer. Unlike in
California and, in the near future France, the UK planning offices treat each application for EV
infrastructure on an individual basis. California has a fast track planning process for EV
infrastructure and incentives in place to encourage businesses to install charging points.
France is also implementing large reforms to planning applications so that all new buildings
will be required to install charging points and is providing powers that allow tenants of a
property to install a charging point. A clear planning policy for EV infrastructure could be used
to increase the number of charging points in the UK. Any such policy should be informed by a
strategic infrastructure plan to deliver maximum utility from investment in new infrastructure.

EVs in the UK & Republic of Ireland Final report for WWF
58
6.4 Policy incentives and business opportunities: conclusions
In the near term EVs require significant subsidy due to their high capital cost. This
could be mitigated in the future by new business models, including battery leasing.
The use of fast track planning applications for EV infrastructure could remove red tape
and increase the speed at which EV infrastructure could be built. The mandatory
installation of EV charging points for new buildings (as proposed in France) could be
used to send clear signals to the market.
The battery swap model is attractive insofar as it offers the potential to effectively
remove the range constraints of BEVs. However, significant barriers remain, including
the high cost of infrastructure and the need to achieve battery standardisation
between manufacturers.
EVs in the UK & Republic of Ireland Final report for WWF
59
7 Policy recommendations
7.1 Demand management and consumer choices
The historical trend of increasing demand for car travel must be halted if the transport
sector is to make its fair contribution towards meeting the UK’s CO2 reduction targets.
Policy mechanisms available to limit demand growth / reverse the trend of increasing
car-km include:
o Higher fuel prices and / or road pricing, including increased use of congestion
charging.
o Improved local infrastructure for walking and cycling to encourage modal shift
for short journeys.
o Increased car parking charges to encourage travel by alternative modes.
Workplace and residential car parking charges could be used to further
discourage car use.
o Spatial planning of new developments to take account of transport
implications to achieve a shift towards more short distance journeys.
o Facilitation of car clubs / lift sharing.
o Moratorium on major road building combined with investment in public
transport.
o Reduce the need for commuting journeys, for example through increased
telecommuting. The distance travelled for business could also be reduced
through increased use of teleconferencing and video conferencing.
Improvements to the efficiency of internal combustion engines will be crucial in
meeting emission reduction targets. Consumers should be incentivised to select
efficient models when making car purchasing decisions, for example through tax
breaks for the most efficient vehicles. Any banded tax regime should be reviewed
regularly to ensure best practice is always encouraged.
7.2 Electric vehicles and supporting infrastructure
Whilst EVs may not provide the bulk of short to medium term emissions savings, they will form
a key part of any long-term transport strategy that aims to reduce emissions and reduce the
transport sector’s reliance on oil. Along with actions to reduce demand for car travel, the
following are recommended actions to support the use and uptake of EVs:
Continue with field trials of EVs and ensure data gathered are shared to accelerate the
pace of learning.
Investigate the potential contribution of EVs in the non-passenger car sector. For
example, in the light goods vehicle market, public sector and corporate vehicle fleets.
Investment in research and development should be supported in order to position the
UK as one of the world’s leaders in EV technology.
Continue and extend capital cost subsidies for EVs to support the market and provide
greater certainty for investors.

EVs in the UK & Republic of Ireland Final report for WWF
60
Public sector to show leadership through integration of EVs into vehicle fleets.
Publicly available and visible charging infrastructure has a role to play. However, the
bulk of the investments in charging infrastructure should be informed by data on likely
utilisation rates and therefore expected payback periods.
7.3 National electricity grid
The vast majority of EVs are expected to recharge from the national grid, which is therefore a
key piece of infrastructure for EVs. Actions to maximise the benefits that EVs offer include:
Continue efforts to decarbonise the electricity grid to realise maximum carbon savings
from EVs.
Support research into demand management techniques in order to mitigate the risk of
EVs exacerbating peak demands and to reduce the need for marginal plant.
Ensure that EV roll-out projections are accounted for in capacity planning at the
national (national grid) and local (distribution network) levels.
EVs in the UK & Republic of Ireland Final report for WWF
61
8 Appendix
8.1 Literature review: national EV studies and other relevant
publications
The literature on electric vehicles and their potential role in future low carbon transportation
systems has grown significantly in recent years. This section summarises some of the major
EV publications relevant to this study, including pertinent details on the anticipated
performance of EVs and published views on the outlook for future EV uptake.
8.1.1 The King Review of low-carbon cars
Part I – the potential for CO2 reduction (October 2007)
The King Review was published in two parts. The first focuses on technology options and
potential carbon savings, including the scale of CO2 reductions possible, the extent to which
different sectors / agents can contribute, and the enabling technologies and behaviours. Key
chapters within the review include fuels, vehicle technologies, and consumer choices.
The study finds that in about a decade’s time new cars could have specific CO2 emissions
30% below 2007 levels with the implementation of available technology. In the medium term
(towards 2030), cars with specific emissions reductions of 50% could be widely available
through the use of battery-electric hybrids (including plug-in vehicles) and biofuels. An urgent
challenge for the short term identified in the report is to develop a strong market for low
emission cars, which will rely on consumers sending signals to manufacturers to make the
investments required to deliver low emission vehicles.
The review notes that complete decarbonisation of road transport in the period to 2030 is
unlikely. Rather, the study aims to set a ‘realistic ambition for 2030 that would constitute good
progress for the UK in the context of a longer-term goal of effectively eliminating CO2
emissions from vehicles close to zero’ (p.14). The level of ambition defined is somewhat lower
than that assumed in this project, with a reduction in total emissions from road transport of
30% by 2030 defined as an achievable scenario for the UK (p.16). However, this is against an
assumption that traffic growth will continue (as set out in the Foreword on p.1).
The report notes that in the long term electric or hydrogen-powered vehicles are a probability.
With sufficient availability of low or zero carbon electricity, battery-electric or hydrogen-electric
propulsion systems could be used to achieve near zero emissions on a well-to-wheel basis.
However, it is noted that ‘significant technical and cost challenges must be overcome before
these can become commercial’ (p.41).
Smarter driver choices are discussed as a means of achieving carbon savings. This includes
choosing more fuel-efficient car models, eco-driving measures (removing unnecessary weight,
keeping tyres properly inflated and smoother driving), avoiding low-value journeys, car
sharing, and modal shift (demand reduction).
In terms of vehicle technologies, indicative efficiency improvements and additional costs of
new engine and transmission technologies are set out. The technologies covered include:
direct injection and lean burn, variable valve actuation, downsizing energy capacity with
EVs in the UK & Republic of Ireland Final report for WWF
62
turbo/supercharging, dual clutch transmission, stop-start, regenerative braking, electric motor
assist, and reduced mechanical friction components. These can all be applied to standard
vehicles and could therefore be described as evolutionary rather than revolutionary changes.
Other cited measures that offer some scope for savings include weight-saving materials
(vehicle lightweighting), improved aerodynamics, and reduced rolling resistance tyres.
Part II – recommendations for action (March 2008)
The second part of the review builds on the analysis of Part I and recommends policy and
actions required to deliver the CO2 reduction potential identified. The policy recommendations
follow the themes of:
Reducing vehicle emissions
Cleaner fuels
Consumer choices
Research and development
The full review is available for download from:
http://webarchive.nationalarchives.gov.uk/+/http://www.hm-treasury.gov.uk/bud_bud08_king_review.htm.
8.1.2 Investigation into the scope for the transport sector to switch to
EV and PHEVs, Arup / Cenex for DfT and BERR
This study was commissioned by the Department for Business, Enterprise and Regulatory
Reform (BERR, now known as BIS) and the Department for Transport, and was published in
October 2008. The main aim was to understand better the contribution that electric vehicles
could make to long-term CO2 reduction in the UK’s transport sector in the context of technical
and economic viability questions around EVs.
The study defined four scenarios for the uptake of EVs:
Business as usual: represents the levels of EV uptake resulting from existing and
announced policies
Mid range: higher levels of EV uptake in line with increased environmental incentives.
Under this scenario sales of EVs are restricted to urban areas and overall sales of
EVs are limited as a result of their higher price and lower utility compared to ICEVs.
High range: EV uptake in a world with significant intervention to encourage EV sales.
Includes assumption that charging infrastructure is widely available in urban, suburban
and some rural areas; and that lifecycle costs of EVs are comparable with ICEVs by
around 2020.
Extreme: level of EV uptake in a future with very high demand for EVs and sales only
restricted in the short term by the availability of vehicles.
The following table summarises number of EVs in the UK car parc under each scenario from
the Arup / Cenex study.
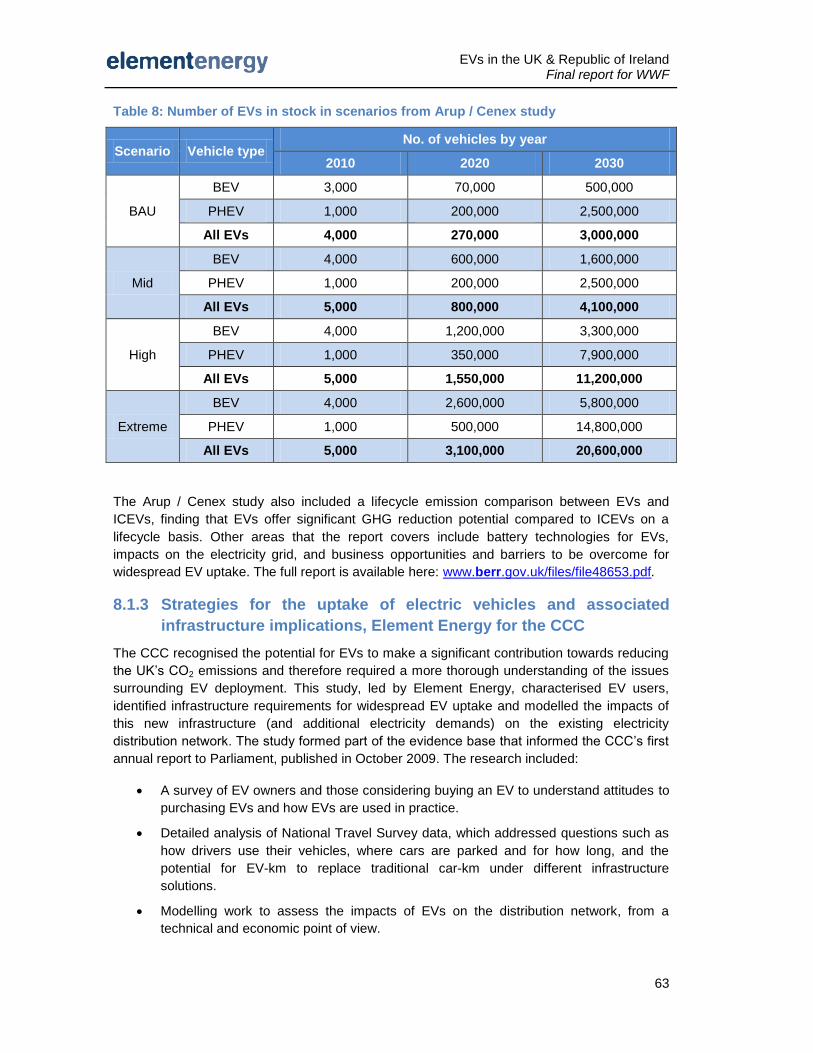
EVs in the UK & Republic of Ireland Final report for WWF
63
Table 8: Number of EVs in stock in scenarios from Arup / Cenex study
Scenario Vehicle type No. of vehicles by year
2010 2020 2030
BAU
BEV 3,000 70,000 500,000
PHEV 1,000 200,000 2,500,000
All EVs 4,000 270,000 3,000,000
Mid
BEV 4,000 600,000 1,600,000
PHEV 1,000 200,000 2,500,000
All EVs 5,000 800,000 4,100,000
High
BEV 4,000 1,200,000 3,300,000
PHEV 1,000 350,000 7,900,000
All EVs 5,000 1,550,000 11,200,000
Extreme
BEV 4,000 2,600,000 5,800,000
PHEV 1,000 500,000 14,800,000
All EVs 5,000 3,100,000 20,600,000
The Arup / Cenex study also included a lifecycle emission comparison between EVs and
ICEVs, finding that EVs offer significant GHG reduction potential compared to ICEVs on a
lifecycle basis. Other areas that the report covers include battery technologies for EVs,
impacts on the electricity grid, and business opportunities and barriers to be overcome for
widespread EV uptake. The full report is available here: www.berr.gov.uk/files/file48653.pdf.
8.1.3 Strategies for the uptake of electric vehicles and associated
infrastructure implications, Element Energy for the CCC
The CCC recognised the potential for EVs to make a significant contribution towards reducing
the UK’s CO2 emissions and therefore required a more thorough understanding of the issues
surrounding EV deployment. This study, led by Element Energy, characterised EV users,
identified infrastructure requirements for widespread EV uptake and modelled the impacts of
this new infrastructure (and additional electricity demands) on the existing electricity
distribution network. The study formed part of the evidence base that informed the CCC’s first
annual report to Parliament, published in October 2009. The research included:
A survey of EV owners and those considering buying an EV to understand attitudes to
purchasing EVs and how EVs are used in practice.
Detailed analysis of National Travel Survey data, which addressed questions such as
how drivers use their vehicles, where cars are parked and for how long, and the
potential for EV-km to replace traditional car-km under different infrastructure
solutions.
Modelling work to assess the impacts of EVs on the distribution network, from a
technical and economic point of view.
EVs in the UK & Republic of Ireland Final report for WWF
64
An assessment of the potential CO2 savings from EV uptake and the sensitivity to
factors such as carbon intensity of grid electricity.
Some of the key conclusions include:
High capital costs combined with lower utility remain the largest barriers to EV uptake
in the UK.
Limited range was often stated as a concern in the consumer survey. Drivers place a
high value on the ability to drive long distances, even though the frequency of long
distance trips is low for most people.
The full technical range of EVs is significantly underexploited in practice, with one third
to one half of the technical range typically utilised. This is a response to limited
recharging opportunities, long recharge times and concerns over the reliability of new
technology.
The driving patterns of a significant proportion of the UK population are dominated by
relatively low daily distances. For example, half the people in the sample analysed did
not exceed 40km (25 miles) on any day of the travel diary week.
Commuting is the dominant trip purpose, with circa one-quarter of all car trips being
undertaken with getting to or from work as the primary reason for travel.
Around two-thirds of commuting trips are less than 16km (10 miles). This suggests
that there are a significant number of commuters with round-trip commutes of less
than 20 miles. This means that the needs of many commuters could be met by an EV
with a technical range of around 100km, for example.
In terms of infrastructure, it was shown that residential and workplace recharging
points are likely to be the most important charging facilities as they offer a far more
cost effective solution than publicly available recharging points.
Publicly available fast charge points could have a role to play in sending signals to the
market and increasing the portion of a vehicle’s technical range that the drive is willing
to utilise. However, they are a costly solution and should therefore not form the core of
any new infrastructure proposal.
The final report is available for download from the CCC’s website:
www.theccc.org.uk/reports/progress-reports/1st-progress-report/supporting-research-.
8.1.4 Plugged-in Vehicles Economics and Infrastructure Project, mixed
consortia for the Energy Technologies Institute
This ETI-funded programme includes research projects worth £4.5m as part of an £11m plan
to support the roll-out of plug-in vehicles in the UK. The research is based around three main
workstreams:
Consumers and vehicles: research into consumer behaviour, including attitudes to
vehicles and factors affecting purchasing decisions, to build an EV uptake model.
Electricity distribution and intelligent infrastructure: includes consideration of the
barriers to deployment of charging infrastructure, evaluation of alternative means of

EVs in the UK & Republic of Ireland Final report for WWF
65
providing the infrastructure, and development of intelligent architecture to enable the
system to be operated and managed effectively.
Economics and carbon benefits: evaluation of the economics of plug-in vehicle
system, including quantification of the revenue streams that may be required for the
financial feasibility of a plug-in vehicle system in the UK. Also analyse the carbon
benefits of increased EV market penetration under future uptake scenarios.
The project began in March 2010 and the final deliverables are expected in the first quarter of
2011. The work is being delivered by consortia including industry, academic and consultancy
expertise. A central aim of the work is to provide robust guidance on how to best invest the
funds pledged to support EVs over the coming years through consumer incentives and
infrastructure deployment.
8.1.5 Electric Vehicles in Scotland: Emission Reductions and
Infrastructure Needs, Element Energy for WWF Scotland
This research project focused on the role that EVs could play in reducing CO2 emissions from
road transport in Scotland. A number of scenarios of low carbon vehicle use were developed,
taking into account realistic targets for EV uptake or specific targets for emission reductions.
The project included an evaluation of the potential CO2 emission reductions, analysis of the
infrastructure requirements to support EV uptake, calculation of the impacts of EVs on urban
air quality and an assessment of the implications for renewable energy generation. Some of
the main conclusions regarding the CO2 impact of EV uptake are:
Business as usual (little EV uptake) leads to a CO2 saving of around 40% in the
passenger car sector under the traffic stabilisation scenario. This relies on
achievement of the 2021 traffic stabilisation target for Scotland, and the realisation of
improvements in ICE efficiency in line with EU directives for new car CO2 emissions.
Improvements in ICE emissions characteristics also lead to CO2 savings relative to
1990 levels under the traffic growth scenario. However, in this case the savings under
BAU are around 20% relative to 1990 emissions.
A 43% reduction in emissions from cars by 2020 (the 2020 target) is beyond the
anticipated savings from EV uptake in the Upper scenario under traffic stabilisation
and traffic growth. Further measures are required for this target to be met.
The contribution that EVs will have to make towards meeting ambitions CO2 reduction
targets depends strongly on future traffic growth. Other methods for reducing
emissions such as technological advances in internal combustion engine cars, modal
shift towards greater public transport use and changing driver behaviour will have an
important part to play in reducing the environmental impact of cars.
If demand for car travel continues on a growth path in line with historical trends, a
maximum CO2 saving of around 21.5% relative to 1990 levels may be achieved under
the Upper scenario by 2020. This means that for deep CO2 cuts efforts to curb
demand for car travel in Scotland must be effective.
Both the full report and a summary report produced by WWF Scotland are available from the
WWF Scotland website:
http://scotland.wwf.org.uk/what_we_do/tackling_climate_change/electric_vehicles/
EVs in the UK & Republic of Ireland Final report for WWF
66
8.1.6 Plugged In – The End Of The Oil Age, WWF
This report highlights the challenge facing the transport sector, which is more dependent on
one source of primary energy than any other. According to the study, transport is 95%
dependent on oil. The main focus of the work is solutions to break the link between the oil and
the transport sector. The key points are as follows:
Diversification of (fuel) supply is a key aspect of achieving security of energy supplies.
However, the world’s remaining oil reserves are concentrated in relatively few
countries (over three quarters of reserves are in the eleven OPEC member states).
This presents a significant barrier to achieving security of supply.
In response to the challenge of reducing oil supplies oil companies are developing
substitutes for crude oil known as ‘alternative fuels’. However, many of these
alternative fuels (e.g. from oil sands, coal-to-liquids and gas-to-liquids) have
environmental impacts worse than conventional crude oil.
The report highlights a range of options available to improve the efficiency of the
automotive fleet (including car sharing, vehicle downsizing, efficient auxiliary
components, simple hybridising, and many of the other measures summarised in
section 8.3.7). However, it argues that a transformational change is required to break
the dependency of the transport sector on liquid hydrocarbon fuels.
Electrification of automotive transport is promoted as a means of reducing reliance on
hydrocarbon fuels and transitioning to a sustainable renewable energy future.
8.1.7 Coventry and Birmingham Low Emission Vehicle Demonstrators
The CABLED project aims to develop the West Midlands and the UK as ‘a leader in low
carbon vehicle technology and its deployment’.77
CABLED is a consortium of 13 companies,
part funded by the Technology Strategy Board and Advantage West Midlands, and the project
aims to demonstrate that EVs are a practical alternative to conventional vehicles. This involves
installation of a network of charging points and a trial of EVs. Six manufacturers are
contributing vehicles to the project, which comprise a mix of BEVs, PHEVs and hydrogen fuel
cell vehicles available for a 12 month lease.
The first results of the project were published in June 2010, reporting on the first quarter of use
of 25 Mitsubishi i-MiEVs (between mid December 2009 and mid March 2010). Key findings
from the press release are:78
Distance
Electric vehicle drivers use their cars like the typical UK driver – the majority of
journeys are less than five miles (at similar distances, when warming up conventional
car engines are at their most polluting, and catalytic converters are at their least
effective).
Average daily mileage is 23 miles (well within the i-MiEVs‟s 80 mile range).
77
http://cabled.org.uk/the-project. 78
http://cabled.org.uk/press.

EVs in the UK & Republic of Ireland Final report for WWF
67
Drivers
Drivers use the entire speed range of the car, showing they are happy to drive at
motorway speeds when required.
The vehicles were driven in all temperatures as low as -10 degrees Celsius,
throughout the winter period. There was a drop-off in usage at very low temperatures,
likely to be the result of reduced car usage during extremely cold weather, when only
essential journeys are made.
Energy use and charging
Vehicles are parked for 97% of the time, typically overnight and during school hours,
allowing lengthy battery charging periods at home and work.
Although vehicles only use the electricity needed to charge them they were left
plugged in for more than 20% of the time, occasionally for several days at a time.

EVs in the UK & Republic of Ireland Final report for WWF
68
8.2 Details of methodology
8.2.1 Scenarios for EV uptake: further details
Introduction to core scenarios
The scenario-based approach used in this study is introduced in section 2.3 and the scenarios
are defined in section 3.1. Calculation of the carbon impact of different levels of EV uptake
depends on a range of factors (see section 8.2.3), which means it is necessary to assign
values to various other parameters. Efforts have been made to make the scenarios internally
consistent through appropriate choice of the values of these other parameters.79
. The three
core scenarios are:
Business as Usual (BAU): potential levels of EV uptake under policies currently in
place or announced. EVs remain relatively niche under BAU, representing 0.5% of the
total car stock in 2020 and 5% by 2030.
Extended: more ambitious EV uptake levels, in line with the indictor figures defined in
the CCC’s October 2009 report.80
Stretch: EV uptake unconstrained by demand side considerations such that the
passenger car market makes an appropriate contribution to emissions reduction in line
with a cut in total UK emissions of 42% by 2020.
Definition of internally consistent scenarios
The uptake of EVs will depend on a range of interrelated factors, some of which are
summarised in the diagram below.
79
The sensitivity of the results to the assumptions behind the core scenarios can be tested by varying parameters of interest. Sensitivity testing results are included in section 8.6. 80
Meeting Carbon Budgets – the need for a step change, Progress Report to Parliament by the Committee on Climate Change (October 2009).
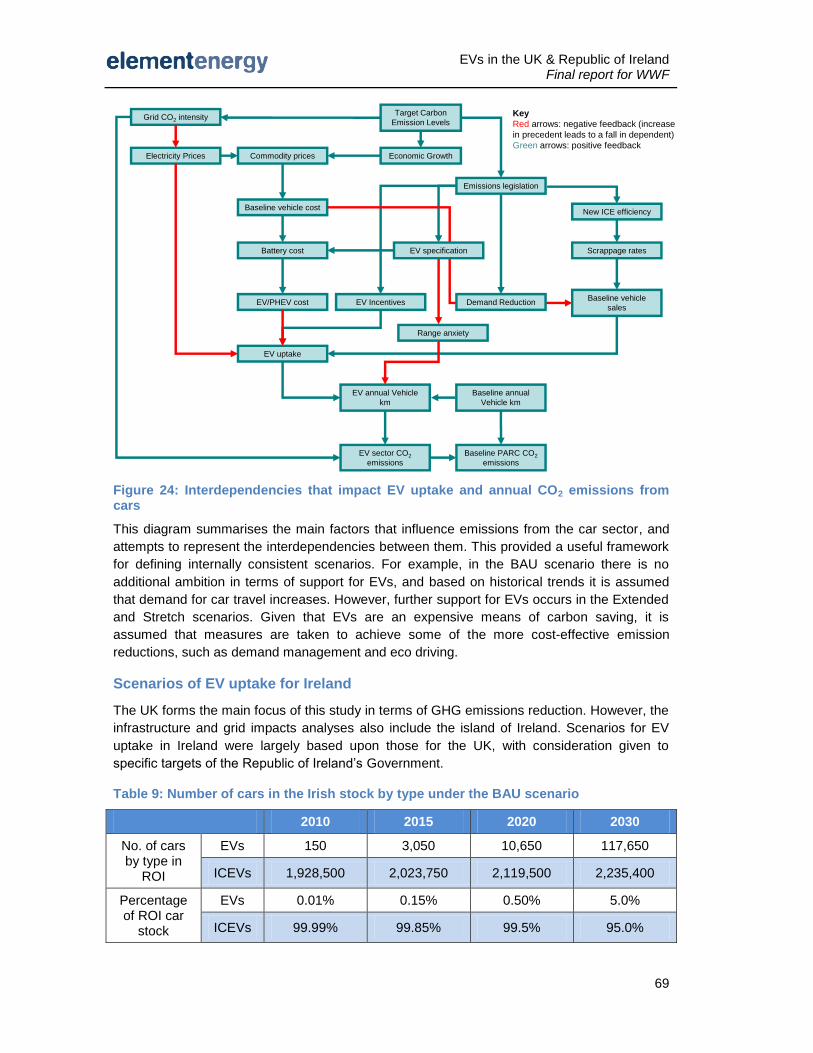
EVs in the UK & Republic of Ireland Final report for WWF
69
Figure 24: Interdependencies that impact EV uptake and annual CO2 emissions from cars
This diagram summarises the main factors that influence emissions from the car sector, and
attempts to represent the interdependencies between them. This provided a useful framework
for defining internally consistent scenarios. For example, in the BAU scenario there is no
additional ambition in terms of support for EVs, and based on historical trends it is assumed
that demand for car travel increases. However, further support for EVs occurs in the Extended
and Stretch scenarios. Given that EVs are an expensive means of carbon saving, it is
assumed that measures are taken to achieve some of the more cost-effective emission
reductions, such as demand management and eco driving.
Scenarios of EV uptake for Ireland
The UK forms the main focus of this study in terms of GHG emissions reduction. However, the
infrastructure and grid impacts analyses also include the island of Ireland. Scenarios for EV
uptake in Ireland were largely based upon those for the UK, with consideration given to
specific targets of the Republic of Ireland’s Government.
Table 9: Number of cars in the Irish stock by type under the BAU scenario
2010 2015 2020 2030
No. of cars by type in
ROI
EVs 150 3,050 10,650 117,650
ICEVs 1,928,500 2,023,750 2,119,500 2,235,400
Percentage of ROI car
stock
EVs 0.01% 0.15% 0.50% 5.0%
ICEVs 99.99% 99.85% 99.5% 95.0%
Key
Red arrows: negative feedback (increase
in precedent leads to a fall in dependent)
Green arrows: positive feedback
Target Carbon
Emission Levels
Economic Growth
Emissions legislation
New ICE efficiency
Scrappage rates
Baseline PARC CO2
emissions
Baseline annual
Vehicle km
Commodity prices
Baseline vehicle cost
Battery cost
EV/PHEV cost EV Incentives
EV uptake
EV annual Vehicle
km
EV sector CO2
emissions
Grid CO2 intensity
Electricity Prices
Baseline vehicle
sales
EV specification
Demand Reduction
Range anxiety
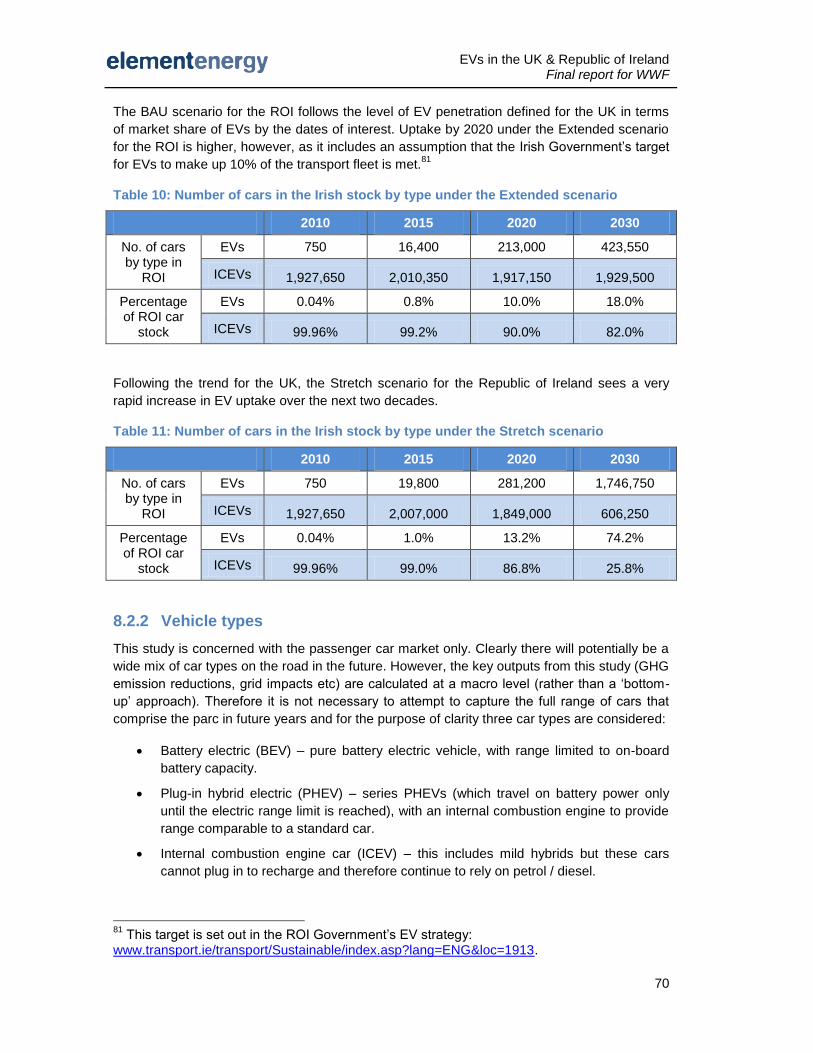
EVs in the UK & Republic of Ireland Final report for WWF
70
The BAU scenario for the ROI follows the level of EV penetration defined for the UK in terms
of market share of EVs by the dates of interest. Uptake by 2020 under the Extended scenario
for the ROI is higher, however, as it includes an assumption that the Irish Government’s target
for EVs to make up 10% of the transport fleet is met.81
Table 10: Number of cars in the Irish stock by type under the Extended scenario
2010 2015 2020 2030
No. of cars by type in
ROI
EVs 750 16,400 213,000 423,550
ICEVs 1,927,650 2,010,350 1,917,150 1,929,500
Percentage of ROI car
stock
EVs 0.04% 0.8% 10.0% 18.0%
ICEVs 99.96% 99.2% 90.0% 82.0%
Following the trend for the UK, the Stretch scenario for the Republic of Ireland sees a very
rapid increase in EV uptake over the next two decades.
Table 11: Number of cars in the Irish stock by type under the Stretch scenario
2010 2015 2020 2030
No. of cars by type in
ROI
EVs 750 19,800 281,200 1,746,750
ICEVs 1,927,650 2,007,000 1,849,000 606,250
Percentage of ROI car
stock
EVs 0.04% 1.0% 13.2% 74.2%
ICEVs 99.96% 99.0% 86.8% 25.8%
8.2.2 Vehicle types
This study is concerned with the passenger car market only. Clearly there will potentially be a
wide mix of car types on the road in the future. However, the key outputs from this study (GHG
emission reductions, grid impacts etc) are calculated at a macro level (rather than a ‘bottom-
up’ approach). Therefore it is not necessary to attempt to capture the full range of cars that
comprise the parc in future years and for the purpose of clarity three car types are considered:
Battery electric (BEV) – pure battery electric vehicle, with range limited to on-board
battery capacity.
Plug-in hybrid electric (PHEV) – series PHEVs (which travel on battery power only
until the electric range limit is reached), with an internal combustion engine to provide
range comparable to a standard car.
Internal combustion engine car (ICEV) – this includes mild hybrids but these cars
cannot plug in to recharge and therefore continue to rely on petrol / diesel.
81
This target is set out in the ROI Government’s EV strategy: www.transport.ie/transport/Sustainable/index.asp?lang=ENG&loc=1913.
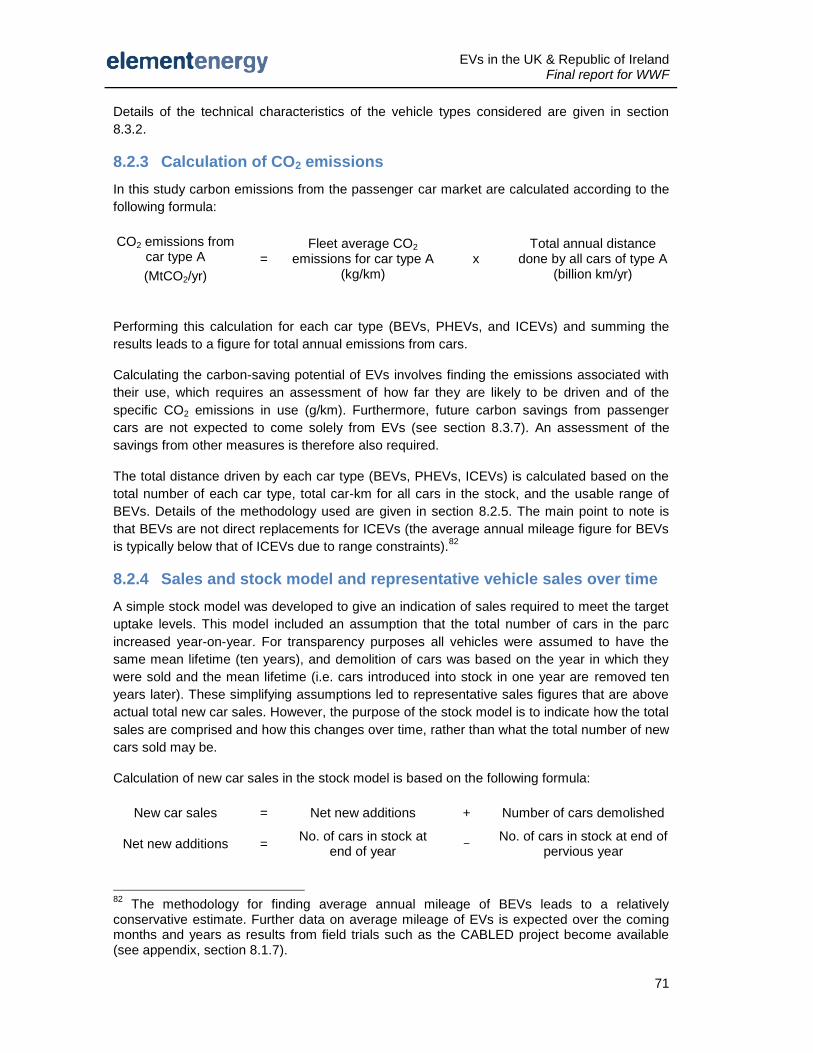
EVs in the UK & Republic of Ireland Final report for WWF
71
Details of the technical characteristics of the vehicle types considered are given in section
8.3.2.
8.2.3 Calculation of CO2 emissions
In this study carbon emissions from the passenger car market are calculated according to the
following formula:
CO2 emissions from car type A
(MtCO2/yr)
= Fleet average CO2
emissions for car type A (kg/km)
x Total annual distance
done by all cars of type A (billion km/yr)
Performing this calculation for each car type (BEVs, PHEVs, and ICEVs) and summing the
results leads to a figure for total annual emissions from cars.
Calculating the carbon-saving potential of EVs involves finding the emissions associated with
their use, which requires an assessment of how far they are likely to be driven and of the
specific CO2 emissions in use (g/km). Furthermore, future carbon savings from passenger
cars are not expected to come solely from EVs (see section 8.3.7). An assessment of the
savings from other measures is therefore also required.
The total distance driven by each car type (BEVs, PHEVs, ICEVs) is calculated based on the
total number of each car type, total car-km for all cars in the stock, and the usable range of
BEVs. Details of the methodology used are given in section 8.2.5. The main point to note is
that BEVs are not direct replacements for ICEVs (the average annual mileage figure for BEVs
is typically below that of ICEVs due to range constraints).82
8.2.4 Sales and stock model and representative vehicle sales over time
A simple stock model was developed to give an indication of sales required to meet the target
uptake levels. This model included an assumption that the total number of cars in the parc
increased year-on-year. For transparency purposes all vehicles were assumed to have the
same mean lifetime (ten years), and demolition of cars was based on the year in which they
were sold and the mean lifetime (i.e. cars introduced into stock in one year are removed ten
years later). These simplifying assumptions led to representative sales figures that are above
actual total new car sales. However, the purpose of the stock model is to indicate how the total
sales are comprised and how this changes over time, rather than what the total number of new
cars sold may be.
Calculation of new car sales in the stock model is based on the following formula:
New car sales = Net new additions + Number of cars demolished
Net new additions = No. of cars in stock at
end of year -
No. of cars in stock at end of pervious year
82
The methodology for finding average annual mileage of BEVs leads to a relatively conservative estimate. Further data on average mileage of EVs is expected over the coming months and years as results from field trials such as the CABLED project become available (see appendix, section 8.1.7).
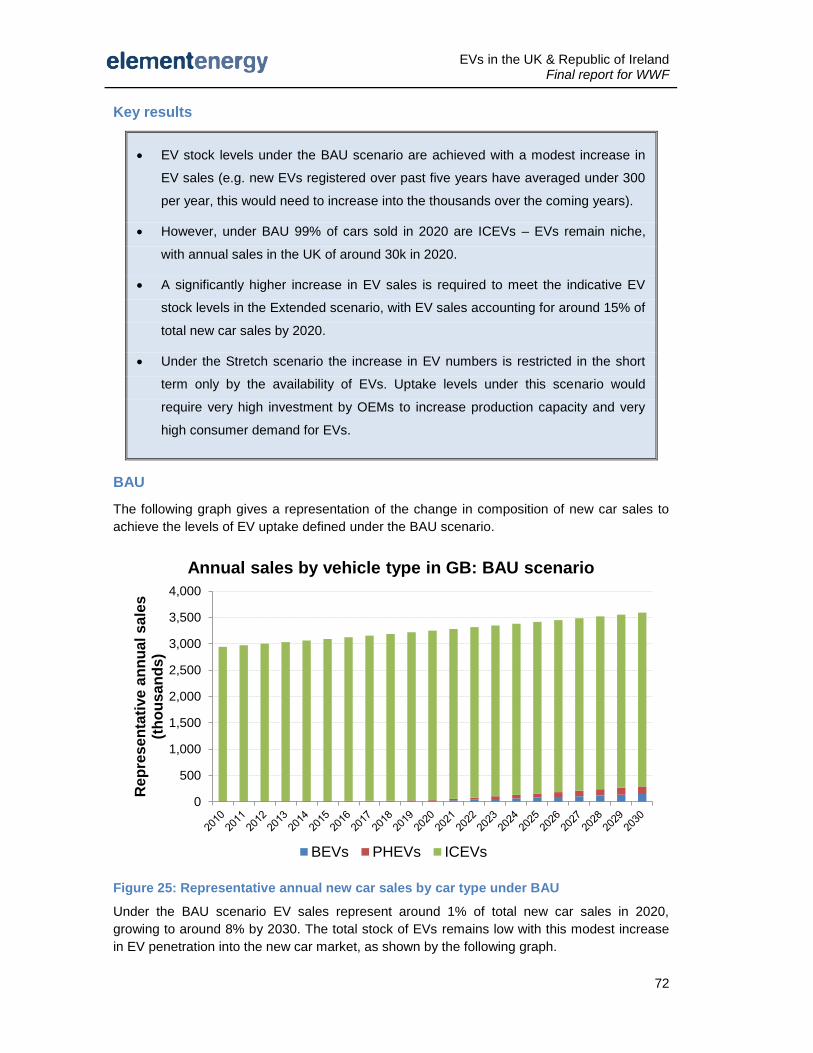
EVs in the UK & Republic of Ireland Final report for WWF
72
Key results
EV stock levels under the BAU scenario are achieved with a modest increase in
EV sales (e.g. new EVs registered over past five years have averaged under 300
per year, this would need to increase into the thousands over the coming years).
However, under BAU 99% of cars sold in 2020 are ICEVs – EVs remain niche,
with annual sales in the UK of around 30k in 2020.
A significantly higher increase in EV sales is required to meet the indicative EV
stock levels in the Extended scenario, with EV sales accounting for around 15% of
total new car sales by 2020.
Under the Stretch scenario the increase in EV numbers is restricted in the short
term only by the availability of EVs. Uptake levels under this scenario would
require very high investment by OEMs to increase production capacity and very
high consumer demand for EVs.
BAU
The following graph gives a representation of the change in composition of new car sales to
achieve the levels of EV uptake defined under the BAU scenario.
Figure 25: Representative annual new car sales by car type under BAU
Under the BAU scenario EV sales represent around 1% of total new car sales in 2020,
growing to around 8% by 2030. The total stock of EVs remains low with this modest increase
in EV penetration into the new car market, as shown by the following graph.
0
500
1,000
1,500
2,000
2,500
3,000
3,500
4,000
Re
pre
se
nta
tive
an
nu
al s
ale
s
(th
ou
sa
nd
s)
Annual sales by vehicle type in GB: BAU scenario
BEVs PHEVs ICEVs
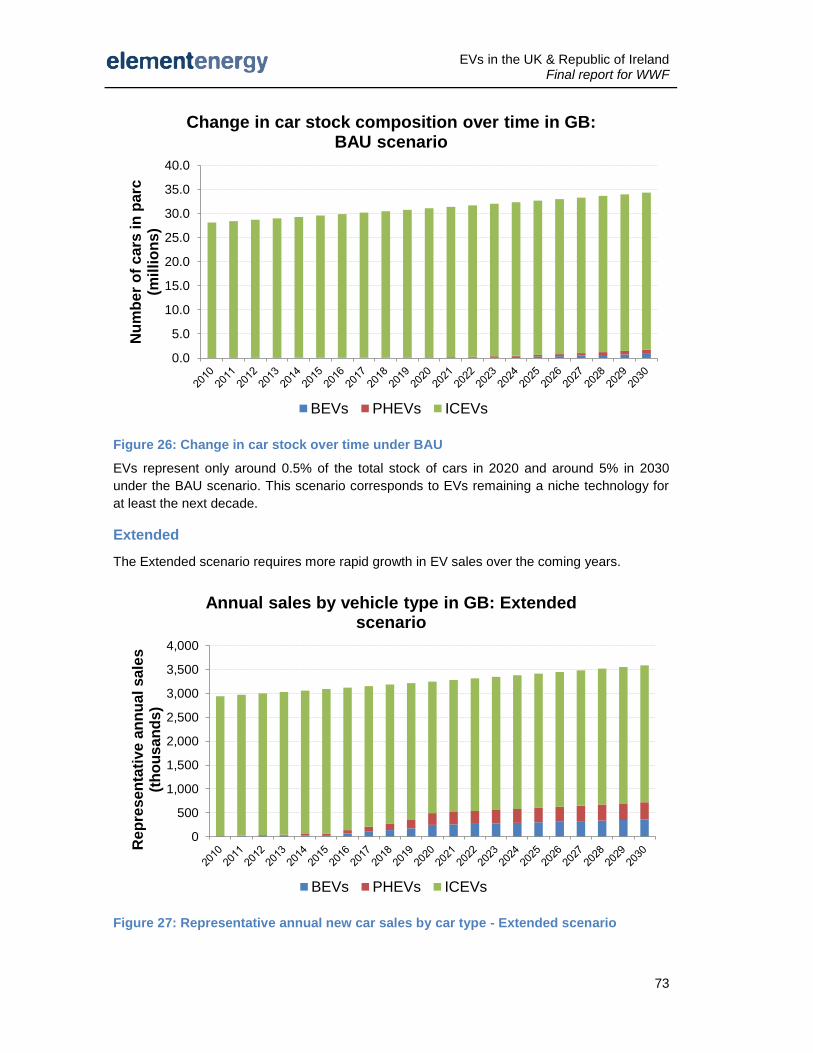
EVs in the UK & Republic of Ireland Final report for WWF
73
Figure 26: Change in car stock over time under BAU
EVs represent only around 0.5% of the total stock of cars in 2020 and around 5% in 2030
under the BAU scenario. This scenario corresponds to EVs remaining a niche technology for
at least the next decade.
Extended
The Extended scenario requires more rapid growth in EV sales over the coming years.
Figure 27: Representative annual new car sales by car type - Extended scenario
0.0
5.0
10.0
15.0
20.0
25.0
30.0
35.0
40.0
Nu
mb
er
of
ca
rs in
pa
rc(m
illi
on
s)
Change in car stock composition over time in GB: BAU scenario
BEVs PHEVs ICEVs
0
500
1,000
1,500
2,000
2,500
3,000
3,500
4,000
Re
pre
sen
tati
ve
an
nu
al
sa
les
(t
ho
us
an
ds
)
Annual sales by vehicle type in GB: Extended scenario
BEVs PHEVs ICEVs
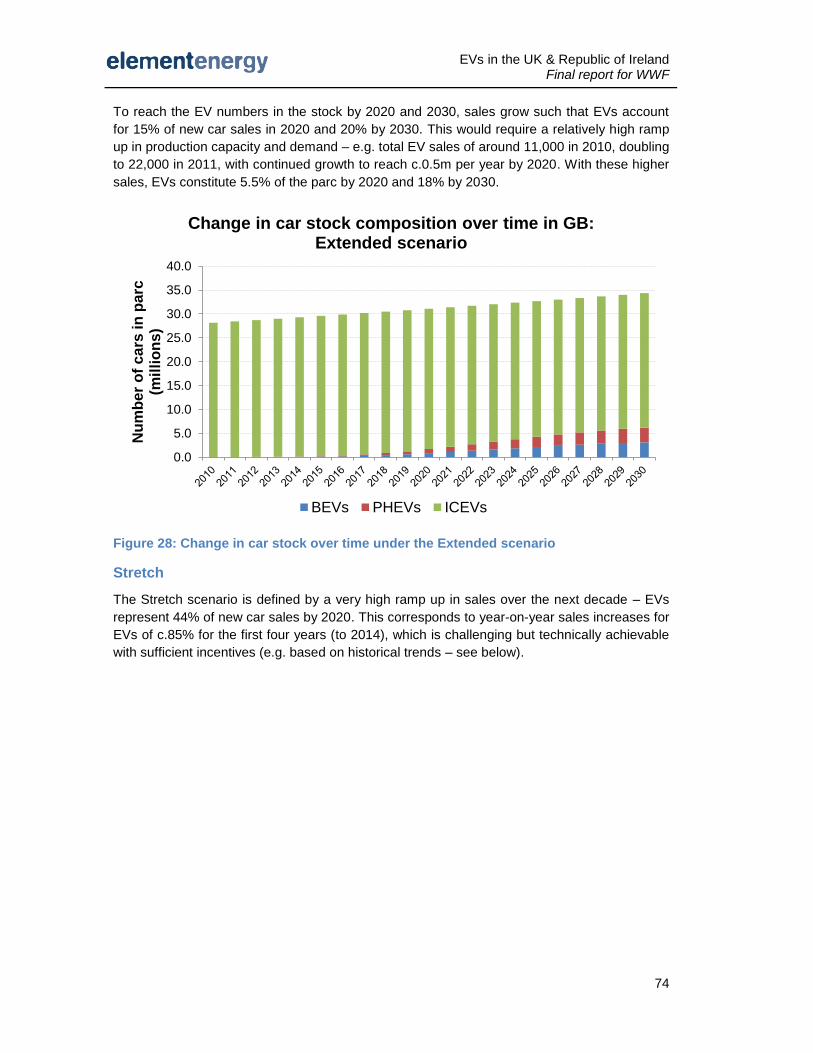
EVs in the UK & Republic of Ireland Final report for WWF
74
To reach the EV numbers in the stock by 2020 and 2030, sales grow such that EVs account
for 15% of new car sales in 2020 and 20% by 2030. This would require a relatively high ramp
up in production capacity and demand – e.g. total EV sales of around 11,000 in 2010, doubling
to 22,000 in 2011, with continued growth to reach c.0.5m per year by 2020. With these higher
sales, EVs constitute 5.5% of the parc by 2020 and 18% by 2030.
Figure 28: Change in car stock over time under the Extended scenario
Stretch
The Stretch scenario is defined by a very high ramp up in sales over the next decade – EVs
represent 44% of new car sales by 2020. This corresponds to year-on-year sales increases for
EVs of c.85% for the first four years (to 2014), which is challenging but technically achievable
with sufficient incentives (e.g. based on historical trends – see below).
0.0
5.0
10.0
15.0
20.0
25.0
30.0
35.0
40.0
Nu
mb
er
of
ca
rs in
pa
rc(m
illi
on
s)
Change in car stock composition over time in GB: Extended scenario
BEVs PHEVs ICEVs
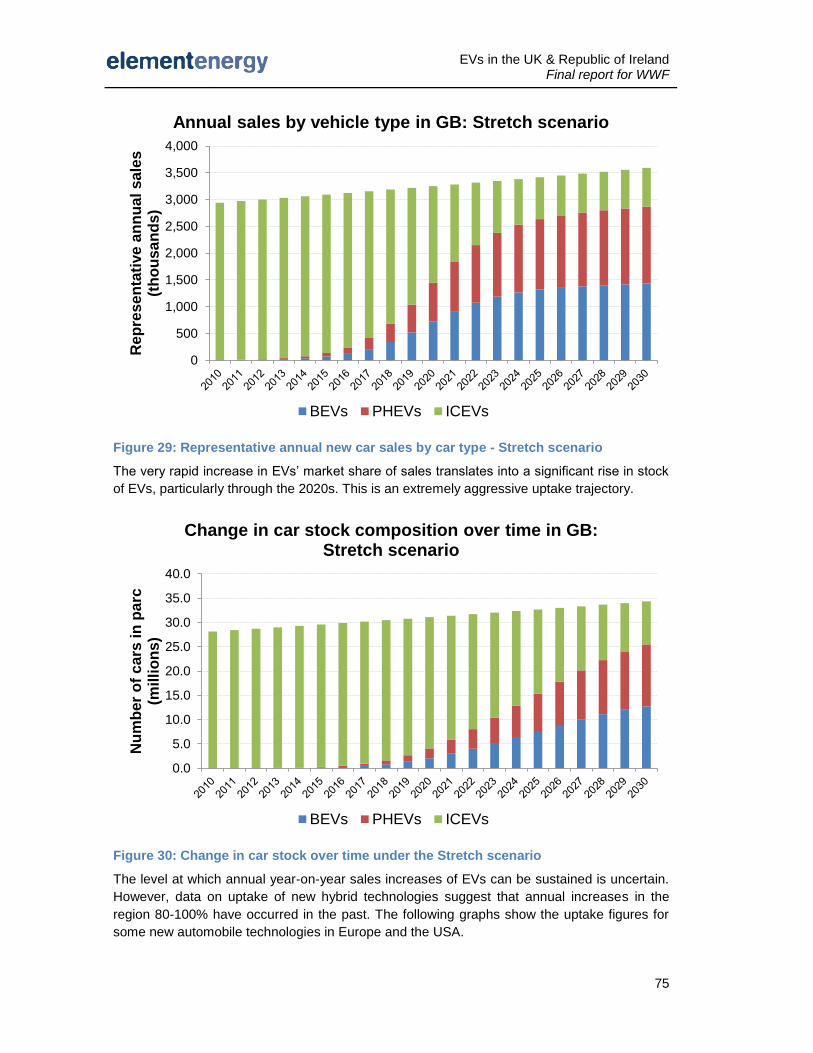
EVs in the UK & Republic of Ireland Final report for WWF
75
Figure 29: Representative annual new car sales by car type - Stretch scenario
The very rapid increase in EVs’ market share of sales translates into a significant rise in stock
of EVs, particularly through the 2020s. This is an extremely aggressive uptake trajectory.
Figure 30: Change in car stock over time under the Stretch scenario
The level at which annual year-on-year sales increases of EVs can be sustained is uncertain.
However, data on uptake of new hybrid technologies suggest that annual increases in the
region 80-100% have occurred in the past. The following graphs show the uptake figures for
some new automobile technologies in Europe and the USA.
0
500
1,000
1,500
2,000
2,500
3,000
3,500
4,000R
ep
res
en
tati
ve
an
nu
al s
ale
s
(th
ou
sa
nd
s)
Annual sales by vehicle type in GB: Stretch scenario
BEVs PHEVs ICEVs
0.0
5.0
10.0
15.0
20.0
25.0
30.0
35.0
40.0
Nu
mb
er
of
ca
rs in
pa
rc(m
illi
on
s)
Change in car stock composition over time in GB: Stretch scenario
BEVs PHEVs ICEVs
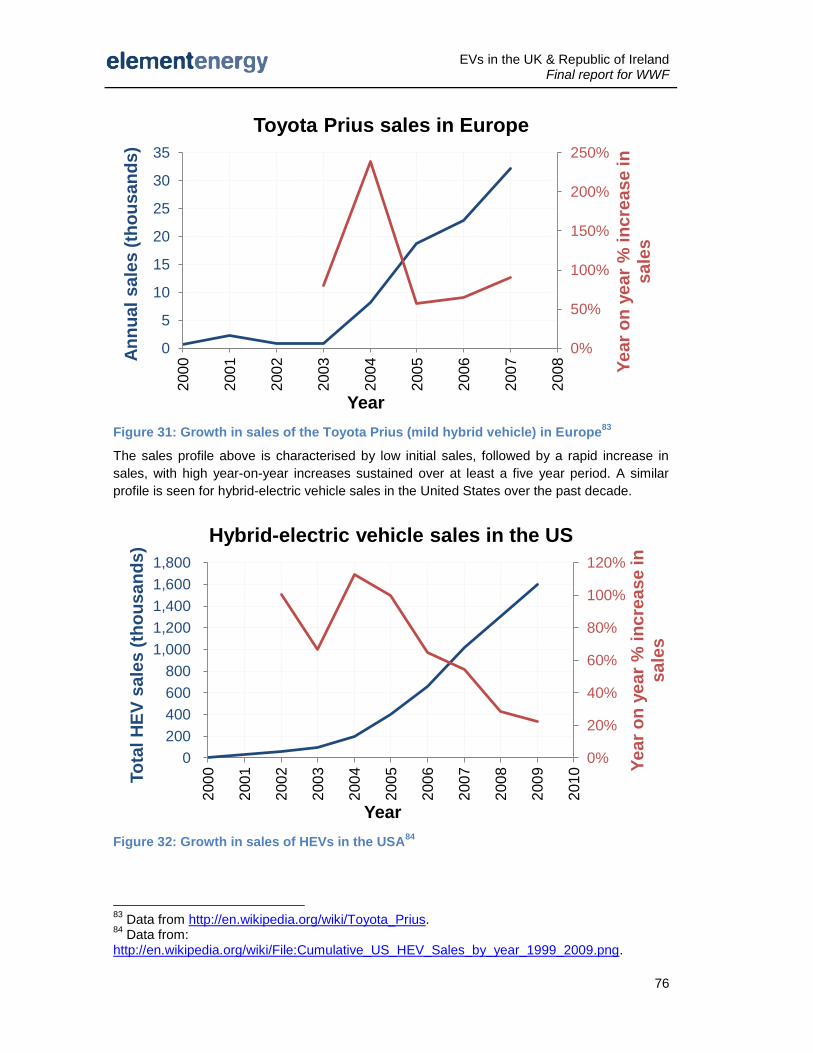
EVs in the UK & Republic of Ireland Final report for WWF
76
Figure 31: Growth in sales of the Toyota Prius (mild hybrid vehicle) in Europe83
The sales profile above is characterised by low initial sales, followed by a rapid increase in
sales, with high year-on-year increases sustained over at least a five year period. A similar
profile is seen for hybrid-electric vehicle sales in the United States over the past decade.
Figure 32: Growth in sales of HEVs in the USA84
83
Data from http://en.wikipedia.org/wiki/Toyota_Prius. 84
Data from: http://en.wikipedia.org/wiki/File:Cumulative_US_HEV_Sales_by_year_1999_2009.png.
0%
50%
100%
150%
200%
250%
0
5
10
15
20
25
30
35
200
0
200
1
200
2
200
3
200
4
200
5
200
6
200
7
200
8 Year
on
year
% i
ncre
ase in
sale
s
An
nu
al
sale
s (
tho
usan
ds)
Year
Toyota Prius sales in Europe
0%
20%
40%
60%
80%
100%
120%
0
200
400
600
800
1,000
1,200
1,400
1,600
1,800
200
0
200
1
200
2
200
3
200
4
200
5
200
6
200
7
200
8
200
9
2010 Y
ea
r o
n y
ea
r %
in
cre
as
e in
sale
s
To
tal H
EV
sa
les
(th
ou
sa
nd
s)
Year
Hybrid-electric vehicle sales in the US
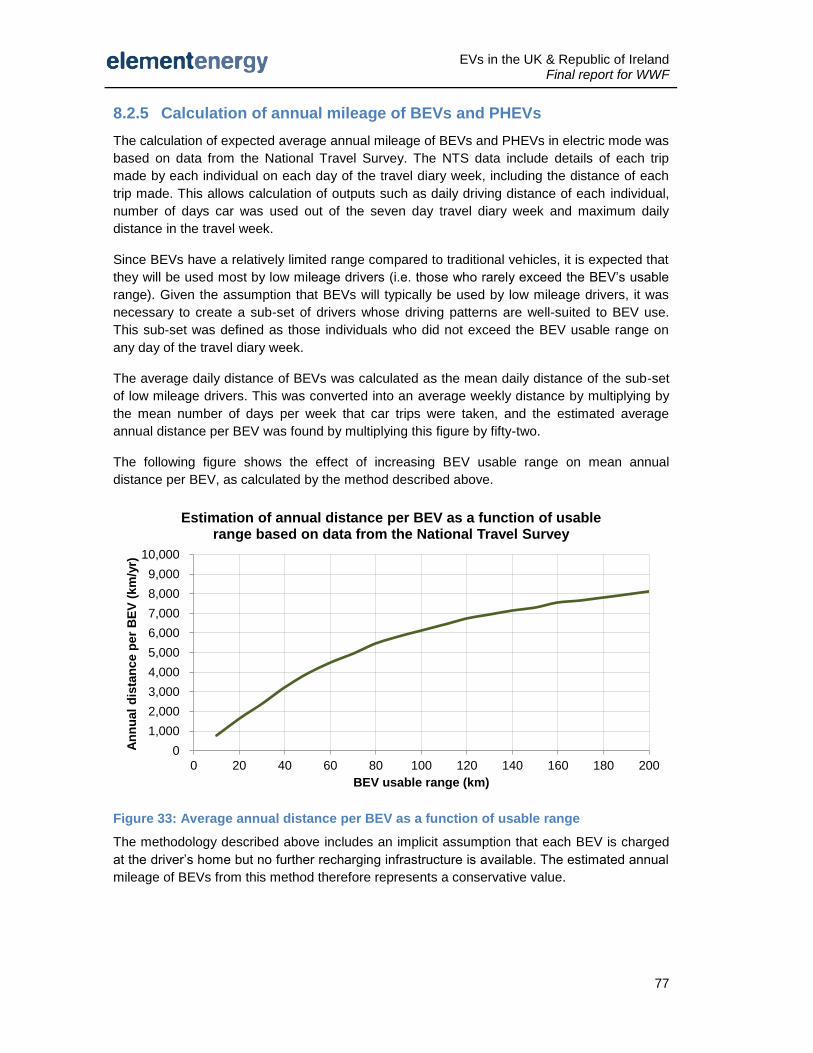
EVs in the UK & Republic of Ireland Final report for WWF
77
8.2.5 Calculation of annual mileage of BEVs and PHEVs
The calculation of expected average annual mileage of BEVs and PHEVs in electric mode was
based on data from the National Travel Survey. The NTS data include details of each trip
made by each individual on each day of the travel diary week, including the distance of each
trip made. This allows calculation of outputs such as daily driving distance of each individual,
number of days car was used out of the seven day travel diary week and maximum daily
distance in the travel week.
Since BEVs have a relatively limited range compared to traditional vehicles, it is expected that
they will be used most by low mileage drivers (i.e. those who rarely exceed the BEV’s usable
range). Given the assumption that BEVs will typically be used by low mileage drivers, it was
necessary to create a sub-set of drivers whose driving patterns are well-suited to BEV use.
This sub-set was defined as those individuals who did not exceed the BEV usable range on
any day of the travel diary week.
The average daily distance of BEVs was calculated as the mean daily distance of the sub-set
of low mileage drivers. This was converted into an average weekly distance by multiplying by
the mean number of days per week that car trips were taken, and the estimated average
annual distance per BEV was found by multiplying this figure by fifty-two.
The following figure shows the effect of increasing BEV usable range on mean annual
distance per BEV, as calculated by the method described above.
Figure 33: Average annual distance per BEV as a function of usable range
The methodology described above includes an implicit assumption that each BEV is charged
at the driver’s home but no further recharging infrastructure is available. The estimated annual
mileage of BEVs from this method therefore represents a conservative value.
0
1,000
2,000
3,000
4,000
5,000
6,000
7,000
8,000
9,000
10,000
0 20 40 60 80 100 120 140 160 180 200
An
nu
al
dis
tan
ce
pe
r B
EV
(k
m/y
r)
BEV usable range (km)
Estimation of annual distance per BEV as a function of usable range based on data from the National Travel Survey
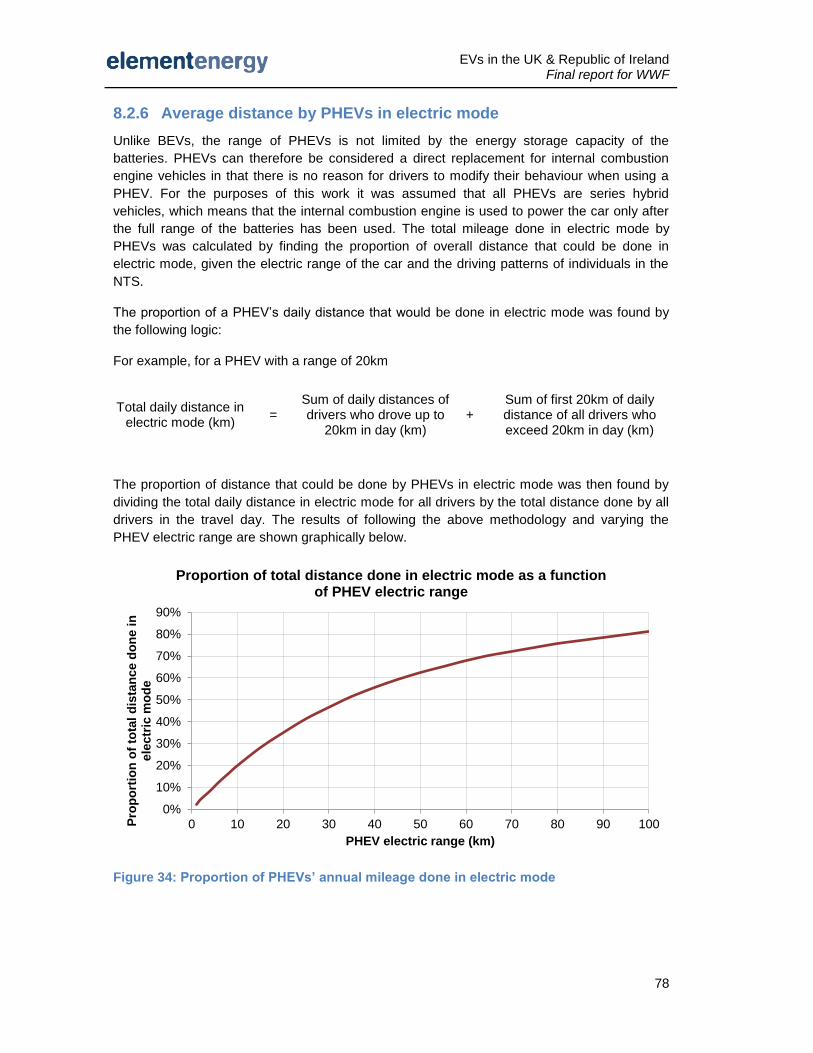
EVs in the UK & Republic of Ireland Final report for WWF
78
8.2.6 Average distance by PHEVs in electric mode
Unlike BEVs, the range of PHEVs is not limited by the energy storage capacity of the
batteries. PHEVs can therefore be considered a direct replacement for internal combustion
engine vehicles in that there is no reason for drivers to modify their behaviour when using a
PHEV. For the purposes of this work it was assumed that all PHEVs are series hybrid
vehicles, which means that the internal combustion engine is used to power the car only after
the full range of the batteries has been used. The total mileage done in electric mode by
PHEVs was calculated by finding the proportion of overall distance that could be done in
electric mode, given the electric range of the car and the driving patterns of individuals in the
NTS.
The proportion of a PHEV’s daily distance that would be done in electric mode was found by
the following logic:
For example, for a PHEV with a range of 20km
Total daily distance in electric mode (km)
= Sum of daily distances of drivers who drove up to
20km in day (km) +
Sum of first 20km of daily distance of all drivers who exceed 20km in day (km)
The proportion of distance that could be done by PHEVs in electric mode was then found by
dividing the total daily distance in electric mode for all drivers by the total distance done by all
drivers in the travel day. The results of following the above methodology and varying the
PHEV electric range are shown graphically below.
Figure 34: Proportion of PHEVs’ annual mileage done in electric mode
0%
10%
20%
30%
40%
50%
60%
70%
80%
90%
0 10 20 30 40 50 60 70 80 90 100Pro
po
rtio
n o
f to
tal d
ista
nc
e d
on
e i
n
ele
ctr
ic m
od
e
PHEV electric range (km)
Proportion of total distance done in electric mode as a function of PHEV electric range

EVs in the UK & Republic of Ireland Final report for WWF
79
8.3 Key assumptions
8.3.1 Derivation of target CO2 reduction for cars
Overview
The Stretch scenario is designed to meet a specific CO2 emission level in 2020. The overall
(cross-sector) 2020 target for the UK currently stands at a 34% cut relative to 1990 emissions,
which is the UK’s share towards a 20% 2020 EU-wide target. This target corresponds to the
‘Interim budget’ figures in the CCC’s reports to Parliament. The ‘Intended budget’ figures in the
CCC’s work relate to a 2020 target for the UK of 42% emissions cuts, which is consistent with
a 30% 2020 target at the EU level.
The amount of emissions savings that will have to come from the transport sector, and the
passenger car sector in particular, will depend on what is achieved in other areas. The CCC
has undertaken extensive analysis of the potential emissions savings from all sectors and as a
result has published a set of transport indicators. These include, amongst other things,
indicative targets for direct emission reductions for the end of each of the three budget periods
considered (2012, 2018 and 2022).
It should be noted that the CCC believes that the relative contribution of each sector to
emission reductions targets should ultimately be decided by Government. The indicators are
given as an example of a scenario that achieves overall interim budget targets.
Emissions reductions from cars in line with a 34% 2020 UK-wide target
The CCC’s indicative targets break emissions savings down by vehicle type within the
transport sector and represent the best available data from which target savings from cars can
be derived. The indicators from the CCC’s October 2009 report show cars achieving savings
of 17%, 24% and 37% relative to 2007 emissions levels by 2012 2018 and 2022
respectively.85
These indicative savings were expressed relative to 1990 emission levels and
values for intervening years (years of interest for this study) were derived by linear
interpolation. The following graph summarises the indicative savings required from cars
relative to 1990 emission levels in line with a 34% 2020 target for the UK as a whole.
85
Meeting Carbon Budgets – the need for a step change, Table 3.4, p.240 (October 2009). Note that the 2022 indicator is reduced to a 34% reduction in the CCC’s latest report: Meeting Carbon Budgets – ensuring a low carbon recovery, Table 4.1, p.128 (June 2010). This is a result of emissions reductions exceeding expectations over the past couple of years due to the recession. However, assuming that these cuts are not ‘banked’, the more ambitious target should still apply.
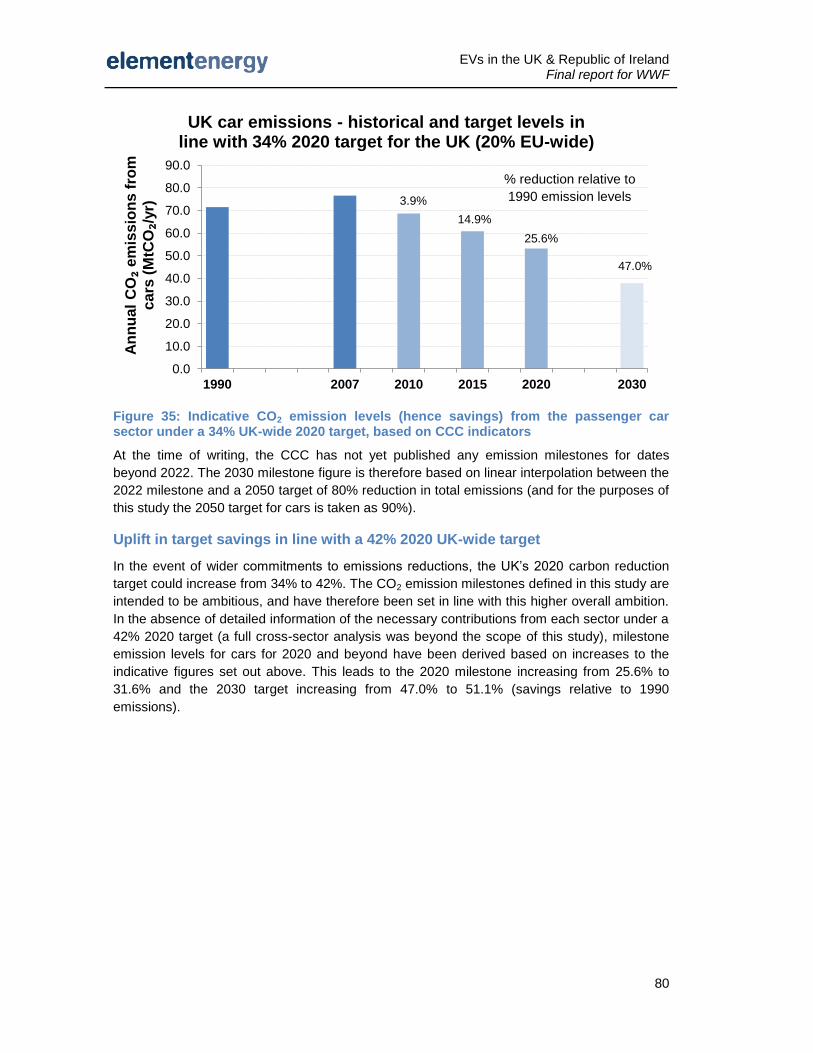
EVs in the UK & Republic of Ireland Final report for WWF
80
Figure 35: Indicative CO2 emission levels (hence savings) from the passenger car sector under a 34% UK-wide 2020 target, based on CCC indicators
At the time of writing, the CCC has not yet published any emission milestones for dates
beyond 2022. The 2030 milestone figure is therefore based on linear interpolation between the
2022 milestone and a 2050 target of 80% reduction in total emissions (and for the purposes of
this study the 2050 target for cars is taken as 90%).
Uplift in target savings in line with a 42% 2020 UK-wide target
In the event of wider commitments to emissions reductions, the UK’s 2020 carbon reduction
target could increase from 34% to 42%. The CO2 emission milestones defined in this study are
intended to be ambitious, and have therefore been set in line with this higher overall ambition.
In the absence of detailed information of the necessary contributions from each sector under a
42% 2020 target (a full cross-sector analysis was beyond the scope of this study), milestone
emission levels for cars for 2020 and beyond have been derived based on increases to the
indicative figures set out above. This leads to the 2020 milestone increasing from 25.6% to
31.6% and the 2030 target increasing from 47.0% to 51.1% (savings relative to 1990
emissions).
0.0
10.0
20.0
30.0
40.0
50.0
60.0
70.0
80.0
90.0
1990 2007 2010 2015 2020 2030
An
nu
al
CO₂
em
iss
ion
s f
rom
c
ars
(M
tCO₂/
yr)
UK car emissions - historical and target levels in line with 34% 2020 target for the UK (20% EU-wide)
3.9%
14.9%
25.6%
47.0%
% reduction relative to
1990 emission levels
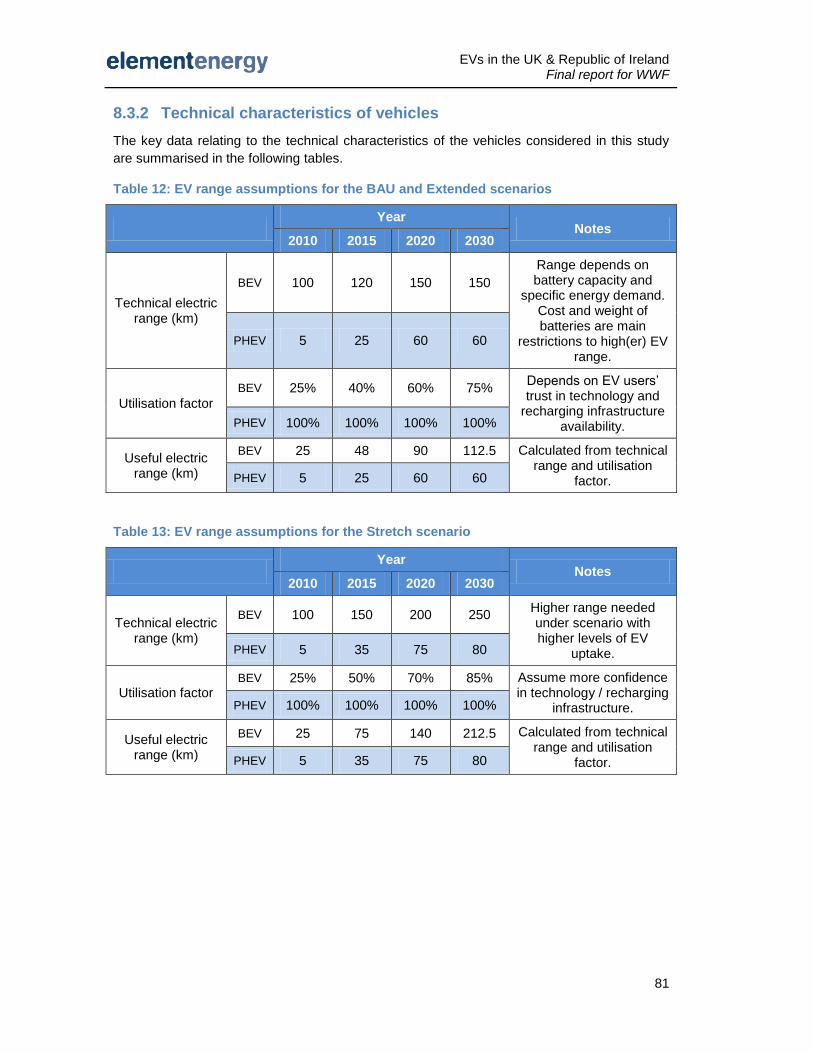
EVs in the UK & Republic of Ireland Final report for WWF
81
8.3.2 Technical characteristics of vehicles
The key data relating to the technical characteristics of the vehicles considered in this study
are summarised in the following tables.
Table 12: EV range assumptions for the BAU and Extended scenarios
Year
Notes 2010 2015 2020 2030
Technical electric range (km)
BEV 100 120 150 150
Range depends on battery capacity and
specific energy demand. Cost and weight of batteries are main
restrictions to high(er) EV range.
PHEV 5 25 60 60
Utilisation factor
BEV 25% 40% 60% 75% Depends on EV users’ trust in technology and
recharging infrastructure availability. PHEV 100% 100% 100% 100%
Useful electric range (km)
BEV 25 48 90 112.5 Calculated from technical range and utilisation
factor. PHEV 5 25 60 60
Table 13: EV range assumptions for the Stretch scenario
Year
Notes 2010 2015 2020 2030
Technical electric range (km)
BEV 100 150 200 250 Higher range needed under scenario with higher levels of EV
uptake. PHEV 5 35 75 80
Utilisation factor BEV 25% 50% 70% 85% Assume more confidence
in technology / recharging infrastructure. PHEV 100% 100% 100% 100%
Useful electric range (km)
BEV 25 75 140 212.5 Calculated from technical range and utilisation
factor. PHEV 5 35 75 80
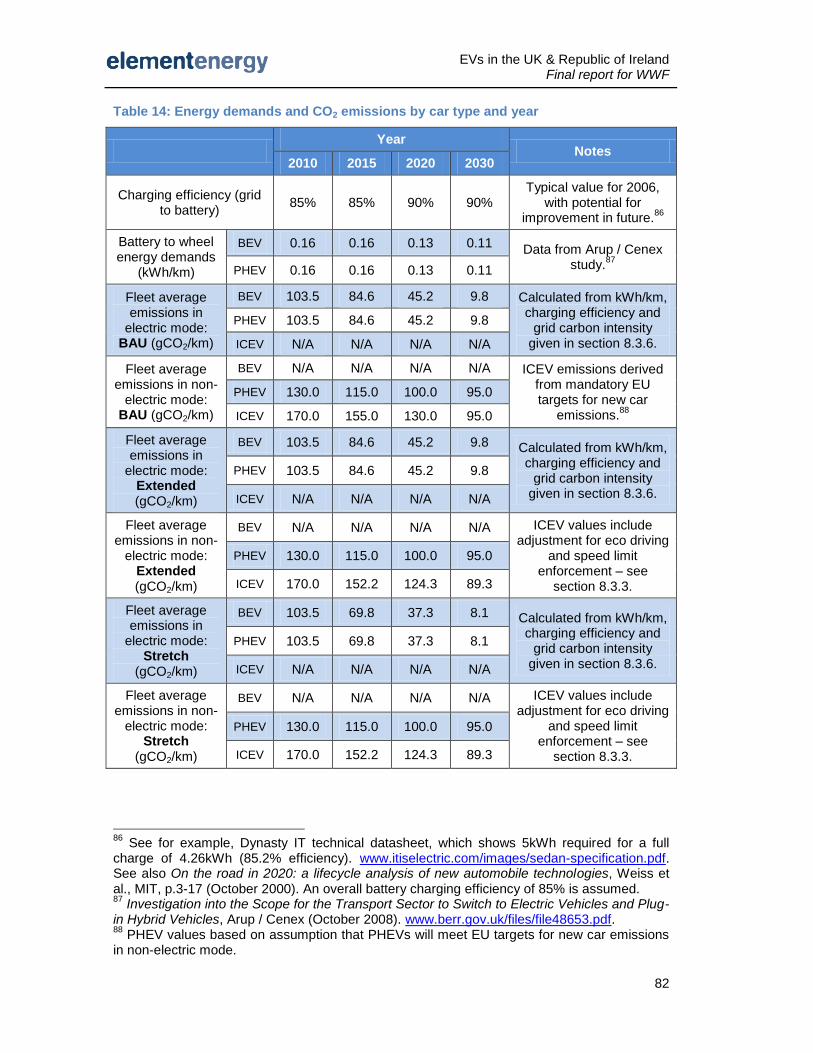
EVs in the UK & Republic of Ireland Final report for WWF
82
Table 14: Energy demands and CO2 emissions by car type and year
Year
Notes 2010 2015 2020 2030
Charging efficiency (grid to battery)
85% 85% 90% 90% Typical value for 2006,
with potential for improvement in future.
86
Battery to wheel energy demands
(kWh/km)
BEV 0.16 0.16 0.13 0.11 Data from Arup / Cenex
study.87
PHEV 0.16 0.16 0.13 0.11
Fleet average emissions in
electric mode: BAU (gCO2/km)
BEV 103.5 84.6 45.2 9.8 Calculated from kWh/km, charging efficiency and
grid carbon intensity given in section 8.3.6.
PHEV 103.5 84.6 45.2 9.8
ICEV N/A N/A N/A N/A
Fleet average emissions in non-
electric mode: BAU (gCO2/km)
BEV N/A N/A N/A N/A ICEV emissions derived from mandatory EU targets for new car
emissions.88
PHEV 130.0 115.0 100.0 95.0
ICEV 170.0 155.0 130.0 95.0
Fleet average emissions in
electric mode: Extended (gCO2/km)
BEV 103.5 84.6 45.2 9.8 Calculated from kWh/km, charging efficiency and
grid carbon intensity given in section 8.3.6.
PHEV 103.5 84.6 45.2 9.8
ICEV N/A N/A N/A N/A
Fleet average emissions in non-
electric mode: Extended (gCO2/km)
BEV N/A N/A N/A N/A ICEV values include adjustment for eco driving
and speed limit enforcement – see
section 8.3.3.
PHEV 130.0 115.0 100.0 95.0
ICEV 170.0 152.2 124.3 89.3
Fleet average emissions in
electric mode: Stretch
(gCO2/km)
BEV 103.5 69.8 37.3 8.1 Calculated from kWh/km, charging efficiency and
grid carbon intensity given in section 8.3.6.
PHEV 103.5 69.8 37.3 8.1
ICEV N/A N/A N/A N/A
Fleet average emissions in non-
electric mode: Stretch
(gCO2/km)
BEV N/A N/A N/A N/A ICEV values include adjustment for eco driving
and speed limit enforcement – see
section 8.3.3.
PHEV 130.0 115.0 100.0 95.0
ICEV 170.0 152.2 124.3 89.3
86
See for example, Dynasty IT technical datasheet, which shows 5kWh required for a full charge of 4.26kWh (85.2% efficiency). www.itiselectric.com/images/sedan-specification.pdf. See also On the road in 2020: a lifecycle analysis of new automobile technologies, Weiss et al., MIT, p.3-17 (October 2000). An overall battery charging efficiency of 85% is assumed. 87
Investigation into the Scope for the Transport Sector to Switch to Electric Vehicles and Plug-in Hybrid Vehicles, Arup / Cenex (October 2008). www.berr.gov.uk/files/file48653.pdf. 88
PHEV values based on assumption that PHEVs will meet EU targets for new car emissions in non-electric mode.
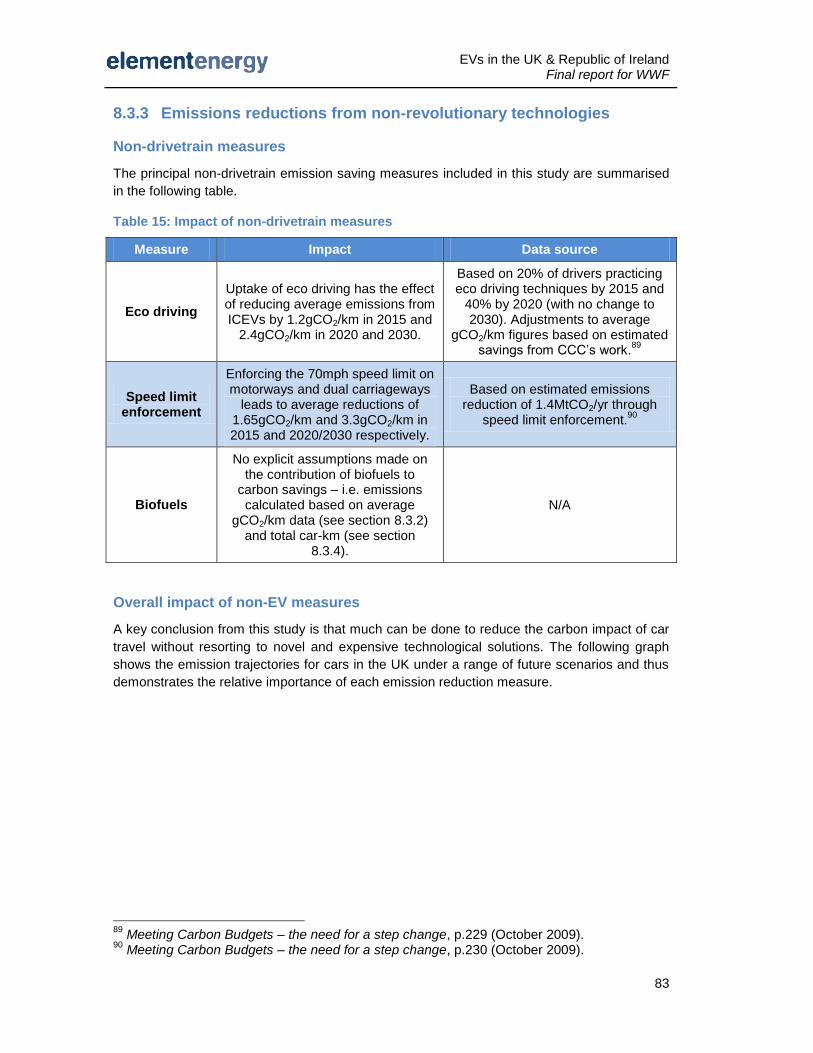
EVs in the UK & Republic of Ireland Final report for WWF
83
8.3.3 Emissions reductions from non-revolutionary technologies
Non-drivetrain measures
The principal non-drivetrain emission saving measures included in this study are summarised
in the following table.
Table 15: Impact of non-drivetrain measures
Measure Impact Data source
Eco driving
Uptake of eco driving has the effect of reducing average emissions from ICEVs by 1.2gCO2/km in 2015 and
2.4gCO2/km in 2020 and 2030.
Based on 20% of drivers practicing eco driving techniques by 2015 and
40% by 2020 (with no change to 2030). Adjustments to average
gCO2/km figures based on estimated savings from CCC’s work.
89
Speed limit enforcement
Enforcing the 70mph speed limit on motorways and dual carriageways
leads to average reductions of 1.65gCO2/km and 3.3gCO2/km in 2015 and 2020/2030 respectively.
Based on estimated emissions reduction of 1.4MtCO2/yr through
speed limit enforcement.90
Biofuels
No explicit assumptions made on the contribution of biofuels to
carbon savings – i.e. emissions calculated based on average
gCO2/km data (see section 8.3.2) and total car-km (see section
8.3.4).
N/A
Overall impact of non-EV measures
A key conclusion from this study is that much can be done to reduce the carbon impact of car
travel without resorting to novel and expensive technological solutions. The following graph
shows the emission trajectories for cars in the UK under a range of future scenarios and thus
demonstrates the relative importance of each emission reduction measure.
89
Meeting Carbon Budgets – the need for a step change, p.229 (October 2009). 90
Meeting Carbon Budgets – the need for a step change, p.230 (October 2009).
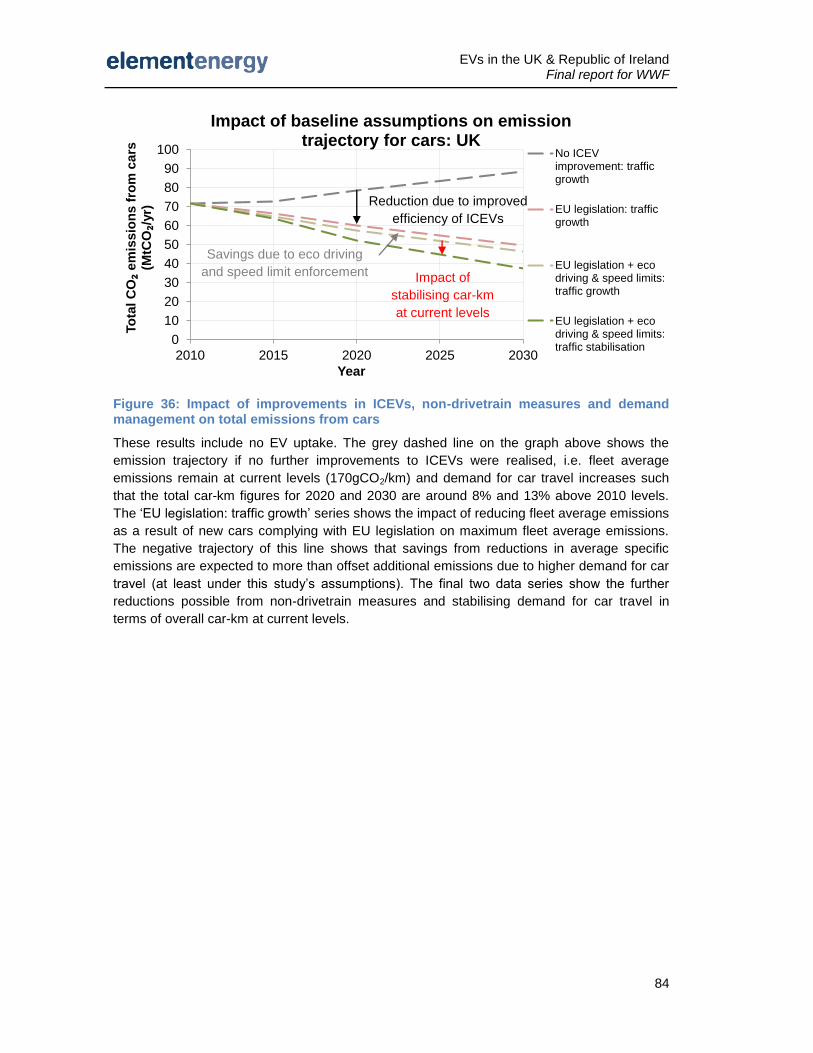
EVs in the UK & Republic of Ireland Final report for WWF
84
Figure 36: Impact of improvements in ICEVs, non-drivetrain measures and demand management on total emissions from cars
These results include no EV uptake. The grey dashed line on the graph above shows the
emission trajectory if no further improvements to ICEVs were realised, i.e. fleet average
emissions remain at current levels (170gCO2/km) and demand for car travel increases such
that the total car-km figures for 2020 and 2030 are around 8% and 13% above 2010 levels.
The ‘EU legislation: traffic growth’ series shows the impact of reducing fleet average emissions
as a result of new cars complying with EU legislation on maximum fleet average emissions.
The negative trajectory of this line shows that savings from reductions in average specific
emissions are expected to more than offset additional emissions due to higher demand for car
travel (at least under this study’s assumptions). The final two data series show the further
reductions possible from non-drivetrain measures and stabilising demand for car travel in
terms of overall car-km at current levels.
0
10
20
30
40
50
60
70
80
90
100
2010 2015 2020 2025 2030
To
tal C
O₂
em
iss
ion
s f
rom
ca
rs
(MtC
O₂/
yr)
Year
Impact of baseline assumptions on emission trajectory for cars: UK
No ICEVimprovement: trafficgrowth
EU legislation: trafficgrowth
EU legislation + ecodriving & speed limits:traffic growth
EU legislation + ecodriving & speed limits:traffic stabilisation
Reduction due to improved
efficiency of ICEVs
Savings due to eco driving
and speed limit enforcement Impact of
stabilising car-km
at current levels
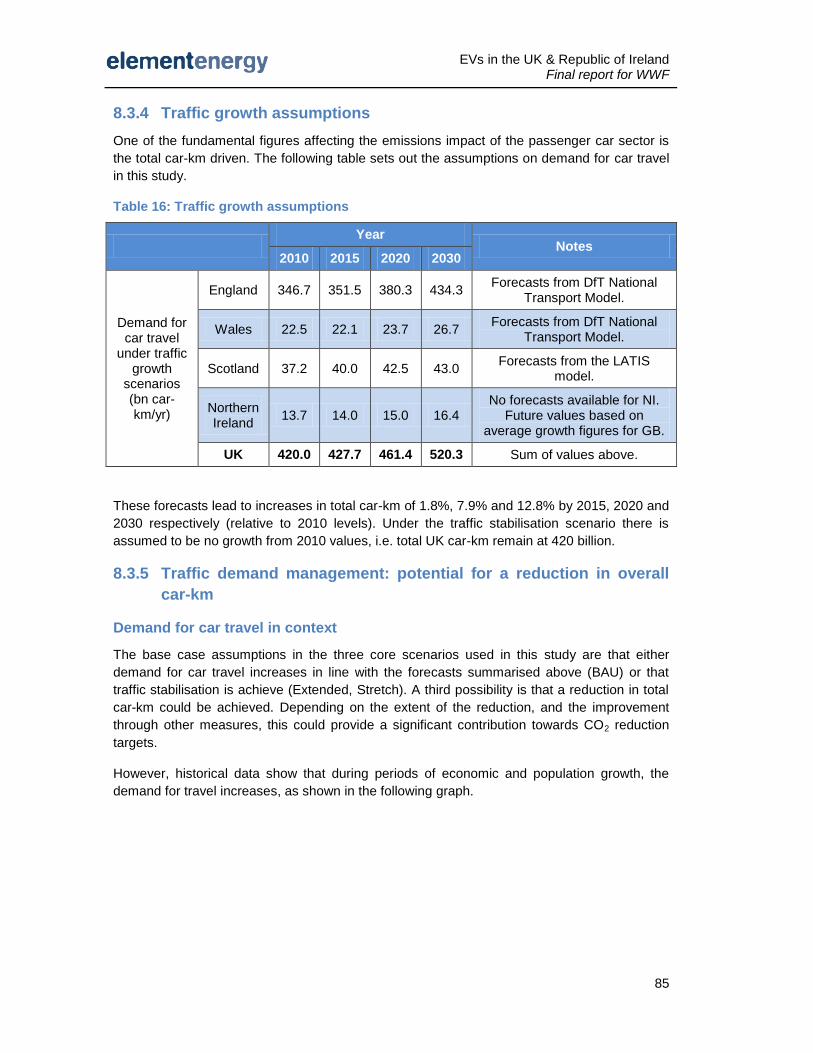
EVs in the UK & Republic of Ireland Final report for WWF
85
8.3.4 Traffic growth assumptions
One of the fundamental figures affecting the emissions impact of the passenger car sector is
the total car-km driven. The following table sets out the assumptions on demand for car travel
in this study.
Table 16: Traffic growth assumptions
Year
Notes 2010 2015 2020 2030
Demand for car travel
under traffic growth
scenarios (bn car-km/yr)
England 346.7 351.5 380.3 434.3 Forecasts from DfT National
Transport Model.
Wales 22.5 22.1 23.7 26.7 Forecasts from DfT National
Transport Model.
Scotland 37.2 40.0 42.5 43.0 Forecasts from the LATIS
model.
Northern Ireland
13.7 14.0 15.0 16.4 No forecasts available for NI.
Future values based on average growth figures for GB.
UK 420.0 427.7 461.4 520.3 Sum of values above.
These forecasts lead to increases in total car-km of 1.8%, 7.9% and 12.8% by 2015, 2020 and
2030 respectively (relative to 2010 levels). Under the traffic stabilisation scenario there is
assumed to be no growth from 2010 values, i.e. total UK car-km remain at 420 billion.
8.3.5 Traffic demand management: potential for a reduction in overall
car-km
Demand for car travel in context
The base case assumptions in the three core scenarios used in this study are that either
demand for car travel increases in line with the forecasts summarised above (BAU) or that
traffic stabilisation is achieve (Extended, Stretch). A third possibility is that a reduction in total
car-km could be achieved. Depending on the extent of the reduction, and the improvement
through other measures, this could provide a significant contribution towards CO2 reduction
targets.
However, historical data show that during periods of economic and population growth, the
demand for travel increases, as shown in the following graph.
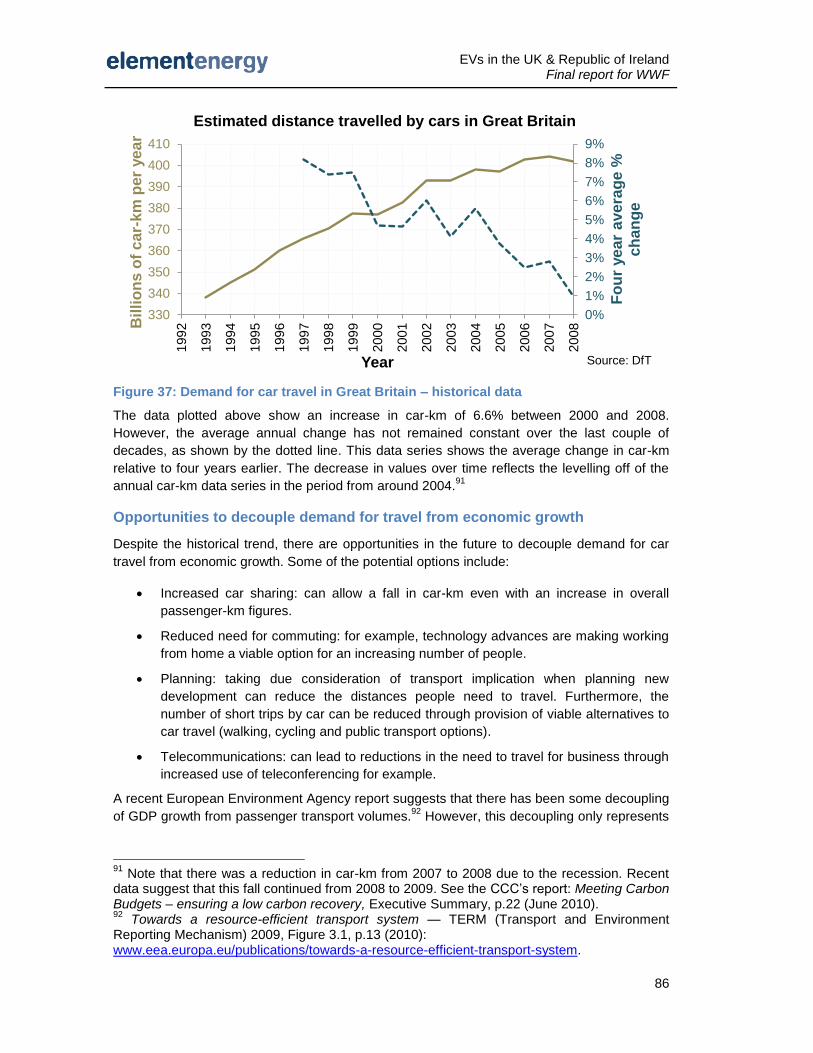
EVs in the UK & Republic of Ireland Final report for WWF
86
Figure 37: Demand for car travel in Great Britain – historical data
The data plotted above show an increase in car-km of 6.6% between 2000 and 2008.
However, the average annual change has not remained constant over the last couple of
decades, as shown by the dotted line. This data series shows the average change in car-km
relative to four years earlier. The decrease in values over time reflects the levelling off of the
annual car-km data series in the period from around 2004.91
Opportunities to decouple demand for travel from economic growth
Despite the historical trend, there are opportunities in the future to decouple demand for car
travel from economic growth. Some of the potential options include:
Increased car sharing: can allow a fall in car-km even with an increase in overall
passenger-km figures.
Reduced need for commuting: for example, technology advances are making working
from home a viable option for an increasing number of people.
Planning: taking due consideration of transport implication when planning new
development can reduce the distances people need to travel. Furthermore, the
number of short trips by car can be reduced through provision of viable alternatives to
car travel (walking, cycling and public transport options).
Telecommunications: can lead to reductions in the need to travel for business through
increased use of teleconferencing for example.
A recent European Environment Agency report suggests that there has been some decoupling
of GDP growth from passenger transport volumes.92
However, this decoupling only represents
91
Note that there was a reduction in car-km from 2007 to 2008 due to the recession. Recent data suggest that this fall continued from 2008 to 2009. See the CCC’s report: Meeting Carbon Budgets – ensuring a low carbon recovery, Executive Summary, p.22 (June 2010). 92
Towards a resource-efficient transport system — TERM (Transport and Environment Reporting Mechanism) 2009, Figure 3.1, p.13 (2010): www.eea.europa.eu/publications/towards-a-resource-efficient-transport-system.
0%
1%
2%
3%
4%
5%
6%
7%
8%
9%
330
340
350
360
370
380
390
400
410
199
2
199
3
199
4
199
5
199
6
199
7
199
8
199
9
200
0
200
1
200
2
200
3
200
4
200
5
200
6
200
7
200
8
Fo
ur
yea
r avera
ge %
c
ha
ng
e
Bil
lio
ns
of
ca
r-km
per
ye
ar
Year
Estimated distance travelled by cars in Great Britain
Source: DfT
EVs in the UK & Republic of Ireland Final report for WWF
87
a slower growth in passenger-km compared to GDP. For a reduction in demand for travel a
negative growth in passenger-km is required even when GDP growth is positive.
Demand reduction scenarios
Given the importance of the total car-km figure, sensitivities have been defined to investigate
the impact of going beyond traffic stabilisation and achieving a decrease in car-km from
current levels. The scenarios are set out in the following table.
Table 17: Total car-km in the UK under demand reduction scenarios
Year
Notes 2010 2015 2020 2030
Demand for car
travel in the UK
(bn car-km/yr)
Traffic growth 420.0 427.7 461.4 520.3 See Table 16, above.
Traffic stabilisation
420.0 420.0 420.0 420.0 See Table 16, above.
Demand reduction: medium
420.0 385.7 351.4 351.4
2020 value based on average value for car driver car-km for
2019-2023 in demand reduction scenario. 2015 value
from linear interpolation.93
Demand reduction: extreme
420.0 371.9 323.7 262.8
Based on extreme behaviour change scenario set out in a UK Energy Research Centre
report.94
The reductions in total car-km under the mild demand reduction scenario correspond to an
8.2% and 16.3% fall in car-km by 2015 and 2020 relative to 2010 levels. In the extreme
demand reduction scenario car-km reductions are 11.5%, 22.9% and 37.4% by 2015, 2020
and 2030 respectively.
The rebound effect
One of the advantages of EVs over conventional vehicles is the potential for lower running
costs (given the higher efficiency of EVs and the relative costs of electricity and petrol / diesel).
This leads to a potential issue in that if driving becomes cheaper on a pounds per km basis
there could be an incentive to drive more (i.e. demand increases when price falls). Due
consideration should be given to this potential rebound effect. The integration of EVs as part of
the solution to meeting emission reduction targets should be based upon EV-km replacing
ICEV-km, rather than EVs leading to additional demands for car travel overall.95
93
A low carbon transport policy for the UK, Keith Buchan, Table 17.1, p.165 (November 2008): www.transportclimate.org. 94
Making the transition to a secure and low-carbon energy system: synthesis report: www.ukerc.ac.uk/Downloads/PDF/U/UKERCEnergy2050/0906UKERC2050.pdf. Behaviour change in transport is discussed in Chapter 6 (from p.103). 95
The risk of a significant rebound effect is limited to some extent provided that battery costs remain relatively high. Expensive batteries means that affordable EVs will have relatively limited range, so even if EV driving is cheap EVs will not add significantly to the total car-km.
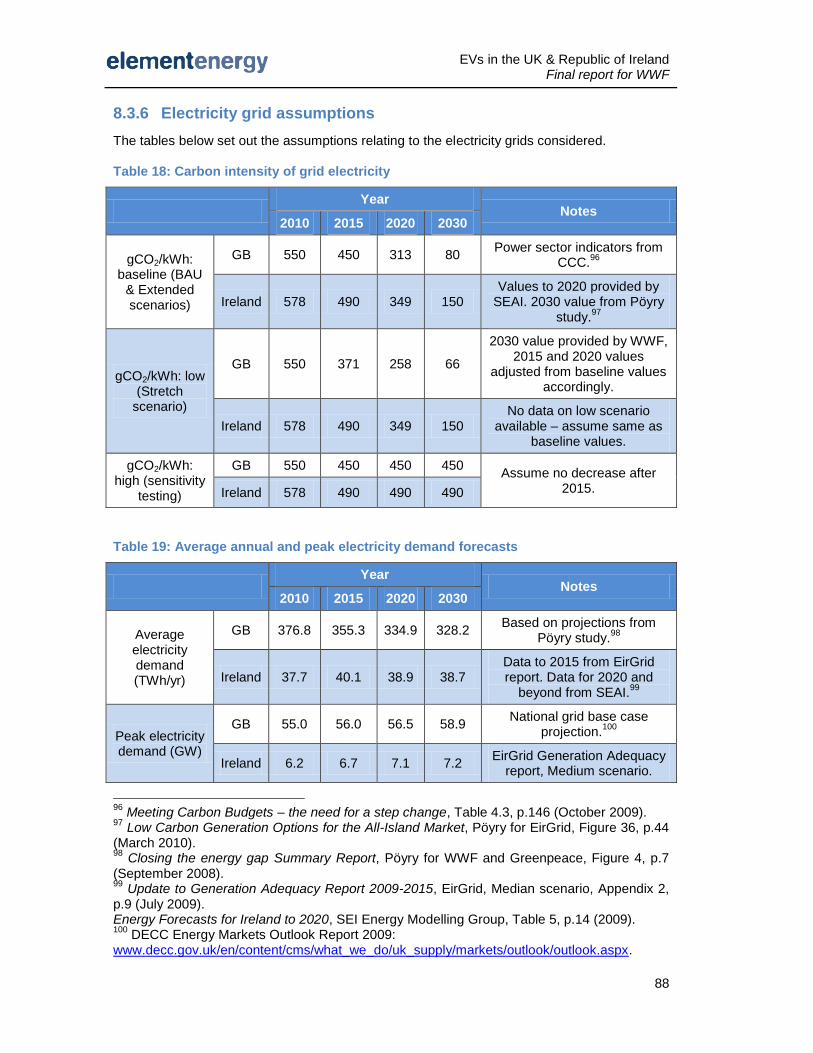
EVs in the UK & Republic of Ireland Final report for WWF
88
8.3.6 Electricity grid assumptions
The tables below set out the assumptions relating to the electricity grids considered.
Table 18: Carbon intensity of grid electricity
Year
Notes 2010 2015 2020 2030
gCO2/kWh: baseline (BAU
& Extended scenarios)
GB 550 450 313 80 Power sector indicators from
CCC.96
Ireland 578 490 349 150 Values to 2020 provided by
SEAI. 2030 value from Pöyry study.
97
gCO2/kWh: low (Stretch
scenario)
GB 550 371 258 66
2030 value provided by WWF, 2015 and 2020 values
adjusted from baseline values accordingly.
Ireland 578 490 349 150 No data on low scenario
available – assume same as baseline values.
gCO2/kWh: high (sensitivity
testing)
GB 550 450 450 450 Assume no decrease after
2015. Ireland 578 490 490 490
Table 19: Average annual and peak electricity demand forecasts
Year
Notes 2010 2015 2020 2030
Average electricity demand (TWh/yr)
GB 376.8 355.3 334.9 328.2 Based on projections from
Pöyry study.98
Ireland 37.7 40.1 38.9 38.7 Data to 2015 from EirGrid report. Data for 2020 and
beyond from SEAI.99
Peak electricity demand (GW)
GB 55.0 56.0 56.5 58.9 National grid base case
projection.100
Ireland 6.2 6.7 7.1 7.2 EirGrid Generation Adequacy
report, Medium scenario.
96
Meeting Carbon Budgets – the need for a step change, Table 4.3, p.146 (October 2009). 97
Low Carbon Generation Options for the All-Island Market, Pöyry for EirGrid, Figure 36, p.44 (March 2010). 98
Closing the energy gap Summary Report, Pöyry for WWF and Greenpeace, Figure 4, p.7 (September 2008). 99
Update to Generation Adequacy Report 2009-2015, EirGrid, Median scenario, Appendix 2, p.9 (July 2009). Energy Forecasts for Ireland to 2020, SEI Energy Modelling Group, Table 5, p.14 (2009). 100
DECC Energy Markets Outlook Report 2009: www.decc.gov.uk/en/content/cms/what_we_do/uk_supply/markets/outlook/outlook.aspx.
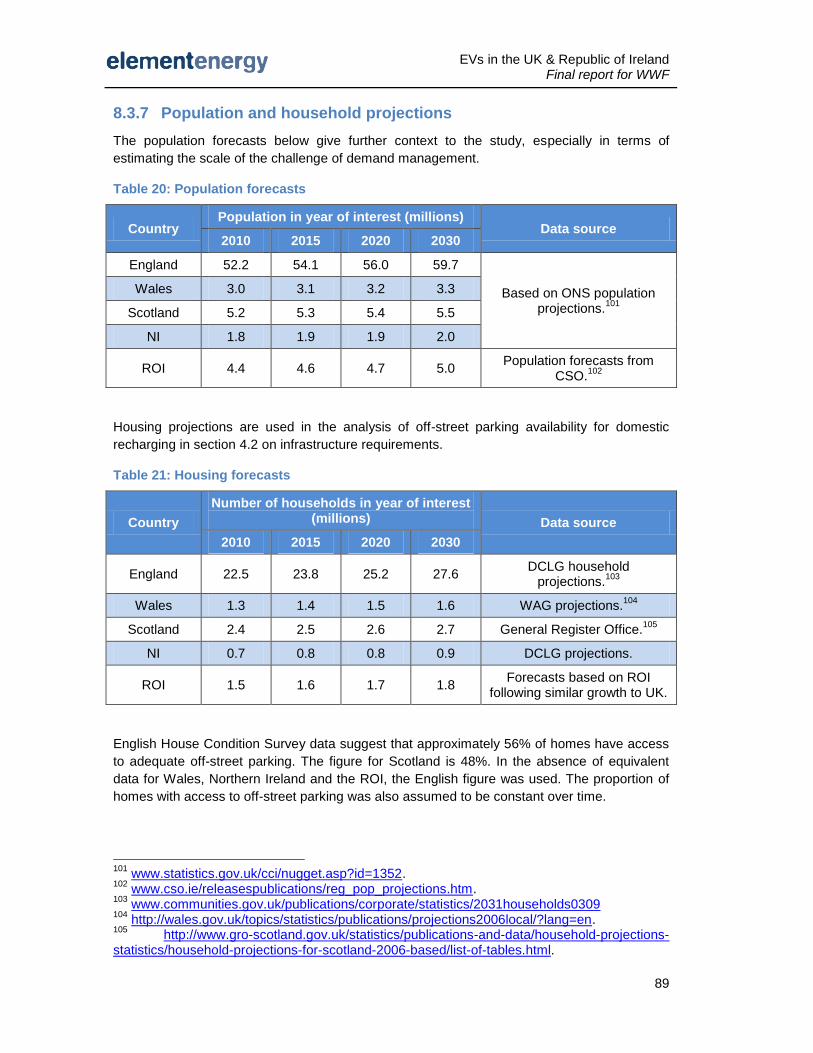
EVs in the UK & Republic of Ireland Final report for WWF
89
8.3.7 Population and household projections
The population forecasts below give further context to the study, especially in terms of
estimating the scale of the challenge of demand management.
Table 20: Population forecasts
Country Population in year of interest (millions)
Data source 2010 2015 2020 2030
England 52.2 54.1 56.0 59.7
Based on ONS population projections.
101
Wales 3.0 3.1 3.2 3.3
Scotland 5.2 5.3 5.4 5.5
NI 1.8 1.9 1.9 2.0
ROI 4.4 4.6 4.7 5.0 Population forecasts from
CSO.102
Housing projections are used in the analysis of off-street parking availability for domestic
recharging in section 4.2 on infrastructure requirements.
Table 21: Housing forecasts
Country
Number of households in year of interest (millions) Data source
2010 2015 2020 2030
England 22.5 23.8 25.2 27.6 DCLG household
projections.103
Wales 1.3 1.4 1.5 1.6 WAG projections.104
Scotland 2.4 2.5 2.6 2.7 General Register Office.105
NI 0.7 0.8 0.8 0.9 DCLG projections.
ROI 1.5 1.6 1.7 1.8 Forecasts based on ROI
following similar growth to UK.
English House Condition Survey data suggest that approximately 56% of homes have access
to adequate off-street parking. The figure for Scotland is 48%. In the absence of equivalent
data for Wales, Northern Ireland and the ROI, the English figure was used. The proportion of
homes with access to off-street parking was also assumed to be constant over time.
101
www.statistics.gov.uk/cci/nugget.asp?id=1352. 102
www.cso.ie/releasespublications/reg_pop_projections.htm. 103
www.communities.gov.uk/publications/corporate/statistics/2031households0309 104
http://wales.gov.uk/topics/statistics/publications/projections2006local/?lang=en. 105
http://www.gro-scotland.gov.uk/statistics/publications-and-data/household-projections-statistics/household-projections-for-scotland-2006-based/list-of-tables.html.
EVs in the UK & Republic of Ireland Final report for WWF
90
8.3.8 Lithium-ion battery cost assumptions
Battery costs are a key component of overall EV costs and it is widely believed that battery
cost reductions will be required for EVs to achieve mass market uptake. Indicative lithium-ion
battery costs are presented in section 5.4.5, which considered the economics of vehicle to
grid. Current battery costs were taken as $1,000/kWh, with an indicative goal of $250/kWh. A
further source of data on battery costs is an HSBC Global Research report.106
This study
notes that true battery costs, and cost breakdowns in particular, are difficult to obtain as
manufacturers tend to be guarded with costs given R&D competition. However, the HSBC
study reports a price of $1,000/kWh, and based on a Department of Energy study estimates
the cost structure of a lithium-ion battery as follows:
75% – cost of materials (cathode, anode, electrolyte, other cell and pack
components).
20% – other costs (R&D, warranty, profit, marketing, distribution).
5% – manufacturing.
The authors state that cost reductions of 65% (to $350/kWh) could be expected by 2020
through:107
Economies of scale, leading to 4% annual decrease in price.
New business models such as recycling flawed batteries and a second hand market
for batteries.
Learning curve effects to reduce the failure rate in manufacturing.
Technological breakthrough to yield higher efficiency and lower cost by 2020.
106
Hybrids and Electric Vehicles: Hype or sustainable investment? The truth about market potential and investment ideas, HSBC Global Research (October 2009). 107
HSBC Global Research, p.35 (October 2009).

EVs in the UK & Republic of Ireland Final report for WWF
91
8.4 Electric vehicles in context
Electric vehicles represent one of a wide range of options available for reducing carbon
emissions in the transport sector. The table below summarises the main methods for
achieving efficiency improvements and/or carbon emission reductions in vehicles.
Table 22: Summary of methods for reducing vehicle emissions
Category Measure Description
Vehicle design
Aerodynamics improvement
Improved aerodynamics lead to lower drag and enhanced fuel efficiency, particularly at higher speeds.
Weight reduction Vehicle lightweighting is an effective method of reducing
fuel consumption and therefore emissions.
Improved tyres Low rolling resistance tyres can be used to reduce fuel
consumption and hence emissions.
Fuels and driver
behaviour
Biofuels
Introduction of biofuels into standard fuels. This is a simple method of achieving carbon savings but the savings are limited unless high blends are used and
sustainable biofuel resources are limited.
Modal shift
Modal shift refers to encouraging the use other forms of transport (e.g. walk, cycle, public transport). Furthermore,
people can be encouraged to consider whether their journey is absolutely necessary. Reducing vehicle-km is a
simple and direct way to reduce emissions.
Speed limits Speed limit reductions, primarily on trunk roads where the limit is 70mph, could be used to cut emissions since fuel
efficiency reduces at higher speeds.
Active traffic management
Active traffic management aims to keep traffic flowing during busy periods. Reducing traffic jams and stop-start
traffic leads to improved fuel efficiency and therefore lower emissions.
Smarter choices and eco driving
Smarter choices refers to encouraging better journey planning and greater use of public transport. In its December 2008 report the CCC identified Smarter
Choices as a low cost means of achieving CO2 savings from transport. Eco driving includes decisions to purchase
less polluting cars, and driving techniques which maximise fuel economy (smooth driving to avoid unnecessary stop/starts, early gear change etc).
Powertrain
Evolutionary improvements
Powertrain improvements involve increasing the efficiency of energy transfer in the vehicle either through improved ICE technology, evolution, or a change in the vehicle’s
propulsion technology, revolution (see below). Revolutionary improvements
EVs in the UK & Republic of Ireland Final report for WWF
92
A major advantage of electric vehicles is that the electric drive train is more efficient than the
internal combustion engine of traditional cars.108
This means that provided the electricity used
to charge the battery comes from an efficient (and preferably low carbon) generator, the
specific carbon emissions of EVs are lower than for an equivalent ICEV.
Another major benefit of EVs is the flexibility they offer in terms of primary energy sources.
While ICEVs rely on petroleum or diesel fuels derived from fossil fuels, EVs can be charged
with electricity from a wide range of sources. The potential for increased market penetration of
EVs to reduce dependence on fossil fuels for car transport is considered in this study through
calculation of the reduced oil demand as a result of increased EV use.
8.4.1 Evolutionary technologies
Traditional internal combustion engines are only 20-35% efficient in that only around a fifth to
a third of the energy in the fuel goes in to vehicle propulsion (most of the remainder is lost as
heat). There is significant scope for improvements in this technology, as demonstrated by
Weiss et al. in a paper exploring emissions of passenger cars to 2020.109
To date the implementation of evolutionary improvements in engine technology has been
relatively modest. The main reason for this has been a lack of incentive for manufacturers to
reduce emissions. However, with legislation such as EC 443/2009 setting emission
performance standards for all new cars in the European Union, there is an onus on car
manufacturers to significantly improve the efficiency of new cars.110
Historically a car’s
efficiency was low on the list of attributes that consumers consider important when making
purchasing decisions. However, recent evidence suggests that new car sales have shown a
shift towards more efficient vehicles. For example, the CCC’s second report to Parliament
states that new car emissions in 2009 were 149.5gCO2/km, out-performing the CCC’s
indicator of 157.8gCO2/km.111
The trend towards increased purchase of lower emitting cars is
108
Electric motors can be up to around 98–99% efficient at turning electricity in to mechanical work. This looks good compared to a typical ICEV engine which might be only around 25% efficient at turning energy in the fuel into useful work. But this is not the complete picture. A typical petrol car, with a fuel efficiency of 40mpg (0.071 litres/km) requires around 0.70kWh/km of energy from the fuel (based on petrol with 9.67kWh/litre). This appears high relative to a typical EV’s demands of around 0.2kWh/km (battery to wheel). However, if the electricity used to charge the EV comes from a fossil-fuel burning power station the fossil fuel equivalent demand of the EV equates to around 0.60kWh/km (based on a power station with electrical efficiency of 40%, 8% transmission and distribution losses and 90% charging efficiency). This is still better than the ICEV and one of the advantages of EVs is the option of using alternative sources of power generation to create the electricity for charging. 109
On the road in 2020: a lifecycle analysis of new automobile technologies, Weiss et al., MIT (October 2000). Table 3.4, p.3-24. As an example, one method for improving engines’ emissions characteristics is to make use of super-chargers and turbo-chargers, which lead to higher cylinder pressures, more efficient fuel burn and higher specific power outputs. Such measures improve vehicle efficiency without compromising performance. 110
Regulation EC 443/2009: setting emission performance standards for new passenger cars as part of the Community’s integrated approach to reduce CO2 emissions from light-duty vehicles. This sets out the path towards a target of average new car fleet emissions of 95gCO2/km from 2020 (with financial implications for manufacturers failing to meet the targets via an excess emissions premium). 111
Meeting Carbon Budgets – ensuring a low carbon recovery, p.116, CCC (June 2010).
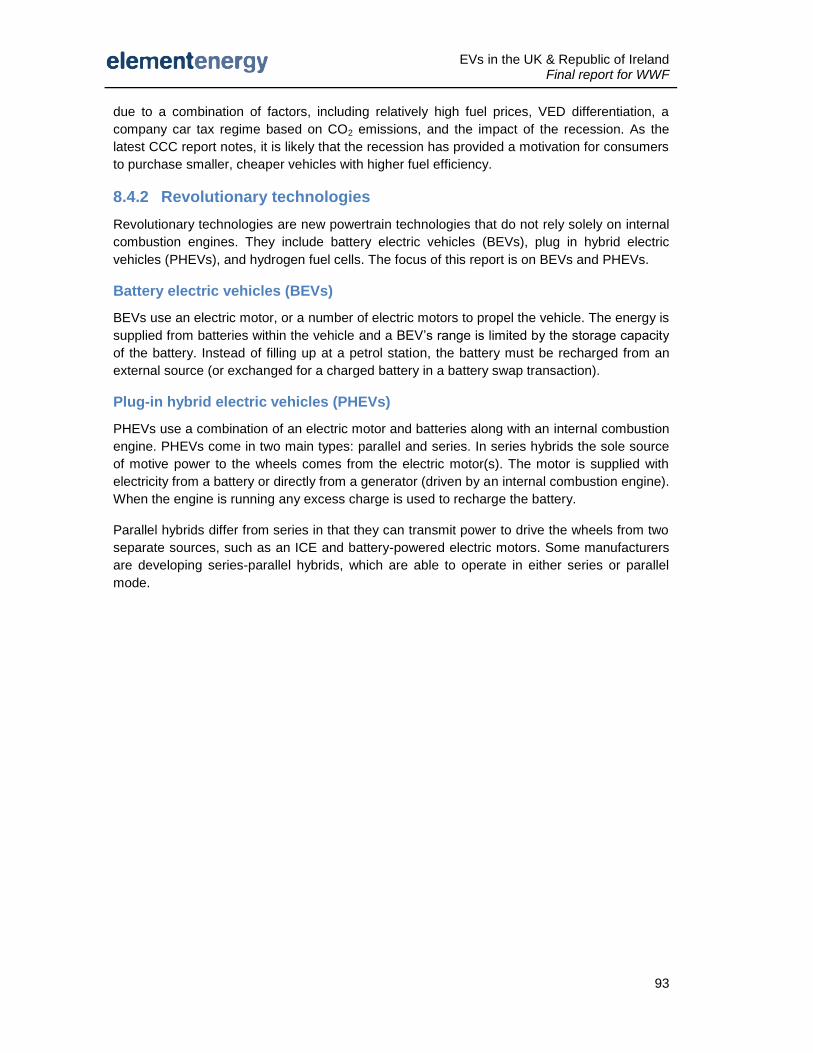
EVs in the UK & Republic of Ireland Final report for WWF
93
due to a combination of factors, including relatively high fuel prices, VED differentiation, a
company car tax regime based on CO2 emissions, and the impact of the recession. As the
latest CCC report notes, it is likely that the recession has provided a motivation for consumers
to purchase smaller, cheaper vehicles with higher fuel efficiency.
8.4.2 Revolutionary technologies
Revolutionary technologies are new powertrain technologies that do not rely solely on internal
combustion engines. They include battery electric vehicles (BEVs), plug in hybrid electric
vehicles (PHEVs), and hydrogen fuel cells. The focus of this report is on BEVs and PHEVs.
Battery electric vehicles (BEVs)
BEVs use an electric motor, or a number of electric motors to propel the vehicle. The energy is
supplied from batteries within the vehicle and a BEV’s range is limited by the storage capacity
of the battery. Instead of filling up at a petrol station, the battery must be recharged from an
external source (or exchanged for a charged battery in a battery swap transaction).
Plug-in hybrid electric vehicles (PHEVs)
PHEVs use a combination of an electric motor and batteries along with an internal combustion
engine. PHEVs come in two main types: parallel and series. In series hybrids the sole source
of motive power to the wheels comes from the electric motor(s). The motor is supplied with
electricity from a battery or directly from a generator (driven by an internal combustion engine).
When the engine is running any excess charge is used to recharge the battery.
Parallel hybrids differ from series in that they can transmit power to drive the wheels from two
separate sources, such as an ICE and battery-powered electric motors. Some manufacturers
are developing series-parallel hybrids, which are able to operate in either series or parallel
mode.
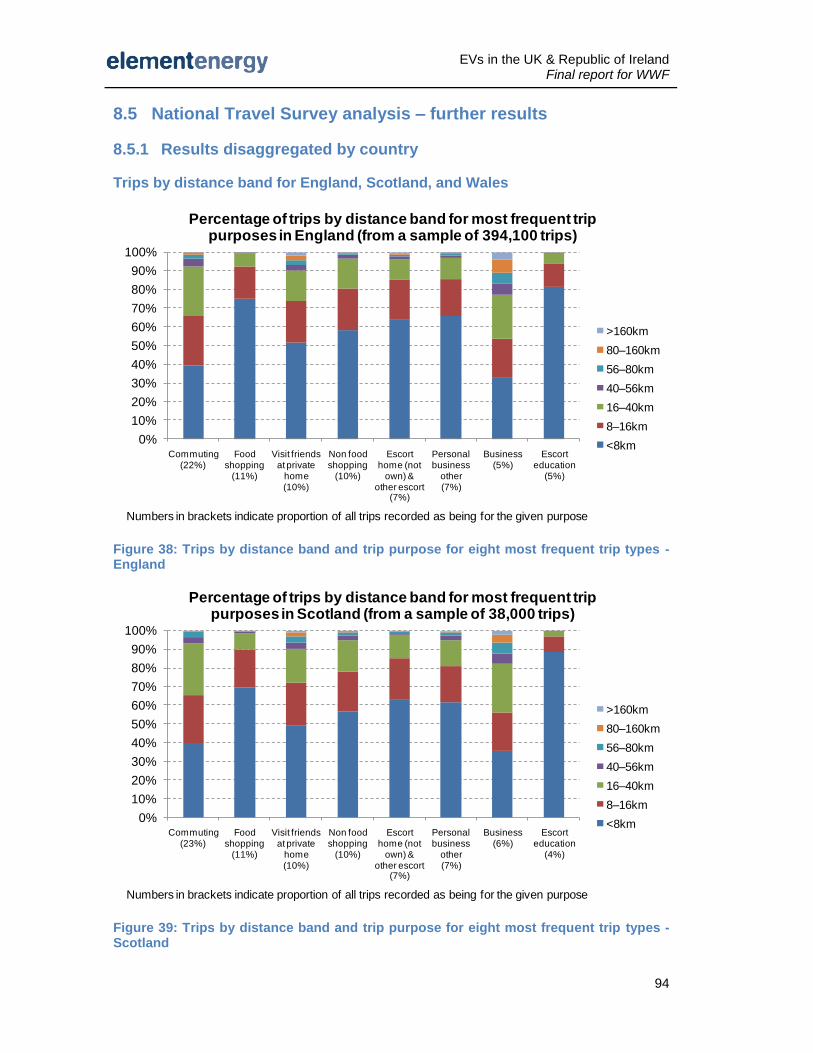
EVs in the UK & Republic of Ireland Final report for WWF
94
8.5 National Travel Survey analysis – further results
8.5.1 Results disaggregated by country
Trips by distance band for England, Scotland, and Wales
Figure 38: Trips by distance band and trip purpose for eight most frequent trip types - England
Figure 39: Trips by distance band and trip purpose for eight most frequent trip types - Scotland
0%
10%
20%
30%
40%
50%
60%
70%
80%
90%
100%
Commuting(22%)
Food shopping
(11%)
Visit friends at private
home(10%)
Non food shopping
(10%)
Escort home (not
own) & other escort
(7%)
Personal business
other(7%)
Business(5%)
Escort education
(5%)
Percentage of trips by distance band for most frequent trip purposes in England (from a sample of 394,100 trips)
>160km
80–160km
56–80km
40–56km
16–40km
8–16km
<8km
Numbers in brackets indicate proportion of all trips recorded as being for the given purpose
0%
10%
20%
30%
40%
50%
60%
70%
80%
90%
100%
Commuting(23%)
Food shopping
(11%)
Visit friends at private
home(10%)
Non food shopping
(10%)
Escort home (not
own) & other escort
(7%)
Personal business
other(7%)
Business(6%)
Escort education
(4%)
Percentage of trips by distance band for most frequent trip purposes in Scotland (from a sample of 38,000 trips)
>160km
80–160km
56–80km
40–56km
16–40km
8–16km
<8km
Numbers in brackets indicate proportion of all trips recorded as being for the given purpose
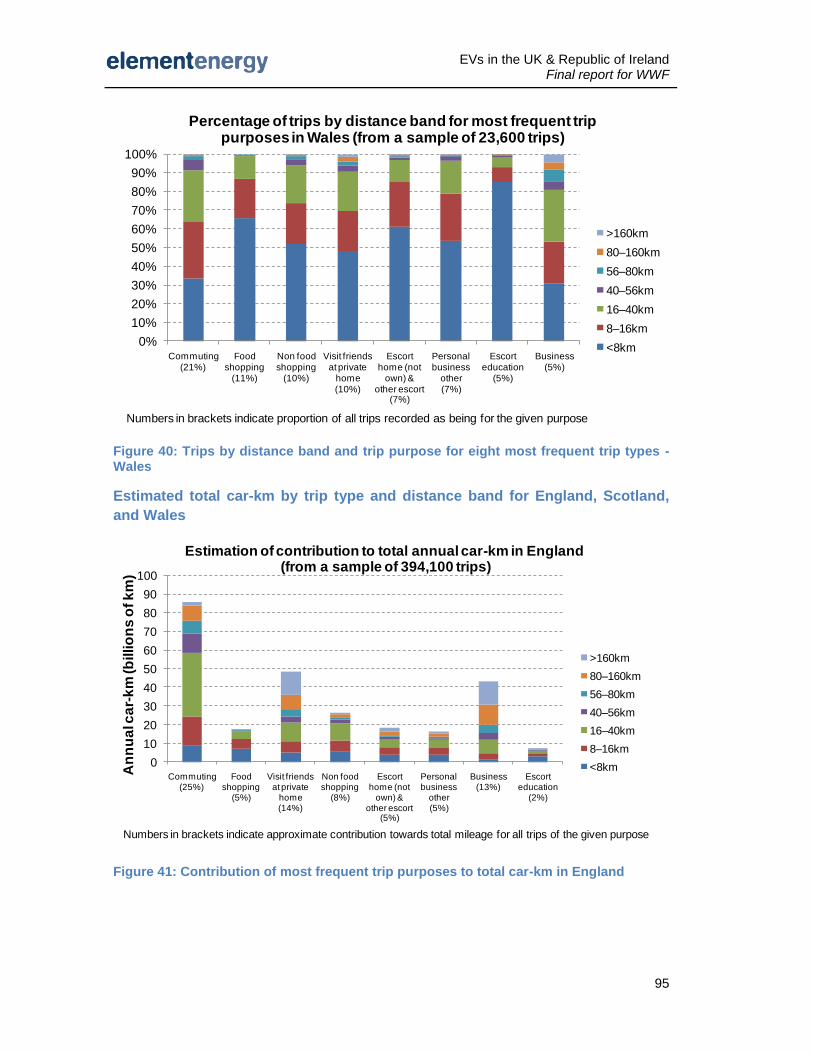
EVs in the UK & Republic of Ireland Final report for WWF
95
Figure 40: Trips by distance band and trip purpose for eight most frequent trip types - Wales
Estimated total car-km by trip type and distance band for England, Scotland,
and Wales
Figure 41: Contribution of most frequent trip purposes to total car-km in England
0%
10%
20%
30%
40%
50%
60%
70%
80%
90%
100%
Commuting(21%)
Food shopping
(11%)
Non food shopping
(10%)
Visit friends at private
home(10%)
Escort home (not
own) & other escort
(7%)
Personal business
other(7%)
Escort education
(5%)
Business(5%)
Percentage of trips by distance band for most frequent trip purposes in Wales (from a sample of 23,600 trips)
>160km
80–160km
56–80km
40–56km
16–40km
8–16km
<8km
Numbers in brackets indicate proportion of all trips recorded as being for the given purpose
0
10
20
30
40
50
60
70
80
90
100
Commuting(25%)
Food shopping
(5%)
Visit friends at private
home(14%)
Non food shopping
(8%)
Escort home (not
own) & other escort
(5%)
Personal business
other(5%)
Business(13%)
Escort education
(2%)
An
nu
al c
ar-
km
(b
illio
ns
of k
m)
Estimation of contribution to total annual car-km in England(from a sample of 394,100 trips)
>160km
80–160km
56–80km
40–56km
16–40km
8–16km
<8km
Numbers in brackets indicate approximate contribution towards total mileage for all trips of the given purpose
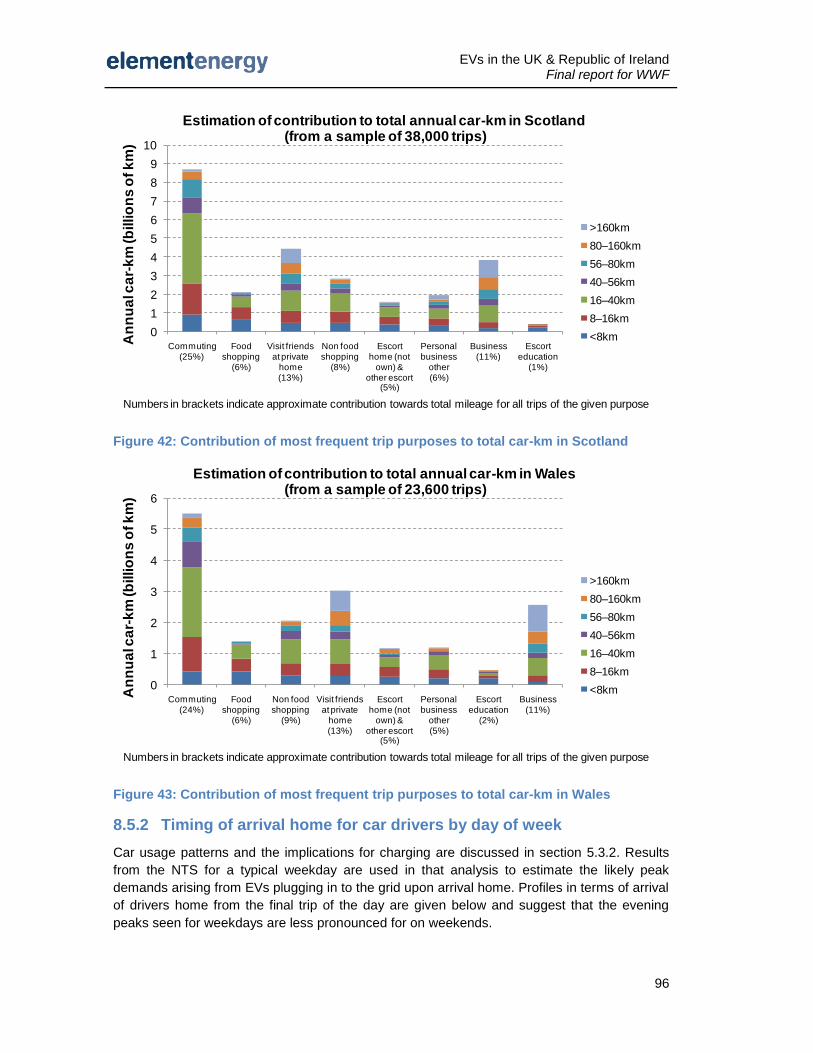
EVs in the UK & Republic of Ireland Final report for WWF
96
Figure 42: Contribution of most frequent trip purposes to total car-km in Scotland
Figure 43: Contribution of most frequent trip purposes to total car-km in Wales
8.5.2 Timing of arrival home for car drivers by day of week
Car usage patterns and the implications for charging are discussed in section 5.3.2. Results
from the NTS for a typical weekday are used in that analysis to estimate the likely peak
demands arising from EVs plugging in to the grid upon arrival home. Profiles in terms of arrival
of drivers home from the final trip of the day are given below and suggest that the evening
peaks seen for weekdays are less pronounced for on weekends.
0
1
2
3
4
5
6
7
8
9
10
Commuting(25%)
Food shopping
(6%)
Visit friends at private
home(13%)
Non food shopping
(8%)
Escort home (not
own) & other escort
(5%)
Personal business
other(6%)
Business(11%)
Escort education
(1%)
An
nu
al c
ar-
km
(b
illio
ns
of k
m)
Estimation of contribution to total annual car-km in Scotland(from a sample of 38,000 trips)
>160km
80–160km
56–80km
40–56km
16–40km
8–16km
<8km
Numbers in brackets indicate approximate contribution towards total mileage for all trips of the given purpose
0
1
2
3
4
5
6
Commuting(24%)
Food shopping
(6%)
Non food shopping
(9%)
Visit friends at private
home(13%)
Escort home (not
own) & other escort
(5%)
Personal business
other(5%)
Escort education
(2%)
Business(11%)
An
nu
al c
ar-
km
(b
illio
ns
of k
m)
Estimation of contribution to total annual car-km in Wales(from a sample of 23,600 trips)
>160km
80–160km
56–80km
40–56km
16–40km
8–16km
<8km
Numbers in brackets indicate approximate contribution towards total mileage for all trips of the given purpose
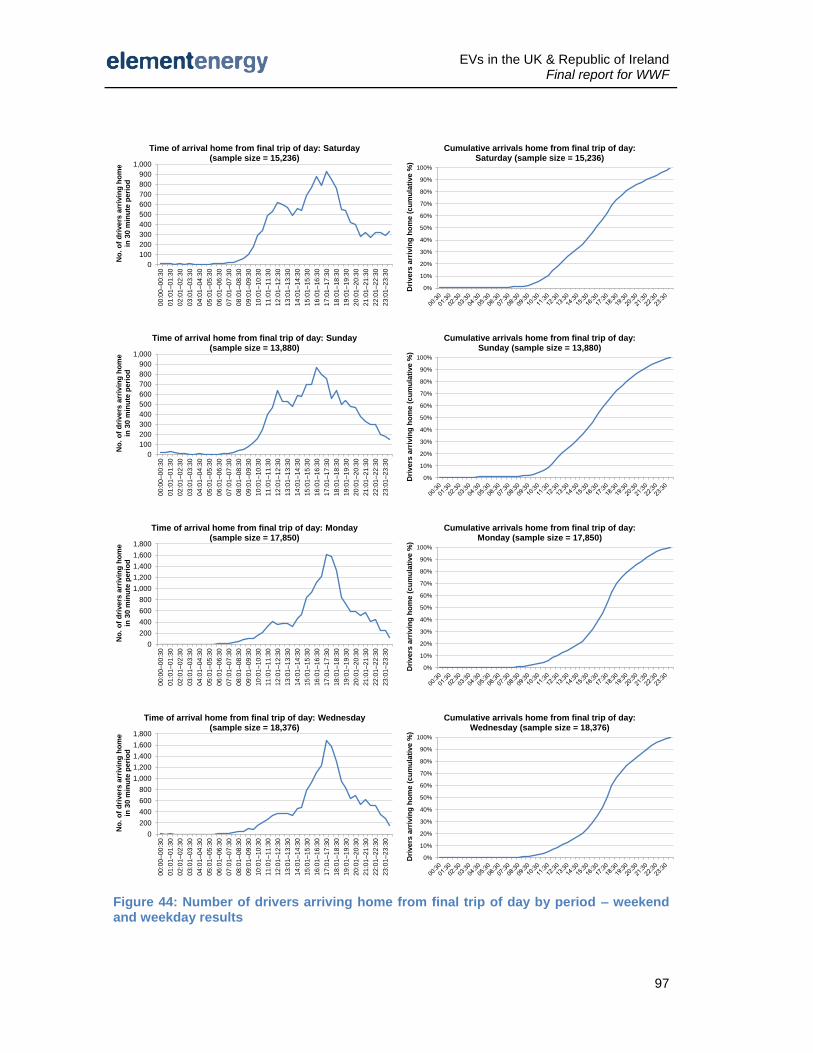
EVs in the UK & Republic of Ireland Final report for WWF
97
Figure 44: Number of drivers arriving home from final trip of day by period – weekend and weekday results
0
100
200
300
400
500
600
700
800
900
1,00000:0
0–00:3
0
01:0
1–01:3
0
02:0
1–02:3
0
03:0
1–03:3
0
04:0
1–04:3
0
05:0
1–05:3
0
06:0
1–06:3
0
07:0
1–07:3
0
08:0
1–08:3
0
09:0
1–09:3
0
10:0
1–10:3
0
11:0
1–11:3
0
12:0
1–12:3
0
13:0
1–13:3
0
14:0
1–14:3
0
15:0
1–15:3
0
16:0
1–16:3
0
17:0
1–17:3
0
18:0
1–18:3
0
19:0
1–19:3
0
20:0
1–20:3
0
21:0
1–21:3
0
22:0
1–22:3
0
23:0
1–23:3
0
No
. o
f d
rive
rs a
rriv
ing
ho
me
in 3
0 m
inu
te p
eri
od
Time of arrival home from final trip of day: Saturday (sample size = 15,236)
0%
10%
20%
30%
40%
50%
60%
70%
80%
90%
100%
Dri
ve
rs a
rriv
ing
ho
me
(c
um
ula
tive
%)
Cumulative arrivals home from final trip of day: Saturday (sample size = 15,236)
0
100
200
300
400
500
600
700
800
900
1,000
00:0
0–00:3
0
01:0
1–01:3
0
02:0
1–02:3
0
03:0
1–03:3
0
04:0
1–04:3
0
05:0
1–05:3
0
06:0
1–06:3
0
07:0
1–07:3
0
08:0
1–08:3
0
09:0
1–09:3
0
10:0
1–10:3
0
11:0
1–11:3
0
12:0
1–12:3
0
13:0
1–13:3
0
14:0
1–14:3
0
15:0
1–15:3
0
16:0
1–16:3
0
17:0
1–17:3
0
18:0
1–18:3
0
19:0
1–19:3
0
20:0
1–20:3
0
21:0
1–21:3
0
22:0
1–22:3
0
23:0
1–23:3
0
No
. o
f d
rive
rs a
rriv
ing
ho
me
in 3
0 m
inu
te p
eri
od
Time of arrival home from final trip of day: Sunday (sample size = 13,880)
0%
10%
20%
30%
40%
50%
60%
70%
80%
90%
100%
Dri
ve
rs a
rriv
ing
ho
me
(c
um
ula
tive
%)
Cumulative arrivals home from final trip of day: Sunday (sample size = 13,880)
0
200
400
600
800
1,000
1,200
1,400
1,600
1,800
00:0
0–00:3
0
01:0
1–01:3
0
02:0
1–02:3
0
03:0
1–03:3
0
04:0
1–04:3
0
05:0
1–05:3
0
06:0
1–06:3
0
07:0
1–07:3
0
08:0
1–08:3
0
09:0
1–09:3
0
10:0
1–10:3
0
11:0
1–11:3
0
12:0
1–12:3
0
13:0
1–13:3
0
14:0
1–14:3
0
15:0
1–15:3
0
16:0
1–16:3
0
17:0
1–17:3
0
18:0
1–18:3
0
19:0
1–19:3
0
20:0
1–20:3
0
21:0
1–21:3
0
22:0
1–22:3
0
23:0
1–23:3
0
No
. o
f d
rive
rs a
rriv
ing
ho
me
in 3
0 m
inu
te p
eri
od
Time of arrival home from final trip of day: Monday (sample size = 17,850)
0%
10%
20%
30%
40%
50%
60%
70%
80%
90%
100%
Dri
ve
rs a
rriv
ing
ho
me
(c
um
ula
tive
%)
Cumulative arrivals home from final trip of day: Monday (sample size = 17,850)
0
200
400
600
800
1,000
1,200
1,400
1,600
1,800
00:0
0–00:3
0
01:0
1–01:3
0
02:0
1–02:3
0
03:0
1–03:3
0
04:0
1–04:3
0
05:0
1–05:3
0
06:0
1–06:3
0
07:0
1–07:3
0
08:0
1–08:3
0
09:0
1–09:3
0
10:0
1–10:3
0
11:0
1–11:3
0
12:0
1–12:3
0
13:0
1–13:3
0
14:0
1–14:3
0
15:0
1–15:3
0
16:0
1–16:3
0
17:0
1–17:3
0
18:0
1–18:3
0
19:0
1–19:3
0
20:0
1–20:3
0
21:0
1–21:3
0
22:0
1–22:3
0
23:0
1–23:3
0
No
. o
f d
rive
rs a
rriv
ing
ho
me
in 3
0 m
inu
te p
eri
od
Time of arrival home from final trip of day: Wednesday (sample size = 18,376)
0%
10%
20%
30%
40%
50%
60%
70%
80%
90%
100%
Dri
ve
rs a
rriv
ing
ho
me
(c
um
ula
tive
%)
Cumulative arrivals home from final trip of day: Wednesday (sample size = 18,376)
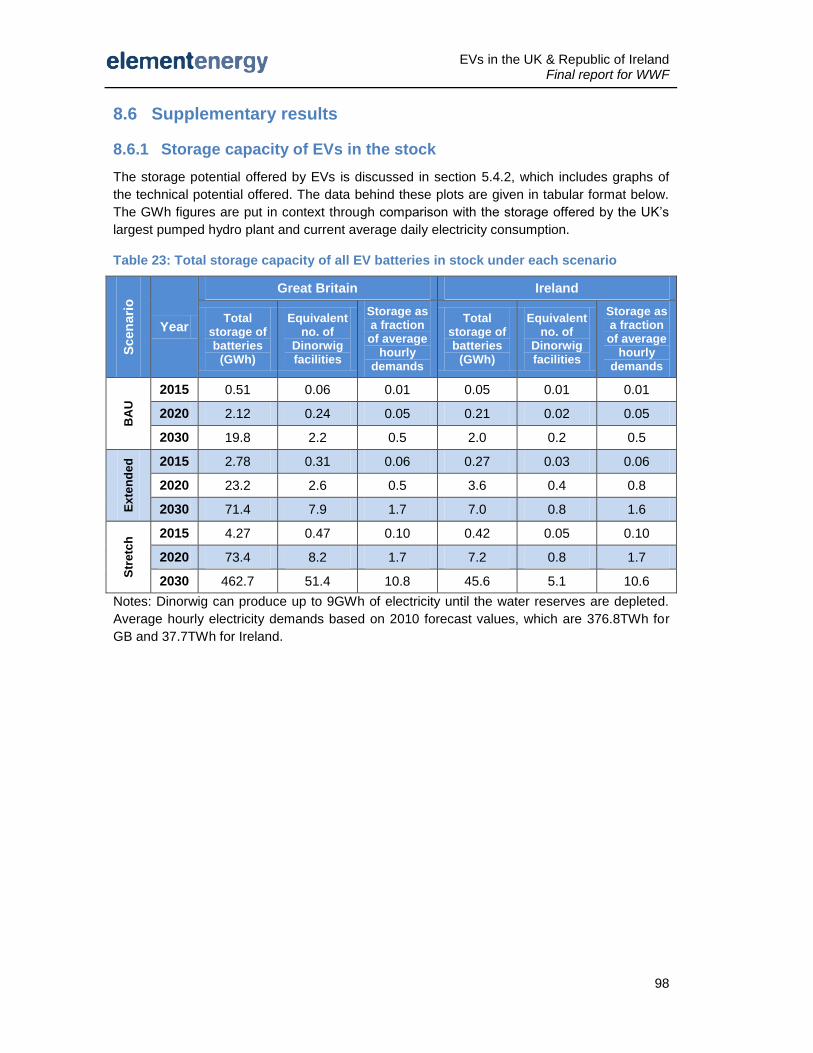
EVs in the UK & Republic of Ireland Final report for WWF
98
8.6 Supplementary results
8.6.1 Storage capacity of EVs in the stock
The storage potential offered by EVs is discussed in section 5.4.2, which includes graphs of
the technical potential offered. The data behind these plots are given in tabular format below.
The GWh figures are put in context through comparison with the storage offered by the UK’s
largest pumped hydro plant and current average daily electricity consumption.
Table 23: Total storage capacity of all EV batteries in stock under each scenario
Scen
ari
o
Year
Great Britain Ireland
Total storage of batteries
(GWh)
Equivalent no. of
Dinorwig facilities
Storage as a fraction of average
hourly demands
Total storage of batteries
(GWh)
Equivalent no. of
Dinorwig facilities
Storage as a fraction of average
hourly demands
BA
U
2015 0.51 0.06 0.01 0.05 0.01 0.01
2020 2.12 0.24 0.05 0.21 0.02 0.05
2030 19.8 2.2 0.5 2.0 0.2 0.5
Ex
ten
de
d
2015 2.78 0.31 0.06 0.27 0.03 0.06
2020 23.2 2.6 0.5 3.6 0.4 0.8
2030 71.4 7.9 1.7 7.0 0.8 1.6
Str
etc
h 2015 4.27 0.47 0.10 0.42 0.05 0.10
2020 73.4 8.2 1.7 7.2 0.8 1.7
2030 462.7 51.4 10.8 45.6 5.1 10.6
Notes: Dinorwig can produce up to 9GWh of electricity until the water reserves are depleted.
Average hourly electricity demands based on 2010 forecast values, which are 376.8TWh for
GB and 37.7TWh for Ireland.
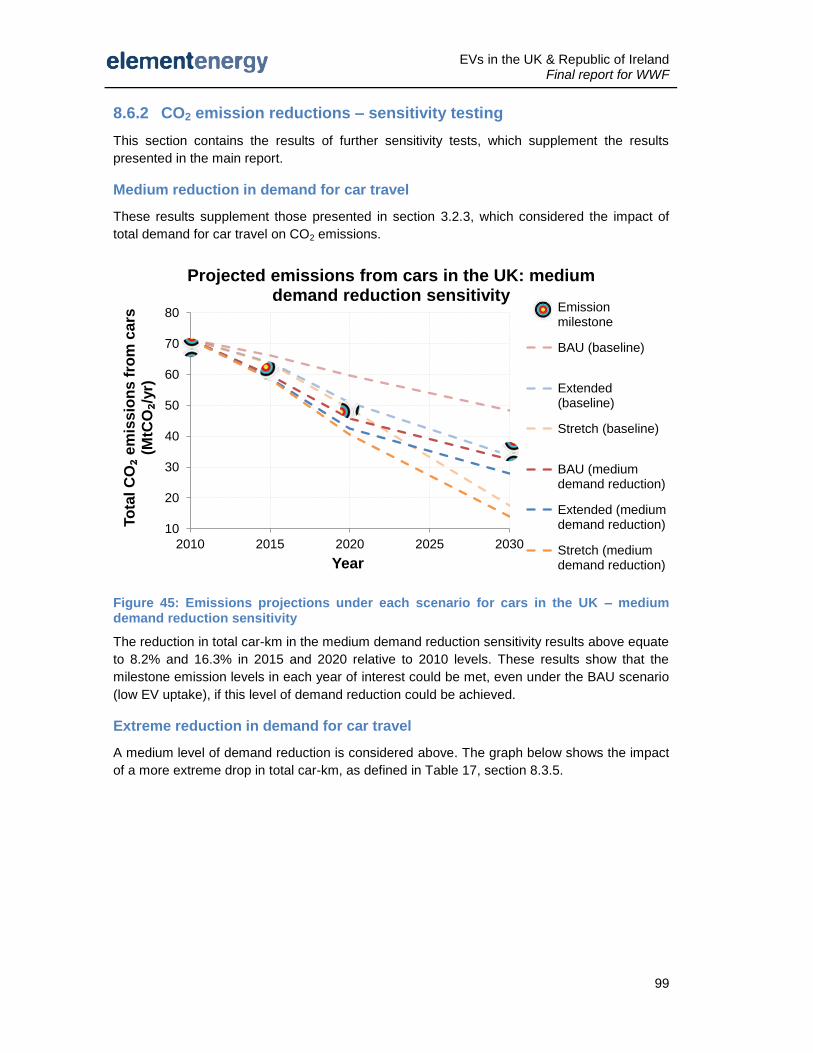
EVs in the UK & Republic of Ireland Final report for WWF
99
8.6.2 CO2 emission reductions – sensitivity testing
This section contains the results of further sensitivity tests, which supplement the results
presented in the main report.
Medium reduction in demand for car travel
These results supplement those presented in section 3.2.3, which considered the impact of
total demand for car travel on CO2 emissions.
Figure 45: Emissions projections under each scenario for cars in the UK – medium demand reduction sensitivity
The reduction in total car-km in the medium demand reduction sensitivity results above equate
to 8.2% and 16.3% in 2015 and 2020 relative to 2010 levels. These results show that the
milestone emission levels in each year of interest could be met, even under the BAU scenario
(low EV uptake), if this level of demand reduction could be achieved.
Extreme reduction in demand for car travel
A medium level of demand reduction is considered above. The graph below shows the impact
of a more extreme drop in total car-km, as defined in Table 17, section 8.3.5.
10
20
30
40
50
60
70
80
2010 2015 2020 2025 2030
To
tal C
O₂
em
issio
ns f
rom
cars
(M
tCO₂/
yr)
Year
Projected emissions from cars in the UK: medium demand reduction sensitivity
Emissionmilestone
BAU (baseline)
Extended(baseline)
Stretch (baseline)
BAU (mediumdemand reduction)
Extended (mediumdemand reduction)
Stretch (mediumdemand reduction)
EVs in the UK & Republic of Ireland Final report for WWF
100
Figure 46: Emissions projections under each scenario for cars in the UK – extreme demand reduction sensitivity
The extreme demand reduction scenario includes car-km reductions of 11.5%, 22.9% and
37.4% by 2015, 2020 and 2030 respectively, which would be sufficient to meet the emission
milestones in all years even without EVs (provided that ICEV improvements in line with EU
legislation are realised).
0
10
20
30
40
50
60
70
80
2010 2015 2020 2025 2030
To
tal C
O₂
em
issio
ns f
rom
cars
(M
tCO₂/
yr)
Year
Projected emissions from cars in the UK: extreme demand reduction sensitivity
Emissionmilestone
BAU (baseline)
Extended(baseline)
Stretch (baseline)
BAU (extremedemand reduction)
Extended (extremedemand reduction)
Stretch (extremedemand reduction)
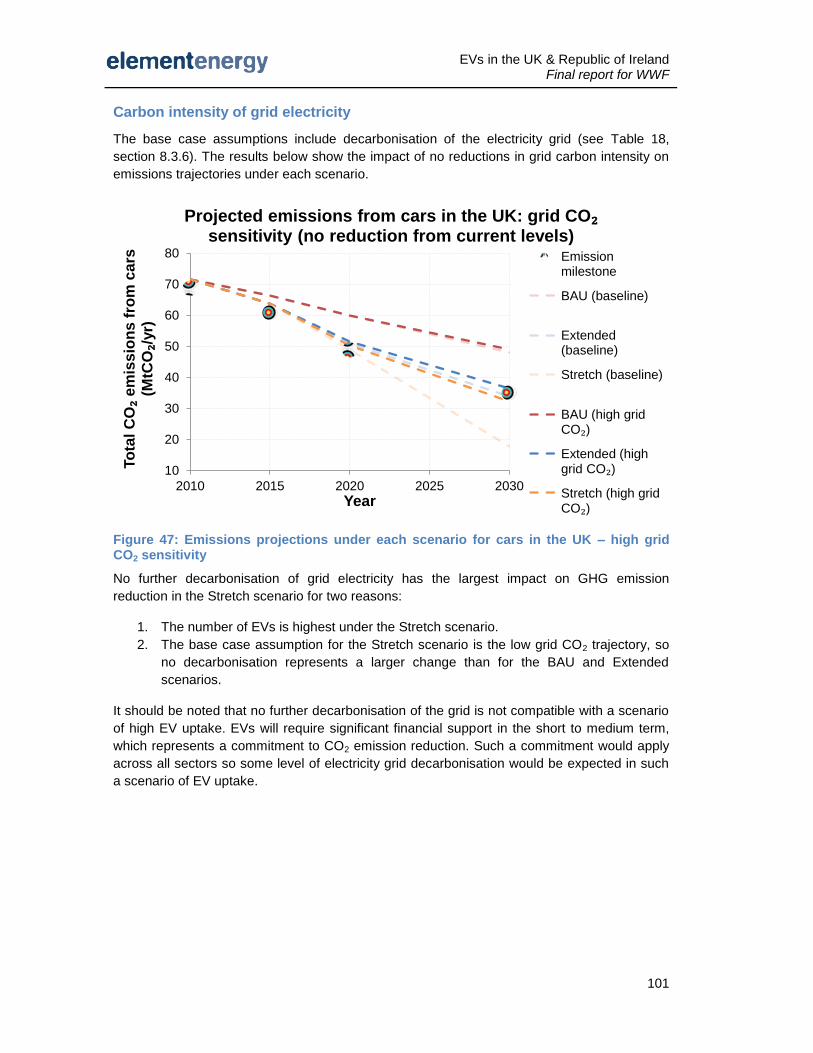
EVs in the UK & Republic of Ireland Final report for WWF
101
Carbon intensity of grid electricity
The base case assumptions include decarbonisation of the electricity grid (see Table 18,
section 8.3.6). The results below show the impact of no reductions in grid carbon intensity on
emissions trajectories under each scenario.
Figure 47: Emissions projections under each scenario for cars in the UK – high grid CO2 sensitivity
No further decarbonisation of grid electricity has the largest impact on GHG emission
reduction in the Stretch scenario for two reasons:
1. The number of EVs is highest under the Stretch scenario.
2. The base case assumption for the Stretch scenario is the low grid CO2 trajectory, so
no decarbonisation represents a larger change than for the BAU and Extended
scenarios.
It should be noted that no further decarbonisation of the grid is not compatible with a scenario
of high EV uptake. EVs will require significant financial support in the short to medium term,
which represents a commitment to CO2 emission reduction. Such a commitment would apply
across all sectors so some level of electricity grid decarbonisation would be expected in such
a scenario of EV uptake.
10
20
30
40
50
60
70
80
2010 2015 2020 2025 2030
To
tal C
O₂
em
iss
ion
s f
rom
ca
rs
(MtC
O₂/
yr)
Year
Projected emissions from cars in the UK: grid CO₂sensitivity (no reduction from current levels)
Emissionmilestone
BAU (baseline)
Extended(baseline)
Stretch (baseline)
BAU (high grid CO₂)
Extended (high grid CO₂)
Stretch (high grid CO₂)
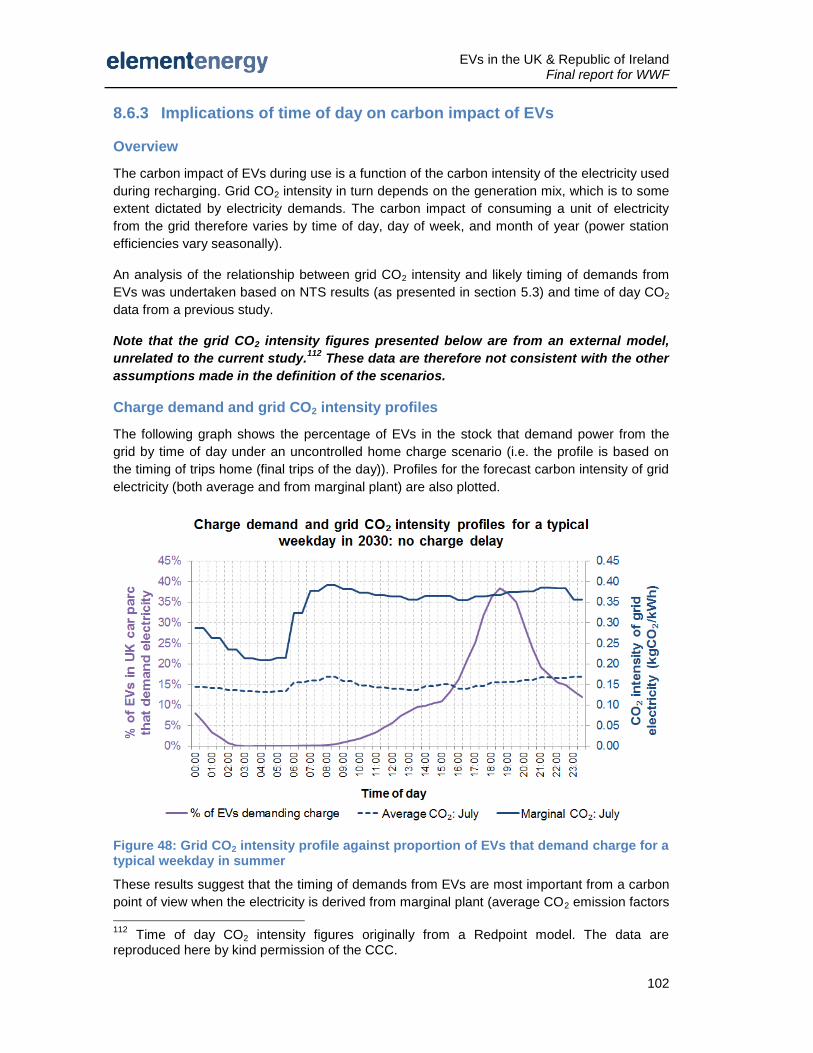
EVs in the UK & Republic of Ireland Final report for WWF
102
8.6.3 Implications of time of day on carbon impact of EVs
Overview
The carbon impact of EVs during use is a function of the carbon intensity of the electricity used
during recharging. Grid CO2 intensity in turn depends on the generation mix, which is to some
extent dictated by electricity demands. The carbon impact of consuming a unit of electricity
from the grid therefore varies by time of day, day of week, and month of year (power station
efficiencies vary seasonally).
An analysis of the relationship between grid CO2 intensity and likely timing of demands from
EVs was undertaken based on NTS results (as presented in section 5.3) and time of day CO2
data from a previous study.
Note that the grid CO2 intensity figures presented below are from an external model,
unrelated to the current study.112
These data are therefore not consistent with the other
assumptions made in the definition of the scenarios.
Charge demand and grid CO2 intensity profiles
The following graph shows the percentage of EVs in the stock that demand power from the
grid by time of day under an uncontrolled home charge scenario (i.e. the profile is based on
the timing of trips home (final trips of the day)). Profiles for the forecast carbon intensity of grid
electricity (both average and from marginal plant) are also plotted.
Figure 48: Grid CO2 intensity profile against proportion of EVs that demand charge for a typical weekday in summer
These results suggest that the timing of demands from EVs are most important from a carbon
point of view when the electricity is derived from marginal plant (average CO2 emission factors
112
Time of day CO2 intensity figures originally from a Redpoint model. The data are reproduced here by kind permission of the CCC.
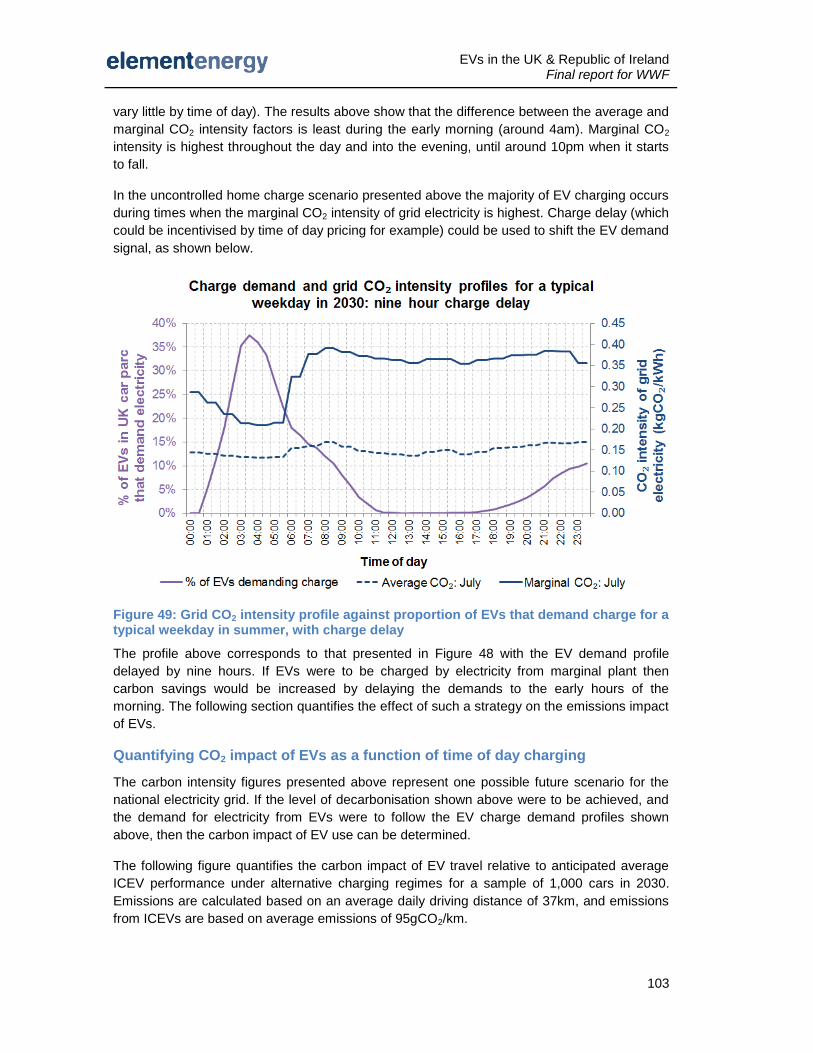
EVs in the UK & Republic of Ireland Final report for WWF
103
vary little by time of day). The results above show that the difference between the average and
marginal CO2 intensity factors is least during the early morning (around 4am). Marginal CO2
intensity is highest throughout the day and into the evening, until around 10pm when it starts
to fall.
In the uncontrolled home charge scenario presented above the majority of EV charging occurs
during times when the marginal CO2 intensity of grid electricity is highest. Charge delay (which
could be incentivised by time of day pricing for example) could be used to shift the EV demand
signal, as shown below.
Figure 49: Grid CO2 intensity profile against proportion of EVs that demand charge for a typical weekday in summer, with charge delay
The profile above corresponds to that presented in Figure 48 with the EV demand profile
delayed by nine hours. If EVs were to be charged by electricity from marginal plant then
carbon savings would be increased by delaying the demands to the early hours of the
morning. The following section quantifies the effect of such a strategy on the emissions impact
of EVs.
Quantifying CO2 impact of EVs as a function of time of day charging
The carbon intensity figures presented above represent one possible future scenario for the
national electricity grid. If the level of decarbonisation shown above were to be achieved, and
the demand for electricity from EVs were to follow the EV charge demand profiles shown
above, then the carbon impact of EV use can be determined.
The following figure quantifies the carbon impact of EV travel relative to anticipated average
ICEV performance under alternative charging regimes for a sample of 1,000 cars in 2030.
Emissions are calculated based on an average daily driving distance of 37km, and emissions
from ICEVs are based on average emissions of 95gCO2/km.
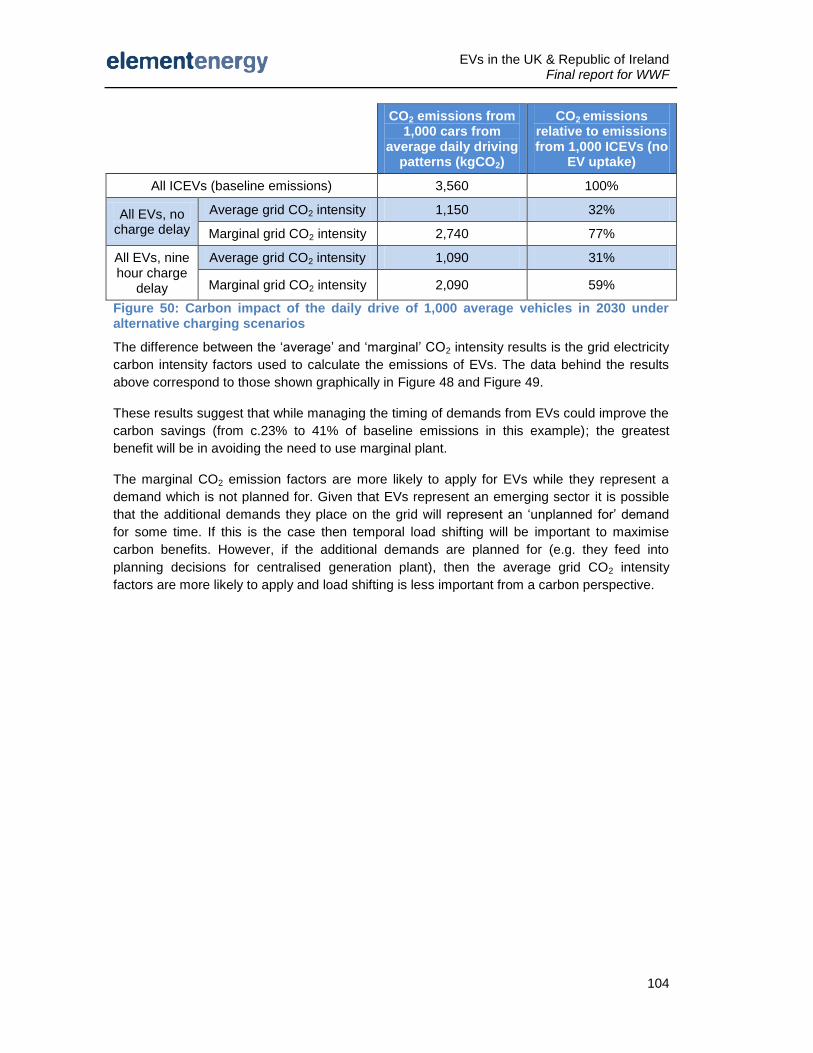
EVs in the UK & Republic of Ireland Final report for WWF
104
CO2 emissions from 1,000 cars from
average daily driving patterns (kgCO2)
CO2 emissions relative to emissions from 1,000 ICEVs (no
EV uptake)
All ICEVs (baseline emissions) 3,560 100%
All EVs, no charge delay
Average grid CO2 intensity 1,150 32%
Marginal grid CO2 intensity 2,740 77%
All EVs, nine hour charge
delay
Average grid CO2 intensity 1,090 31%
Marginal grid CO2 intensity 2,090 59%
Figure 50: Carbon impact of the daily drive of 1,000 average vehicles in 2030 under alternative charging scenarios
The difference between the ‘average’ and ‘marginal’ CO2 intensity results is the grid electricity
carbon intensity factors used to calculate the emissions of EVs. The data behind the results
above correspond to those shown graphically in Figure 48 and Figure 49.
These results suggest that while managing the timing of demands from EVs could improve the
carbon savings (from c.23% to 41% of baseline emissions in this example); the greatest
benefit will be in avoiding the need to use marginal plant.
The marginal CO2 emission factors are more likely to apply for EVs while they represent a
demand which is not planned for. Given that EVs represent an emerging sector it is possible
that the additional demands they place on the grid will represent an ‘unplanned for’ demand
for some time. If this is the case then temporal load shifting will be important to maximise
carbon benefits. However, if the additional demands are planned for (e.g. they feed into
planning decisions for centralised generation plant), then the average grid CO2 intensity
factors are more likely to apply and load shifting is less important from a carbon perspective.
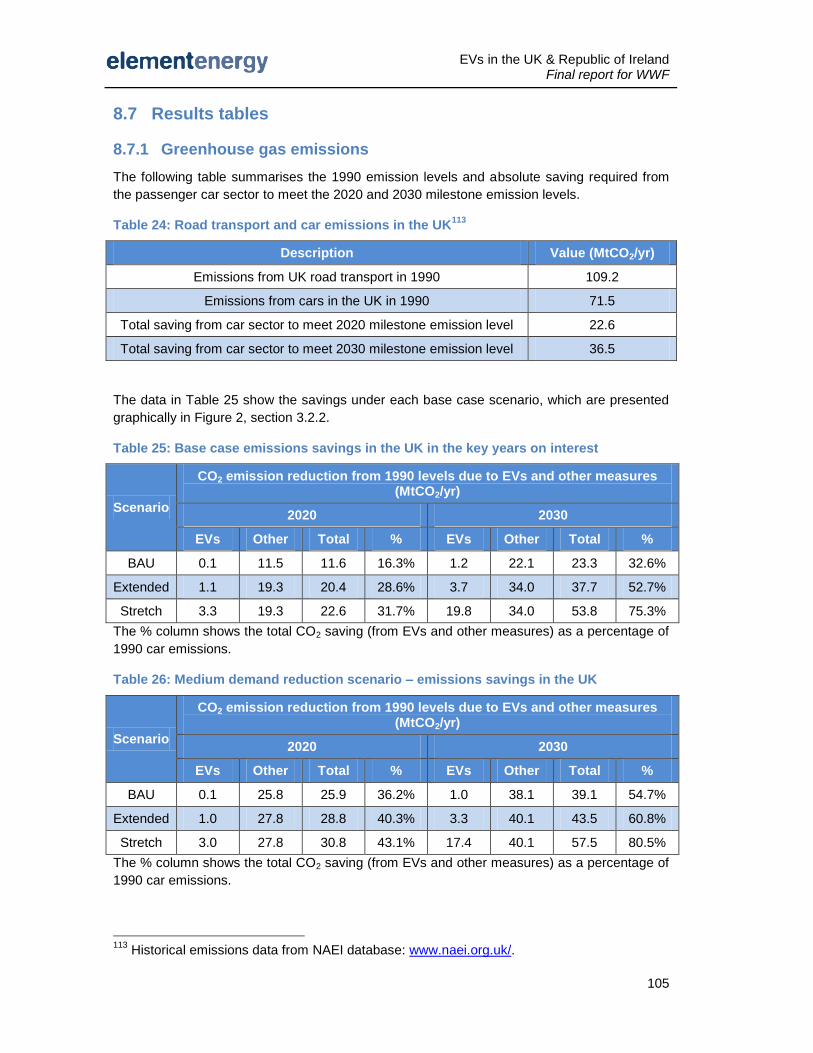
EVs in the UK & Republic of Ireland Final report for WWF
105
8.7 Results tables
8.7.1 Greenhouse gas emissions
The following table summarises the 1990 emission levels and absolute saving required from
the passenger car sector to meet the 2020 and 2030 milestone emission levels.
Table 24: Road transport and car emissions in the UK113
Description Value (MtCO2/yr)
Emissions from UK road transport in 1990 109.2
Emissions from cars in the UK in 1990 71.5
Total saving from car sector to meet 2020 milestone emission level 22.6
Total saving from car sector to meet 2030 milestone emission level 36.5
The data in Table 25 show the savings under each base case scenario, which are presented
graphically in Figure 2, section 3.2.2.
Table 25: Base case emissions savings in the UK in the key years on interest
Scenario
CO2 emission reduction from 1990 levels due to EVs and other measures (MtCO2/yr)
2020 2030
EVs Other Total % EVs Other Total %
BAU 0.1 11.5 11.6 16.3% 1.2 22.1 23.3 32.6%
Extended 1.1 19.3 20.4 28.6% 3.7 34.0 37.7 52.7%
Stretch 3.3 19.3 22.6 31.7% 19.8 34.0 53.8 75.3%
The % column shows the total CO2 saving (from EVs and other measures) as a percentage of
1990 car emissions.
Table 26: Medium demand reduction scenario – emissions savings in the UK
Scenario
CO2 emission reduction from 1990 levels due to EVs and other measures (MtCO2/yr)
2020 2030
EVs Other Total % EVs Other Total %
BAU 0.1 25.8 25.9 36.2% 1.0 38.1 39.1 54.7%
Extended 1.0 27.8 28.8 40.3% 3.3 40.1 43.5 60.8%
Stretch 3.0 27.8 30.8 43.1% 17.4 40.1 57.5 80.5%
The % column shows the total CO2 saving (from EVs and other measures) as a percentage of
1990 car emissions.
113
Historical emissions data from NAEI database: www.naei.org.uk/.
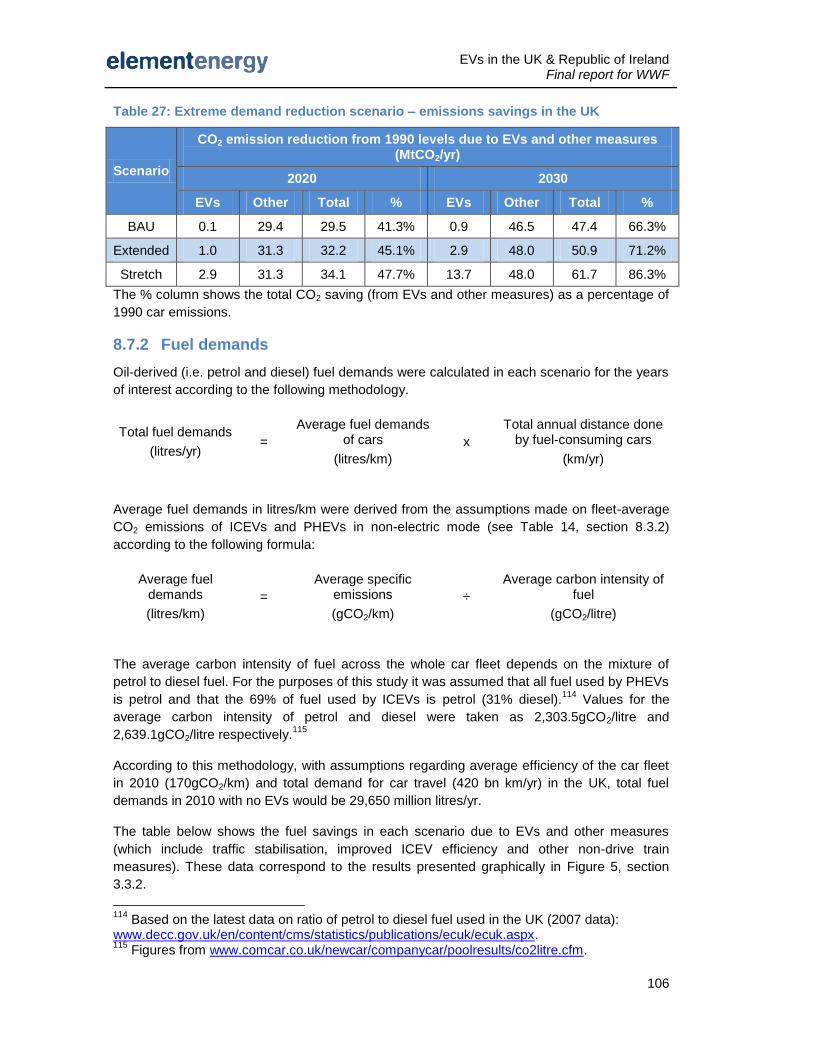
EVs in the UK & Republic of Ireland Final report for WWF
106
Table 27: Extreme demand reduction scenario – emissions savings in the UK
Scenario
CO2 emission reduction from 1990 levels due to EVs and other measures (MtCO2/yr)
2020 2030
EVs Other Total % EVs Other Total %
BAU 0.1 29.4 29.5 41.3% 0.9 46.5 47.4 66.3%
Extended 1.0 31.3 32.2 45.1% 2.9 48.0 50.9 71.2%
Stretch 2.9 31.3 34.1 47.7% 13.7 48.0 61.7 86.3%
The % column shows the total CO2 saving (from EVs and other measures) as a percentage of
1990 car emissions.
8.7.2 Fuel demands
Oil-derived (i.e. petrol and diesel) fuel demands were calculated in each scenario for the years
of interest according to the following methodology.
Total fuel demands
(litres/yr) =
Average fuel demands of cars
(litres/km)
x
Total annual distance done by fuel-consuming cars
(km/yr)
Average fuel demands in litres/km were derived from the assumptions made on fleet-average
CO2 emissions of ICEVs and PHEVs in non-electric mode (see Table 14, section 8.3.2)
according to the following formula:
Average fuel demands
(litres/km)
=
Average specific emissions
(gCO2/km)
÷
Average carbon intensity of fuel
(gCO2/litre)
The average carbon intensity of fuel across the whole car fleet depends on the mixture of
petrol to diesel fuel. For the purposes of this study it was assumed that all fuel used by PHEVs
is petrol and that the 69% of fuel used by ICEVs is petrol (31% diesel).114
Values for the
average carbon intensity of petrol and diesel were taken as 2,303.5gCO2/litre and
2,639.1gCO2/litre respectively.115
According to this methodology, with assumptions regarding average efficiency of the car fleet
in 2010 (170gCO2/km) and total demand for car travel (420 bn km/yr) in the UK, total fuel
demands in 2010 with no EVs would be 29,650 million litres/yr.
The table below shows the fuel savings in each scenario due to EVs and other measures
(which include traffic stabilisation, improved ICEV efficiency and other non-drive train
measures). These data correspond to the results presented graphically in Figure 5, section
3.3.2.
114
Based on the latest data on ratio of petrol to diesel fuel used in the UK (2007 data): www.decc.gov.uk/en/content/cms/statistics/publications/ecuk/ecuk.aspx. 115
Figures from www.comcar.co.uk/newcar/companycar/poolresults/co2litre.cfm.
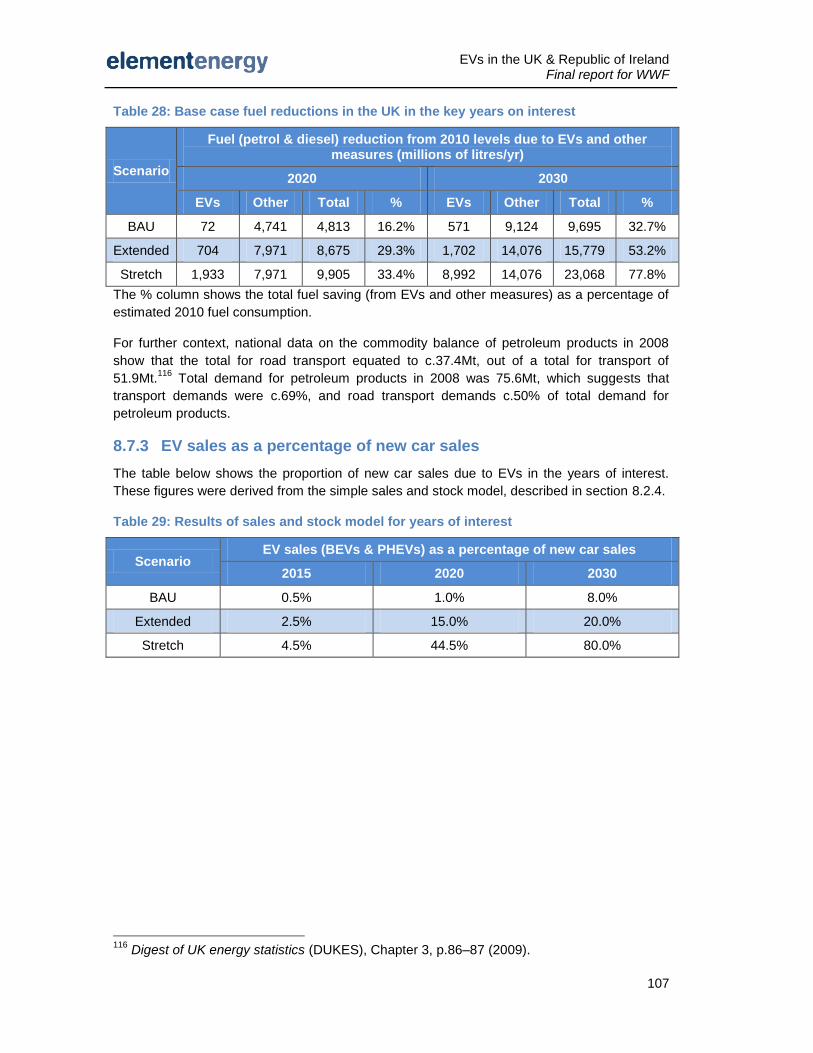
EVs in the UK & Republic of Ireland Final report for WWF
107
Table 28: Base case fuel reductions in the UK in the key years on interest
Scenario
Fuel (petrol & diesel) reduction from 2010 levels due to EVs and other measures (millions of litres/yr)
2020 2030
EVs Other Total % EVs Other Total %
BAU 72 4,741 4,813 16.2% 571 9,124 9,695 32.7%
Extended 704 7,971 8,675 29.3% 1,702 14,076 15,779 53.2%
Stretch 1,933 7,971 9,905 33.4% 8,992 14,076 23,068 77.8%
The % column shows the total fuel saving (from EVs and other measures) as a percentage of
estimated 2010 fuel consumption.
For further context, national data on the commodity balance of petroleum products in 2008
show that the total for road transport equated to c.37.4Mt, out of a total for transport of
51.9Mt.116
Total demand for petroleum products in 2008 was 75.6Mt, which suggests that
transport demands were c.69%, and road transport demands c.50% of total demand for
petroleum products.
8.7.3 EV sales as a percentage of new car sales
The table below shows the proportion of new car sales due to EVs in the years of interest.
These figures were derived from the simple sales and stock model, described in section 8.2.4.
Table 29: Results of sales and stock model for years of interest
Scenario EV sales (BEVs & PHEVs) as a percentage of new car sales
2015 2020 2030
BAU 0.5% 1.0% 8.0%
Extended 2.5% 15.0% 20.0%
Stretch 4.5% 44.5% 80.0%
116
Digest of UK energy statistics (DUKES), Chapter 3, p.86–87 (2009).