sharedata
TRANSCRIPT

ANGLOVAAL MINING LIMITED | Annual Report 2002
M I N I N GA N G L O V A A L

0 2 Group structure
0 3 Profi le
0 4 Group financial summary and
statistics
0 6 Directors
0 7 Senior management and board
committees
0 8 Review by the chairman and chief
executive officer
1 2 Review of operations
1 2 Ferrous metals
1 4 Precious metals
1 6 Base metals
1 7 Cobalt/copper
1 8 Nickel
2 0 Mineral resources and reserves
2 4 Corporate sustainable development
2 9 Corporate governance
3 4 Annual financial statements
8 4 Shareholders’ analysis and diary
8 5 Administration
8 6 Notice of annual general meeting
Attached Form of proxy
Anglovaal Mining Limited is incorporated in the
Republic of South Afr ica and is l isted on the JSE
Securi t ies Exchange, South Afr ica and the London
Stock Exchange. At 30 June 2002, the Company had
a marke t cap i ta l i sa t ion o f R4 ,12 b i l l i on .
1C
on
ten
ts
C O N T E N T S
F O R W A R D L O O K I N G S T A T E M E N TC e r t a i n s t a t e m e n t s i n c l u d e d i n t h i s r e p o r t c o n s t i t u t e “ f o r w a r d l o o k i n g s t a t m e n t s ” . S u c h s t a t e m e n t s i n v o l v e k n o w n
a n d u n k n o w n r i s k s , u n c e r t a i n t i e s a n d o t h e r f a c t o r s t h a t m a y c a u s e t h e a c t u a l r e s u l t s , p e r f o r m a n c e s , o b j e c t i v e s o r
a c h i e v e m e n t s o f A n g l o v a a l M i n i n g L i m i t e d a n d i t s s u b s i d i a r y o r a s s o c i a t e d c o m p a n i e s a s w e l l a s t h e m i n i n g
i n d u s t r y t o b e m a t e r i a l l y d i f f e r e n t f r o m f u t u r e r e s u l t s , p e r f o r m a n c e s , o b j e c t i v e s o r a c h i e v e m e n t s e x p r e s s e d o r
i m p l i e d b y t h e s e f o r w a r d l o o k i n g s t a t e m e n t s . A n g l o v a a l M i n i n g L i m i t e d i s s u b j e c t t o t h e e f f e c t o f c h a n g e s i n t h e
m i n e r a l s a n d m e t a l s c o m m o d i t y p r i c e s , c u r r e n c y f l u c t u a t i o n s a n d t h e r i s k s i n v o l v e d i n m i n i n g o p e r a t i o n s .

ANGLOVAAL MINING LIMITED
Developers and operators of managedinvestments in southern Africa in the ferrous,precious and base metals sectors
AVMIN GROUP:30 June 2002
•Revenue: R4 billion•Cost of sales: R2,9 billion•Profit before tax: R694 million•Headline earnings: R204 million
FERROUS METALS
•Assmang – 50,3%(iron ore, manganese ore and alloys, chrome ore and alloys)
ASSMANG GROUP:30 June 2002
• Revenue: R2,8 billion• Cost of sales: R1,9 billion• Profit before tax: R1,2 billion• Contribution to Avmin’s
headline earnings: R270 million
BASE METALS
•Chambishi Metals – 90% (cobalt and copper)
•Nkomati – 75% (nickel, copper, cobalt, PGMs)
CHAMBISHI METALS:30 June 2002
• Revenue: R547 million• Cost of sales: R561 million• Loss before tax (after exceptional
items): R2 233 million• Contribution to Avmin’s headline
earnings: R211 million – loss
NKOMATI:30 June 2002
• Revenue: R435 million• Cost of sales: R223 million• Profit before tax: R221 million• Contribution to Avmin’s headline
earnings: R122 million
PRECIOUS METALS
•Avgold – 56% (gold)
•Two Rivers Platinum – 55% (PGMs)
AVGOLD:30 June 2002
• Revenue: R364 million• Cost of sales: R346 million• Profit before tax: R41 million• Contribution to Avmin’s
headline earnings: R21 million
G R O U P S T R U C T U R E – 2 0 0 2
2G
rou
p s
tru
ctu
re 2
00
2

2
68
4
1
3
7
5
Nelspruit
Johannesburg
Durban
Bloemfontein
Kimberley
East London
Port Elizabeth
Cape Town
9
LIMPOPO(NORTHERN)PROVINCE
NORTH WEST
GAUTENG
MPUMALANGA
FREE STATE KWA-ZULUNATAL
NORTHERN CAPE
WESTERN CAPE
EASTERN CAPE
1 Two Rivers: PGMs
Assmang: chrome ore (Dwarsrivier)
2 Nkomati: nickel, copper, cobalt, PGMs
3 Avgold: gold (ETC)
4 Assmang: chrome alloys
5 Assmang: manganese alloys
6 Avgold: gold (Target)
7 Assmang: manganese ore (Nchwaning)
8 Assmang: iron ore (Beeshoek)
9 Chambish Metals: cobalt/copper
Anglovaal Mining Limited cont inues to enhance i ts posi t ion asan operator of qual i ty assets in the ferrous, base and preciousmetal sectors in southern Afr ica and i t a lso has a strongproject p ipel ine. The Group’s object ive is to del iver superiorreturns to i ts shareholders in a sustainable manner whi lstcontr ibut ing to the economic development, social wel l -beingand environmental protect ion of the areas where the Group
3P
rofi
le a
nd
str
uc
ture
P R O F I L E
A S S E T L O C A T I O N S
P r i n c i p a l o p e r a t i n g e n t i t i e s

Defini t ions 1 . Effective taxation rate (per cent)
Taxation charge per income statement less secondary tax on companies divided by profit before taxation.
2 . Interest cover (t imes)Profit before exceptional items and finance costs divided by finance costs.
3 . Dividend cover (t imes) Headline earnings per share divided by dividends per share for the year.
4 . Return on operational assets (per cent) Profit from operations divided by tangible non-current and current assets excluding capital work inprogress.
5 . Return on capital employed (per cent) Profit before exceptional items and finance costs, divided by average capital employed.Capital employed comprises non-current and current assets less trade and other payables andprovisions.
6 . Return on equity (per cent) Headline earnings divided by ordinary shareholders’ interest in capital and reserves.
7 . Debt:equity rat io Total debt divided by total equity. Total debt comprises long-term borrowings, overdrafts and short-termborrowings.
Total equity comprises total shareholders' interest.
8 . Net debt:equity rat ioTotal debt less cash and cash equivalents divided by total equity. Total debt comprises long-termborrowings, overdrafts and short-term borrowings.
Total equity comprises total shareholders’ interest.
9 . Net asset value per share (cents) Ordinary shareholders' interest in capital and reserves divided by number of shares in issue.
10 . Market capital isation (R mil l ion)Number of ordinary shares in issue multiplied by market value of shares at 30 June.
Note: The Group results for 1999 and 2000 include diamond royalties from The Saturn Partnership. The Group’sdiamond interests were disposed on 12 June 2000 and a distribution of R27,00 per share was made toshareholders on 7 July 2000.
4G
rou
p f
ina
nc
ial
su
mm
ary
an
d s
tati
sti
cs
G R O U P F I N A N C I A L S U M M A R Y A N D S T A T I S T I C S
2 0 0 1 2 0 0 2
J A S O N D J F M A M J
SO
UTH
AFR
ICA
N C
EN
TS
Anglovaal Mining Limited: High/low share price31/07/01 - 30/06/02
Month low share priceMonth high share price
3 000
3 200
3 400
3 600
3 800
4 000
4 200
4 400
5G
rou
p f
ina
nc
ial
su
mm
ary
an
d s
tati
sti
cs
G R O U P F I N A N C I A L S U M M A R Y A N D S T A T I S T I C S
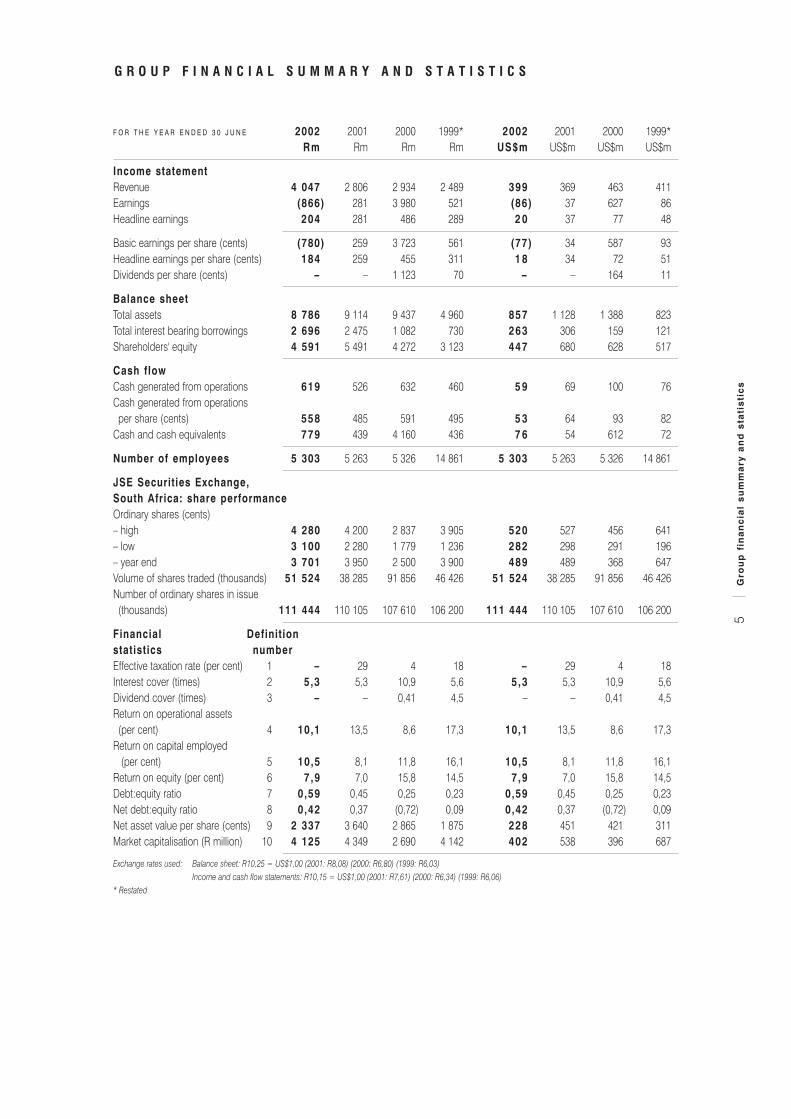
F O R T H E Y E A R E N D E D 3 0 J U N E 2002 2001 2000 1999* 2002 2001 2000 1999* Rm Rm Rm Rm US$m US$m US$m US$m
Income statement Revenue 4 047 2 806 2 934 2 489 399 369 463 411 Earnings (866) 281 3 980 521 (86) 37 627 86 Headline earnings 204 281 486 289 2 0 37 77 48
Basic earnings per share (cents) (780) 259 3 723 561 (77) 34 587 93 Headline earnings per share (cents) 184 259 455 311 1 8 34 72 51 Dividends per share (cents) – – 1 123 70 – – 164 11
Balance sheet Total assets 8 786 9 114 9 437 4 960 857 1 128 1 388 823 Total interest bearing borrowings 2 696 2 475 1 082 730 263 306 159 121 Shareholders' equity 4 591 5 491 4 272 3 123 447 680 628 517
Cash flow Cash generated from operations 619 526 632 460 5 9 69 100 76 Cash generated from operations
per share (cents) 558 485 591 495 5 3 64 93 82 Cash and cash equivalents 779 439 4 160 436 7 6 54 612 72
Number of employees 5 303 5 263 5 326 14 861 5 303 5 263 5 326 14 861
JSE Securities Exchange, South Africa: share performanceOrdinary shares (cents) – high 4 280 4 200 2 837 3 905 520 527 456 641 – low 3 100 2 280 1 779 1 236 282 298 291 196 – year end 3 701 3 950 2 500 3 900 489 489 368 647 Volume of shares traded (thousands) 51 524 38 285 91 856 46 426 51 524 38 285 91 856 46 426 Number of ordinary shares in issue
(thousands) 111 444 110 105 107 610 106 200 111 444 110 105 107 610 106 200
Financial Definit ionstatistics number Effective taxation rate (per cent) 1 – 29 4 18 – 29 4 18 Interest cover (times) 2 5,3 5,3 10,9 5,6 5,3 5,3 10,9 5,6 Dividend cover (times) 3 – – 0,41 4,5 – – 0,41 4,5 Return on operational assets
(per cent) 4 10,1 13,5 8,6 17,3 10,1 13,5 8,6 17,3Return on capital employed
(per cent) 5 10,5 8,1 11,8 16,1 10,5 8,1 11,8 16,1 Return on equity (per cent) 6 7,9 7,0 15,8 14,5 7,9 7,0 15,8 14,5 Debt:equity ratio 7 0,59 0,45 0,25 0,23 0,59 0,45 0,25 0,23 Net debt:equity ratio 8 0,42 0,37 (0,72) 0,09 0,42 0,37 (0,72) 0,09Net asset value per share (cents) 9 2 337 3 640 2 865 1 875 228 451 421 311 Market capitalisation (R million) 10 4 125 4 349 2 690 4 142 402 538 396 687
Exchange rates used: Balance sheet: R10,25 = US$1,00 (2001: R8,08) (2000: R6,80) (1999: R6,03)Income and cash flow statements: R10,15 = US$1,00 (2001: R7,61) (2000: R6,34) (1999: R6,06)
* Restated
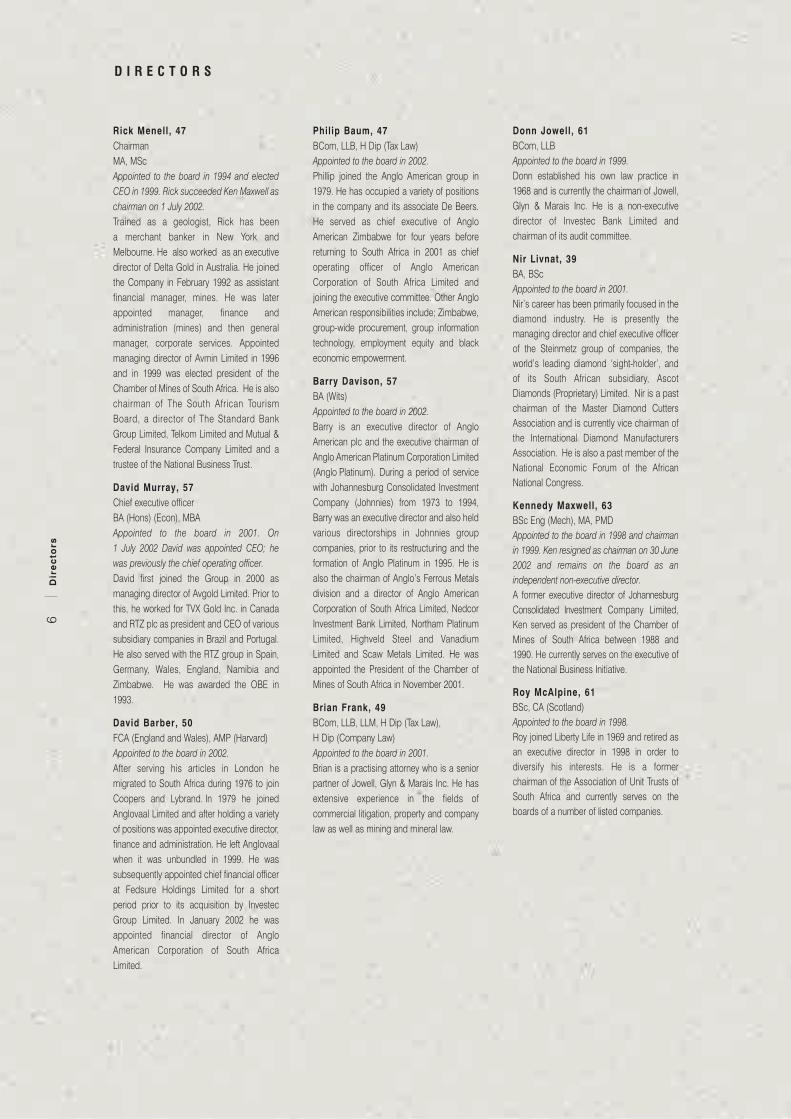
Rick Menell, 47ChairmanMA, MScAppointed to the board in 1994 and electedCEO in 1999. Rick succeeded Ken Maxwell aschairman on 1 July 2002. Trained as a geologist, Rick has been a merchant banker in New York andMelbourne. He also worked as an executivedirector of Delta Gold in Australia. He joinedthe Company in February 1992 as assistantfinancial manager, mines. He was laterappointed manager, finance andadministration (mines) and then generalmanager, corporate services. Appointedmanaging director of Avmin Limited in 1996and in 1999 was elected president of theChamber of Mines of South Africa. He is alsochairman of The South African TourismBoard, a director of The Standard BankGroup Limited, Telkom Limited and Mutual &Federal Insurance Company Limited and atrustee of the National Business Trust.
David Murray, 57Chief executive officerBA (Hons) (Econ), MBAAppointed to the board in 2001. On 1 July 2002 David was appointed CEO; hewas previously the chief operating officer.David first joined the Group in 2000 asmanaging director of Avgold Limited. Prior tothis, he worked for TVX Gold Inc. in Canadaand RTZ plc as president and CEO of varioussubsidiary companies in Brazil and Portugal.He also served with the RTZ group in Spain,Germany, Wales, England, Namibia andZimbabwe. He was awarded the OBE in1993.
David Barber, 50FCA (England and Wales), AMP (Harvard)Appointed to the board in 2002.After serving his articles in London hemigrated to South Africa during 1976 to joinCoopers and Lybrand. In 1979 he joinedAnglovaal Limited and after holding a varietyof positions was appointed executive director,finance and administration. He left Anglovaalwhen it was unbundled in 1999. He wassubsequently appointed chief financial officerat Fedsure Holdings Limited for a shortperiod prior to its acquisition by InvestecGroup Limited. In January 2002 he wasappointed financial director of AngloAmerican Corporation of South AfricaLimited.
Philip Baum, 47BCom, LLB, H Dip (Tax Law)Appointed to the board in 2002.Phillip joined the Anglo American group in1979. He has occupied a variety of positionsin the company and its associate De Beers.He served as chief executive of AngloAmerican Zimbabwe for four years beforereturning to South Africa in 2001 as chiefoperating officer of Anglo AmericanCorporation of South Africa Limited andjoining the executive committee. Other AngloAmerican responsibilities include; Zimbabwe,group-wide procurement, group informationtechnology, employment equity and blackeconomic empowerment.
Barry Davison, 57BA (Wits)Appointed to the board in 2002.Barry is an executive director of AngloAmerican plc and the executive chairman ofAnglo American Platinum Corporation Limited(Anglo Platinum). During a period of servicewith Johannesburg Consolidated InvestmentCompany (Johnnies) from 1973 to 1994,Barry was an executive director and also heldvarious directorships in Johnnies groupcompanies, prior to its restructuring and theformation of Anglo Platinum in 1995. He isalso the chairman of Anglo’s Ferrous Metalsdivision and a director of Anglo AmericanCorporation of South Africa Limited, NedcorInvestment Bank Limited, Northam PlatinumLimited, Highveld Steel and VanadiumLimited and Scaw Metals Limited. He wasappointed the President of the Chamber ofMines of South Africa in November 2001.
Brian Frank, 49BCom, LLB, LLM, H Dip (Tax Law), H Dip (Company Law)Appointed to the board in 2001.Brian is a practising attorney who is a seniorpartner of Jowell, Glyn & Marais Inc. He hasextensive experience in the fields ofcommercial litigation, property and companylaw as well as mining and mineral law.
Donn Jowell, 61BCom, LLBAppointed to the board in 1999.Donn established his own law practice in1968 and is currently the chairman of Jowell,Glyn & Marais Inc. He is a non-executivedirector of Investec Bank Limited andchairman of its audit committee.
Nir Livnat, 39BA, BScAppointed to the board in 2001.Nir’s career has been primarily focused in thediamond industry. He is presently themanaging director and chief executive officerof the Steinmetz group of companies, theworld’s leading diamond ‘sight-holder’, andof its South African subsidiary, AscotDiamonds (Proprietary) Limited. Nir is a pastchairman of the Master Diamond CuttersAssociation and is currently vice chairman ofthe International Diamond ManufacturersAssociation. He is also a past member of theNational Economic Forum of the AfricanNational Congress.
Kennedy Maxwell, 63BSc Eng (Mech), MA, PMDAppointed to the board in 1998 and chairmanin 1999. Ken resigned as chairman on 30 June2002 and remains on the board as anindependent non-executive director.A former executive director of JohannesburgConsolidated Investment Company Limited,Ken served as president of the Chamber ofMines of South Africa between 1988 and1990. He currently serves on the executive ofthe National Business Initiative.
Roy McAlpine, 61BSc, CA (Scotland)Appointed to the board in 1998.Roy joined Liberty Life in 1969 and retired asan executive director in 1998 in order todiversify his interests. He is a formerchairman of the Association of Unit Trusts ofSouth Africa and currently serves on theboards of a number of listed companies.
6D
ire
cto
rs
D I R E C T O R S

S E N I O RB O A R D C O M M I T T E E S
7S
en
ior
ma
na
ge
me
nt
A u d i t
Kennedy Maxwell (Chairman)David BarberDonn JowellRick MenellDr Morley NkosiRoy Oron
E n v i r o n m e n t a l
Donn Jowell (Chairman)Brian FrankKennedy MaxwellBrian MenellRick MenellBill NairnDr Morley Nkosi
N o m i n a t i o n s
Philip BaumDonn JowellRick MenellDr Morley Nkosi
R e m u n e r a t i o n
Kennedy Maxwell (Chairman)Barry DavisonRoy McAlpineRick MenellRoy Oron
R i s k
Donn Jowell (Chairman)Philip BaumDoug CampbellBrian FrankRick MenellDavid Murray
R i c k M e n e l lChairman
D a v i d M u r r a y †Chief executive officer
J a n S t e e n k a m p † *Chief operating officer
B r y a n B r o e k m a n *Senior vice president: Ferrous metals
D o u g C a m p b e l l † *Senior vice president: Finance and chieffinancial officer
G e r h a r d P o t g i e t e r *Senior vice president: South Africanoperations
G e r r y R o b b e r t z e *Senior vice president: Technicalservices
G r a h a m B u t t e rVice president: Ferrous metals
G r a h a m E m m e t t *Vice president: Human resources
J u l i a n G w i l l i m † *Vice president: Corporate development
F r e d d i e H u m a n * Vice president: Safety, health andenvironment
A r n é L e w i s * Vice president: South African operations
T h y s U y s *Vice president: Technical services
D r J o h n K i l a n iGeneral manager: Safety, health andenvironment
T e b o h o M a h u m aGeneral manager: Government relationsand communications
†Members of the chiefexecutive’s committee
*Members of the operationscommittee
Brian Menell, 37BA (Hons)Appointed to the board in 1998.Brian has worked in the diamond mining andtrading industries since 1988 and serves onthe boards of various diamond mining,finance and trading companies in SouthAfrica, Belgium and Canada.
Bill Nairn, 57BSc (Min Eng)Alternate to Barry Davison.An executive director of Anglo American plcas well as its group technical director. Billcommenced his career with JohannesburgConsolidated Investment Company Limitedas a learner official (mining) on RandfonteinEstates, Cooke section in 1964, and retiredas the chief executive and managing directorin 1994. He is also a director of AngloAmerican Corporation of South AfricaLimited, AngloGold Limited, Anglo AmericanPlatinum Corporation Limited and AngloOperations Limited.
Dr Morley Nkosi, 67PhD (Economics), MBA, BS (Economics)Appointed to the board in 1998.Apart from being an academic, economistand a businessman, Morley is thechairperson of the National Institute forEconomic Policy and managing associate ofMorley Nkosi Associates. He serves onseveral boards including those of InvestecGroup Limited and Investec Bank Limited.
Roy Oron, 33 BA (Hons), MBAAppointed to the board in 2000.Roy is currently the managing director ofNorinter Financial Advisors (Proprietary)Limited, a financial advisory firm. Previousexperience includes corporate finance,mergers and acquisitions as well as macroeconomy and privatisation strategy. He hasserved on the boards of various companies inthe following industries: telecommunications,real estate, information technology,environmental technology, luxury goods andinvestment banking. Roy has also completeda Masters in Statistics with majors inoperational research and risk theory.
D I R E C T O R S ( c o n t i n u e d )

8R
ev
iew
by
th
e c
ha
irm
an
an
d c
hie
f e
xec
uti
ve
off
ice
r
Rick Menell Chairman
David Murray Chief executive officer
“The Group’s 5 300 employees have responded very well to al lthe challenges that the Group faced during the past year and wewish to thank them for their efforts. We look forward to theircont inued focus dur ing the for thcoming year .”

The past year has been challenging, but beneficial to the future growth of the Group. Our South African assets,in particular Assmang Limited (Assmang), performed well, but these achievements were overshadowed by apoor performance from Chambishi Metals plc (Chambishi), our cobalt investment in Zambia. As aconsequence, headline earnings for the year reduced to R204 million from R281 million in the previous year.
In November last year, the redesign of the Chambishi furnace cooling system and refractory lining wasapproved. At the same time, we reviewed the carrying value of the Chambishi investment and decided on apartial write-down of R1,6 billion, which was taken in January 2002. As a direct result, we initiated aprogramme of strengthening our balance sheet and sold our investment in Iscor Limited for a totalconsideration of R911 million. We also sold some of our Avgold Limited (Avgold) and Assore Limitedinvestments and realised R234 million; these sales did not affect our core portfolio. The combined net gainamounted to R540 million.
Another important event that occurred during the year was Anglo American plc (Anglo American) acquiringa 34,9 per cent interest in Avmin, effective 12 March 2002, which is subject to regulatory approvals. Thisacquisition eliminated the historic control structure of Avmin. Coinciding with this, Anglo American alsoacquired a 20 per cent interest in Kumba Resources Limited (Kumba) with a view to unlocking the fullpotential of the Northern Cape iron ore assets of Kumba, Assmang and the relevant rail and portinfrastructure, owned and operated by the government of South Africa. Discussions are continuing in thisregard and all the possibilities being considered are value enhancing for Avmin stakeholders.
FINANCIAL AND OPERATING RESULTS. Strong sales for most products resulted in Group revenue risingb y44 per cent from R2,8 billion to R4,0 billion. Cost of sales increased by 43 per cent to R3,0 billion. Grossoperating profit increased by 47 per cent to R1 062 million (30 June 2001: R723 million) and profit before taxand exceptional items by 21 per cent to R694 million (R572 million). Headline earnings reduced from R281 million to R204 million due to Chambishi’s poor operating performance.
After the Chambishi write down, and gains on disposals, the Group made a loss after exceptional items andtaxation of R866 million as opposed to a profit of R281 million the previous year.
It is an indication of the strength of the Group’s South African operations that if Chambishi had broken even,as planned (i.e. no profit or loss), the Group would have achieved headline earnings of R425 million,representing a year-on-year increase of 51 per cent.
The most significant operational features of the year were:
Assmang had a record year with headline earnings rising by 92 per cent to R443 million. The weaker rand,improved volumes for most commodities, continued cost containment and better operating efficiencies allcontributed to this increase. The new R375 million, 54MVA chrome furnace and 350 000 tons per yearpelletising plant were commissioned during the year and are operating well. The new R517 million shaft atthe Nchwaning manganese mine is within budget and on schedule for commissioning before December2003.
Assmang increased its contribution to Avmin’s headline earnings from R153 million to R270 million, a 76 percent increase.
Avgold ’s Target gold mine was commissioned in the last quarter within its R2,1 billion budget. As the start-up issues are progressively resolved, Avgold is expected to become a major cash contributor to theCompany. The ETC gold mining complex restructuring, aimed at enhancing future grades, was alsocompleted in the past year.
9R
evie
w b
y th
e ch
airm
an a
nd c
hief
exe
cuti
ve o
ffic
er
R E V I E W B Y T H E C H A I R M A N A N D C H I E F E X E C U T I V E O F F I C E R
RA
ND
MIL
LIO
N
Ferrous metals270
Corporate,exploration and other
12
Total204
-221Cobalt/copper
Nickel122
Preciousmetals
21
300
250200
150
100
50
0-50
-100
-150
-200
-250
Contribution to Avmin’s headline earnings:Year ended 30 June 2002

Avgold’s contribution to Avmin’s headline earnings was R21 million (R39 million).
The Two Rivers Platinum (Proprietary) Limited (Two Rivers) project feasibility report is due for completionin October 2002 for issue to the partners, Avmin (55 per cent) and Impala Platinum Holding Limited (45 percent). Two Rivers is at an advanced stage of discussion with a view to introducing a black economicempowerment partner into this new venture. In projecting the project’s future profitability, the effect of the fallin platinum group metals (PGM) prices over the past year has been offset by the weaker rand.
Chambishi had a very disappointing year over and above the partial asset write down. The roaster circuit,which toll treats customers’ concentrates, operated well, but the new smelter circuit did not. Furnace availabilitywas only 65 per cent, design power input levels were never achieved and as a result only 1 100 tons of cobaltwere produced from the 4 500 ton per year facility. The furnace cooling system and refractory linings wereredesigned and have been installed. The furnace re-commissioning is advanced and is building up to achievedesign output levels before December 2002. Current performance at 30MW and 70 per cent capacity is aheadof expectation.
Chambishi reduced Avmin’s headline earnings to the extent of its loss of R221 million (R64 million – loss).
Nkomati nickel mine performed well throughout the year. The 11 per cent reduction of profit before tax at R221million is attributable to reduced US dollar commodity prices earlier in the year as well as significant off-mineUS dollar costs, which were adversely affected by the currency fluctuation. The expansion feasibility report wascompleted and is being evaluated by the two partners, Avmin (75 per cent) and Anglo American (25 per cent).
Nkomati contributed R122 million (R130 million) to Avmin’s headline earnings.
GROUP FUNDING. We remain concerned about the Group’s US dollar loan exposure and the year end netgearing level of 42 per cent, which was after investment disposals of R1 145 million. As a result, within Avgold,we are considering refinancing the US$35 million loan facility into rands. Operational cash flows and other profitgeneration will be utilised to reduce the current gearing level. Options to reduce debt levels further arecontinuously being considered.
HEDGING. A formal hedging policy has been adopted for the Group. The hedging policy has as its primaryfocus the reduction of risk. Avmin’s policy is not to utilise exotic hedging instruments or engage in financialspeculation. Hedging is aligned with forecast monthly production based on plans approved by the board.
In terms of bank covenants, Avgold has entered into gold hedges covering 60 per cent of its plannedproduction over the next four years during repayment of the R300 million and US$35 million combined loanraised to complete the development of the Target mine. None of Avgold’s hedge agreements are subject tomargin calls.
There are no other hedges in the Avmin Group at this time.
SUSTAINABLE DEVELOPMENT. Safety, health and the environment: We report with regret that one fatalaccident occurred within the Group during the year: Mr Aaron Ndhlovu died of injuries from a fall of ground atE T C .Mr Ndhlovu’s death is viewed as a tragedy.
Despite this incident, the Avmin Group has achieved a reducing trend of reportable injuries and lost day injuryrates over the last five years. Avmin continues its endeavours for safety to remain an imperative and that it isforemost in the minds of all employees.
The Group continues to give priority to the HIV/AIDS issue. Various initiatives are underway to counter the effectof this pandemic: prevalence testing has been completed throughout the Group and a comprehensivemanagement plan devised, which is well into its implementation phase. An education process is underway topromote HIV/AIDS prevention, as it is vital to ensure that employees who are HIV negative remain so. A keyadvantage of Avmin’s comprehensive plan, which places emphasis on voluntary counselling and testing, isthat it promotes individual behavioural change that is essential to turn the tide of this epidemic.
Avmin fully recognises the need to monitor, manage and reduce environmental impacts that the variousbusiness units may have on the communities in which the Group operates. Avmin has formulated guidelinesto encourage new initiatives and to assist operational management in the implementation of this importantpart of the Group’s key performance areas. The independent project within the Mining, Minerals andSustainable Development grouping, in which Avmin has played a role, is beginning to produce results. Thisproject is aimed at assessing the role that the mining, minerals and metals industries can play in contributing
10R
evie
w b
y th
e ch
airm
an a
nd c
hief
exe
cuti
ve o
ffic
er
R E V I E W B Y T H E C H A I R M A N A N D C H I E F E X E C U T I V E O F F I C E R
to a more sustainable future. The harsh realities of this were brought to the world’s attention during the WorldSummit on Sustainable Development (the Summit) held in Johannesburg during August 2002 wherebusiness, labour, governments and civil society worked together to evolve a plan for a better global environment.The Avmin Group was a proud participant at the Summit, and in a small way, played a part to ensure thetriumph of the vision of sustainable development.
More detail on Avmin’s activities are contained on pages 24 to 26, and in our Sustainable Development Report,2002, which outlines the actions that the Group is taking to contribute towards a sustainable future.
MINERAL AND PETROLEUM RESOURCES DEVELOPMENT BILL. The new Minerals and PetroleumResources Development Bill (the Bill) was presented to Parliament in June 2002 with two additional key inputsbeing awaited: the Socio Economic Empowerment Charter, which will set the framework, targets and timetablefor meaningful economic empowerment in the industry; and the Money Bill, which will regulate royaltiespayable by the South African mining industry to the State.
Avmin is working through the Chamber of Mines of South Africa to engage in dialogue to arrive at practicallegislative proposals that will allow us to adapt to the new industry structure. In relation to this, the Group hasbeen working for some time on black economic empowerment transactions that will make positivecontributions towards transformation of the South African mining industry and minimise value loss to existingstakeholders. The consummation of these transactions awaits clarification of the regulatory environment overthe coming months.
DIVIDENDS. In terms of bank covenants, no dividends were declared for the year ended 30 June 2002.
DIRECTORATE AND STAFF. During May 2002, Mr Kennedy Maxwell announced his retirement as chairman,effective 30 June 2002, and Mr Rick Menell was appointed as his successor. Ken has agreed to remain a non-executive director and continues to chair the audit and remuneration committees. On behalf of the board, weexpress our appreciation for Ken’s expertise, guidance and commitment to the Company during his term ofoffice as chairman. Mr David Murray, previously Avmin’s chief operating officer, has succeeded Rick as theCompany’s chief executive officer.
Following the introduction of Anglo American as a major shareholder, Messrs David Barber, Philip Baum andBarry Davison were appointed non-executive directors and Mr William (Bill) Nairn as Barry’s alternate. We havewelcomed their prudent guidance during the last few meetings of directors and look forward to their continuedinvolvement. Dr Vincent Maphai, a board member since 1998, decided to resign during the year as a result ofhis varied and extensive external commitments. Together with the rest of the board we thank him for hiscontribution.
The Group’s 5 300 employees have responded very well to all the challenges that the Group faced during thepast year and we wish to thank them for their efforts. We look forward to their continued focus during theforthcoming year.
FUTURE OUTLOOK. Avmin faces another challenging year. World commodity prices are not expected to bematerially higher than at present and the exchange rate future is uncertain. The major challenges ahead forthe Company are to achieve Chambishi’s performance targets on an ongoing basis and to ensure that designoutput levels at the Target gold mine are sustained. Earnings growth for the current year will depend on meetingthese challenges and also, to a large extent, on the rand/US dollar exchange rate remaining at current orweaker levels, as well as a recovery in the cobalt price from the current level of US$7,00/lb.
Rick Menel l
Chairman
David Murray
Chief executive officer
27 September 2002
11R
evie
w b
y th
e ch
airm
an a
nd c
hief
exe
cuti
ve o
ffic
er
R E V I E W B Y T H E C H A I R M A N A N D C H I E F E X E C U T I V E O F F I C E R

R E V I E W O F O P E R A T I O N S l F e r r o u s m e t a l s
13R
ev
iew
of
op
era
tio
ns
A s s m a n g L i m i t e d , 5 0 p e r c e n t o w n e d b y A v m i n , o p e r a t e s i n t h r e e d i v i s i o n s –
m a n g a n e s e , i r o n o r e a n d c h r o m e . I t s m a n g a n e s e o r e a n d i r o n o r e m i n i n g o p e r a t i o n s ,
N c h w a n i n g a n d B e e s h o e k , a r e i n t h e N o r t h e r n C a p e . M a n g a n e s e a l l o y s a r e p r o d u c e d a t
t h e s m e l t i n g a n d r e f i n i n g f a c i l i t i e s i n K w a Z u l u - N a t a l . C h r o m e o r e s a r e m i n e d a t t h e
D w a r s r i v i e r m i n e i n M p u m a l a n g a , a n d c h r o m e a l l o y s a r e p r o d u c e d a t t h e n e a r b y
M a c h a d o d o r p w o r k s .
FERROUS METALS – ASSMANG. Assmang Limited’s (Assmang) headline earnings increased, by 92 percent, to R443 million from R231 million. A weakening South African rand/US dollar exchange rate was the maincontributing factor to this increase. Good cost containment and improving efficiencies also contributed to thehigher earnings. The restructuring of the businesses into three distinct operating entities: manganese, iron oreand chrome continued during the year.
Revenue rose to R2,8 billion (R1,9 billion) and cost of sales were R1,9 billion (R1,4 billion).
MANGANESE. The Nchwaning and Gloria mines had a pleasing year with a contribution to Assmang’s overalloperating profit of R582 million, which also included proceeds from the manganese alloy smelter. Manganeseore sales, excluding sales to the smelter, were higher at 993 000 tons (979 000 tons). This was a satisfactoryachievement, considering distances between the shaft and underground workings are increasingly testing theNchwaning mine’s infrastructure. Manganese alloy sales were lower at 187 000 tons (193 000 tons) as a resultof market conditions.
An area of concern has been the deteriorating condition of rail and harbour infrastructure in South Africa for thehandling of manganese ores and alloys. Discussions will be held with the authorities on these issues duringthe current year.
IRON ORE. Sales rose to 4,8 million tons (4,3 million tons) as the benefits of the new jig plant and improvedoperational efficiencies came into effect.
CHROME. The Dwarsrivier chrome ore mine completed its first full year of production, delivering the plannedtonnages to the ferro-chrome smelter. These works were upgraded during the year leading to significantlyhigher alloy sales at 190 000 tons (125 000 tons). The ramp up of production to installed capacity levels ofsome 300 000 tons of ferro-chrome per annum is in progress.
PROJECTS. Assmang continued its significant capital expenditure programme spending R372 million (R626 million) during the year, the majority on its two major projects: the new manganese shaft at Nchwaningand the chrome alloy smelter. Assmang has spent R1,8 billion over the last five years on re-capitalising andexpanding its businesses.
Progress on the development of the R517 million Nchwaning decline shaft system has been satisfactory andthe project is ahead of schedule and within budget. The development of the shaft was completed on 27 June2002 and equipping has commenced. It is expected that the shaft will be commissioned before December2003. The operational life of Assmang’s manganese deposit will be extended by over 20 years andmechanised mining will result in a lower operating cost.
The chrome division’s new R375 million, 54MVA furnace and a 350 000 tons a year pelletising plant werecommissioned during the year under review. The furnace is currently operating near design levels. Ferro-chrome sales are expected to improve during the current financial year to a level of 230 000 tons and increaseto a maximum of nearly 300 000 tons per annum in future years. Another important focus for the current yearwill be to complete the design and feasibility study of a one million ton a year, run-of-mine, undergroundchrome mine at Dwarsrivier.
FUTURE GROWTH. Assmang is anticipating significant capital expenditure in future years on current andadditional growth projects. These include the completion of the Nchwaning shaft, the construction of theunderground mine at Dwarsrivier, and the conversion of one of the furnaces at the chrome division to 30MVA.Capital has also been allocated within the manganese division to enhance alloy production technology, therebyimproving operating margins.

T h e p r e c i o u s m e t a l s d i v i s i o n c o m p r i s e s :
• Avgo ld L im i t ed , 56 pe r cen t owned by Avmin , wh i ch ope ra tes t he ETC go ld m in i ng comp lex
nea r Ba rbe r t on i n Mpuma langa P rov i nce and t he new Ta rge t go l d m ine i n t he F ree S ta t e .
The l a t t e r commenced ope ra t i ng du r i ng May 2002 . Avgo ld i s a l so conduc t i ng a su r f ace
exp l o ra t i on d r i l l i ng p rog ramme on an ex t ens i ve go l d r esou rce i n t he no r t he rn F ree S ta t e .
• Two R i ve r s P l a t i num (P rop r i e t a r y ) L im i t ed , 55 pe r cen t owned , wh i ch was r ecen t l y f o rmed
f o l l o w i n g t h e a c q u i s i t i o n o f t h e p l a t i n u m g r o u p m e t a l ( P G M ) r i g h t s , f r o m A s s m a n g
L i m i t e d , o n t h e f a r m D w a r s R i v i e r .
PRECIOUS METALS – AVGOLD. Avgold Limited’s (Avgold) headline earnings for the year ended 30 June2002 were R36 million (R39 million) or 5 cents a share (7 cents a share). Following the commissioning of Targetmine in May 2000, total gold sales for the year increased to 4 179kg (2 842kg), the average yield was 8,56g/t (9,18g/t), and the cash cost was R64 277/kg (R58 698/kg), or US$198/oz (US$241/oz). The averagegold price received during the year was R86 794/kg (R76 586/kg), or US$306/oz (US$315/oz).
Revenue for the year was R364 million (R218 million), with costs and expenses rising to R346 million (R190 million). This resulted in an operating profit of R17 million (R28 million). Unrealised foreign exchangegains increased income before taxation to R41 million (R39 million). Earnings, after a taxation charge of R5 million (nil), were R36 million (R39 million).
TARGET. Target commenced mining operations in May 2002. Underground start-up issues, mainly the difficultyof separating development material from mined reef due to an incomplete rock pass system, resulted in less thanplanned reef being delivered to the new plant. This is currently being addressed. On commissioning, Target’s newmill experienced minor problems, which have now been resolved. Gold sales for May and June 2002 totalled 1 374kg and Target’s cash costs averaged US$156 an ounce of gold. Target’s capital expenditure for the yearamounted to R405 million (R586 million) and the project has been completed within its R2,1 billion budget.
ETC. ETC finalised a restructuring process during the year. The use of the Fairview mine infrastructure toaccess the Sheba orebody and the focus on mining higher grade reserves were accomplished towards theend of the year. After various infrastructure changes, the planned mining grades were achieved at Sheba andFairview, while the New Consort mine improvement will be evident in the new financial year.
It is expected that ETC will shortly obtain the approval of its environmental management programme, which willenable a permanent mining licence to be issued.
ETC’s three mines – Sheba, New Consort and Fairview – milled a total 315 523 tonnes (309 506 tonnes) for theyear at an average yield of 8,89g/t (9,18g/t). Gold sales were lower at 2 805kg (2 842kg) and the cash costincreased to R69 805/kg (R58 698/kg), but declined in dollar terms to US$215/oz (US$241/oz). A total of R17 million (R19 million) was spent on capital expenditure.
NORTHERN FREE STATE EXPLORATION. The surface exploration drilling programme in the northern FreeState on the adjoining Paradise property, north of Target, has been completed. The results to date have proventhat the Eldorado fan extends northwards and have delineated important geological structures. The oreresource model is currently being updated for Paradise and Target, and this information will be publishedduring October 2002.
HEDGING. At year end, Avgold’s hedge book represented 60 per cent of forecast gold production for the next48 months to June 2006 and had a negative mark-to-market value of R873 million, calculated on a gold priceof US$314,25/oz and an exchange rate of US$1,00:ZAR10,25. These hedges were established as arequirement of the five-year term loan arranged for the Target mine and are unmargined.
PRECIOUS METALS – TWO RIVERS PLATINUM (PROPRIETARY) LIMITED (Two Rivers). The feasibilitystudy is at an advanced stage on this platinum group metals (PGM) resource that was recently acquired byAvmin and its partner, Impala Platinum Holdings Limited. It is envisaged that a decision to proceed with a 200000 ounce a year PGM mine could be made during the current financial year. Discussions are advanced tosecure an empowerment partner for this project.
15R
ev
iew
of
op
era
tio
ns
R E V I E W O F O P E R A T I O N S l P r e c i o u s m e t a l s

Chambish i Meta ls p lc , 90 per cen t owned by Avmin and based in Zambia , i s in the p rocess o f
bu i ld ing up i t s p roduc t ion to become one o f the wor ld ’s la rges t p r imary coba l t p roducers ,
recover ing th is p roduc t and copper , f rom i t s own 20 mi l l i on ton dump resource . Th is w i l l be
ach ieved when the re fu rb ished smel te r and downs t ream processes ramp up to fu l l p roduc t ion
dur ing ca lendar year 2002 .
CHAMBISHI METALS PLC (Chambishi) experienced a difficult year with furnace availability at only 65 per cent.
The new smelter was first commissioned during the first quarter of the calendar year 2001. In November 2001,
following a second refractory lining failure, a decision was made to contract a Canadian company to redesign
the furnace cooling system and refractory lining. The redesigned furnace is currently being commissioned and
full output levels are expected during December 2002. The designed smelter capacity exceeds 4 500 tons of
cobalt a year and Avmin is confident that management at the plant has the ability to achieve this target and
operate the plant to its intended efficiency.
PRODUCTION. During the year under review, 3 700 tons of cobalt were produced from the toll refining roaster
operation and the smelter. Although the roaster operated well, the smelter did not. As a result of the poor
smelter output and lower average cobalt prices of US$7,56/lb (US$11,37/lb), Chambishi recorded a pre-
interest operating loss of US$12 million (US$11 million – loss) and a post interest loss of US$19 million
(US$12 million – loss) for the year under review.
On 29 January 2002, Avmin announced a partial write-down on its Chambishi investment. The impact of the
various technical problems, the effects of an unexpected decline of the cobalt price from US$11/lb to US$7/lb
and weaker economic fundamentals for base metal markets, resulted in a partial write-down of R1 619 million
in relation to these assets. The Avmin board and the Company’s independent auditors reviewed the
assumptions and the calculations and deemed the residual value of US$70 million reasonable and
appropriate.
Inclusive of the write-down, Chambishi’s overall earnings loss for the year was US$195 million.
CHALLENGES. The major strategic challenge for this financial year is to ensure the successful
recommissioning of the furnace and its optimal operation. Once achieved, the focus will be on cobalt recovery
optimisation, reducing downtime and decreasing operating costs.
The decision by other Zambian-based Copperbelt operators to re-evaluate their activities has necessitated a
revision to Chambishi’s toll refining strategy. The sourcing of toll feed material from the nearby Baluba mine,
currently in receivership, is being evaluated as are possibilities within the Democratic Republic of Congo. 17
Re
vie
w o
f o
pe
rati
on
s
R E V I E W O F O P E R A T I O N S – B a s e m e t a l s l C o b a l t / c o p p e r

Avmin ’s 75 per cen t he ld Nkomat i mine , Sou th A f r i ca ’s on ly p r imary n icke l p roducer , i s
loca ted near Machadodorp in the Mpumalanga Prov ince . The mine a lso p roduces copper ,
coba l t and p la t inum group meta ls as by -produc ts .
NKOMATI MINE received lower United States dollar prices for its products compared to last year, but the
weaker rand, especially during the first half of the financial year and a maintained overall yield enabled the mine
to perform in line with the previous year.
SALES TONNAGES. The mine milled 255 000 tons (280 000 tons) of ore, producing 46 000 tons (41 000 tons) of
concentrate at an average nickel grade of 9,33 per cent (10,47 per cent). Last year’s nickel head grades
averaged 1,9 per cent for the year and it was planned that the mine would continue operating in lower grade
areas for the majority of the 2002 financial year. However, an average grade of 2,2 per cent was achieved,
demonstrating the quality of the MSB orebody mined. The mine is currently operating to its maximum design
capacity at an average 22 000 tons of run-of-mine ore a month and the objective is to maintain the overall nickel
grade, while keeping costs at current levels. The mine has an operating life of some five years, but this may be
extended depending upon a decision whether to proceed with the significant expansion possibility.
The metallurgical recovery was 78 per cent and the mine sold a slightly lower 3 900 tons (4 000 tons) of nickel.
Nkomati also sold 3 000 tons (2 500 tons) of copper, 52 tons (54 tons) of cobalt and 35 000 ounces
(32 600 ounces) of platinum group metals (PGMs). PGMs, copper and cobalt contributed 42 per cent of the
mine’s total revenue. The nickel price averaged US$2,69/lb (US$3,28/lb) during the year.
FINANCIAL RESULTS. The mine’s revenue for the year was unchanged at R435 million and cost of sales rose
to R218 million (R187 million). This increase was mainly attributable to significant off mine costs, incurred in US
dollars, which were adversely affected by currency fluctuations. As a result, operating profit declined to
R209 million (R241 million) and after adding other income, mainly interest received, profit before tax was lower,
year-on-year, at R221 million (R249 million).
The cash cost of producing nickel, net of by-products, was US$0,32/lb (minus – US$0,82/lb). Last year’s cash
cost to produce nickel was negative as a result of strong PGM prices.
EXPANSION. The feasibility study to significantly expand the mine has been completed and presented to the
joint venture partners, Avmin and Anglo Operations Limited. The total cost of the proposed expansion is
expected to exceed R2 billion. The plan seeks to produce about 16 000 tons of refined nickel annually, some
9 000 tons a year of refined copper, 900 tons of cobalt oxides and nearly 100 000 ounces of PGMs for toll
refining. The run-of-mine feed will be from both open pit and underground operations.
Environmental and mining permits are currently being procured.
19R
evie
w o
f op
erat
ions
R E V I E W O F O P E R A T I O N S – B a s e m e t a l s l N i c k e l

Avmin’s method of reporting mineral resources and mineral reserves conforms to the South African Code forReporting Mineral Resources and Mineral Reserves (SAMREC Code) and the Australian Institute of Mining andMetallurgy Joint Ore Reserves Committee Code (JORC Code).
The convention adopted in this report is that mineral resources are reported exclusive of that portion of the totalmineral resource converted to a mineral reserve. Underground resources are in-situ tonnages at thepostulated mining width, after deductions for geological losses and pillars. Resources from dumps areestimated as in-situ tonnages.
Underground mineral reserves reflect milled tonnages while surface mineral reserves are in-situ tonnages. Bothare quoted at the grade reporting to the mill.
The evaluation method is generally ordinary kriging with mining block sizes ranging from 20*20 square metresto 100*100 square metres. The thickness varies from 1,0 to 2,5 metres. Inverse distance is used in a fewinstances and with similar block sizes. The Sichel-t estimator is often applied in gold exploration projects.
A gold price of R88 000/kg was utilised to arrive at the pay-limits for the gold operations. The mineral resourcesof these properties are reported at gold cut-off grades ranging from 2,0g/t to 3,0g/t.
For Nkomati a cut-off grade of 0,3 per cent nickel or higher was applied while for Chambishi 0,5 per cent cobaltwas used. The mineral resources and reserves for the remaining commodities are reported at current contractgrades or at guaranteed minimum grades, whichever relevant.
The competent person with overall responsibility for the compilation of the mineral reserves and resources isDr FA Camisani-Calzolari, PrScNat. He is a private consultant employed by Avmin.
The following competent persons were involved in the calculation of mineral resources and reserves. They areemployed by Avmin or its subsidiaries, unless otherwise stated:
Resources ReservesM Burger, PrSciNat FW Chadwick, PrMsRM Carey, PrSciNat CP de Villiers, PrEngLAD Carter*, MGASA VG Duke, PrEng F Chadwick, PrMs A Durrant, NHD.Met.MinA du P Ferreira, PrSciNat F Hardy, NHD.Met.MinR Hornsey, PrSciNat D Heyl, PrEngRP le Roux, PrSciNat N Horswell, PrEngDr WD Northrop, PrSciNat N Muller, PrEngA Pretorius, PrSciNat A Mostert, PrMsCL Robus, PrSciNat N Schwab, PrEngCN Rippon, PrSciNatRF Tucker, PrSciNatP van der Merwe, PrSciNatR van der Westhuizen, PrSciNatJ Vieler*, PrSciNat JAS Woolfe, PrSciNat
* Private consultant
Most of the competent persons are members of either SACNASP, ECSA or PLATO and have in excess of fiveyears’ experience relevant to the style of mineralisation and type of deposits under consideration.
Snowden Mining Industry Consultants and Steffen Robbertson and Kirsten (SRK) have audited the resourcesand reserves of some operations.
Maps, plans and reports supporting resources and reserves are available for inspection at Avmin’s registeredoffice and at the relevant mines.
20M
ine
ral
res
ou
rce
s a
nd
re
se
rve
s
M I N E R A L R E S O U R C E S A N D R E S E R V E S

DEFINITIONSThe definitions of resources and reserves, quoted from the SAMREC Code, are as follows:
A ‘mineral resource’ is a concentration [or occurrence] of material of economic interest in or on the earth’s crustin such form, quality or quantity that there are reasonable prospects for eventual economic extraction. The location,quantity, grade, continuity and other geological characteristics of a mineral resource are known, estimated fromspecific geological evidence and knowledge, or interpreted from a well constrained and portrayed geological model.Mineral resources are subdivided, in order of increasing confidence in respect of geoscientific evidence, into inferred,indicated and measured categories.
An ‘inferred mineral resource’ is that part of a mineral resource for which tonnage, grade and mineral contentcan be estimated with a low level of confidence. It is inferred from geological evidence and assumed but not verifiedgeological and/or grade continuity. It is based on information gathered through appropriate techniques fromlocations such as outcrops, trenches, pits, workings and drill holes that may be limited or of uncertain quality andreliability.
An ‘indicated mineral resource’ is that part of a mineral resource for which tonnage, densities, shape, physicalcharacteristics, grade and mineral content can be estimated with a reasonable level of confidence. It is based onexploration, sampling and testing information gathered through appropriate techniques from locations such asoutcrops, trenches, pits, workings and drill holes. The locations are too widely or inappropriately spaced to confirmgeological and/or grade continuity but are spaced closely enough for continuity to be assumed.
A ‘measured mineral resource’ is that part of a mineral resource for which tonnage, densities, shape, physicalcharacteristics, grade and mineral content can be estimated with a high level of confidence. It is based on detailedand reliable exploration, sampling and testing information gathered through appropriate techniques from locationssuch as outcrops, trenches, pits, workings and drill holes. The locations are spaced closely enough to confirmgeological and grade continuity.
A ‘mineral reserve’ is the economically mineable material derived from a measured and/or indicated mineralresource. It is inclusive of diluting materials and allows for losses that may occur when the material is mined.Appropriate assessments, which may include feasibility studies, have been carried out, including consideration of,and modification by, realistically assumed mining, metallurgical, economic, marketing, legal, environmental, socialand governmental factors. These assessments demonstrate at the time of reporting that extraction is reasonablyjustified. Mineral reserves are sub-divided in order of increasing confidence into probable mineral reserves andproved mineral reserves.
A ‘probable mineral reserve’ is the economically mineable material derived from a measured and/or indicatedmineral resource. It is estimated with a lower level of confidence than a proved mineral resource. It is inclusive ofdiluting materials and allows for losses that may occur when the material is mined. Appropriate assessments, whichmay include feasibility studies, have been carried out, including consideration of, and modification by, realisticallyassumed mining, metallurgical, economic, marketing, legal, environmental, social and governmental factors. Theseassessments demonstrate at the time of reporting that extraction is reasonably justified.
A ‘proved mineral reserve’ is the economically mineable material derived from a measured mineral resource. It isestimated with a high level of confidence. It is inclusive of diluting materials and allows for losses that may occurwhen the material is mined. Appropriate assessments, which may include feasibility studies, have been carried out,including consideration of, and modification by, realistically assumed mining, metallurgical, economic, marketing,legal, environmental, social and governmental factors. These assessments demonstrate at the time of reporting thatextraction is reasonably justified.
Dr FA Camisani-CalzolariAugust 2002
21M
ine
ral
res
ou
rce
s a
nd
re
se
rve
s
M I N E R A L R E S O U R C E S A N D R E S E R V E S ( c o n t i n u e d )

Summary of mineral resources and mineral reserves
AVGOLD
GOLD Tons g/ tAu Moz
Proved mineral reserves 6 507 000 10,40 2,18
Probable mineral reserves 10 276 000 3,67 1,21
Measured mineral resources 8 010 000 6,16 1,59
Indicated mineral resources *88 341 000 7,37 20,94
Inferred mineral resources *263 794 000 6,74 57,20
Total mineral reserves 16 783 000 6,28 3,39
Total mineral resources 360 145 000 6,88 79,72
*The mineral resources for the Paradise property, immediately north of the Target mine, are being revised following completion of the surface
drilling programme. The results will be published during October 2002.
ASSMANG
Beeshoek
IRON Tons %Fe
Proved mineral reserves 449 800 000 64,63
Measured mineral resources 262 100 000 65,03
Indicated mineral resources 75 400 000 64,87
Inferred mineral resources 166 100 000 64,59
Total mineral reserves 449 800 000 64,63
Total mineral resources 503 600 000 64,86
Nchwaning
MANGANESE Tons %Mn %Fe
Proved mineral reserves 6 900 000 46,33 9,68
Measured mineral resources 80 600 000 44,59 9,18
Indicated mineral resources 14 700 000 47,72 12,66
Glor ia
MANGANESE
Proved mineral reserves 5 100 000 39,09 4,65
Measured mineral resources 1 100 000 37,32 4,79
Indicated mineral resources 32 500 000 38,62 7,03
Inferred mineral resources 87 000 000 38,62 7,03
Nchwaning and Gloria
Total mineral reserves 12 000 000 43,25 7,54
Total mineral resources 215 900 000 41,46 8,20
Dwarsrivier
CHROMITE Tons %Cr2O3 %FeO
Proved mineral reserves 11 346 000 39,70 23,61
Probable mineral reserves 14 600 000 40,59 23,62
Measured mineral resources 4 181 000 39,66 23,68
Indicated mineral resources 8 298 000 40,60 23,63
Inferred mineral resources 93 660 000 40,18 23,60
Total mineral reserves 25 946 000 40,20 23,62
Total mineral resources 106 139 000 40,19 23,61
22M
ine
ral
res
ou
rse
s a
nd
re
se
rve
s
M I N E R A L R E S O U R C E S A N D R E S E R V E S ( c o n t i n u e d )

CHAMBISHI METALS
COBALT Tons %Co %Cu
Proved mineral reserves 1 452 000 1,40 1,10
Probable mineral reserves 18 347 000 0,67 1,09
Indicated mineral resources 1 000 000 0,86 1,11
Total mineral reserves 19 799 000 0,73 1,09
Total mineral resources 1 000 000 0,86 1,11
AVMIN
Nkomati
NICKEL Tons %Ni %Cu %Co g/ tPt g/ tPd
Proved mineral reserves 1 121 000 2,20 1,19 0,10 1,65 4,11
Indicated mineral resources 121 200 000 0,48 0,19 0,03 0,27 0,72
Inferred mineral resources 467 000 1,52 0,57 0,07 0,23 0,58
Total mineral reserves 1 121 000 2,20 1,19 0,10 1,65 4,11
Total mineral resources 121 667 000 0,48 0,19 0,03 0,27 0,72
Nkomati
CHROMITE Tons %Cr2O3 %Ni
Indicated mineral resources 50 000 000 25,48 0,19
TWO RIVERS PLATINUM
A feasibility study is presently being undertaken on this project, an integral part of which is a mineral
resources and mineral reserves statement, which is being finalised.
Note: Resources and reserves are quoted in metric tons.Au goldCo cobaltCu copperCr203 chrome oxideFe ironFe0 ferrous oxideMn manganeseNi nickelPt platinumPd palladium
23M
ine
ral
res
ou
rce
s a
nd
re
se
rve
s
M I N E R A L R E S O U R C E S A N D R E S E R V E S ( c o n t i n u e d )

THE WORKING ENVIRONMENT Avmin seeks to develop and retain its staff through the provision of an equitable, safe and healthy workenvironment.
EMPLOYMENT EQUITY Avmin has a transformation committee chaired by the Group’s chairman to define the Company’s targets andstrategy for meaningful transformation. The committee met regularly throughout 2002 to set targets for Avmin.National and industry demographics and Group profiles were reviewed. Group succession plans werescrutinised to identify positions pledged for employment equity placements and Group targets were identifiedper level including the composition of the board of directors.
Operations have set out their own strategies for the achievements of the targets and report half-yearly onprogress against plan.
In compliance with section 22 of the Employment Equity Act (EE), the table below applies to the 4 680 SouthAfrican Group employees and summarises the progress reports submitted to the Department of Labour,detailing the occupational categories as at 30 June 2002 compared to the 2004 target.
SAFETY, HEALTH AND THE ENVIRONMENT (SHE) REVIEWThe Avmin Group sustainability strategy provides a general framework. In addition, each operation is alloweda large measure of flexibility, enabling it to refine its own SHE and community strategies to meet local needs,or to take into consideration special requirements imposed by particular processes or conditions.
Avmin has this year produced a separate "Sustainable Development Report – 2002", that addresses:
– Safety– Health– HIV/AIDS– Environment– Community development
The abovenamed document accompanies this report for the information of shareholders. The Group’sactivities for safety, occupational health and the environment are therefore only summarised in this annualreport.
As SHE activities are key considerations throughout Avmin, the achievement of high and improving standardsin these areas are an integral part of all planning, construction and operational areas.
Principles guiding this policy include traning for all employees with regard to the identification and minimisationof job related SHE risks. As risks are identified, they are dealt with. SHE audits are undertaken regularly,systematically and with the appropriate representative participation.
24C
orp
ora
te s
us
tain
ab
le d
ev
elo
pm
en
t
C O R P O R A T E S U S T A I N A B L E D E V E L O P M E N T
30 June 2002 Target 2004
Occupational categories Male Designated % Male Designated White groups EE White groups
Legislators, senior officials and managers 72 10 12 80% 20%
Professionals 175 50 22
Technicians and associate professionals 308 153 33 60% 40%
Clerks 32 210 87
Service and sales workers 3 29 91
Skilled and agricultural and fishery workers – 2 100
Craft and related trade workers 284 231 45 20% 80%
Plant and machine operators and assemblers 164 1 605 91
Elementary occupations 14 821 98

Avmin’s vice president and Avmin’s general manager in charge of the SHE portfolios are jointly responsible forthe development and implementation of a workable, comprehensive sustainability strategy, and for ensuringthat legal compliance is achieved throughout the Group’s operations. Avmin’s SHE committee reviews theGroup’s progress on a quarterly basis, comparing its performance in the areas of safety, health and theenvironment with international best practice.
Safety. The Company deeply regrets that the Group had one fatality during the year at its ETC mine causedby a fall of ground.
Avmin’s safety statistics show a dramatic improvement over the past year, largely as a result of increasedparticipation of employees, employee representatives and contractors. The Lost Day Injury Frequency Rate(LDIFR) and Severity Ratio (SR) for the Group reduced by 24,2 per cent to 8,4 and 16,6 per cent to 9,5,respectively, compared to the previous year. The total injury frequency rate (TIFR) reduced by 38,5 per cent.Further details can be ascertained from the accompanying Sustainable Development Report.
Health. Audiometric screen tests have been conducted throughout the Group to assess the status of hearingamong employees, resulting in 76 employees being referred for additional tests. These additional testsindicated that the hearing of 21 of these employees had been impaired and they qualified for work-related lossof hearing compensation.
Avgold referred 21 employee pulmonary tuberculosis cases to the Medical Bureau for certification andcompensation. Thirteen cases of silicosis were also referred to the Bureau. Five cases of pneumoconiosiswere diagnosed at Target mine and at ETC another was referred for compensation.
HIV/AIDS. Recognising the inherent dangers that the HIV/AIDS epidemic has, and will have, on theproductivity and prosperity of the Group, Avmin has devised a strategy to control the impact of the disease onits operations. Avmin is very aware of the psychosocial needs of its workforce and the humanitarian aspectsof providing help and support to those employees and their families stricken with HIV/AIDS. All researchfindings indicate that early treatment improves the quality and length of life.
Avmin’s board of directors fully supports this strategy, and is committed to introducing measures that promote
both business sustainability and humane working conditions in the face of the HIV/AIDS epidemic. The primary
aim of the strategy is to prevent new infections and provide a high level of care for those already infected.
The graphic above shows the key elements to Avmin’s HIV prevention strategy. Planned outcomes for each ofthese elements have been prescribed for all operations.
Environment. Mining by its very nature impacts on the environment. The policy that Avmin has adopted is tomanage the impact of its activities on the environment as it works to meet and, in some cases exceed, legalrequirements.
To enhance the Group’s environmental performance, it seeks the active participation and involvement ofstakeholders and undertakes a process of regular internal and external audits at all operations. In addition, it
25C
orp
ora
te s
us
tain
ab
le d
ev
elo
pm
en
t
C O R P O R A T E S U S T A I N A B L E D E V E L O P M E N T ( c o n t i n u e d )
Testing and tracking
Strategy and management
Employeesliving
with HIVPrevention Benefits
Continued employment

is Avmin’s intention to implement an environmental management system that fulfils the requirements of theInternational Standard ISO 14001 at all of its operations. Several of the operations have already achieved thisstandard.
The Group spent in excess of R16 million on rehabilitation and environmental issues during the financial year
funded from capital, operating expenditure and trust funds. All Avmin operations were affected, with major
expenditure being incurred at Assmang: manganese alloys (Cato Ridge works), Assmang: iron ore (Beeshoek
mine) and Avgold. Details of awards and progress are to be found in The Sustainable Development Report.
INVESTMENTS IN THE COMMUNITY
Avmin initiates, supports and actively participates in programmes that seek to improve the quality of life of
communities in South Africa. To this end partnerships are sought with government and non-governmental
organisations at national and provincial levels. Avmin endeavours to uphold people’s rights to initiate and
participate in their own development.
The key strategies are to concentrate available resources on a few initiatives within identified focus areas, to
achieve maximum positive and sustainable impact. Projects are managed for accountability.
Avmin employees are actively encouraged to participate in the Group’s community development programmes.
This encouragement can also extend beyond the Group’s programmes, into projects in which employees have
become involved in their private lives. The key focus areas are:
• Education – about 45 per cent of 2002’s budget was devoted to education projects. Avmin is targeting
educator training and support at primary and secondary levels in mathematics, science and technology.
• Work creation – 35 per cent was spent on projects that offer opportunities for the poor and unemployed to
earn a living. The targeted groups are women and the out-of-school youth.
Avmin concentrates its resources where a target group needs and wants the intervention, and is an active
participant at all stages to meet a specific measurable need of a particular community. Progress is measured
during the project on the target group’s lives and beyond. Sound financial reporting and governance are pre-
requisites for any project that Avmin supports.
Avmin annually commits a portion of its before tax earnings to its community investment programme. These
funds are divided between all operations, focusing on their immediate communities, and the Group’s national
programmes. Some examples of these key areas include:
Maths Centre for Professional Teachers (the Centre). The Centre has for many years trained and
supported teachers in effective methods for teaching mathematics at primary schools.
In recent years, driven by demand, the Centre has developed materials and training programmes for teachersat secondary education level and is servicing most parts of the country through their provincialtraining/resource centres.
Avmin continues to support the Centre’s development of teaching and learning aids used in the Centre’sprojects nationwide.
Sparrow Ministries – Rainbow Vil lage. The village is an initiative of Sparrow Ministries. When complete itwill consist of about 50 accommodation clusters housing more than 200 individuals that find themselveshomeless largely as a result of their HIV status.
In addition to providing accommodation, the village will also have a number of clusters dedicated to work andincome generation for the residents and the village’s own sustainability.
Avmin has supported this project for the past few years, providing funds for some of the buildings as well asfurnishings and equipment.
26C
orp
ora
te s
us
tain
ab
le d
ev
elo
pm
en
t
C O R P O R A T E S U S T A I N A B L E D E V E L O P M E N T ( c o n t i n u e d )

27C
orp
ora
te s
us
tain
ab
le d
ev
elo
pm
en
t
C O R P O R A T E S U S T A I N A B L E D E V E L O P M E N T ( c o n t i n u e d )
Pfuxanani Youth Centre. The centre was built with funding from the Department of Public Works. Pfuxananihas grown from an organisation that focused on taking young people off the streets through temporarydiversions, to one that provides skills training and more long-term solutions to problems of unemployment andilliteracy. In recent years, Avmin has supported the training of 50 home based care-givers, as well as thebeginnings of a food gardening project
Siyazisiza Trust – Maputaland integrated rural development programme. Maputaland is in northernKwa-Zulu Natal, an area with little economic activity, and is thus severely under-resourced. Siyazisiza Trust hassuccessfully facilitated the training of people and establishing a number of income generation projects.
By the end of June 2001, when Avmin’s grant period ended, more than 700 individuals had participated in varioussustainable projects with the participants and their families continuing to support themselves through this initiative.
Rekgutl i le Temong Agricultural Association (the Association). The Association originally comprised 65families living and working on farms in the Delmas area, Mpumalanga Province. With funds granted by theDepartment of Land Affairs, these families purchased agricultural land on which they grow vegetables (seebelow) and undertake dairy farming.
Avmin’s support has helped:• train 20 members in dairy and vegetable production;• purchase and repair equipment, purchase seeds and implements for vegetable production; and• purchase a computer for record keeping and general administration purposes.

Wolanani . This programme consists of counselling/support groups, lobbying for fair treatment, and workcreation for those women living with HIV/AIDS. Avmin has paid for the training of 25 women in the productionof crafts which they sell for a living. A further 15 women have been trained as home-based care givers.
Further corporate community interventions are reflected in the Sustainable Development Report.
INVESTMENT IN BUSINESS COMMUNITY INITIATIVESA growing economy will provide sustained improvements to the lives of the majority of South Africans. To thisend the Business Trust (the Trust) is an initiative of the South African business community in working inpartnership with government to undertake targeted job creation and capacity building programmes. The Trust’sobjectives are to bring the resources and skills of business to bear on the development challenges, as directedby government priorities, and in the process enhance trust and co-operative relations between business andgovernment.
The Trust works closely on various programmes with the Departments of Education, Environmental Affairs andTourism, Labour, and Safety and Security.
Avmin has participated in the funding of the Trust and its leadership.
28C
orp
ora
te s
us
tain
ab
le d
ev
elo
pm
en
t
C O R P O R A T E S U S T A I N A B L E D E V E L O P M E N T ( c o n t i n u e d )

29C
orp
ora
te g
ov
ern
an
ce
C O R P O R A T E G O V E R N A N C E
The Anglovaal Mining Group has strong commitments to a wide range of corporate governance practices. The
directors of Avmin are ultimately accountable to shareholders and have a responsibility, both collectively and
individually, to ensure that a high standard of corporate governance is maintained.
KING CODE OF CORPORATE PRACTICE AND CONDUCT. The board of Avmin is committed to maintaining
the standards of integrity, accountability and openness advocated in the King Report on Corporate
Governance (King I Report) and is working towards the attainment of the succeeding King II Report
requirements. The latter’s requirements should be met by 31 March 2003.
CODE OF ETHICS. The Company is committed to the highest standards of integrity, behaviour and ethics in
dealing with all its stakeholders. All directors and employees are required to maintain the highest ethical
standards to ensure that the Company’s business practices are conducted in a reasonable manner and to act
in good faith and in the interests of the Company. The Company is undertaking the codifying of its standards
in a code of ethics as part of the process of complying with the requirements of the King II Report.
BOARD OF DIRECTORS. The board consists of 13 directors; comprising the chairman, an executive director,
four independent non-executive directors and seven non-executive directors. The directors’ diverse skills and
expertise are reflected on pages 6 and 7.
As of 1 July 2002, Rick Menell was appointed chairman of Avmin, following the resignation of Ken Maxwell as
chairman. David Murray simultaneously assumed the position of chief executive officer.
The board met on seven occasions during the 2002 financial year. The board has reserved certain powers to itself
with the chairman ensuring that policies are adhered to and that corporate governance is consistently applied and
promoted. The chairman is responsible for the attainment of the strategic objectives set by the board.
The Company’s articles of association stipulate that the maximum term of office of a director is three years.
One-third of all directors retire by rotation annually and, if eligible for re-election, their names are submitted for
election at the annual general meeting. All directors who were appointed subsequent to the last annual general
meeting are required to seek election at the following annual general meeting.
None of the members of the board have service contracts with the Company other than Ken Maxwell and Brian
Menell whose consulting contracts extend until 31 December 2002. All members have access to the advice of
the company secretary and are entitled to seek independent professional advice about the affairs of the
Company and at its expense.
The directors’ fees and attendance fees payable to the chairman and directors were reviewed during the
year and increases payable from 1 July 2002 are recommended for adoption at the annual general
meeting. It is felt that fees need to be increased so as to attract, retain and motivate members of the board.
The fees were last increased three years ago. Full details are contained in the notice of annual general
meeting on page 86.
BOARD COMMITTEES. The directors of the Company appoint both executive and non-executive members to
the various committees. The non-executive directors play an active role, particularly in the capacity of chairmen
of the committees concerned. The members of these committees are reflected in the table "Meetings
attendance during the year ended 30 June 2002” on page 32. Each committee meets at defined times each
year and provides the directorate with an effective communication forum. The delegation of authority to
committees does not mitigate the board’s responsibility for discharge of its and directors’ duties to the
Company’s stakeholders.
The information provided to the board is derived from external sources and internally from minutes, plans
and reports of the activities of the respective committees; no restrictions are placed upon accessing
Avmin sources.
Audit committee. The members of this committee comprise three independent non-executive directors (one
of whom is the chairman), two non-executives and the chairman of the Company. The chief executive officer
and chief financial officer attend meetings by invitation. Three meetings were held during financial year 2002.
Attendance fees, per meeting: Chairman R9 600, committee members R6 000.
The main responsibilities of this committee include the maintenance of high standards of records and systems
of internal control, the safeguarding (in conjunction with the risk committee) of the Company’s assets and
shareholders’ investments, assuring the board as to the veracity of the Company’s financial reports to
shareholders, assisting the board to monitor standards of corporate governance, and advising the board on
the “going concern” status of the Company. The committee also conducts reviews of major business risks and
audits, that are undertaken by both internal and external auditors, and it examines their respective plans and
reports to ensure effectiveness. The external and internal auditors have unrestricted access to the audit
committee and its chairman.
Environmental committee. Safety and health matters are considered at every board meeting of directors. Two
committee meetings were held during the period under review. Three independent non-executive directors, one of
whom is the chairman, Avmin’s chairman and three non-executive directors with one being an alternate director,
comprise the committee. The chief executive officer and vice president: Safety, health and environment attend
these meetings by invitation. Attendance fees, per meeting: Chairman R6 600, committee members R4 000.
The board and committee’s primary focus is:
Safety. The evaluation of Group statistics and performance, incorporating the comparison of Group results
against benchmarks provided by other international mining companies and operations, as well as the
achievement of statutory and regulatory compliance requirements. Group safety objectives take cognisance
of these benchmarks. Accidents are reviewed with the objective of preventing recurrence.
HIV/AIDS. A comprehensive strategy has been devised to hinder the spread of this disease at Avmin’s
operations, details of which are reflected on page 25. Monitoring and evaluation against this strategy has
been receiving urgent attention.
Occupational health. Information from operations is continually reviewed to meet set objectives
incorporating statutory and regulatory compliance needs, with a particular focus on those areas of specific
interest to Avmin. Areas of concern include manganese neurotoxicity (manganism), occupational lung
diseases and noise induced hearing loss.
30C
orp
ora
te g
ov
ern
an
ce
C O R P O R A T E G O V E R N A N C E ( c o n t i n u e d )

31C
orp
ora
te g
ov
ern
an
ce
C O R P O R A T E G O V E R N A N C E ( c o n t i n u e d )
Environment. At the meetings, statutory and regulatory compliance is evaluated. The main objectives are
the provision of funding to approved nature conservation trust funds to finance the rehabilitation of areas
disturbed by mining and related activities and to provide funds for rehabilitation of the sites at closure and
post closure maintenance to at least legislated requirements.
The Safety, Health and Environment Review is reflected on pages 24 to 26.
Nominations committee. On 11 September 2002 the board of directors authorised the establishment of a
nominations committee. The committee comprises four members, whose names are reflected on page 7, two
of whom are independent non-executive directors, one non-executive director and Avmin’s chairman. The
chairman will be appointed from among the non-executive director committee members.
The committee’s function will be to ensure that the board will have an appropriate skills and experience mix
amongst directors having regard to Avmin’s activities in southern Africa. The committee will investigate the
background of potential directors prior to appointment to a seat on the board to ensure that such persons have
no legal impediment to assuming such a role and that they are of the calibre, credibility and with the necessary
skills and experience to bring independent judgement to bear on matters before the board. The process for
the appointment of new directors, yet to be decided, will be both formal and transparent in nature.
Remuneration committee. The committee was convened on four occasions during the year ended 30 June
2002. Membership comprises two independent non-executive directors (one being the chairman), two non-
executive directors and the chairman of the Company. Directors withdraw from meetings when matters
personally affecting them are discussed. The chief executive officer attends meetings by invitation. The vice
president: Human resources attends all meetings and has direct access to all members of this committee.
Attendance fees, per meeting: Chairman R6 600, committee members R4 000.
The directors ensure appropriate levels of remuneration to senior management of the Company through the
remuneration committee. This committee determines broad policy for individual remuneration and benefits to
maintain a compensation policy that is both competitive and equitable. The committee also undertakes the
review of non-executive directors’ performance against appropriate guidelines.
Risk committee. The board risk committee was established during the first half of the financial year and one
meeting was held during the year. Two independent non-executive directors, one of whom is the chairman, two
non-executive and two executive directors and the chief financial officer comprise the comittee. Attendance
fees per meeting are: Chairman R8 000, committee members R4 800.
This committee assists the board of directors in the discharge of its duties in relation to risk matters, providing
assurance that:
• The total process of risk management is effectively designed, implemented and monitored;
• The broader strategic and significant business risks facing the Group are identified together with
attendant controls/management assurance;
• The process is integrated into the day-to-day activities of the Group; and
• Ongoing consultation occurs between the board risk and the audit committees.
The committee is assisted by the risk management committee whose role is described on page 33.
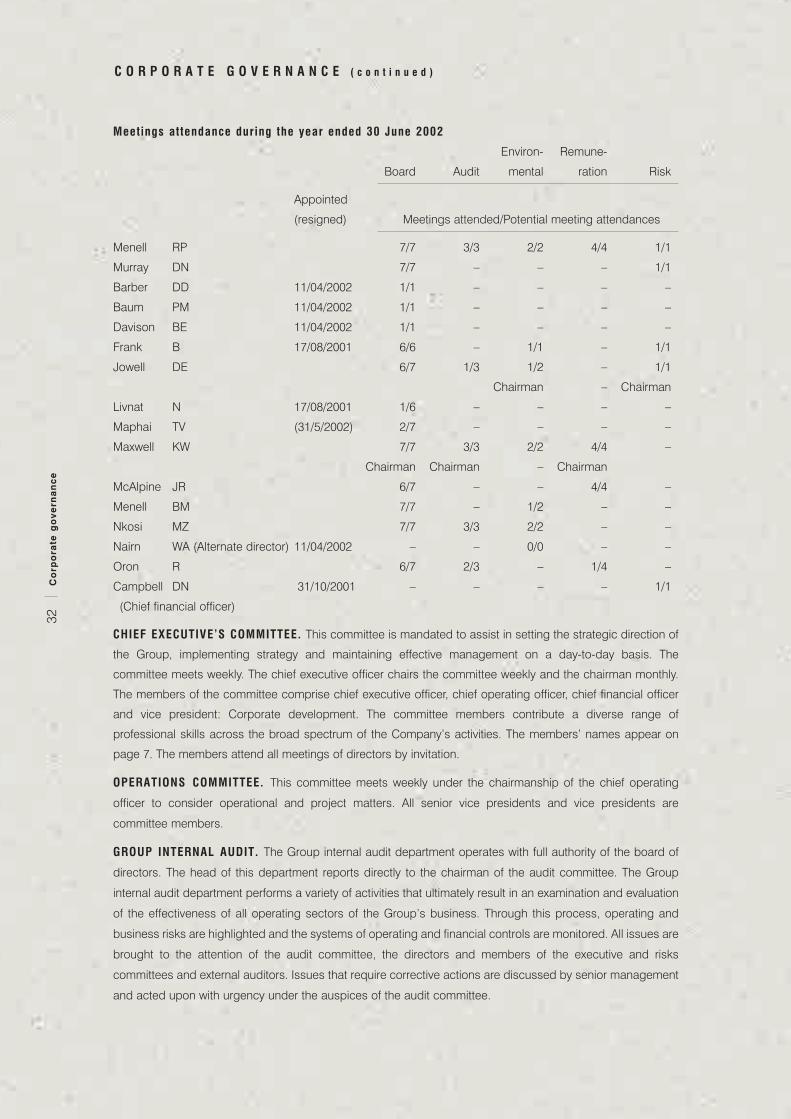
Meetings attendance during the year ended 30 June 2002
Environ- Remune-
Board Audit mental ration Risk
Appointed
(resigned) Meetings attended/Potential meeting attendances
Menell RP 7/7 3/3 2/2 4/4 1/1
Murray DN 7/7 – – – 1/1
Barber DD 11/04/2002 1/1 – – – –
Baum PM 11/04/2002 1/1 – – – –
Davison BE 11/04/2002 1/1 – – – –
Frank B 17/08/2001 6/6 – 1/1 – 1/1
Jowell DE 6/7 1/3 1/2 – 1/1
Chairman – Chairman
Livnat N 17/08/2001 1/6 – – – –
Maphai TV (31/5/2002) 2/7 – – – –
Maxwell KW 7/7 3/3 2/2 4/4 –
Chairman Chairman – Chairman
McAlpine JR 6/7 – – 4/4 –
Menell BM 7/7 – 1/2 – –
Nkosi MZ 7/7 3/3 2/2 – –
Nairn WA (Alternate director) 11/04/2002 – – 0/0 – –
Oron R 6/7 2/3 – 1/4 –
Campbell DN 31/10/2001 – – – – 1/1
(Chief financial officer)
CHIEF EXECUTIVE’S COMMITTEE. This committee is mandated to assist in setting the strategic direction of
the Group, implementing strategy and maintaining effective management on a day-to-day basis. The
committee meets weekly. The chief executive officer chairs the committee weekly and the chairman monthly.
The members of the committee comprise chief executive officer, chief operating officer, chief financial officer
and vice president: Corporate development. The committee members contribute a diverse range of
professional skills across the broad spectrum of the Company’s activities. The members’ names appear on
page 7. The members attend all meetings of directors by invitation.
OPERATIONS COMMITTEE. This committee meets weekly under the chairmanship of the chief operating
officer to consider operational and project matters. All senior vice presidents and vice presidents are
committee members.
GROUP INTERNAL AUDIT. The Group internal audit department operates with full authority of the board of
directors. The head of this department reports directly to the chairman of the audit committee. The Group
internal audit department performs a variety of activities that ultimately result in an examination and evaluation
of the effectiveness of all operating sectors of the Group’s business. Through this process, operating and
business risks are highlighted and the systems of operating and financial controls are monitored. All issues are
brought to the attention of the audit committee, the directors and members of the executive and risks
committees and external auditors. Issues that require corrective actions are discussed by senior management
and acted upon with urgency under the auspices of the audit committee.
32C
orp
ora
te g
ov
ern
an
ce
C O R P O R A T E G O V E R N A N C E ( c o n t i n u e d )
33C
orp
ora
te g
ov
ern
an
ce
C O R P O R A T E G O V E R N A N C E ( c o n t i n u e d )
GROUP SAFETY, HEALTH AND ENVIRONMENTAL COMMITTEE. This is a committee comprising senior
managers, under the chairmanship of the chief operating officer, that assists the board committee. The
committee meets quarterly.
RISK MANAGEMENT COMMITTEE. This management committee reports to the board risk committee and is
chaired by the Group risk manager. Its members comprise the chief operating officer and vice presidents. The
committee meets regularly during the year to identify, manage and monitor the Group’s risk initiatives. KPMG
Management Assurance Services attend these meetings and provide assistance in ensuring that the risk
initiatives are appropriately focused. Three management committee meetings have been held since July 2001.
The committee has engaged the services of independent risk engineering consultants who continue to grade
each operation against international risk standards for fire, security, engineering, commercial, crime,
contingency planning and mining to monitor whether these practices meet the set criteria. The committee is
also responsible for ensuring that appropriate financial and insurance mechanisms comprehensively protect
the Group against catastrophe risk.
TREASURY AND HEDGE COMMITTEE. The committee, under the chairmanship of the chief financial officer,
meets fortnightly, and more often when necessary, with Standard Risk and Treasury Management Services
(Proprietary) Limited (SRTMS) to discuss market conditions, treasury operations, to review market conditions
and existing and future hedging strategies. The primary focus of the committee is the reduction of risk in
commodities and currencies. SRTMS implements decisions taken. SRTMS does not perform an executive or
decision-making role. Advice is also sought from other outside parties on a continuous basis. During the year
ended 30 June 2002 the committee met 25 times.
The committee operates within clearly defined parameters set by the board.
CLOSED PERIODS. The Company operates a closed period prior to the publication of its interim and final
results. During this period directors, officers and designated persons who may have access to price sensitive
information are precluded from dealing in the shares, securities or financial instruments of the Company. The
closed period extends from the cost close of the month at the end of a reporting period or the financial year
until the day of publication of the results in the press. Where appropriate, dealing is also restricted during
sensitive periods where major transactions are being negotiated and a public announcement is imminent.
34A
vm
in A
nn
ua
l R
ep
ort
20
02
3 6 Auditors’ report
3 6 Certificate by secretary
3 7 Directors’ report
4 5 Accounting policies
5 2 Balance sheets
5 3 Income statements
5 4 Statements of changes in
equity
5 5 Cash flow statements
5 6 Notes to the financial
statements
7 8 Report on subsidiary
companies
7 9 Principal subsidiary
The annual f inancial statement and Group annual f inancial statements which appear on pages 36 to
80 were approved by the directors on 27 September 2002 and are signed on their behalf by:
RP Menel l
Chairman
DN Murray
Chief executive officer
A N N U A L F I N A N C I A L S T A T E M E N T S

Auditors’ report
To the members of Anglovaal Mining Limited
We have audited the annual financial statements and Group annual financial statements set out on pages 37
to 80 for the year ended 30 June 2002. These financial statements are the responsibility of the Company’s
directors. Our responsibility is to express an opinion on these financial statements based on our audit.
Scope
We conducted our audit in accordance with statements of South African Auditing Standards. Those standards
require that we plan and perform the audit to obtain reasonable assurance that the financial statements are
free from material misstatement. An audit includes:
• Examining, on a test basis, evidence supporting the amounts and disclosures in the financial statements;
• Assessing the accounting principles used and significant estimates made by management; and
• Evaluating the overall financial statement presentation.
We believe that our audit provides a reasonable basis for our opinion.
Audit opinion
In our opinion, the financial statements fairly present, in all material respects, the financial position of the
Company and the Group at 30 June 2002 and the results of their operations and cash flows for the year then
ended in accordance with South African Statements of Generally Accepted Accounting Practice, International
Accounting Standards and in the manner required by the Companies Act in South Africa.
Ernst & Young
Chartered Accountants (SA)
Registered Accountants and Auditors
Johannesburg, 27 September 2002
Certificate by secretary
I certify that the requirements as stated in section 268G(d) of the Companies Act have been met and that all
returns, as are required of a public company in terms of the aforementioned Act, have been lodged with the
Registrar of Companies and that such returns are true, correct and up to date.
RH Phi l l ips
Group company secretary
Johannesburg, 27 September 2002
36A
ud
ito
rs’
rep
ort
an
d C
ert
ific
ate
by
se
cre
tary

Directors’ report
Business of the Company
The business of the Company* and its subsidiaries and associates is to explore, develop, operate and hold
interests in the mining and minerals industry. The operational focus is in the following areas: Precious, base
and ferrous metals.
The Company maintains a core central unit that provides a range of services and skills within the areas of
finance, technical and legal services, and human resources. Strategic initiatives and commercial transactions
are implemented and maintained by the central unit and the Company also participates directly in, and
arranges finance for, mineral prospecting operations and mining development.
The Company’s shares are listed on the JSE Securities Exchange, South Africa (JSE) and the London Stock
Exchange.
* Shareholders’ approval will be sought at the annual general meeting to change the Company’s main business and main
object clauses contained in the current memorandum of association to align them to the business of the Company as
expressed in this paragraph; refer Notice page 86.
Review of operations
The activities and results of operations of the Group for the year ended 30 June 2002 are incorporated in the
review by the chairman and chief executive officer and review of operations; pages 9 to 19.
The most significant event which occurred during the year under review was the partial write down of
approximately R1,6 billion of Avmin’s investment in Chambishi Metals plc (Chambishi) during 2002.
Acquisit ions and disposals
Details of the Company’s direct and indirect interests in its principal subsidiaries, associated companies, joint
ventures, partnerships and other investments are contained in separate reports; refer pages 78 and 80.
During the period under review the following significant transactions occurred:
The Company sold half of its Assore Limited holding, 2,5 million shares, for R95 million. Avmin’s holding at
30 June 2002 was 2,6 million shares (5,1 million shares).
A total of 28 million Avgold Limited shares were sold for R139 million, decreasing the holding at year end to
56 per cent (61 per cent).
The entire Iscor Limited holding of 35,3 million shares, acquired for R494 million, was sold to Deutsche Bank
and Stimela Mining Limited (Stimela) for a consideration of R836 million. A joint venture was entered into with
Stimela to pursue opportunities in iron ore. At that time Avmin was granted a call option on between 10 and
25 per cent of Stimela’s shares in Kumba Resources Limited. This option was subsequently sold to Stimela for
R75 million.
In the recently registered Two Rivers Platinum (Proprietary) Limited, a portion of shareholder loans,
R100 million, was converted into equity. Avmin’s resultant shareholding being 330 shares. The equity ratio of
55:45 between Avmin and Impala Platinum Holdings Limited has been maintained. This company was formed
to mine the platinum group metals underlying the chrome deposit situated on the farm Dwars Rivier,
Mpumalanga Province.
Since the accounting date to the date of this report, no significant acquisitions or disposals have taken place.
37A
vm
in A
nn
ua
l R
ep
ort
20
02

Directors’ report (continued)
Financial
The financial position of the Company and its subsidiaries (Group) are reflected in the balance sheet, income
statement, changes in equity and cashflow statements and supporting statements. Group borrowings at
30 June 2002 totalled R2,7 billion; R1,2 billion were long-term and R1,5 billion short-term. Loans totalling
US$175 million form a portion of these borrowings of which US$140 million relates to Chambishi and the
balance was borrowed by Avgold for the completion of the Target mine. The Group is exposed to currency
fluctuations in translating these borrowings.
In accordance with the Company’s articles of association the borrowing powers of the Company* at the
accounting date were limited to R4,9 billion.
Mineral and Petroleum Resources Development Bil l
The Mineral and Petroleum Resources Development Bill (the Bill) was recently presented to Parliament and
awaits assent by the President. A key objective of the Bill is that the State will be the custodian of the nation’s
mineral resources. While the Group is adapting to this new legal framework to enable it to continue making a
contribution to all stakeholders, the effect of the Bill, including the Socio Economic Empowerment Charter and
the Money Bill, which are still to be formulated, are yet to be determined.
Events subsequent to year end
As a result of Chambishi not being brought into production as planned Avmin, has negotiated a rescheduling
of a portion of its short-term US$32,5 million loan until July 2004. A new US$20,0 million loan with repayment
during August 2004 has also been secured.
The progress being achieved at Chambishi in its ramp up to full production in calendar 2002 is detailed on
page 17.
Share capital
The Company’s authorised share capital* was unchanged during the year and at 30 June 2002 was:
R million
Ordinary
196 668 737 shares of 5 cents each 9,8
Preference
646 380 compulsorily convertible preference shares of 678 cents each 4,4
14,2
* The notice of annual general meeting contains proposals to change these parameters; refer Notice, pages 86 and 87.
The principal movements of issued share capital that occurred during the period:
Shares
Ordinary
Shares in issue at 1 July 2001 110 104 818
Shares issued for options exercised by share incentive scheme participants 1 338 834
Shares in issue at 30 June 2002 111 443 652
Loans for purchase of mineral r ights and mine development costs
The Company has advanced loans to certain subsidiary prospecting companies to finance the purchase of
mineral rights and costs related to mine development.
Changes in accounting policies
No changes were made to the accounting policies during the year ended 30 June 2002. The policies stated in
the annual financial statements are the same as for the year ended 30 June 2001.
38D
ire
cto
rs’
rep
ort

Directors’ report (continued)
Taxat ion
The 1998 return of income has been assessed by the revenue authorities who have rejected the Company’s
contention that the premium payable on redemption of loan stock is not of a capital nature and therefore
allowable. An appeal has been lodged against the assessment. The Company’s legal advisers support the
contention. No provision has been made in the annual financial statements for the assessed amount of
R107 million plus interest.
Assessments have been received for financial years 1999 and 2000; certain items are under dispute with the
revenue authorities regarding the 1999 return of income. The 2001 return of income has been submitted to the
revenue authorities, but not assessed.
Dividend pol icy
The current policy adopted by the directors is to declare a single dividend annually with at least four times
earnings cover.
Dividends
The Company is subject to bank covenants relating to the financing of Chambishi for the 2002 financial year
precluding the payment of cash dividends.
Accordingly no dividends were declared for the year ended 30 June 2002.
Directors’ responsibil i ty relating to annual f inancial statements
It is the directors’ responsibility to prepare annual financial statements that fairly present the state of affairs and
the results of the Company and of the Group. The external auditors are responsible for independently reviewing
and reporting on these annual financial statements.
The annual financial statements set out in this report have been prepared in accordance with South African
Statements of Generally Accepted Accounting Practice and International Accounting Standards. They are
based on appropriate accounting policies which have been consistently applied and are supported by
reasonable and prudent judgements and estimates. The annual financial statements have been prepared on
a going-concern basis and the directors have no reason to believe that the business of the Company will not
be a going concern in the year ahead.
To fulfil its responsibilities, management maintains adequate accounting records and has developed and
continues to maintain systems of internal controls.
The Company and its subsidiaries’ internal controls and systems are designed to provide reasonable but not
absolute assurance as to the integrity and reliability of the annual financial statements and to adequately
safeguard, verify and maintain their assets. These controls are monitored throughout the Group and nothing
has come to the directors’ attention to indicate that any material breakdown in the functioning of these controls,
procedures and systems has occurred during the year under review.
Directorate
The names and details of the directors of the Company are reflected on pages 6 and 7.
Mr KW Maxwell tendered his resignation as chairman of the Company on 30 June 2002 and was succeeded
by Mr RP Menell on 1 July 2002. Mr Maxwell remains a director of the Company. Mr DN Murray was appointed
chief executive officer on 1 July 2002.
Messrs B Frank and N Livnat were appointed to the board on 17 August 2001. On 11 April 2002, Messrs
DD Barber, PM Baum and BE Davison were appointed to the board. In terms of the articles of association the
aforementioned appointments lapse on termination of the forthcoming annual general meeting.
Mr WA Nairn’s appointment as alternate to Mr Davison was also approved on 11 April 2002.
39A
vm
in A
nn
ua
l R
ep
ort
20
02

Directors’ report (continued)
In accordance with article 83 of the articles of association Messrs RP Menell, DE Jowell, BM Menell and Dr MZ Nkosi retire by rotation at the close of the forthcoming annual general meeting.
All of the aforementioned directors, being eligible, have offered themselves for election and re-election respectively.
Dr TV Maphai resigned as a director of the Company on 31 May 2002.
There have been no changes to the composition of the board subsequent to those detailed above.
The only current contracts between the Company and its directors are consultancy agreements with Messrs KW Maxwell and B M Menell terminating on 31 December 2002.
Directors’ emolumentsThe emoluments detailed below were paid to directors during the year ended 30 June 2002.
Bonusesand per- Pension Exercise
Board and Consult- formance scheme of sharecommittee ancy related contribu- options Total Total
All figures in R000 fees fees Salaries1 payments tions gains 2002 2001
Executive directorsRP Menell
Avmin 79 – 2 538 805 219 6 204 9 845 2 574DN Murray
Avmin 58 – 1 460 1 313 118 – 2 949 823Avgold Limited – – 562 1 248 51 – 1 861 884
BM Menell (until 1 November 2001)Avmin 20 587 – – – – 607 905
157 587 4 560 3 366 388 6 204 15 262 5 186
Non-executive directorsDD Barber 11 – – – – – 1 1 –PM Baum 11 – – – – – 1 1 –BE Davison 11 – – – – – 1 1 –B Frank 52 – – – – – 5 2 –DE Jowell 61 – – – – – 6 1 64N Livnat 38 – – – – – 3 8 –Dr TV Maphai 35 – – – – – 3 5 55KW Maxwell 132 270 – – – – 402 413JR McAlpine 63 – – – – 6 3 69BM Menell 40 1 200 – – – – 1 240 –Dr MZ Nkosi 71 – – – – – 7 1 70R Oron 63 – – – – – 6 3 44
588 1 470 – – – – 2 058 715
Total 745 2 057 4 560 3 366 388 6 204 17 320 5 901
Aggregate emoluments of directors who served during the yearBoard and committee fees 745 630Consultancy fees 2 057 1 110Salaries 4 560 3 232Bonuses and performance related payments 3 366 568Pension scheme contributions 388 361Exercise of share options gains 6 204 –
Total 17 320 5 901
1 Refer page 66, note 19
40D
ire
cto
rs’
rep
ort

Directors’ report (continued)
An increase in directors’ fees payable annually and per meeting to directors will be proposed as an ordinary
resolution at the annual general meeting. These fees were last increased on 1 July 1999. Please refer to page 86
for further details.
Opt ionsOptions to subscribe for ordinary shares of the Company granted during the year to 30 June 2002 are shownin the table below.
ChairmanRP Menell
Held as at 1 July 2001Number 398 758Average exercise price per share R8,43
Granted during the yearNumber 148 600Average exercise price per share R33,50
Exercised during the yearNumber 162 227Average exercise price per share R0,05
Held as at 30 June 2002Number 385 131Average exercise price per share R21,63Latest expiry date 19 September 2009
Interests of directorsThe direct and indirect beneficial and deemed beneficial interests of the directors of the Company (includingafter due enquiry in this regard, their family interests) in the issued share capital of the Company at 30 June2002 were as follows:
30 June 2002 30 June 2001Ordinary shares BeneficialNon-beneficial Beneficial Non-beneficial
Non-executive directorsDr TV Maphai 1 000 –KW Maxwell 5 355 – 5 355 –
5 355 – 6 355 –
Indirect interestsExecutive directorsRP Menell 2 835 – – –RP Menell and BM Menell 260 314 – 783 061 –
Non-executive directorsDD Barber 5 500 – – –DE Jowell – 35 071 – –
268 649 35 071 783 061 –
Total 274 004 35 071 789 416 –
41A
vm
in A
nn
ua
l R
ep
ort
20
02
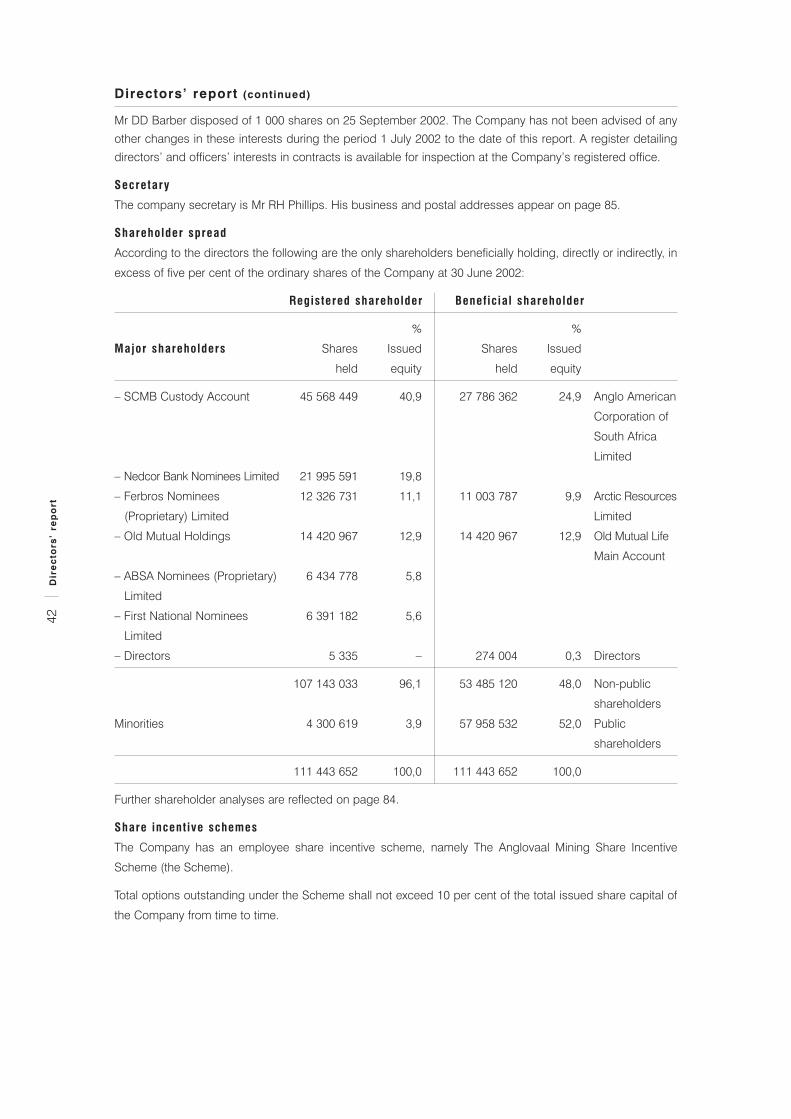
Directors’ report (continued)
Mr DD Barber disposed of 1 000 shares on 25 September 2002. The Company has not been advised of any
other changes in these interests during the period 1 July 2002 to the date of this report. A register detailing
directors’ and officers’ interests in contracts is available for inspection at the Company’s registered office.
Secretary
The company secretary is Mr RH Phillips. His business and postal addresses appear on page 85.
Shareholder spread
According to the directors the following are the only shareholders beneficially holding, directly or indirectly, in
excess of five per cent of the ordinary shares of the Company at 30 June 2002:
Registered shareholder Beneficial shareholder
% %
Major shareholders Shares Issued Shares Issued
held equity held equity
– SCMB Custody Account 45 568 449 40,9 27 786 362 24,9 Anglo American
Corporation of
South Africa
Limited
– Nedcor Bank Nominees Limited 21 995 591 19,8
– Ferbros Nominees 12 326 731 11,1 11 003 787 9,9 Arctic Resources
(Proprietary) Limited Limited
– Old Mutual Holdings 14 420 967 12,9 14 420 967 12,9 Old Mutual Life
Main Account
– ABSA Nominees (Proprietary) 6 434 778 5,8
Limited
– First National Nominees 6 391 182 5,6
Limited
– Directors 5 335 – 274 004 0,3 Directors
107 143 033 96,1 53 485 120 48,0 Non-public
shareholders
Minorities 4 300 619 3,9 57 958 532 52,0 Public
shareholders
111 443 652 100,0 111 443 652 100,0
Further shareholder analyses are reflected on page 84.
Share incentive schemes
The Company has an employee share incentive scheme, namely The Anglovaal Mining Share Incentive
Scheme (the Scheme).
Total options outstanding under the Scheme shall not exceed 10 per cent of the total issued share capital of
the Company from time to time.
42D
ire
cto
rs’
rep
ort

Directors’ report (continued)
At the annual general meeting held on 1 November 2001 the proposed ordinary resolution that the Scheme’s
rule 5.3 be amended by the deletion of "0,5%" and the substitution therefor of "1,0%" was adopted. The effect
of the amendment will permit any one participant to hold a total of unvested and vested scheme shares and/or
options to an aggregate equal to one per cent of the issued share capital of the Company.
Options exercised by executive directors are included in ‘directors’ emoluments’.
The following are summaries of particulars required in terms of the Scheme and JSE Listings Requirements
for the schemes:
The
Anglovaal
Ordinary Mining Share Strike
shares in Incentive price per
issue Scheme share
Number
At 30 June 2001 110 104 818 4 364 264
Movements during the year:
Options
– granted 1 444 821 Varying
– exercised 1 338 834 (1 338 834) between
R0,05 and
R69,25
– forfeited (108 091)
At 30 June 2002 111 443 652 4 362 160
Movements subsequent to year end:
Options
– granted 8 085
– exercised 376 815 (376 815)
At 27 September 2002 111 820 467 3 993 430
27 September 2002 30 June 2002 30 June 2001
Options granted to participants
during the period 8 085 1 444 821 2 378 886
Number of shares available for
purposes of the trust 7 188 616 6 782 205 6 646 218
Options outstanding at 30 June 2002
Expiry date No of options Average price
30 June 2005 1 635 69,25
30 June 2006 138 574 3,55
30 June 2007 810 480 0,05
30 June 2008 1 811 593 31,24
30 June 2009 352 357 29,62
30 June 2010 1 247 521 33,50
4 362 160
43A
vm
in A
nn
ua
l R
ep
ort
20
02

Directors’ report (continued)
Special resolut ions
No special resolutions were passed by the Company during the period 1 July 2001 to the date of this report.
STRATE (Share Transactions Totally Electronic)
The Company’s shares were dematerialised on 5 November 2001. Should you wish to trade your Avmin shares
on the JSE you are urged to deposit them with a CSDP (Central Securities Depository Participant) or qualifying
stockbroker as trading in the Company’s shares on the JSE will only be possible if they exist in electronic format
in the STRATE environment. Should you have any queries please contact the Company’s transfer secretaries,
Computershare Investor Services Limited, whose details are set out on page 85.
Reporting in United States dollars
To assist international investors the Group’s balance sheet, income statement, changes in equity and cash flow
statement have been translated into United States dollars. These translations are based on average rates of
exchange for income statement and cash flow statement items and at those ruling at year end for the balance
sheet items. These statements are reflected on pages 81 to 83.
44D
ire
cto
rs’
rep
ort

Accounting policies
The consolidated financial statements are prepared in accordance with and comply with South African
Statements of Generally Accepted Accounting Practice and International Accounting Standards. The
consolidated financial statements are prepared under the historical cost convention as modified by the
revaluation of certain freehold land, buildings and investments.
The principal accounting policies as set out below have been consistently applied.
Basis of consolidation and goodwil l
Joint ventures
Joint ventures are contractual agreements whereby the Group has joint control over the financial and operating
policy decisions of the enterprise. The Group’s attributable share of the assets, liabilities, income and
expenses of such jointly controlled entities is proportionately consolidated on a line-by-line basis in the Group
financial statements.
The post-acquisition results of joint ventures are adjusted where necessary to take account of the effects of fair
value from the effective date of acquisition to date of disposal.
Subsidiary companies
Investments in subsidiaries are accounted for at cost less impairments.
The results of subsidiaries are consolidated from the dates of effective control up to the dates effective control
ceases. The post-acquisition results of subsidiaries are adjusted for the effects of fair value adjustments at
acquisition, unrealised profits and goodwill adjustments.
Goodwil l
Goodwill represents the excess of the cost of the investment over the fair value attributable to the net assets
acquired. Goodwill is included in the total amount of intangible assets and is amortised on the straight-line
basis over estimated useful life to a maximum of 20 years.
Any excess of the value attributable to the net assets acquired over the cost of the investment acquired is treated
as negative goodwill. Where negative goodwill is considered to represent future losses and expenses it is
amortised to the income statement as the losses and expenses are incurred. To the extent that negative goodwill
does not relate to future expected losses and expenses, the amount of negative goodwill, not exceeding the fair
values of acquired identifiable non-monetary assets, is recognised systematically over the estimated useful life of
the non-monetary assets and any excess over fair value is recognised in income immediately.
Inter-Company transactions and balances
Consolidation principles relating to the elimination of inter-Company transactions and balances and
adjustments for unrealised inter-Company profits are applied in all intra-Group dealings, whether it be
transactions with subsidiaries, associated companies or joint ventures.
Borrowing costs
Borrowing costs that are directly attributable to the acquisition, construction or development of a qualifying
asset that requires a substantial period of time to be prepared for its intended use are capitalised. Discounts
or premiums relating to borrowings are deferred and amortised over the term of the respective borrowing.
Borrowing costs are expensed from the time that production becomes commercially viable.
Deferred taxation
Deferred tax liabilities and assets are recognised in respect of temporary differences between the book value
and tax base of balance sheet items, including items with a tax base but no book value. The resulting net
deferred tax assets or net deferred tax liabilities are recognised on the balance sheet.
45A
vm
in A
nn
ua
l R
ep
ort
20
02

Accounting policies (continued)
Deferred tax is not recognised when the transaction involves the initial recognition of an asset or liability that is
not subject to a business combination, and at the time of the transaction affects neither accounting nor taxable
profit. Deferred tax assets are not recognised on negative goodwill and no deferred tax liability is recognised
on goodwill for which amortisation is not deductible for tax purposes. Deferred tax assets are recognised to
the extent that it is probable that taxable profit will be available against which the deductible temporary
difference can be utilised.
Deferred tax is calculated at the applicable rate for mining and non-mining taxes. In the case of mining taxes
for gold mines, deferred tax is calculated at the mining cost formula rate that is expected to apply to the period
when the asset is realised or the liability is settled.
Secondary taxation on companies
Secondary tax on companies (STC) is recognised on the declaration date of all dividends and is included in
the taxation expense in the income statement. STC credits available for offset against future STC is not
recognised as an asset on the balance sheet.
Environmental rehabil i tat ion obligation
The estimated cost of final rehabilitation, comprising liabilities for decommissioning and restoration, is based
on current legal requirements and existing technology and is reassessed annually. Cost estimates are not
reduced by the potential proceeds from the sale of assets.
Decommissioning
The present value of estimated future decommissioning obligations at the end of the operating life of an
operation is included in long-term provisions. The unwinding of the obligation is included in the income
statement. The related decommissioning asset is recognised in fixed assets.
Restorat ion
The present value of the estimated cost of restoration is included in long-term provisions. This estimate is
revised annually and any movement is charged against income.
Expenditure on ongoing rehabilitation is charged to the income statement as incurred.
Environmental rehabil i tation trust funds
Annual payments are made to rehabilitation trust funds in accordance with statutory requirements. The trust
funds are recognised separately from the related liability on the balance sheet.
Exploration expenditure
Exploration expenditure comprises expenditure incurred and advances made in respect of exploratory
ventures, research programmes and other related projects.
The costs of exploration programmes are expensed in the year in which they are incurred, except for expenditure
on specific properties which have indicated the presence of a mineral resource with the potential of being
developed into a mine, in which case the expenditures are capitalised and amortised in the same way as
detailed in the accounting policy for Tangible assets – mine development and decommissioning below. Where
it is subsequently found that no potential exists to develop a mine, the capitalised costs are written off in full.
Financial instruments
Financial instruments recognised on the balance sheet include cash and cash equivalents, investments, trade
receivables, trade creditors, foreign exchange contracts and borrowings. Initial recognition is at cost.
Subsequent recognition is at fair value or at amortised cost. The recognition methods adopted are disclosed
in the individual policy statements associated with each item.
46A
cc
ou
nti
ng
po
lic
ies
Accounting policies (continued)
Derivative instruments
Derivatives are initially measured at cost, and associated transaction costs are charged to the income
statement when incurred. Subsequently these instruments are measured as set out below.
Gains and losses on derivative instruments that effectively establish the prices for future production are
recognised in revenue when the related production is delivered. In the event of early settlement of hedging
contracts, gains and losses are brought into revenue at the date of settlement. Any potential loss on hedge
positions below the current cost of production is recognised in the period in which it arises.
Forward exchange contracts are valued at the balance sheet date using the forward rate available at the
balance sheet date for the remaining maturity period of the forward contract. Any gain or loss from valuing the
contract against the contracted rate is recognised in the income statement unless the contract qualifies for
special hedge accounting. A corresponding forward exchange asset or liability is recognised.
On settlement of a forward exchange contract, any gain or loss is recognised in the income statement.
Where the Group enters into cashflow hedges that qualify for special hedge accounting the effective portion of
fair value gains and losses is recognised in equity. When the underlying transaction occurs the gains and
losses are recognised in earnings.
Investments
Investments other than investments in subsidiaries, associates and joint ventures, are reflected at fair value.
Increases and decreases in fair values of available for sale investments are reflected in the revaluation reserve.
On disposal of an investment, the balance in the revaluation reserve is recognised in the income statement.
Where regulated markets exist, fair values are determined with reference to the stock exchange quoted selling
prices at the close of business on the balance sheet date. Where no regulated markets exist, investments are
carried at cost.
Set-of f
If a legally enforceable right exists to set-off recognised amounts of financial assets and liabilities and the
Group intends to settle on a net basis or to realise the asset and settle the liability simultaneously, all related
financial effects are netted.
Fixed assets
Impairment of assets
The carrying value of assets is reviewed at each balance sheet date to assess whether there is any indication
of impairment. If any such indication exists, the recoverable amounts of the assets are estimated. Where the
carrying value exceeds the estimated recoverable amount such assets are written down to their recoverable
amount. If the circumstances leading to the impairment no longer exist, the appropriate portion of the
impairment loss previously recognised is written back.
Intangible assets
Intangible assets are reflected at cost and are amortised on a straight-line basis over the anticipated useful
lives of the assets to a maximum of 20 years.
Research and development
Expenditure on research projects (or on the research phase of an internal project) is recognised as an expense
when it is incurred. When the development phase of a project demonstrates that it is probable that future
economic benefits will be generated, the related expenditure is recognised as an asset if:
47A
vm
in A
nn
ua
l R
ep
ort
20
02

Accounting policies (continued)
• The technical feasibility of completing the asset demonstrates that it will be available for use or sale;
• There is an intention to complete the asset, and use or sell it;
• There is an ability to use or sell the asset;
• There are adequate technical, financial and other resources available to complete the development, and
to use or sell the asset; and
• The expenditure attributable to the asset can be measured reliably.
Tangible assets
Tangible assets, other than land, are stated at cost less accumulated depreciation.
Land and buildings
Land and buildings, other than mine properties, are valued at market value. Buildings are depreciated on a
straight-line basis over their estimated useful lives to an estimated residual value, if such value is significant.
The annual depreciation rates used vary between two and five per cent.
Land and buildings are valued by external valuers at periodic intervals of not more than five years. Surpluses on
revaluation are recognised in equity in a revaluation reserve. Any subsequent impairment is adjusted against the
revaluation surplus to the extent of the available surplus and thereafter charged against operating profit. New
acquisitions and additions to existing land and buildings are reflected at cost until the next periodic revaluation.
Mine development and decommissioning
Costs to develop new ore bodies, to define further mineralisation in existing ore bodies and to expand the
capacity of a mine, or its current production, as well as the decommissioning thereof, are capitalised.
Development costs to maintain production are expensed as incurred.
Mine development and decommissioning assets are amortised using the units-of-production method based
on estimated proved and probable ore reserves. Proved and probable ore reserves reflect estimated quantities
of economically recoverable reserves which can be recovered in future from known mineral deposits. These
reserves are reassessed annually. The maximum period of amortisation using this method is 25 years. Where
the reserves are not determinable due to their scattered nature, the straight-line method of depreciation is
applied based on the estimated life of the mine to a maximum of 25 years.
Mineral rights
Mineral rights that are being depleted are amortised over their estimated useful lives using the units-of-
production method based on proved and probable ore reserves. Where the reserves are not determinable, due
to their scattered nature, the straight-line method is applied. The maximum rate of depletion of any mineral
right is 25 years. Mineral rights that are not being depleted are not amortised. Mineral rights that have no
commercial value are written off in full.
The excess purchase price over the fair value paid for mineral rights is recognised as being an amount paid for
the acquisition of ore reserves. This amount is capitalised and amortised over the period during which future
economic benefits are expected to be obtained from these mineral rights, to a maximum of 25 years.
Plant and machinery
Mining plant and machinery is amortised using the lesser of its estimated useful life or the units-of-production
method based on estimated proved and probable ore reserves. Where ore reserves are not determinable,
because of their scattered nature, the straight-line method of depreciation is applied. Non-mining plant and
machinery is depreciated over its useful life. The maximum life of any single item is 25 years.
48A
cc
ou
nti
ng
po
lic
ies

Accounting policies (continued)
Other
Mine properties (including houses, schools and administration blocks), motor vehicles and furniture and
equipment are depreciated on the straight-line basis over their expected useful lives, to estimated residual
values. The residual value is the amount expected to be obtained for the asset at the end of its useful life,
after deducting expected costs of disposal.
The annual depreciation rates generally used in the Group are:
• Furniture and equipment 10 to 33 per cent
• Mine properties 4 to 7 per cent
• Motor vehicles 20 per cent
• Mine development plant and
machinery, and mineral rights 4 to 25 per cent
Foreign currency translat ions
Foreign ent i t ies
Financial statements of foreign subsidiaries that are classified as foreign entities are translated into South
African rand using the exchange rates applicable at the reporting date, as follows:
• Assets and liabilities at rates of exchange ruling at the balance sheet date;
• Income and expenditure at the weighted average rate of exchange for the year;
• Cash flow items at the weighted average rate of exchange for the year, except where the date of cash
flow for significant transactions can be identified, in which case the cash flows are translated at the rate
of exchange ruling at the date of the cash flow;
• Fair value adjustments are considered to relate to the foreign entity and are translated at the closing rate;
• Goodwill is considered to relate to the reporting entity and is translated at the rate at the date of
acquisition, and
• Differences arising on translation are classified as equity until the investment is disposed of.
Foreign currency transactions and balances
Transactions in foreign currencies are converted to South African rand at the rate of exchange ruling at the
date that the enterprise is irrevocably committed to the transaction.
Foreign denominated monetary assets and liabilities (including those linked to a forward exchange contract)
are stated in South African rand using the exchange rate ruling at the balance sheet date, with the resulting
exchange differences being recognised in the income statement. Exchange differences on foreign loans that
are naturally hedged by an investment in a foreign entity are taken directly to equity to the extent that the loan
is not greater than the investment.
Inventor ies
Inventories are valued at the lower of cost and estimated net realisable value with due allowances being made
for obsolete and slow-moving items. Cost is determined using the following basis:
• Consumables and maintenance spares are valued at average cost;
• Finished products are valued at weighted average cost including an appropriate portion of direct
overhead costs;
• Work-in-process is valued at weighted average cost;
• Raw materials are valued at weighted average cost, and
• By-products are valued at the estimated variable cost associated with its production.
49A
vm
in A
nn
ua
l R
ep
ort
20
02

Accounting policies (continued)
Leased assets
Leases of fixed and tangible assets where the Group assumes substantially all the risks and rewards of
ownership are classified as finance leases. Assets subject to finance lease agreements are capitalised at their
cash cost equivalent and the corresponding liability to the lessor is raised. Lease payments are allocated using
the effective interest rate method to determine the lease finance cost which is charged against operating profit
and the capital repayment which reduces the liability to the lessor. These assets are depreciated on the same
basis as the fixed assets owned by the Group.
Leases, under which the lessor effectively retains the risks and rewards of ownership, are classified as
operating leases, with lease payments charged against operating profit in equal instalments over the period of
the lease.
Employee benefi ts
Costs related to defined contribution retirement plans are expensed as incurred.
The Group has certain unfunded liabilities in respect of post-retirement medical health care benefits. The
entitlement to these benefits is dependent upon the employee remaining in service until retirement age. The
actuarially determined costs of providing these benefits are charged to income immediately for past service costs.
Share options
Share options are accounted for at the strike price when the option is exercised and the shares are issued.
Provisions
Provisions are recognised when the following conditions have been met:
• A present legal or constructive obligation, to transfer economic benefits as a result of past events exists;
and
• A reasonable estimate of the obligation can be made.
A present obligation is considered to exist when there is no realistic alternative, but to make the transfer of
economic benefits. The amount recognised as a provision is the best estimate at the balance sheet date of
the expenditure required to settle the obligation. Only expenditure related to the purpose for which the provision
is raised is charged against the provision.
Revenue recognit ion
Revenue is recognised when the risks and rewards of ownership have been transferred and when the
economic benefits associated with a transaction will flow to the Group and the amount of revenue can be
measured reliably.
Dividends
Dividends are accounted for on the last day of registration for listed investments and when declared in respect
of unlisted investments.
Mining products
Revenue from the sale of mining and related products is recognised when the significant risks and rewards of
ownership of the goods have passed to the buyer.
50A
cc
ou
nti
ng
po
lic
ies

Accounting policies (continued)
Interest
Interest is recognised on a time proportion basis that takes account of the effective yield on the asset and an
appropriate accrual is made at each accounting reference date.
Toll treatment
Revenue from toll treatment contracts is recognised following the treatment of mining concentrates belonging
to third parties. The revenue is based on the final metal recoveries from concentrates at the agreed contract
rates.
DEFINITIONS
Cash and cash equivalents
Cash and cash equivalents include cash on hand and call deposits as well as short-term, highly liquid
investments that are readily convertible to known amounts of cash and are subject to an insignificant risk of
changes in value. Overdrafts are excluded from cash and cash equivalents.
Basic earnings per share
Earnings divided by the weighted average number of shares in issue.
Headline earnings per share
Headline earnings comprise earnings for the year, adjusted for profits, losses and capital items of such a nature
and size that separate disclosure is required in accordance with the requirements of AC 306. Adjustments
against earnings take account of attributable taxation and minority interests. The adjusted earnings figure is
divided by the weighted average number of shares in issue to arrive at headline earnings per share.
Fully di luted earnings per share
Fully diluted earnings comprise earnings as used in calculating basic earnings per share. The earnings figure
is divided by the weighted average number of ordinary shares, adjusted for any financial instruments or other
contracts that may entitle the holder thereof to ordinary shares, to arrive at fully diluted earnings per share. Fully
diluted headline earnings per share is calculated on the same basis as fully diluted earnings per share.
Cash generated from operations per share
Cash generated from operations divided by the weighted average number of shares in issue during the year.
51A
vm
in A
nn
ua
l R
ep
ort
20
02

Balance sheets
AT 3 0 J U N E 2 0 0 2
Group Company
2002 2001 2002 2001Note R m Rm R m Rm
ASSETS Non-current assets Tangible assets 2 5 686 5 987 120 113 Intangible assets 2 7 9 – – Loans and long-term receivables – – 252 830Deferred tax assets 10 38 47 – – Environmental rehabilitation trust funds 3 64 59 8 7 Investments 4 176 1 186 2 142 3 231
5 971 7 288 2 522 4 181
Current assets Inventories 6 976 722 1 6 14 Trade and other receivables 1 060 664 140 110 Taxation – 1 – – Deposits and cash 779 439 545 340
2 815 1 826 701 464
Total assets 8 786 9 114 3 223 4 645
EQUITY AND LIABILITIES Capital and reserves Ordinary share capital 7 6 6 6 6 Share premium 7 62 56 62 56 Non-distributable reserves 110 679 (91) 577 Distributable reserves 2 401 3 267 2 092 2 882
Shareholders’ interest in capital and reserves 2 579 4 008 2 069 3 521 Minority interest 8 2 012 1 483 – –
Total shareholders' interest 4 591 5 491 2 069 3 521
Non-current liabilities Long-term borrowings 9 1 181 921 – – Deferred tax liabilities 10 493 360 106 64 Long-term provisions 11 215 196 7 2 70
1 889 1 477 178 134
Current liabilit iesTrade and other payables 12 637 387 6 5 64 Provisions 13 6 2 116 2 7 82 Taxation 4 5 78 3 48 Derivative instruments 28 4 7 11 – – Overdrafts and short-term borrowings 14 1 515 1 554 881 796
2 306 2 146 976 990
Total equity and liabilities 8 786 9 114 3 223 4 645
52A
vm
in A
nn
ua
l R
ep
ort
20
02

Income statements
F O R T H E Y E A R E N D E D 3 0 J U N E 2 0 0 2
Group Company
2002 2001 2002 2001Note R m Rm R m Rm
Revenue 15 4 047 2 806 326 327 Cost of sales 2 985 2 083 167 140
Gross profit 1 062 723 159 187 Other operating income 215 211 400 260 Other operating expenses 478 338 447 279
Profit from operations 16 799 596 112 168 Income from investments 17 55 108 124 153 Finance costs 160 132 56 62
Profit before taxation and exceptional items 694 572 180 259 Exceptional items 18 (1 084) – (911) –
Profit before taxation (390) 572 (731) 259 Taxation 20 313 167 59 74
Profit from ordinary activities (703) 405 (790) 185
Minority interest 163 124 – –
Earnings (866) 281 (790) 185
Headline earnings 21 204 281 173 185
Basic earnings per share (cents) 22 (780) 259 Headline earnings per share (cents) 22 184 259 Fully diluted earnings per share (cents) 22 (771) 251 Fully diluted headline earnings per
share (cents) 22 182 251 Number of shares in issue at end of
year (thousands) 111 444 110 105 Weighted average number of shares
in issue (thousands) 110 977 108 379 Weighted average number of shares
used in calculating fully diluted earnings per share (thousands) 22 112 367 112 073
53A
vm
in A
nn
ua
l R
ep
ort
20
02

Statements of changes in equity
F O R T H E Y E A R E N D E D 3 0 J U N E 2 0 0 2
Share Foreigncapital and currency Revaluation Retained
premium translation surplus Other earnings TotalGroup Rm Rm Rm Rm Rm R m
Balance at 30 June 2000 60 6 3 47 2 971 3 087 Earnings – – – – 281 281 Revaluation of listed investments – – 635 – – 635Share options exercised 2 – – – – 2 Reallocation of reserves – – – (12) 12 – Other – – – – 3 3
Balance at 30 June 2001 62 6 638 35 3 267 4 008 Earnings – – – – (866) (866)Revaluation of listed investments – – 65 – – 6 5Disposal of listed investments – – (562) – – (562)Foreign entity translations – (48) – – – (48)Unrealised loss on currency
derivative contract – – – (26) – (26)Share options exercised 6 – – – – 6 Other – – – 2 – 2
Balance at 30 June 2002 68 (42) 141 11 2 401 2 579
Company Balance at 30 June 2000 60 (35) 6 35 2 697 2 763 Foreign currency translation
reserve – (64) – – – (64)Earnings – – – – 185 185 Revaluation of listed investments – – 635 – – 635 Share options exercised 2 – – – – 2
Balance at 30 June 2001 62 (99) 641 35 2 882 3 521 Foreign currency translation
reserve – (171) – – – (171)Earnings – – – – (790) (790)Revaluation of listed investments – – 65 – – 6 5Disposal of listed investments – – (562) – – (562)Share options exercised 6 – – – – 6
Balance at 30 June 2002 68 (270) 144 35 2 092 2 069
54A
vm
in A
nn
ua
l R
ep
ort
20
02

Cash flow statements
F O R T H E Y E A R E N D E D 3 0 J U N E 2 0 0 2
Group Company
2002 2001 2002 2001Note R m Rm R m Rm
CASH FLOW FROM OPERATING ACTIVITIES
Cash receipts from customers 3 823 2 967 462 881 Cash paid to suppliers and employees 3 204 2 441 415 392
Cash generated from operations 23 619 526 4 7 489 Interest received 5 5 106 94 137 Interest paid (160) (132) (56) (62)Dividends received 2 2 31 15 Dividends paid 24 (23) (1 222) – (1 208)Capital distibution – (1 697) – (1 697)Taxation paid 25 (197) (237) (62) (187)Net cash inflow/(outflow) from
operating activities 296 (2 654) 5 4 (2 513)
CASH FLOW FROM INVESTING ACTIVITIES
Proceeds from sale of joint venture and subsidiaries 26 – 6 – –
Additions to fixed assets to maintain operations (122) (291) (12) (14)
Additions to fixed assets to expand operations (1 101) (1 793) (11) (9)
Proceeds on disposal of fixed assets 6 2 – – Proceeds on disposal of investments 1 007 12 1 007 6 (Advances)/repayments in investment
loans and receivables – 4 (833) (503)Proceeds on dilution of interest in
investment in subsidiaries 139 – 139 –Other investments acquired – (497) (55) (814)
Net cash (outflow)/inflow from investing activit ies (71) (2 557) 235 (1 334)
CASH FLOW FROM FINANCING ACTIVITIES
Increase in shareholder funding 6 – 6 –Funding received from minority shareholders 264 182 – – Long-term borrowings raised 314 726 – – Long-term borrowings repaid (153) (4) – – (Decrease)/increase in short-term borrowings (316) 599 (90) 67 Decrease in treasury liabilities – (13) – (13)
Net cash inflow/(outflow) from financing activities 115 1 490 (84) 54
Net increase/(decrease) in cash and cash equivalents 340 (3 721) 205 (3 793)
Cash and cash equivalents at beginning of year 439 4 160 340 4 133
Cash and cash equivalents at end of year 779 439 545 340
Cash generated from operations per share (cents) 558 485 42 451
55A
vm
in A
nn
ua
l R
ep
ort
20
02
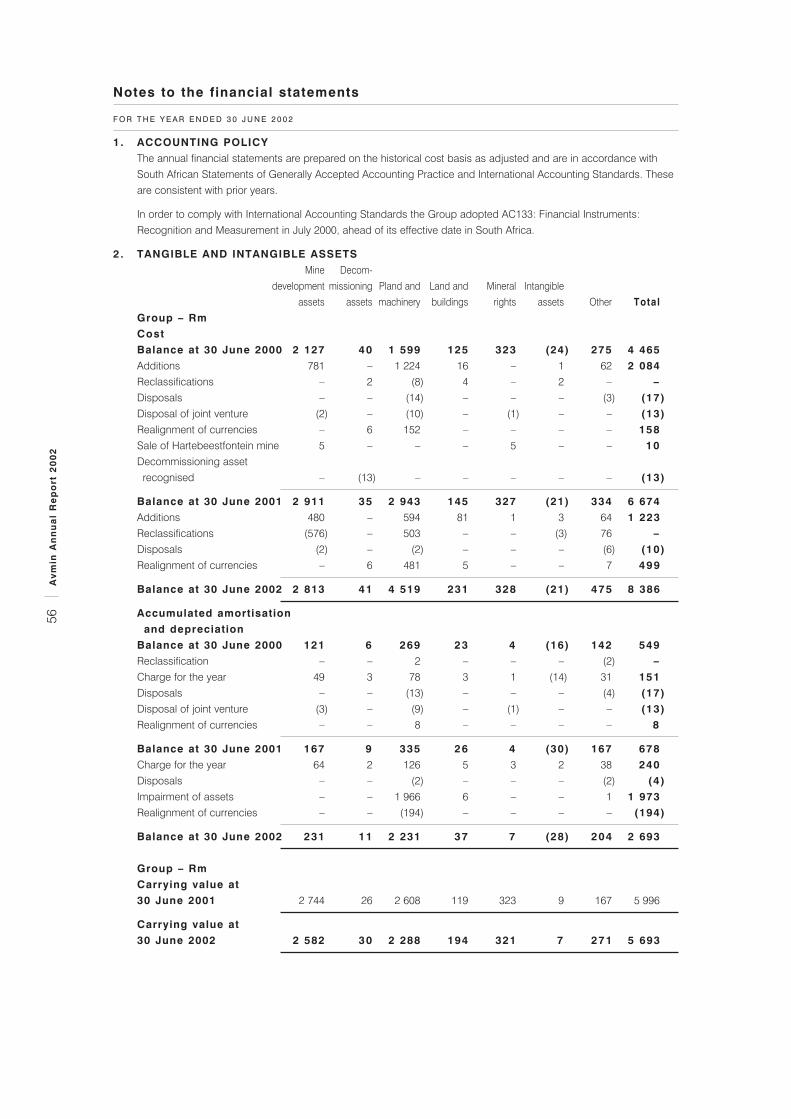
Notes to the financial statements
F O R T H E Y E A R E N D E D 3 0 J U N E 2 0 0 2
1. ACCOUNTING POLICY The annual financial statements are prepared on the historical cost basis as adjusted and are in accordance withSouth African Statements of Generally Accepted Accounting Practice and International Accounting Standards. Theseare consistent with prior years.
In order to comply with International Accounting Standards the Group adopted AC133: Financial Instruments:Recognition and Measurement in July 2000, ahead of its effective date in South Africa.
2. TANGIBLE AND INTANGIBLE ASSETS Mine Decom-
development missioning Pland and Land and Mineral Intangibleassets assets machinery buildings rights assets Other Total
Group – Rm Cost Balance at 30 June 2000 2 127 40 1 599 125 323 (24) 275 4 465 Additions 781 – 1 224 16 – 1 62 2 084 Reclassifications – 2 (8) 4 – 2 – –Disposals – – (14) – – – (3) (17)Disposal of joint venture (2) – (10) – (1) – – (13)Realignment of currencies – 6 152 – – – – 158 Sale of Hartebeestfontein mine 5 – – – 5 – – 10 Decommissioning asset
recognised – (13) – – – – – (13)
Balance at 30 June 2001 2 911 35 2 943 145 327 (21) 334 6 674 Additions 480 – 594 81 1 3 64 1 223Reclassifications (576) – 503 – – (3) 76 – Disposals (2) – (2) – – – (6) (10)Realignment of currencies – 6 481 5 – – 7 499
Balance at 30 June 2002 2 813 41 4 519 231 328 (21) 475 8 386
Accumulated amortisation and depreciation
Balance at 30 June 2000 121 6 269 23 4 (16) 142 549 Reclassification – – 2 – – – (2) –Charge for the year 49 3 78 3 1 (14) 31 151 Disposals – – (13) – – – (4) (17)Disposal of joint venture (3) – (9) – (1) – – (13)Realignment of currencies – – 8 – – – – 8
Balance at 30 June 2001 167 9 335 26 4 (30) 167 678 Charge for the year 64 2 126 5 3 2 38 240 Disposals – – (2) – – – (2) (4)Impairment of assets – – 1 966 6 – – 1 1 973 Realignment of currencies – – (194) – – – – (194)
Balance at 30 June 2002 231 11 2 231 37 7 (28) 204 2 693
Group – Rm Carrying value at 30 June 2001 2 744 26 2 608 119 323 9 167 5 996
Carrying value at 30 June 2002 2 582 30 2 288 194 321 7 271 5 693
56A
vm
in A
nn
ua
l R
ep
ort
20
02

Notes to the financial statements
F O R T H E Y E A R E N D E D 3 0 J U N E 2 0 0 2
2. TANGIBLE AND INTANGIBLE ASSETS (continued)
Borrowing costs Borrowing costs amounting to R85 million were capitalised in respect of the year to 30 June 2002 (2001: R94 million).
Specific US$ denominated borrowings are capitalised at varying rates between 6,25 per cent and 7,25 per cent andrand denominated borrowings are capitalised at a rate based on JIBAR plus 2,25 per cent.
Capital work-in-progress Included in the above is R629 million (2001: R3 393 million) of assets relating to projects in progress from which norevenue is currently derived.
Leased assets Included in plant and machinery are leased assets with a book value of R3 million (2001: R5 million). There were noadditions during the year (2001: R1 million).
Other assetsIncluded in other assets are vehicles and equipment held under finance lease R1 million (2001: R1 million), mineproperties R79 million (2001: R71 million), furniture, equipment and vehicles R191 million (2001: R95 million).
Intangible assetsIntangible assets consist of patents and trademarks.
Mine Decom-development missioning Plant and Land and
assets assets machinery buildings Other TotalCompany – Rm Cost Balance at 30 June 2000 90 1 44 17 24 176Additions 10 – 4 – 10 2 4Disposals – – – – (2) (2)
Balance at 30 June 2001 100 1 48 17 32 198 Additions 15 – 4 – 4 23 Disposals – – – – (2) (2)
Balance at 30 June 2002 115 1 52 17 34 219
Accumulated amortisation and depreciation Balance at 30 June 2000 22 – 18 – 20 60 Charge for the year 19 – – – 6 2 5
Balance at 30 June 2001 41 – 18 – 2 6 85 Charge for the year 6 – 3 – 6 15 Disposals – – – – (1) (1)
Balance at 30 June 2002 47 – 21 – 31 99
Carrying value at 30 June 2001 59 1 30 17 6 113
Carrying value at 30 June 2002 6 8 1 3 1 17 3 120
A register containing details of mineral and mining rights and land and buildings is available for inspection duringbusiness hours at the registered address of the Company by members or their duly authorised agents.
57A
vm
in A
nn
ua
l R
ep
ort
20
02

Notes to the financial statements
F O R T H E Y E A R E N D E D 3 0 J U N E 2 0 0 2
Group Company
2002 2001 2002 2001R m Rm R m Rm
3. ENVIRONMENTAL REHABILITATION TRUST FUNDS Total environmental rehabilitation obligation (note 11) 130 115 9 8 Less: Amounts in trust funds 64 59 8 7
Net liability 6 6 56 1 1
The funds in the trusts are as follows: Balance at beginning of year 59 51 7 7 Amounts received during the year 4 2 – – Less: Work completed (6) (1) – – Interest earned 7 5 – – Other movements – 2 1 –
64 59 8 7
4. INVESTMENTS Listed – subsidiary companies Book value 1 462 1 552
Listed – other investments Original cost 31 546 31 555 Revaluation surplus 138 635 138 635
Closing carrying amount 169 1 181 169 1 190
Total – listed investments 169 1 181 1 631 2 742
Market value of listed investments 169 1 181 2 310 4 162
Unlisted – subsidiary companies Book value 203 451 Loans* (refer page 78) 303 34
506 485 Unlisted – other 7 5 5 4
Total unlisted 7 5 511 489
Total carrying amount of investments 176 1 186 2 142 3 231
Directors' valuation of unlisted investments – subsidiaries and other 3 6 8 670 490
A report on investments appears on pages 78 to 80.
*These loans are interest free with no fixed terms of repayment.
58A
vm
in A
nn
ua
l R
ep
ort
20
02

Notes to the financial statements
F O R T H E Y E A R E N D E D 3 0 J U N E 2 0 0 2
5. JOINT VENTURES The proportionate share of the following joint venture has been incorporated into the Company results:
– a 75 per cent share in the Nkomati mine.
The proportionate shares of the following joint ventures have been incorporated into the Group results:
– a 75 per cent share in the Nkomati mine, and – a 50 per cent share in Cato Ridge Alloys (Proprietary) Limited.
The aggregate amounts of joint ventures proportionately consolidated in the financial statements are: Group Company
2002 2001 2002 2001R m Rm R m Rm
Income statements Revenue 424 377 326 327
Profit for the year after taxation 122 132 116 130
Balance sheets Non-current assets 155 125 104 92 Current assets 239 174 146 112 Non-current liabilities 3 3 29 3 3 29 Current liabilities 173 104 3 6 28
Cash flow statements Net cash inflow from operating activities 5 1 50 2 4 36 Net cash outflow from investing activities (23) (22) (22) (21)Net cash outflow from financing activities (57) (51) – (44)
Commitments and contingent liabilitiesCommitments 3 3 – –
6. INVENTORIES Consumable stores 150 105 1 1 Raw material 372 321 – 13 Work-in-progress 80 35 15 – Finished goods 374 261 – –
976 722 16 14
7. SHARE CAPITAL AND PREMIUM Share capital Authorised 196 668 737 (2001: 196 668 737) ordinary shares
of 5 cents each 1 0 10 10 10 646 380 (2001: 646 380) compulsorily convertible
preference shares of 678 cents each 4 4 4 4
1 4 14 1 4 14
Issued 111 443 652 (2001: 110 104 818) ordinary
shares of 5 cents each 6 6 6 6
Share premium 6 2 56 62 56
– Balance at beginning of the year 5 6 51 56 51 – Premium on shares issued 6 5 6 5
Total issued share capital and premium 6 8 62 68 62
59A
vm
in A
nn
ua
l R
ep
ort
20
02

Notes to the financial statements
F O R T H E Y E A R E N D E D 3 0 J U N E 2 0 0 2
Group Company
2002 2001 2002 2001R m Rm R m Rm
8. MINORITY INTEREST Balance at beginning of year 1 483 1 185 Transfer from income statement 163 124 Unrealised loss on currency derivative
contract accounted for in equity (21) –Dividends paid to minorities (24) (13)Change in minority control in subsidiary 114 182 New subsidiary acquired 4 5 –Minority shareholders’ loan:
Two Rivers Platinum (Proprietary) Limited * 218 –Realignment of currencies 3 4 5
Balance at year end 2 012 1 483
*The minority shareholder’s contribution to this projecthas been classified as a minority shareholder’scontribution including that portion presently classifiedas shareholders’ loans. A final decision on thecomposition of these contributions between equity andloans has still to be made and will only be finalisedwhen the project feasibility is finalised and approved.
9. LONG-TERM BORROWINGS SA rand long-term borrowings Secured loans Secured by a selection of bonds, pledges andcharges over certain immovable property, certainmovable corporeal assets, rights, hedging receivablesand certain bank accounts. Interest is calculated at2,25 per cent above JIBAR rate. The loan is to be repaid in twelve equal quarterlyinstalments commencing on 31 March 2003. 300 150 – –
Unsecured loans Fixed term loan of five years that terminated on 11 June 2002. The loan bears interest at a nominalrate of 15,96 per cent, repayable in ten equal six-monthly instalments of R14 million commencing on11 December 1997 with a final instalment on 11 June 2002. – 23 – – Finance lease 1 2 – –
Total borrowings 301 175 – – Less: Repayable within one year included in
short-term borrowings 5 0 23 – –
Total SA rand long-term borrowings 251 152 – –
US dollar long-term borrowings
Secured loans Loans of US$64 million (2001: US$67 million) at afixed interest rate of 6,75 per cent and repayable in semi-annual instalments over five years, commencingsix months after final draw down, March 2002. The loan is secured with a pledge of shares and cash. 656 540 – –
Loans of US$16 million (2001: US$20 million) at an interest rate of 2 per cent above LIBOR. This loan is repayable in ten bi-annual instalments that commenced during September 2001 and the final being September 2006. 164 162 – –
Balance carried forward 820 702 – –
60A
vm
in A
nn
ua
l R
ep
ort
20
02
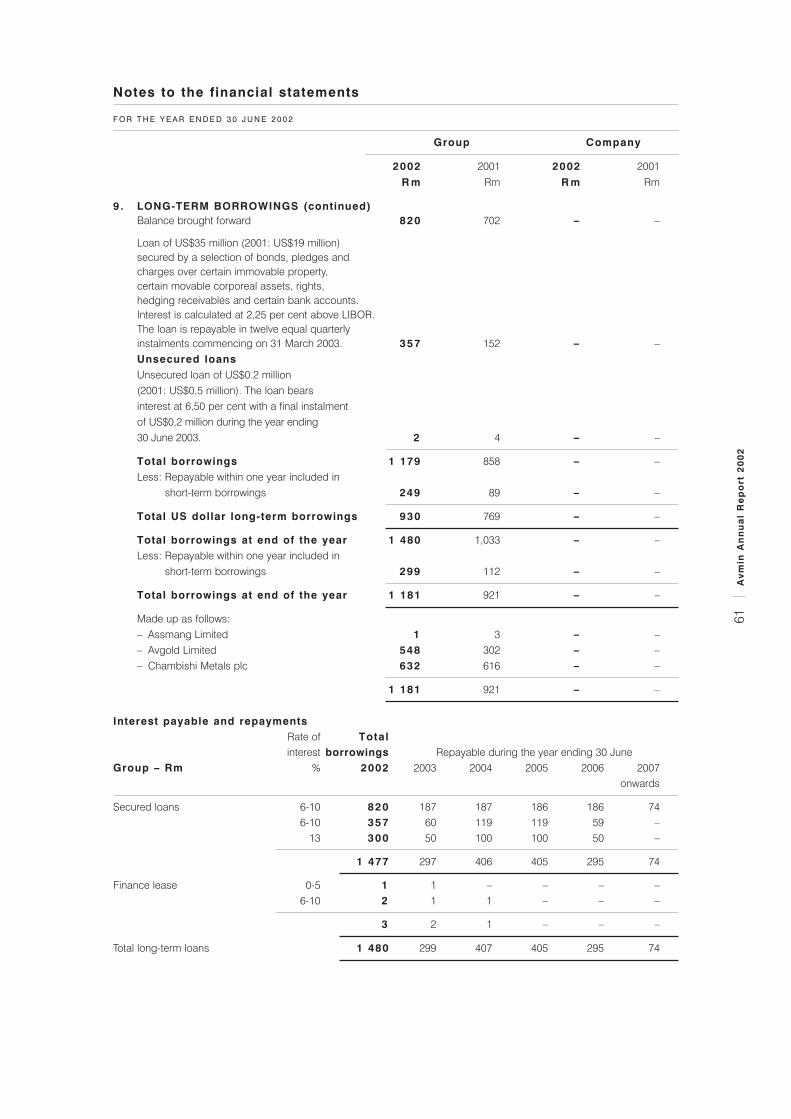
Notes to the financial statements
F O R T H E Y E A R E N D E D 3 0 J U N E 2 0 0 2
Group Company
2002 2001 2002 2001R m Rm R m Rm
9. LONG-TERM BORROWINGS (continued)Balance brought forward 820 702 – –
Loan of US$35 million (2001: US$19 million)secured by a selection of bonds, pledges and charges over certain immovable property, certain movable corporeal assets, rights,hedging receivables and certain bank accounts. Interest is calculated at 2,25 per cent above LIBOR. The loan is repayable in twelve equal quarterly instalments commencing on 31 March 2003. 357 152 – – Unsecured loans Unsecured loan of US$0.2 million (2001: US$0,5 million). The loan bears interest at 6,50 per cent with a final instalment of US$0,2 million during the year ending30 June 2003. 2 4 – –
Total borrowings 1 179 858 – – Less: Repayable within one year included in
short-term borrowings 249 89 – –
Total US dollar long-term borrowings 930 769 – –
Total borrowings at end of the year 1 480 1,033 – – Less: Repayable within one year included in
short-term borrowings 299 112 – –
Total borrowings at end of the year 1 181 921 – –
Made up as follows: – Assmang Limited 1 3 – – – Avgold Limited 548 302 – – – Chambishi Metals plc 632 616 – –
1 181 921 – –
Interest payable and repayments Rate of Totalinterest borrowings Repayable during the year ending 30 June
Group – Rm % 2002 2003 2004 2005 2006 2007onwards
Secured loans 6-10 820 187 187 186 186 746-10 357 60 119 119 59 –
13 300 50 100 100 50 –
1 477 297 406 405 295 74
Finance lease 0-5 1 1 – – – – 6-10 2 1 1 – – –
3 2 1 – – –
Total long-term loans 1 480 299 407 405 295 74
61A
vm
in A
nn
ua
l R
ep
ort
20
02

Notes to the financial statements
F O R T H E Y E A R E N D E D 3 0 J U N E 2 0 0 2
Group Company
2002 2001 2002 2001R m Rm R m Rm
10. DEFERRED TAXATION Deferred tax assetsValuation of inventories – 1 – – Revaluation, net of related depreciation – 10 – – Assessed loss 3 8 34 – – State share of profit at 10,125 per cent – 1 – – Liabilities for health care benefits – 1 – –
Net deferred tax assets 3 8 47 – –
Deferred tax liabilities Tangible assets 389 283 31 28 Valuation of inventories (3) – – – Provisions made (13) (3) (2) (2)State share of profit at 10,125 per cent 3 7 29 – – Liabilities for health care benefits (20) (19) (19) (19)Foreign exchange profit deferred 4 8 9 4 8 9Other 55 61 4 8 48
Net deferred tax liabilities 493 360 106 64
Reconciliation of opening and closing balanceOpening deferred tax liability 360 289 64 57 Opening deferred tax asset (47) (22) – –
Net deferred tax liability – opening balance 313 267 6 4 57 Temporary differences from: 142 46 4 2 7
– Assessed loss (4) (240) – – – Tangible assets 116 270 – 5 – Valuation of inventories (2) – – – – Provisions made (10) (2) – – – Development costs – 6 – – – Health care benefits – (3) – – – State share of profit 9 9 – – – Revaluation net of depreciation – (6) – –– Foreign exchange profit deferred 3 9 9 3 9 9– Other (6) 3 3 (7)
– Deferred tax liability 493 360 106 64 – Deferred tax asset 38 (47) – –
Net deferred tax liability – closing balance 455 313 106 64
Deferred tax balances are shown net of deferred tax assets and deferred tax liabilities where a legal right to offset atsettlement exists.
62A
vm
in A
nn
ua
l R
ep
ort
20
02

Notes to the financial statements
F O R T H E Y E A R E N D E D 3 0 J U N E 2 0 0 2
Group Company
2002 2001 2002 2001R m Rm R m Rm
11. LONG-TERM PROVISIONS Environmental rehabilitation obligation
Provision for decommissioning Balance at beginning of year 68 71 1 1 Payments made (4) – – – Provision for the year 6 4 – – Realignment of currencies 6 6 – –Revision in estimate – (13) – –Other movements (4) – 1 –
Balance at end of year 72 68 2 1
Provision for restoration Balance at beginning of year 47 38 7 7 Payments made (2) (1) – – Provision for the year 7 8 – – Additional obligation recognised 6 2 – –
Balance at end of year 58 47 7 7
Total environmental rehabilitation obligation 130 115 9 8
Post-retirement health care benefits Balance at beginning of year 81 71 62 54 Provision for the year 4 10 1 8
Balance at end of the year 85 81 6 3 62
Other long-term provisions Balance at beginning of year – 22 – – Payments made – (6) – – Realignment of currencies – 2 – –Transfer to payables – (15) – –Transfer to short-term provisions – (1) – – Other – (2) – –
Balance at end of the year – – – –
Total long-term provisions at year end 215 196 7 2 70
12. TRADE AND OTHER PAYABLES Trade payables 540 314 4 7 34 Other payables 97 73 1 8 30
Total trade and other payables 637 387 6 5 64
63A
vm
in A
nn
ua
l R
ep
ort
20
02

Notes to the financial statements
F O R T H E Y E A R E N D E D 3 0 J U N E 2 0 0 2
Group Company
2002 2001 2002 2001R m Rm R m Rm
13. SHORT-TERM PROVISIONS Balance at beginning of year 116 105 82 67 Provision for the year 3 8 40 23 29 Payments made during the year (93) (24) (78) (14)Realignment of currencies 1 – – – Transfers from long-term provisions – 1 – – Transfers to payables – (6) –
Balance at end of the year 62 116 27 82
Made up as follows: – Debt suretyship 7 58 7 58 – Leave-pay and bonus provisions 5 5 56 2 0 24 – Long service awards – 2 – –
Total short-term provisions 62 116 2 7 82
14. OVERDRAFTS AND SHORT-TERM BORROWINGS Overdrafts 3 1 235 – – Short-term borrowings 1 185 1 207 881 796
– Foreign 595 598 595 501 – Local 590 609 286 295
Current portion of long-term borrowings 299 112 – –
1 515 1 554 881 796
Overdrafts and short-term borrowings are made up as follows: – Anglovaal Air (Proprietary) Limited – 23 – – – Anglovaal Mining Limited 595 501 595 501 – Assmang Limited 577 910 – – – Avgold Limited 126 5 – – – Chambishi Metals plc 217 115 – – – Loans from subsidiaries – – 286 295
1 515 1 554 881 796
64A
vm
in A
nn
ua
l R
ep
ort
20
02

Notes to the financial statements
F O R T H E Y E A R E N D E D 3 0 J U N E 2 0 0 2
Group Company
2002 2001 2002 2001R m Rm R m Rm
15. REVENUE Revenue comprises: – Mining and related products 3 771 2 615 326 327 – By-products 34 24 – – – Toll treatment and other services 242 167 – –
Mining and related revenue 4 047 2 806 326 327
Revenue and other income 4 317 3 125 850 740
Made up as follows: – Local revenue 622 686 141 172 – Export revenue 3 425 2 120 185 155
4 047 2 806 326 327
For reporting purposes other income includes fees, which are included in other operating income,and dividends and interest received which are included in investment income.
Revenue between companies within the Group, including revenue at arm’s length, is eliminated on consolidation.
16. PROFIT FROM OPERATIONS Profit from operations includes: Foreign exchange gains
– realised 7 3 58 3 0 58 – unrealised 9 5 57 2 4 52
Remuneration for management advisory services 1 1 7 7 54 Remuneration for technical advisory services 7 31 7 31 Surplus on disposal of tangible assets 1 1 – – Surplus on disposal of other investments 540 9 533 3 Amortisation and depreciation
– land and buildings 5 3 – – – mine development, exploration and
decommissioning 66 52 6 19– mineral rights 1 – – –– intangible assets 1 (14) – – – plant and machinery 126 78 3 – – other 4 1 31 6 6
Auditors' remuneration – audit fees 4 3 1 1 – other services 1 – – –
Exploration expenditure 5 6 64 4 9 61 Foreign exchange losses
– realised 5 3 34 1 3 5 – unrealised 5 5 18 – 5
Inventory write down – 7 – – Movement in provisions
– long-term 1 6 22 2 8 – short-term 38 40 2 3 29
Share transfer, secretarial and financial services 5 7 2 7 Staff costs
– salaries and wages 584 475 103 113 – defined contribution plans (pension) 2 8 27 7 6 – health care 2 1 15 3 –
65A
vm
in A
nn
ua
l R
ep
ort
20
02

Notes to the financial statements
F O R T H E Y E A R E N D E D 3 0 J U N E 2 0 0 2
Group Company
2002 2001 2002 2001R m Rm R m Rm
17. INCOME FROM INVESTMENTS Dividend income
– subsidiary companies – listed – – 24 13 – subsidiary companies – unlisted – – 5 –– other – listed 1 2 1 2 – other – unlisted 1 – 1 –
Interest received– subsidiary companies – – 49 51 – other 5 3 106 44 87
5 5 108 124 153
18. EXCEPTIONAL ITEMS Impairment of assets – Chambishi Metals plc (2 019) – – – Surplus on disposal of Iscor Limited investment 343 – 343 – Surplus on disposal of Kumba Resources
Limited options 7 5 – 75 –Surplus on disposal of Avgold Limited 4 8 – 5 0 –Surplus on disposal of Assore Limited 7 4 – 6 5 –Provision for guarantee (5) – (5) – Provision for doubtful debt – Chambishi Metals plc – – (1 534) – Foreign exchange profit on Chambishi Metals plc
– debtors book 400 – 400 –Loss on write-down of Chambishi Metals plc – – (305) –
Exceptional items per income statement (1 084) – (911) – Taxation (52) – (52) –Minority interest 6 6 – – –
Net exceptional items (1 070) – (963) –
19. DIRECTORS’ EMOLUMENTS Paid by the Company Executive directors – Salaries 5 3 – Bonuses 3 – Non-executive directors 2 1
1 0 4
Value of options at 30 June (R million) – Directors 8 3
Share options granted during year to 30 June (units in thousands) – Directors 149 148
Option periods – Directors August 2000 to June 2008
20. TAXATION South African normal taxation – current year 119 104 1 7 67 – prior year 1 1 2 – – State share of profits 3 7 12 – – Deferred taxation – temporary differences 142 46 4 2 7 Secondary tax on companies 4 3 – –
313 167 59 74
66A
vm
in A
nn
ua
l R
ep
ort
20
02

Notes to the financial statements
F O R T H E Y E A R E N D E D 3 0 J U N E 2 0 0 2
Group Company
2002 2001 2002 2001R m Rm R m Rm
20. TAXATION (continued)Dealt with as follows: Attributable to profit before exceptional items 261 167 7 74 Attributable to exceptional items (Note 18) 5 2 – 5 2 –
313 167 59 74
Reconciliation of rate of taxation: % % % %
Standard rate of company taxation 3 0 30 3 0 30 Adjusted for:
– Disallowed expenditure (136) 4 (65) 8 – Exempt income 3 5 (2) 2 0 (5)– Effect of State share of profit – 3 – – – Secondary tax on companies (2) – – – – Tax losses not raised as deferred tax assets (17) (2) – –– Revaluation reserve 1 3 (4) 7 (4)– Other (3) – – –
Effective rate of taxation (80) 29 (8) 29
The estimated losses which are available for the reduction of future taxable income are 2 689 719 – –
The ordinary shareholders' interest in the abated assessed losses is estimated at 2 414 629 – –
The estimated unredeemed capital expenditure available for reduction against future mining income is 3 740 2 572 – –
The ordinary shareholders' interest in the abated unredeemed capital expenditure is estimated at 2 065 1 549 – –
The Group had unused credits in respect of secondary tax on companies of R49 million at 30 June 2002 (2001: R24 million).
The latest tax assesment for the Company relates tothe year ended June 2000 and is dated 19 July 2001. The assessment for 1999 has not yet been received and a revised assesment for 1998 is under appeal.All returns, including June 2001, have been submitted.
21. HEADLINE EARNINGS Earnings per income statement (866) 281 (790) 185 Impairment of assets 1 619 – 1 439 –Provisions 5 – 5 –Surplus on disposal of investments (540) _ (533) –
218 281 121 185Taxation 5 2 – 5 2 –Minority interest (66) – – –
Headline earnings 204 281 173 185
67A
vm
in A
nn
ua
l R
ep
ort
20
02

Notes to the financial statements
F O R T H E Y E A R E N D E D 3 0 J U N E 2 0 0 2
Group Company
2002 2001 2002 2001R m Rm R m Rm
22. EARNINGS PER SHARE The calculation of earnings per share is based on aloss of R866 million (2001: R281 million – profit),and a weighted average of 110 977 thousand(2000: 108 379 thousand) shares in issue duringthe year. The calculation of headline earnings pershare is based on headline earnings of R204 million (2001: R281 million), and a weightedaverage of 110 977 thousand (2001: 108 379thousand) shares in issue during the year.
The calculation of fully diluted earnings per share is based on a loss of R866 million (2001: R281 million – profit), and a weighted average of 112 367 thousand (2001: 112 073 thousand)shares, calculated as follows:
Weighted average number of shares used in calculating basic earnings per share (thousands) 110 977 108 379 Potential ordinary shares due to share options granted 1 390 3 694
Weighted average number of shares used in calculating fully diluted earnings per share (thousands) 112 367 112 073
The calculation of fully diluted headline earnings pershare is based on earnings of R204 million (2001:R281 million) and a weighted average of 112 367thousand (2001: 112 073 thousand) shares.
23. RECONCILIATION OF NET PROFIT BEFORE TAX TO CASH GENERATED FROM OPERATIONS Net income/(loss) before tax, finance cost and investment income (284) 596 (799) 168 Adjusted for: 1 348 84 926 48
– Amortisation and depreciation of fixed assets 240 151 1 5 25 – Investment in Chambishi Metals plc
written off – – 305 – – Long- and short-term provisions 2 1 62 2 4 37 – Impairment of fixed assets 1 619 – 1 134 – – Surplus on disposal of fixed assets – (1) – –– Surplus on disposal of investments (540) (9) (532) (3)– Unrealised foreign exchange gain (40) (39) (23) (47)– Inventory write-down to net realisable value – 7 – – – Payment to trust funds (5) (2) (1) –– Other non-cash flow items 5 3 (85) 4 36
Operating profit before working capital changes 1 064 680 127 216 (Increase)/decrease in inventories (224) (122) (2) 2 (Increase)/decrease in receivables (346) 34 (30) 300 Increase/(decrease) in payables 125 (66) (48) (29)
Cash generated from operations 619 526 4 7 489
68A
vm
in A
nn
ua
l R
ep
ort
20
02

Notes to the financial statements
F O R T H E Y E A R E N D E D 3 0 J U N E 2 0 0 2
Group Company
2002 2001 2002 2001R m Rm R m Rm
24. DIVIDENDS PAID Balance at beginning of year – 1 208 – 1 208 Dividends to minorities 2 3 13 – – Other movements – 1 – –
Dividends paid 2 3 1 222 – 1 208
25. TAXATION PAID Balance at beginning of year (net) 77 191 4 8 169 Prior year tax under provided 11 2 – – Current taxation as per income statements 156 119 17 67 Other movements (2) 2 – (1)Balance at end of year (45) (77) (3) (48)
Taxation paid 197 237 62 187
26. PROCEEDS FROM DISPOSAL OF JOINT VENTURE AND SUBSIDIARIES During the 2001 year the Company disposed of its holdings in the Lannex Joint Venture in Lavino (Proprietary) Limited
Group2002 2001
The following assets and liabilities were disposed of: R m Rm Fixed assets – 2 Trade and other receivables – 1 Trade and other payables and provisions – (2)
Net assets (fairly valued) – 1 Profit on disposal – 5
– 6
Cash flow on disposal – 6
69A
vm
in A
nn
ua
l R
ep
ort
20
02

Notes to the financial statements
F O R T H E Y E A R E N D E D 3 0 J U N E 2 0 0 2
Group – 2001 Precious Cobalt/ Ferrous CorporateR m metals Copper Nickel metals and Other Total
27. SEGMENTAL INFORMATION Primary segmental information Year to 30 June 2002 Revenue External revenue 364 548 326 2 809 – 4 047 Cost of sales (335) (561) (167) (1 922) – (2 985)Other operating income 31 2 31 45 106 215Other operating expenses (11) (130) (27) (174) (136) (478)Reallocated corporate expenditure – (15) 7 47 (39) –
Segment result 49 (156) 170 805 (69) 799 Income from investments 3 – 2 4 46 55 Finance cost (8) (73) – (72) (7) (160)Exceptional items (2) (2 019) – – 937 (1 084)Taxation (5) – (50) (247) (11) (313)Minority interest (16) 73 – (220) – (163)
Contribution to earnings 21 (2 175) 122 270 896 (866)
Contribution to headline earnings 21 (221) 122 270 12 204
Other information Consolidated total operating assets 2 997 1 282 250 3 158 771 8 458Intangibles and mineral rights 141 – – 181 6 328
Consolidated total assets 3 138 1 282 250 3 339 777 8 786
Consolidated total liabilities 959 1 148 69 1 211 808 4 195
Capital expenditure 466 362 22 372 1 1 223
Depreciation 57 49 12 117 5 240
Primary segmental information Year to 30 June 2001 Revenue External revenue 218 326 327 1 926 9 2 806 Cost of sales (181) (353) (140) (1 402) (7) (2 083)Other operating income 9 – 6 2 194 211 Other operating expenses 7 (54) (10) (112) (169) (338)Reallocated corporate expenditure – (8) – 39 (31) –
Segment result 53 (89) 183 453 (4) 596
Income from investments 1 2 4 2 99 108 Finance cost – (12) – (68) (52) (132)Taxation – 29 (57) (119) (20) (167)Minority interest (15) 6 – (115) – (124)
Contribution to earnings 39 (64) 130 153 23 281
Contribution to headline earnings 39 (64) 130 153 23 281
Other informationConsolidated total operating assets 2 545 2 080 206 2 405 1 546 8 782 Intangibles and mineral rights 143 – – 184 5 332
Consolidated total assets 2 688 2 080 206 2 589 1 551 9 114
Consolidated total liabilities 517 1 704 58 1 400 (56) 3 623
Capital expenditure 600 834 21 626 3 2 084
Depreciation 4 31 22 90 4 151
70A
vm
in A
nn
ua
l R
ep
ort
20
02

Notes to the financial statements
F O R T H E Y E A R E N D E D 3 0 J U N E 2 0 0 2
27. SEGMENTAL INFORMATION (continued)
Business segments
For management purposes, the Company is organised into four major operating divisions. These are precious metals,
cobalt/copper, nickel and ferrous metals.
The Company's products predominantly reflect the risks and rewards of trading and the operating divisions are
therefore identified as the primary reporting segments. Financial information about the primary segments is presented
in the previous section of this note.
Geographical segments
The Company operates in two principal geographical areas namely South Africa and Zambia. Chambishi Metals plc,
in Zambia, is the only significant operation outside South Africa and is reported in the cobalt/copper business segment.
Group
Assets by geographical area 2002 2001
in which the assets are located, are as follows: R m Rm
– South Africa 7 232 6 821
– Zambia 1 139 2 080
– Europe 5 7 95
– USA 331 118
– Middle East 2 7 –
8 786 9 114
Revenue by geographical area
– South Africa 622 659
– Zambia 244 221
– Europe 1 290 611
– Japan and China 1 150 841
– USA 511 333
– Other 230 141
4 047 2 806
Capital expenditure
– South Africa 861 1 250
– Zambia 362 834
1 223 2 084
28. FINANCIAL INSTRUMENTS AND RISK MANAGEMENT
The Group is exposed to certain financial risks in the normal course of its operations. To manage these risks, a treasury
risk management committee has been established that may enter into transactions involving financial instruments from
time to time. Both recognised and unrecognised financial instruments are disclosed below.
The Group does not acquire, hold or issue derivative instruments for trading purposes. All derivative type transactions
are entered into as hedges of underlying cash flows.
The following risks occur and are managed through the policies adopted below:
Commodity price and currency risk
Commodity price risk arises from the possible adverse effect of fluctuations in commodity prices on current and future
earnings. The commodity market is predominantly priced in US dollars which exposes the Group’s cash flows to
foreign exchange currency risks.
Derivative instruments used to hedge the position of the Group against these risks include forward sale and purchasecontracts as well as forward exchange contracts.
71A
vm
in A
nn
ua
l R
ep
ort
20
02

Notes to the financial statements
F O R T H E Y E A R E N D E D 3 0 J U N E 2 0 0 2
28. FINANCIAL INSTRUMENTS AND RISK MANAGEMENT (continued)Foreign Year
currency end amount rate
Financial assets US$m R/US$ United States dollar
Foreign currency denominated items included in receivables – 30 June 2002 79 10,25Foreign currency denominated items included in receivables – 30 June 2001 57 8,08
Financial l iabilit ies United States dollar Foreign currency denominated items included in payables – 30 June 2002 3 10,25Foreign currency denominated items included in payables – 30 June 2001 10 8,08
For foreign currency denominated items included in long- and short-term borrowings refer to interest rate risk notefurther below.
Liquidity risk management The Company’s executive meet regularly to review long- and mid-term plans as well as short-term forecasts of cash flow.
Funding requirements are met by arranging banking facilities and/or structuring finance as applicable. All funding andrelated structures are approved by the board of directors.
Credit risk Credit risk arises from possible defaults on payments by business partners or bank counterparties. The Groupminimises credit risk by evaluating counterparties before concluding transactions in order to ensure the credit-worthiness of such counterparties. Cash is only deposited with institutions which have exceptional credit rankings withthe amounts distributed appropriately among these institutions to minimise credit risk through diversification.
At year end Bindura Nickel Corporation Limited, situated in Zimbabwe, owed the Group R65 million (2001: R70 million).Due to the shortage of foreign currency, payment is overdue. Other significant concentration of debt is The KonkolaCopper Mines (Zambia) with total current debt of R39 million (2001: R45 million). The directors believe these moniesare fully recoverable.
Treasury risk management The Company's treasury operation is a division of Anglovaal Mining Limited. The purpose of the division is to co-ordinate the short-term cash requirements in the South African domestic money market. The treasury operation makesavailable to all Group companies its bulk finance benefits at, or better than market related rates.
The treasury function is outsourced to Standard Risk and Treasury Management Services (Proprietary) Limited(SRTMS), a specialist in the management of third party treasury operations.
A treasury committee, consisting of senior managers in the Company and representatives from SRTMS, meets on aregular basis to analyse currency and interest rate exposures as well as future funding requirements within the Group.The committee reviews the treasury operation's dealings to ensure compliance with Group policies and exposure limitsas directed by the board of directors and audit committee.
Equity instruments Equity instruments include equity and preference shares. There are no preference shares in issue at present.
72A
vm
in A
nn
ua
l R
ep
ort
20
02

Notes to the financial statements
F O R T H E Y E A R E N D E D 3 0 J U N E 2 0 0 2
28. FINANCIAL INSTRUMENTS AND RISK MANAGEMENT (continued)Principal Principal Average Maturity
Forward contracts (recognised on at year end at year end rate date balance sheet) US$m Rm R/US$ Activity:
Forward exchange contract for precious metals at 30 June 2002 24 209 8,74 31 July 2002 to
30 June 2003Forward exchange contract for ferrous metals 20 151 7,55 10 July todebtors at 30 June 2001 20 August 2001
Volume Volume Average MaturityForward contracts (not recognised on hedged hedged price date balance sheet) (ounces) (kilograms) US$/oz year ending Activity:
Year ended 30 June 2002Gold hedgingDollar forward sales contracts 50 769 1 579 313 30 June 2003
51 481 1 601 298 30 June 200446 885 1 458 284 30 June 200521 620 672 290 30 June 2006
Volume Volume Average Maturity Forward contracts (not recognised on hedged hedged price datebalance sheet) (ounces) (kilograms) R/kg year ending Activity:
Year ended 30 June 2002Gold hedging 302 411 9 406 83 077 30 June 2003Rand forward sales contracts 251 733 7 830 85 135 30 June 2004
246 876 7 679 94 009 30 June 2005119 923 3 730 100 985 30 June 2006
The Group enters into forward sales contracts to sell specified amounts of gold and related currency (United Statesdollars) in the future at predetermined rates. These hedge contracts are entered into to secure the future revenuestreams. The Company does not use derivative instruments for speculative purposes.
Forward sale agreements are not recognised on the balance sheet as financial assets and liabilities. The revenue isrecognised when the related production is delivered The mark-to-market of the hedge book contracts at 30 June 2002was R873 million (negative) (2001: R121 million – positive) based on market rates and accepted valuation methodologies.
The value in the current hedge book is exposed to the transaction risk of value changing due to movements in marketrates (interest rates, exchange rates or gold prices).
A limited number of counterparties are involved in the hedge transactions. These have good credit ratings, thusminimising any credit risk.
The mix of hedging instruments, the volume of production hedged and the tenor of the hedging book is continuouslyreviewed in the light of changes in operational forecasts, market conditions and the Group's hedging policy.
Certain of the rand gold forward sales contracts with counterparties differ from those with whom the related gold forwardsale contracts have been concluded. IAS 39 requires that as these contracts are cash flow hedges that they qualify forhedge accounting. The mark-to-market unrealised loss of R47 million has been raised as a current liability. The effect onequity of R26 million after minority interest is included in the statement of owners’ equity.
Interest rate risk Fluctuations in interest rates give rise to interest rate risks through the impact these fluctuations have on the value ofshort-term cash investments and financing activities.
Hedging of interest rates may be undertaken to ensure that fluctuations in interest rates do not have an unexpectedimpact on the cash flows or value of assets and liabilities.
Cash is managed to ensure that surplus funds are invested in a manner to achieve maximum returns while minimisingrisks. This is achieved through the activities of Anglovaal Treasury Operations serving the Group in managing cash flowneeds.
73A
vm
in A
nn
ua
l R
ep
ort
20
02

Notes to the financial statements
F O R T H E Y E A R E N D E D 3 0 J U N E 2 0 0 2
28. FINANCIAL INSTRUMENTS AND RISK MANAGEMENT (continued)Significant exposures to interest rate risk were as follows:
Foreign Bookcurrency value at Effective
amount year end Repricing Maturity interestFinancial assets US$m Rm date date rate
Year ended 30 June 2002 overnight
Cash – financial institutions 210 call deposit 11,00%-11.35%– fixed 569 Various dates 11,35%-11,80%
in July 2002
779
Year ended 30 June 2001 overnight
Cash – financial institutions 419 call deposit 9,35%– fixed 2 0 25/06/2001 8,75%
439
Financial l iabilit ies
Year ended 30 June 2002Foreign financial liabilities
Long-term financial liabilities – Rand Merchant Bank 6 4 656 Fixed to maturity 31/03/2007 6,75%– Industrial Development Corporation 1 6 164 Fixed to maturity 30/09/2006 LIBOR + 2% – Syndicated loan 3 5 357 Fixed to maturity 31/12/2005 LIBOR + 2,25%– Other 1 2
116 1 179
Short-term financial liabilities
– ABSA (Isle of Man) Limited 9 9 2 28/02/2002 30/08/2002 LIBOR + 0,8%– Citibank Johannesburg 10 103 03/06/2002 04/12/2002 LIBOR + 1,70%– Rand Merchant Bank (Dublin) 6 6 6 28/06/2002 31/01/2002 LIBOR + 1,25%– Nedcor Trade Securities (Mauritius)
Limited 2 3 231 28/06/2002 31/07/2002 LIBOR + 1,05%– Nedcor Trade Securities (Mauritius)
Limited 10 103 28/06/2003 31/07/2003 LIBOR + 1,25%
5 8 595
Total foreign financial liabilities 174 1 774
Local financial l iabilities
Long-term financial liabilities– Syndicated loan 300 31/12/2005 JIBAR + 2,25% – Various 1
Short-term financial liabilities Linked to– Financial institutions 621 money market
Total local liabilities 922
Total financial liabilities 2002 174 2 696
74A
vm
in A
nn
ua
l R
ep
ort
20
02

Notes to the financial statements
F O R T H E Y E A R E N D E D 3 0 J U N E 2 0 0 2
28. FINANCIAL INSTRUMENTS AND RISK MANAGEMENT (continued)Foreign Book
currency value at Effectiveamount year end Repricing Maturity interest
US$m Rm date date rate Financial l iabilit ies
Year ended 30 June 2001Foreign financial liabilities
Long-term financial liabilities – Rand Merchant Bank 6 7 540 Fixed to maturity 31/03/2007 6,75%– Industrial Development
Corporation 20 162 Fixed to maturity 30/09/2006 LIBOR + 2%– Syndicated loan 1 9 152 Fixed to maturity 31/12/2005 LIBOR + 2,25%– Other 1 4 30/06/2003
107 858
Short-term financial liabilities – ABSA (Isle of Man) Limited 10 8 1 31/08/2001 31/10/2001 4,80%– Investec Bank (Mauritius) Limited 10 8 1 05/09/2001 30/09/2001 4,95%– First National Bank Limited 7 5 7 28/09/2001 29/06/2001 4,71%– Nedcor Trade Securities (Mauritius)
Limited 25 201 31/07/2001 31/07/2001 6,43%– Nedcor Trade Securities (Mauritius)
Limited 1 0 8 1 25/10/2001 25/10/2001 5,33%– Financial institutions 9 7 5 30/06/2001 current Linked to LIBOR– Other 3 2 2 30/062001 31/07/2001 5,76%
7 4 598
Total foreign financial liabilities 181 1 456
Local financial l iabilities
Long-term financial liabilities – Syndicated loan 150 17/08/2001 31/12/2005 JIBAR + 2,25%– Financial institutions 2 3 30/06/2000 30/06/2002 15,96%– Various 2Short-term financial liabilities– Financial institutions Linked to money
844 30/06/2001 30/06/2001 market
Total local liabilities – 1 019
Total financial liabilities 2001 181 2 475
75A
vm
in A
nn
ua
l R
ep
ort
20
02

Notes to the financial statements
F O R T H E Y E A R E N D E D 3 0 J U N E 2 0 0 2
Group Company
2002 2001 2002 2001R m Rm R m Rm
29. COMMITMENTS AND CONTINGENT LIABILITIES CommitmentsCommitments in respect of capital expenditure: Approved by directors – contracted for 229 272 7 7 – not contracted for 588 988 2 9
Total commitments 817 1 260 9 16
Contingent liabilities Back-to-back guarantees 180 180 – – Housing collaterals and contingent liabilities
relating to slimes dams 1 2 – – Guarantee of subsidiary loan 656 540 656 540
Total commitments and contingent liabilities 1 654 1 982 665 556
The Company has a contingent liability for the amount of tax relating to the Anglovaal Limited loan stock redemptionpremium that the South African Revenue Service disallowed in 1998.
The potential 1998 liability for tax is R107 million at a tax rate of 30 per cent plus interest. This matter is currently under appeal.
A back-to-back guarantee to Assore Limited (Assore) is in respect of guarantees issued to bankers by Assore to securea short-term export finance agreement facility of R180 million (2001: R180 million). Short-term export finance loansnegotiated in terms of the above facility in the ordinary course of business at 30 June 2002 were R13 million (2001:R75 million).
Anglovaal Mining Limited has provided an irrevocable and unconditional guarantee to Copperbelt Energy Corporationplc (CEC) and the Development Bank of Southern Africa Limited (DBSA) for the due and punctual payment byChambishi Metals plc (Chambishi) of the capital charge component of the power supply assets installed and ownedby CEC for which financing was obtained by CEC from DBSA. The total outstanding capital charge obligation at June2002 amounted to US$11,1 million (2001: US$11,5 million) and will reduce over 10 years ending June 2012 as capitalcharge payments are made by Chambishi Metals plc.
A contingent liability exists, arising from an agreement with LTA Process Engineering whereunder Avgold Limited isliable for the erection costs of a tailings dam, should a dump reclamation project at the latter’s ETC mining complexbe cancelled.
30. RETIREMENT PLANS The Group has made provision for pension plans and provident funds substantially covering all employees. These arecomposed of defined contribution pension plans, which are governed by the Pension Fund Act, 1956, and definedcontribution provident funds administered by employee organisations within the industries in which members areemployed. The contributions paid by Group companies for retirement benefits are charged to the income statementas they are incurred.
The benefits provided by the defined contribution plans are determined by accumulated contributions and returns oninvestment.
Periodic reviews of the plans are carried out by independent actuaries at regular intervals.
Members contribute between 5,0 per cent and 7,5 per cent and employers between 5,0 per cent and 18,02 per cent of pensionable salaries to the funds.
76A
vm
in A
nn
ua
l R
ep
ort
20
02

Notes to the financial statements
F O R T H E Y E A R E N D E D 3 0 J U N E 2 0 0 2
31. POST-RETIREMENT HEALTH CARE BENEFITS The Group has obligations to fund a portion of certain pensioners' and retiring employees' medical aid contributionsbased on the cost of benefits. The anticipated liabilities arising from these obligations have been actuarially determinedusing the project unit credit method, and a corresponding liability has been raised.
The liability is assessed periodically by an independent actuarial survey. This survey uses the following principalactuarial assumptions:
– a discount rate of 12 per cent, based on high quality corporate bonds;
– an increase in health care costs at a rate of 8,74 per cent.
The provisions raised in respect of post-retirement health care benefits amounted to R85 million (2001: R81 million) atthe end of the year. Of this amount, R4 million (2001: R10 million) was charged against income in the current year (referto note 11).
The liabilities raised based on present values of the post-retirement benefit, have been recognised in full. The actuarialvaluation was conducted at 31 July 2001. The liability for post-retirement health care benefits is not funded. Atretirement, members are given the choice to have an actuarially determined amount paid into their pension fund, tocover the expected cost of the post-retirement health cover, alternatively the Company will continue to fund the portionof the retiring employee’s medical aid contributions.
32. RELATED PARTY TRANSACTIONS Related party transactions can exist between subsidiaries and the holding company, fellow subsidiaries, associatedcompanies, joint ventures and key management personnel. A report on investments in subsidiaries, associatedcompanies and joint ventures, that indicates the relationship and degree of control exercised by the Company, appearson pages 79 to 80.
Transactions between the holding company, its subsidiaries, associated companies and joint ventures relate to fees,dividends, rents and interest and are regarded as inter-Group transactions and eliminated on consolidation.
Fees relating to specific capital projects are not eliminated as the underlying costs are capitalised to capital work-in-progress.
These transactions are concluded at arm's length and under terms and conditions that are no less favourable thanthose arranged with third parties. The volume of these transactions is insignificant in relation to the operatingtransactions of the Company and are concluded to effect internal policies and practices of the Company. There wereno material outstanding balances at the end of the year, as transactions with the Group companies are eliminated onconsolidation.
Group Company
2002 2001 2002 2001R m Rm R m Rm
Assmang Limited – Provison of services 7 14 5 7 47– Dividends – – 2 4 13 Chambishi Metals plc – Provision of services 1 4 16 2 6 31– Interest – – 4 8 38Nkomati Joint Venture – Provision of services 1 1 6 6
Transactions with directors relate to fees and share options and are disclosed in note 19 above.
77A
vm
in A
nn
ua
l R
ep
ort
20
02

Report on subsidiary companies
F O R T H E Y E A R E N D E D 3 0 J U N E 2 0 0 2
Company
2002 2001R m Rm
INVESTMENTSListed: market value R4 993 million (2001: R2 972 million) 1 462 1 552Unlisted 881 451
2 343 2 003Amounts owing by subsidiaries (refer note 4) 303 34Amounts owing to subsidiaries (refer note 14) (286) (295)
2 360 1 742
INCOME FROM SUBSIDIARIESDividends 2 9 13Interest 4 9 51Fees – management advisory services 7 7 53Fees – technical advisory services 7 31
162 148
MEMBERS' AGGREGATE INTEREST IN PROFITS AND LOSSES AFTERTAXATION OF SUBSIDIARIESProfits 123 149Losses 912 58
INDEBTEDNESS TO COMPANIES IN THE GROUPThe aggregate amount of indebtedness of subsidiaries to Anglovaal Mining Limited is:– included in investments 303 34– included in loans and long-term receivables 252 830– included in receivables 3 9
558 873
The aggregate amount of indebtedness of Anglovaal Mining Limited to its subsidiaries is:– included in payables 1 2– included in overdrafts and short-term borrowings 286 295
287 297
78A
vm
in A
nn
ua
l R
ep
ort
20
02

Principal subsidiary companies
A S AT 3 0 J U N E 2 0 0 2
Book value of the Company’sIssued Direct interest in interest
capital amount capital Shares Indebtednessby/(to)
2002 2001 2002 2001 2002 2001 2002 2001Name and nature of business Class R m Rm % % R m Rm R m Rm
Anglovaal Air (Proprietary) Limited– air charter operator Ord – – 100 100 8 9 89 (211) (213)Assmang Limited1.
– manganese and iron ore mining company and ferro-alloy producer Ord 2 2 5 0 50 261 261 – –
Atscot (Proprietary) Limited– investment Ord 1 1 100 100 1 0 10 (23) (23)Avgold Limited1
– gold producer Ord 7 7 5 6 61 1 201 1 291 – 1Avmin Limited– mining investment Ord 454 454 100 100 678 678 (17) (17)Bitcon’s Investments (Proprietary) Limited– investments Ord – – 100 100 2 2 (2) (2)Chambishi Marketing (Proprietary)Limited– marketing of metals Ord – – 100 100 – – – –Chambishi Metals plc2.
– cobalt and copper treatment Ord 339 339 9 0 90 – 305 2 1 16Jesdene Limited– share dealer Ord – – 100 100 – – 6 6Kingfisher Insurance Company Limited– insurance Ord – – 100 100 5 5 – –Lavino (Proprietary) Limited– investment Ord 1 1 100 100 3 3 (9) (11)Letaba Copper & Zinc Corporation Limited– prospecting Ord 1 1 9 4 94 – – – –Prieska Copper Mines Limited– investment Ord – – 9 7 97 – – – –Sheffield Minerals (Proprietary)Limited– investments Ord – – 100 100 – – – –South African Base Minerals Limited– investment Ord – – 100 100 – – – –Tasrose Investments (Proprietary) Limited Pref – – 100 100 2 4 24 – –– mining investment Ord – – 100 100 – – (24) (24)Two Rivers Platinum (Proprietary) Limited– platinum investment Ord 100 – 5 5 – 5 5 – 267 –Vallum Investments (Proprietary) Limited– investment Ord – – 100 100 – – – (3)Venetia Diamond Mines3 .
(Proprietary) Limited– share dealings Ord – – 100 100 – – – (2)Venture Building Trust(Proprietary) Limited– property owner Ord – – 100 100 1 2 12 1 0 12
Unless otherwise stated, all companies are incorporated and carry on their principal operations in the Republic of South Africa. Interests areshown to the extent that this information is considered material. A schedule with details of all other subsidiaries is available from theregistered office or the London secretaries of the Company.1. Listed companies2. Incorporated in Zambia3. Submitted for deregistration
79A
vm
in A
nn
ua
l R
ep
ort
20
02

80A
vm
in A
nn
ua
l R
ep
ort
20
02
Report on other investments
A S AT 3 0 J U N E 2 0 0 2
Group Company Group effectiveNumber of shares held Number of shares held percentage holding
Name of company 2002 2001 2002 2001 2002 2001
INVESTMENTS IN ASSOCIATED COMPANIES, JOINT VENTURES AND PARTNERSHIPS
ASSOCIATED COMPANIES UnlistedLucas Block Minerals LimitedOrdinary shares of R2 each 120 120 120 120 2 5 25ListedVillage Main Reef Gold Mining Company (1934) LimitedOrdinary shares of 12,5 cents each 2 292 500 2 292 500 2 292 500 2 292 500 3 8 38
JOINT VENTURES AND PARTNERSHIPSCato Ridge Alloys (Proprietary) Limited 19 400 19 400 – – 2 5 25Nkomati Joint Venture – – – – 7 5 75
INVESTMENTS IN OTHER COMPANIESListedAssore Limited 2 610 600 5 108 600 2 610 600 5 108 600Iscor Limited – 35 293 300 – 35 293 300Sub-Sahara Resources Limited*6 265 664 6 265 664 6 265 664 6 265 664
UnlistedOtterbea International (Proprietary) Limited 7 982 7 982 7 982 7 982Small Business Development Corporation 323 177 323 177 323 177 323 177TEBA Limited 2 208 5 687 – –
NotesInterests are shown to the extent that this information is considered material. A schedule with details of all other investments is available fromthe registered office or the London secretaries of the Company.* Incorporated in Australia
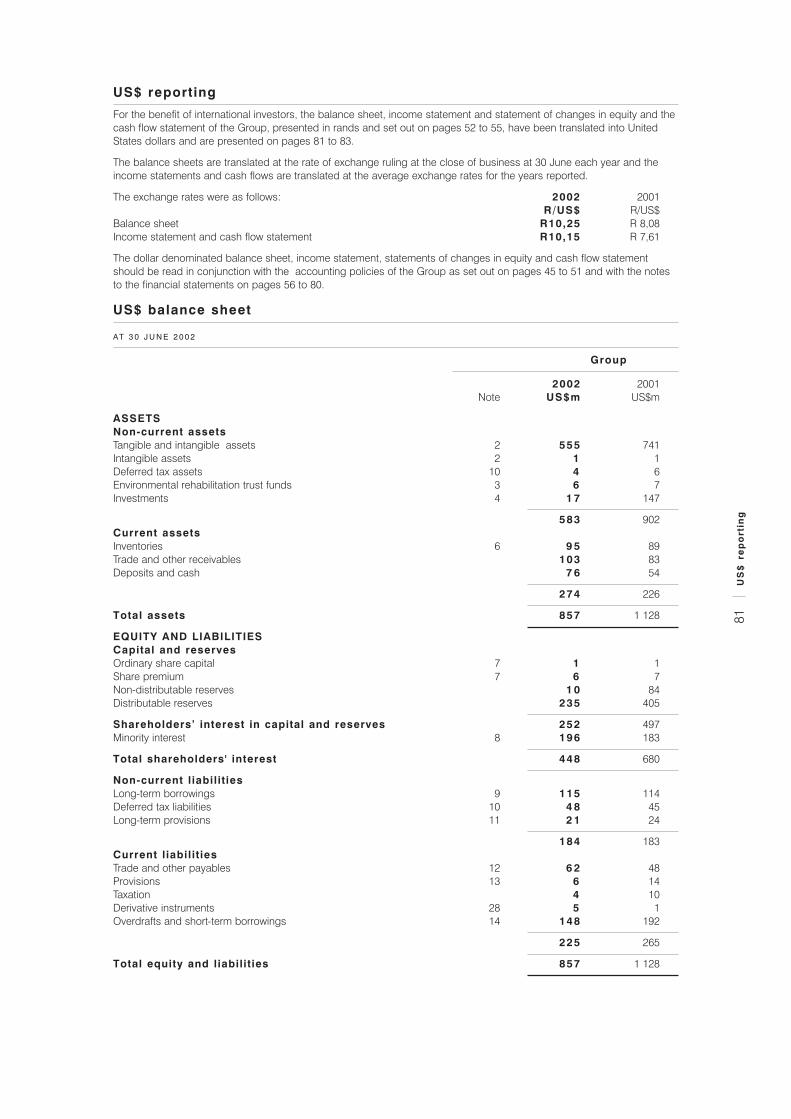
US$ balance sheet
AT 3 0 J U N E 2 0 0 2
Group
2002 2001Note US$m US$m
ASSETS Non-current assets Tangible and intangible assets 2 555 741 Intangible assets 2 1 1 Deferred tax assets 10 4 6 Environmental rehabilitation trust funds 3 6 7 Investments 4 1 7 147
583 902 Current assets Inventories 6 9 5 89 Trade and other receivables 103 83 Deposits and cash 7 6 54
274 226
Total assets 857 1 128
EQUITY AND LIABILITIES Capital and reserves Ordinary share capital 7 1 1 Share premium 7 6 7 Non-distributable reserves 1 0 84 Distributable reserves 235 405
Shareholders’ interest in capital and reserves 252 497 Minority interest 8 196 183
Total shareholders' interest 448 680
Non-current liabilities Long-term borrowings 9 115 114 Deferred tax liabilities 10 4 8 45 Long-term provisions 11 2 1 24
184 183 Current liabilit ies Trade and other payables 12 6 2 48 Provisions 13 6 14 Taxation 4 10 Derivative instruments 28 5 1 Overdrafts and short-term borrowings 14 148 192
225 265
Total equity and liabilities 857 1 128
81U
S$
rep
ort
ing
US$ reporting
For the benefit of international investors, the balance sheet, income statement and statement of changes in equity and thecash flow statement of the Group, presented in rands and set out on pages 52 to 55, have been translated into UnitedStates dollars and are presented on pages 81 to 83.
The balance sheets are translated at the rate of exchange ruling at the close of business at 30 June each year and theincome statements and cash flows are translated at the average exchange rates for the years reported.
The exchange rates were as follows: 2002 2001 R/US$ R/US$
Balance sheet R10,25 R 8,08 Income statement and cash flow statement R10,15 R 7,61
The dollar denominated balance sheet, income statement, statements of changes in equity and cash flow statementshould be read in conjunction with the accounting policies of the Group as set out on pages 45 to 51 and with the notesto the financial statements on pages 56 to 80.

Statement of changes in equity
F O R T H E Y E A R E N D E D 3 0 J U N E 2 0 0 2
Share Foreigncapital and currency Revaluation Retained
premium translation surplus Other profit TotalGroup US$m US$m US$m US$m US$m US$m
Balance at 30 June 2000 9 1 1 6 437 454 Foreign currency translation reserve (1) – – (1) (71) (73)Earnings – – – – 37 37 Revaluation of listed investment – – 79 – – 7 9Reallocation of reserves – – – (2) 2 –
Balance at 30 June 2001 as reported 8 1 80 3 405 497
Realignment of currencies (1) – (18) – (85) (104)Earnings – – – – (85) (85)Revaluation of listed investment – – 6 – – 6Disposal of listed investments – – (54) – – (54)Unrealised loss on currency
derivative contract – – – (3) – (3)Other – (5) – – – (5)
Balance at 30 June 2002 7 (4) 14 – 235 252
82U
S$
rep
ort
ing
US$ income statement
F O R T H E Y E A R E N D E D 3 0 J U N E 2 0 0 2
Group
2002 2001 Note US$m US$m
Revenue 15 399 369 Cost of sales 294 274
Gross profit 105 95 Other operating income 2 1 27 Other operating expenses 4 7 44
Profit from operations 16 7 9 78 Income from investments 17 5 14 Finance costs 1 6 17
Profit before taxation and exceptional items 6 8 75 Exceptional items 18 (107) –
Profit before taxation (39) 75 Taxation 20 3 1 22
Profit from ordinary activities (70) 53
Minority interest 1 6 16
Earnings (86) 37
Headline earnings 21 2 0 37
Basic earnings/(attributable loss) per share (cents) 22 (77) 34 Headline earnings per share (cents) 22 1 8 34 Fully diluted earnings per share (cents) 22 (76) 33 Fully diluted headline earnings per share (cents) 22 1 8 33 Number of shares in issue at end of year (thousands) 111 444 110 105 Weighted average number of shares in issue (thousands) 110 977 108 379 Weighted average number of shares used in calculating
fully diluted earnings per share (thousands) 22 112 367 112 073

83U
S$
rep
ort
ing
US$ cash flow statement
F O R T H E Y E A R E N D E D 3 0 J U N E 2 0 0 2
Group
2002 2001Note US$m US$m
CASH FLOW FROM OPERATING ACTIVITIES Cash receipts from customers 377 390 Cash paid to suppliers and employees 318 321
Cash generated from operations 23 5 9 69 Translation adjustment (11) (69)Interest received 5 14 Interest paid (16) (17)Dividends paid 24 (2) (161)Capital distribution – (223)Taxation paid 25 (19) (31)
Net cash inflow/(outflow) from operating activities 1 6 (418)
CASH FLOW FROM INVESTING ACTIVITIES Proceeds from sale of joint venture and subsidiaries 26 – 1 Additions to fixed assets to maintain operations (12) (38)Additions to fixed assets to expand operations (108) (236)Proceeds on disposal of fixed assets 1 – Proceeds on disposal of investments 99 2 Advances/(repayments) in investment loans and receivables – 1 Proceeds on dilution of interest in investments in subsidiaries – (65)Other investments acquired 14 –
Net cash (outflow) from investing activities (6) (335)
CASH FLOW FROM FINANCING ACTIVITIES Increase in shareholder funding 1 – Funding received from minority shareholders 26 24 Long-term borrowings raised 31 95 Long-term borrowings repaid (15) (1)(Decrease)/increase in short-term borrowings (31) 79 Decrease in treasury liabilities – (2)
Net cash in-flow from financing activities 12 195
Net increase/(decrease) in cash and cash equivalents 2 2 (558)Cash and cash equivalents at beginning of year 5 4 612
Cash and cash equivalents at end of year 76 54
Cash generated from operations per share (cents) 5 3 64

Shareholders’ analysis
3 0 J U N E 2 0 0 2
Number of Number ofHoldings shareholders % shares %
1 – 1 000 1 521 62,1 764 614 0,71 001 – 5 000 561 22,9 1 578 199 1,45 001 – 10 000 105 4,3 874 230 0,8
10 001 – 50 000 120 4,9 2 826 357 2,650 001 – 100 000 43 1,8 3 258 210 2,9
100 001 – 1 000 000 82 3,3 26 000 629 23,31 000 000 and over 16 0,7 76 141 413 68,3
2 448 100,0 111 443 652 100,0
Shareholders’ diary
Financial year end 30 JuneAnnual general meeting 8 November 2002
Report and profit statements PublishedHalf-yearly interim report March 2003Results and dividend announcement September 2003Annual financial statements issued October 2003
Annual dividend 2002 (refer to page 39) Declared nil Paid nil
84S
ha
reh
old
ers
’ a
na
lys
is a
nd
dia
ry

85A
dm
inis
tra
tio
n
Administration
Company
Anglovaal Mining LimitedRegistration number: 1933/004580/06Share code:
JSE Securities Exchange, South Africa – AINLondon Stock Exchange – AGM
ISIN ZAE000017141
Company secretary’s and registered office’s address
56 Main StreetJohannesburg, 2001South Africa
SHAREHOLDER ENQUIRIES
Transfer secretaries
Computershare Investor Services Limited70 Marshall StreetJohannesburg, 2001South Africa
Postal address
PO Box 1053Johannesburg, 2000South AfricaTelephone (+27 11) 370-5000Telefax (+27 11) 370-5271/2
London secretaries
St James’s Corporate Services Limited6 St James’s PlaceLondon SW1A 1NPUnited KingdomTelephone (020) 7499-3916Telefax (020) 7491-1989
United Kingdom share registrars
Capita IRG PlcBalfour House390/398 High RoadIlford, Essex IGI 1NQUnited Kingdom
Postal address
PO Box 62379Marshalltown, 2107South AfricaTelephone (+27 11) 634-9111Telefax (+27 11) 634-0503
Additional corporate information can be obtainedfrom Teboho Mahuma in the public relations andcommunications department at the postaladdress or telephone number shown above.
Alternatively, at the Company’swebsite:
http://www.avmin.co.za
Auditors
Ernst & Young
Bankers
FirstRand Bank LimitedNedbank LimitedThe Standard Bank of South Africa Limited
Sponsors
Deutsche Securities SA (Pty) Limited
CHANGE OF ADDRESS
Members are requested to notify any change ofaddress to:The Transfer SecretariesComputershare Investor Services LimitedPO Box 1053Johannesburg, 2000South Africa
or
The London SecretariesSt James’s Corporate Services Limited6 St James’s PlaceLondon SW1A 1NPUnited KingdomTelephone (020) 7499-3916Telefax (020) 7491-1989

Notice of annual general meeting
Notice is hereby given that the sixty-ninth annual general meeting of members of Anglovaal Mining Limited will be held at
14:00 on Friday, 8 November 2002 at the Company’s registered office, 56 Main Street, Johannesburg, South Africa, for the
following purposes:
1. To receive and consider the annual financial statements for the financial year ended 30 June 2002.
2. To elect the following directors in place of those who retire in accordance with the provisions of the Company’s articles
of association, and who, being eligible, offer themselves for re-election, namely Messrs RP Menell, DE Jowell,
BM Menell and Dr MZ Nkosi.
Refer next page – Footnotes – for directors’ curriculum vitae
3. To elect the following directors who were appointed as such since the last annual general meeting and who, being
eligible, offer themselves for election, namely Messrs DD Barber, PM Baum and BE Davison; and
Refer Footnotes for directors’ curriculum vitae
4. To consider and, if deemed fit, to pass, with or without modification, the following ordinary and special resolutions:
Ordinary resolution number 1
"Resolved that the rate at which the directors shall be paid out of the funds of the Company as remuneration for their
services fees as such be and is hereby increased from R70 000 to R75 000 per annum for the chairman and from
R40 000 to R43 000 per annum for each of the other directors, and directors’ meeting attendance fees be increased from
R4 375 to R5 250 per meeting for the chairman and from R2 500 to R3 000 per meeting for each of the other directors,
payable quarterly in arrears, with effect from 1 July 2002, until otherwise determined by the Company in general meeting."
Special resolution number 1"Resolved that the authorised 646 380 compulsorily convertible preference shares of 677,999777221 cents each in thecapital of the Company be and they are hereby cancelled and that the memorandum of association be and is herebyamended accordingly."
Special resolution number 2"Resolved that the ordinary share capital of the Company be and is hereby increased from R9 833 436,85 divided into196 668 737 ordinary shares of five cents each, to R15 000 000 divided into 300 000 000 ordinary shares of five centseach by the creation of 103 331 263 new ordinary shares of five cents each, ranking pari passu in every respect with theexisting ordinary shares of five cents each."
Special resolution number 3"Resolved that, subject to the passing and registration of special resolutions 1 and 2, the new memorandum ofassociation, a copy of which has been tabled at this meeting and initialled by the chairman of the meeting foridentification purposes, be and is hereby adopted as the memorandum of association of the Company in substitution forthe existing memorandum of association."
Special resolution number 4"Resolved that the new articles of association of the Company, a copy of which has been tabled at this meeting andinitialled by the Chairman for identification purposes, be and are hereby adopted as the articles of association of theCompany in substitution for the existing articles of association."
Reasons for and effect of Special ResolutionsThe reason for special resolution number 1 is to reduce the Company’s authorised share capital by an amount equal tothe value of the compulsorily convertible preference shares being cancelled. The effect of special resolution number 1is to reduce the Company’s authorised share capital and to amend the Company’s memorandum of associationaccordingly.
The reason for special resolution number 2 is to increase the Company’s authorised share capital by an amount equalto the value of the ordinary shares being created. The effect of special resolution number 2 is to increase the Company’sauthorised share capital and to amend the Company’s memorandum of association accordingly.
The reason for special resolution number 3 is to provide the Company with a memorandum of association that is up to dateand correctly sets out the main business which the Company is to carry on and the main object of the Company. The effectof special resolution number 3 is to substitute the existing memorandum of association of the Company in its entirety.
86N
oti
ce
of
an
nu
al
ge
ne
ral
me
eti
ng

87N
oti
ce
of
an
nu
al
ge
ne
ral
me
eti
ng
Notice of annual general meeting (continued)
The reason for special resolution number 4 is to provide the Company with articles of association that are up to date, toauthorise the Company to make payments to its shareholders (including distributing any amounts standing to the creditof or dealing with its share capital, stated capital or share premium accounts, its reserves or its capital redemption reservefund), to provide for the directors to raise or borrow such sums as they think fit (without limitation) and, generally, forbeneficial holders of securities, uncertificated securities and the settlement of uncertificated securities transactionsthrough the STRATE system on the JSE Securities Exchange, South Africa, and to provide for the electroniccommunication of information to its shareholders by the Company and to the Company by its shareholders and directors.
A draft of the new memorandum and articles of association may be inspected at the registered offices of the Company, 56 Main Street, Johannesburg, South Africa, or at the London secretaries of the Company, St James’s Corporate ServicesLimited, 6 St James’s Place, London SW1A 1NP, England, during usual business hours on any day (excluding Saturdays,Sundays and public holidays) prior to the time fixed for the holding of the annual general meeting.
5 To transact such other business as may be transacted at an annual general meeting.
Voting and ProxiesEach shareholder of the Company who is registered as such and who, being an individual, is present in person or byproxy or which, being a company, is represented at the annual general meeting is entitled to one vote on a show of hands.
On a poll, each shareholder present in person or by proxy or represented shall have one vote for every share held bysuch shareholder.
Footnotes
Directors retiring by rotation and are seeking re-electionRichard Peter Menell, MA, MSc (47). Chairman of the board of directors, a director of the Company since September1994. Board committee membership: Audit, environmental, remuneration, risk and nominations.
Donn Edward Jowell, BCom, LLB (61). Chairman: Jowell, Glyn & Marais Inc. An independent non-executive directorappointed during January 1999. Board committee membership: Audit, environmental (chairman), nomination and risk(chairman).
Brian Michael Menell, BA (Hons) (37). Director of companies. Appointed to the board during September 1998. Previouslyan executive director of Avmin; currently a non-executive director. Member of environmental committee.
Dr Morley Zebulon Nkosi, PhD (Economics), MBA, BS (Economics) (67). Chairman: National Institute of Economic Policy.An independent non-executive director of the Company since December 1998. A member of the audit, environmentaland nominations committees.
Confirmation of appointments of directors appointed since the last annual general meetingDavid Duncan Barber, FCA (England and Wales), AMP (Harvard) (50). Financial director: Anglo American Corporation ofSouth Africa Limited. Co-opted onto the board during April 2002. A non-executive director and is a member of the auditcommittee.
Philip Michael Baum, BCom, LLB, H Dip (Tax Law) (47). Chief operating officer, Anglo American Corporation of SouthAfrica Limited. Appointed to the board during April 2002 as a non-executive director. Serves on the nominations and riskcommittees as a member.
Barry Erskine Davison, BA (Wits) (57). Executive director of Anglo American plc and executive chairman of AngloAmerican Platinum Corporation Limited. Joined the Avmin board during April 2002 as a non-executive director. He is amember of the remuneration committee.
Notice of annual general meeting (continued)
Certificated shareholders/dematerialised shareholders with own name registrations.Shareholders who have not yet dematerialised their shares or who have dematerialised their shares with own nameregistration (entitled shareholders) may appoint one or more proxies to attend, speak and vote or abstain from voting in suchshareholders’ stead. The person so appointed need not be a member of the Company. A form of proxy is attached for theuse of those entitled shareholders who wish to be so represented. Such entitled shareholders should complete the attachedform of proxy in accordance with the instructions contained therein and return it to the registered office of the Company,namely 56 Main Street, Johannesburg, 2001, South Africa, (PO Box 62379, Marshalltown, 2107, South Africa) or thetransfer secretaries, Computershare Investor Services Limited, 70 Marshall Street, Johannesburg 2001, South Africa(PO Box 1053, Johannesburg 2000, South Africa) or United Kingdom share registrars, Capita IRG Plc, BalfourH o u s e ,390/398 High Road, Illford, Essex, England IGI 1NQ, to be received by 14:00 on Wednesday, 6 November 2002.
Dematerialised shareholdersShareholders who have dematerialised their shares (other than those with own name registrations) should provide theirCentral Securities Depository Participant (CSDP) or broker with their voting instructions in terms of the custody agreemententered into with the relevant CSDP or broker. Should such shareholders wish to attend the annual general meeting or senda proxy to represent them at the annual general meeting, they should inform their CSDP or broker timeously and requesttheir CSDP or broker to issue them with the necessary authorisation to attend.
By order of the board
RH Phill ipsGroup company secretary
Johannesburg27 September 2002
88N
oti
ce
of
an
nu
al
ge
ne
ral
me
eti
ng
Printed by Ince (Pty) Ltd

Fo
rm o
f p
rox
y
Form of proxy
Shareholders who have dematerialised their shares (other than those with own name registrations) should provide theirCentral Securities Depository Participant (CSDP) or broker with their voting instructions in terms of the custody agreemententered into with their relevant CSDP or broker. Should such shareholders wish to attend the annual general meeting ofAnglovaal Mining Limited (the Company), they should inform their CSDP or broker timeously and request their CSDP orbroker to issue them with the necessary authorisation to attend.
FOR COMPLETION BY SHAREHOLDERS WHO HAVE NOT YET DEMATERIALISED THEIR SHARESOR WHO HAVE DEMATERIALISED THEIR SHARES WITH OWN NAME REGISTRATION
Shareholders who have not yet dematerialised their shares or who have dematerialised their shares with own nameregistration (entitled shareholders) may appoint one or more proxies to attend, speak and vote or to abstain from voting insuch shareholder’s stead. The person so appointed need not be a member of the Company. This form of proxy is for theuse of those entitled members who wish to be so represented. Such entitled shareholders should complete this form ofproxy in accordance with the instructions contained herein and return it to the registered office or the transfer secretariesor the United Kingdom share registrars of the Company, to be received by the time and date stipulated herein.
If you are unable to attend the sixty-ninth annual general meeting of shareholders of Anglovaal Mining Limited convenedfor Friday, 8 November 2002 at 14:00, you should complete and return this form of proxy as soon as possible, but in anyevent to be received by not later than 14:00 on Wednesday, 6 November 2002.
I/We (name in block letters)
of (address)
being the holder of shares in the issued share capital of Anglovaal Mining Limited, do hereby appoint
or failing him/her,
or failing him/her, the chairman of the Company, or failing him/her the chairman of the meeting, as my/our proxy to vote forme/us and on my/our behalf at the annual general meeting of the Company to be held at 14:00 on Friday, 8 November2002 and at any adjournment thereof and in particular in respect of the following resolutions:
*Indicate with an X in the spaces below how votes are to be cast. Unless otherwise directed, the proxy will vote or abstainas he thinks fit in respect of the member’s holding.
Resolutions For Against Abstain
1 To re-elect the following directors, who retire by rotation:RP Menell
DE Jowell
BM Menell
Dr MZ Nkosi
2 To confirm the appointments of the following directors made during the year:DD Barber
PM Baum
BE Davison
3 Ordinary resolution number 1:To increase directors’ fees.
4 Special resolution number 1:To cancel the compulsorily convertible preference shares authorisedshare capital.
5 Special resolution number 2:To increase the authorised share capital: Ordinary share capital.
6 Special resolution number 3:To adopt a new memorandum of association.
7 Special resolution number 4:To adopt new articles of association.
Unless this section is completed for a lesser number, the Company is authorised to insertin the said section the total number of shares registered in my/our name(s) one businessday before the meeting.
Signed at on 2002
Signature
Assisted by me (where applicable)
Please see notes overleaf
Number of shares

Instructions on signing and lodging forms of proxy
Please read the notes below:
1. The completion and lodging of this form of proxy will not preclude the entitled member who grants this proxy fromattending the meeting and speaking and voting in person thereat to the exclusion of any proxy appointed in termshereof should he or she wish to do so.
2. Every member present in person or represented by proxy and entitled to vote shall, on a show of hands, have onlyone vote and upon a poll every member shall have a vote for every ordinary share held.
3. You may insert the name of any person(s) whom you wish to appoint as your proxy in the blank space(s) provided forthat purpose. The person whose name appears first on the form of proxy and who is present at this meeting will beentitled to act as proxy to the exclusion of those whose names follow.
4. When there are joint holders of shares, only that holder whose name appears in the register need sign this form ofproxy.
5. If the form of proxy is signed under the authority of a power of attorney or on behalf of a company or any other juristicperson, then it must be accompanied by such power of attorney or a certified copy of the relevant enabling resolutionor other authority of such company or other juristic person, unless proof of such authority has been recorded by theCompany.
6. A deletion of any printed matter and the completion of any blank spaces need not be signed or initialled. Anyalteration must be signed, not initialled.
7. The chairman of the meeting may, in his absolute discretion, reject any form of proxy which is completed other thanin accordance with these instructions.
8. Forms of proxy, powers of attorney or any other authority appointing a proxy shall be deposited at the registeredoff ice of the Company, 56 Main Street, Johannesburg 2001 South Africa (or posted to PO Box 62379, Marshalltown2107 South Africa), or at the transfer secretaries, Computershare Investor Services Limited, 70 Marshall Street,Johannesburg 2001 South Africa (or posted to PO Box 1053, Johannesburg 2000 South Africa) or the UnitedKingdom share registrars, Capita IRG Plc, Balfour House, 390/398 High Road, Illford, Essex, England IGI INQ,so as to be received not later than 14:00 on Wednesday, 6 November 2002 (in respect of the meeting) or 48 hours,excluding Saturdays, Sundays and public holidays, before the time appointed for holding of any adjourned meeting.
9. No form of proxy shall be valid after the expiration of six months from the date when it was signed except at anadjourned meeting in cases where the meeting was originally held within six months from the aforesaid date.
Fo
rm o
f p
rox
y


M I N I N GA N G L O V A A L
www.avmin.co.za