www.transman.hu modelling the impacts of road pricing in budapest transman consulting for transport...
Post on 22-Dec-2015
221 views
TRANSCRIPT

www.transman.hu
MODELLING THE IMPACTS OFMODELLING THE IMPACTS OFROAD PRICING IN ROAD PRICING IN BUDAPESTBUDAPEST
TRANSMANTRANSMANConsulting for Transport System Management Ltd.Consulting for Transport System Management Ltd.1051 Budapest Hercegprimas u. 10.Tel.: +36-1-353-1484 Fax: +36-1-311-0265E-mail: [email protected]: http://www.transman.hu
Dr. habil Janos MONIGL
Zsolt BERKI
IMPRINT SeminarIMPRINT Seminar
BudapestBudapest
19 April 202319 April 2023

2www.transman.hu
Scope of the investigationScope of the investigation
Within EUROPRICE (Energy Efficiency of Urban Road Pricing Investigation in Capitals of Europe)
Project leader Trinity College Dublin for EC DG XVII.
London, Dublin, Athens, Budapest Impact assessment of Road Pricing in Budapest
- a Case Study Energy savings because of pricing?
Congestion, air pollution – more important
3www.transman.hu
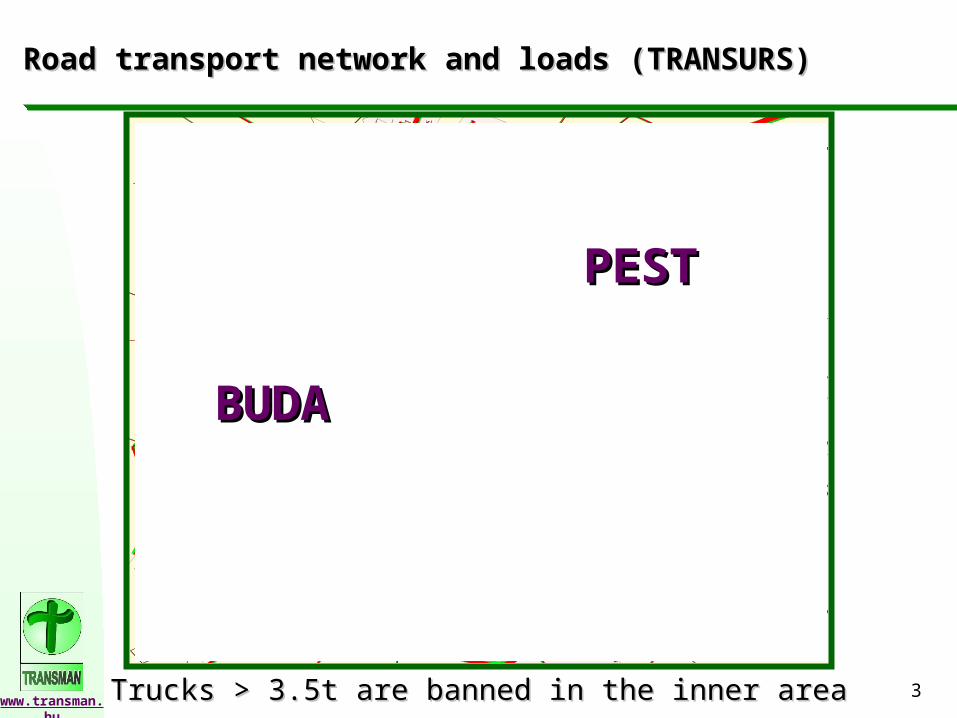
Road transport network and loadsRoad transport network and loads (TRANSURS) (TRANSURS)
BUDABUDA
PESTPEST
Trucks > 3.5t are banned in the inner areaTrucks > 3.5t are banned in the inner area

4www.transman.hu
Public transport network and loadsPublic transport network and loads (TRANSURS) (TRANSURS)
1,4 billion passengers/year - Decrease1,4 billion passengers/year - Decrease

5www.transman.hu
Car trips to the city by trip origin, purpose and Car trips to the city by trip origin, purpose and leaving trip destinationleaving trip destination
0
5000
10000
15000
20000
25000
30000
Wor
k
Sch
ool
Bu
sin
ess
Sh
opp
ing
Oth
ers
Wor
k
Sch
ool
Bu
sin
ess
Sh
opp
ing
Oth
ers
Wor
k
Sch
ool
Bu
sin
ess
Sh
opp
ing
Oth
ers
Other destination
Home destination
Trips with home origin Trips with other origin Together
32%
68%
36%64%
39%61%
14%86%
32%68%
47%53%
60%40%
44%56% 28%
72%36%64%
35%
65%
56%44%
42%58%
41%59%
35%65%
leaving to home destination
leaving to other destination
Modal split „local”: PT vs car (60%:40%)Modal split „local”: PT vs car (60%:40%)
6www.transman.hu
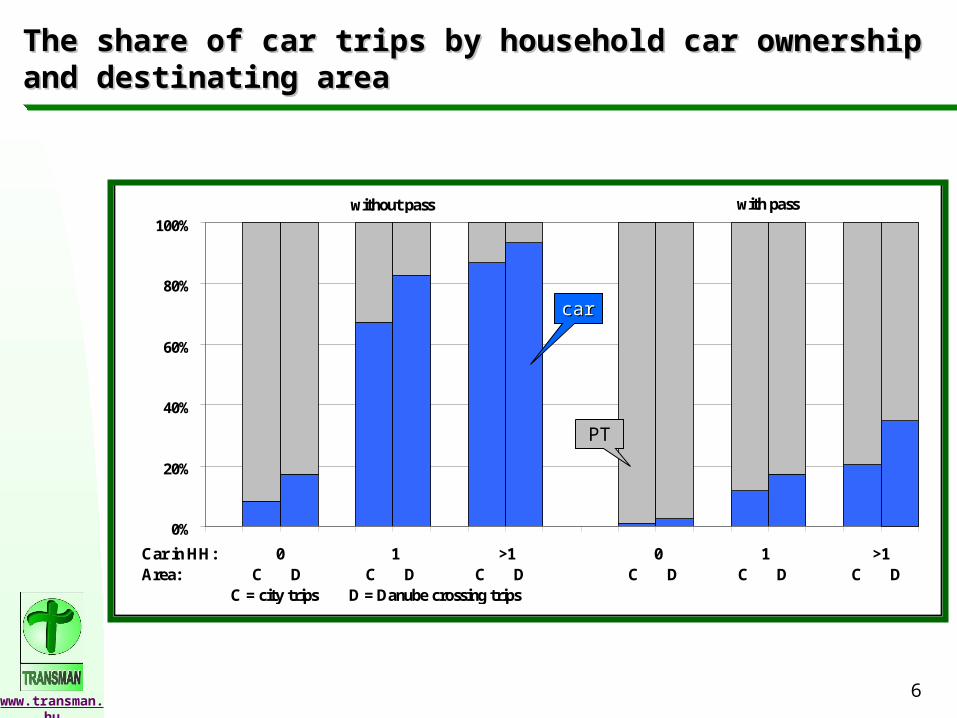
The share of car trips by household car ownership The share of car trips by household car ownership and destinand destinatating area ing area
0%
20%
40%
60%
80%
100%
0 0 1 >1 >1 0 0 1 >1 >1Car in HH: 0 1 >1 0 1 >1Area: C D C D C D C D C D C D
C = city trips D = Danube crossing trips
without pass with pass
PTPT
carcar

7www.transman.hu
Inbound passenger traffic to Budapest by modesInbound passenger traffic to Budapest by modes
Modal split inbound: PT vs car (40%:60%)Modal split inbound: PT vs car (40%:60%)

8www.transman.hu
Development tendencies of car traffic and public Development tendencies of car traffic and public transport in Budapesttransport in Budapest
19901991
19921993
19941995
19961997
19981999
20002001
100,0 105,0104,5 107,7
124,1
118,1
115,0128,9
117,9
133,0
158,7 165,7
100,0 103,4 109,1 113,4 117,9 120,7120,6
123,1
114,5113,5 118,5 122,7
100,0100,3
100,198,5
93,4
87,3
82,381,7
80,779,8
78,478,5
100,0
96,0
87,887,2 90,7
90,1
85,784,1
82,582,9
84,684,7
70,0
80,0
90,0
100,0
110,0
120,0
130,0
140,0
150,0
160,0
170,0
%
Year
BKV Passenger Number
BKV Place Kilometre
Number of Cars (BP)
Traffic Over the Danube Bridges

9www.transman.hu
Budapest Transport System Development Plan: Reducing demand for transport by improved land use management; Improving traffic organisation and management; Mitigating the environmental impacts of transport activity; Minimising costs and improving the efficiency of the transport system.
Transport policy implications Transport policy implications
Is pricing a tool to meet the goals?Is pricing a tool to meet the goals?

10www.transman.hu
Area related indicators for the inner cityArea related indicators for the inner city
Area related indicators
0,00%
2,00%
4,00%
6,00%
8,00%
10,00%
12,00%
14,00%
area traffic time fuel air
0,00%
2,00%
4,00%
6,00%
8,00%
10,00%
12,00%
14,00%
basescenario 2
11www.transman.hu
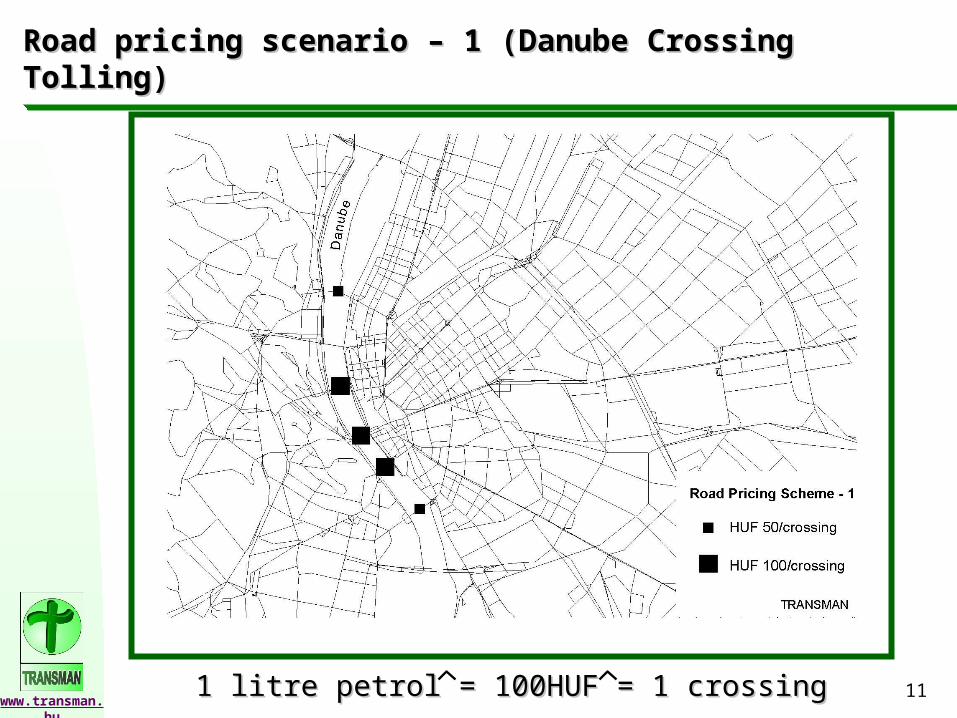
Road pricing scenarioRoad pricing scenario –– 11 ( (Danube Crossing TollingDanube Crossing Tolling))
1 litre petrol = 100HUF = 1 crossing1 litre petrol = 100HUF = 1 crossing
12www.transman.hu
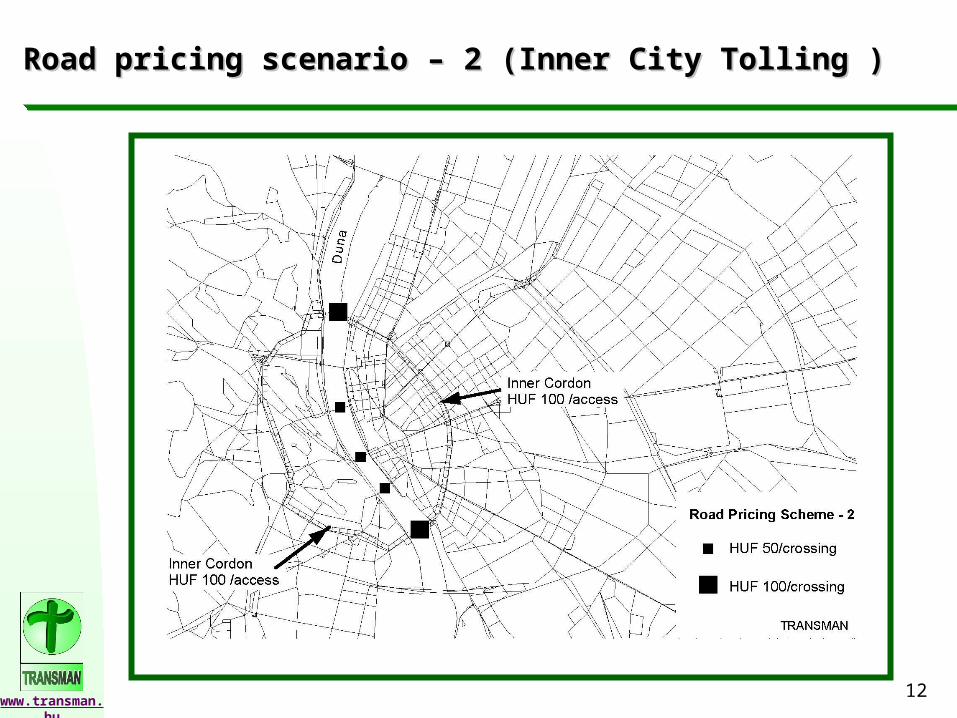
Road pricing scenarioRoad pricing scenario –– 2 ( 2 (Inner City TollingInner City Tolling ) )
13www.transman.hu
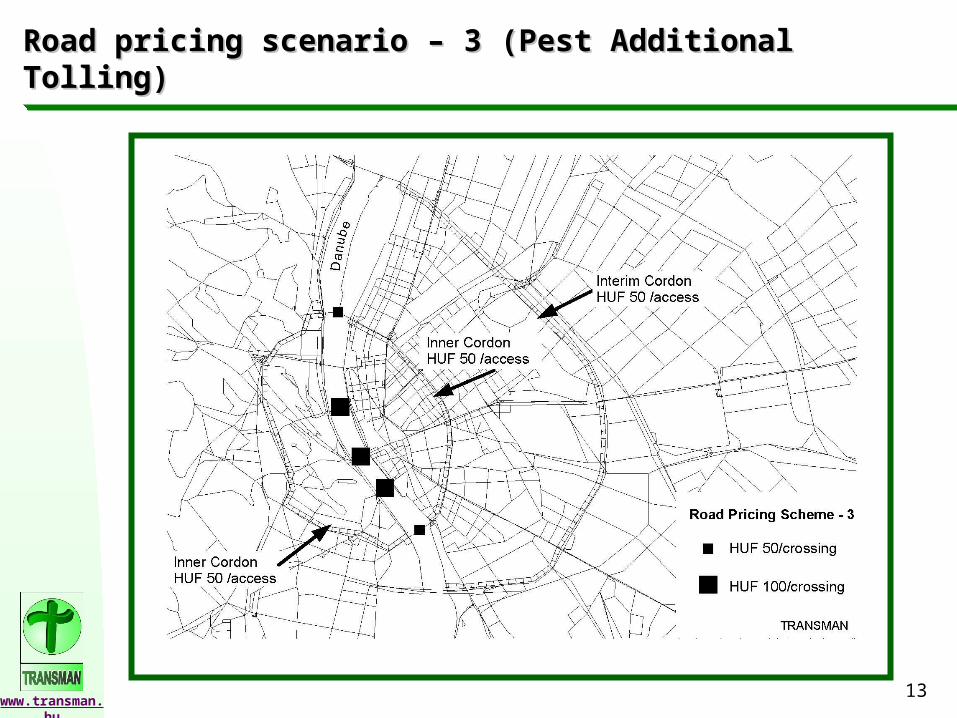
Road pricing scenarioRoad pricing scenario –– 3 ( 3 (Pest Pest AdditionalAdditional Tolling Tolling))

14www.transman.hu
Modelling by Modelling by TRANSURS modelTRANSURS model

15www.transman.hu
Modelling work - Modelling work - TRANSURS modelTRANSURS model
Trip generation:trip rateswith „location potential” dependency
Trip distribution: two stagesarea choice (logsum)zonal distribution (gravity)
Modal splitlogit by person group, by activity, car availability,pass ownership, trip purpose (chain)
Assignment: equilibrium Impact calculation by speed and volumes
for time, fuel, air pollution, etc.
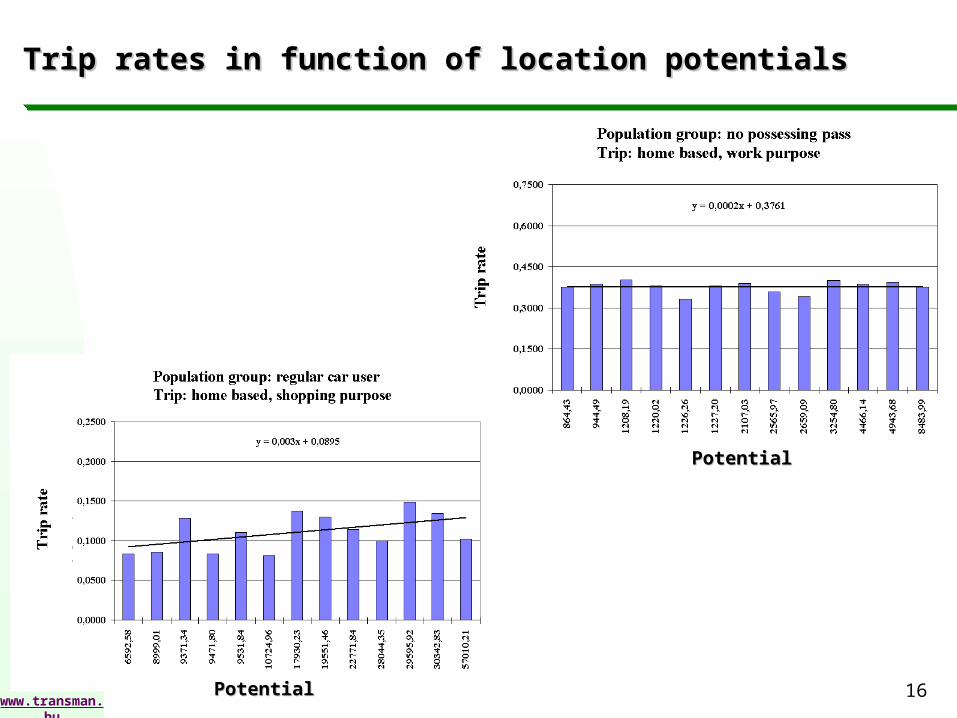
16www.transman.hu
Trip rates in function of location potentialsTrip rates in function of location potentials
PotentialPotential
PotentialPotential
17www.transman.hu
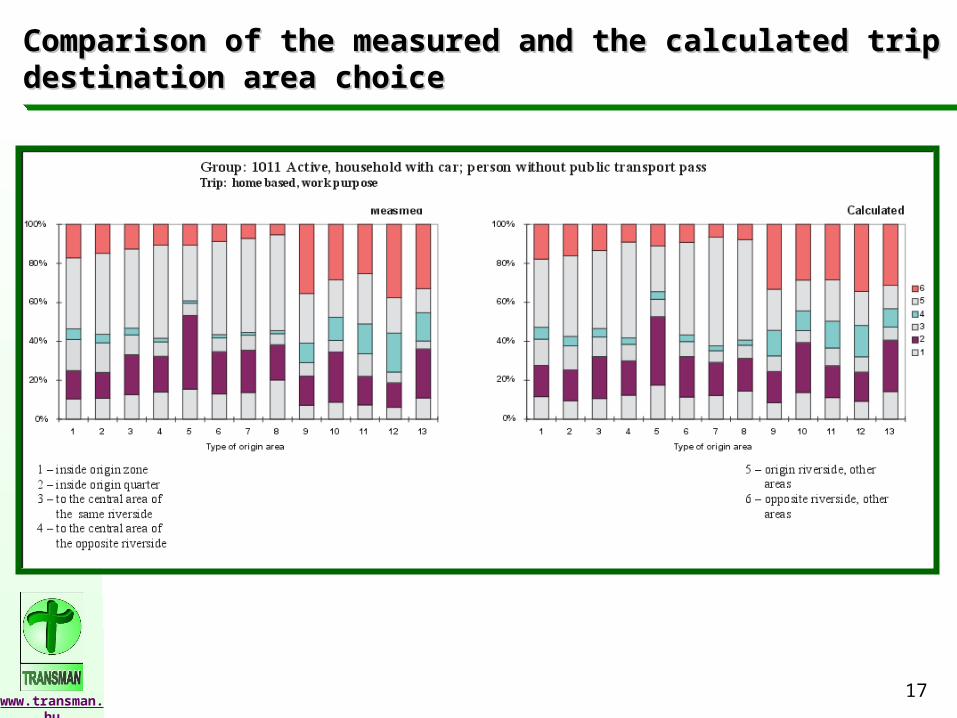
Comparison of the measured and the calculated trip Comparison of the measured and the calculated trip ddestination area choiceestination area choice

18www.transman.hu
Comparison of the measured and the calculated Comparison of the measured and the calculated mode choicemode choice

19www.transman.hu
Deterrence functionsDeterrence functions

20www.transman.hu
Traffic load difference map of road pricing Scenario2Traffic load difference map of road pricing Scenario2
increaseincrease
decreasedecrease
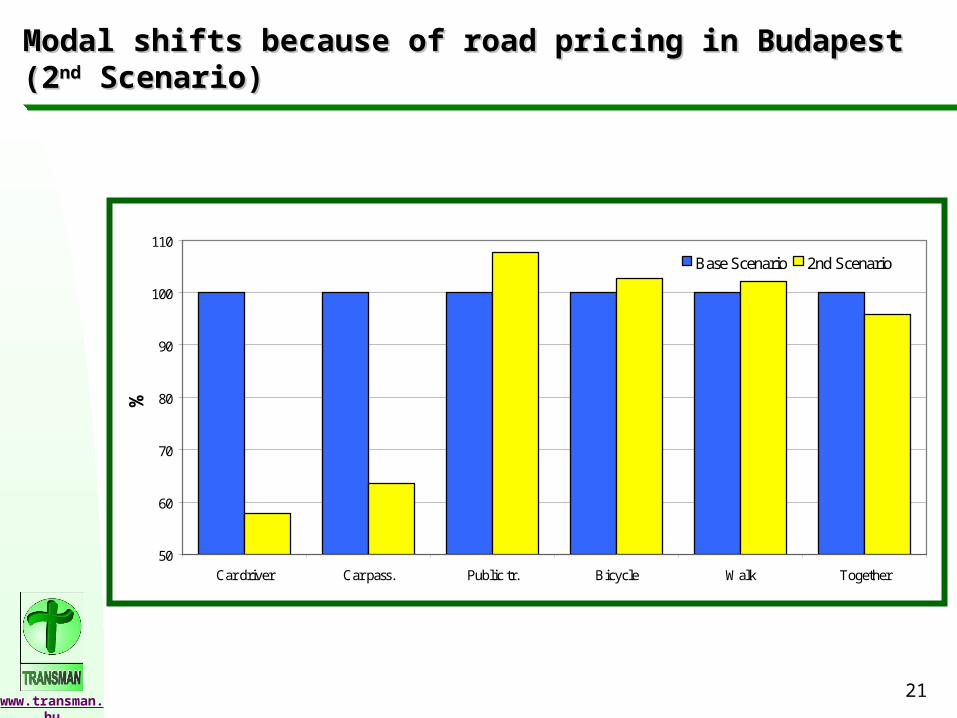
21www.transman.hu
Modal shifts because of road pricing in BudapestModal shifts because of road pricing in Budapest(2(2ndnd Scenario) Scenario)
50
60
70
80
90
100
110
Car driver Car pass. Public tr. Bicycle Walk Together
%
Base Scenario 2nd Scenario

22www.transman.hu
Impacts of road pricing in Budapest (2Impacts of road pricing in Budapest (2ndnd Scenario) Scenario)
30
40
50
60
70
80
90
100
110
Destining tr. Performance Time Fuel NOx
%
Inner area Entire Bp.Base Scenario

23www.transman.hu
Area related indicators for the inner cityArea related indicators for the inner city
Area related indicators
0,00%
2,00%
4,00%
6,00%
8,00%
10,00%
12,00%
14,00%
area traffic time fuel air
0,00%
2,00%
4,00%
6,00%
8,00%
10,00%
12,00%
14,00%
basescenario 2

24www.transman.hu
Main model results – Scenario 2Main model results – Scenario 2
Origin/destination trips: in inner area –4% Shifts in transport modes
cars –40%, public transport +8%, bike +3%, walk +2% Changes in the inner city/whole city:
traffic performance (-48%/0%)transport time (-65%/+1%)fuel consumption (-54%/-1%)NOX emission (-31%/+3%)
Traffic reassignment from the inner bridges to Lágymányosi bridge (south) Árpád bridge (north)
Annual toll-box revenue: HUF 7,2 billion/year (1995)
28 million EUR/year

25www.transman.hu
Network wide impacts of the road pricing scenariosNetwork wide impacts of the road pricing scenarios
Road traffic Time Fuel Air Toll Morning peak Daily Morning peak Daily public tr. car consumption consumption pollution revenue
trip/h trip/d trip/h trip/d % % carkm/d carhour/day l/day NO x HUF/daythousands petrol wkg*/day
Base scenarioInner area 72619 695418 122469 699437 70,8 29,2 1162,3 61960 115070 3390
% 100 100 100 100 100,0 100,0 100,0 100,0 100,0 100,0Interim area 98050 734918 113250 738851 65,8 34,2 1782,2 98820 173920 5730
% 100 100 100 100 100,0 100,0 100,0 100,0 100,0 100,0Other area 508836 3175274 443786 3167321 60,6 39,4 12748,1 354580 903060 44230
% 100 100 100 100 100,0 100,0 100,0 100,0 100,0 100,0Budapest Total 679505 4605609 679505 4605609 63,0 37,0 15692,6 515360 1192050 53350 0
% 100 100 100 100 100,0 100,0 100,0 100,0 100,0 100,0Scenario 1Inner area 72585 696714 122356 700681 72,9 29,1 968,9 48370 94080 3110
% 100,0 100,2 99,9 100,2 103,0 99,7 83,4 78,1 81,8 91,7Interim area 97784 730019 112141 733852 66,8 33,2 1785,1 99350 174430 5900
% 99,7 99,3 99,0 99,3 101,5 97,1 100,2 100,5 100,3 103,0Other area 508931 3178705 444803 3170904 60,7 39,3 13172,8 386210 940750 46060
% 100,0 100,1 100,2 100,1 100,2 99,7 103,3 108,9 104,2 104,1Budapest Total 679300 4605437 679300 4605437 63,6 36,4 15926,8 533930 1209260 55070 9 897 900
% 100,0 100,0 100,0 100,0 101,0 98,4 101,5 103,6 101,4 103,2Scenario 2Inner area 71503 668933 115359 670638 81,6 18,4 602,4 21670 53370 2350
% 98,5 96,2 94,2 95,9 115,3 63,0 51,8 35,0 46,4 69,3Interim area 97653 729838 112255 733945 67,1 32,9 1795,0 102840 177590 5970
% 99,6 99,3 99,1 99,3 102,0 96,2 100,7 104,1 102,1 104,2Other area 509695 3205913 451237 3200101 60,4 39,6 13313,8 395140 950150 46360
% 100,2 101,0 101,7 101,0 99,7 100,5 104,4 111,4 105,2 104,8Budapest Total 678851 4604684 678851 4604684 64,6 35,4 15711,2 519650 1181110 54680 23 859 200
% 99,9 100,0 99,9 100,0 102,5 95,7 100,1 100,8 99,1 102,5Scenario 3Inner area 71834 674491 116885 676867 79,4 20,6 640,9 27850 60020 2410
% 98,9 97,0 95,4 96,8 112,1 70,5 55,1 44,9 52,2 71,1Interim area 97738 730753 112365 734396 68,1 31,9 1705,5 95500 167710 5700
% 99,7 99,4 99,2 99,4 103,5 93,3 95,7 96,6 96,4 99,5Other area 509337 3199745 449659 3193725 60,8 39,2 13364,2 392870 955650 46250
% 100,1 100,8 101,3 100,8 100,3 99,5 104,8 110,8 105,8 104,6Budapest Total 678910 4604989 678910 4604989 64,7 35,3 15710,6 516220 1183380 54360 26 002 350
% 99,9 100,0 99,9 100,0 102,7 95,4 100,1 100,2 99,3 101,9*Weighting according to imposed area type by network sections
0riginating trips Destinating trips Modal split (day)
Sum of network wide effects

26www.transman.hu
Theoretic Theoretic Marginal Cost Marginal Cost Proportional Proportional Road Pricing Road Pricing Scheme by Scheme by Area and Daily Area and Daily Time Period Time Period Using Paper Using Paper VignettesVignettes
Inner area
Interim area
Outer area
Vignettes
Daily (1)Weekly (6)Monthly (22)Quarterly (60)Yearly (220)
Regis-trationplateNr.
Daily Validity VignetteReimbursement by area of
registrationArea ofvalidity
time period form &colour
unit/piece inner area interimarea
other area
peak06-1015-19
10 6 2 -Inner area
off peak 10-15 6 6 2 -
peak06-1015-19
4 - 2 -Interim area
off peak 10-15 2 - 2 -
peak06-1015-19
- - - - -Outer area
off peak 10-15 - - - - -