www.viasimcorp.com slide 1 archived file the file below has been archived for historical reference...
TRANSCRIPT

www.viasimcorp.com Slide 1
Archived File
The file below has been archived for historical reference purposes only. The content and links are no longer maintained and may be outdated. See the OER Public Archive Home Page for
more details about archived files.

www.viasimcorp.com Slide 2
PI Aging Simulation Model
www.viasimcorp.com Slide 3
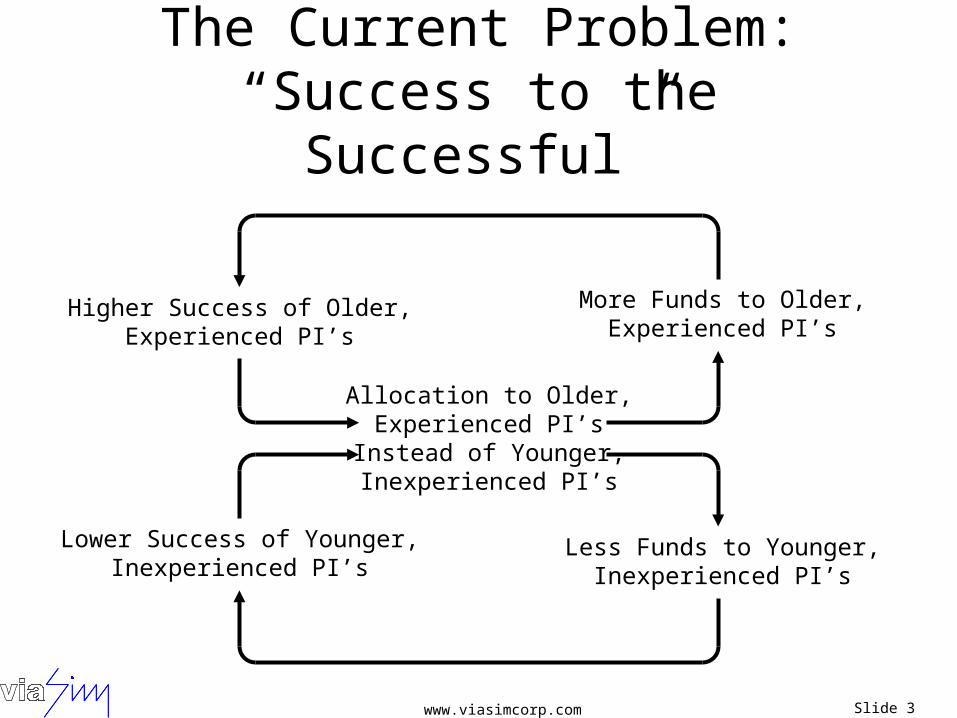
The Current Problem:“Success to the Successful”
More Funds to Older,Experienced PI’s
Allocation to Older,Experienced PI’s
Instead of Younger,Inexperienced PI’s
Lower Success of Younger,Inexperienced PI’s
Less Funds to Younger,Inexperienced PI’s
Higher Success of Older,Experienced PI’s

www.viasimcorp.com Slide 4
Basic Structure for Age Group
PIs in the system that have “aged” enough to move to the next age group.
New PIs (i.e., first-time) that enter the NIH pool in this age group.
PIs of this age group that leave the “system.”
Represents the number of PIs in the total pool that are in this age group.
PIs in the system that have “aged” enough to move into this age group.
www.viasimcorp.com Slide 5
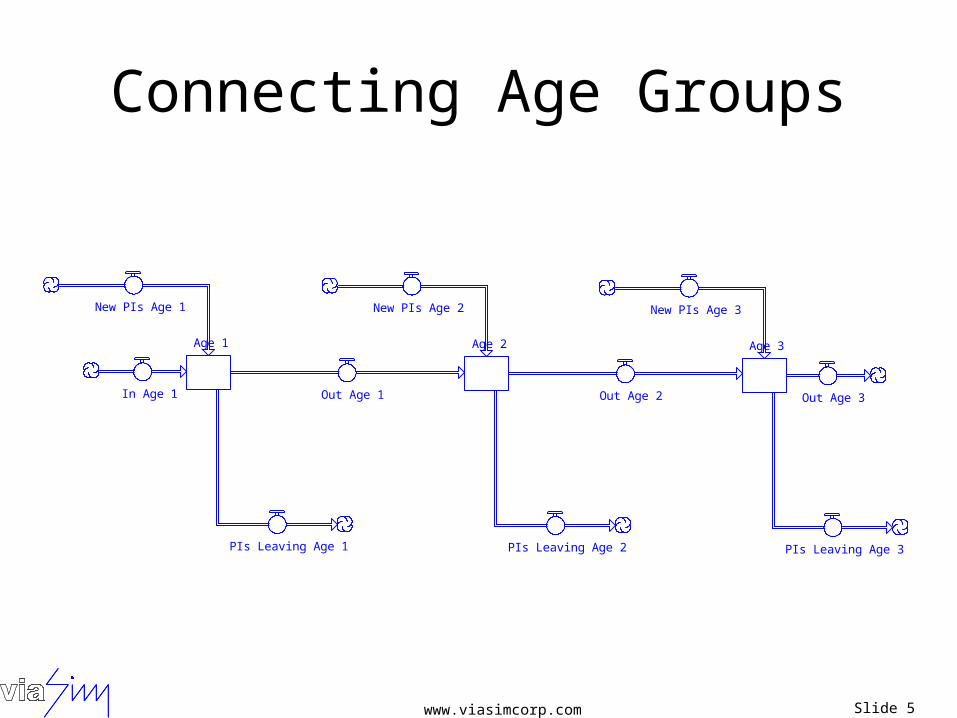
Connecting Age Groups
Age 1
In Age 1 Out Age 1
PIs Leaving Age 1
New PIs Age 1
Age 2
Out Age 2
PIs Leaving Age 2
New PIs Age 2
Age 3
Out Age 3
PIs Leaving Age 3
New PIs Age 3
www.viasimcorp.com Slide 6
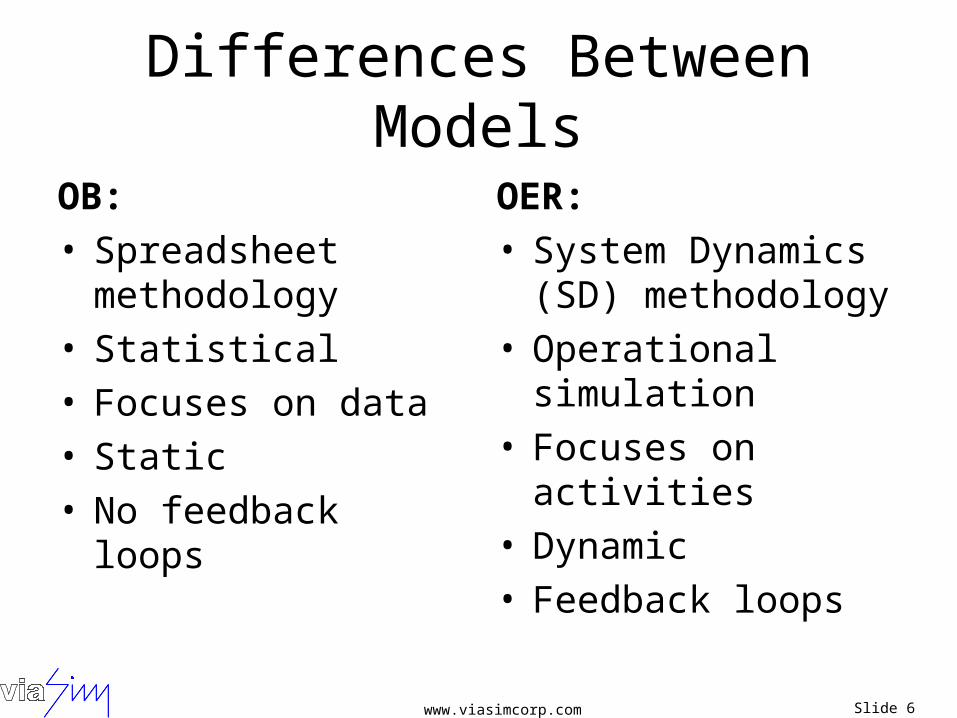
Differences Between Models
OB:• Spreadsheet
methodology• Statistical• Focuses on data• Static• No feedback loops
OER:• System Dynamics
(SD) methodology• Operational simulation• Focuses on activities• Dynamic• Feedback loops
www.viasimcorp.com Slide 7
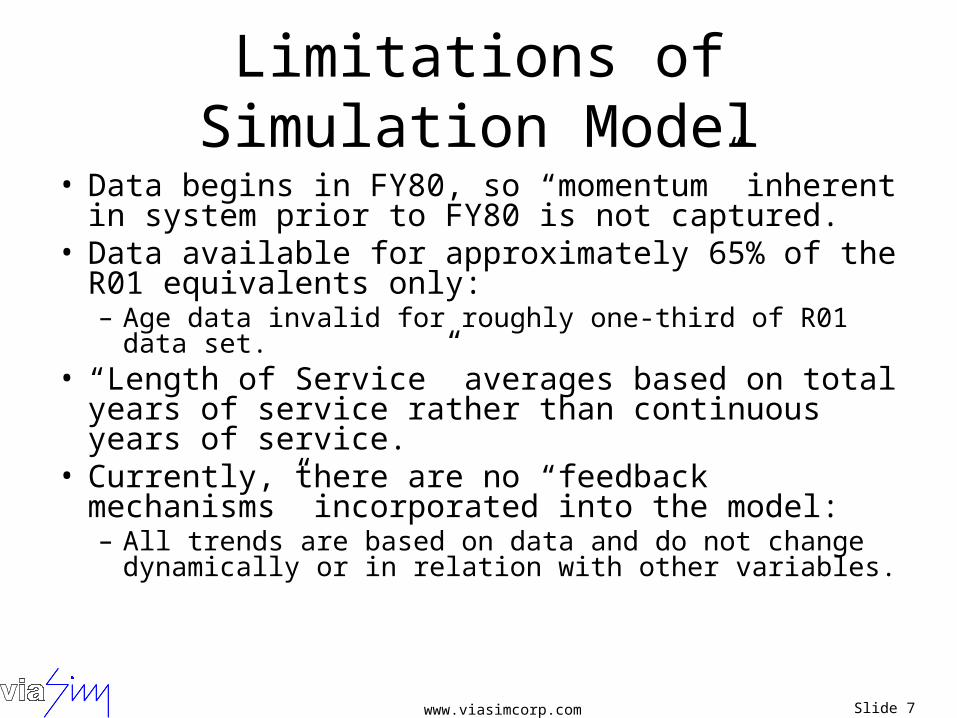
Limitations of Simulation Model
• Data begins in FY80, so “momentum” inherent in system prior to FY80 is not captured.
• Data available for approximately 65% of the R01 equivalents only:– Age data invalid for roughly one-third of R01 data set.
• “Length of Service” averages based on total years of service rather than continuous years of service.
• Currently, there are no “feedback mechanisms” incorporated into the model:– All trends are based on data and do not change
dynamically or in relation with other variables.
www.viasimcorp.com Slide 8
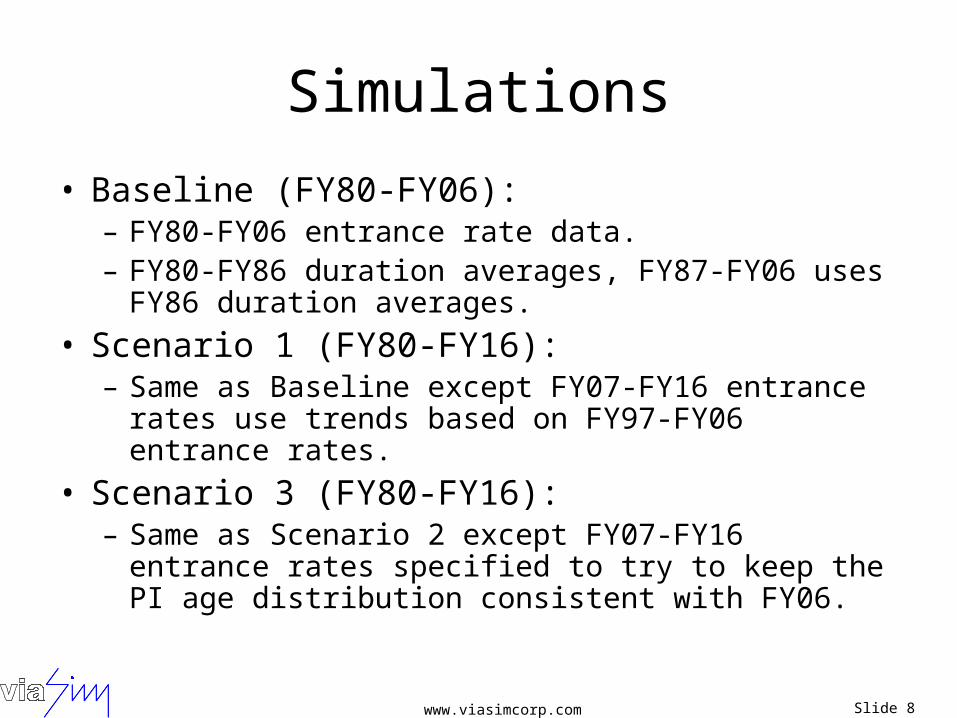
Simulations
• Baseline (FY80-FY06):– FY80-FY06 entrance rate data.– FY80-FY86 duration averages, FY87-FY06 uses
FY86 duration averages.
• Scenario 1 (FY80-FY16):– Same as Baseline except FY07-FY16 entrance rates
use trends based on FY97-FY06 entrance rates.
• Scenario 3 (FY80-FY16):– Same as Scenario 2 except FY07-FY16 entrance
rates specified to try to keep the PI age distribution consistent with FY06.
www.viasimcorp.com Slide 9
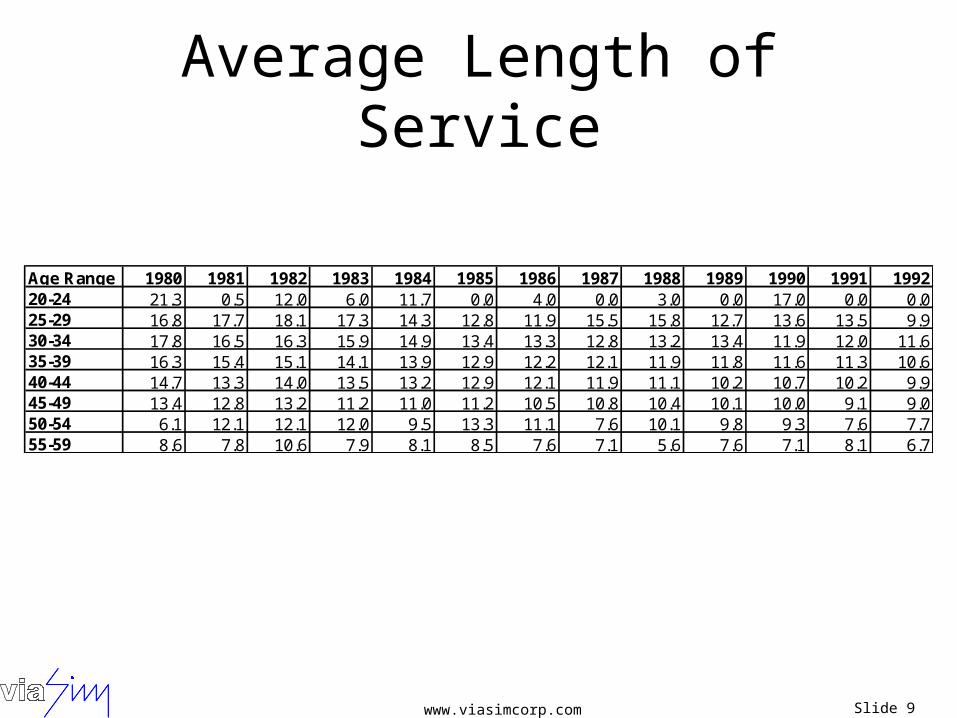
Average Length of Service
Age Range 1980 1981 1982 1983 1984 1985 1986 1987 1988 1989 1990 1991 199220-24 21.3 0.5 12.0 6.0 11.7 0.0 4.0 0.0 3.0 0.0 17.0 0.0 0.025-29 16.8 17.7 18.1 17.3 14.3 12.8 11.9 15.5 15.8 12.7 13.6 13.5 9.930-34 17.8 16.5 16.3 15.9 14.9 13.4 13.3 12.8 13.2 13.4 11.9 12.0 11.635-39 16.3 15.4 15.1 14.1 13.9 12.9 12.2 12.1 11.9 11.8 11.6 11.3 10.640-44 14.7 13.3 14.0 13.5 13.2 12.9 12.1 11.9 11.1 10.2 10.7 10.2 9.945-49 13.4 12.8 13.2 11.2 11.0 11.2 10.5 10.8 10.4 10.1 10.0 9.1 9.050-54 6.1 12.1 12.1 12.0 9.5 13.3 11.1 7.6 10.1 9.8 9.3 7.6 7.755-59 8.6 7.8 10.6 7.9 8.1 8.5 7.6 7.1 5.6 7.6 7.1 8.1 6.7
www.viasimcorp.com Slide 10
Baseline Results
www.viasimcorp.com Slide 11
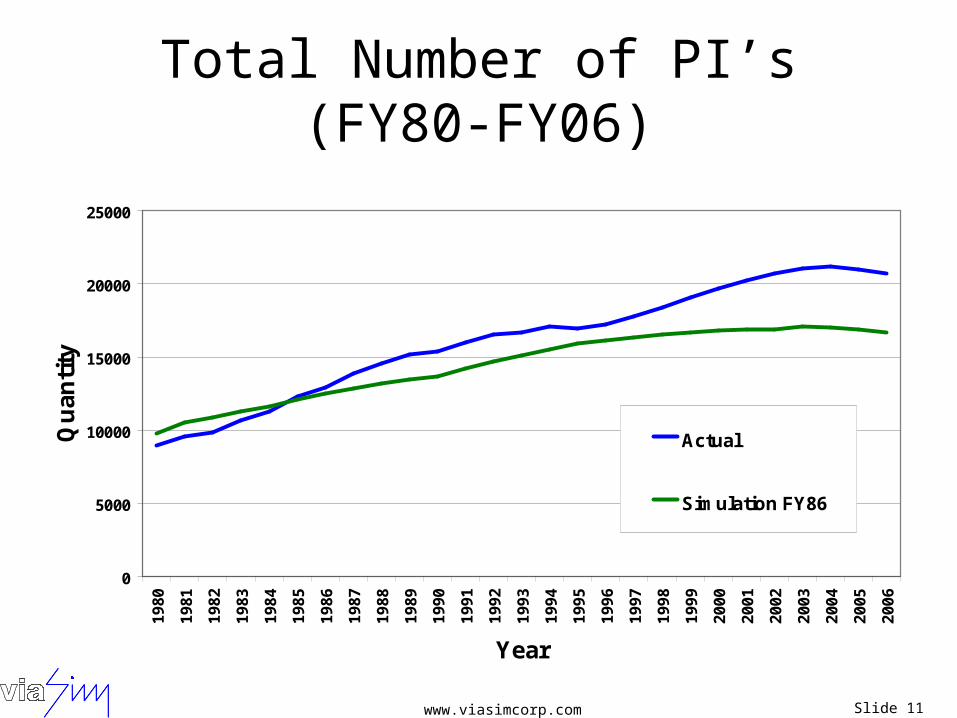
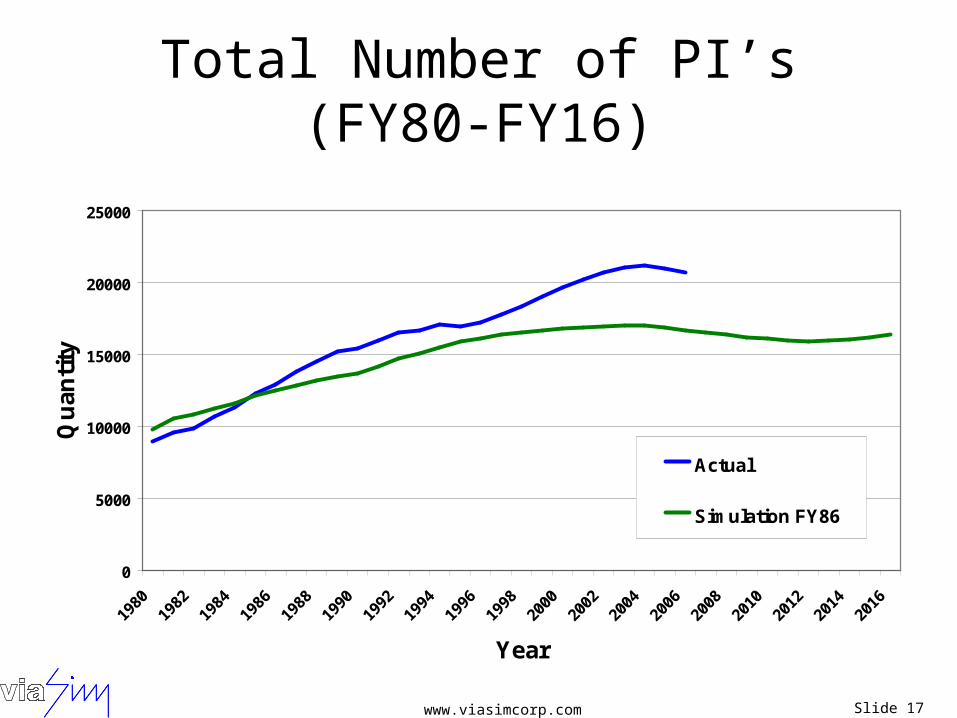
Total Number of PI’s (FY80-FY06)
0
5000
10000
15000
20000
25000
1980
1981
1982
1983
1984
1985
1986
1987
1988
1989
1990
1991
1992
1993
1994
1995
1996
1997
1998
1999
2000
2001
2002
2003
2004
2005
2006
Year
Qu
an
tity
Actual
Simulation FY86
www.viasimcorp.com Slide 12
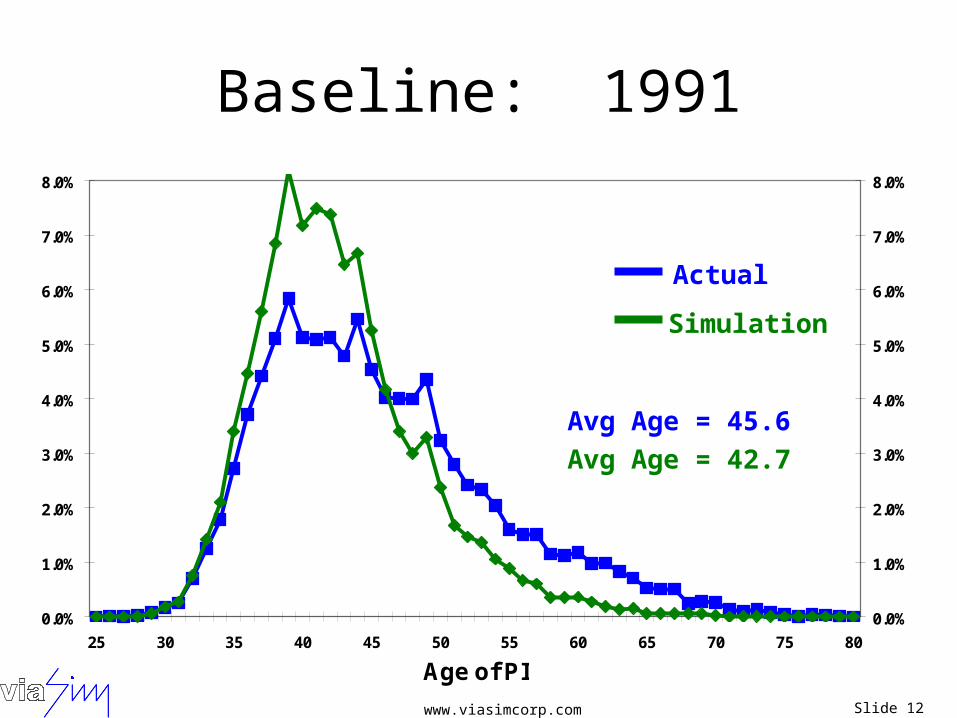
Baseline: 1991
0.0%
1.0%
2.0%
3.0%
4.0%
5.0%
6.0%
7.0%
8.0%
25 30 35 40 45 50 55 60 65 70 75 80
Age of PI
0.0%
1.0%
2.0%
3.0%
4.0%
5.0%
6.0%
7.0%
8.0%
Actual
Simulation
Avg Age = 42.7
Avg Age = 45.6

www.viasimcorp.com Slide 13
Baseline: 1996
0.0%
1.0%
2.0%
3.0%
4.0%
5.0%
6.0%
7.0%
8.0%
25 30 35 40 45 50 55 60 65 70 75 80
Age of PI
0.0%
1.0%
2.0%
3.0%
4.0%
5.0%
6.0%
7.0%
8.0%
Actual
Simulation
Avg Age = 44.7
Avg Age = 47.3
www.viasimcorp.com Slide 14
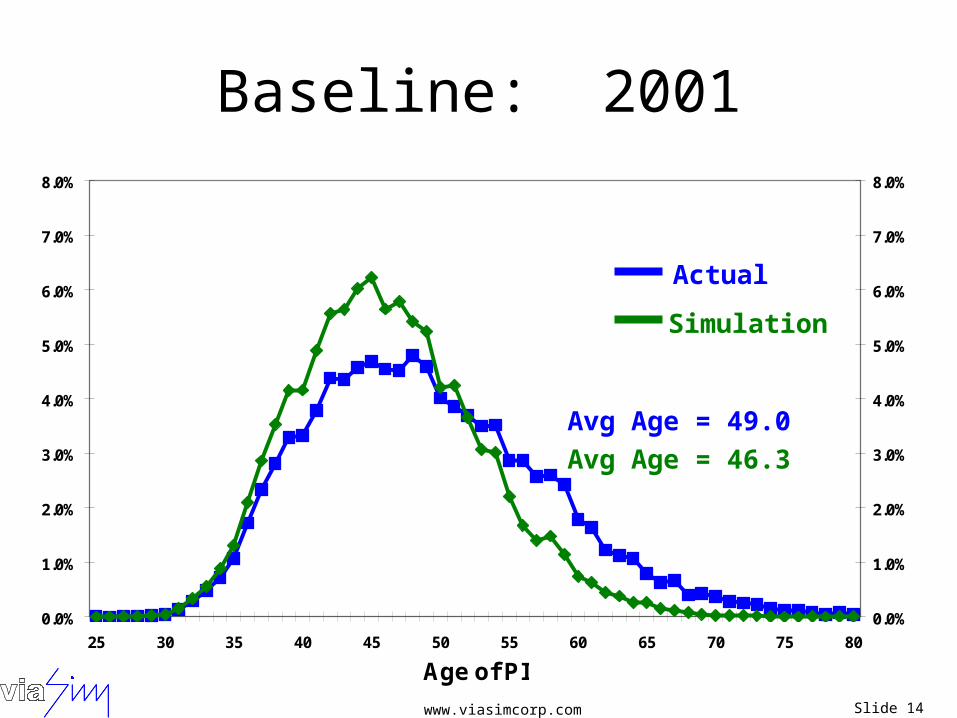
Baseline: 2001
0.0%
1.0%
2.0%
3.0%
4.0%
5.0%
6.0%
7.0%
8.0%
25 30 35 40 45 50 55 60 65 70 75 80
Age of PI
0.0%
1.0%
2.0%
3.0%
4.0%
5.0%
6.0%
7.0%
8.0%
Actual
Simulation
Avg Age = 46.3
Avg Age = 49.0
www.viasimcorp.com Slide 15
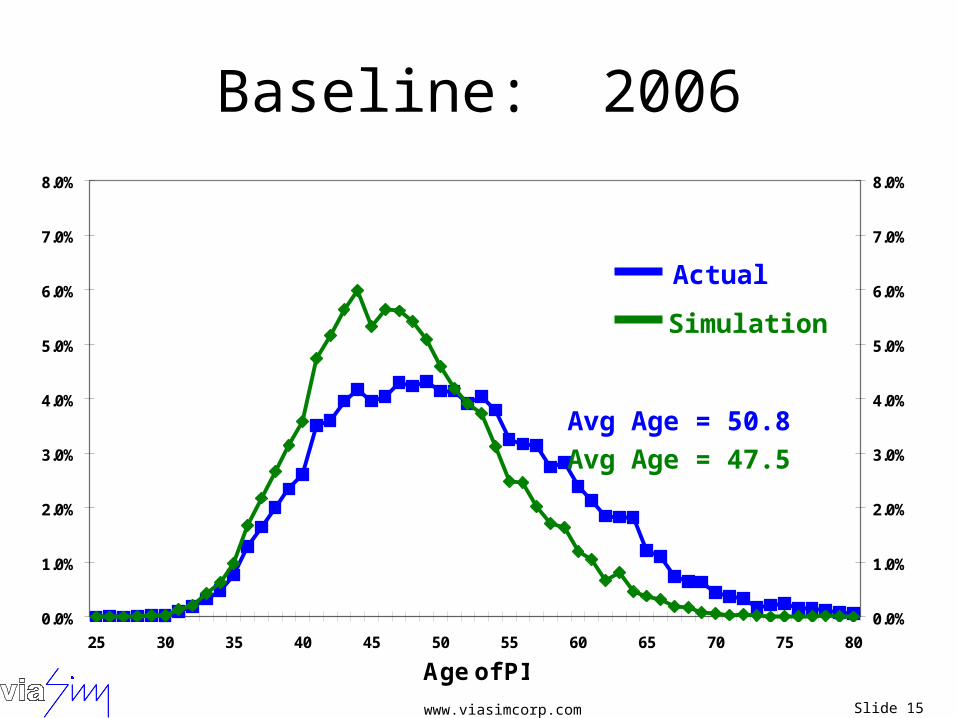
Baseline: 2006
0.0%
1.0%
2.0%
3.0%
4.0%
5.0%
6.0%
7.0%
8.0%
25 30 35 40 45 50 55 60 65 70 75 80
Age of PI
0.0%
1.0%
2.0%
3.0%
4.0%
5.0%
6.0%
7.0%
8.0%
Actual
Simulation
Avg Age = 47.5
Avg Age = 50.8

www.viasimcorp.com Slide 16
Scenario 1 Results
www.viasimcorp.com Slide 17
Total Number of PI’s (FY80-FY16)
0
5000
10000
15000
20000
25000
Year
Qu
an
tity
Actual
Simulation FY86
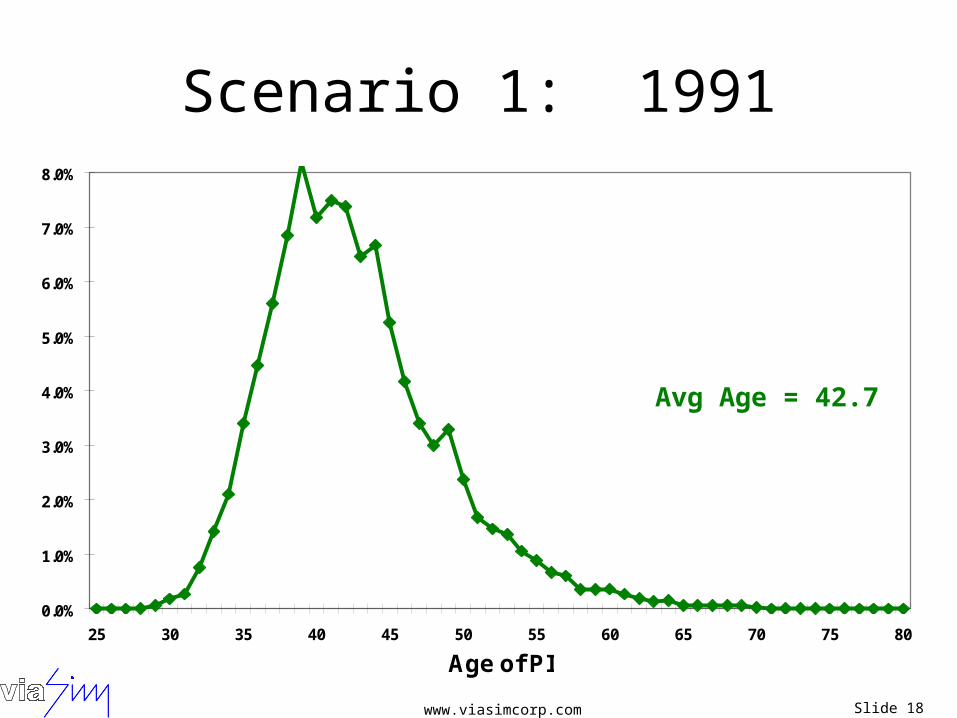
www.viasimcorp.com Slide 18
Scenario 1: 1991
0.0%
1.0%
2.0%
3.0%
4.0%
5.0%
6.0%
7.0%
8.0%
25 30 35 40 45 50 55 60 65 70 75 80
Age of PI
Avg Age = 42.7

www.viasimcorp.com Slide 19
Scenario 1: 1996
0.0%
1.0%
2.0%
3.0%
4.0%
5.0%
6.0%
7.0%
8.0%
25 30 35 40 45 50 55 60 65 70 75 80
Age of PI
Avg Age = 44.7
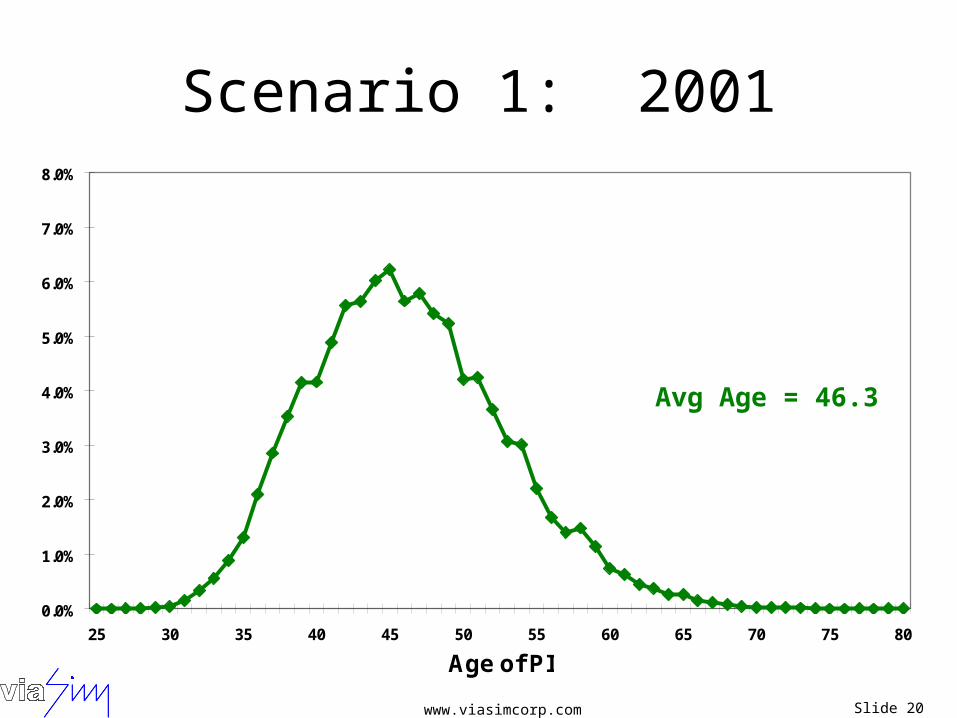
www.viasimcorp.com Slide 20
Scenario 1: 2001
0.0%
1.0%
2.0%
3.0%
4.0%
5.0%
6.0%
7.0%
8.0%
25 30 35 40 45 50 55 60 65 70 75 80
Age of PI
Avg Age = 46.3
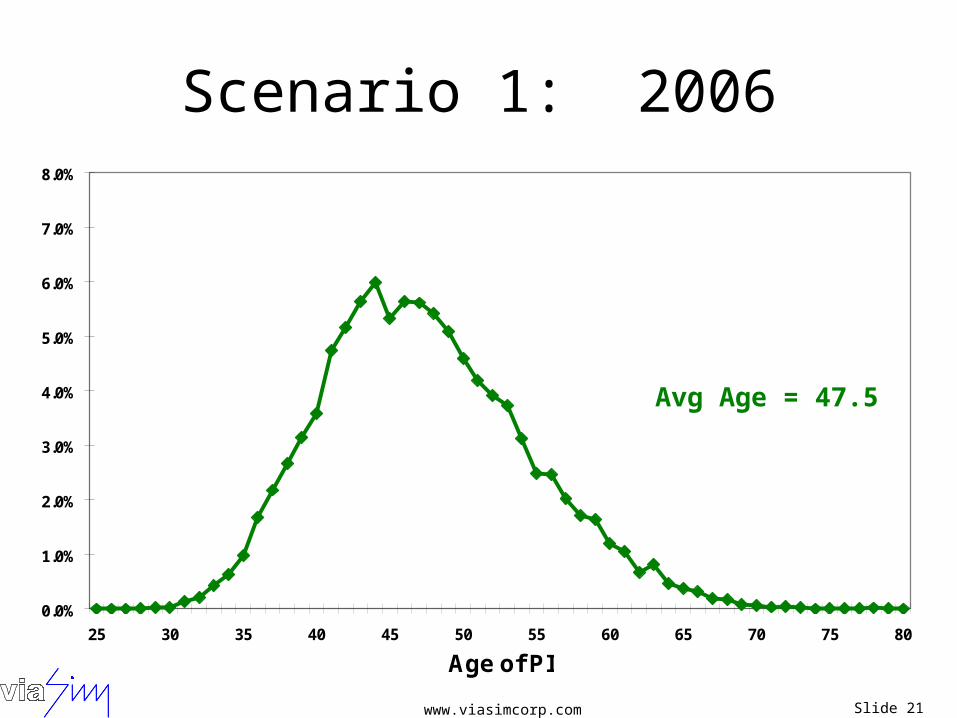
www.viasimcorp.com Slide 21
Scenario 1: 2006
0.0%
1.0%
2.0%
3.0%
4.0%
5.0%
6.0%
7.0%
8.0%
25 30 35 40 45 50 55 60 65 70 75 80
Age of PI
Avg Age = 47.5
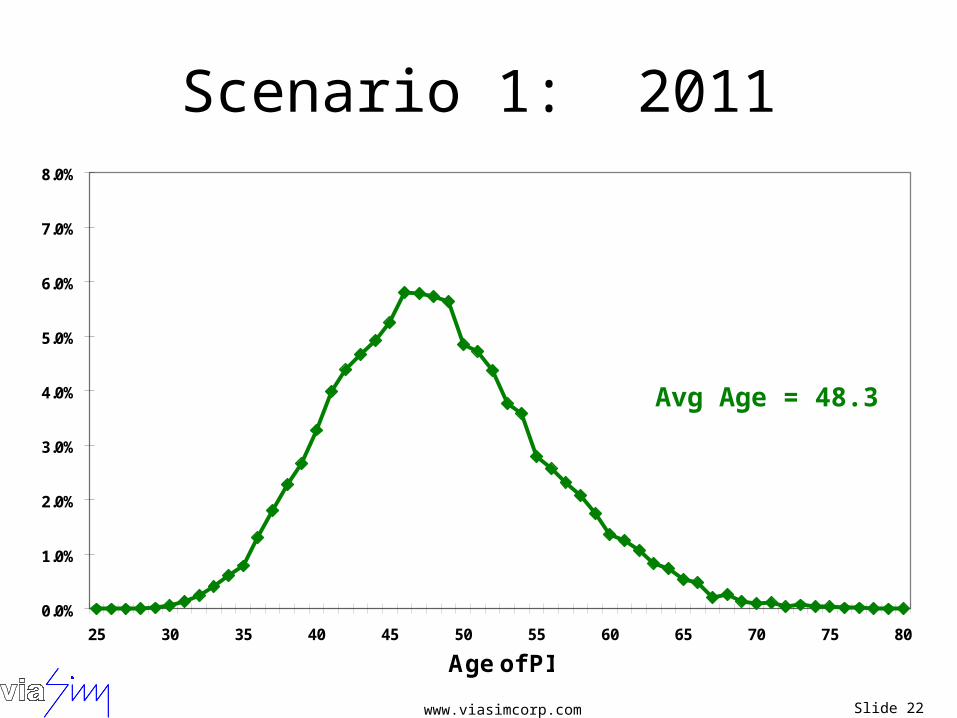
www.viasimcorp.com Slide 22
Scenario 1: 2011
0.0%
1.0%
2.0%
3.0%
4.0%
5.0%
6.0%
7.0%
8.0%
25 30 35 40 45 50 55 60 65 70 75 80
Age of PI
Avg Age = 48.3

www.viasimcorp.com Slide 23
Scenario 1: 2016
0.0%
1.0%
2.0%
3.0%
4.0%
5.0%
6.0%
7.0%
8.0%
25 30 35 40 45 50 55 60 65 70 75 80
Age of PI
Avg Age = 49.8

www.viasimcorp.com Slide 24
Scenario 2 Results

www.viasimcorp.com Slide 25
Scenario 2: Approach
• Objective is to keep average age and approximate age distribution consistent with 2006 values:– Average age = 47.5
• Possible policy changes to test:– No new PI’s older than 65 – minimal impact– Forced retirement at 70 – minimal impact– Forced distribution of 1500 new PI’s:
• No new PI’s at all• All new PI’s <40, evenly spread for each age• All new PI’s forced to fit a specific age distribution
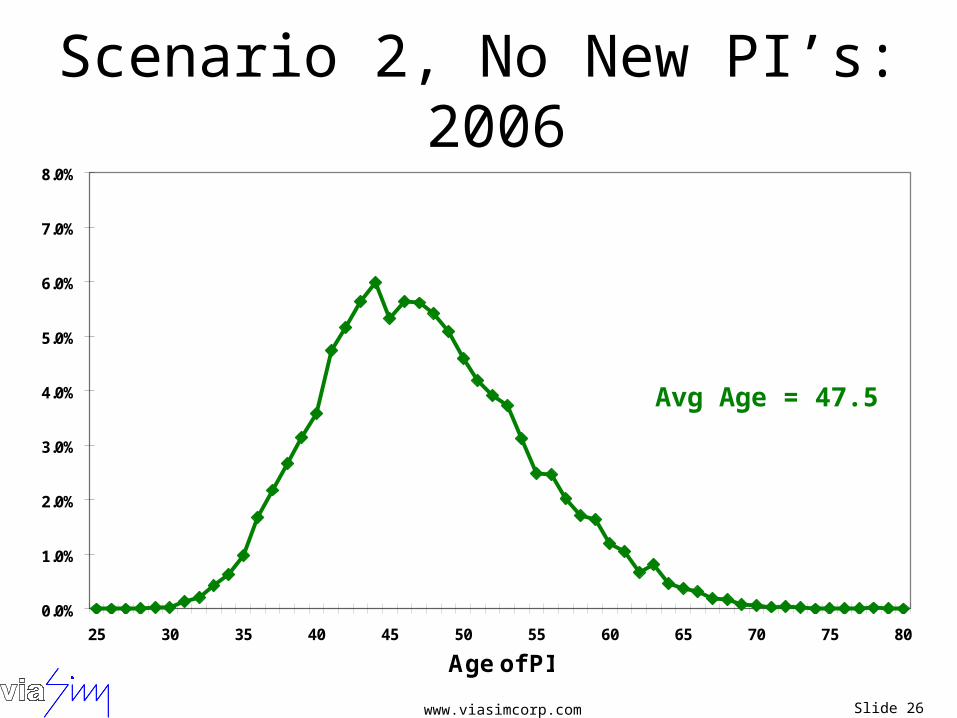
www.viasimcorp.com Slide 26
Scenario 2, No New PI’s: 2006
0.0%
1.0%
2.0%
3.0%
4.0%
5.0%
6.0%
7.0%
8.0%
25 30 35 40 45 50 55 60 65 70 75 80
Age of PI
Avg Age = 47.5
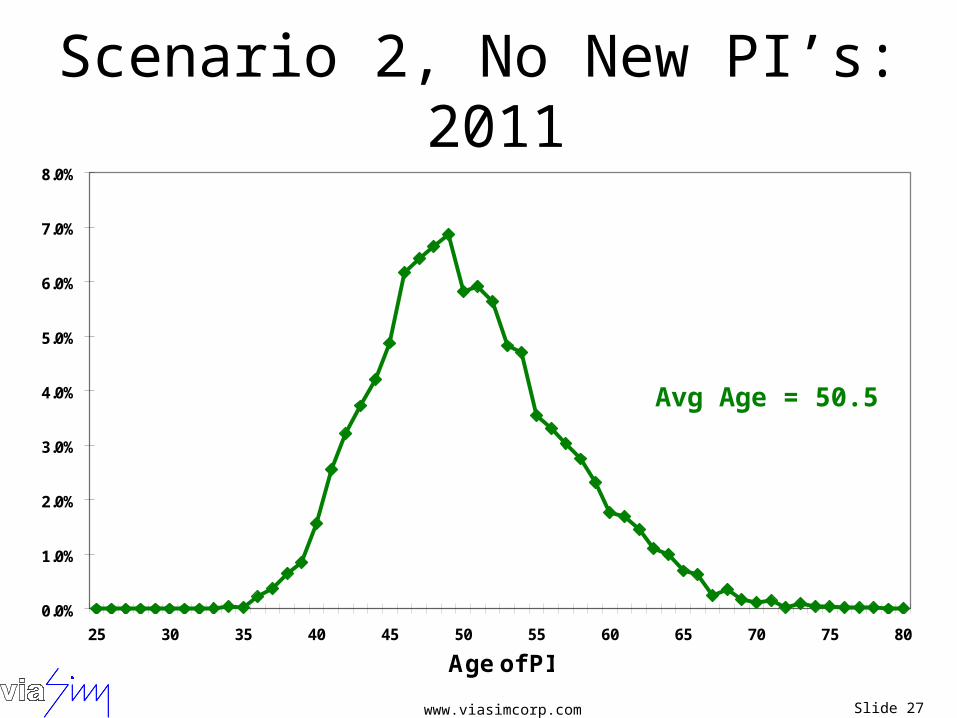
www.viasimcorp.com Slide 27
Scenario 2, No New PI’s: 2011
0.0%
1.0%
2.0%
3.0%
4.0%
5.0%
6.0%
7.0%
8.0%
25 30 35 40 45 50 55 60 65 70 75 80
Age of PI
Avg Age = 50.5
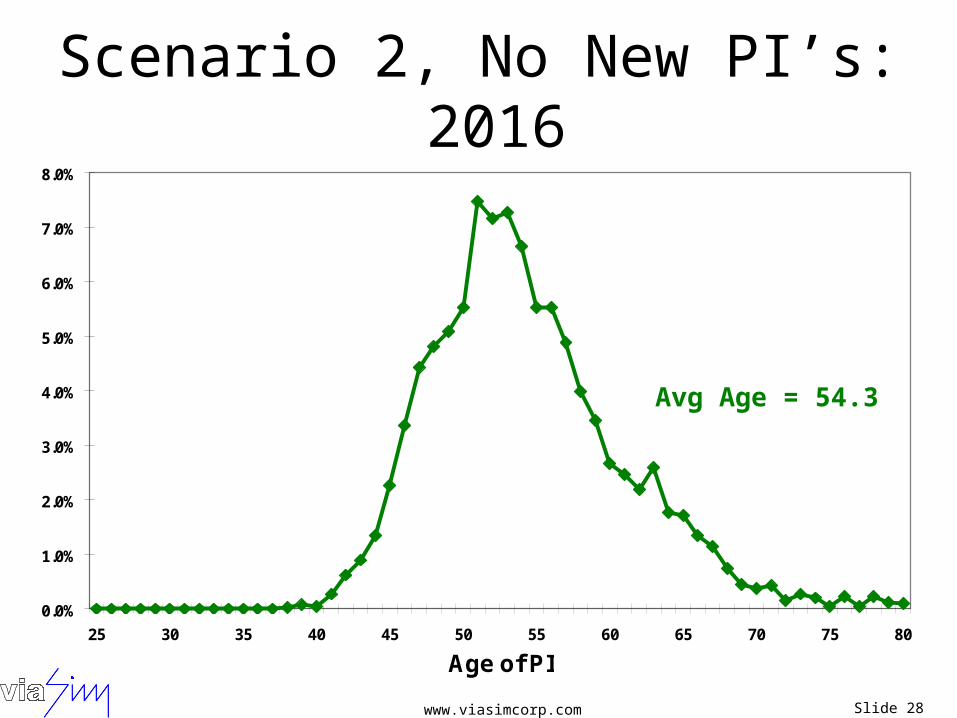
www.viasimcorp.com Slide 28
Scenario 2, No New PI’s: 2016
0.0%
1.0%
2.0%
3.0%
4.0%
5.0%
6.0%
7.0%
8.0%
25 30 35 40 45 50 55 60 65 70 75 80
Age of PI
Avg Age = 54.3

www.viasimcorp.com Slide 29
Scenario 2, All New PI’s <40: 2006
0.0%
1.0%
2.0%
3.0%
4.0%
5.0%
6.0%
7.0%
8.0%
25 30 35 40 45 50 55 60 65 70 75 80
Age of PI
Avg Age = 47.5
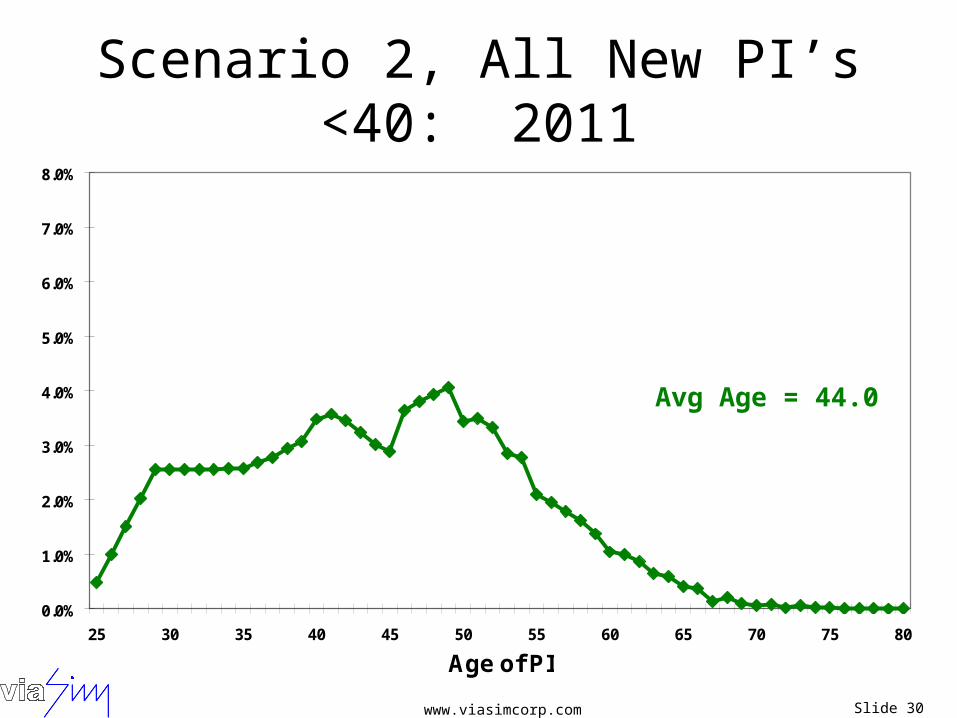
www.viasimcorp.com Slide 30
Scenario 2, All New PI’s <40: 2011
0.0%
1.0%
2.0%
3.0%
4.0%
5.0%
6.0%
7.0%
8.0%
25 30 35 40 45 50 55 60 65 70 75 80
Age of PI
Avg Age = 44.0
www.viasimcorp.com Slide 31
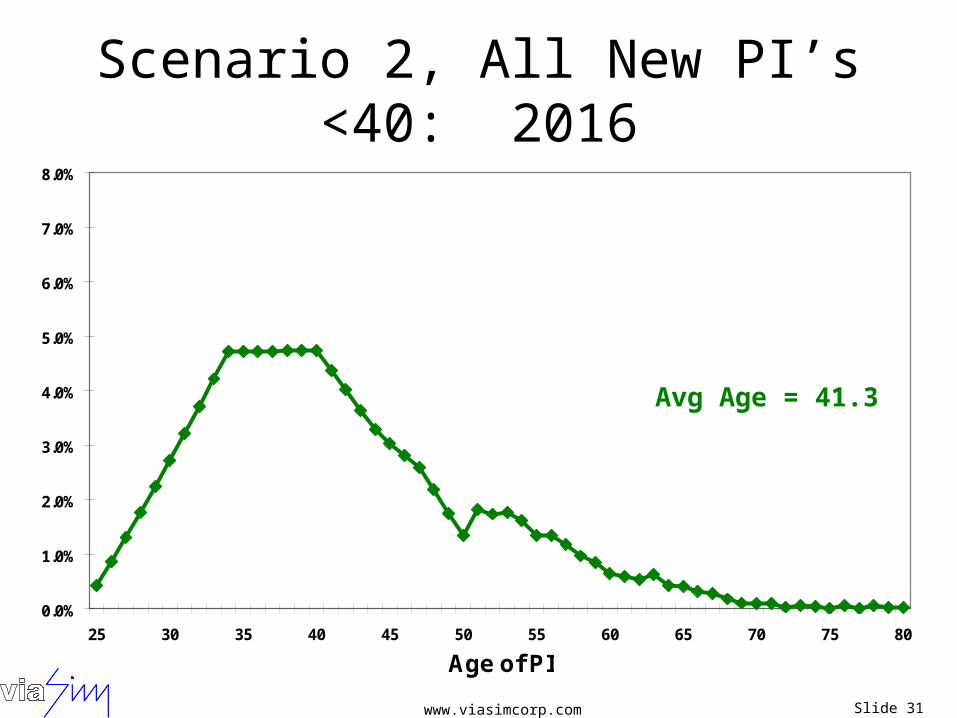
Scenario 2, All New PI’s <40: 2016
0.0%
1.0%
2.0%
3.0%
4.0%
5.0%
6.0%
7.0%
8.0%
25 30 35 40 45 50 55 60 65 70 75 80
Age of PI
Avg Age = 41.3
www.viasimcorp.com Slide 32
What Does This Tell Us?
• We have a model that is capable of forecasting the age distributions of the PI pool given assumptions on influxes and tenures.
• Making dramatic changes can have dramatic impacts.
www.viasimcorp.com Slide 33
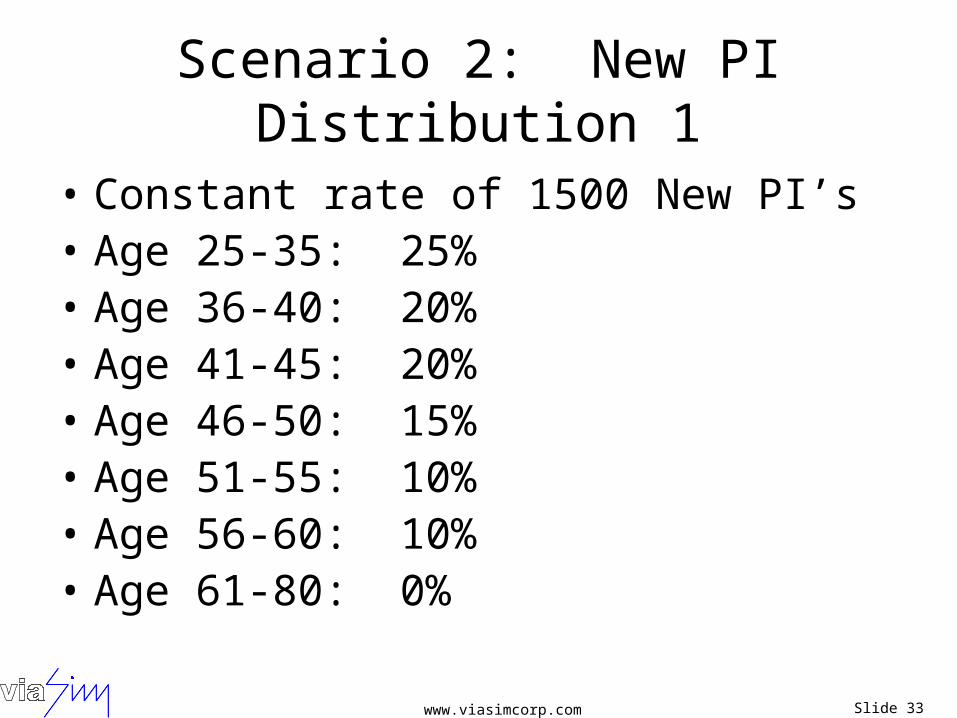
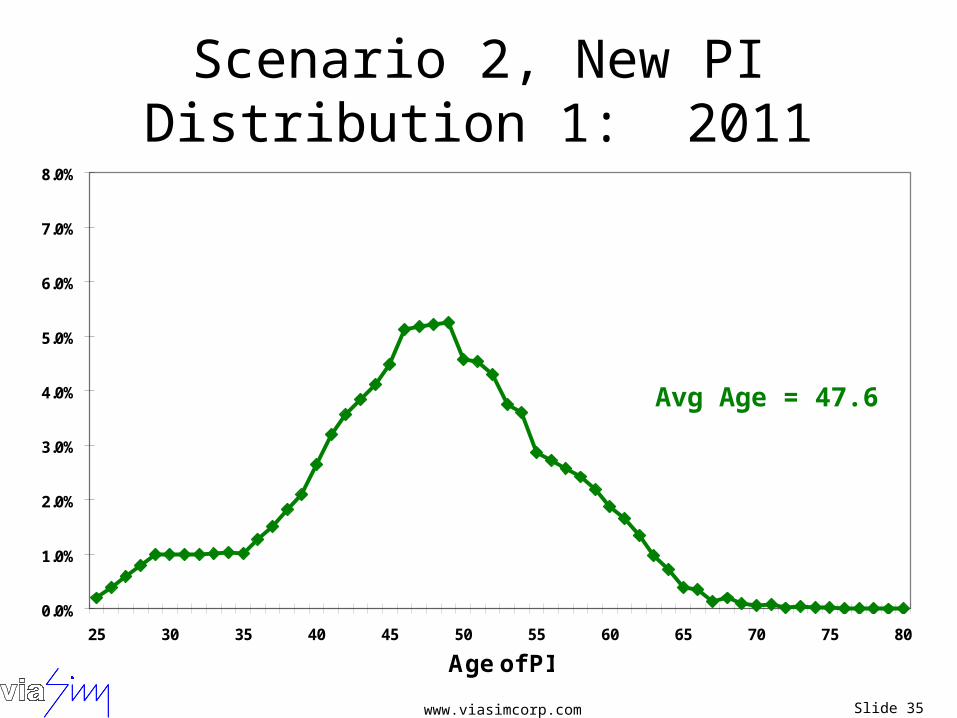
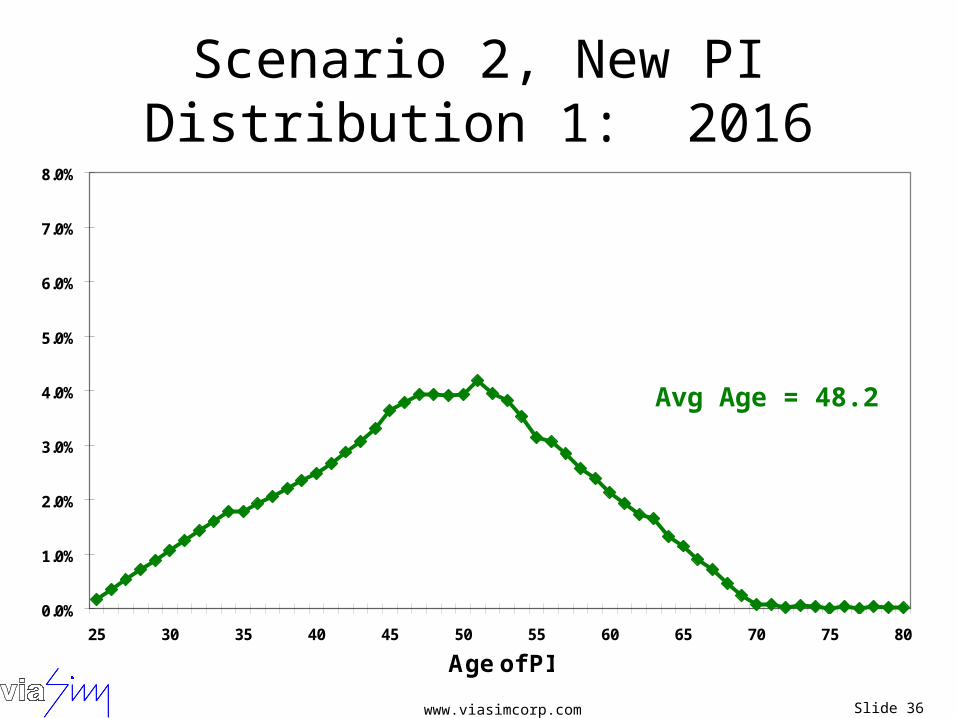
Scenario 2: New PI Distribution 1
• Constant rate of 1500 New PI’s• Age 25-35: 25%• Age 36-40: 20%• Age 41-45: 20%• Age 46-50: 15%• Age 51-55: 10%• Age 56-60: 10%• Age 61-80: 0%
www.viasimcorp.com Slide 34
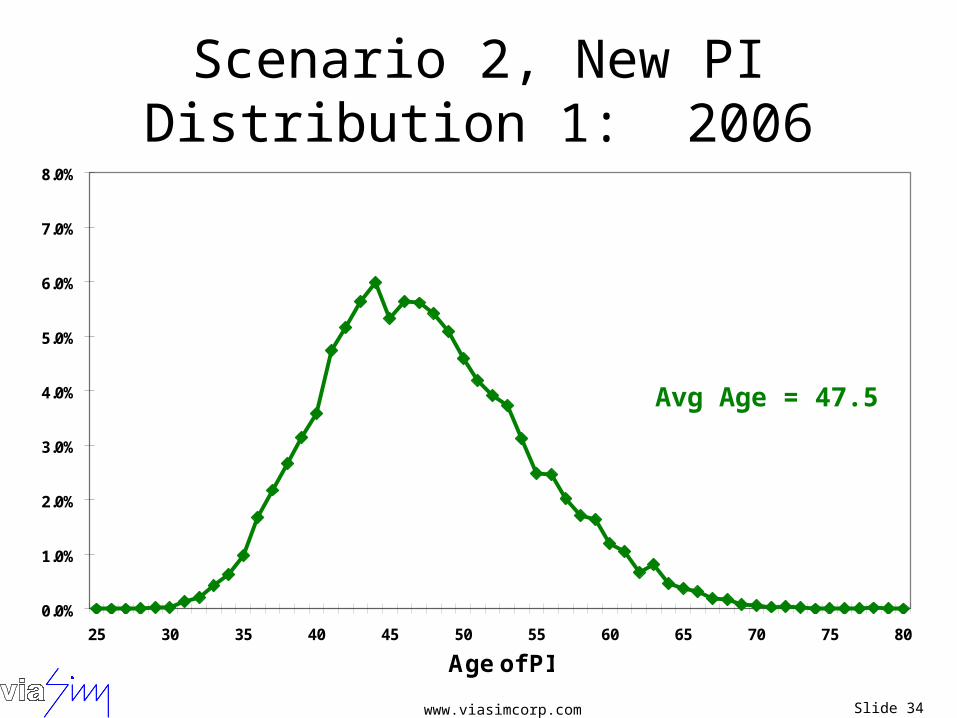
Scenario 2, New PI Distribution 1: 2006
0.0%
1.0%
2.0%
3.0%
4.0%
5.0%
6.0%
7.0%
8.0%
25 30 35 40 45 50 55 60 65 70 75 80
Age of PI
Avg Age = 47.5
www.viasimcorp.com Slide 35
Scenario 2, New PI Distribution 1: 2011
0.0%
1.0%
2.0%
3.0%
4.0%
5.0%
6.0%
7.0%
8.0%
25 30 35 40 45 50 55 60 65 70 75 80
Age of PI
Avg Age = 47.6
www.viasimcorp.com Slide 36
Scenario 2, New PI Distribution 1: 2016
0.0%
1.0%
2.0%
3.0%
4.0%
5.0%
6.0%
7.0%
8.0%
25 30 35 40 45 50 55 60 65 70 75 80
Age of PI
Avg Age = 48.2
www.viasimcorp.com Slide 37
What Does This Tell Us?
• The “ideal” age distribution for the PI pool is still an unknown target.
• With changes that occur due to feedback loops in the system, the established age distribution policy for new PI’s for future years will likely change every few years.
• In other words, there is no constant age distribution policy for incoming new PI’s that will provide the “ideal” PI pool age distribution over the long run.

www.viasimcorp.com Slide 38
Additional Test Scenarios for Final Workforce Group Meeting
November 14, 2007
www.viasimcorp.com Slide 39
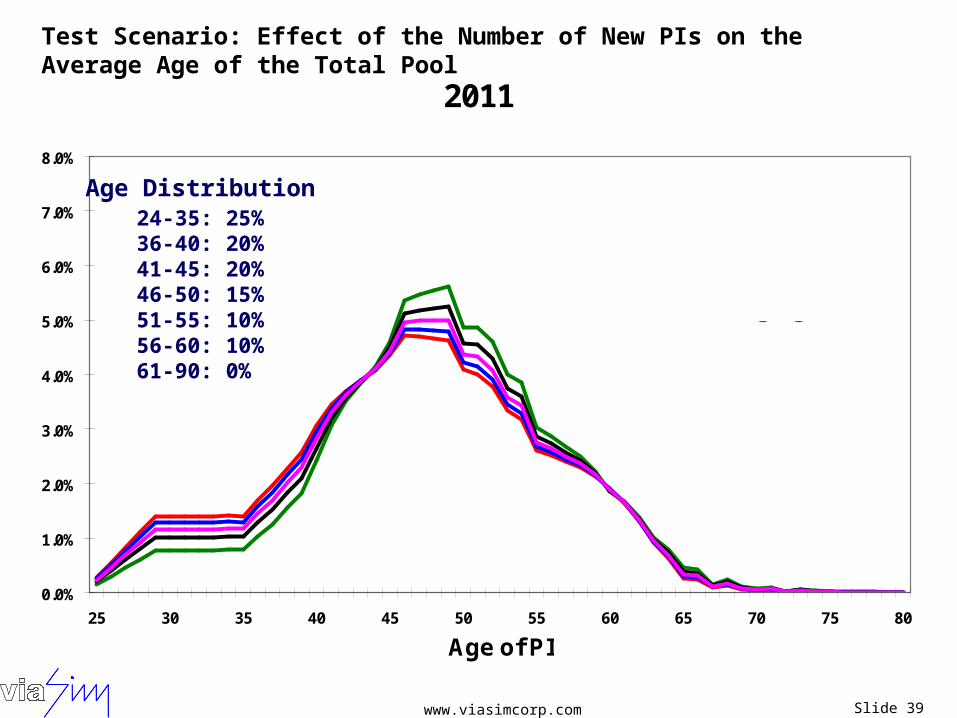
2011
0.0%
1.0%
2.0%
3.0%
4.0%
5.0%
6.0%
7.0%
8.0%
25 30 35 40 45 50 55 60 65 70 75 80
Age of PI
1000: Avg Age = 48.31500: Avg Age = 47.62000: Avg Age = 47.22500: Avg Age = 46.83000: Avg Age = 46.5
Test Scenario: Effect of the Number of New PIs on the Average Age of the Total Pool
Age Distribution24-35: 25%36-40: 20%41-45: 20%46-50: 15%51-55: 10%56-60: 10%61-90: 0%
www.viasimcorp.com Slide 40
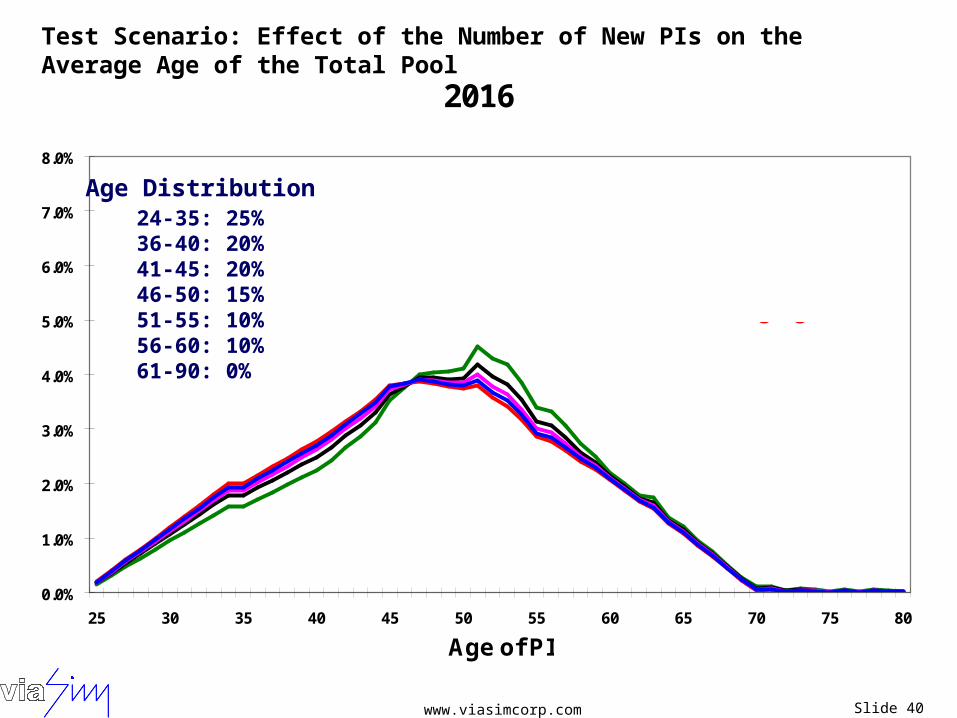
2016
0.0%
1.0%
2.0%
3.0%
4.0%
5.0%
6.0%
7.0%
8.0%
25 30 35 40 45 50 55 60 65 70 75 80
Age of PI
1000: Avg Age = 48.81500: Avg Age = 48.22000: Avg Age = 47.82500: Avg Age = 47.63000: Avg Age = 47.4
Test Scenario: Effect of the Number of New PIs on the Average Age of the Total Pool
Age Distribution24-35: 25%36-40: 20%41-45: 20%46-50: 15%51-55: 10%56-60: 10%61-90: 0%
www.viasimcorp.com Slide 41
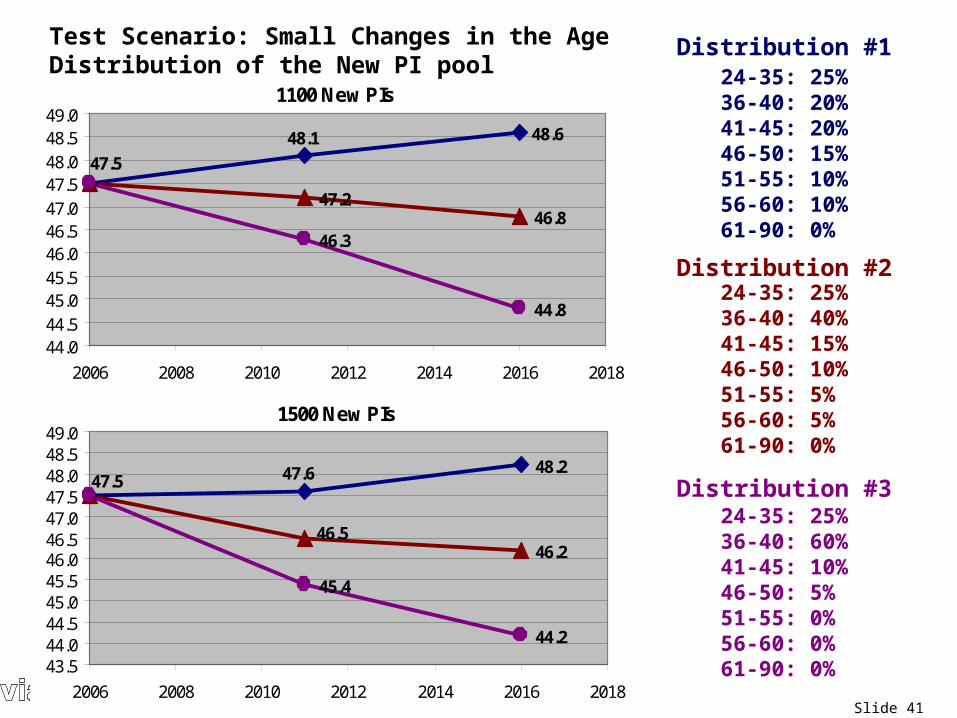
Distribution #1
Distribution #3
Distribution #2
24-35: 25%36-40: 20%41-45: 20%46-50: 15%51-55: 10%56-60: 10%61-90: 0%
24-35: 25%36-40: 40%41-45: 15%46-50: 10%51-55: 5%56-60: 5%61-90: 0%
24-35: 25%36-40: 60%41-45: 10%46-50: 5%51-55: 0%56-60: 0%61-90: 0%
1500 New PIs
48.2
46.2
45.4
44.2
47.6
46.5
47.5
43.544.044.545.045.546.046.547.047.548.048.549.0
2006 2008 2010 2012 2014 2016 2018
1100 New PIs
48.6
47.246.8
46.3
44.8
48.1
47.5
44.044.545.045.546.046.547.047.548.048.549.0
2006 2008 2010 2012 2014 2016 2018
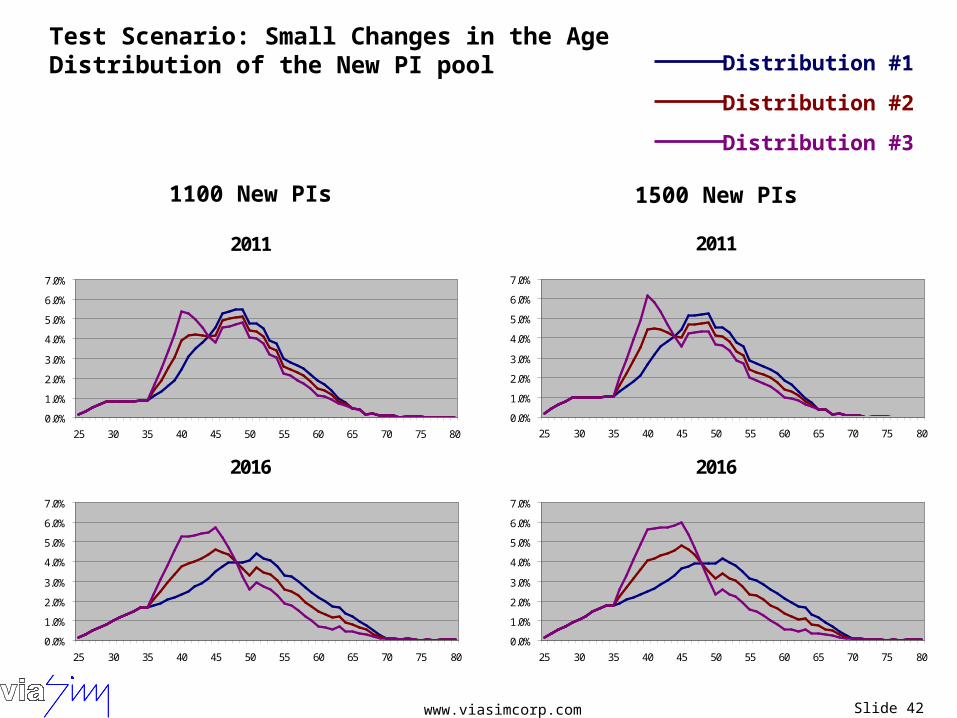
Test Scenario: Small Changes in the Age Distribution of the New PI pool
www.viasimcorp.com Slide 42
2011
0.0%
1.0%
2.0%
3.0%
4.0%
5.0%
6.0%
7.0%
25 30 35 40 45 50 55 60 65 70 75 80
2016
0.0%
1.0%
2.0%
3.0%
4.0%
5.0%
6.0%
7.0%
25 30 35 40 45 50 55 60 65 70 75 80
2011
0.0%
1.0%
2.0%
3.0%
4.0%
5.0%
6.0%
7.0%
25 30 35 40 45 50 55 60 65 70 75 80
2016
0.0%
1.0%
2.0%
3.0%
4.0%
5.0%
6.0%
7.0%
25 30 35 40 45 50 55 60 65 70 75 80
Distribution #1
Distribution #3
Distribution #2
1100 New PIs 1500 New PIs
Test Scenario: Small Changes in the Age Distribution of the New PI pool

www.viasimcorp.com Slide 43
No Competing Grants after 2006,1500 New PIs after 2006, Age Distribution: 25% 24-35, 75% 36-40
-0.01
0.01
0.03
0.05
0.07
0.09
0.11
0.13
0.15
25 30 35 40 45 50 55 60 65 70 75 80
Age of PI
2006
2011
2016
46.6
38
40.5
Test Scenario: Extreme Case – Replacing the PI Pool
www.viasimcorp.com Slide 44
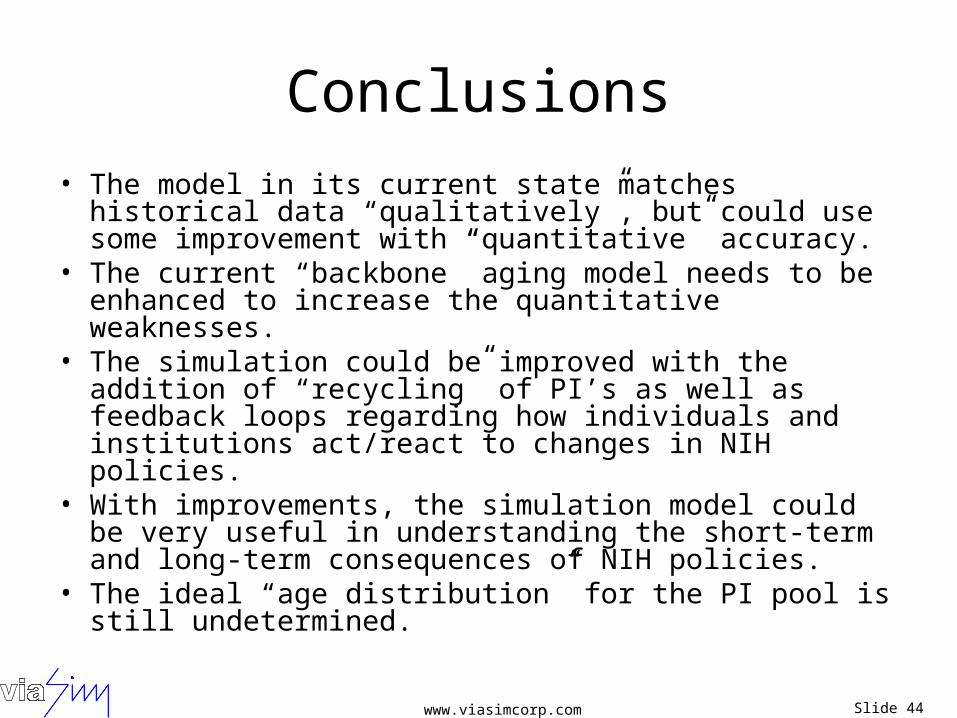
Conclusions
• The model in its current state matches historical data “qualitatively”, but could use some improvement with “quantitative” accuracy.
• The current “backbone” aging model needs to be enhanced to increase the quantitative weaknesses.
• The simulation could be improved with the addition of “recycling” of PI’s as well as feedback loops regarding how individuals and institutions act/react to changes in NIH policies.
• With improvements, the simulation model could be very useful in understanding the short-term and long-term consequences of NIH policies.
• The ideal “age distribution” for the PI pool is still undetermined.
www.viasimcorp.com Slide 45
Next Steps
• Based on feedback from the final workforce group meeting, develop a list of specific model enhancements to be incorporated in a follow-on effort.
• On this next effort, focus on increasing the quantitative accuracy of the model compared to historical data.
• Report back to workforce modeling group on results from enhanced model.