wyoming department of environmental quality monitoring...
TRANSCRIPT
1
WYOMING DEPARTMENT OF ENVIRONMENTAL QUALITY MONITORING AND ASSESSMENT REPORT Waterbodies: Smiths Fork, East Fork Smiths Fork, Watershed: Green River and West Fork Smiths Fork Hydrologic Unit Code: 14040107 Segments: 041-2, 159-1, & 042-2 Field Personnel: Tavis Eddy, Chad Rieger, Sam Horn, Annette France (Uinta County Conservation District) Author: Chad A. Rieger INTRODUCTION The Smiths Fork, East Fork of Smiths Fork (East Fork) and West Fork of Smiths Fork (West Fork) are all classified as Class 2AB streams (WDEQ/WQD, 2001b). Designated uses for this classification include fisheries, fish consumption, aquatic life other than fish, primary contact recreation, wildlife, industry, agriculture and scenic value. Class 2AB streams are those surface waters known to support game fish populations or spawning and nursery areas at least seasonally, and all of their perennial tributaries and adjacent wetlands, and where a game fishery and drinking water uses are otherwise attainable. Such waters are additionally protected for non-game fish, fish consumption, aquatic life other than fish, primary contact recreation, wildlife, industry, agriculture, and scenic value (WDEQ/WQD 2001c). The East Fork and West Fork flow northerly out of the Uinta Mountains and combine to become the Smiths Fork. The confluence is located in Section 13 of Township 13 North, Range 116 West. The Smiths Fork then flows northeasterly until it meets the Blacks Fork northeast of Lyman, Wyoming. The drainage basin area of this system is bounded on the south by the Uinta Mountains. Primary tributaries to the Smiths Fork study area include Gilbert Creek (to the East Fork), Archie Creek (to the West Fork), and Willow Creek (to the Smiths Fork). The study area consists of the confluence of the Smiths Fork with Willow Creek upstream to the headwaters of the East Fork and West Fork. Willow Creek will be analyzed in a separate report. These segments of the Smiths Fork system were included in the WDEQ/WQD Monitoring Program to assess the stream following the completion of a Clean Water Act Section 319 restoration project associated with Best Management Practice (BMP) installation and water quality improvement of Willow Creek. The project included monitoring of the East Fork and West Fork of the Smiths Fork to determine if BMP installation is necessary to improve water quality of these stream segments as well. The Smiths Fork is listed in Table A (Waterbodies with Water Quality Impairments) of the 2002 303(d) list as not fully supporting aquatic life and fisheries from the confluence with the Blacks Fork upstream past Cottonwood Creek due to habitat degradation. It is also listed in Table A for not fully supporting recreation from the confluence with the Blacks Fork upstream an undetermined distance due to fecal coliform. The East Fork, West Fork, and Willow Creek are listed on Table C of the 303(d) list (Waterbodies
2
with Water Quality Threats) due to habitat degradation. DESCRIPTION OF BIOASSESSMENT STATIONS Four bioassessment stations were established in the Smiths Fork study area from October 13th-27th, 2003. One water quality-only station was established on Gilbert Creek, a tributary to the East Fork. The stations were assessed to monitor the variation of the Smiths Fork system as it descends north towards its confluence with Willow Creek. Bioassessment stations on the West Fork were designated as Reference (WF-1) and Section 23 (WF-2). The bioassessment station on the East Fork was designated Gaging Station (EF-1), with the associated Gilbert Creek water quality-only station designated Above Road (GC-1). The Smiths Fork station was designated Section 12 (SF-1). Using a Geographic Information System (GIS) mapping program, it was determined that WF-1, EF-1, and GC-1 are within the Wasatch and Uinta Mountains (WU) ecoregion while WF-2 and SF-1 are within the Wyoming Basins (WB) ecoregion. The Reference station was first monitored in 1997 and was grouped in the Middle Rockies West (MRW) ecoregion at the time. Therefore, the station ID code was given based on the initial monitoring. Further refinement of the ecoregions places the station in the WU ecoregion. WF-2 and SF-1 are within the WB ecoregion, but are very close to WU.
Table 1. 2003 Bioassessment Stations
Stream Station Station ID Code
Section Township Range
Latitude Longitude Elevation (ft)
USGS Map
West Fork WF-1 MRW 56 S.10 T12N R116W 41° 01’ 47.98” 110° 28’ 29.85” 8537 Buck Fever Ridge
West Fork WF-2 WU 5 S.23 T13N R116W 41° 04’ 54.90” 110° 27’ 09.77” 8100 Buck Fever Ridge
East Fork EF-1 WU 1 S.5 T12N R115W 41° 03’ 08.23” 110° 23’ 53.08” 8530 Buck Fever Ridge
Gilbert Creek
GC-1 n/a* S.5. T12N R115W 41° 02’ 54.47” 110° 24’ 13.30” 8510 Buck Fever Ridge
Smiths Fork
SF-1 WU 2 S.12 T13N R116W 41° 07’ 04.53” 110° 26’ 34.18” 7791 Buck Fever Ridge
Latitude-longitude coordinates were determined from GPS readings; stations are within Uinta County * Water quality-only stations do not receive Station ID Codes Reference (WF-1): located on USFS land approximately one mile downstream from the confluence of the West Fork and Archie Creek. It was assessed on October 15th, 2003 with water samples collected on October 13th, 2003. The stream within this reach drains conifer forests and high elevation meadows. Section 23 (WF-2): located on BLM land approximately two miles upstream from the confluence of the West Fork and the East Fork. It was assessed on October 16th, 2003 with water samples collected on October 16th, 2003. A macroinvertebrate sample was not collected due to the prevalence of beaver dams. The stream within this reach drains forested areas, valley foothills and irrigated croplands. Gaging Station (EF-1): located on USFS land immediately upstream of the road crossing at the gaging station. It was assessed on October 14th, 2003 with water samples collected on October
3
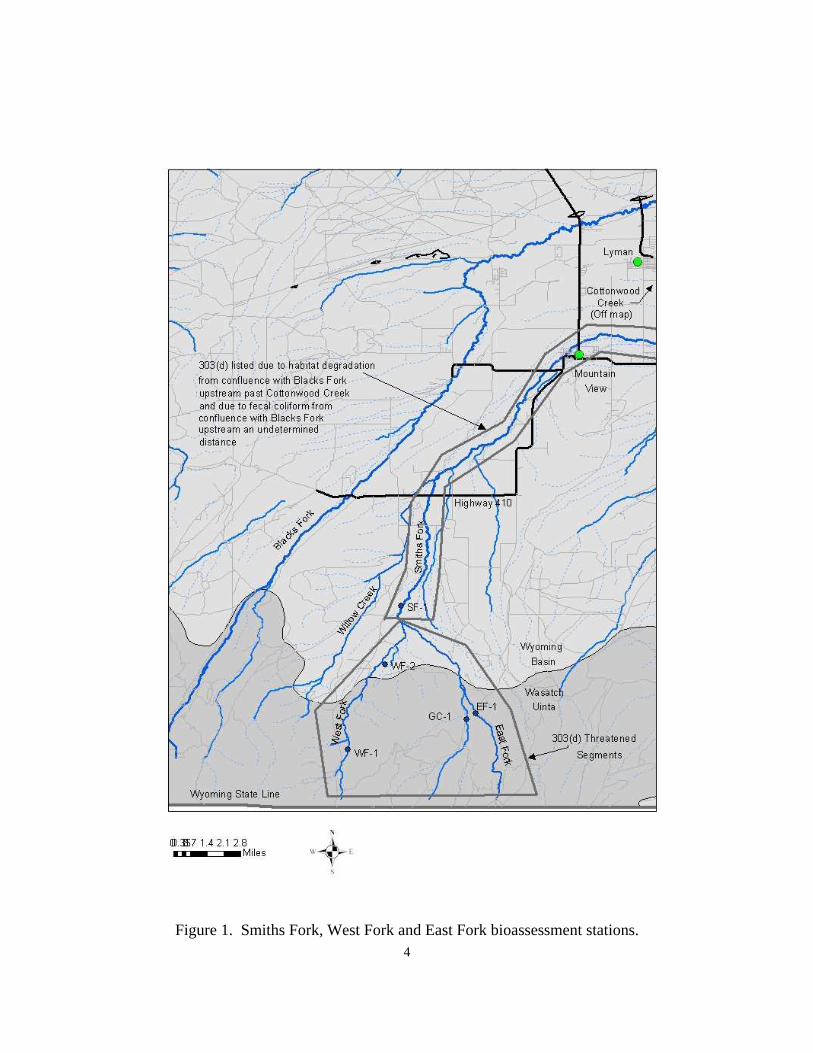
13th, 2003. The stream within this reach drains conifer forests. Gilbert Creek (GC-1): water quality-only station located on USFS land immediately upstream from road crossing, approximately 1.25 miles upstream from the confluence of Gilbert Creek and East Fork Smiths Fork. Water samples were collected on October 13, 2003. The stream within this reach drains conifer forests. Section 12 (SF-1): located on BLM land approximately one mile downstream from the confluence of the West Fork and the East Fork and approximately five miles upstream from the confluence of Willow Creek and the Smiths Fork. It was assessed on October 27th, 2003 with water samples collected on October 13th, 2003. The stream within this reach drains valley foothills and irrigated croplands. A map showing the layout of the stations is included as Figure 1.
4
Figure 1. Smiths Fork, West Fork and East Fork bioassessment stations.
5
METHODS Water quality samples were collected at the West Fork, East Fork, and Smiths Fork assessment stations October 13th and October 16th, 2003. Grab samples were collected, preserved, transported and analyzed in accordance with procedures outlined in the department’s Quality Assurance Project Plan for Beneficial Use Reconnaissance Project WDEQ/WQD, (2001a) and Manual of Standard Operating Procedures (SOP) for Sample Collection and Analysis (2004). The qualitative habitat quality assessment for the West Fork, East Fork and Smiths Fork covered a segment upstream from the riffles used for macroinvertebrate sampling. Each reach length is determined by multiplying the bankfull width by 20, or at a minimum, a 360-foot reach length is used. A 360-foot segment was used for the habitat quality assessment at the Section 23 site, where macroinvertebrate sampling was not performed and a bankfull width was not determined. Thirteen habitat parameters (5 primary parameters, 4 secondary parameters, and 4 tertiary parameters) were evaluated. Evaluation of these parameters allow for a total habitat score ranging from zero to 200 points. High total point scores correlate to a higher quality habitat. Specifics of the individual habitat parameters are contained in WDEQ/WQD (2004) and Plafkin et al. (1989). Physical (habitat quality) data were collected and analyzed according to WDEQ/WQD bioassessment protocols (WDEQ, 2004). Additional quantitative data is collected at 10% of the stream sites throughout a sampling season. This includes additional bankfull and flood-prone measurements, width/depth ratios, substrate composition, fine sediment covering, embeddedness, stability and cover of banks, and bed feature delineation. Additional qualitative measurements include a fish cover analysis and a riparian vegetative cover and human influence analysis. This additional 10% data was collected at WF-1. Macroinvertebrate samples were collected from a representative riffle habitat. Eight surber samples were randomly located at the WF-1, EF-1 and SF-1 using generated random number scales, and a composite sample was obtained. Samples were sent to WDEQ/WQD’s contract laboratory (Rhithron Associates, Inc., Missoula, MT) where they were processed and sub-sampled according to WDEQ/WQD protocol and standard taxonomic effort (WDEQ, 2004). Evaluation of the macroinvertebrate data was conducted through the use of the Wyoming Stream Integrity Index (WSII). The WSII (Stribling et al., 2000; Jessup and Stribling, 2002) consists of regionally-calibrated multi-metric biological criteria for assessing aquatic life use support in Wyoming streams. Because biological communities of Wyoming streams vary across natural gradients of environmental conditions, a two-tiered site classification scheme was used to group sites into relatively homogeneous units. The primary classification was the level III ecoregions of Omernik and Gallant (1987); the secondary classification was an aggregation of ecoregions into areas of relative biological similarity (bioregions). Core macroinvertebrate metrics with pronounced discrimination efficiencies (degree of separation between metric value distributions of reference and degraded sites within each bioregion) were incorporated into the WSII. Scoring of individual metric values was based on comparison to the 5th or 95th percentile of bioregional reference stream data for each specific metric. The composition of this suite of metrics is diverse, and relatively non-overlapping, in its ecological characterization. Specific metric scoring formulae are presented in Stribling et al. (2000) and Jessup and Stribling (2002). The final index

6
score is an average of the individual metric scores. Quality Assurance/Quality Control Environmental data from the West Fork, East Fork and Smiths Fork were collected in accordance to the methods, procedures, and techniques listed in the Methods section of this report. Station QA/QC reports for each sample station are attached to this report. All physical, biological, and chemical data for 2003 were determined to be complete and accurate. PHYSICAL SETTING The bioassessment stations are either within the Wasatch and Uinta Mountain Level III ecoregion (WF-1, EF-1, and GC-1) or within the Wyoming Basins Level III ecoregion (WF-2 and SF-1). WF-1, EF-1 and GC-1 exist within the Mid-Elevation Uinta Mountains Level IV ecoregion. This ecoregion is described as follows:
Glaciated. Moderate to steep mountains. Moraines and a few lakes. Streams are moderate to steep gradient, riffle/run. Substrate is cobble, glacial outwash material comprised primarily of quartzite. (Chapman et. al, 2003)
WF-2 and SF-1 exist within the Sub-Irrigated High Valleys Level IV ecoregion. This ecoregion is described as follows:
Unglaciated. High elevation valleys, nearly flat floodplains, and low terraces. Many wetlands. Streams and rivers are moderate gradient, riffle/run. Substrate is generally cobble-sized glacial outwash material consisting of granite, limestone, and quartzite. (Chapman et. al, 2003)
The geology and soil of the watershed were heterogeneous. Surficial geology of WF-1 was primarily Landslide Deposits (locally includes intermixed landslide and glacial deposits, talus, and rock-glacier deposits). Surficial geology of WF-2 was primarily Alluvium and Colluvium (clay, silt, sand and gravel in flood plains, fans, terraces and slopes). Other surficial geology in this watershed included Gravel, Pediment and Fan Deposits and Bridger Formation (greenish-gray, olive-drab, and white tuffacaceous sandstone and claystone). Surficial geology of EF-1 was primarily Alluvium and Colluvium. Other surficial geology in this watershed included Glacial Deposits. GC-1 had a surficial geology of Undivided Surficial Deposits. Also contributing to the Gilbert Creek watershed were Landslide Deposits and Bishop Conglomerate. Surficial geology of the SF-1 was primarily Alluvium and Colluvium. Contributing surficial geology was the same as W-F-2 (Wyoming Oil and Gas Resource Assessment Mapper website 2002). The National Resource Conservation Service state-wide digital soils map of Wyoming (STATSGO) listed the general soil taxonomy (order/suborder/great group/subgroup) at WF-1 as Uinta-Lail-Amsden (WY181). Uinta (15%) is a well drained soil with moderate infiltration rates. Lail (15%) is well drained with slow infiltration rates, and Amsden (15%) is well drained with moderate infiltration rates. Ten other soil types made up the remaining 55% of the soil
7
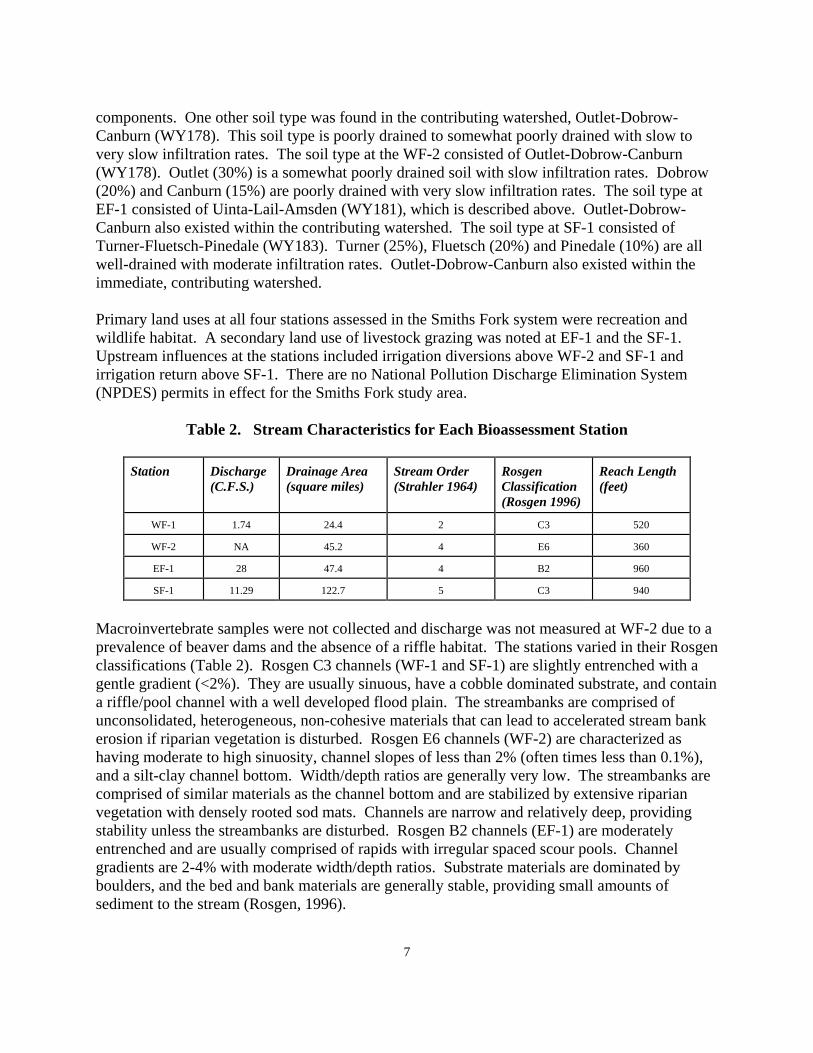
components. One other soil type was found in the contributing watershed, Outlet-Dobrow-Canburn (WY178). This soil type is poorly drained to somewhat poorly drained with slow to very slow infiltration rates. The soil type at the WF-2 consisted of Outlet-Dobrow-Canburn (WY178). Outlet (30%) is a somewhat poorly drained soil with slow infiltration rates. Dobrow (20%) and Canburn (15%) are poorly drained with very slow infiltration rates. The soil type at EF-1 consisted of Uinta-Lail-Amsden (WY181), which is described above. Outlet-Dobrow-Canburn also existed within the contributing watershed. The soil type at SF-1 consisted of Turner-Fluetsch-Pinedale (WY183). Turner (25%), Fluetsch (20%) and Pinedale (10%) are all well-drained with moderate infiltration rates. Outlet-Dobrow-Canburn also existed within the immediate, contributing watershed. Primary land uses at all four stations assessed in the Smiths Fork system were recreation and wildlife habitat. A secondary land use of livestock grazing was noted at EF-1 and the SF-1. Upstream influences at the stations included irrigation diversions above WF-2 and SF-1 and irrigation return above SF-1. There are no National Pollution Discharge Elimination System (NPDES) permits in effect for the Smiths Fork study area.
Table 2. Stream Characteristics for Each Bioassessment Station
Station
Discharge (C.F.S.)
Drainage Area (square miles)
Stream Order (Strahler 1964)
Rosgen Classification (Rosgen 1996)
Reach Length (feet)
WF-1 1.74 24.4 2 C3 520
WF-2 NA 45.2 4 E6 360
EF-1 28 47.4 4 B2 960
SF-1 11.29 122.7 5 C3 940
Macroinvertebrate samples were not collected and discharge was not measured at WF-2 due to a prevalence of beaver dams and the absence of a riffle habitat. The stations varied in their Rosgen classifications (Table 2). Rosgen C3 channels (WF-1 and SF-1) are slightly entrenched with a gentle gradient (<2%). They are usually sinuous, have a cobble dominated substrate, and contain a riffle/pool channel with a well developed flood plain. The streambanks are comprised of unconsolidated, heterogeneous, non-cohesive materials that can lead to accelerated stream bank erosion if riparian vegetation is disturbed. Rosgen E6 channels (WF-2) are characterized as having moderate to high sinuosity, channel slopes of less than 2% (often times less than 0.1%), and a silt-clay channel bottom. Width/depth ratios are generally very low. The streambanks are comprised of similar materials as the channel bottom and are stabilized by extensive riparian vegetation with densely rooted sod mats. Channels are narrow and relatively deep, providing stability unless the streambanks are disturbed. Rosgen B2 channels (EF-1) are moderately entrenched and are usually comprised of rapids with irregular spaced scour pools. Channel gradients are 2-4% with moderate width/depth ratios. Substrate materials are dominated by boulders, and the bed and bank materials are generally stable, providing small amounts of sediment to the stream (Rosgen, 1996).
8
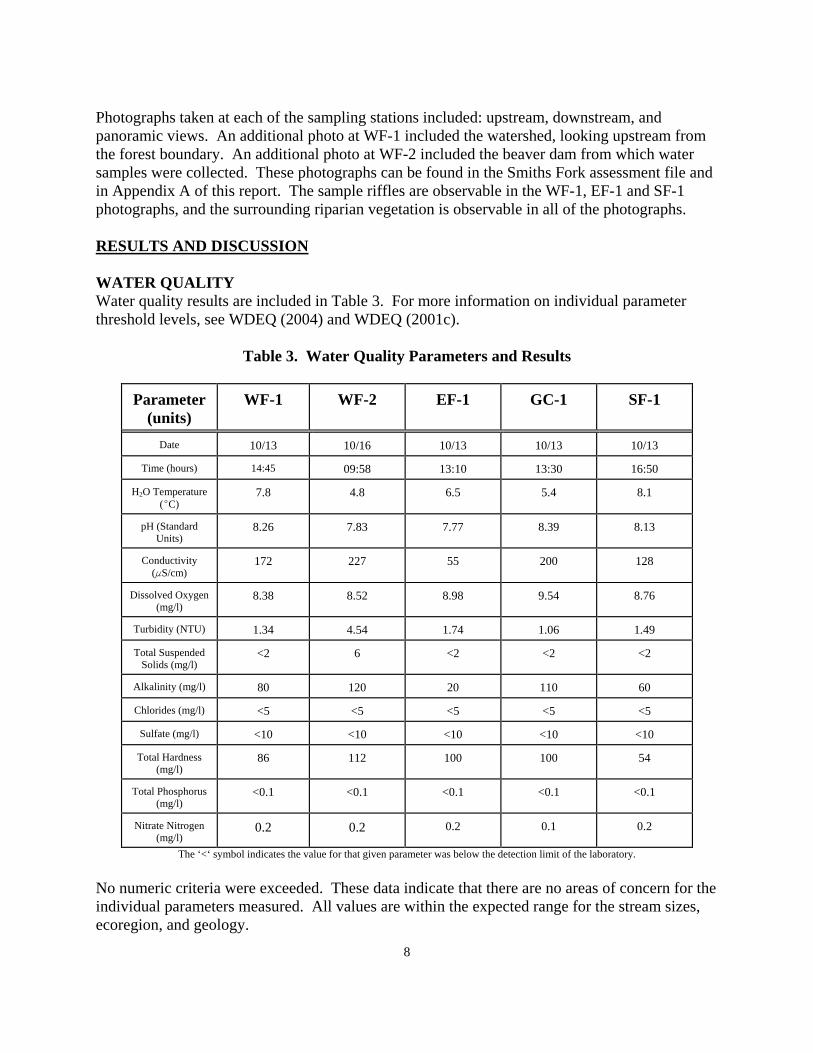
Photographs taken at each of the sampling stations included: upstream, downstream, and panoramic views. An additional photo at WF-1 included the watershed, looking upstream from the forest boundary. An additional photo at WF-2 included the beaver dam from which water samples were collected. These photographs can be found in the Smiths Fork assessment file and in Appendix A of this report. The sample riffles are observable in the WF-1, EF-1 and SF-1 photographs, and the surrounding riparian vegetation is observable in all of the photographs. RESULTS AND DISCUSSION WATER QUALITY Water quality results are included in Table 3. For more information on individual parameter threshold levels, see WDEQ (2004) and WDEQ (2001c).
Table 3. Water Quality Parameters and Results
Parameter (units)
WF-1 WF-2 EF-1 GC-1 SF-1
Date 10/13 10/16 10/13 10/13 10/13
Time (hours) 14:45 09:58 13:10 13:30 16:50
H2O Temperature (EC)
7.8 4.8 6.5 5.4 8.1
pH (Standard Units)
8.26 7.83 7.77 8.39 8.13
Conductivity (FS/cm)
172 227 55 200 128
Dissolved Oxygen (mg/l)
8.38 8.52 8.98 9.54 8.76
Turbidity (NTU) 1.34 4.54 1.74 1.06 1.49
Total Suspended Solids (mg/l)
<2 6 <2 <2 <2
Alkalinity (mg/l) 80 120 20 110 60
Chlorides (mg/l) <5 <5 <5 <5 <5
Sulfate (mg/l) <10 <10 <10 <10 <10
Total Hardness (mg/l)
86 112 100 100 54
Total Phosphorus (mg/l)
<0.1 <0.1 <0.1 <0.1 <0.1
Nitrate Nitrogen (mg/l)
0.2 0.2 0.2 0.1 0.2
The ‘<‘ symbol indicates the value for that given parameter was below the detection limit of the laboratory.
No numeric criteria were exceeded. These data indicate that there are no areas of concern for the individual parameters measured. All values are within the expected range for the stream sizes, ecoregion, and geology.
9
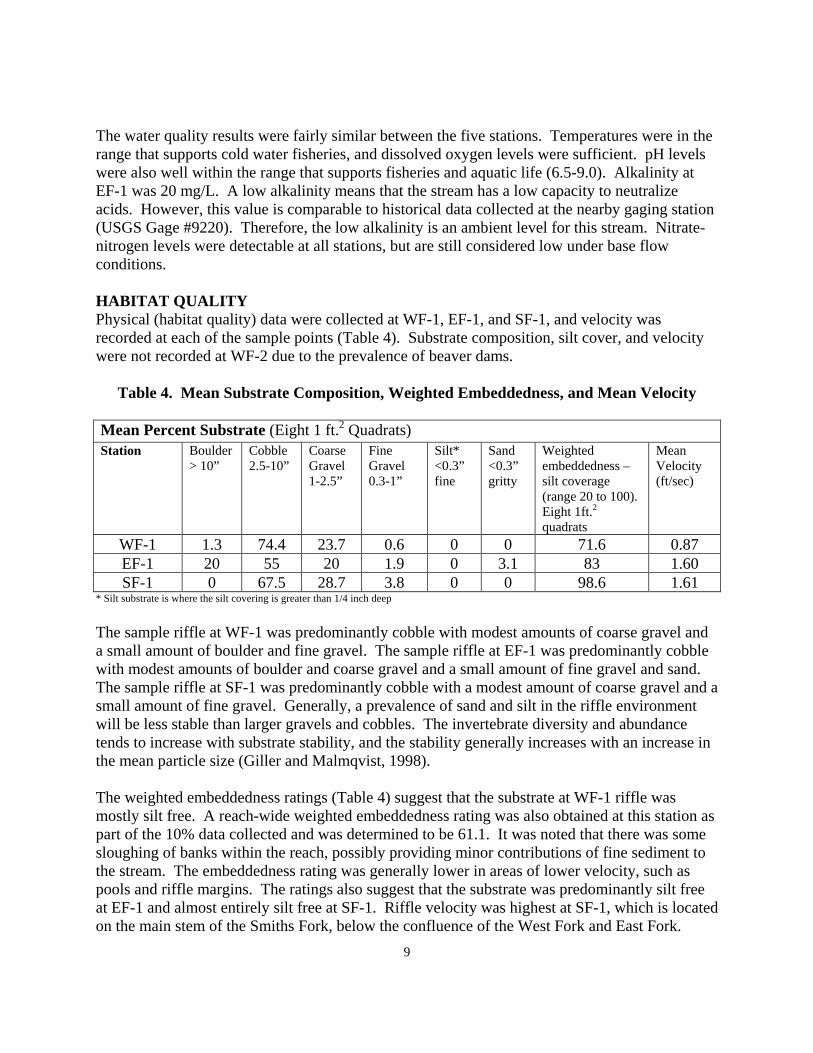
The water quality results were fairly similar between the five stations. Temperatures were in the range that supports cold water fisheries, and dissolved oxygen levels were sufficient. pH levels were also well within the range that supports fisheries and aquatic life (6.5-9.0). Alkalinity at EF-1 was 20 mg/L. A low alkalinity means that the stream has a low capacity to neutralize acids. However, this value is comparable to historical data collected at the nearby gaging station (USGS Gage #9220). Therefore, the low alkalinity is an ambient level for this stream. Nitrate-nitrogen levels were detectable at all stations, but are still considered low under base flow conditions. HABITAT QUALITY Physical (habitat quality) data were collected at WF-1, EF-1, and SF-1, and velocity was recorded at each of the sample points (Table 4). Substrate composition, silt cover, and velocity were not recorded at WF-2 due to the prevalence of beaver dams.
Table 4. Mean Substrate Composition, Weighted Embeddedness, and Mean Velocity Mean Percent Substrate (Eight 1 ft.2 Quadrats) Station Boulder
> 10” Cobble 2.5-10”
Coarse Gravel 1-2.5”
Fine Gravel 0.3-1”
Silt* <0.3” fine
Sand <0.3” gritty
Weighted embeddedness –silt coverage (range 20 to 100). Eight 1ft.2 quadrats
Mean Velocity (ft/sec)
WF-1 1.3 74.4 23.7 0.6 0 0 71.6 0.87 EF-1 20 55 20 1.9 0 3.1 83 1.60 SF-1 0 67.5 28.7 3.8 0 0 98.6 1.61
* Silt substrate is where the silt covering is greater than 1/4 inch deep
The sample riffle at WF-1 was predominantly cobble with modest amounts of coarse gravel and a small amount of boulder and fine gravel. The sample riffle at EF-1 was predominantly cobble with modest amounts of boulder and coarse gravel and a small amount of fine gravel and sand. The sample riffle at SF-1 was predominantly cobble with a modest amount of coarse gravel and a small amount of fine gravel. Generally, a prevalence of sand and silt in the riffle environment will be less stable than larger gravels and cobbles. The invertebrate diversity and abundance tends to increase with substrate stability, and the stability generally increases with an increase in the mean particle size (Giller and Malmqvist, 1998). The weighted embeddedness ratings (Table 4) suggest that the substrate at WF-1 riffle was mostly silt free. A reach-wide weighted embeddedness rating was also obtained at this station as part of the 10% data collected and was determined to be 61.1. It was noted that there was some sloughing of banks within the reach, possibly providing minor contributions of fine sediment to the stream. The embeddedness rating was generally lower in areas of lower velocity, such as pools and riffle margins. The ratings also suggest that the substrate was predominantly silt free at EF-1 and almost entirely silt free at SF-1. Riffle velocity was highest at SF-1, which is located on the main stem of the Smiths Fork, below the confluence of the West Fork and East Fork.
10
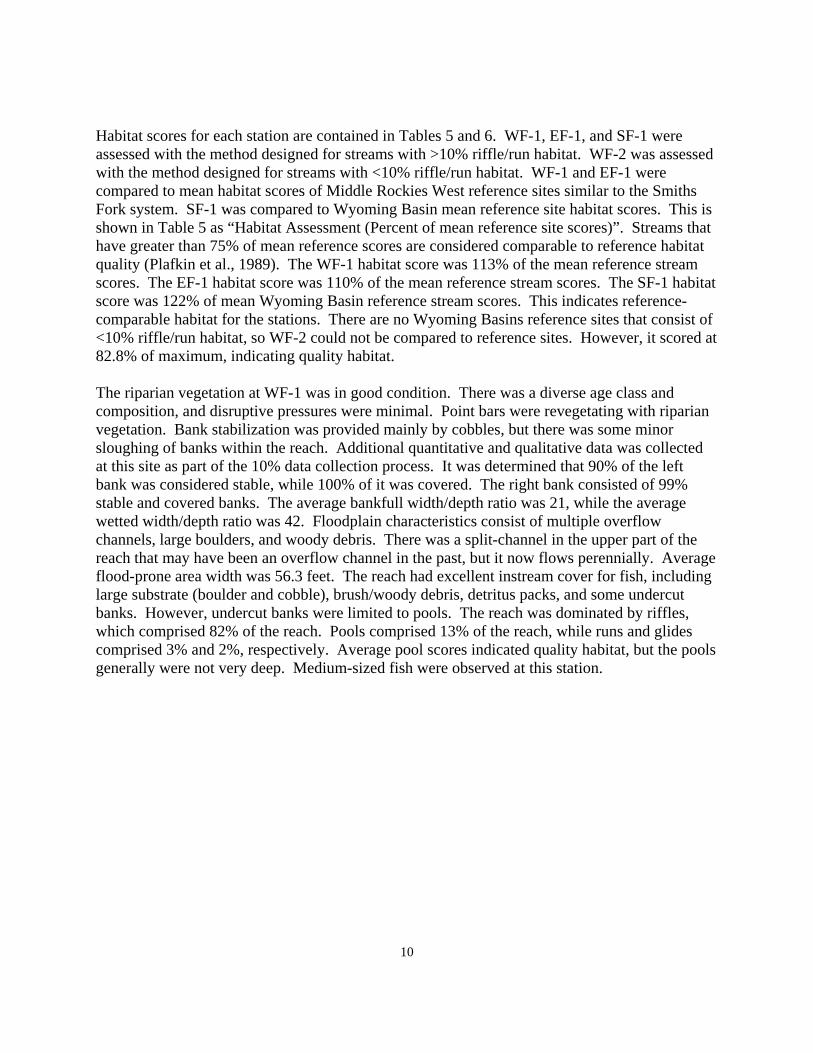
Habitat scores for each station are contained in Tables 5 and 6. WF-1, EF-1, and SF-1 were assessed with the method designed for streams with >10% riffle/run habitat. WF-2 was assessed with the method designed for streams with <10% riffle/run habitat. WF-1 and EF-1 were compared to mean habitat scores of Middle Rockies West reference sites similar to the Smiths Fork system. SF-1 was compared to Wyoming Basin mean reference site habitat scores. This is shown in Table 5 as “Habitat Assessment (Percent of mean reference site scores)”. Streams that have greater than 75% of mean reference scores are considered comparable to reference habitat quality (Plafkin et al., 1989). The WF-1 habitat score was 113% of the mean reference stream scores. The EF-1 habitat score was 110% of the mean reference stream scores. The SF-1 habitat score was 122% of mean Wyoming Basin reference stream scores. This indicates reference-comparable habitat for the stations. There are no Wyoming Basins reference sites that consist of <10% riffle/run habitat, so WF-2 could not be compared to reference sites. However, it scored at 82.8% of maximum, indicating quality habitat. The riparian vegetation at WF-1 was in good condition. There was a diverse age class and composition, and disruptive pressures were minimal. Point bars were revegetating with riparian vegetation. Bank stabilization was provided mainly by cobbles, but there was some minor sloughing of banks within the reach. Additional quantitative and qualitative data was collected at this site as part of the 10% data collection process. It was determined that 90% of the left bank was considered stable, while 100% of it was covered. The right bank consisted of 99% stable and covered banks. The average bankfull width/depth ratio was 21, while the average wetted width/depth ratio was 42. Floodplain characteristics consist of multiple overflow channels, large boulders, and woody debris. There was a split-channel in the upper part of the reach that may have been an overflow channel in the past, but it now flows perennially. Average flood-prone area width was 56.3 feet. The reach had excellent instream cover for fish, including large substrate (boulder and cobble), brush/woody debris, detritus packs, and some undercut banks. However, undercut banks were limited to pools. The reach was dominated by riffles, which comprised 82% of the reach. Pools comprised 13% of the reach, while runs and glides comprised 3% and 2%, respectively. Average pool scores indicated quality habitat, but the pools generally were not very deep. Medium-sized fish were observed at this station.
11
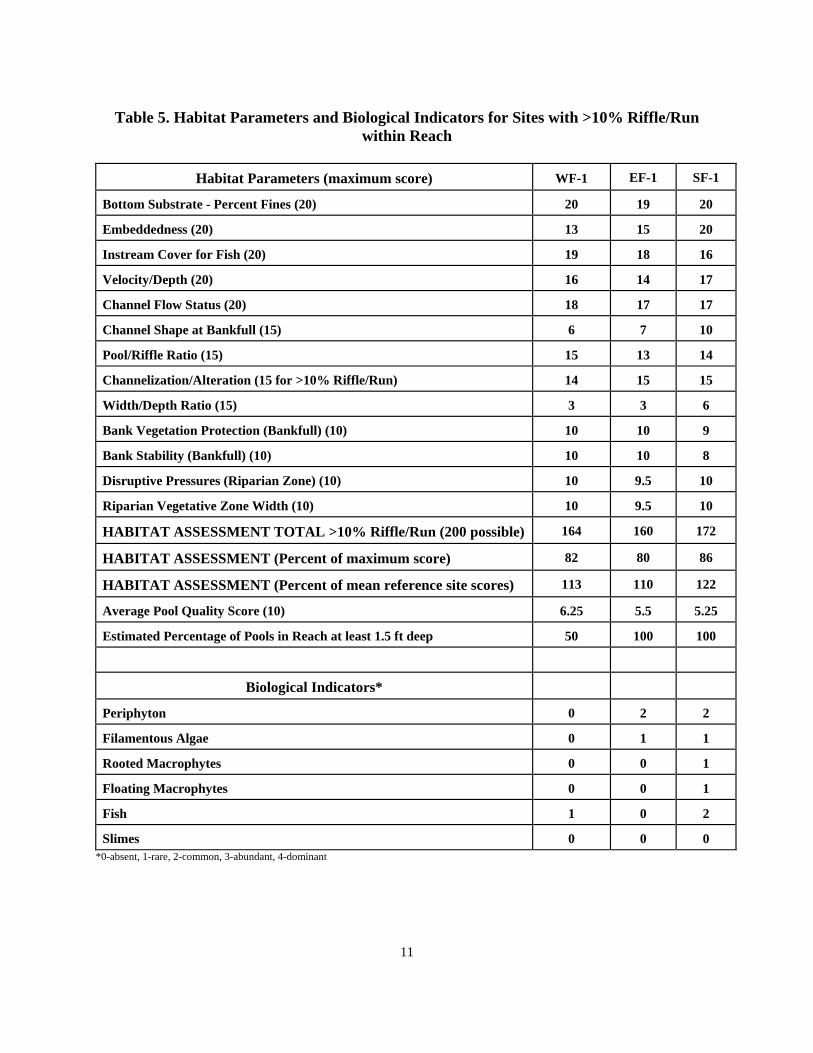
Table 5. Habitat Parameters and Biological Indicators for Sites with >10% Riffle/Run within Reach
Habitat Parameters (maximum score) WF-1 EF-1 SF-1
Bottom Substrate - Percent Fines (20) 20 19 20
Embeddedness (20) 13 15 20
Instream Cover for Fish (20) 19 18 16
Velocity/Depth (20) 16 14 17
Channel Flow Status (20) 18 17 17
Channel Shape at Bankfull (15) 6 7 10
Pool/Riffle Ratio (15) 15 13 14
Channelization/Alteration (15 for >10% Riffle/Run) 14 15 15
Width/Depth Ratio (15) 3 3 6
Bank Vegetation Protection (Bankfull) (10) 10 10 9
Bank Stability (Bankfull) (10) 10 10 8
Disruptive Pressures (Riparian Zone) (10) 10 9.5 10
Riparian Vegetative Zone Width (10) 10 9.5 10
HABITAT ASSESSMENT TOTAL >10% Riffle/Run (200 possible) 164 160 172
HABITAT ASSESSMENT (Percent of maximum score) 82 80 86
HABITAT ASSESSMENT (Percent of mean reference site scores) 113 110 122
Average Pool Quality Score (10) 6.25 5.5 5.25
Estimated Percentage of Pools in Reach at least 1.5 ft deep 50 100 100
Biological Indicators*
Periphyton 0 2 2
Filamentous Algae 0 1 1
Rooted Macrophytes 0 0 1
Floating Macrophytes 0 0 1
Fish 1 0 2
Slimes 0 0 0 *0-absent, 1-rare, 2-common, 3-abundant, 4-dominant
12
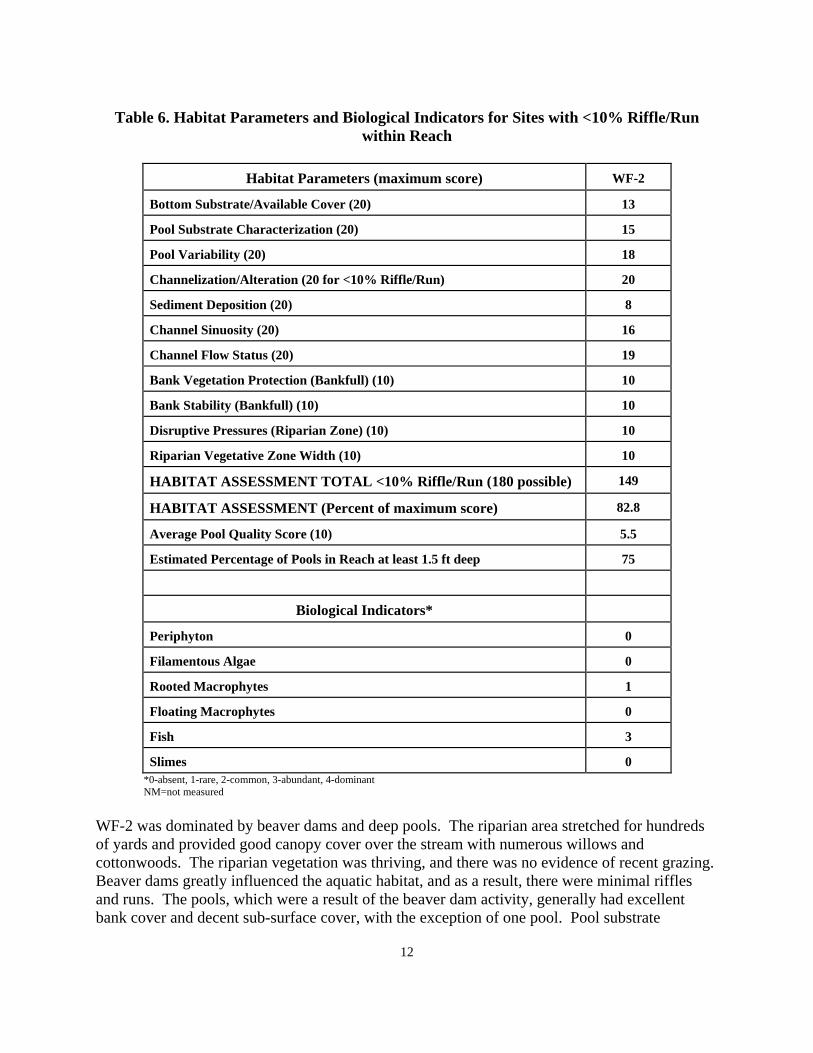
Table 6. Habitat Parameters and Biological Indicators for Sites with <10% Riffle/Run within Reach
Habitat Parameters (maximum score) WF-2
Bottom Substrate/Available Cover (20) 13
Pool Substrate Characterization (20) 15
Pool Variability (20) 18
Channelization/Alteration (20 for <10% Riffle/Run) 20
Sediment Deposition (20) 8
Channel Sinuosity (20) 16
Channel Flow Status (20) 19
Bank Vegetation Protection (Bankfull) (10) 10
Bank Stability (Bankfull) (10) 10
Disruptive Pressures (Riparian Zone) (10) 10
Riparian Vegetative Zone Width (10) 10
HABITAT ASSESSMENT TOTAL <10% Riffle/Run (180 possible) 149
HABITAT ASSESSMENT (Percent of maximum score) 82.8
Average Pool Quality Score (10) 5.5
Estimated Percentage of Pools in Reach at least 1.5 ft deep 75
Biological Indicators*
Periphyton 0
Filamentous Algae 0
Rooted Macrophytes 1
Floating Macrophytes 0
Fish 3
Slimes 0 *0-absent, 1-rare, 2-common, 3-abundant, 4-dominant NM=not measured WF-2 was dominated by beaver dams and deep pools. The riparian area stretched for hundreds of yards and provided good canopy cover over the stream with numerous willows and cottonwoods. The riparian vegetation was thriving, and there was no evidence of recent grazing. Beaver dams greatly influenced the aquatic habitat, and as a result, there were minimal riffles and runs. The pools, which were a result of the beaver dam activity, generally had excellent bank cover and decent sub-surface cover, with the exception of one pool. Pool substrate
13
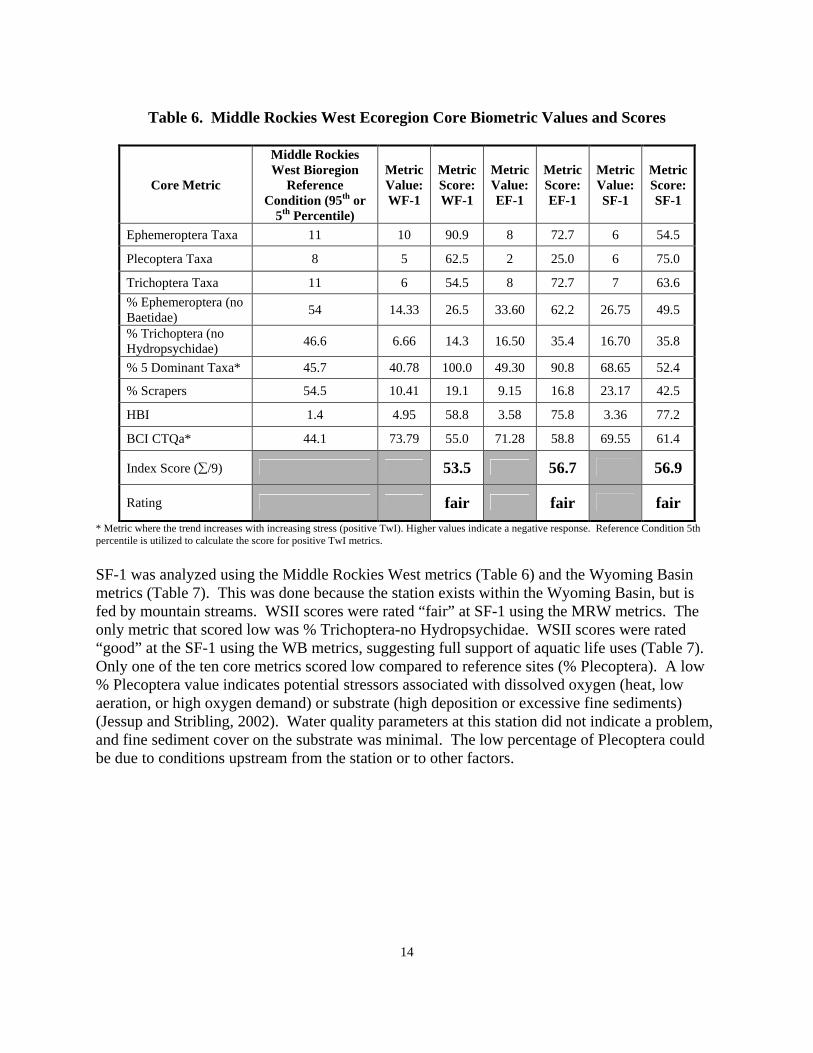
consisted mainly of silt that was being retained by the beaver dams. Abundant medium sized fish were observed at this station. The riparian area at EF-1 was of the width expected for a steep channel, with bank support coming largely from non-riparian trees, such as pines, and cobbles and boulders. Willows were also present, but were mainly older with little recruitment. Canopy cover over the stream was abundant, providing plenty of shade. The reach was riffle dominated with few pools or glides. Energy dissipation was achieved through channel roughness (large substrate) and overflow channels. The reach provided good instream cover for fish, including cobbles, boulders, submerged logs and snags. The pools scored well for subsurface cover and dominant substrate, but poor for overhead cover. This was due to the large width of the stream and the location of the pools in the center of the stream, often far from the vegetated banks. No fish were observed at this station, but dark substrate and turbulent water made viewing underwater difficult. SF-1 had an extensive riparian area with willows, sedges and cottonwoods, all having a diverse age-class distribution. Floodplain characteristics consisted of cobbles, boulders, and some large woody debris. Energy dissipation was achieved mainly by secondary channels, floodplain access, and sinuosity. The reach was dominated by riffles. Fish cover was provided mainly by larger substrate and deep pools. Overhead cover at the pools was minimal. Fish were commonly seen at this station. MACROINVERTEBRATES AND BIOLOGICAL CONDITION The Wyoming Stream Integrity Index (WSII) was used to analyze the biological integrity of the stream stations (Tables 6 and 7). WSII scores were rated “fair” at WF-1, suggesting partial support of aquatic life uses (Table 6). Three of the nine core metrics scored low compared to reference sites (% Ephemeroptera-no Baetidae, % Trichoptera-no Hydropsychidae, and % Scrapers). Baetidae are more tolerant to stressors than other Ephemeroptera (mayfly) species. Therefore, the metric indicates that only 14.33% of the macroinvertebrate sample was relatively intolerant mayflies, leading to a low score (26.5). Hydropsychidae are more tolerant to stressors than other Trichoptera (caddisfly) species. Therefore, the metric indicates that only 6.66% of the macroinvertebrate sample was relatively intolerant caddisflies, leading to a low score (14.3). Scrapers are considered specialist feeders that are generally more sensitive to pollution or disturbance because they rely on a single type of food source. A low score for % Scrapers (19.1) can indicate a potential water quality problem (Jessup and Stribling, 2002). WSII scores were rated “fair” at EF-1, suggesting partial support of aquatic life uses (Table 6). Three of the nine core metrics scored low compared to reference sites (Plecoptera taxa, % Trichoptera-no Hydropsychidae, and % Scrapers). These are some of the same metrics that scored low at WF-1 as well. Only two taxa of Plecoptera (stonefly) were collected, giving a score of 25.0. Stoneflies are usually found in cool, clear streams with low amounts of sediments and high dissolved oxygen. Being pollution sensitive, these macroinvertebrates are generally one of the first groups to disappear when stream conditions worsen (Jessup and Stribling, 2002). Only one species of Trichoptera collected was classified in the Hydropsychidae family. However, the sample contained a relatively small percentage of Trichoptera individuals, resulting in a low % Trichoptera-no Hydropsychidae score.
14
Table 6. Middle Rockies West Ecoregion Core Biometric Values and Scores
Core Metric
Middle Rockies West Bioregion
Reference Condition (95th or
5th Percentile)
Metric Value: WF-1
Metric Score: WF-1
Metric Value: EF-1
Metric Score: EF-1
Metric Value: SF-1
Metric Score: SF-1
Ephemeroptera Taxa 11 10 90.9 8 72.7 6 54.5
Plecoptera Taxa 8 5 62.5 2 25.0 6 75.0
Trichoptera Taxa 11 6 54.5 8 72.7 7 63.6
% Ephemeroptera (no Baetidae)
54 14.33 26.5 33.60 62.2 26.75 49.5
% Trichoptera (no Hydropsychidae)
46.6 6.66 14.3 16.50 35.4 16.70 35.8
% 5 Dominant Taxa* 45.7 40.78 100.0 49.30 90.8 68.65 52.4
% Scrapers 54.5 10.41 19.1 9.15 16.8 23.17 42.5
HBI 1.4 4.95 58.8 3.58 75.8 3.36 77.2
BCI CTQa* 44.1 73.79 55.0 71.28 58.8 69.55 61.4
Index Score (∑/9) 53.5 56.7 56.9
Rating fair fair fair
* Metric where the trend increases with increasing stress (positive TwI). Higher values indicate a negative response. Reference Condition 5th percentile is utilized to calculate the score for positive TwI metrics.
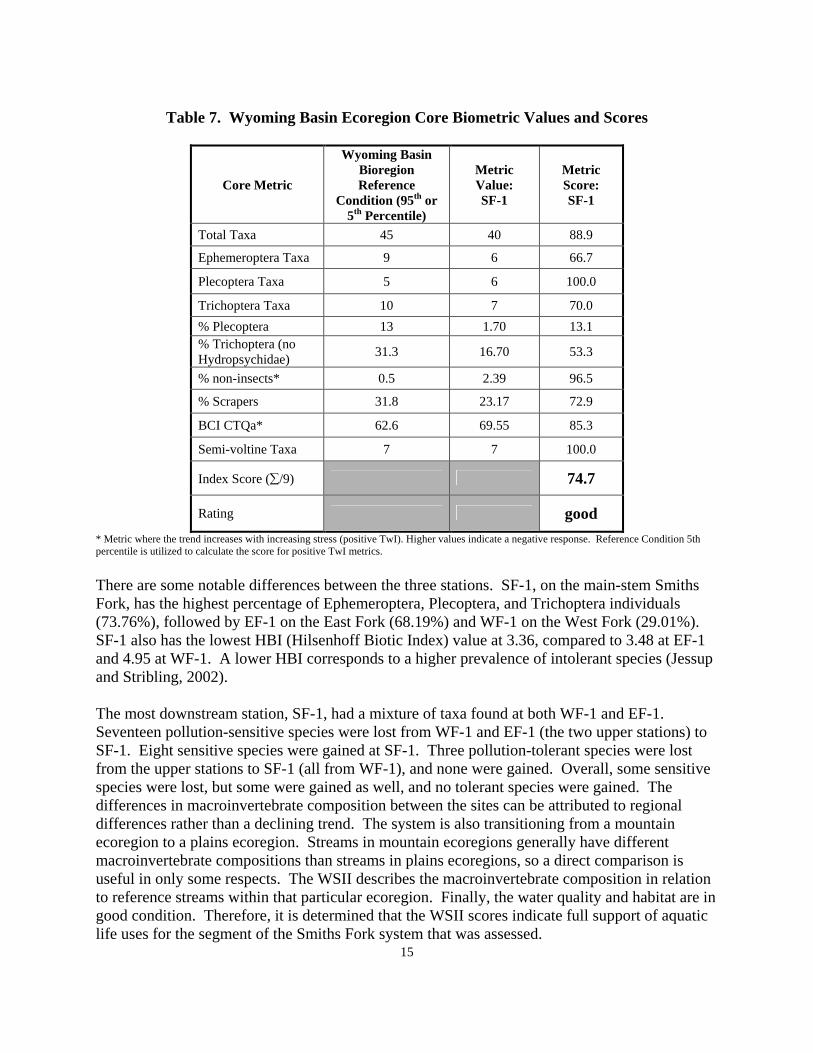
SF-1 was analyzed using the Middle Rockies West metrics (Table 6) and the Wyoming Basin metrics (Table 7). This was done because the station exists within the Wyoming Basin, but is fed by mountain streams. WSII scores were rated “fair” at SF-1 using the MRW metrics. The only metric that scored low was % Trichoptera-no Hydropsychidae. WSII scores were rated “good” at the SF-1 using the WB metrics, suggesting full support of aquatic life uses (Table 7). Only one of the ten core metrics scored low compared to reference sites (% Plecoptera). A low % Plecoptera value indicates potential stressors associated with dissolved oxygen (heat, low aeration, or high oxygen demand) or substrate (high deposition or excessive fine sediments) (Jessup and Stribling, 2002). Water quality parameters at this station did not indicate a problem, and fine sediment cover on the substrate was minimal. The low percentage of Plecoptera could be due to conditions upstream from the station or to other factors.
15
Table 7. Wyoming Basin Ecoregion Core Biometric Values and Scores
Core Metric
Wyoming Basin Bioregion Reference
Condition (95th or 5th Percentile)
Metric Value: SF-1
Metric Score: SF-1
Total Taxa 45 40 88.9
Ephemeroptera Taxa 9 6 66.7
Plecoptera Taxa 5 6 100.0
Trichoptera Taxa 10 7 70.0
% Plecoptera 13 1.70 13.1 % Trichoptera (no Hydropsychidae)
31.3 16.70 53.3
% non-insects* 0.5 2.39 96.5
% Scrapers 31.8 23.17 72.9
BCI CTQa* 62.6 69.55 85.3
Semi-voltine Taxa 7 7 100.0
Index Score (∑/9) 74.7
Rating good
* Metric where the trend increases with increasing stress (positive TwI). Higher values indicate a negative response. Reference Condition 5th percentile is utilized to calculate the score for positive TwI metrics.
There are some notable differences between the three stations. SF-1, on the main-stem Smiths Fork, has the highest percentage of Ephemeroptera, Plecoptera, and Trichoptera individuals (73.76%), followed by EF-1 on the East Fork (68.19%) and WF-1 on the West Fork (29.01%). SF-1 also has the lowest HBI (Hilsenhoff Biotic Index) value at 3.36, compared to 3.48 at EF-1 and 4.95 at WF-1. A lower HBI corresponds to a higher prevalence of intolerant species (Jessup and Stribling, 2002). The most downstream station, SF-1, had a mixture of taxa found at both WF-1 and EF-1. Seventeen pollution-sensitive species were lost from WF-1 and EF-1 (the two upper stations) to SF-1. Eight sensitive species were gained at SF-1. Three pollution-tolerant species were lost from the upper stations to SF-1 (all from WF-1), and none were gained. Overall, some sensitive species were lost, but some were gained as well, and no tolerant species were gained. The differences in macroinvertebrate composition between the sites can be attributed to regional differences rather than a declining trend. The system is also transitioning from a mountain ecoregion to a plains ecoregion. Streams in mountain ecoregions generally have different macroinvertebrate compositions than streams in plains ecoregions, so a direct comparison is useful in only some respects. The WSII describes the macroinvertebrate composition in relation to reference streams within that particular ecoregion. Finally, the water quality and habitat are in good condition. Therefore, it is determined that the WSII scores indicate full support of aquatic life uses for the segment of the Smiths Fork system that was assessed.
16
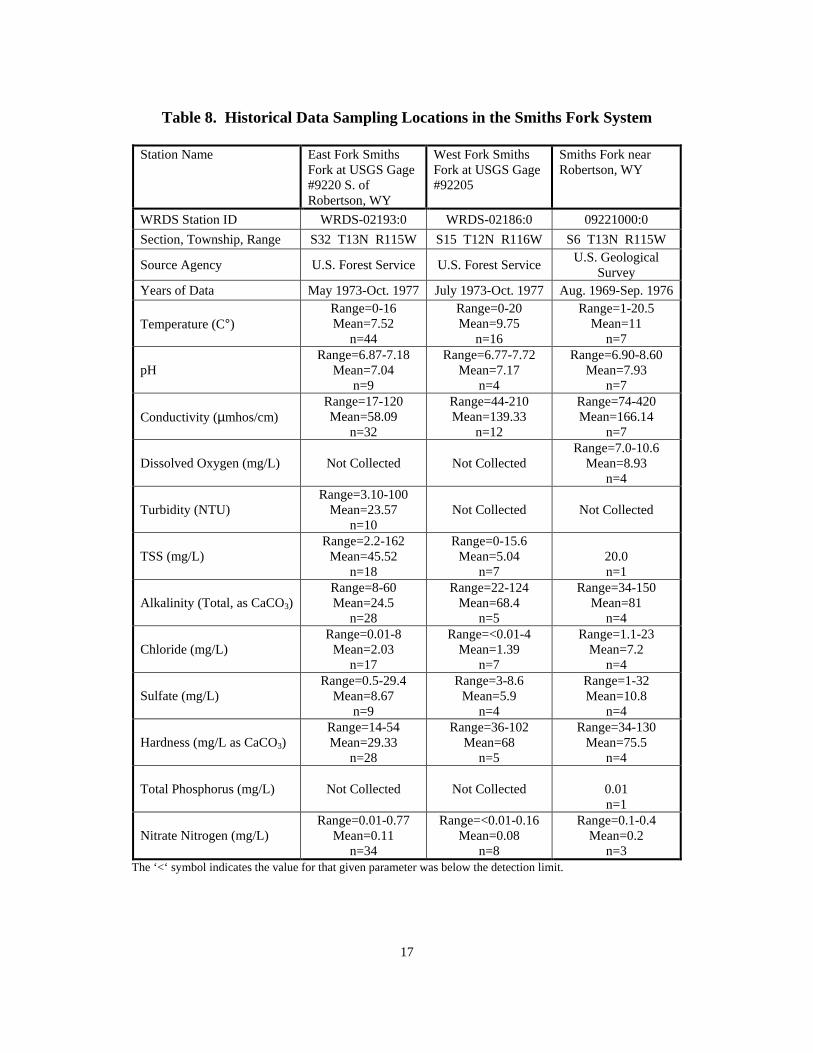
Macroinvertebrates were not sampled at WF-2 due to the predominance of beaver dams, making it difficult to locate a representative riffle. General Biological Observations: WF-1: elk scat; multiple species of willow; rushes; sedges; lodgepole pine; some spruce WF-2: some dead wood (old, dead willows and cottonwoods); thriving sedges and willows of various ages; numerous grass species EF-1: elk scat; older willows; logs and woody debris in stream SF-1: dipper observed; extensive riparian area HISTORICAL AND ANCILLARY INFORMATION The Water Resources Data System database provides data for three locations on the Smiths Fork system (See Table 8). Station WRDS-02193:0 data, provided by the U.S. Forest Service (USFS), was obtained from the USGS gaging station immediately downstream of the East Fork bioassessment station (EF-1) associated with this report. EF-1 had significantly lower turbidity and suspended solids readings than the historical data. The pH value from 2003 was slightly higher than the historical range, but still within the acceptable WDEQ water quality criteria. The 2003 data also showed a hardness reading of 100 mg/L, almost double the maximum value obtained during historical sampling. However, the 2003 hardness data is still comparable to reference streams. Station WRDS-02186:0 data, provided by the USFS, was obtained from the USGS gaging station approximately 0.5 miles upstream from the WF-1. The 2003 pH value, 8.26, was higher than the maximum historical value of 7.72. However, it still falls within the acceptable WDEQ water quality criteria. Nitrate nitrogen in the 2003 sample was 0.2 mg/L, slightly higher than the maximum historical value, 0.16 mg/L. However, it was still low enough that it is not considered a concern. Station 09221000:0 data, provided by the USGS, was obtained from sampling at a location approximately one and a half miles downstream from the Smiths Fork Section 12 station. All 2003 water quality parameters were within the range of historical values. The majority of the 2003 data falls within the range of historical values. The 2003 data that were outside historical values do not indicate any water quality concerns.
17
Table 8. Historical Data Sampling Locations in the Smiths Fork System
Station Name East Fork Smiths Fork at USGS Gage #9220 S. of Robertson, WY
West Fork Smiths Fork at USGS Gage #92205
Smiths Fork near Robertson, WY
WRDS Station ID WRDS-02193:0 WRDS-02186:0 09221000:0
Section, Township, Range S32 T13N R115W S15 T12N R116W S6 T13N R115W
Source Agency U.S. Forest Service U.S. Forest Service U.S. Geological
Survey Years of Data May 1973-Oct. 1977 July 1973-Oct. 1977 Aug. 1969-Sep. 1976
Temperature (C°) Range=0-16 Mean=7.52
n=44
Range=0-20 Mean=9.75
n=16
Range=1-20.5 Mean=11
n=7
pH Range=6.87-7.18
Mean=7.04 n=9
Range=6.77-7.72 Mean=7.17
n=4
Range=6.90-8.60 Mean=7.93
n=7
Conductivity (µmhos/cm) Range=17-120 Mean=58.09
n=32
Range=44-210 Mean=139.33
n=12
Range=74-420 Mean=166.14
n=7
Dissolved Oxygen (mg/L)
Not Collected
Not Collected Range=7.0-10.6
Mean=8.93 n=4
Turbidity (NTU) Range=3.10-100
Mean=23.57 n=10
Not Collected
Not Collected
TSS (mg/L) Range=2.2-162
Mean=45.52 n=18
Range=0-15.6 Mean=5.04
n=7
20.0 n=1
Alkalinity (Total, as CaCO3) Range=8-60 Mean=24.5
n=28
Range=22-124 Mean=68.4
n=5
Range=34-150 Mean=81
n=4
Chloride (mg/L) Range=0.01-8 Mean=2.03
n=17
Range=<0.01-4 Mean=1.39
n=7
Range=1.1-23 Mean=7.2
n=4
Sulfate (mg/L) Range=0.5-29.4
Mean=8.67 n=9
Range=3-8.6 Mean=5.9
n=4
Range=1-32 Mean=10.8
n=4
Hardness (mg/L as CaCO3) Range=14-54 Mean=29.33
n=28
Range=36-102 Mean=68
n=5
Range=34-130 Mean=75.5
n=4
Total Phosphorus (mg/L) Not Collected Not Collected
0.01 n=1
Nitrate Nitrogen (mg/L) Range=0.01-0.77
Mean=0.11 n=34
Range=<0.01-0.16 Mean=0.08
n=8
Range=0.1-0.4 Mean=0.2
n=3 The ‘<‘ symbol indicates the value for that given parameter was below the detection limit.
18
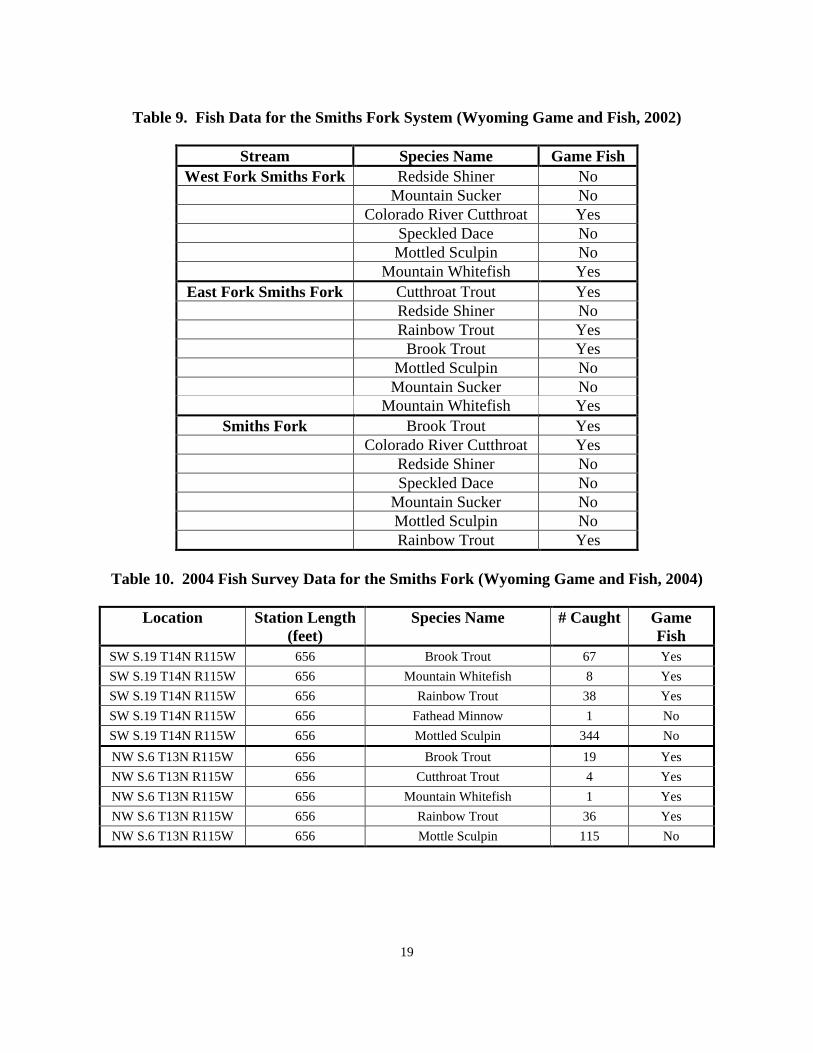
Bacteria Data: Historical fecal coliform data has been collected at the following stations: East Fork Smiths Fork at USGS Gage #9220 S. of Robertson, WY; and West Fork Smiths Fork at USGS Gage #92205. The East Fork station had a sample size of 36 (taken from 1974-1977), a minimum of 0 cols./100mL (obtained in 11 samples), a maximum of 1,150 cols./100mL, and an average of 80.14 cols./100mL. The West Fork station had a sample size of 15 (taken from 1975-1977), a minimum of 0 cols./100mL (obtained in 3 samples), a maximum of 320 cols./100mL, and an average of 84.33 cols./100mL. Fecal coliform data was not collected on the Smiths Fork system in 2003, so a comparison cannot be made. Bacteria sampling is presently being performed by the Uinta County Conservation District on the Smiths Fork system above the Willow Creek confluence. Monitoring has been underway since the spring of 2002, performed twice a year (spring and late summer), utilizing the geometric mean approach. Sampling results were not available for this report, but are being incorporated into the Watershed Management Plan for the Smiths Fork system. Fish Data: The Wyoming Game and Fish database states that various fish species have been found in the West Fork Smiths Fork, East Fork Smiths Fork, and the main stem of the Smiths Fork (Table 9). Fish survey data on the West Fork and East Fork was collected at Township 13N, Range 116W, Section 13, just upstream from the confluence of the two streams. Fish survey data on the main stem of the Smiths Fork was collected at Township 16N, Range 113W, Section 6, just upstream from the confluence of the Smiths Fork and the Blacks Fork. The survey data represents the entire 2AB section of the West Fork, East Fork, and Smiths Fork, which includes the four WDEQ stations. Wyoming Game and Fish data indicate that the Smiths Fork system has the capacity to support coldwater game fish species. Additional fish survey data was collected from the Smiths Fork by the Wyoming Game and Fish in 2004 in a study funded by the Bureau of Reclamation (Table 10). Fish survey data was not collected for the East Fork or West Fork. The 2004 data also indicates that the Smiths Fork system has the capacity to support cold water game fish species. The sampling stations are listed by the most downstream station first, then moving upstream. Fish survey data was collected in the Smiths Fork below the Willow Creek confluence, but only the data above the confluence is shown in Table 10.
19
Table 9. Fish Data for the Smiths Fork System (Wyoming Game and Fish, 2002)
Stream Species Name Game Fish West Fork Smiths Fork Redside Shiner No
Mountain Sucker No Colorado River Cutthroat Yes Speckled Dace No Mottled Sculpin No Mountain Whitefish Yes
East Fork Smiths Fork Cutthroat Trout Yes Redside Shiner No Rainbow Trout Yes Brook Trout Yes Mottled Sculpin No Mountain Sucker No Mountain Whitefish Yes
Smiths Fork Brook Trout Yes Colorado River Cutthroat Yes Redside Shiner No Speckled Dace No Mountain Sucker No Mottled Sculpin No Rainbow Trout Yes
Table 10. 2004 Fish Survey Data for the Smiths Fork (Wyoming Game and Fish, 2004)
Location Station Length
(feet) Species Name # Caught Game
Fish SW S.19 T14N R115W 656 Brook Trout 67 Yes
SW S.19 T14N R115W 656 Mountain Whitefish 8 Yes
SW S.19 T14N R115W 656 Rainbow Trout 38 Yes
SW S.19 T14N R115W 656 Fathead Minnow 1 No
SW S.19 T14N R115W 656 Mottled Sculpin 344 No
NW S.6 T13N R115W 656 Brook Trout 19 Yes
NW S.6 T13N R115W 656 Cutthroat Trout 4 Yes
NW S.6 T13N R115W 656 Mountain Whitefish 1 Yes
NW S.6 T13N R115W 656 Rainbow Trout 36 Yes
NW S.6 T13N R115W 656 Mottle Sculpin 115 No
20
SUMMARY AND CONCLUSIONS East Fork Smiths Fork, West Fork Smiths Fork, Smiths Fork Classification East Fork Smiths Fork, West Fork Smiths Fork, and the Smiths Fork (HUC 14040107) are correctly classified as 2AB water bodies. This conclusion is based primarily on the Wyoming Game and Fish database and in part from findings within this assessment. Water Quality Water quality data collected at the four stations on the Smiths Fork system on October 13th and 16th indicate no tested parameters exceed existing criteria. Bacteria, pesticides, and hydrocarbons were not included in the analysis and are not routinely sampled unless there is reasonable evidence that suggests a problem with these parameters. The West Fork, East Fork, and Smiths Fork are in full support for aquatic life uses with respect to water quality. Physical and Habitat Quality The habitat data indicate that most habitat parameters (substrate composition, embeddedeness, vegetative cover, etc.) are comparable to reference streams in the Middle Rockies West or Wyoming Basin. Silt cover is minimal at all of the stations, with WF-1 being slightly affected by some sloughing banks. Riparian vegetation is thriving, and fish cover is adequate at all of the stations. The overall habitat quality of the Smiths Fork system is in full support of designated uses. Macroinvertebrates and Biological Condition Bioassessment primary metrics indicate that the Smiths Fork system’s macroinvertebrate community is in fair to good condition. The macroinvertebrate condition seems to slightly improve moving downstream. The most downstream station (SF-1) had the highest percentage of pollution sensitive Ephemeroptera, Plecoptera, and Trichoptera. It also had the lowest HBI rating, indicating a higher prevalence of sensitive species. Some sensitive species were lost from the upper stations to the most downstream station, but some were gained as well, and no tolerant species were gained at the lower station. Also, the system is transitioning from a mountain ecoregion to a plains ecoregion. Streams in mountain ecoregions generally have different macroinvertebrate compositions than streams in plains ecoregions, so a direct comparison is useful in only some respects. The WSII describes the macroinvertebrate composition in relation to reference streams within that particular ecoregion. The macroinvertebrate analyses show that the Smiths Fork system is in full support of aquatic life. FINAL ASSESSMENT AND SIGNATURES Review of the current and historical chemical, biological, and physical data collected on the East Fork, West Fork, and Smiths Fork (from the confluence with Willow Creek upstream) indicate that the streams are in full support of all designated uses of a Class 2AB stream, with the exception of recreation due to the lack of current E. coli or fecal coliform data. This conclusion is based on the following items, in order of strength:
21
1. No water quality standard was exceeded under base flow conditions, and the values documented for the given parameters sampled do not identify any conditions that would suggest nutrient, sediment, or toxicant problems.
2. The benthic macroinvertebrate community is in fair to good condition relative to that of reference condition and does not show a declining trend.
3. Habitat scores were greater than 75% of mean reference scores and are considered comparable to reference habitat quality.
4. Historical and recent information from the Smiths Fork system indicates the support of a cold water game fish population.
Based on the data presented in this assessment, it is recommended that the East Fork and West Fork of the Smiths Fork be removed from the 303(d) threatened list as they are no longer threatened by habitat degradation. The Smiths Fork is listed on the 2002 303(d) list for not supporting aquatic life uses and fisheries from the confluence with the Blacks Fork upstream past Cottonwood Creek. This should be amended to exclude the segment of the Smiths Fork above the Willow Creek confluence. Finally, the listing of the Smiths Fork for fecal coliform is being addressed by a watershed management plan being prepared by the Uinta County Conservation District.
___________________________________________________ __________________ Assessment Report Author (signature and printed name) Date ___________________________________________________ __________________ Reviewed by (signature and printed name) Date ___________________________________________________ __________________ Monitoring Supervisor (signature and printed name) Date
22
REFERENCES Chapman, S.S., Bryce, S.A., Omernik, J.M., Despain, D.G., Zumberge, J., and Conrad, M.,
2003, Ecoregions of Wyoming (color poster with map, descriptive text, summary tables, and photographs): Reston, Virginia, U.S. Geological Survey (map scale 1:1,400,000).
Giller, P.S. and B. Malmqvist, 1998. The Biology of Streams and Rivers, Oxford University
Press. New York. pp. 31-69 Jessup, B.K. and J.B. Stribling. 2002. Further evaluation of the Wyoming Stream Integrity Index,
considering quantitative and qualitative reference site criteria. October 2002. Tetra Tech Inc., Owings Mills, MD. 70pp.
Omernik, J.M. and A.L. Gallant. 1987. Ecoregions of the west-central United States (map). U.S.
Environmental Protection Agency, Corvallis, OR. Plafkin, J.L., M.T. Barbour, K.D. Porter, S.K. Gross, and R.M. Hughes. 1989. Rapid bio-
assessment protocols of use in streams and rivers - benthic macroinvertebrates and fish. U.S. Environmental Protection Agency, Office of Water. EPA/444/4-89-001. May, 1989.
Rosgen, D. 1996. Applied river morphology. Illustrated by H.L. Silvey. Wildland Hydrology,
Pagosa Springs, CO. Strahler, A.N. 1964. Quantitative geomorphology of drainage basins and channel networks;
section 4-2, in Handbook of Applied Hydrology, ed. Ven te Chow, McGraw-Hill, New York.
Stribling, J.B., B.K. Jessup, and J. Gerritsen. 2000. Development of biological and physical
habitat criteria for Wyoming streams and their use in the TMDL process. March, 2000. Tetra Tech, Inc., Owings Mills, MD. 46pp.
Water Resources Data System Water Quality Database. State Climate Office.
(http://www.wrds.uwyo.edu/wrds/dbms/hydro/sel.html) Wyoming Department of Environmental Quality. 2001a Watershed Program. Quality
Assurance Project Plan for Beneficial Use Reconnaissance Project Water Quality Monitoring. March 2001. Cheyenne, Wyoming. 88 pp.
_______________. 2001b. Wyoming Surface water Classification List (Table A). June 21,
2001 update. Water Quality Division, Cheyenne, WY. _______________. 2001c. Water Quality Rules and Regulations, Wyoming Surface Water
Quality Standards. Chapter 1. Cheyenne, WY. 54 pp.
23
_______________. 2004. Manual of Standard Operating Procedures for Sample Collection and
Analysis. Cheyenne, WY. 375 pp. Wyoming Game and Fish Stream Lake Database 2002. Accessed via Department of
Environmental Quality Website; Tables A and B http://deq.state.wy.us/wqd/index.asp?pageid=137
Wyoming Oil and Gas Resource Assessment Mapper website 2002 . University of Wyoming.
Wyoming Geographic Information Science Center. (http://wogra.wygisc. uwyo.edu/misc/wograindex.html)