wyoming geo-notes - professor robert b....
TRANSCRIPT

Laramie, WyomingDecember, 1999
Wyoming Geo-notes
1933
G
EOLOGICAL SURVE Y
STATE OF WYOMING
Number 64
Wyoming State Geological SurveyLance Cook, State Geologist
WYOMING STATE GEOLOGICAL SURVEYLance Cook, State Geologist
GEOLOGICAL SURVEY BOARD
Ex Officio
Jim Geringer, GovernorPhilip L. Dubois, President, University of Wyoming
Don J. Likwartz, Oil and Gas SupervisorLance Cook, State Geologist
Appointed
Nancy M. Doelger, Casper Charles M. Love, Rock SpringsRonald A. Baugh, Casper Stephen L. Payne, Casper
John E. Trummel, GilletteSTAFF
Publications Section Richard W. Jones - Editor Janet Van Nuys - Editorial Assistant Kathy Hastreiter - Sales Manager Fred H. Porter, III - Cartographer Phyllis A. Ranz - Cartographer
Laboratory Unit Robert W. Gregory, Laboratory Technician
Supportive Services Unit Susanne G. Bruhnke - Office Manager Peggy Hopkins - Administrative Assistant
WYOMING GEO-NOTES: This quarterly digest on the State’s geology and mineral resources and activities of the Geological Survey is available by subscription (four issues for $15.00) or as single copies at $5.00 each. Two-year subscriptions are accepted.
People with disabilities who require an alternative form of communication in order to use this publication should contact the Editor, Wyoming State Geological Survey at (307) 766-2286. TTY Relay operator 1(800) 877-9975.
Printed on 50% recycled fiber paper. 400 copies printed by Pony X-Press, Cheyenne, Wyoming.
Computer Services Unit Susan McClendon - Manager
Geologic Sections James C. Case, Staff Geologist - Geologic Hazards Rodney H. De Bruin, Staff Geologist - Oil and Gas Ray E. Harris, Staff Geologist - Industrial Minerals and Uranium W. Dan Hausel, Senior Economic Geologist - Metals and Precious Stones Robert M. Lyman, Staff Geologist - Coal Alan J. Ver Ploeg, Senior Staff Geologist - Geologic Mapping
PHONE: (307) 766-2286 Email: [email protected] FAX: (307) 766-2605 WEB Page: http://www.wsgsweb.uwyo.edu
Front cover: Coalbed methane drilling rig on location, southeastern edge of the Washakie Basin, southern Wyoming. This rig is exploring for coalbed methane in coals of the Almond Formation, Mesaverde Group (Upper Cretaceous). Photograph by Rodney H. De Bruin, September, 1999.

PageTable of Contents
Publications Section Richard W. Jones - Editor Janet Van Nuys - Editorial Assistant Kathy Hastreiter - Sales Manager Fred H. Porter, III - Cartographer Phyllis A. Ranz - Cartographer
Laboratory Unit Robert W. Gregory, Laboratory Technician
Supportive Services Unit Susanne G. Bruhnke - Office Manager Peggy Hopkins - Administrative Assistant
Minerals Update ....................................................................................... 1 Overview general comments ................................................................ 1 Oil and gas update................................................................................ 3 Exploration and development ............................................................... 13
Coal update........................................................................................... 20 Developments in the Powder River Basin (PRB) ............................. 24 Developments in southern Wyoming................................................ 27 Transportation developments ........................................................... 28 Coalbed methane developments...................................................... 28 Regulatory developments................................................................. 29 Market developments and opportunities........................................... 30 References cited........................................................................... 31
Industrial minerals and uranium update................................................ 31 Bentonite .......................................................................................... 31 Chemical grade limestone ................................................................ 33 Construction aggregate .................................................................... 34 Gypsum ............................................................................................ 34 Trona ................................................................................................ 35 Uranium............................................................................................ 35 Reference cited............................................................................. 36
Metals and precious stones update ...................................................... 37 Gold .................................................................................................. 37 Platinum............................................................................................ 40 Base metals...................................................................................... 41 Titanium............................................................................................ 41 Gemstones ....................................................................................... 41 Reference cited............................................................................. 42
Mineral resource and reserve base estimates for Wyoming .................... 43
Geologic Mapping, Paleontology, and Stratigraphy Update ..................... 44 Update on the Volunteer Mapping Program.......................................... 44 Dinosaur bones found in Thermopolis Shale ........................................ 45 New publication on Wyoming geology .................................................. 47 Reference cited ................................................................................ 47
How to make your manufactured, mobile, or modular homemore earthquake resistant........................................................................ 47 Mitigation of structural damage............................................................. 48 Bracing systems ............................................................................... 48 Earthquake resistant foundations ..................................................... 48 Earthquake Resistant Bracing Systems ........................................... 49 Ground anchors................................................................................ 49 Steel piers......................................................................................... 49

Page Axles and hitches.............................................................................. 49 Mitigation of non-structural damage...................................................... 50 Gas appliances................................................................................. 50 Additional actions for water heaters.................................................. 50 References cited............................................................................... 51 Rock hound’s corner................................................................................. 52 Finding specimen gold .......................................................................... 52 References cited............................................................................... 53
WSGS annual field trip ............................................................................. 54
Staff profile – W. Dan Hausel ................................................................... 58
New publications by the Wyoming State Geological Survey.................... 61 Attention topographic map purchasers! ................................................ 61 New publications by the Wyoming State Geological Survey................. 62 Clearance sale on Wyoming Geo-notes ............................................... 64 Wyoming Topographic Map Users ........................................................ 65

Wyoming Geo-notes No. 64/Page 1
MINERALS UPDATE
OVERVIEW AND GENERAL COMMENTS
Lance CookState Geologist–Wyoming State Geological Survey
The State of Wyoming’s Consensus Revenue Estimating Group (CREG) has released new production and price forecasts for Wyoming’s mineral commodities. In general, the new forecasts (Tables 1 and 2) show slight increases in production of the four most important minerals (oil, gas, coal, and trona) and slight increases in prices for oil and gas when compared to estimates made last year (see Wyo-ming Geo-notes No. 60 for December, 1998). Forecasted coal and trona prices are slightly less than those estimates made last year. For more details on these new estimates, see the updates for each mineral. For FY1999, which ended June 30 of this year, CREG’s forecast for combined mineral income to the State of Wyoming was off by less than 0.1%.
Recent developments in the Powder River Basin are worthy of note. The Wyoming Oil and Gas Conservation Commission has now approved or received over 6000 drilling permits for coalbed methane wells. This drilling activity is un-
Table 1. Wyoming mineral production (1985-1998) with forecasts to 20061.
Calendar Carbon In-situ Year Oil2,3 Methane3,4 Dioxide3,4 Helium4,5 Coal6 Trona7 Uranium7,8 Sulfur3,9
1985 131.0 597.9 — — 140.4 10.8 N/A 0.80 1986 122.4 563.2 23.8 0.15 135.4 11.9 0.05 0.76 1987 115.9 628.2 114.2 0.86 146.5 12.4 0.00 1.19 1988 114.3 700.8 110.0 0.83 163.6 15.1 0.09 1.06 1989 109.1 739.0 126.1 0.94 171.1 16.2 1.1 1.17 1990 104.0 777.2 119.9 0.90 184.0 16.2 1.0 1.04 1991 99.8 820.0 140.3 1.05 193.9 16.2 1.0 1.18 1992 97.0 871.5 139.2 1.05 189.5 16.4 1.2 1.20 1993 89.0 912.8 140.8 1.06 209.9 16.0 1.2 1.14 1994 80.2 959.2 142.6 1.07 236.9 16.1 1.2 1.10 1995 75.6 987.5 148.8 1.11 263.9 18.4 1.3 1.20 1996 73.9 1,023.4 149.0 1.10 278.4 18.6 1.9 1.22 1997 70.2 1,040.7 151.0 1.10 281.5 19.4 2.2 1.23 1998 65.7 1,072.6 151.0 1.10 314.9 18.6 2.3 1.20 1999 60.1 1,121.6 151.0 1.10 338.5 19.0 2.5 1.20 2000 56.2 1,147.1 151.0 1.10 357.0 19.5 2.5 1.20 2001 53.1 1,173.1 151.0 1.10 369.5 20.0 2.5 1.20 2002 50.2 1,199.6 151.0 1.10 373.2 20.0 2.5 1.20 2003 47.4 1,226.6 151.0 1.10 376.9 21.1 2.5 1.20 2004 44.8 1,254.2 151.0 1.10 380.7 22.0 2.5 1.20 2005 42.3 1,282.3 151.0 1.10 384.5 22.0 2.5 1.20 2006 40.0 1,311.0 151.0 1.10 388.4 22.0 2.5 1.20
1Modified from CREG's Wyoming State Government Revenue Forecast, October, 1999; 2Millions of barrels; 3Wyoming Oil & Gas Conservation Commission, 1985-1998; 4Billions of cubic feet; 5Based on Exxon's estimate that the average helium content in the gas processed at Shute Creek is 0.5%; 6Millions of short tons (Wyoming State Inspector of Mines, 1985-1998); 7Wyoming Department of Revenue, 1985-1998; 8Millions of pounds of yellowcake (not available [N/A] for 1985 and previous years because it was only reported as taxable value); 9Millions of short tons.

Wyoming Geo-notes No. 64/Page 2 Wyoming Geo-notes No. 64/Page 3
precedented, with 72 rigs presently active in the play. As a result of this unforeseen activity, the U.S. Bureau of Land Management (BLM) has been caught unprepared in its planning process. The Resource Management Plan (RMP) for the Buffalo Resource Area, which sets limits and plans for future development in much of the Powder River Basin and is the guiding document for more specific analysis under the National Environmental Policy Act (NEPA), is in need of revision. As a result, new activity on Federal lands in the basin will be delayed. Each new project will require its own separate NEPA analysis and decision document until BLM can prepare a new RMP for the Buffalo area. This process may take from 18 months to 2 years to complete.
In the meantime, coalbed methane activity will continue on private and state leases. Coal leasing will still continue as before, with each new lease requiring its own NEPA analysis. The big loser will be conventional oil and gas activity, which will have to compete with coalbed methane wells for permits.
If the pipeline project to bring carbon dioxide (CO2) from LaBarge to the Powder
River Basin becomes a reality, enhanced oil recovery projects can still go forward, but when they involve Federal lands, BLM will have to perform NEPA analysis on a field-wide basis. In all, the NEPA process will create a substantial drag on the pace of activity in the basin.
Table 2. Average prices paid for Wyoming oil, methane, coal, and trona (1985-1998) with forecasts to 20061. Calendar
Year Oil2 Methane3 Coal4 Trona5
1985 24.67 3.03 11.36 35.18 1986 12.94 2.33 10.85 34.80 1987 16.42 1.78 9.80 36.56 1988 13.43 1.43 9.16 36.88 1989 16.71 1.58 8.63 40.76 1990 21.08 1.59 8.43 43.70 1991 17.33 1.46 8.06 44.18 1992 16.38 1.49 8.13 43.81 1993 14.50 1.81 7.12 40.08 1994 13.67 1.63 6.62 38.96 1995 15.50 1.13 6.38 40.93 1996 19.56 1.46 6.15 45.86 1997 17.41 1.94 5.78 42.29 1998 10.67 1.81 5.41 41.29 1999 14.50 1.95 5.23 37.58 2000 15.00 1.85 5.13 37.81 2001 15.00 1.85 4.99 38.32 2002 15.00 1.85 4.99 38.86 2003 15.00 1.85 5.03 39.36 2004 15.00 1.85 5.05 39.64 2005 15.00 1.85 5.07 39.64 2006 15.00 1.85 5.08 39.641Modified from CREG, Wyoming State Government Revenue Forecast, October, 1999; 2First purchase price in dollars per barrel (weighted average price for sweet, sour, heavy, stripper, and tertiary oil). Source: Energy Information Administration, 1985-1998; 3Wellhead price in dollars per thousand cubic feet (MCF). Source: Wyoming Office of State Lands and Investments, 1989-1997 (derived from State royalty payments); Minerals Management Service, 1985-1988 (derived from Federal royalty payments); 4Dollars per short ton (weighted average price for coal mined by surface and underground methods). Source: Energy Information Administration, 1985-1990 and derived from Department of Revenue, 1991-1998; 5Dollars per ton of trona, not soda ash. Source: Wyoming Department of Revenue, 1985-1998.

Wyoming Geo-notes No. 64/Page 2 Wyoming Geo-notes No. 64/Page 3
The Wyoming State Geological Survey continues to publish new maps. We have recently completed our second coalbed methane map (CMM 99-2), this cov-ers the western Powder River Basin, an area into which the coalbed methane play is spreading. Our eastern Powder River Basin coalbed methane map (CMM 99-1) has been updated as of September, 1999. We have published a new oil and gas map of the northwestern quarter of Wyoming (Map Series 53), and soon we will finish our new coverage of the state’s oil and gas fields with publication of a map of southeastern Wyoming. Our new large format color map plotter has given us the flexibility to correct and update maps on a more frequent basis and has helped reduce the time necessary to generate new maps.
We have an agreement with the U.S. Geological Survey to publish surface geologic maps done by Dave Love, and you will be seeing those maps next year. The maps will be in Grand Teton National Park, Jackson Hole, and the area of the Gros Ventre/Wind River Ranges.
Finally, we will be making increased use of the internet. See our web site (http://www.wsgsweb.uwyo.edu) for the latest information on the Diamond Project, an exciting program aimed at defining Wyoming’s potential as a diamond producer.
OIL AND GAS UPDATE
Rodney H. De BruinStaff Geologist-Oil and Gas, Wyoming State Geological Survey
This issue of Wyoming Geo-notes reflects the most recent oil and gas pro-duction and price forecasts used by the State’s Consensus Revenue Estimating Group (CREG). There were some substantial changes in the forecasts, and most changes are upward. Production forecasts for oil and methane have been raised for all years (Table 1). Carbon dioxide, helium, and sulfur production forecasts have not been raised from our earlier forecasts. The raised forecast for Wyoming oil production is a result of a turnaround in world oil prices due to decreased produc-tion in a number of key oil-producing countries. However, Wyoming production still continues to decrease each year (Figure 1).
The raised forecast for methane production (Table 1 and Figure 2) reflects expected growth in demand for Wyoming natural gas, due in large part to the comple-tion of a number of natural gas pipelines that will allow the marketing of coalbed methane from the Powder River Basin and the completion of a pipeline from Jonah Field that will allow increased production.
The forecast prices for oil and methane have also been increased (Table 2 and Figures 3 and 4) over forecasts made earlier this year (see Wyoming Geo-notes No. 61, 62, and 63). Oil prices have been over $15 a barrel for the last five months and were over $20 a barrel in September. This increase in price has been due to

Wyoming Geo-notes No. 64/Page 4 Wyoming Geo-notes No. 64/Page 5
Figure 1. Annual crude oil production from Wyoming (1974 to 1998) with forecasts to 2006.
Figure 2. Annual natural gas production from Wyoming (1980 to 1998) with forecasts to 2006.

Wyoming Geo-notes No. 64/Page 4 Wyoming Geo-notes No. 64/Page 5
Figure 3. Average prices paid for Wyoming crude oil (1980 to 1998) with forecasts to 2006.
Figure 4. Average prices paid for Wyoming methane (1980 to 1998) with forecasts to 2006.

Wyoming Geo-notes No. 64/Page 6 Wyoming Geo-notes No. 64/Page 7
production agreements, in OPEC and other key oil-exporting countries, that have cut into the oversupply of oil on world markets.
The price for methane has stabilized in the last three years and the differential between prices at Henry Hub and at Opal, Wyoming have lessened in recent years. The price at Opal has been $2.00 or more per thousand cubic feet for the past five months. Demand for natural gas is predicted to rise dramatically in the next 10 to 15 years and prices should remain strong during that period.
Prices paid to Wyoming oil producers during the third quarter of 1999 averaged $18.73 per barrel. The average price for the third quarter of 1999 was $3.78 higher than for the first quarter of 1999, and the average for the first nine months of 1999 was $3.55 higher than for the first nine months of 1998. The average price of $20.50 in September (Table 3) is the highest average monthly price since January, 1997. Figure 5 shows the posted sweet and sour crude prices and first purchase price for Wyoming oil averaged by month.
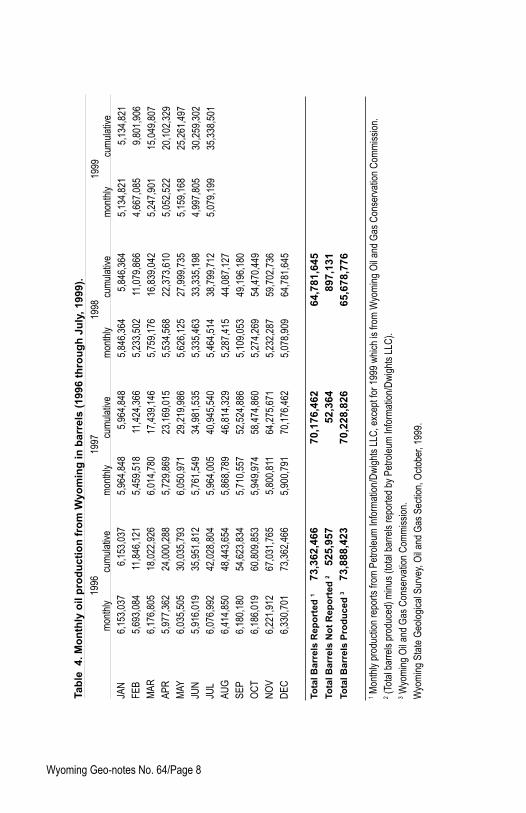
Oil production in Wyoming for the first seven months of 1999 was about 35.3 million barrels (Table 4), according to figures from the Wyoming Oil and Gas Con-servation Commission. Although this production is a drop of about 9% from the first seven months of production in 1998, the decline in production has moderated over the past several months because of higher prices for Wyoming oil.
Spot prices for natural gas at Opal, Wyoming averaged $2.27 during the third quarter of 1999. This is $0.62 higher than for the third quarter of 1998 (Table 5 and Figure 6). The average spot price for the first nine months of 1999 is the highest for the first nine months of a year since 1986.
Table 3. Monthly average price of a barrel of oil produced in Wyoming (1996 through September, 1999).
1996 1997 1998 1999 monthly cumulative monthly cumulative monthly cumulative monthly cumulativeJAN $16.38 $16.38 $22.56 $22.56 $12.79 $12.79 $9.30 $9.30FEB $16.28 $16.33 $19.45 $21.01 $12.16 $12.48 $9.09 $9.20MAR $18.63 $17.09 $17.99 $20.00 $10.97 $11.97 $11.77 $10.05APR $20.29 $17.90 $16.81 $19.20 $11.54 $11.87 $14.34 $11.13MAY $18.85 $18.08 $17.74 $18.91 $11.19 $11.73 $15.16 $11.93JUN $18.15 $18.10 $15.90 $18.41 $9.63 $11.38 $15.36 $12.50JUL $18.98 $18.22 $16.29 $18.11 $10.20 $11.21 $17.39 $13.20AUG $19.59 $18.39 $16.61 $17.92 $9.58 $11.01 $18.30 $13.84SEP $21.48 $18.74 $16.42 $17.75 $11.19 $11.03 $20.50 $14.58OCT $22.63 $19.13 $17.89 $17.77 $11.04 $11.03NOV $21.19 $19.31 $16.51 $17.65 $9.64 $10.90DEC $22.42 $19.56 $14.72 $17.41 $8.05 $10.67Avg. yearly price $19.56 $17.41 $10.67Source: All averages are derived from published monthly reports by the Energy Information Administration, except that averages in bold print in 1999 are estimated from various unpublished bulletins listing posted prices.Wyoming State Geological Survey, Oil and Gas Section, October, 1999.

Wyoming Geo-notes No. 64/Page 6 Wyoming Geo-notes No. 64/Page 7
Fig
ure
5. W
yom
ing
po
sted
sw
eet a
nd
so
ur
cru
de
oil
pri
ces
and
firs
t pu
rch
ase
pri
ces,
ave
rag
ed b
y m
on
th (J
anu
ary,
198
7, th
rou
gh
Sep
tem
ber
, 19
99).
Wyoming Geo-notes No. 64/Page 8 Wyoming Geo-notes No. 64/Page 9
Tab
le 4
. Mo
nth
ly o
il p
rod
uct
ion
fro
m W
yom
ing
in b
arre
ls (
1996
th
rou
gh
Ju
ly, 1
999)
.
1996
199
7
199
8
1
999
m
onth
ly
cum
ulat
ive
mon
thly
c
umul
ativ
e
m
onth
ly
cum
ulat
ive
m
onth
ly
cum
ulat
ive
JAN
6,1
53,0
37
6,
153,
037
5,96
4,84
8
5,9
64,8
48
5,
846,
364
5,
846,
364
5,1
34,8
21
5
,134
,821
FEB
5,69
3,08
4
11,8
46,1
21
5,
459,
518
11,
424,
366
5,23
3,50
2
1
1,07
9,86
6
4
,667
,085
9,8
01,9
06M
AR
6,
176,
805
18
,022
,926
6,01
4,78
0
1
7,43
9,14
6
5,
759,
176
16,
839,
042
5,2
47,9
01
15,
049,
807
APR
5,97
7,36
2
24,0
00,2
88
5,
729,
869
23,
169,
015
5,53
4,56
8
2
2,37
3,61
0
5
,052
,522
2
0,10
2,32
9M
AY
6,
035,
505
30
,035
,793
6,05
0,97
1
2
9,21
9,98
6
5,
626,
125
27,
999,
735
5,1
59,1
68
25,
261,
497
JUN
5,9
16,0
19
35,9
51,8
12
5,
761,
549
34,
981,
535
5,33
5,46
3
3
3,33
5,19
8
4
,997
,805
3
0,25
9,30
2JU
L
6
,076
,992
42
,028
,804
5,96
4,00
5
4
0,94
5,54
0
5,
464,
514
38,
799,
712
5,0
79,1
99
35,
338,
501
AUG
6,41
4,85
0
48,4
43,6
54
5,
868,
789
46,
814,
329
5,28
7,41
5
4
4,08
7,12
7SE
P
6,
180,
180
54
,623
,834
5,71
0,55
7
5
2,52
4,88
6
5,
109,
053
49,
196,
180
OC
T
6,
186,
019
60
,809
,853
5,94
9,97
4
5
8,47
4,86
0
5,
274,
269
54,
470,
449
NO
V
6,
221,
912
67
,031
,765
5,8
00,8
11
64,2
75,6
71
5,
232,
287
59,
702,
736
DEC
6,33
0,70
1
73,3
62,4
66
5,
900,
791
70,
176,
462
5,07
8,90
9
6
4,78
1,64
5
Tota
l Bar
rels
Rep
ort
ed 1
7
3,36
2,46
6
70,1
76,4
62
64,7
81,6
45To
tal B
arre
ls N
ot
Rep
ort
ed 2
52
5,95
7
52,
364
89
7,13
1To
tal B
arre
ls P
rod
uce
d 3
73
,888
,423
70
,228
,826
65
,678
,776
1 Mon
thly
pro
duct
ion
repo
rts fr
om P
etro
leum
Info
rmat
ion/
Dw
ight
s LL
C, e
xcep
t for
199
9 w
hich
is fr
om W
yom
ing
Oil
and
Gas
Con
serv
atio
n C
omm
issi
on.
2 (Tot
al b
arre
ls p
rodu
ced)
min
us (t
otal
bar
rels
repo
rted
by P
etro
leum
Info
rmat
ion/
Dw
ight
s LL
C).
3 Wyo
min
g O
il an
d G
as C
onse
rvat
ion
Com
mis
sion
.W
yom
ing
Stat
e G
eolo
gica
l Sur
vey,
Oil
and
Gas
Sec
tion,
Oct
ober
, 199
9.

Wyoming Geo-notes No. 64/Page 8 Wyoming Geo-notes No. 64/Page 9
Table 5. Monthly average spot sale price for a thousand cubic feet (MCF) of methane at Opal, Wyoming (1996 through September, 1999).
1996 1997 1998 1999 monthly cumulative monthly cumulative monthly cumulative monthly cumulative
JAN $1.25 $1.25 $3.90 $3.90 $2.05 $2.05 $1.80 $1.80FEB $1.20 $1.23 $2.50 $3.20 $1.70 $1.88 $1.65 $1.73MAR $1.20 $1.22 $1.40 $2.60 $1.90 $1.88 $1.50 $1.65APR $1.05 $1.18 $1.45 $2.31 $1.90 $1.89 $1.60 $1.64MAY $0.95 $1.13 $1.60 $2.17 $1.95 $1.90 $2.00 $1.71JUN $1.10 $1.13 $1.35 $2.03 $1.65 $1.86 $2.00 $1.76JUL $1.20 $1.14 $1.45 $1.95 $1.60 $1.82 $2.00 $1.79AUG $1.25 $1.15 $1.40 $1.88 $1.75 $1.81 $2.20 $1.84SEP $1.20 $1.16 $1.50 $1.84 $1.60 $1.79 $2.60 $1.93OCT $1.30 $1.17 $2.05 $1.86 $1.65 $1.78NOV $2.45 $1.29 $3.00 $1.96 $2.00 $1.80DEC $3.50 $1.47 $1.95 $1.96 $2.00 $1.81
Avg. yearly price $1.47 $1.96 $1.81
Source: American Gas Association’s monthly reports, except for the average yearly price, which comes from Wyoming’s Office of State Lands and Investments.
Wyoming State Geological Survey, Oil and Gas Section, October, 1999.
Natural gas production in Wyoming for the first seven months of 1999 was 719.2 billion cubic feet, according to production figures from the Wyoming Oil and Gas Conservation Commission. This production is up 3.1% from the first seven months of 1998 (Table 6).
Devon Energy and KN Energy, partners in Thunder Creek Gas Services, have completed the Thunder Creek natural gas pipeline in the Powder River Basin. The 24-inch line which was built to transport coalbed methane, extends between Gillette and Glenrock (see map by De Bruin, 1999a), and has a design capacity of 450 million cubic feet of gas per day.
CMS Energy, Enron North America, Western Gas Resources, Barrett Re-sources, and Colorado Interstate Gas, partners in Fort Union Gas Gathering, have completed the 24-inch Fort Union Gas Gathering System. The line transports coalbed methane from southeast of Gillette to east of Glenrock and like Thunder Creek, also has a capacity of 450 million cubic feet of gas per day.
Wyoming Interstate Co. (WIC) filed an application with the Federal Energy Regulatory Commission to expand its Medicine Bow Lateral pipeline that is currently under construction. The 150-mile line extends from near Douglas to the company’s main line southwest of Cheyenne and will be completed in December of this year. The line will have an initial capacity of 273 million cubic feet of gas per day. WIC’s application requests approval to install an additional 7,170 horsepower of com-pression at Douglas and to construct 5.6 miles of 24-inch pipe. The expansion will increase the pipeline’s capacity to 400 million cubic feet of gas per day and will be completed by October of 2000.
WBI Holdings acquired 100% of the interest in Bitter Creek Pipelines, which transports coalbed methane in the Powder River Basin. Redstone Resources previ-ously owned 75% of Bitter Creek; Preston Reynolds and Co. owned the rest.

Wyoming Geo-notes No. 64/Page 10 Wyoming Geo-notes No. 64/Page 11
Fig
ure
6. S
po
t sa
le p
rice
s fo
r m
eth
ane
at O
pal
, Wyo
min
g, a
vera
ged
by
mo
nth
(Ja
nu
ary,
199
0, t
hro
ug
h S
epte
mb
er 1
999)
.

Wyoming Geo-notes No. 64/Page 10 Wyoming Geo-notes No. 64/Page 11
Tab
le 6
. Mo
nth
ly n
atu
ral g
as p
rod
uct
ion
fro
m W
yom
ing
in t
ho
usa
nd
s o
f cu
bic
fee
t (M
CF
) (1
996
thro
ug
h J
uly
, 199
9).
1996
1997
19
98
1
999
mon
thly
cu
mul
ativ
e
mon
thly
cu
mul
ativ
e
m
onth
ly
c
umul
ativ
e
m
onth
ly
c
umul
ativ
eJA
N
101,
359,
648
10
1,35
9,64
8
9
9,57
9,81
8
99
,579
,818
103
,640
,214
1
03,6
40,2
14
1
01,5
45,5
92
101
,545
,592
FEB
9
6,30
3,30
0
197,
662,
948
91,
766,
159
19
1,34
5,97
7
9
4,50
1,81
9
198
,142
,033
90
,978
,955
1
92,5
24,5
47M
AR
103,
541,
127
30
1,20
4,07
5
10
4,15
7,57
8
295,
503,
555
103,
906,
999
3
02,0
49,0
32
1
10,1
70,8
44
302
,695
,391
APR
9
9,47
9,60
9
400,
683,
684
99,
459,
039
39
4,96
2,59
4
9
8,20
1,00
7
400
,250
,039
101
,990
,485
4
04,6
85,8
76M
AY
97,
900,
863
49
8,58
4,54
7
10
1,07
0,37
1
496,
032,
965
96,
741,
237
4
96,9
91,2
76
1
05,3
29,5
69
510
,015
,445
JUN
87,0
69,6
12
585
,654
,159
91,
905,
308
58
7,93
8,27
3
9
8,41
3,52
0
595
,404
,796
102
,262
,100
6
12,2
77,5
45JU
L
100,
219,
275
68
5,87
3,43
4
10
0,12
9,49
7
688,
067,
770
102,
055,
968
6
97,4
60,7
64
1
06,9
45,0
24
719
,222
,569
AUG
9
9,87
4,01
9
785,
747,
453
97,
673,
622
78
5,74
1,39
2
10
5,37
8,33
4
802
,839
,098
SEP
9
3,51
0,55
1
879,
258,
004
100,
028,
888
88
5,77
0,28
0
9
8,47
4,78
2
901
,313
,880
OC
T
95,
441,
022
97
4,69
9,02
6
10
2,20
6,87
5
987,
977,
155
96,
470,
624
9
90,8
80,9
52N
OV
9
4,01
5,00
7
1,
068,
714,
033
100,
752,
128
1,08
8,72
9,28
3
10
3,44
5,85
9
1
,101
,230
,363
DEC
9
9,14
1,29
8
1,
167,
855,
331
103,
415,
430
1,19
2,14
4,71
3
9
9,33
9,04
3
1
,200
,569
,406
Tota
l MC
F R
epo
rted
1
1,1
67,8
55,3
31
1,
192,
144,
713
1,20
0,56
9,40
6To
tal M
CF
No
t R
epo
rted
2
5,
663,
874
68
3,43
2
22,
955,
142
Tota
l MC
F P
rod
uce
d 3
1,
173,
519,
205
1,19
2,82
8,14
5
1,
223,
524,
548
1 Mon
thly
pro
duct
ion
repo
rts fr
om P
etro
leum
Info
rmat
ion/
Dw
ight
s LL
C.
2 (Tot
al M
CF
prod
uced
) min
us (t
otal
MC
F re
porte
d by
Pet
role
um In
form
atio
n/D
wig
hts
LLC
).3 W
yom
ing
Oil
and
Gas
Con
serv
atio
n C
omm
issi
on.
Wyo
min
g St
ate
Geo
logi
cal S
urve
y, O
il an
d G
as S
ectio
n, O
ctob
er, 1
999.

Wyoming Geo-notes No. 64/Page 12 Wyoming Geo-notes No. 64/Page 13
The Wyoming State Office of the U.S. Bureau of Land Management (BLM) received a proposal from Pioneer Pipeline to upgrade its existing eight-inch products line that extends from Sinclair, Wyoming to Croydon, Utah (see oil and gas fields maps by De Bruin, 1996, 1999b). The existing pipeline is 248 miles long and is located primarily along I-80. Pioneer wants to install a new 16-inch products line. The BLM will prepare an Environmental Assessment to determine the environmental consequences of the pipeline installation and operation.
Wold Oil Properties acquired Forest Oil’s interests in Grieve and Austin Creek fields in Natrona County. The company purchased a 97% working interest in Grieve Field and a 30% interest in Austin Creek Field and will operate both. Current gross production for the two fields is approximately 200 barrels of oil and 500,000 cubic feet of gas per day.
Leasing activity at the August BLM sale was concentrated in the Powder River Basin around the African Swallow discovery in Converse County and in the northern area of coalbed methane development in Campbell County; and in the Greater Green River Basin around Stagecoach Draw Field in northwestern Sweetwater County (Figure 7). Donald B. Anderson Ltd. made the sale’s high per-acre bid of $290 for a 1440-acre lease covering parts of sections 8, 10, 12, and 22, T18N, R94W
Figure 7. Locations of Federal oil and gas tracts leased by the U.S. Bureau of Land Management at its August, 1999, sale.
Wyoming Geo-notes No. 64/Page 12 Wyoming Geo-notes No. 64/Page 13
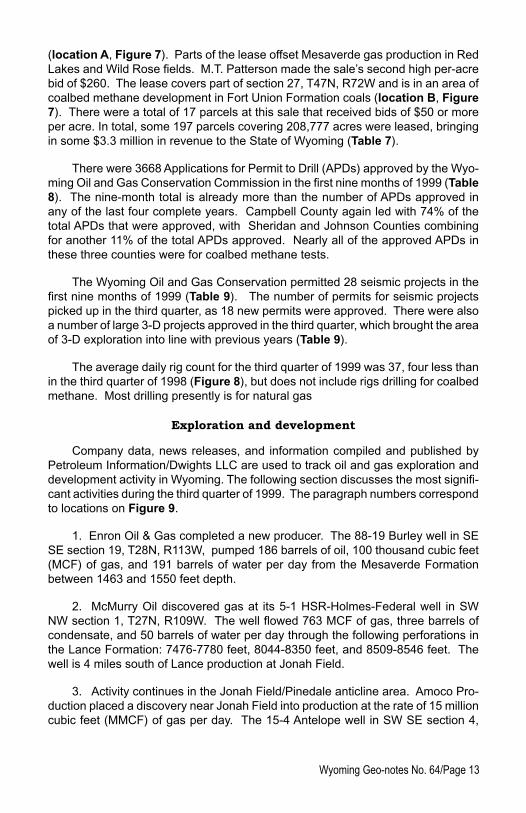
(location A, Figure 7). Parts of the lease offset Mesaverde gas production in Red Lakes and Wild Rose fields. M.T. Patterson made the sale’s second high per-acre bid of $260. The lease covers part of section 27, T47N, R72W and is in an area of coalbed methane development in Fort Union Formation coals (location B, Figure 7). There were a total of 17 parcels at this sale that received bids of $50 or more per acre. In total, some 197 parcels covering 208,777 acres were leased, bringing in some $3.3 million in revenue to the State of Wyoming (Table 7).
There were 3668 Applications for Permit to Drill (APDs) approved by the Wyo-ming Oil and Gas Conservation Commission in the first nine months of 1999 (Table 8). The nine-month total is already more than the number of APDs approved in any of the last four complete years. Campbell County again led with 74% of the total APDs that were approved, with Sheridan and Johnson Counties combining for another 11% of the total APDs approved. Nearly all of the approved APDs in these three counties were for coalbed methane tests.
The Wyoming Oil and Gas Conservation permitted 28 seismic projects in the first nine months of 1999 (Table 9). The number of permits for seismic projects picked up in the third quarter, as 18 new permits were approved. There were also a number of large 3-D projects approved in the third quarter, which brought the area of 3-D exploration into line with previous years (Table 9).
The average daily rig count for the third quarter of 1999 was 37, four less than in the third quarter of 1998 (Figure 8), but does not include rigs drilling for coalbed methane. Most drilling presently is for natural gas
Exploration and development
Company data, news releases, and information compiled and published by Petroleum Information/Dwights LLC are used to track oil and gas exploration and development activity in Wyoming. The following section discusses the most signifi-cant activities during the third quarter of 1999. The paragraph numbers correspond to locations on Figure 9.
1. Enron Oil & Gas completed a new producer. The 88-19 Burley well in SE SE section 19, T28N, R113W, pumped 186 barrels of oil, 100 thousand cubic feet (MCF) of gas, and 191 barrels of water per day from the Mesaverde Formation between 1463 and 1550 feet depth.
2. McMurry Oil discovered gas at its 5-1 HSR-Holmes-Federal well in SW NW section 1, T27N, R109W. The well flowed 763 MCF of gas, three barrels of condensate, and 50 barrels of water per day through the following perforations in the Lance Formation: 7476-7780 feet, 8044-8350 feet, and 8509-8546 feet. The well is 4 miles south of Lance production at Jonah Field.
3. Activity continues in the Jonah Field/Pinedale anticline area. Amoco Pro-duction placed a discovery near Jonah Field into production at the rate of 15 million cubic feet (MMCF) of gas per day. The 15-4 Antelope well in SW SE section 4,

Wyoming Geo-notes No. 64/Page 14 Wyoming Geo-notes No. 64/Page 15
Tab
le 7
. Fed
eral
an
d S
tate
co
mp
etit
ive
oil
and
gas
leas
e sa
les
in W
yom
ing
.
FE
DE
RA
L S
AL
ES
(B
UR
EA
U O
F L
AN
D M
AN
AG
EM
EN
T)
N
umbe
r
N
umbe
r
A
vera
ge
To
tal
of p
arce
ls
of
par
cels
T
otal
A
cres
pr
ice
per
Hig
h pr
ice
Mon
th
R
even
ue
o
ffere
d
leas
ed
ac
res
le
ased
acre
leas
ed
pe
r acr
e
1996
TOTA
L
$11,
487,
567
1
828
1125
1,40
3,44
4
7
39,5
05
$1
5.53
$1,
450.
00
1997
TOTA
L
$31,
976,
603
1
787
1485
1,57
8,93
8
1,2
06,6
42
$2
6.50
$
600.
00
1998
Febr
uary
$5,
262,
908
369
285
36
6,78
7
2
41,6
54
$2
1.78
$
415.
00
April
$10
,287
,111
247
22
7
192,
561
162
,393
$63.
35
$39
5.00
Ju
ne
$
14,7
37,1
17
4
63
367
49
8,33
9
3
68,8
16
$3
9.96
$
430.
00Au
gust
$
8,03
3,02
9
30
6
2
45
349,
605
278
,095
$28.
89
$50
0.00
Oct
ober
$10
,251
,074
455
30
8
421,
900
293
,141
$34.
97
$43
0.00
Dec
embe
r
$15,
229,
257
407
278
38
8,78
3
2
77,5
38
$5
4.87
$
800.
00
TOTA
L
$63,
800,
496
2
247
1710
2,21
7,97
5
1,6
21,6
37
$3
9.34
$
800.
00
1999
Febr
uary
$2,
734,
442
170
138
15
7,77
9
1
24,8
80
$2
1.90
$
325.
00Ap
ril
$2,1
21,2
20
1
24
116
12
9,35
8
1
21,4
21
$1
7.47
$
280.
00Ju
ne
$8,3
58,3
63
1
79
155
23
3,59
9
2
07,9
78
$4
0.19
$
32,0
00.0
0Au
gust
$
3,29
4,33
9
20
6
1
97
215,
631
208
,777
$15.
78
$29
0.00
STA
TE
SA
LE
S (
OF
FIC
E O
F S
TAT
E L
AN
DS
AN
D IN
VE
ST
ME
NT
S)
N
umbe
r of
Num
ber o
f
Av
erag
e
Tota
l
parc
els
par
cels
To
tal
Acre
s
pr
ice
per
Hig
h pr
ice
Mon
th
Rev
enue
offe
red
le
ased
ac
res
leas
ed
acr
e le
ased
per a
cre
1996
TOTA
L
$
2,32
5,49
7
1
049
508
418
,111
2
06,8
14
$
11.2
4
$206
.00
1997
TOTA
L
$
3,15
1,02
0
1
198
704
438,
296
2
63,2
30
$
11.9
7
$340
.00
1998
April
$
1,20
3,79
2
300
161
115,
646
63,8
48
$
18.8
5
$320
.00
June
$
1,66
0,43
8
300
148
108,
654
52,5
01
$
31.6
3
$600
.00
Oct
ober
$1,3
13,7
92
298
178
98
,856
65,
212
$20
.14
$5
90.0
0D
ecem
ber
$1,
045,
447
3
00
18
7
12
1,55
1
77
,852
$13
.43
$2
15.0
0
TOTA
L
$
5,22
3,46
9
1
198
674
444,
707
2
59,4
13
$
20.1
4
$600
.00
1999
April
$
1,81
5,52
6
299
196
123,
119
89,1
94
$
20.3
5
$890
.00
June
$
1,00
2,03
9
300
190
108,
310
69,8
58
$
14.3
4
$400
.00
Sour
ces:
Wyo
min
g O
ffice
of S
tate
Lan
ds a
nd In
vest
men
ts, P
etro
leum
Info
rmat
ion/
Dw
ight
s LL
C -
Roc
ky M
ount
ain
Reg
ion
Rep
ort,
and
U.S
. Bur
eau
of L
and
Man
agem
ent.

Wyoming Geo-notes No. 64/Page 14 Wyoming Geo-notes No. 64/Page 15
Table 8. Number of Applications for Permit to Drill (APD) approved by the Wyoming Oil and Gas Conservation Commission (1996 through September, 1999).
1996 1997 1998 1999County APDs APDs APDs APDsAlbany 1 0 0 0Big Horn 53 59 13 5Campbell 554 941 1586 2711Carbon 77 84 96 83Converse 20 16 6 16Crook 37 26 29 24Fremont 26 58 76 41Goshen 0 0 0 0Hot Springs 24 42 1 8Johnson 16 6 49 206Laramie 2 3 2 0Lincoln 55 122 105 42Natrona 74 59 36 28Niobrara 7 8 8 2Park 30 25 11 9Platte 0 0 0 0Sheridan 0 2 35 212Sublette 118 179 230 163Sweetwater 136 210 181 97Teton 0 0 0 0Uinta 10 27 26 17Washakie 30 36 9 0Weston 10 5 6 4Totals 1280 1908 2505 3668Source: All data are from the Wyoming Oil and Gas Conservation Commission.Wyoming State Geological Survey, Oil and Gas Section, October, 1999.
T29N, R107W, is producing from an undisclosed interval in the Lance Formation. Amoco also plans to drill eight Lance tests in sections 18, 19, and 20, T29N, R107W. These planned wells are within 2 miles east and northeast of Lance production at Jonah Field. McMurry also plans to drill its 8-12 Yellow Point well in SE NE section 12, T28N, R109W, to a depth of 20,000 feet. The well will evaluate the Blair, Rock Springs, and Frontier Formations, and the Dakota Sandstone, but will have to be approved by the BLM. Veritas DGC Land will enlarge its Pinedale anticline 3-D seismic project from 60 to approximately 200 square miles.
4. Fancher Oil completed a stepout from a gas discovery in the second Frontier that was never placed on line. The 30-12 Horsethief Canyon-Federal well in SW SW section 30, T21N, R102W, produced an average of 87 barrels of oil and 78 barrels of water per day during its first month on line. The well is producing from an undisclosed interval in the second Frontier above 6150 feet.
5. Wexpro completed a new producer in Trail Field. The 18 Trail Unit well in SW SE section 3, T13N, R100W, flowed 2.3 MMCF of gas per day from the Me-saverde Formation between 6531 and 7566 feet.

Wyoming Geo-notes No. 64/Page 16 Wyoming Geo-notes No. 64/Page 17
Tabl
e 9.
Num
ber o
f sei
smic
pro
ject
s an
d m
iles
perm
itted
by
the
Wyo
min
g O
il an
d G
as C
onse
rvat
ion
Com
mis
sion
(199
6 th
roug
h Se
ptem
ber,
1999
).
1996
1997
19
98
199
9
C
onve
ntio
nal
3
-D S
q
C
onve
ntio
nal
3
-D S
q
Con
vent
iona
l
3-D
Sq
Con
vent
iona
l
3-
D S
qC
ount
y
Per
mits
Mile
s
M
iles
Perm
its
M
iles
Mile
s
Pe
rmits
M
iles
Mile
s
P
erm
its
Mile
s
Mile
sAl
bany
1
18
0
0
0
0
0
0
0Bi
g H
orn
2
3
66
2
0
4
5
1
0
1
6C
ampb
ell
32
56
22
0
20
52
79
14
18
18
2
2
4
Car
bon
2
5
18
3
7
190
4
0
3
18
5
77
57C
onve
rse
1
4
0
1
5
0
4
12
239
1
50C
rook
5
3
20
7
8
1
8
2
2
4
1
10
Frem
ont
2
5
15
6
4
3
12
6
2
1
00
0
Gos
hen
0
0
0
2
2
27
0
0
0
0H
ot S
prin
gs
4
17
29
1
8
0
4
19
0Jo
hnso
n
0
0
0
2
7
17
1
4
0
Lara
mie
0
0
0
0
0
0
0
0
0
Linc
oln
0
0
0
3
7
116
1
10
0N
atro
na
0
0
0
5
1
4
10
1
6
12
214
2
23
0N
iobr
ara
2
0
23
0
0
0
0
0
0
2
7
23Pa
rk
6
20
82
4
56
58
3
16
13
2
3
25
32Pl
atte
0
0
0
0
0
0
0
0
0Sh
erid
an
1
5
0
0
0
0
1
14
0Su
blet
te
2
21
52
1
0
61
2
1
115
3
30
8Sw
eetw
ater
8
17
670
4
6
6
29
6
6
2
14
66
7
29
8Te
ton
0
0
0
0
0
0
0
0
0U
inta
1
0
40
0
0
0
2
0
147
1
26W
asha
kie
0
0
0
3
3
6
0
4
41
35
1
8W
esto
n
1
0
16
1
0
1
7
1
0
3
5To
tals
7
0
174
12
51
65
5
36
11
24
58
46
3
1503
28
11
3
104
2
Sour
ce:
All d
ata
are
from
the
Wyo
min
g O
il an
d G
as C
onse
rvat
ion
Com
mis
sion
.W
yom
ing
Stat
e G
eolo
gica
l Sur
vey,
Oil
and
Gas
Sec
tion,
Oct
ober
, 199
9.

Wyoming Geo-notes No. 64/Page 16 Wyoming Geo-notes No. 64/Page 17
Fig
ure
8. W
yom
ing
dai
ly r
ig c
ou
nt,
exc
lusi
ve o
f co
alb
ed m
eth
ane
rig
s, a
vera
ged
by
mo
nth
(D
ecem
ber
, 198
9 th
rou
gh
Sep
tem
ber
, 199
9).

Wyoming Geo-notes No. 64/Page 18 Wyoming Geo-notes No. 64/Page 19
Figure 9. Oil and gas exploration and development activities in Wyoming during the third quarter of 1999, exclusive of coalbed methane activities.
6. Union Pacific Resources began drilling two deep horizontal Frontier For-mation tests northeast of Table Rock Field in the area of the 4-H Rock Island Unit discovery that is producing at the rate of 14 MMCF of gas per day. The 2-H Side-winder well in NW SW section 30, T20N, R96W, is projected to a measured depth of 19,000 feet and a true vertical depth of 16,485 feet. The 1-H Sidewinder well in NW NW section 2, T19N, R97W, is projected to a measured depth of 18,000 feet and a true measured depth of 15,595 feet. Texaco Exploration & Production began drilling its 115-H Table Rock Unit well in SE NW section 19, T19N, R97W. The well is projected to a measured depth of 16,350 and a true vertical depth of 14,510 and will also test the Frontier Formation.
7. Marathon Oil completed a new producer in Mulligan Draw Field. The 5 Wedge Unit in NE NW section 13, T15N, R95W, flowed 6.1 MMCF of gas, 19 bar-rels of condensate, and 33 barrels of water per day from the Almond Formation between 12,729 and 12,738 feet.
8. Enron Oil & Gas discovered gas at its 21-18 Cepo-Lewis well in SW SW section 18, T14N, R95W. The well flowed 6.7 MMCF of gas, 15 barrels of conden-

Wyoming Geo-notes No. 64/Page 18 Wyoming Geo-notes No. 64/Page 19
sate, and 17 barrels of water per day from the Lewis Shale between 13,244 and 13,286 feet.
9. True Oil discovered gas at its 44-18 Mull-Federal well in SE SE section 18, T15N, R94W. The well flowed 2.6 MMCF of gas per day from the Almond Forma-tion between 12,538 and 12,558 feet.
10. Santa Fe Snyder Oil has a new discovery. Its 5-18-15-93 Flat Top well in SW NW section 18, T15N, R93W, is producing through the following perforations in the Almond Formation: 10,651-10,714 feet, 10,853-10,855 feet, and 10,932-10,935 feet. No other details are available.
11. Yates Petroleum discovered gas at its 2 North Castle Garden Unit well in W/2 NE section 21, T35N, R90W. The well flowed 8.0 MMCF of gas per day from the Lance Formation at about 5150 feet.
12. Tom Brown Inc., made a deeper pool discovery at its 15-21X Tribal-Pavil-lion well in NE NW section 15, T3N, R2E. The well flowed 596 MCF of gas per day from the Frontier Formation below 14,800 feet. Pavillion Field produces primarily from the Wind River and Fort Union Formations above 6000 feet.
13. Louisiana Land & Exploration completed a new gas well in Madden Field. The 40 Madden Deep Unit well in SE SE section 1, T38N, R90W, flowed 4.5 MMCF of gas and 19 barrels of water per day from the Fort Union Formation between 9388 and 9398 feet. Burlington Resources, through its Louisiana Land & Exploration subsidiary, scheduled another deep Madison test at Madden Field. The 6-27 Bighorn well is projected to a depth of 25,800 feet in NW NW section 27, T39N, R90W. Burlington Resources is currently drilling near 21,000 feet at its 5-6 Bighorn well in SW NW section 6, T38N, R89W. Three other Madison wells are already producing gas at Madden Field.
14. Tom Brown Inc. completed a new gas well in Frenchie Draw Field. The 38 Graham Unit well in NE NE section 20, T37N, R89W, flowed 3.9 MMCF of gas and 115 barrels of water per day from the Fort Union Formation between 10,074 and 10,443 feet and from the Lance Formation between 10,626 and 10,924 feet.
15. Barrett Resources completed a new well in Waltman Field. The 17 Cave Gulch Unit well in NE NE section 31, T37N, R86W, flowed 5.2 MMCF of gas and 100 barrels of water per day from the Fort Union between 4020 and 4505 feet. Barrett also recompleted its 1-29 Lak-Cave Gulch-Federal well in NE NW section 29, T37N, R86W, in the Muddy Sandstone at about 18,175 feet. The well flowed 16 MMCF of gas per day. This well blew out in August 1998 while it was producing 45 MMCF of gas per day.
16. BreitBurn Energy completed an offset to the company’s Lost Dome discov-ery in the Tensleep Sandstone. The 3-B Lost Dome-Federal well in NE NW section 13, T37N, R83W, produced an average of 72 barrels of oil and 687 barrels of water per day during its first month on line. The well is producing from an undisclosed interval in the Tensleep.

Wyoming Geo-notes No. 64/Page 20 Wyoming Geo-notes No. 64/Page 21
17. Prima Oil & Gas completed a new Muddy Sandstone producer in Cedar Draw Field. The 11-21 Cedar Draw-Federal well in NE NW section 11, T51N, R75W, flowed 1.5 MMCF of gas and 40 barrels of condensate per day from about 9374 feet.
18. Exxon Corp completed a new well in Hartzog Draw Field. The 4598 Hartzog Draw Unit well in SE SE section 9, T44N, R75W, pumped 335 barrels of oil and 79 MCF of gas per day from the Shannon Sandstone between 9662 and 9700 feet.
19. Abraxas Petroleum will drill a horizontal well in SE SE section 16, T38N, R67W. The 4-H 16-38-67 well will be horizontally drilled into the Turner Sandstone, then a second lateral will be drilled into the Niobrara Formation directly above the horizontal Turner lateral.
References cited
De Bruin, R.H., 1996, Oil and gas fields map of Wyoming: Wyoming State Geologi-cal Survey Map Series 48, scale 1:500,000 (color).
De Bruin, R.H., 1999a, Oil and gas fields map of the Powder River Basin, Wyoming: Wyoming State Geological Survey Map Series 51, scale 1:350,000 (color).
De Bruin, R.H., 1999b, Oil and gas fields map of the Greater Green River Basin and Overthrust Belt, Wyoming: Wyoming State Geological Survey Map Series 52, scale 1:350,000 (color).
COAL UPDATE
Robert M. LymanStaff Geologist-Coal, Wyoming State Geological Survey
The State of Wyoming Consensus Revenue Estimating Group’s (CREG’s) September, 1999 estimates predict continued growth of Wyoming coal production through the year 2006 (Table 1) and the firming of coal prices in the Powder River Basin (Table 2).
Table 10 and Figures 10 and 11 depict historic and projected coal production by county and producing area. The table also provides an estimate of the amount of higher-priced coal produced in the Powder River Basin, defined as that coal which sells for more than $5.00/ton. The tonnage sold at these higher prices is that from remaining older, long-term coal contracts that had escalation clauses built into them.
Table 11 and Figure 12 show a breakdown of the average prices for coal produced in northeastern Wyoming and southern Wyoming over the past 11 years

Wyoming Geo-notes No. 64/Page 20 Wyoming Geo-notes No. 64/Page 21
Tab
le 1
0. W
yom
ing
co
al p
rod
uct
ion
by
cou
nty
1, 2 (
in m
illio
ns
of
ton
s), f
rom
199
5 to
199
8 w
ith
fo
reca
sts
to 2
006.
1995
1
996
1997
1998
199
9
2
000
2001
2
002
2
003
200
4
20
05
20
06
Po
wd
er R
iver
Bas
in
Cam
pbel
l Cou
nty2
32.4
24
5.3
2
46.3
2
74.1
2
96.8
312.
0
32
6.5
3
30.2
3
31.9
3
40.7
343
.5
347
.4
Con
vers
e C
ount
y14.
1
15
.8
17
.8
2
3.4
25.
0
3
0.0
30
.0
3
0.0
3
0.0
25.0
25
.0
2
5.0
Sher
idan
Cou
nty
M
M
M
M
M
M
M
M
M
M
M
M
So
uth
ern
Wyo
min
g
Car
bon
Cou
nty
3.8
4.7
5.
0
3.5
3
.7
2.0
M
M
2
.0
2.0
3.
0
3
.0
Swee
twat
er C
ount
y
9.
1
8
.2
7.8
9.
2
8.0
8
.0
8.0
8.0
8.0
8
.0
8.0
8.0
Linc
oln
Cou
nty
4.5
4.4
4.
6
4.7
5
.0
5.0
5.
0
5
.0
5
.0
5.0
5.
0
5
.0
Tota
l Wyo
min
g3
263.
9
27
8.4
281
.5
314.
9
338.
5
357.
0
3
69.5
373
.2
37
6.9
38
0.7
384
.5
38
8.4
Annu
al C
hang
e11.
4%
5.
5%
1.1
%
11.
9%
7.
5%
6
.0%
3.4
%
1.
0%
1.0
%
1.0
%
1
.0%
1.0%
Hig
her
-pri
ced
co
al4
26
%
24%
22
%
17%
1
3%
9%
6%
4%
4
%
4
%
4%
4
%
1 Tonn
age
from
the
Wyo
min
g St
ate
Insp
ecto
r of M
ines
, 199
5-19
98.
2 Cou
nty
estim
ates
by
the
Wyo
min
g St
ate
Geo
logi
cal S
urve
y, O
ctob
er, 1
999,
for 1
999-
2006
.3 C
REG
’s W
yom
ing
Stat
e G
over
nmen
t Rev
enue
For
ecas
t, O
ctob
er, 1
999.
4 Estim
ated
per
cent
age
of P
owde
r Riv
er B
asin
coa
l pro
duct
ion
that
is s
old
at p
rices
abo
ve $
5.00
/ton
(old
er lo
ng-te
rm c
ontra
cts
that
hav
e no
t yet
exp
ired)
.[M
mea
ns m
inor
tonn
age
(less
than
50,
000
tons
)].W
yom
ing
Stat
e G
eolo
gica
l Sur
vey,
Coa
l Sec
tion,
Oct
ober
, 199
9.

Wyoming Geo-notes No. 64/Page 22 Wyoming Geo-notes No. 64/Page 23
Figure 10. Annual coal production from Wyoming and the Powder River Basin (1985-1998) with forecasts to 2006. Sources: Wyoming State Inspector of Mines (1985-1998) and Wyoming State Geological Survey (1999-2006).
Figure 11. Annual coal production from southern Wyoming mines (1985-1998) with forecasts to 2006. Sources: Wyoming State Inspector of Mines (1985-1998) and Wyoming State Geological Survey (1999-2006).

Wyoming Geo-notes No. 64/Page 22 Wyoming Geo-notes No. 64/Page 23
Table 11. Breakdown of average prices paid for coal from northeastern Wyoming, southern Wyoming, and Wyoming as a whole (1985-1997) with forecasts to 2006.
Year Northeastern Southern Statewide 1985 $11.36 1986 $10.85 1987 $9.80 1988 $7.35 $21.45 $9.16 1989 $6.94 $19.76 $8.63 1990 $6.86 $19.36 $8.43 1991 $6.58 $18.81 $8.06 1992 $6.61 $18.84 $8.13 1993 $6.02 $17.72 $7.12 1994 $5.62 $17.42 $6.62 1995 $5.60 $17.35 $6.38 1996 $5.40 $17.30 $6.15 1997 $5.03 $17.19 $5.78 1998 $4.73 $17.15 $5.41 1999 $4.61 $17.11 $5.23 2000 $4.63 $16.63 $5.13 2001 $4.56 $16.89 $4.99 2002 $4.56 $16.79 $4.99 2003 $4.54 $16.91 $5.03 2004 $4.56 $17.00 $5.05 2005 $4.55 $17.00 $5.07 2006 $4.57 $17.00 $5.08Statewide data for 1985-1990 are from reports by the U.S. Department of Energy’s Energy Information Administration; data for 1991-1998 are derived from Wyoming Department of Revenue information; state-wide estimates for 1999-2006 are from CREG’s Wyoming State Government Revenue Forecast, October, 1999; and for all regional breakdowns are by the Wyoming State Geological Survey (July, 1999). Wyoming State Geological Survey, October, 1999.
Figure 12. Average prices paid for Wyoming coal by producing area (1985-1998) with forecasts to 2006. Sources: U.S. Energy Information Administration (1985-1990); Wyoming Department of Revenue (1991-1998); and Wyoming State Geological Survey (1999-2006).

Wyoming Geo-notes No. 64/Page 24 Wyoming Geo-notes No. 64/Page 25
and projected average prices through 2006. As the higher-priced coal from the PRB gets converted to low-priced coal, the effect it has on average price is lessened each year, and by 2002, it will have hardly any effect on overall prices. Market conditions are expected to improve in the out years of the forecasts.
Coal delivery figures for the second quarter of 1999, from the Federal Energy Regulatory Commission (FERC) (Table 12) indicate strong growth in Wyoming’s coal production. By mid-year, the state’s coal producers had shipped nearly 159.5 million short tons, an increase of 7.7 over the 148.1 million short tons delivered in first half of 1998. Monthly coal delivery trends for the last three years (Figure 13) as well as spot sales and contract sales for the same period (Figure 14) document the unprecedented growth in Wyoming coal sales.
Statistics published by the Energy Information Administration (EIA), showed that utilities in 25 states used 302.5 million tons of Wyoming coal in 1998 (Freme and Hong, 1999) (Figure 15). When combined with coal exports, electrical utility companies used 304.7 million short tons of Wyoming coal in 1998. This was 96.7% of the State’s production. Texas remained the largest Wyoming coal consumer with 45.1 million short tons, followed by Missouri with 38.6 million tons. Along with Wyoming, Illinois, and Iowa, electric utilities in these 5 states consumed almost half of Wyoming’s coal. In addition, industrial customers, residential and commercial markets, and year-end stockpiles at mines across Wyoming accounted for the remaining 1998 Wyoming coal production.
In a recent article in Coal Age on draglines in the U.S., Gilewicz (1999) pointed out the current aging state of the large, mostly older, overburden workhorses of the coal industry. The article does point out that nowhere else in the world are draglines doing more than in Wyoming.
Developments in the Powder River Basin (PRB)
Kennecott Energy is hoping that its Horse Creek Lease By Application (LBA) Federal coal tract adjacent to the company’s Antelope mine can get back on sched-ule. The U.S. Bureau of Land Management (BLM) had set the LBA aside while completing their Wyodak Coalbed Methane Environmental Impact Statement (EIS), which was needed for coalbed methane development in the PRB (Coal Daily, 8/3/99). Kennecott is concerned that the delay may force it to alter its Antelope mine plan if the LBA lease is not acquired in a timely manner. Antelope’s current mine plan calls for mining to begin on the Horse Creek tract as soon as late 2001 or early 2002. Despite the delay, Kennecott hopes to complete the LBA process by late 2000 or early 2001. The Horse Creek LBA tract is believed to contain 356 million tons of surface minable coal and will add 11 to 13 years to the life of the operation. Antelope produced 19.4 million short tons in 1998 and currently has an air quality permit that limits production to 30 million short tons annually.
In early October, BLM announced it had started scoping work on the EISs for both the Horse Creek LBA tract and the Belle Ayr LBA tract nominated by RAG

Wyoming Geo-notes No. 64/Page 24 Wyoming Geo-notes No. 64/Page 25
Tab
le 1
2. M
on
thly
co
al d
eliv
erie
s fr
om
Wyo
min
g’s
min
es in
sh
ort
to
ns
(199
6-Ju
ne,
199
9)
199
6
1
997
1
998
1999
mon
thly
cum
ulat
ive
mon
thly
cum
ulat
ive
mon
thly
cum
ulat
ive
mon
thly
cum
ulat
ive
JAN
21,7
93,3
87
21,
793,
387
25,
165,
405
2
5,16
5,40
5
26,5
36,2
17
26,
536,
217
26
,970
,936
26
,970
,936
FEB
2
0,37
4,05
5
42,
167,
442
20,
743,
224
4
5,90
8,62
9
23,1
96,1
52
49,
732,
369
25
,675
,015
52
,645
,951
MAR
2
2,50
7,80
0
64,
675,
242
22,
566,
012
6
8,47
4,64
1
23,8
61,4
72
73,
593,
841
28
,082
,331
80
,728
,282
APR
2
2,57
9,95
9
87,
255,
201
20,
961,
008
8
9,43
5,64
9
24,7
68,9
89
98,
362,
830
25
,836
,684
106
,564
,966
MAY
2
2,21
6,01
6
109,
471,
217
23,
102,
867
11
2,53
8,51
6
25,2
78,9
60
123,
641,
790
28
,414
,354
134
,979
,320
JUN
20,6
98,8
14
130,
170,
031
20,
862,
610
13
3,40
1,12
6
24,4
50,8
35
148,
092,
625
24
,508
,742
159
,488
,062
JUL
24,8
42,9
71
155,
013,
002
24,
074,
929
15
7,47
6,05
5
25,6
63,5
77
173,
756,
202
AU
G
24,
421,
537
17
9,43
4,53
9
2
3,00
2,25
4
180,
478,
309
26
,591
,950
20
0,34
8,15
2
SEP
2
3,33
9,79
2
202,
774,
331
22,
452,
566
20
2,93
0,87
5
26,0
41,0
99
226,
389,
251
O
CT
2
2,61
5,72
1
225,
390,
052
21,
623,
057
22
4,55
3,93
2
26,6
59,1
21
253,
048,
372
N
OV
2
1,42
1,08
5
246,
811,
137
21,
695,
072
24
6,24
9,00
4
25,6
20,2
16
278,
668,
588
D
EC
22,
105,
530
26
8,91
6,66
7
2
4,69
5,74
0
270,
944,
744
26
,102
,620
30
4,77
1,20
8
To
tal T
on
nag
e R
epo
rted
1
2
68,9
16,6
67
2
70,9
44,7
44
3
04,7
71,2
08
To
tal T
on
nag
e N
ot
Rep
ort
ed2
9,
508,
289
10
,536
,772
1
0,19
0,88
3
Tota
l To
nn
age
Pro
du
ced
3
278,
424,
956
281
,481
,516
314
,962
,091
1 From
Fed
eral
Ene
rgy
Reg
ulat
ory
Com
mis
sion
(FER
C) F
orm
423
, 199
6-19
99.
2 Incl
udes
est
imat
es o
f res
iden
tial,
indu
stria
l, an
d ex
porte
d co
al, p
lus
tonn
age
not r
epor
ted
on F
ERC
’s F
orm
423
.3 W
yom
ing
Stat
e M
ine
Insp
ecto
r’s A
nnua
l Rep
orts
.W
yom
ing
Stat
e G
eolo
gica
l Sur
vey,
Coa
l Sec
tion,
Oct
ober
, 199
9.

Wyoming Geo-notes No. 64/Page 26 Wyoming Geo-notes No. 64/Page 27
Figure 13. Reported monthly deliveries from Wyoming coal mines (1997 through June, 1999). Derived from data on the Federal Energy Regulatory Commission’s Internet bulletin board.
Figure 14. Monthly coal deliveries from Wyoming coal mines (1997 through June, 1999). (A) Coal sold on the spot market and (B) Coal sold on contract. Derived from data on the Federal Energy Regulatory Commission’s Internet bulletin board.
Wyoming Geo-notes No. 64/Page 26 Wyoming Geo-notes No. 64/Page 27
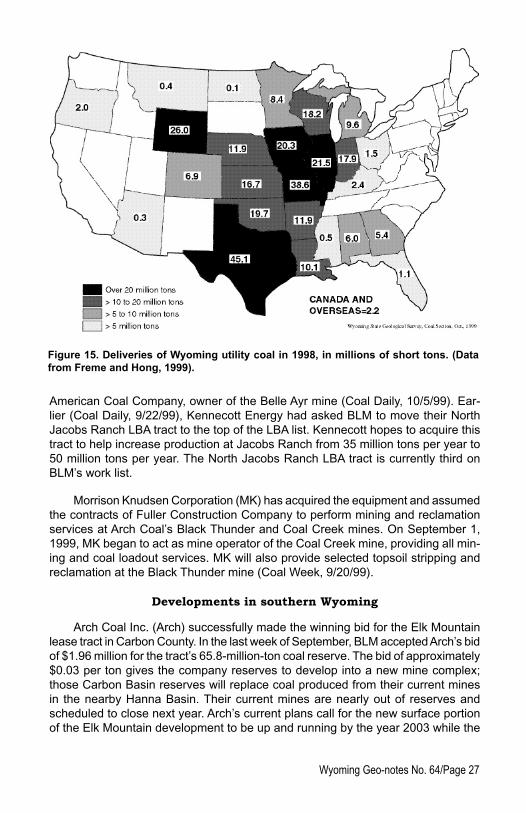
Figure 15. Deliveries of Wyoming utility coal in 1998, in millions of short tons. (Data from Freme and Hong, 1999).
American Coal Company, owner of the Belle Ayr mine (Coal Daily, 10/5/99). Ear-lier (Coal Daily, 9/22/99), Kennecott Energy had asked BLM to move their North Jacobs Ranch LBA tract to the top of the LBA list. Kennecott hopes to acquire this tract to help increase production at Jacobs Ranch from 35 million tons per year to 50 million tons per year. The North Jacobs Ranch LBA tract is currently third on BLM’s work list.
Morrison Knudsen Corporation (MK) has acquired the equipment and assumed the contracts of Fuller Construction Company to perform mining and reclamation services at Arch Coal’s Black Thunder and Coal Creek mines. On September 1, 1999, MK began to act as mine operator of the Coal Creek mine, providing all min-ing and coal loadout services. MK will also provide selected topsoil stripping and reclamation at the Black Thunder mine (Coal Week, 9/20/99).
Developments in southern Wyoming
Arch Coal Inc. (Arch) successfully made the winning bid for the Elk Mountain lease tract in Carbon County. In the last week of September, BLM accepted Arch’s bid of $1.96 million for the tract’s 65.8-million-ton coal reserve. The bid of approximately $0.03 per ton gives the company reserves to develop into a new mine complex; those Carbon Basin reserves will replace coal produced from their current mines in the nearby Hanna Basin. Their current mines are nearly out of reserves and scheduled to close next year. Arch’s current plans call for the new surface portion of the Elk Mountain development to be up and running by the year 2003 while the
Wyoming Geo-notes No. 64/Page 28 Wyoming Geo-notes No. 64/Page 29
planned underground mine will be delayed for several years, dependent on market conditions (Coal Daily, 10/4/99).
Transportation developments
CANAC International Inc. formally released results of its study on the capacity challenges facing the Union Pacific/Southern Pacific and Burlington Northern/Santa Fe railroads in their service of Powder River Basin (PRB) coal mines. At the September 15th meeting of the Western Coal Transportation Association in Denver, CANAC noted several conclusions from their study (Coal Daily, 9/16/99) as described below.
The bottleneck with unit trains in the southern PRB this past year has shifted to the mine loadouts. This has caused some staging of trains on the main line, which will not be possible as production in the area grows. CANAC projected that the load from the PRB on the joint line of the two railroads will grow from approximately 282.5 million tons this year to 359 million tons by the end of 2004. To handle this load, the report estimates that 75 trains will be needed for loading every day.
Much of the needed expansion in rail capacity will fall on the producers. The CANAC report recommended that PRB mines would need to build 20 additional train-landing slots. A timetable in the report indicated that construction should start in year 2000 when the southern PRB mines pass the 300 million-tons-per-year mark on the joint line. CANAC said they have supplied every producer in the southern PRB with a blueprint to help each mine meet its projected production targets. Reac-tion to the blueprints from the mines was reported as less than enthusiastic. The upcoming debate centers on who should be financially responsible for the proposed improvements.
In regard to the joint line, CANAC’s report recommended adding 14.5 miles of triple track from milepost 58 to Reno Junction; building an additional 15.5 miles of quadruple track over Logan Hill; and building train yards in the PRB to provide additional staging areas for both railroads.
The Tennessee Valley Authority (TVA) awarded Ohio River Company a new coal transportation contract. The contract is for barge shipping of western coal from their Cora Coal Terminal on the Mississippi River to their Allen plant in Tennessee. The new contract is for a three-year period starting in January of 2000, and contains an option clause to extend the haulage contract up to two additional three-year periods (Coal Daily, 9/29/99).
Coalbed methane developments
Double Eagle Petroleum and Mining Co. announced that they had acquired the assets of KCS Mountain Resources, a wholly owned subsidiary of KCS Energy, Inc., in the Cow Creek Field of Carbon County, Wyoming (PR Newswire, 8/25/99). Double Eagle made the acquisition to complement and solidify its lease position in the eastern Washakie Basin coalbed methane play. Besides the oil and gas rights,

Wyoming Geo-notes No. 64/Page 28 Wyoming Geo-notes No. 64/Page 29
the deal gives Double Eagle one gas well producing 230 thousand cubic feet (MCF) per day from the Dakota Formation at 8000 feet, two shut-in wells, and a compres-sor station/gathering system.
Phillips Petroleum Company acquired a 50% working interest in Yates Petroleum Company’s coalbed methane acreage in the PRB (Business Wire, 9/22/99). The agreement establishes a joint development partnership between the two companies for 340,00 gross acres and 90 existing coalbed methane wells. Phillips has joined with Yates in an ongoing drilling program to develop the joint-owned leases. If suc-cessful, the two companies may drill up to 2000 wells in the next 10 to 20 years. The companies plan to expand development of the joint leases with both the shallow coalbed methane targets currently being exploited and possibly some pilot drilling to identify deeper gas resources in the area.
Pennaco Energy, Inc. reported in a Company Announcement of 7/29/99 that as of July 30, 1999, its estimated net proved gas reserves in the PRB were 42.7 billion cubic feet (BCF). About 22.3 BCF, of the reserves were classified as developed and were being produced from 94 completed wells. 7.2 BCF of the reserves were associated with 32 completed wells, but shut-in awaiting pipeline connection. The remaining 13.2 BCF were classified as proved, undeveloped reserves. An additional 15.4 BCF of probable shut-in reserves was also mentioned in the announcement.
In another company announcement (PR-Newswire, 10/11/99), Pennaco said it had increased its net working gas production in the PRB to 21 MMCF per day in the South Gillette area. With approximately 100 wells now on line, the production level here increased by 10 MMCF per day with the completion of KN Energy’s Seam Booster Compressor Station. The KN Energy compressor station connects to the newly opened Thunder Creek Gas Pipeline. The company revealed that it has over 200 coalbed methane wells in the South Gillette area awaiting comple-tion of Bear Paw Energy’s Antelope Valley Compressor Station, expected to open November 1, 1999. The Antelope compressor station will connect to the Fort Union Gas Gathering Pipeline.
Regulatory developments
The State of Wyoming, facing a projected $180 million budget shortfall for the 2001-2002 biennium, is again looking for ways to generate additional revenue (Coal Daily, 10/21/99). Meeting in early October, the Joint Revenue Interim Committee of the Wyoming State Legislature discussed potential solutions to the problem. The committee is considering a $0.10 per ton transportation tax on coal shipped outside of Wyoming; the elimination of certain sales and use tax exemptions; increasing taxes on real estate transfers; and creating a new excise tax on electricity.
One of the tax exemptions being examined by the committee is the severance tax on coalbed methane. In 1993, the Legislature reduced the severance tax on new oil and gas from 6 to 2%. Because of the coalbed methane boom currently
Wyoming Geo-notes No. 64/Page 30 Wyoming Geo-notes No. 64/Page 31
taking place across the state, the Legislature is considering raising the severance on coalbed methane back to the 6% level.
The Mine Health and Safety Administration (MSHA) in September issued new health standards aimed at protecting miners from hearing loss due to prolonged exposure to excessive noise. The new MSHA noise rules require mining companies to enroll miners in a hearing protection program if they are exposed to noise at or above an average of 85 decibels over an eight-hour period. The program will include training, hearing tests, and the provision of earplugs or other hearing protectors. Use of the protectors will be optional for the workers, but the mining companies must offer their employees the training and protection devices (Coal Week, 9/20/99).
Market developments and opportunities
In September, New York State Attorney General Eliot Spitzer announced that the State of New York would begin legal action against 17 coal-fired power plants located in Indiana, Kentucky, Ohio, Virginia, and West Virginia. The State of New York believes the plants are impacting the air quality in the state. Claiming the targeted coal-fired plants emit large quantities of air-borne pollutants, Mr. Spitzer believes that the plants have failed to meet compliance under the Clean Air Act (Coal Week, 9/20/99).
The plants cited by the attorney general include: the Schafer and Tanner Creek in Indiana; the Big Sandy in Kentucky; the Beckjord, Cardinal/Tidd, Gavin, Muskingum, and Simms plants in Ohio; the Clinch River and Chesterfield plants in Virginia; and the Amos, Fort Martin, Kammer, Kanawha River, Mitchell, Mt. Strom, and Sporn plants in West Virginia.
The cited plants burn mainly high-sulfur coal from the Appalachian and Illinois Basins. The legal action may set back measures that many Midwestern states have been trying to implement to bolster their sagging high-sulfur coal sales. These measures are designed to utilize resources within their state’s borders. The action may result in increased demand for low-sulfur coal feedstock, and hopefully many of the power plants under siege will turn to Wyoming coal for their future needs.
Kansas City Board of Public Utilities’s Nearman Station experienced a conveyor fire that erupted about 10 p.m. on July 21. The belt line fire was quickly put out, but not before it had spread to the coal stockpile area, where flames smoldered until early the next day. As a result, the plant lost all but 3,900 tons of its stocked coal (only a 24- to 48-hour supply). The plant will be down until the company can restock its coal supply and repair the extensively damaged conveyor system. Company officials believe it will take up to four months to get the plant back in full operation. The plant burns about 1.2 million tons of coal per year supplied from the PRB. For the first quarter of 1999, all the coal was sourced out of the Dry Fork mine (Coal Daily, 7/23/99).

Wyoming Geo-notes No. 64/Page 30 Wyoming Geo-notes No. 64/Page 31
Coal Daily (7/26/99) reported that its sources believe Colorado Springs Utilities will try to modify or buy out its contract with Kennecott’s Colowyo mine in Colorado so that they can burn 100% PRB coal. The utility’s Nixon plant currently has a one million ton-per-year contract with the Colorado mine, which runs through 2004.
Table 12 tabulates some of the contracts, spot sales, test burns, and solici-tations for Wyoming coal announced during the third quarter of 1999.
References cited
Federal Energy Regulatory Commission (FERC) Electric Form 423 (http://www.ferc.fed.us/electric/f423/form423.htm).
Stauffenberg, D.G., (1999), Annual report of the State Inspector of Mines of Wyo-ming for the year ending December 31,1998: Office of the State Inspector of Mines, Rock Springs, 79 p.
Freme, F., and Hong, B., 1999, U.S. coal supply and demand: 1998 Review: Energy Information Administration, 11 p.
Gilewicz, P., 1999, U.S. dragline census: Coal Age, v. 104, no. 8 (August, 1999), p. 35-40.
INDUSTRIAL MINERALS AND URANIUM UPDATE
Ray E. HarrisStaff Geologist - Industrial Minerals and Uranium, Wyoming State Geological Survey
Bentonite
Bentonite is quarried at several locations near Wyoming’s ten operating ben-tonite plants in the Black Hills, Bighorn Basin, and at Casper (Figure 16). Wyoming produces more bentonite than any other state in the U.S. Smaller amounts of bentonite are mined in the neighboring states of Montana and South Dakota, and a different kind of bentonite is produced in Mississippi.
Bentonite is used in many different ways. Before 1990, most bentonite was processed into drilling mud where it was used as a lubricant and cuttings carrier; some bentonite is still used for this purpose. At present, more bentonite is processed into products other than drilling mud. The largest volume use of bentonite at present is for kitty litter and entire processing plants in Wyoming are dedicated to its pro-duction. Bentonite is used: to make refractory molds for metal casting; as a binder in iron ore pellets that feed furnaces that refine iron ore into steel; in impermeable barriers in waste isolation; as an adsorbent in industrial sites and other areas; and

Wyoming Geo-notes No. 64/Page 32 Wyoming Geo-notes No. 64/Page 33
Tabl
e 12
. Mar
ketin
g ac
tiviti
es fo
r Wyo
min
g co
al p
rodu
cers
dur
ing
the
third
qua
rter o
f 199
9.1
U
tility
Pow
er P
lant
Coa
l Min
e/R
egio
n
Act
ivity
Ton
nage
Com
men
ts
1.
Ar
izon
a Pu
blic
Ser
vice
Cho
lla
PRB
/+87
00 B
tu w
este
rn
So
700
,000
t
Fina
l del
iver
y on
BN
SF ra
ilroa
d
2.
C
omm
onw
ealth
Edi
son
Sy
stem
wid
e
PR
B
C
8
milli
on t/
y
Fo
ur y
ears
3.
C
onsu
mer
s En
ergy
S
yste
m w
ide
P
RB
C
up to
4.5
milli
on t/
y
St
ill ev
alua
ting
bids
on
PRB
coal
for d
eliv
ery
t
hrou
gh 2
008
4.
D
airy
land
Pow
er C
oop.
G
enoa
& A
lma
Bla
ck T
hund
er/P
RB
C
1.9
milli
on t
For 2
000
deliv
ery
on B
NSF
Rai
lroad
5.
Fi
rstE
nerg
y C
orp.
Bays
hore
& s
yste
m
PR
B co
als
8,40
0-8,
600
Btu/
lb
So
up to
2 m
illion
Fo
r 200
0 de
liver
y
6.
Ill
inoi
s Po
wer
Bal
dwin
& H
enne
pin
B
lack
Thu
nder
/PR
B
C
40
% o
f pla
nts’
need
s
For d
eliv
ery
2000
to 2
002
N
orth
Ant
elop
e/R
oche
lle/P
RB
C
60
% o
f pla
nts’
need
s
For d
eliv
ery
2000
to 2
002
7.
Ka
nsas
City
Pow
er &
Lig
ht
Sys
tem
wid
e
PR
B
S
o
50
0,00
0 t
Fo
r yea
r 200
0
8.
O
tter T
rail
Pow
er C
o.
S
yste
m w
ide
C
orde
ro R
ojo
Com
plex
/PR
B
C
1.
4 m
illion
t/y
20
00 a
nd 2
001
Sy
stem
wid
e
Bel
le A
yr o
r Eag
le B
utte
/PR
B
C
300,
000
t/y
2
000
and
2001
Sy
stem
wid
e
Bla
ck T
hund
er/P
RB
C
300,
000
t/y
2
000
and
2001
9.
Pe
nnsy
lvan
ia P
ower
& L
ight
C
oret
te
P
RB
SO
700,
000
t/y
f
or y
ear 2
000
and
poss
ibly
200
1
10.
Por
tland
Gen
eral
Ele
ctric
Boa
rdm
an
B
ucks
kin/
PRB
S
p
1.
8 m
illion
t
Fo
r yea
r 200
0
(+/-
200,
000
t)
11.
Sou
thw
este
rn E
lect
rical
Pow
er C
o.
Wel
ch &
Flin
t Cre
ek
Nor
th R
oche
lle/P
RB
T
100,
000
to 2
00,0
00
C
oal p
urch
ased
in 1
998
t/p
lant
12.
St.
Jose
ph L
ight
& P
ower
Co.
Lake
Roa
d
W
este
rn m
inim
um a
vg. 1
0,00
0 Bt
u/lb
S
o
13
5,00
0 t
Fo
r 200
0 de
liver
y on
BN
SF o
r UP
Rai
lroad
s
13.
Ten
ness
ee V
alle
y Au
thor
ity
Sys
tem
wid
e
Nor
th A
ntel
ope/
Roc
helle
/PR
B
C
11,4
00,0
00 t
D
eliv
ery
over
five
yea
r sta
rting
10/
1/99
14.
TXU
Ele
ctric
& G
as
Big
Bro
wn
& M
artin
Lak
e
Buck
skin
/Eag
le B
utte
, & C
oal C
reek
/PR
B
C
3.0
to 3
.5 m
illion
t/y
Split
equ
ally
am
ong
min
es fo
r 200
0 &
2001
1999
15.
Wis
cons
in E
lect
ric P
ower
Co.
Plea
sant
Pra
rie
C
orde
ro R
ojo
Com
plex
/PR
B
C
1.
7 to
2.3
milli
on t/
y
Fo
r up
to s
ix y
ears
sta
rting
Jan
. 1, 2
000
1 Dat
a ob
tain
ed fr
om: C
oal W
eek,
Coa
l Dai
ly, C
oal A
ge, F
ERC
dat
abas
e, a
nd p
erso
nal c
onta
cts.
Not
e: C
= c
ontra
ct c
oal;
Sp =
spo
t coa
l; So
= s
olic
itatio
n; E
x =
expo
rt co
al; T
= te
st b
urn;
t =s
hort
ton;
t/y
= sh
ort t
ons
per y
ear;
PRB
= Po
wde
r Riv
er B
asin
; and
BN
SF =
Bur
lingt
on N
orth
ern/
Sant
a Fe
railr
oad.
W
yom
ing
Stat
e G
eolo
gica
l Sur
vey,
Coa
l Sec
tion,
Oct
ober
, 199
9.

Wyoming Geo-notes No. 64/Page 32 Wyoming Geo-notes No. 64/Page 33
Figure 16. Map of selected industrial mineral and uranium sites in Wyoming.
it is used in the water purification process. Bentonite is used as a mineral filler in many products including paint, fertilizer, soap and detergents, dry aerosols, and others, and it is used as a filler in some food products, including ice cream.
Chemical grade limestone
Chemical grade limestone, usually defined as limestone containing more than 95% calcium carbonate, is quarried for the production of lime and other chemical products in Wyoming. Factors determining the viability of individual deposits may include deposit size, low processing costs, and the absence of detrimental miner-als such as silicates.
Colorado Lien, Inc. (Lien) quarries chemical grade limestone at Hartville to produce emissions control lime used in the Laramie River coal-fired power plant near Wheatland (Figure 16). In the third quarter of 1999, Lien began producing

Wyoming Geo-notes No. 64/Page 34 Wyoming Geo-notes No. 64/Page 35
chemical grade limestone from this quarry for use in refining sugar beets at a plant in Bayard, Nebraska. This is the first limestone produced for sugar beet refining from Wyoming since 1983.
Mountain Cement quarries chemical grade limestone near Laramie (Figure 16) where it is used as a major component in cement production. Dakota Lime’s plant near Frannie (Figure 16) produces lime from chemical grade limestone quarried east of Warren, Montana. This lime is used for local and regional construction and for power plant emissions control in North Dakota.
Construction aggregate
Construction aggregate is the sized or crushed and sized rock used in construc-tion base and fill, used with a binder to make concrete or other materials, and used for other similar applications. Although Wyoming ranks 45th among the 50 states in the production of construction aggregate, within the state this product ranks third in value of nonfuel materials mined or quarried. Aggregate is the most important nonfuel material mined in most states.
The U.S. Bureau of Land Management (BLM) issued a permit on September 2 to UMETCO Minerals to quarry rip rap (large-sized aggregate blocks) from a site in the western Rattlesnake Hills in western Natrona County (Figure 16). UMETCO is required by the Nuclear Regulatory Commission to cover its reclaimed uranium tailings (at a former mill site) in the Gas Hills with this type of rock. However, the proposed quarry is opposed by various groups on aesthetic grounds. BLM then reversed its decision, withdrew the permit, and extended the deadline for public appeal to October 25, 1999.
The Wyoming Board of Land Commissioners renewed the state lease held by Rissler-McMurry Company (RM) on Bessemer Mountain west of Casper in Natrona County (Figure 16). RM quarried some limestone several years ago from this site, but the quarry was opposed by various groups on aesthetic grounds. As a result, RM was unable to obtain a small mining permit to continue quarrying. Renewal of the lease will enable negotiations for a state/BLM land exchange in the area to move forward. The proposed exchange would allow RM to produce limestone from state lands located in a less sensitive area.
The Wyoming Department of Transportation (WYDOT) has contracted for 1.6 million tons of limestone aggregate from a quarry site south of Glenrock in Con-verse County (Figure 16) for highway construction projects in the Casper area. By quarrying large amounts of aggregate from one site and transporting the material to centrally located stockpiles, WYDOT can save overall construction costs.
Gypsum
Demand for wallboard, which is manufactured from calcined and processed gypsum, increased during the third quarter of 1999 due primarily to rebuilding

Wyoming Geo-notes No. 64/Page 34 Wyoming Geo-notes No. 64/Page 35
structures damaged by hurricanes in the southeastern United States. As a result, the wallboard shortage in the northwestern United States (see Wyoming Geo-notes 63) worsened.
Wallboard is produced in the Bighorn Basin, Wyoming by the Celotex Corpo-ration at Cody and by Georgia-Pacific south of Lovell (Figure 16). These plants are currently operating at capacity. There is an opportunity to increase Wyoming’s gypsum production by increasing capacity of existing plants and/or by constructing new plants. Several inquiries have been made to the Wyoming State Geological Survey by companies interested in gypsum development in Wyoming. Wyoming’s gypsum deposits are the closest to the Pacific Northwest of any minable gypsum deposits in the United States.
Trona
Soda ash and other sodium-based chemicals continue to be produced from mined trona at the five refining plants in southwestern Wyoming (Figure 16). Pro-duction during the third quarter of 1999 is slightly more than for the same period in 1998, according to information released by the U.S. Geological Survey (USGS). Increased soda ash consumption, increased imports, steady exports, and lower stockpiles were also reported by the USGS for each month in the third quarter.
Because of the expected increases in consumption and exports, projections have increased for trona production in 1999 through 2006 (see Table 1). Trona production should be about 19 million tons in 1999 and increase slightly each year until reaching a peak of 22 million tons in 2004 (compare with previous estimates published in Geo-notes No. 63).
Unfortunately, prices for mined trona are not expected to increase greatly in the next eight years (Table 2), and forecast prices are even less than those predicted last year (see Geo-notes No. 60, December, 1998). The price of mined trona now predicted for 1999 may in fact be $3.71 less than the $41.29 estimated for 1998, a decrease of about 9%.
Uranium
As reported in Wyoming Geo-notes 63, Wyoming’s in-situ uranium production reached a record level in 1998, and the production rate this year is equal to or a little above last year’s rate. As a result, in-situ production is predicted to reach 2.5 million pounds in 1999 and continue at that pace through 2006 (Table 1). This is the same projection as published earlier (see Wyoming Geo-notes No. 63).
Uranium prices on the spot market are declining (Figure 17). The decline in spot market prices and the worldwide uncertainty of uranium supply and demand create uncertainties in predicting the future of Wyoming’s uranium industry.

Wyoming Geo-notes No. 64/Page 36 Wyoming Geo-notes No. 64/Page 37
Uranium for nuclear power plant fuel is not only produced from newly mined ore but also from decommissioning nuclear weapons. Some countries other than the United States also reprocess spent nuclear fuel.
There are some positive indicators for the future of the uranium industry in Wyoming. The demand for nuclear power fuel is increasing worldwide, except for the United States and Germany. Worldwide stockpiles of uranium are decreasing and all of Wyoming’s uranium production is contracted to foreign purchasers. As long as the state’s producers can obtain contracts for additional uranium, Wyoming will continue to lead the nation in uranium production.
In August, the U.S. Nuclear Regulatory Commission issued a performance-based operating license to the Sweetwater uranium mill located northwest of Raw-lins in Sweetwater County (Figure 16). The license will enable this uranium mill to produce yellowcake from mined uranium when production becomes economically viable.
Reference cited
Uranium Exchange weekly reports and Bob Odell, Rocky Mountain Scout.
Figure 17. Spot market yellowcake prices, as of October 25, 1999. Source: Uranium Exchange weekly reports and Bob O’Dell, Rocky Mountain Scout.

Wyoming Geo-notes No. 64/Page 36 Wyoming Geo-notes No. 64/Page 37
METALS AND PRECIOUS STONES UPDATE
W. Dan HauselSenior Economic Geologist – Wyoming State Geological Survey
In response to a number of inquiries received in the third quarter, we have prepared the following discussion on the occurrence of, and exploration targets for, some of Wyoming’s metals and precious stones.
Gold
Rattlesnake Hills. Modern gold exploration in the Rattlesnake Hills, northern Granite Mountains, central Wyoming (Figure 18), began after significant mineral-ization was detected by the Wyoming State Geological Survey (WSGS) in 1981. Samples of pyritiferous graphitic schist and metachert hosted by Archean metabasalt yielded 1.0 to 7.6 parts per million (ppm) Au in a zone that was traced for 4800 feet. This discovery was significant in that the Rattlesnake Hills had never before been identified as a mining district.
Following the discovery, a group of companies including ACNC, Canyon Re-sources, and Newmont initiated gold exploration programs in the Rattlesnake Hills. Since details of the Precambrian rocks in the district were poorly known, in 1992 the WSGS initiated a project to map the Archean terrane. The project identified a 16 mi2 greenstone belt fragment intruded by 50 Tertiary felsic and alkalic stocks, plugs, laccoliths, and dikes. During mapping, gold anomalies were detected in metachert, iron formation, jasperoid, quartz veins, breccia veins, stockworks, the Tertiary volcanics, and some associated brecciated metagreywacke.
Drilling by various companies identified a large-tonnage, disseminated gold deposit that is on the order of a few hundred feet thick; open both at depth and laterally. A resource of 250,000 ounces at a grade of approximately 0.042 ounces per ton (opt) was outlined. A high-grade stratabound deposit that averaged 0.3 opt Au over a 10-foot interval was also intersected at depth.
Recent review of the drill data suggests that a gold resource may be closer to one million ounces or more (Dave Miller, personal communication, 1998). Surpris-ingly, several Archean and Tertiary targets remain unexplored in the region.
Copper King. The Copper King property lies in the historic Silver Crown district west of Cheyenne in the Laramie Mountains, southeastern Wyoming (Figure 18). This property was first prospected in 1881, and a number of entities have explored it since, including Asarco, Henrietta Mines, Hecla, Caledonia Resources, Kirkwood Ex-ploration, Compass Minerals, and more recently, Mountain Lake Resources. Based on mapping and petrography, the property is now interpreted as a deeply-dissected Proterozoic-age, gold-copper porphyry with a highly silicified, sheared stockwork enclosed by propylitic- and potassic-altered quartz monzonite and granodiorite.

Wyoming Geo-notes No. 64/Page 38 Wyoming Geo-notes No. 64/Page 39
Fig
ure
18
. P
rin
cip
al
min
era
liz
ed
a
rea
s an
d m
inin
g d
istr
icts
in
Wy
om
ing
(m
od
-if
ied
a
nd
a
da
pte
d
fro
m H
ause
l, 19
97).

Wyoming Geo-notes No. 64/Page 38 Wyoming Geo-notes No. 64/Page 39
Drilling at Copper King by the U.S. Bureau of Mines several years ago identified in situ reserves of 35 million tons of ore at a grade of 0.21% Cu and 0.022 opt Au, with credits in silver. In 1987, Caledonia Resources reported that a higher grade central core area contained 4.5 million tons of ore at a grade of 0.044 opt Au or (200,000 ounces of contained gold). In 1997, Mountain Lake Resources reported: proven resources of 2.3 million short tons of ore at 0.074 opt Au (169,000 ounces) with 0.46% Cu (21 million pounds); probable resources of 7.4 million short tons at 0.029 opt Au (214,000 ounces) with 0.26% Cu (37.6 million pounds); and possible resources of 9.65 million short tons at 0.04 opt Au (383,000 ounces) with 0.3% Cu (58.6 million pounds).
South Pass. In the 1980s, the WSGS mapped all or parts of eight 7.5-minute quadrangles (about 400 mi2) in the South Pass greenstone belt in the southern Wind River Mountains, western Wyoming (Figure 18). The area included several historic gold mines–many gold anomalies were identified during this project. Work completed by the U.S. Geological Survey (USGS) on two Tertiary paleoplacer deposits along the northern and southern margins of the greenstone belt also provided evidence for hidden, world-class, gold deposits.
The USGS estimated that one of these paleoplacers (Oregon Buttes) contained 28.5 million ounces of gold; the other (Twin Creek) was estimated to be about a quarter the size of the Oregon Buttes deposit. The source of the gold in these paleoplacers has yet to be identified, but presumably originated in the South Pass granite-greenstone terrane.
During mapping of the South Pass greenstone belt by the WSGS, significant gold was identified in the Lewiston district near the northeastern flank of the belt. Gold was found in relatively narrow (<20-foot-wide) shear zones, some which were traced more than 11,000 feet along strike. Samples yielded a trace to 3.05 opt Au.
The South Pass-Atlantic City district west of Lewiston encloses several shear zones and a major iron ore deposit. More than 90 million tons of iron ore were re-covered from this deposit prior to 1983 by U.S. Steel, and 300 to 400 million tons of ore remain in place.
One of the better gold properties, the Carissa, is located southeast of the iron formation, and occurs in a narrow, prominent, shear. Past production from the mine is estimated at 50,000 to 180,000 ounces of gold. The ore from this mine contained a trace to 2.6 opt Au and averaged 0.3 opt Au. Some specimen-grade samples assayed as high as 260 opt Au. Essentially all exploration efforts concentrated on a narrow, 1- to 50-foot-wide shear. However, this primary shear is enclosed in a larger shear envelope that is locally 1000 feet wide. Samples collected from this envelope yielded 0.02 to 0.07 opt Au over a 200-foot-width. The rest of the envelope is unexplored.
Anaconda drilled the primary shear of the Carissa in 1974. One hole intersected 16.1 feet of ore beneath the mine workings that averaged 0.13 opt Au. The shear was also intersected in four holes at 700 to 930 feet deep. These yielded 0.11 to 0.36 opt Au over shear widths of 2.3 to 11.9 ft. Consolidated McKinney Resources

Wyoming Geo-notes No. 64/Page 40 Wyoming Geo-notes No. 64/Page 41
drilled the property in the 1980s and intersected an 80-foot zone beneath the work-ings that yielded 0.031 to 2.54 opt Au.
Other Deposits. Several other areas in Wyoming (Figure 18) also provide excellent exploration targets. In the Seminoe Mountains greenstone belt in central Wyoming, a 1/4-mile-diameter, propylitically altered zone in metabasalt with quartz veins and stockworks yielded a trace to 2.87 opt Au. In the Mineral Hill district in northeastern Wyoming, vein, jasperoid, and brecciated alkalic rocks have yielded a trace to 3.8 opt Au and 9.7 opt Ag. Tertiary alkalic breccias in the Bear Lodge Mountains northwest of Mineral Hill are a source for low-grade disseminated gold and rare earths over relatively large areas, but much of the area remains unexplored.
Platinum
A Pt-group province extends across the Sierra Madre and Medicine Bow Moun-tains in southeastern Wyoming. Platinum, palladium, nickel, and cobalt anomalies have been detected in Proterozoic-age mafic complexes in this region. At the New Rambler mine (Figure 18), past production included 1.7 million pounds of Cu, 170 ounces of Au, 7350 ounces of Ag, 910 ounces of Pt and 16,870 ounces of Pd. The mine lies in the highly deformed layered Mullen Creek mafic complex that occupies some 60 mi2.
The Lake Owen mafic complex south of New Rambler is relatively undeformed. This is a funnel- to bowl-shaped layered complex that is tilted on edge. Based on research by Robert Loucks, formerly with Purdue University, the lowest cyclic unit in the complex has a strike length of 1.8 miles; the uppermost unit has a strike length of 7.5 miles. Cumulate sulfides are reported in at least 12 horizons in the complex with some zones showing elevated Au with Pt±Pd. Four of these horizons appar-ently have laterally persistent precious metal anomalies of a few hundred to a few thousand parts per billion (ppb). The mineralized zones are spotty but include lenses up to 15 feet thick with strike lengths of more than a mile. Four of these horizons are known to contain platinum group metals plus Au mineralization at grades >1ppm! Bornite was detected in one of these four horizons with ppm-level Au+Pt±Pd that was continuous over a length of 1.2 miles. In another unit, mineralization was reported over a strike interval of 6 miles.
The nearby Centennial Ridge district (Figure 18) also yielded Au, Pt, and Pd anomalies in shear zones within discontinuous mafic intrusives. The richest ores were found in sulfide-rich zones in mafic mylonites, graphitic fault gouge, and in strongly chloritized zones.
In 1995, the WSGS discovered significant anomalies in the Puzzler Hill complex in the Sierra Madre. Samples yielded 0.01 to 4.43% Cu, 66 ppm to 3.72% Ni, 14 ppb to 0.29 opt Au, <5 to 828 ppb Pt, 5 ppb to 0.12 opt Pd, <0.1 ppm to 0.19 opt Ag, 21 to 831 ppm Co, and 64 to 294 ppm Cr.

Wyoming Geo-notes No. 64/Page 40 Wyoming Geo-notes No. 64/Page 41
Base metals
Wyoming has several impressive base metal deposits. The Ferris-Haggarty mine in the Sierra Madre was Wyoming’s principal source of base metals in the past. It lies in a base metal province along the margin of a major highly mineralized Proterozoic suture zone.
The ore occurs in brecciated metaconglomerate in a flexure fold along a mas-sive quartzite-felsic schist contact. A 20-foot-thick ore shoot swells to as much as 65 feet in thickness and is reported to average 6 to 8% Cu. Some tonnage was reported to grade from 30 to 40% Cu with credits in silver and gold.
Past production from the mine amounted to about 21 million pounds of copper. A sampling program in a portion of the historical workings by Exxon Minerals in 1988 yielded samples with 0.10 to 21.3% Cu, 1.1 ppm to 2.34 opt Ag, and 75 ppb to 0.33 opt Au. Reserves were identified to include 928,500 tons of ore averaging 6.5% Cu with 116,800 ounces of gold.
Titanium
In the central Laramie Mountains of southeastern Wyoming, a large 350 mi2 anorthosite batholith hosts several massive titaniferous-magnetite deposits. Many were mined in the past and used for ballast. Exploration in recent years has identi-fied a large, disseminated, titaniferous magnetite deposit with associated pyrite, chalcopyrite, and pyrrhotite containing pods of massive titaniferous magnetite. The property was drilled and 300 million tons of titaniferous magnetite were identified (John Simons, personal communication, 1990). The batholith is also a potential source for other metals. Samples recovered from the Strong mine in the southern portion of the batholith (Figure 18) assayed values in copper, gold, silver, nickel, and tungsten.
Gemstones
Research by the WSGS has identified several gemstone localities in the state. Some of the better gems include diamond, iolite, corundum, peridot, garnet, and jade. These and other gemstones are described in a new WSGS bulletin (in press) entitled: Gemstones, semi-precious stones, lapidary materials, ornamental stones, and other unique minerals and rocks of Wyoming – A field guide for collectors, by W. Dan Hausel and Wayne M. Sutherland.
Diamonds are currently of great interest: Wyoming is underlain by a craton that is intruded by the largest known fields of kimberlites and lamproites in the U.S. Some areas of the state have yielded hundreds of square miles containing kimberlitic indicator mineral anomalies, supporting the hypothesis that more kimberlites (and possibly diamonds) will be found in the future.
Recent mapping by the WSGS in the Iron Mountain district of southeastern Wyoming (located approximately between the Elmers Rock mineralized area

Wyoming Geo-notes No. 64/Page 42 Wyoming Geo-notes No. 64/Page 43
and the Strong mine on Figure 18), has greatly expanded the known extent of kimberlites in that district (see What’s New under the Survey’s web site <http://www.wsgsweb.uwyo.edu/>). The district now encloses one of the two largest kimberlite fields in the U.S. The other field of similar size lies about 50 miles to the south-southwest along the Colorado-Wyoming border where more than 130,000 industrial and gem quality diamonds, ranging from microscopic to 28.3 carats in weight, have been recovered over the past 20 years. Diamonds from this district were mined following a similar mapping project by the WSGS in 1977.
Three major dike complexes and several outliers have been recognized in the Iron Mountain district. The complexes consist of extensive dike systems as much as 3 miles long with periodic blows and pipes. The presence of numerous soil-covered shear zones and fractures, along with some geophysical evidence suggests that several hidden (buried) kimberlites may also exist.
Microprobe analyses of kimberlitic indicator minerals from Iron Mountain have identified at least eight intrusives that contain diamond-stability pyrope garnets. These will be sampled for diamonds in the near future by the WSGS.
To date, diamonds have been recovered not only from the Colorado-Wyoming State Line kimberlite district, but also from breccia pipes of kimberlitic affinity in the Green River Basin of southwestern Wyoming. Detrital diamonds have also been reported in the Gros Ventre, Wind River, Medicine Bow, Sierra Madre, Laramie, and Granite mountains, and in the Powder River and Green River Basins. Kimberlitic indicator mineral anomalies have been identified statewide, further supporting the fact that Wyoming is underlain by a major kimberlite province, and will likely produce more diamonds in the future.
Reference cited
Hausel, W.D., 1997, Copper, lead, molybdenum, and associated metal deposits of Wyoming: Wyoming State Geological Survey Bulletin 70, 229 p.
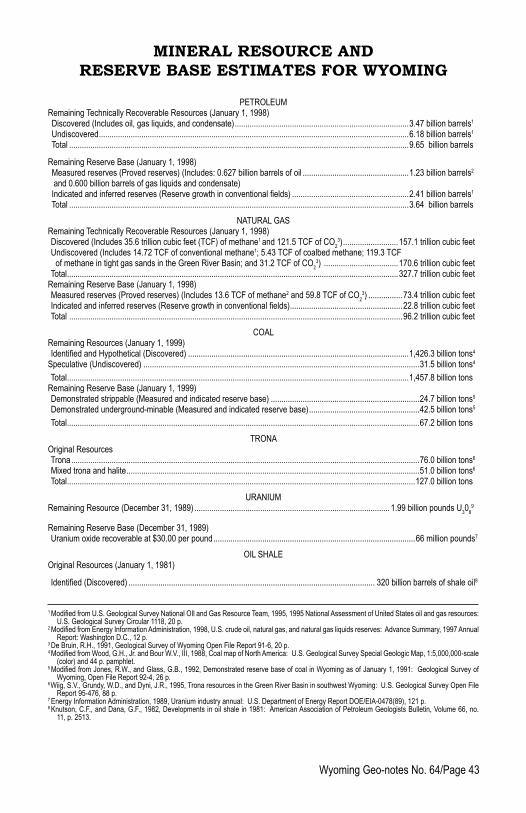
Wyoming Geo-notes No. 64/Page 42 Wyoming Geo-notes No. 64/Page 43
MINERAL RESOURCE ANDRESERVE BASE ESTIMATES FOR WYOMING
PETROLEUMRemaining Technically Recoverable Resources (January 1, 1998) Discovered (Includes oil, gas liquids, and condensate)..................................................................................3.47 billion barrels1
Undiscovered..................................................................................................................................................6.18 billion barrels1
Total ................................................................................................................................................................9.65 billion barrels
Remaining Reserve Base (January 1, 1998) Measured reserves (Proved reserves) (Includes: 0.627 billion barrels of oil ..................................................1.23 billion barrels2
and 0.600 billion barrels of gas liquids and condensate) Indicated and inferred reserves (Reserve growth in conventional fields) .......................................................2.41 billion barrels1 Total ................................................................................................................................................................3.64 billion barrels
NATURAL GASRemaining Technically Recoverable Resources (January 1, 1998) Discovered (Includes 35.6 trillion cubic feet (TCF) of methane1 and 121.5 TCF of CO
23)..........................157.1 trillion cubic feet
Undiscovered (Includes 14.72 TCF of conventional methane1; 5.43 TCF of coalbed methane; 119.3 TCF of methane in tight gas sands in the Green River Basin; and 31.2 TCF of CO
23) ...................................170.6 trillion cubic feet
Total............................................................................................................................................................327.7 trillion cubic feetRemaining Reserve Base (January 1, 1998) Measured reserves (Proved reserves) (Includes 13.6 TCF of methane2 and 59.8 TCF of CO
23) ................73.4 trillion cubic feet
Indicated and inferred reserves (Reserve growth in conventional fields).....................................................22.8 trillion cubic feet Total .............................................................................................................................................................96.2 trillion cubic feet
COALRemaining Resources (January 1, 1999) Identified and Hypothetical (Discovered) ........................................................................................................1,426.3 billion tons4
Speculative (Undiscovered) ..................................................................................................................................31.5 billion tons4
Total.................................................................................................................................................................1,457.8 billion tonsRemaining Reserve Base (January 1, 1999) Demonstrated strippable (Measured and indicated reserve base) ......................................................................24.7 billion tons5
Demonstrated underground-minable (Measured and indicated reserve base)....................................................42.5 billion tons5
Total......................................................................................................................................................................67.2 billion tons
TRONAOriginal Resources Trona....................................................................................................................................................................76.0 billion tons6 Mixed trona and halite..........................................................................................................................................51.0 billion tons6
Total....................................................................................................................................................................127.0 billion tons
URANIUMRemaining Resource (December 31, 1989) ............................................................................................ 1.99 billion pounds U
30
89
Remaining Reserve Base (December 31, 1989) Uranium oxide recoverable at $30.00 per pound...............................................................................................66 million pounds7
OIL SHALEOriginal Resources (January 1, 1981)
Identified (Discovered) .................................................................................................................... 320 billion barrels of shale oil8
1 Modified from U.S. Geological Survey National OIl and Gas Resource Team, 1995, 1995 National Assessment of United States oil and gas resources: U.S. Geological Survey Circular 1118, 20 p.
2 Modified from Energy Information Administration, 1998, U.S. crude oil, natural gas, and natural gas liquids reserves: Advance Summary, 1997 Annual Report: Washington D.C., 12 p.
3 De Bruin, R.H., 1991, Geological Survey of Wyoming Open File Report 91-6, 20 p.4 Modified from Wood, G.H., Jr. and Bour W.V., III, 1988, Coal map of North America: U.S. Geological Survey Special Geologic Map, 1:5,000,000-scale
(color) and 44 p. pamphlet.5 Modified from Jones, R.W., and Glass, G.B., 1992, Demonstrated reserve base of coal in Wyoming as of January 1, 1991: Geological Survey of
Wyoming, Open File Report 92-4, 26 p.6 Wiig, S.V., Grundy, W.D., and Dyni, J.R., 1995, Trona resources in the Green River Basin in southwest Wyoming: U.S. Geological Survey Open File
Report 95-476, 88 p.7 Energy Information Administration, 1989, Uranium industry annual: U.S. Department of Energy Report DOE/EIA-0478(89), 121 p.8 Knutson, C.F., and Dana, G.F., 1982, Developments in oil shale in 1981: American Association of Petroleum Geologists Bulletin, Volume 66, no.
11, p. 2513.

Wyoming Geo-notes No. 64/Page 44 Wyoming Geo-notes No. 64/Page 45
GEOLOGIC MAPPING, PALEONTOLOGY, AND STRA-TIGRAPHY UPDATE
Alan J. Ver PloegSenior Staff Geologist-Geologic Mapping, Wyoming State Geological Survey
UPDATE ON THE VOLUNTEER MAPPING PROGRAM
The Geologic Mapping Section of the Wyoming State Geological Survey (WSGS) is continuing efforts on a 1:24,000- and 1:100,000-scale mapping initiative, emphasizing populated areas of Wyoming. WSGS mapping projects are currently being funded in part through the STATEMAP Program. The maps are designed to aid in land-use evaluation and planning, as well as in exploration and development of potential mineral and water resources. Recent and projected population growth in many of Wyoming’s cities has increased the need for geologic information to assist planning entities in those areas and demand for these maps is increasing.
In an effort to accelerate geologic mapping in Wyoming, the Volunteer Mapping Program was initiated in 1995 by requesting volunteer assistance from qualified geologists. The request was answered by five geologists, who volunteered to compile the Cody, Casper, Thermopolis, and Worland 1:100,000-scale quadrangles, and the Thermopolis 1:24,000-scale quadrangle (Table 13). These maps are in vari-ous stages of preparation, with the first drafts for the Casper and both Thermopolis maps approaching completion.
After a similar request in 1997, eight new volunteers came forward committing to compile the Buffalo, Rock Springs, Powell, and Riverton 1:100,000-scale geo-logic maps and the Cody, Spence, North Emblem Reservoir, Manderson NE, and the Green River 1:24,000-scale geologic maps (Table 13 and Figure 19). These projects are all in the beginning stages; the volunteers have been given base map materials and copies of existing maps for their specific map areas.
Even more new geologic maps are needed and the WSGS continues to so-licit the aid of any qualified geologists willing to volunteer their efforts in compiling geologic maps. We are specifically in need of a volunteer to complete the Casper 1:100,000-scale map; John Hunter had completed approximately 90% of the map before moving to England. Anyone interested in finishing the map is urged to contact us. In addition, any geologists with expertise and interest in a specific map area in Wyoming not mentioned above are encouraged to contact Alan Ver Ploeg at the WSGS by phone (307) 766-2286 or by e-mail at [email protected].

Wyoming Geo-notes No. 64/Page 44 Wyoming Geo-notes No. 64/Page 45
Table 13. Listing of volunteer mapping projects included in the WSGS mapping ini-tiative.
Quadrangle/Scale Volunteer Affiliation
Casper-1:100,000 John Hunter Power Resources Casper, WY Thermopolis-1:100,000 Tim McCutcheon Consultant Casper, WY Cody-1:100,000 Dr. David Malone Illinois State University Normal, IL Thermopolis-1:24,000 Gretchen Hurley Consultant Thermopolis, WY
Buffalo-1:100,000 Remelle Burton Olsen Consultant Sheridan, WY
Powell-1:100,000 Dr. Gary D. Johnson Dartmouth College N. Emblem Reservoir-1:24,000 Hanover, NH Manderson NE-1:24,000Spence-1:24,000
Cody-1:24,000 Dr. Tim Clarey Delta College University Center, MI Riverton-1:100,000 Kent Chamberlain Consultant Worland-1:100,000 Worland, WY
Green River-1:24,000 John Dyni USGS-Denver, CO Bill Culbertson USGS-retired-Denver,CO Rock Springs 1:100,000 Richard Jones Geologist/Editor-WSGS Laramie, WY
Red Hole-1:24,000 Tom Anderson Consultant Casper, WY
DINOSAUR BONES FOUND IN THERMOPOLIS SHALE
A commercial fossil collector, Bernie Makowski, recently discovered numerous fragments of dinosaur bones on private lands southwest of Cody (Figure 19). The discovery is significant because the fossils occur in the Thermopolis Shale, tradition-ally thought to have been deposited in a dominantly marine environment. Prior to

Wyoming Geo-notes No. 64/Page 46 Wyoming Geo-notes No. 64/Page 47
this, only traces of marine reptiles and invertebrate fossils had been found in this 100 million-year-old formation. The new fossils, however, are definitely from dinosaurs that lived on land. Dr. Michael Cassiliano, a University of Wyoming paleontologist, visited the discovery and verified the fact that they were indeed dinosaur bones.
The fossils are on private lands and Makowski owns the rights to the fossils and the right to determine who else can collect on these lands, based on contractual agreements with the land owners. Makowski plans to market the fossils.
This is the second recent find in the Bighorn Basin area that provides evidence of dinosaurs living in what was thought to be a dominantly marine environment. The Red Gulch tracksite near Shell (Figure 19), which is currently being investigated and developed, contains dinosaur tracks in the Jurassic Sundance Formation which was traditionally interpreted as being marine.
Figure 19. Index to selected paleontologic discoveries, sites of recently published stratigraphic studies, and Volunteer Mapping Program activities in Wyoming. The 100,000-scale quadrangles are in capital letters; 1:24,000-scale quadrangles are in lower case.

Wyoming Geo-notes No. 64/Page 46 Wyoming Geo-notes No. 64/Page 47
NEW PUBLICATION ON WYOMING GEOLOGY
Montgomery (1999) recently published an overview paper detailing the expand-ing coalbed methane play in Wyoming’s Powder River Basin (Figure 19). The paper details the recent exploration efforts in the Powder River Basin and examines the geology and character of the specific target coal beds in the Paleocene Fort Union Formation. The author presents reserve estimates and describes well completion techniques used in the basin.
Reference cited
Montgomery, S.L., 1999, Powder River Basin, Wyoming: An expanding coalbed methane (CBM) play: American Association of Petroleum Geologists Bulletin, vol. 83, no. 8, p. 1207-1222.
HOW TO MAKE YOUR MAUNFACTURED, MOBILE, OR MODULAR HOME MORE EARTHQUAKE
RESISTANT
By James C. CaseStaff Geologist – Geologic Hazards, Wyoming State Geological Survey
Damaging earthquakes can occur in any part of Wyoming. Recent research on active faults and a current analysis of the earthquake history of Wyoming indicate that the largest earthquakes expected in the state would have magnitudes rang-ing from 6.25 to 7.5. The largest earthquake expected in western Wyoming would have a magnitude of 7.5 and could produce ground shaking so intense that most masonry and frame structures in the vicinity of the epicenter could be destroyed. In central Wyoming, the largest expected earthquake would have a magnitude of 6.75 and could produce significant damage as well. Chimneys may fall, panel walls may be thrown out of frame structures, and partial collapse may occur in ordinary substantial buildings. The largest earthquake expected in northern, eastern, and southern Wyoming would have a magnitude of 6.5, which could result in moderate damage in well-built ordinary structures, and considerable damage in poorly built or badly designed structures.
While the frame constituting the structure of manufactured, modular, and mobile homes is typically earthquake resistant, the method of mounting the home at its site makes this type of construction especially vulnerable and particularly susceptible to damage during moderate and major earthquake activity. Even moderate earth-quakes may dislodge these homes from their support systems (piers), allowing them to fall to the ground. When this happens, gas lines inside or outside the home can break, and structures such as awnings, decks, skirting, etc. are typically damaged beyond repair. Even homes that are braced typically utilize unconventional mate-

Wyoming Geo-notes No. 64/Page 48 Wyoming Geo-notes No. 64/Page 49
rial such as blocks of wood or flat rocks for piers, which in turn contribute greatly to the structure’s instability.
Obviously, there is potential for people to be hurt in their manufactured, mobile, or modular homes if the support structure partially or completely fails. During an earthquake, people can also be hurt in their homes from non-structural damage such as lights falling, bookcases tipping, free-standing wood stoves shifting, and water heaters overturning. In fact, in the United States, much of the damage to buildings or personal injury that occurs during an earthquake is non-structural in nature.
Principal considerations in preparing manufactured, modular, or mobile homes for resistance to earthquakes include: 1) Preventing the home from falling to the ground by installing one of a number of braced foundation support designs available; 2) Preventing the movement of gas burning appliances through correct bracing; and 3) Installing flexible gas lines into the home and to gas appliances.
This article, which is an expansion of an article in Wyoming Geo-notes No. 48 (Case, 1995), outlines several suggestions to reduce or prevent damage to both new and existing homes. While these suggestions do increase the cost of home installation, they can–if implemented properly–provide significant savings by reduc-ing or eliminating the cost of repairing the home after an earthquake.
MITIGATION OF STRUCTURAL DAMAGE
Bracing systems
There are a number of actions that a homeowner or contractor can take to minimize the movement of manufactured homes and accessory structures during an earthquake. These actions can be as complex as installing an engineered earth-quake resistant foundation or as simple as leaving the axles and hitch attached to the home. More detailed explanations and instruction can be found in Steven Winter Associates (1995). A summary of key items from that report is presented below, with the actions ranked in order from most to least effective.
Earthquake resistant foundations
Earthquake resistant foundations are usually designed with perimeter walls and footings, and may be built similar to foundations for conventional housing. In addition, earthquake-resistant piers should be placed under the main beams of the home and the marriage walls for double-wide units. More detail can be found in a report prepared for the U.S. Department of Housing and Urban Development (University of Illinois . . ., 1996). The 1997 Uniform Building Code also provides guidance on attaching homes to permanent foundations.

Wyoming Geo-notes No. 64/Page 48 Wyoming Geo-notes No. 64/Page 49
Earthquake Resistant Bracing Systems
Earthquake Resistant Bracing Systems (ERBS) can range from a system that serves to catch a home if it falls off its piers during an earthquake, to a system that minimizes both horizontal and vertical movement of the home through connections between the bracing system, the home, and the footings. Due to their complexity, it is recommended that the homeowner contact a qualified home installer or contrac-tor for obtaining and installing ERBS. A list of bracing systems certified for use in California is available at the Wyoming State Geological Survey. A useful publication on ERBS is Wiss, Janney, Elstner Associates, Inc. (1994). A copy of the publication is on file at the Wyoming State Geological Survey.
Ground anchors
Most homes have some type of anchors or straps that stabilize the home, primarily to resist wind storms. Ground anchors have not been fully tested under earthquake-like conditions and should not be solely relied upon for withstanding the effects of ground shaking associated with earthquakes. To a limited degree, however, they may help to stabilize a home during an earthquake when properly installed. Unless other instructions or regulations are available, anchors and tie-down straps should be installed as follows: 1) Place anchors and tie-downs a maximum of eight feet on center on the sides of the home; 2) Install a minimum of two anchors on the ends of each home section near each frame I-beam; and 3) Check with your local building department to determine if more stringent regulations apply.
Steel piers
Steel piers, which are typically easy to install and adjust, provide little bearing surface to properly support the home in the event of an earthquake. There are ac-tions a homeowner can take, however, to increase pier stability and possibly prevent the home from jumping off its piers or footings. It is recommended that when steel piers are used, they be bolted to the main beams of the home as well as fastened to their footings. Steel piers designed to be attached in such a manner are usually available through most home installers. More detail can be found in the report by Steven Winter Associates (1995).
Axles and hitches
Mobile home residents can somewhat minimize earthquake-related damage to their homes by simply leaving the axles and the hitch under the home. This may prevent the home from falling completely to the ground and may make reinstallation easier. The axle and hitch may be removed, however, if an earthquake resistant bracing system or other approved support system is used.

Wyoming Geo-notes No. 64/Page 50 Wyoming Geo-notes No. 64/Page 51
MITIGATION OF NON-STRUCTURAL DAMAGE
Gas appliances
Earthquake-related fires are usually the cause of seriously damaged or de-stroyed manufactured, modular or mobile homes. Most fires originate from a ruptured gas line when movement of a gas appliance during an earthquake breaks the gas connection. Gas water heaters can topple out of manufactured, modular or mobile homes through an exterior door or through an access panel to the water heater compartment. This often causes broken gas lines. Additionally, as homes fall from their foundations and support systems, they can break the gas meter or pipe leading to the home. The following suggestions will help minimize potential damages:
1) Secure all gas appliances, such as cook-stoves, water heaters, furnaces, etc. to wall studs near the appliance. Utilize brackets to attach stoves and furnaces to nearby wall studs. In some cases, water heaters can be attached using instructions on page 5 of this brochure. If the water heater is in a closet, however, it can be secured by wrapping two loops around both the upper and lower half of the water heater with 3/
4" x 24 gauge steel plumbers tape. Secure the ends of the four steel
tapes to wall studs with 1/4" x 3" lag screws and washers. Refer to Steven Winter
Associates, Inc. (1995) for additional instructions.
2) Make certain that all gas appliances have flexible connectors installed between the supply line and the appliance.
3) Make certain that approved flexible gas connectors are installed between the gas meter and the home. This will allow limited movement of a home without significant damage to the gas system. It is recommended the home be placed a minimum of three feet from the gas meter, when possible. It is also recommended that the flex-ible connector length be twice the distance of the home from the gas meter, which will increase the allowable movement of the home before damage occurs.
4) Seismic motion detectors and gas detectors are available for consumer use to minimize the potential hazard of gas leaks. These devices will stop gas flow when either a gas leak in sensed or during seismic ground motion.
In the event of an earthquake, do not operate electrical switches if you smell gas. Natural gas is easily ignited by open flames that exist in a standing pilot light and by sparks from switches and other electrical devices. If you should smell gas, leave all switches in their current position to avoid the possibility of electrical sparks.
Additional actions for water heaters
Additional actions to maintain the water heater and its compartment include replacing deteriorated flooring beneath water heaters and installing a drip pan be-

Wyoming Geo-notes No. 64/Page 50 Wyoming Geo-notes No. 64/Page 51
neath the water heater, with an exterior drain, if possible. Also, be sure to have the pressure relief valve tested and ensure it is plumbed through the floor.
The above recommendations can be found in greater detail in Steven Winter Associates (1995) and in Wyoming Geo-notes No. 48 (Case, 1995).
SUMMARY
During an earthquake, a completely risk-free environment is not possible and can not be guaranteed. If any of the suggestions are correctly implemented in your manufactured, modular, or mobile home, however, the chances of personal injury or property loss will be reduced.
More detailed explanations of some of these actions can be also obtained from the Wyoming State Geological Survey (WSGS), the Wyoming Emergency Manage-ment Agency (WEMA), the U.S. Department of Housing and Urban Development (HUD), or select offices of the Red Cross.
REFERENCES CITED
Case, J.C., 1995, How to make your Wyoming home more earthquake resistant: Wyo-ming State Geological Survey Wyoming Geo-notes Number 48, p. 41-47.
Steven Winter Associates, Inc., 1995, Minimizing damage and repair costs to manufactured homes during an earthquake: U.S. Department of Housing and Urban Development (HUD), Office of Policy Development and Research, report generated by the National Conference of States on Building Codes and Standards, Inc., Housing and Building Technology Division, under contract to Steven Winter Associates, Inc., Building Systems Consultants, Norwalk, Connecticut, 20 p.
University of Illinois at Urbana-Champaign, School of Architecture-Building Research Council, 1999, Permanent foundations guide for manufactured housing: U.S. Department of Housing and Urban Development, report generated by the University of Illinois at Urbana-Champaign, Champaign, Illinois, School of Architecture-Building Research Council, 384 p.
Wiss, Janney, Elstner Associates, Inc., 1994, Manufactured housing earthquake-resistant bracing systems subjected to the Northridge earthquake: Wiss, Janney, Elstner Associates, Inc. Report WJE No. 931299, Northbrook, Illinois, 39 p.

Wyoming Geo-notes No. 64/Page 52 Wyoming Geo-notes No. 64/Page 53
ROCK HOUND’S CORNER
By W. Dan HauselSenior Economic Geologist – Wyoming State Geological Survey
FINDING SPECIMEN GOLD
In recent years many prospectors have been successful in finding gold nuggets in Wyoming. Some of this success is due to activities sponsored by clubs such as the Rocky Mountain Prospectors and Treasure Hunters and the Gold Prospectors Association of America. Clubs like these share knowledge and plan activities for their members, and often lead their members to some good prospecting sites. A few years ago, a member from one of these clubs showed me a briefcase filled with more than 40 good-sized nuggets that he had found while using a metal detector at South Pass. I have heard that he now has more than 150 nuggets! Another find was reported in the August, 1999 issue of Highways magazine. The publication reported a find which included 399 nuggets recovered from the Encampment dis-trict a few years ago. So if you are a prospector or a rock hound, you have come to the right state.
Some of the largest specimen-grade gold samples reported from the state came from South Pass. One specimen was described as a fist-size chunk of quartz with 24 ounces of gold. A boulder found near the specimen in 1905 reportedly contained about 630 ounces of gold! A book on South Pass (Hausel, 1989) and a book on Wyoming’s precious metal deposits (Hausel, 1991) have been useful to many of those prospecting for gold in Wyoming; these are available from the Wyoming State Geological Survey.
Gold occurs as a distinct, warm-yellow, soft, sectile, maleable metal. Because of its high specific gravity (15 to 19.3) it is easily recovered in gold pans. It crystallizes in the isometric crystal system, but good crystallized gold specimens are essentially unheard of in Wyoming. Most of the gold found in the state occurs as fracture-fillings in quartz, rods and flakes on limonite, flakes and nuggets in streams (placers), or in stream deposits (paleoplacers).
Often, people mistake muscovite and sericite mica for gold. A classic example of this was described by Hausel (1999). Even though mica tends to concentrate with heavy minerals (black sands) in a gold pan, it will roll in the water along the bottom of the pan during agitation because of its low specific gravity. Gold flakes will lie on the bottom of the pan and not roll.
The majority of gold nuggets found in Wyoming are from the South Pass re-gion of the Wind River Mountains. Another notable place for nuggets has been the Douglas Creek district in the Medicine Bow Mountains. Some nuggets were found in the Mineral Hill district in the Black Hills and in the Encampment district in the Sierra Madre.

Wyoming Geo-notes No. 64/Page 52 Wyoming Geo-notes No. 64/Page 53
Specimen-grade samples of gold-bearing quartz typically consist of rusty or milky quartz with fractures filled with gold. Some of the better specimen-grade mate-rial has been found in the South Pass region. Other areas include the Medicine Bow Mountains, Seminoe Mountains, Sierra Madre, and the Mineral Hill district.
In the Medicine Bow Mountains, some attractive nuggets have been found in Douglas Creek and its tributaries; specimen grade gold-quartz samples have been found at some historical mines along Douglas Creek. Near the western edge of the Seminoe Mountains, some specimen-grade gold-bearing quartz was recovered from a group of mines along the northeastern flank of Bradley Peak. This area drains into Deweese Creek which probably is a good place to hunt for nuggets. Other gold has been found in dry placers in the Miracle Mile area northeast of Bradley Peak.
Gold in the Sierra Madre includes some specimen grade samples from Pur-gatory Gulch. Gold nuggets have also been found in this area, as well as in the Strawberry Gulch area several miles to the west.
The South Pass greenstone terrane near the southern tip of the Wind River Mountains has been Wyoming’s most productive gold district. The historical re-cords indicate many large nuggets, as well as many specimen-grade samples of auriferous quartz, have been found in this region. Each year, new discoveries are made by prospectors. For example, a 7.5-ounce nugget was recently found by a prospector from Rock Springs searching old tailings with a metal detector. Some of the largest nuggets reported in the literature weighed from 5.3 to 0.75 ounces. Another nugget weighing 2 pounds ended up in a museum in Los Angeles (Ralph Platt, personal communication, 1998). In addition to specimen-grade gold-quartz samples and nuggets, flour and flake gold have been recovered from numerous localities in the state.
References cited
Hausel, W.D., 1989, Geology of Wyoming’s precious metal lode and placer deposits: Wyoming State Geological Survey Bulletin 68, 248 p.
Hausel, W.D., 1991, Economic geology of the South Pass granite-greenstone belt, southern Wind River Range, Western, Wyoming: Wyoming State Geological Survey Report of Investigations 44, 129 p.
Hausel, W.D., 1999, Gold fever: International California Mining Journal, v. 68, no. 12, p. 17-19.

Wyoming Geo-notes No. 64/Page 54 Wyoming Geo-notes No. 64/Page 55
WSGS ANNUAL FIELD TRIP
Richard W. JonesEditor/Geologist–Wyoming State Geological Survey
The Wyoming State Geological Survey (WSGS) held its first annual field trip late this summer (Figure 20). State Geologist Lance Cook and the staff of the WSGS had invited the public to a geologic tour of the Medicine Bow Mountains west of Laramie. The theme of what is to be an annual event is “Get to know your State’s geologists, geology, and resources,” and each summer the WSGS plans to lead the public to a geologically interesting part of Wyoming.
At 7:30 on the morning of August 20, 1999, some 85 registered participants, 20 WSGS staff, and a University of Wyoming emeritus professor piled into seven vans and one pickup truck and left the University of Wyoming campus, headed west. After a brief stop across from the Territorial Prison, where a tour guide in each van began commentary, the caravan crossed the Laramie River floodplain and proceeded west onto old floodplain surfaces that cover the Laramie Basin. Passing the Laramie airport on Highway 130, we encountered the wind-excavated feature Big Hollow, which we followed for a number of miles.
Near the turnoff to Twin Lakes and Lake Hattie, the group made its first stop. Tour guides by this time had explained the local and regional geology of the Laramie Basin, and Rod De Bruin then discussed oil and gas activity and Big Hollow oil field. Dr. Brainerd Mears, Professor Emeritus at the University of Wyoming, explained (in his own inimitable lecture style) the geomorphology and origin of Big Hollow and the Airport surface and related Pleistocene/Quaternary features, not to mention what people from Kansas (“flatlanders”) would think about it. Finally, Jim Case discussed a variety of environmental geology and geologic hazard issues in the Laramie Basin and how they related to human occupancy of the area.
From here the trip continued westward, dropping off the Airport surface into Centennial Valley. Excellent views of Sheep Mountain (which consists of Precam-brian rocks thrust eastward over Cretaceous rocks in the Laramie Basin) and the structure of the western Centennial Valley could be seen from the road, and after crossing the Little Laramie River, we traveled on the boulder-covered glacial outwash the rest of the way to Centennial.
At the second stop, just east of Centennial, Survey geologists and Dr. Mears explained various aspects of the geology. Dan Hausel talked about gold mining and other metal deposits of the Centennial mining district, and told us about the unfortu-nate soul that mistook mica for gold when panning. Ray Harris discussed industrial minerals in the area, namely aggregate and stone quarries. Dick Jones explained the structure of Sheep Mountain, Centennial Valley syncline, and the front of the Medicine Bow Mountains while Alan Ver Ploeg talked about geologic mapping and the sedimentary rock sequence and Bob Lyman discussed some of the coal mining

Wyoming Geo-notes No. 64/Page 54 Wyoming Geo-notes No. 64/Page 55
Figure 20. A number of the field trip participants examining outcrops of the French Slate near Nash Fork Campground. Photograph by Ray E. Harris.
in the area. Jim Case and Dr. Mears pointed out the different glacial features above Centennial and how the different ages of moraines can be distinguished.
As we passed through the town of Centennial and started into the Medicine Bow Mountains, we drove across moraines left by mountain glaciers moving off the Snowy Range. After passing Snowy Range Lodge and Barber Lake (on the Barber Lake road), we left the pavement and drove up a steep road to a spectacular obser-vation point. This provided an excellent view south into Centennial Valley and the surrounding mountains. Here, with the help of descriptions from Dr. Mears and Jim Case, one could imagine glacial ice advancing and retreating in the valleys below, and often overtopping our vantage point at various times during the Ice Age. The Precambrian rocks at this point were on the upper plate of a thrust fault that bounds the north end of Centennial Valley.
After passing through a group of highly metamorphosed granites/granite gneisses and schists on the Barber Lake road, the caravan eventually rejoined Highway 130. Near the old S.H. Knight science camp, the caravan passed the Cheyenne belt shear zone which separates younger metamorphic rocks on the south from the older Archean and Proterozoic rocks to the north. Part of the late Proterozoic sequence contains very well exposed metasedimentary rocks that we visited at several stops.
Dan Hausel led the group to outcrops of French Slate near Nash Fork camp-ground where the group observed spectacularly folded and crenulated slate and

Wyoming Geo-notes No. 64/Page 56 Wyoming Geo-notes No. 64/Page 57
phyllite (Figure 20). Near Sugarloaf Recreational area, Dan, Dr. Mears, and Ray Harris showed us the beautifully preserved, 1.7-billion-year-old stromatolites of the Nash Fork Formation.
Just past Snowy Range pass and Libby Flats lookout, the group viewed the various rock units composing the mountain front of the Snowy Range (Figure 21), namely the Medicine Peak and Sugarloaf Quartzites and the Lookout Schist. At this point, Dan Hausel acquainted the group with various mining activities, geology, and mineralization in the area (including an abandoned mine, miners cabin, and head frame). Jim Case and Dr. Mears provided more on the glacial features, high level erosion surfaces (such as Libby Flats), and glaciation of the Snowy Range, and Dr. Mears described, in sometimes graphic detail, the plane crash into the mountain front in 1956.
Figure 21. At Medicine Bow Peak overlook, the group is learning about the glaciation of the Medicine Bow Mountains and the geology of the Snowy Range Mountain front. Photograph by Ray E. Harris.
The group enjoyed an excellent lunch at Mirror Lake campground and then backtracked on Highway 230 to Centennial. We crossed Centennial Valley on a county road (that must hold the world’s record number of washboards) which joined State Highway 11. The caravan made several stops along Highway 11 to examine Jurassic and Cretaceous sedimentary rocks on the east flank of Centennial Valley syncline. Alan Ver Ploeg led the group through the local stratigraphic sequence and described the geologic mapping he was doing in the area. Ray Harris mentioned the economic significance of bentonite in the Mowry Shale, Rod De Bruin explained that many sandstones seen on the outcrop were also oil and gas producers in the

Wyoming Geo-notes No. 64/Page 56 Wyoming Geo-notes No. 64/Page 57
Laramie Basin and Wyoming, and Lance Cook pointed out the importance of Cre-taceous rocks to the oil and gas industry in Wyoming. In the face of an impending rainstorm, the group did locate some invertebrate fossils (despite some 60 or 70 years of freshman geology classes visiting the same locality) and got a chance to see the rocks up close (Figure 22).
Figure 22. Field trip participants collecting fossils from Cretaceous rocks exposed along State Highway 11 on the east side of Centennial Valley. Photograph by Ray E. Harris.
The weather turned wet and the roads became muddy during the trip past the town of Albany and back into the Precambrian rocks of the Medicine Bow Moun-tains, but by the time we reached the Keystone mining district and Douglas Creek placer area, we were out of the rain and enjoyed good weather and roads the rest of the way. Dan Hausel led a group of intrepid prospectors in the techniques of gold panning on Douglas Creek (Figure 23), where active placer mining is taking place even today. This was our last stop before starting back to Laramie.
An enjoyable drive across the mountains led to the settlement of Foxpark, where we turned east onto Highway 230 to Woods Landing. Following a short half-hour drive across the Laramie plains following the Laramie River, the caravan arrived back in Laramie at 5:00 PM sharp, where the tired but satisfied group parted company.
The Survey geologists and staff had a great time on the trip, and enjoyed both an excellent day in the field and an enthusiastic audience. Despite the wide variety of

Wyoming Geo-notes No. 64/Page 58 Wyoming Geo-notes No. 64/Page 59
backgrounds, experience, and edu-cation that participants had and the variety of occupations represented, from geologist to teacher to student to reporter to townspeople of every type, all had a good educational ex-perience. Nearly everyone agreed that this was a worthwhile activity and that the Survey should continue the field trips in the future.
The WSGS plans to repeat this trip in mid-summer of 2000, and advises those that did not get a chance to attend this trip to contact the Survey this winter to reserve a space for the next trip. For residents in the Cody-Powell area in the Big-horn Basin of northern Wyoming, the second annual WSGS field trip to the Chief Joseph Scenic Highway is being planned for the late summer of 2000.
STAFF PROFILE – MEET W. DAN HAUSEL
W. Dan HauselSenior Economic Geologist–Wyoming State Geological Survey
W. Dan Hausel (Figure 24) handles investigations related to gemstones, pre-cious metals, base metals, and Precambrian geology. His projects are supported by a group of excellent geologists including Robert Gregory (lab technician), Seth Kruckenberg, Woody Motten, and Wayne Sutherland (contract geologists). Each year he receives hundreds of inquiries from the general public and industry request-ing information about various mineral resources.
Dan was born and raised in Salt Lake City, Utah, and graduated from high school there in 1967. He attended the University of Utah where he earned a B.S.
Figure 23. Panning gold placer deposits along Douglas Creek at Bobbie Thompson Campground. Photograph by Ray E. Harris.

Wyoming Geo-notes No. 64/Page 58 Wyoming Geo-notes No. 64/Page 59
in Geology in 1972 and an M.S. in geology in 1974. While at the University of Utah, he was a Research Assistant as well as a lecturer in astronomy at the Hansen Planetarium. After a year at the University of New Mexico as a Teaching Assistant while working on an advanced degree, he joined Warnock Exploration and Mining in Albuquerque. He began his work in Wyoming with the U.S. Geological Survey in Casper and then joined the Wyoming State Geological Survey in 1977. At various times in his career, Dan has also worked as a geologic consultant in gold and dia-mond exploration for a number of companies, including Echo Bay, Bald Mountain Mining, A & E Resources, Fowler Resources, Chevron Resources, Western Gold Exploration and Mining, and others.
His first project at the WSGS was mapping the Wyoming portion of the Colo-rado-Wyoming State Line district. According to Dan, some memorable experiences occurred during this project. “I especially remember mapping in late November and finally stopping due to the intense Wyoming winds. I measured my incline with a Bruton compass at 35° into the wind before I fell over.” By the time this project was completed, he had mapped 20 diamondiferous kimberlites–nine of which were discovered by him. Since then, Dan has developed an international reputation as an exploration geologist by finding more kimberlites, writing several regional and international papers, and spear-heading exploration programs for some private companies outside of Wyoming.
His work on precious metals has also been rewarding. In 1981, Dan’s work may have started the largest gold rush in Wyoming since the early 1900s. After his
Figure 24. The head of the Survey’s Metals and Precious Stones Section, W. Dan Hausel, examining mineral deposits in the field.

Wyoming Geo-notes No. 64/Page 60 Wyoming Geo-notes No. 64/Page 61
discovery of several quartz-vein samples with visible gold in the Seminoe Mountains, it was impossible to get a room in Saratoga, Rawlins, or Sinclair, as they were filled with geologists. Another memorable discovery occurred in the Rattlesnake Hills in the same year. Dan found significant gold associated with pyritiferous metachert at what he aptly named the Lost Muffler prospect. Soon after the announcement, the area was staked by a local consulting geologist, and exploration programs were followed by ACNC, Canyon Resources, and Newmont. It is now believed that more than a million ounces of gold were outlined by the drilling programs (Dave Miller, personal communication, 1999). Most recently, he made a discovery of highly anomalous platinum, palladium, nickel, cobalt, gold, and silver associated with copper at Puzzler Hill along the northeastern flank of the Encampment district in the Sierra Madre.
Twice nominated for the Dibblie Mapping Award, Dan has mapped more than 500 mi2 of complex Precambrian terrain in Wyoming. He mapped the South Pass and Seminoe Mountains greenstone belts, the Copper Mountain, Rattlesnake Hills, Iron Mountain, State Line, Sheep Rock, and Cooper Hill districts, and more than three dozen underground gold and copper mines in the South Pass, Copper Moun-tain, Cooper Hill, Centennial Ridge, and Silver Crown districts. Along with being a successful exploration and research geologist, Dan is a prolific writer. He is the author or co-author of more than 350 books, professional papers, and maps–many of which are published by the WSGS and in various national and international journals and books.
His achievements have been recognized nationally and internationally. In 1992, he was awarded AAPG’s Energy Mineral’s Division President’s Award and the Wyoming Geological Association’s Certificate of Appreciation for Outstanding Endeavors and Contributions. In 1994, he was honored as Distinguished Lecturer on diamonds by the Laramie Lyceum, and by the University of Wyoming Depart-ment of Geology and Geophysics in 1998. He also received the Prospector’s Best Friend Award from the Rocky Mountain Prospector’s Association in 1998, and was recognized as one of 2000 Outstanding Scientists of the 20th Century by the Inter-national Biographical Center (IBC) in Cambridge, England. His contributions have been highlighted in dozens of Who’s Who publications including Marquis Who’s Who in Science and Engineering, Who’s Who in the West, Who’s Who in America, and Who’s Who in the World, the American Biographical Institute’s (ABI) 2000 Notable American Men, Man of the Year 1996, and 5000 Personalities of the World, and the IBC’s International Man of the Year 1995-96.
When not at work, Dan relaxes by sketching and by training in the martial arts. He teaches karate, jujutsu, and rape prevention at UW. In 1998, he was inducted into the World Karate Union Hall-Of-Fame and the ABI’s Millennium Hall-Of-Fame. He was also nominated for IBC’s World Who’s Who Hall of Fame in 1999. He has earned seven black belts, is one of only a few non-Asians honored with the titles of Samurai and Kyoju (professor of martial arts), and was recognized in 1998 as both the Juko-Kai International Outstanding Shorin-Ryu Instructor of the Year, and

Wyoming Geo-notes No. 64/Page 60 Wyoming Geo-notes No. 64/Page 61
the World Karate Union Grand-master Instructor of the Year. In September, 1999, he reached the highest possible level in martial arts when he was awarded Soke (grandmaster) of Seiyo Shorin-Ryu Karate and Kobudo, placing him as the highest ranked martial artist in the world of this Okinawan art.
He also enjoys sketching, and some of his sketches appear on greeting cards. He has also received international awards for some of his artwork, such as the endpiece for this article (Figure 25).
NEW PUBLICATIONS BY THE WYOMING STATE GEOLOGICAL SURVEY
ATTENTION TOPOGRAPHIC MAP PURCHASERS!
The U.S Geological Survey (USGS) has increased the prices of several map series to their authorized dealers. We are forced to increase our prices on the fol-lowing maps:
1. USGS 1:100,000-scale metric topographic maps of Wyoming, folded and 1:250,000-scale AMS maps, rolled - $6.50 each.
2. U.S. Bureau of Land Management (BLM) Surface Management Status maps for the 1:100,000-scale metric topographic quadrangles in Wyoming, folded - $7.00 each.
Figure 25. Sketch entitled “Self protrait,” by W. Dan Hausel, 1999.

Wyoming Geo-notes No. 64/Page 62 Wyoming Geo-notes No. 64/Page 63
3. Wall maps, 1:500,000-scale shaded relief and topographic maps of Wyoming, rolled - $7.50.
4. Wall map, 1:500,000-scale BLM surface management status map of Wyoming, rolled - $7.50.
Fortunately, prices for U.S. Geological Survey 7 1/2-minute quadrangle maps
have not changed.
These maps (plus other topographic maps of Wyoming) are available over-the-counter at the Survey offices in Laramie or by mail. We do not offer quantity discounts and can make no exchanges or refunds on the USGS, BLM, or GTR’s Highway geology maps of Wyoming. Sales tax of 6% is added to all sales for Wyo-ming addresses.
NEW PUBLICATIONS BY THE WYOMINGSTATE GEOLOGICAL SURVEY
*Oil and gas fields map of central and northwestern Wyoming basins, by R.H. De Bruin, 1999: Map Series 53, scale 1:350,000 - $25.00, plotted color map, rolled only; $60.00, viewable image of map and viewing software (Mr. Sid) on CD-ROM.
*Coalbed methane activity in the western Powder River Basin, Campbell, Con-verse, Johnson, Natrona, and Sheridan Counties, Wyoming, by R.H. De Bruin, R.M. Lyman, L.L. Hallberg, and M.M. Harrison, 1999: Coalbed Methane Map CMM-99-2 - $30.00, plotted color map, rolled only; $100.00, digital version (ArcInfo/ArcView format) on CD-ROM.
*New publications of the Wyoming State Geological Survey, November, 1999, by R.W. Jones, 1999: unnumbered pamphlet – Free (specify indexed or non-indexed version).
*Geology of Wyoming, by D.L. Blackstone, Jr. and G.B. Glass, 1992: Information Pamphlet 2 (reprint) – Free.
*Geologic map of Wyoming, 3” x 5” postcard, color (reprint) – 5 for $1.00.
*Illustrated geologic history of the Medicine Bow Mountains and adjacent areas, Wyoming, S.H. Knight, 1990: Memoir 4 (second printing) - $6.00.
*A review of Wyoming’s coal mines and markets, 1999, by R.M. Lyman and L.L. Hallberg, 1999: Coal report CR 99-1 - $15.00 (photocopies only).
Fossils of Wyoming (fifth printing), by M.W. Hager, 1970: Bulletin 54 - $6.00.
Rocks and minerals of Wyoming (second printing), by W. D. Hausel, 1986: Bulletin 66 - $6.00.

Wyoming Geo-notes No. 64/Page 62 Wyoming Geo-notes No. 64/Page 63
Digital geologic map of the Gillette 30’ x 60’ Quadrangle, Campbell, Crook, and Weston Counties, northeastern Wyoming, compiled and mapped by C.S. Boyd and A.J. Ver Ploeg; digital cartography by A.L. Kirkaldie and C.A. Jessen, 1999: Geologic Hazards Section Digital Map HSDM 99-1 - $10.00, on CD-ROM for PC-based computers using Windows 95/98 or Windows NT; $25.00 for plotted color map only.
Preliminary digital surficial geologic map of the Douglas 30’ x 60’ Quadrangle, Con-verse and Platte Counties, Wyoming, mapped and compiled by L.L. Hallberg and J.C. Case; digital cartography by A.L. Kirkaldie and C.A. Jessen, 1999: Geologic Hazards Section Digital Map HSDM 99-2 - $10.00, on CD-ROM for PC-based computers using Windows 95/98 or Windows NT; $25.00 for plotted color map only.
Preliminary digital surficial geologic map of the Powell 30’ x 60’ Quadrangle, Big Horn and Park Counties, Wyoming, and southern Montana, mapped and compiled by L.L. Hallberg and J.C. Case; digital cartography by C.A. Jessen and A.L. Kirkaldie, 1999: Geologic Hazards Section Digital Map HSDM 99-3 - $10.00, on CD-ROM for PC-based computers using Windows 95/98 or Windows NT; $25.00 for plotted color map only.
Preliminary digital surficial geologic map of the Rock Springs 30’ x 60’ Quadrangle, Sweetwater County, Wyoming, mapped and compiled by L.L. Hallberg and J.C. Case; digital cartography by C.A. Jessen and A.L. Kirkaldie, 1999: Geologic Hazards Section Digital Map HSDM 99-4 - $10.00, on CD-ROM for PC-based computers using Windows 95/98 or Windows NT; $25.00 for plotted color map only.
Preliminary digital surficial geologic map of the Sheridan 30’ x 60’ Quadrangle, Sheri-dan, Johnson, and Campbell Counties, Wyoming, and southeastern Montana, mapped and compiled by L.L. Hallberg and J.C. Case; digital cartography by C.A. Jessen and A.L. Kirkaldie, 1999: Geologic Hazards Section Digital Map HSDM 99-5 - $10.00, on CD-ROM for PC-based computers using Windows 95/98 or Windows NT; $25.00 for plotted color map only.
Preliminary digital surficial geologic map of the Torrington 30’ x 60’ Quadrangle, Goshen and Platte Counties, Wyoming, mapped and compiled by L.L. Hallberg and J.C. Case; digital cartography by A.L. Kirkaldie and C.A. Jessen, 1999: Geologic Hazards Section Digital Map HSDM 99-6 - $10.00, on CD-ROM for PC-based computers using Windows 95/98 or Windows NT; $25.00 for plotted color map only.
Oil and gas fields map of the Greater Green River Basin, Wyoming, by R.H. De Bruin, 1999: Map Series 52, scale 1:350,000 - $25.00, plotted color map, rolled only; $60.00, viewable image of map and viewing software (Mr. Sid) on CD-ROM (please call for details and prices).

Wyoming Geo-notes No. 64/Page 64 Wyoming Geo-notes No. 64/Page 65
Preliminary geologic map of the Laramie 30’ x 60’ Quadrangle, Laramie and Albany Counties, Wyoming, by A.J. Ver Ploeg and C.M. Boyd, 1999: Preliminary Geologic Map PGM 99-1 (scale 1:100,000, black and white copies only, rolled) - $4.00.
Preliminary geologic map of the Barlow Gap Quadrangle, Natrona County, Wyoming, by W.M. Sutherland and W.D. Hausel, 1999: Preliminary Geologic Map PGM 99-2 (scale 1:24,000, black and white copies only, rolled) - $4.00.
*New releases since the last issue of Wyoming Geo-notes.
Each geologic section of the Survey now prepares and releases some of its own numbered reports and maps. Please contact the following Staff Geologists for coverage, availability, prices, or further information on specific commodities or topics [Phone: (307) 766-2286; FAX: (307) 766-2605; or use the EMail addresses included below]:
James C. Case - Geologic hazards and environmental geology(EMail: [email protected])Rodney H. De Bruin - Oil and gas (EMail: [email protected])Ray E. Harris - Industrial minerals and uranium (EMail: [email protected])W. Dan Hausel - Metals and precious stones(EMail: [email protected])Robert M. Lyman- Coal(EMail: [email protected])Alan J. Ver Ploeg - Geologic mapping and stratigraphy (EMail: [email protected])
CLEARANCE SALE ON WYOMING GEO-NOTES
Back issues available at $1.00 for a year’s issues. Sold only in sets of four issues each (three in 1986); please specify which year(s) needed; no single issues please. Quantities are limited. We pay postage on prepaid orders; Wyoming ad-dresses must add 6% sales tax.
1984: Numbers 2-5 1991: Numbers 29-321985: Numbers 6-9 1992: Numbers 33-361986: Numbers 10-12 1993: Numbers 37-401987: Numbers 13-16 1994: Numbers 41-441988: Numbers 17-20 1995: Numbers 45-481989: Numbers 21-24 1996: Numbers 49-521990: Numbers 25-28

Wyoming Geo-notes No. 64/Page 64 Wyoming Geo-notes No. 64/Page 65
OTHER PUBLICATIONS NOW AVAILABLE FROM THE WYO-MING STATE GEOLOGICAL SURVEY
Interpreting the landscapes of Grand Teton and Yellowstone National Parks— Recent and ongoing geology, by J.M. Good and K.L. Pierce, 1996: Published by Grand Teton Natural History Association – ISBN 0-931895-45-6, $13.00.
Geologic and historic guide to the Beartooth Highway, Montana and Wyoming, by H.L. James, 1995: Montana Bureau of Mines and Geology Special Publica-tion 110 - $20.00.
Roadside geology of Wyoming: by D.R. Lageson and D.R. Spearing, 1988: published by Mountain Press Publishing Company - ISBN 0-87842-216-1, $18.00.
*A correlated history of Earth, by Pan Terra, Inc., 1998: full color wall chart, 38” high x 28” wide, laminated - $20.00.
*New item since the last issue of Wyoming Geo-notes
Order these and other publications from: Wyoming State Geological Survey, P.O. Box 3008, Laramie, Wyoming 82071-3008. Phone: (307) 766-2286; Fax (307) 766-2605; and E-Mail: [email protected]. An order form is also included at the back of this issue of Wyoming Geo-notes. Many of these publications are also available over-the-counter at the Wyoming Oil and Gas Conservation Commission (Basko Building) in Casper, Wyoming. A free list of publications is available on request.
As of September 1, 1999, we are including postage charges on all mailed and shipped orders, including prepaid orders. Please use the shipping and handling chart on our order forms to calculate charges for your order.
WYOMING TOPOGRAPHIC MAP USERS
The Wyoming State Geological Survey is now a dealer for All Topo Maps: Wyo-ming, published by iGage . This is a packaged set of four CD-ROMs that contain all 1,885 U.S. Geological Survey quadrangle maps in Wyoming at a scale of 1:24,000 and 24 1° x 2° AMS (Army Map Service) quadrangles in Wyoming (and adjoining states) at a scale of 1:250,000. Another CD-ROM that contains the 1:100,000-scale metric topographic maps of Wyoming is under development and will soon be avail-able separately. The maps are scanned digital raster images of the information contained on the topographic maps, including all the marginal data surrounding each quadrangle. Some of the many features of this product include:
• Compatible with Windows 95/98/NT and will run on 486 PC machines and on Macintosh machines with Virtual PC emulator. Requires at least 60MB hard disk space, 2X/4X/ or higher CD-ROM reader, and pointing device.

Wyoming Geo-notes No. 64/Page 66 Wyoming Geo-notes No. 64/Page 67
• Supports graphics-capable black and white/color printers that are supported by Windows. Can export to clipboard and to many graphics programs.
• Viewing software has continuous GPS coordinate display for cursor location; users can double click on border to move to adjacent map; display allows map annotations, zooming from 25% to 200%, and printing and exporting of maps or sections of maps.
• Built in place-name and map-name databases allow searches by name or part of a name to locate map features and/or retrieve maps.
• Continuous coordinate display options include latitude/longitude, UTM, and military grid systems. True geo-referenced maps allow continuous straight line and path tracing measurements in feet, meters, and miles. The software allows unlim-ited waypoints to be set, the ability to jump to any entered waypoint, and includes a waypoint editor.
• The ability to combine the set of Wyoming maps with similar coverages for Colorado, Utah, Idaho, and Montana.
• Enhanced viewing software and map splicing/combining tools available as downloads from the vendor’s web site.
The set of four CD-ROMs sells for $125.00; Wyoming addresses must include 6% sales tax. Available over-the-counter or prepaid only. For more information and a description of other features, please contact the Survey’s sales office in Laramie.