wyoming labor force september 2012 · pdf filewyoming department of workforce services...
TRANSCRIPT

TRENDSWYOMING LABOR FORCE
http://doe.state.wy.us/LMI
September 2012
Vol. 49 No. 9 © Copyright 2012 by the Wyoming Department of Workforce Services Research & Planning
Potential Impacts of the Patient Protection and Affordable Care Act on Employer-Provided Benefits in Wyomingby: Sarah Trimmer, Research Intern
Passage of the Patient Protection and Affordable Care Act (PPACA) has generated considerable speculation about the act’s full effects on employment and businesses, but scant conclusive evidence exists. When the law is fully implemented, businesses with fewer than 50 employees would not be required to provide health insurance to workers, although they may qualify for tax credits if they choose to do so. While more than 96% of firms in the Wyoming employ fewer than 50 employees, nearly three-fourths of all full-time workers in the state are employed by firms with more than 100 employees. Using data from the Wyoming Benefits Survey and other state and federal data, in addition to previous research related to health care mandates in other states, this article explores the PPACA’s possible effects on employment in the state.
Extensive analyses have suggested how states will respond to the Patient Protection and Affordable Care Act
(PPACA, Public Law 111-148, often referred to as “Obamacare”) and implement provisions of the law, but conclusive evidence related to how these changes may affect private businesses of various sizes is scarce.
Intended to expand health insurance
coverage to more working, non-elderly Americans while offsetting costs that would otherwise be shifted to state budgets, PPACA requirements vary, depending on the number of employees a company has. For example, employers with fewer than 50 employees are not required to offer health insurance to their workers. However, in the
(Text continued on page 3)
• The number of full-time jobs with access to benefits increased from 2010 to 2011. However, this number was still considerably lower than in 2008, before Wyoming entered an economic downturn. … page 21
• The total number of occupational fatalities in Wyoming decreased from 33 in 2010 to 29 in 2011. … page 22
HIGHLIGHTS

© WYOMING LABOR FORCE TRENDSWyoming Department of Workforce Services Research & Planning
http://doe.state.wy.us/LMIPage 2 September 2012
Unemployment Rate (Percentage)
6.3 to 7.25.4 to 6.24.5 to 5.33.6 to 4.4
Fremont
Sweetwater
Green River
Evanston
Kemmerer
Pinedale
Jackson
Worland
Basin
Thermopolis
Sheridan
GilletteBu�alo
Sundance
Newcastle
Lusk
DouglasCasper
RawlinsWheatland
Torrington
CheyenneLaramie
Lander
Lincoln
Uinta
Sublette
TetonHotSprings
Washakie
Big Horn
Natrona
Johnson
Sheridan
Campbell
Crook
Weston
Carbon
ConverseNiobrara
GoshenPlatte
LaramieAlbany
Southeast RegionCentral RegionSouthwest Region
Northwest Region Northeast Region
Park
Cody
IN THIS ISSUE
Unemployment Rate by Wyoming County, July 2012 (Not Seasonally Adjusted)
The Impact of the Affordable Care Act on Wyoming’s Employers and Workforce . . . . . . . . . . . . . . . . . . . . . . . . . . . 1
Wyoming Benefits Survey 2012 Available Soon . . . . . . . . . . 21
Wyoming Occupational Fatalities Decrease in 2011 . . . . . 22
2008 CFOI Fatality Rates: Accuracy vs. Timeliness . . . . . . .24
Fatal Occupational Injuries, 2010 and 2011 . . . . . . . . . . . . . . . . . 28
Wyoming Jobless Rate Increases to 5.6% in July 2012 . . . . . . 29
Current Employment Statistics (CES) Estimates and Research & Planning’s Short-Term Projections, July 2012 . . . . . . . . . . . . . . . . . . . . . . . . . . . . . . . . . . . . . . . 30
State Unemployment Rates (Seasonally Adjusted) . . . . . 30
Wyoming Nonagricultural Wage and Salary Employment . . . . . 31
Economic Indicators . . . . . . . . . . . . . . . . . . . . . . . . . . . . . . . . . 32Wyoming County Unemployment Rates . . . . . . . . . . . . . . . . . 33Wyoming Normalized Unemployment Insurance Statistics: Initial Claims . . . . . . . . . . . . . . . . . . . . . . . . . . . . . . 34
Wyoming Normalized Unemployment Insurance Statistics: Continued Claims . . . . . . . . . . . . . . . . . . . . . . . . . . 35
Wyoming Labor Force TrendsA monthly publication of the
Wyoming Department of Workforce Services,Joan Evans, Director
Research & PlanningP.O. Box 2760
Casper, WY 82602-2760 [email protected]
307-473-3807
Tom Gallagher, ManagerTony Glover, Workforce Information Supervisor
Carola Cowan, Bureau of Labor Statistics Programs Supervisor
Phil Ellsworth, Editor Michael Moore, Associate Editor
Editorial Committee: David Bullard, Valerie A. Davis, Phil Ellsworth, and
Michael Moore
Contributors to Wyoming Labor Force Trends this month: David Bullard, Carola
Cowan, Margaret Hiatt, Sarah Trimmer, and Sherry Wen.
Subscriptions, additional copies, and back issues available free of charge.
© Copyright 2012 by the Wyoming Department of Workforce Services,
Research & Planning.
Material contained in this publication is in the public domain and may be reproduced without special permission provided that source credit is given to: Wyoming Labor
Force Trends, Wyoming Department of Workforce Services, Research & Planning
Department of Workforce Services Nondiscrimination Statement
The Department of Workforce Services does not discriminate on the basis of
race, color, religion, national origin, sex, age, or disability. It is our intention that all individuals seeking services from our agency be given equal opportunity and that eligibility decisions be based upon
applicable statutes, rules, and regulations.
Mission statement available
at http://doe.state.wy.us/LMI/mission.pdf.
ISSN 0512-4409

© WYOMING LABOR FORCE TRENDS
Page 3http://doe.state.wy.us/LMISeptember 2012
Wyoming Department of Workforce ServicesResearch & Planning
first phase of implementation (expiring in 2013), small businesses with fewer than 25 employees whose average annual wage is less than $50,000 per full-time equivalent may qualify for a tax credit to provide health insurance (IRS, 2010). For the second phase (beginning January 1, 2014, when full implementation of the law is activated), eligible small businesses that purchase insurance through a state health exchange will be provided with a tax credit, if the employer contributes at least 50% of the premium.
Conversely, medium and large businesses that employ more than 50 workers will be required to provide affordable health insurance coverage to their employees. Failure to do so will result in an assessed penalty of $2,000 to $3,000 per employee, excluding the first 30 employees. Opponents of this element of the law argue that high costs associated with providing health insurance may cause some employers to discontinue offering employer-sponsored health insurance, suggesting that businesses will instead opt to pay the PPACA penalties. The movement from private to public insurance, termed crowd-out, would drive workers to obtain coverage individually via a state-based health exchange or expanded Medicaid program based on income. Others contend employer-mandated insurance may cause reductions or eliminations of other benefits offered such as retirement, or possibly trigger shedding of jobs through layoffs or attrition.
The purpose of this study is to provide context to the possible effects of the PPACA on Wyoming’s private-sector by examining employers by employment size, industry, and benefits offered to
employees. From those data, this article will envision the economic implications of the PPACA on employers by exploring how they might respond to requirements given their size; will they shift costs from other benefits currently offered, reduce wages, or restructure their workforce? By extension, possible resulting impacts on the workforce will also be considered by examining the composition of the workforce, the types of jobs available in Wyoming, and the impact of nonresident workers. Suggestions for further research and strategies will also be provided.
Review of the Literature
Because mandated employer-sponsored health insurance is unfamiliar terrain for most states, there have been few examples of research on the policy impact and its effect on the behavior of businesses after they are required to offer health insurance to their workers. A recent study examined the only state example that has compiled more than two decades worth of data from Hawaii’s Prepaid Health Care Act passed in 1979, which requires all private-sector employers to provide coverage to employees working more than 20 hours per week (Buchmueller, DiNardo, Valetta, 2011). Labor market indicators such as wages, employment, hours, and benefits revealed that the law increased insurance coverage for workforce groups with traditionally low rates of coverage in the voluntary market. Further, the assertion that the mandates reduce wages and employment probabilities was not proven; the changes were not statistically significant, although a greater reliance on part-time workers was a noted detectable effect.
One concern about PPACA was that
(Text continued from page 1)

© WYOMING LABOR FORCE TRENDSWyoming Department of Workforce Services Research & Planning
http://doe.state.wy.us/LMIPage 4 September 2012
employers might scale back or eliminate employer-sponsored health insurance, thereby causing a transfer to public plans. However, a study examining employer response to mandated coverage in the 2006 Massachusetts reform initiative indicated employer coverage increased, even though the consequence for not offering insurance was slight ($295 per employee) compared to the PPACA penalty (Long, Stockley, Dahlen, 2012). According to a statewide survey, 94.2% of non-elderly residents reported being covered in 2010, compared to 86.6% in 2006. The percentage reporting coverage through an employer rose from 64.4% to 68.0% over the same period. Another study (Seiber and Florence, 2010) examined the impact of an expansion of the State Children’s Health Insurance Program and found an increase in dependent coverage in the small group market, with no significant movement from private plans. Consistent with those findings, Gabel and Whitemore (2008) conducted a randomized survey of 1,056 Massachusetts firms that indicated only 3% of firms were planning to drop coverage, a proportion similar to national figures suggesting that public plans will not experience a flooded market caused by crowd-out effects.
Because data related to employers’ responses to mandated employer-sponsored health insurance are scarce, analyses projecting a variety of outcomes have been published. One study (Sinaiko, 2004) examined the possible effects of a proposed 2003 California play-or-pay law (SB2) that would have required employers to expand health insurance coverage for a portion of the state’s working uninsured population. The study forecast labor market responses such as reduced wages, increased prices, changes in the workforce, and potential for adverse selection. Examples of adverse selection might include people who buy insurance
policies knowing that their risk is greater than normal, or people in lower-risk groups (e.g., young non-smokers) leaving the risk pool because they can find less expensive alternatives. Policy analysis of SB2 examined the possible effects of an 83% to 100% shift in wages as well as cost-containment strategies that could include price increases in products and services that are relatively fixed, restructuring the workforce to reduce part-time workers (more costly to insure), using overtime more frequently instead of hiring more workers, or reducing the size of the workforce. Without an individual mandate, it was projected that fewer workers would become insured.
Methodology
Employer Size Class and Benefits Methodology
Employer requirements of the PPACA are established by firm size. To determine the number of employers in the state by size, the number of unique Unemployment Insurance (UI) accounts was queried using 2011 Quarterly Census of Employment and Wages (QCEW)1 data. Employer size classes were defined by the number of employees in the fourth quarter of 2011 and were grouped by fewer than 50, 50-59, 60-79, 80-99, and more than 100 employees per firm. Rather than classify employers by fewer than 50 and more than 100, size categories of employers were
1 Data for QCEW come from UI-covered employment records. Approximately 91% of employment is covered by unemployment insurance in Wyoming, making it a near-census of employment in the states (U.S. Bureau of Economic Analysis, 2011). Among the types of firms excluded are railroads and some agriculture operations. For a complete list of businesses excluded from coverage, go to the Technical Appendix of “Wyoming 2000 Annual Covered Employment and Wages” at http://doe.state.wy.us/LMI/00202pub/tech_app.htm.

© WYOMING LABOR FORCE TRENDS
Page 5http://doe.state.wy.us/LMISeptember 2012
Wyoming Department of Workforce ServicesResearch & Planning
chosen for discussion purposes to gauge the various decisions firms may apply, and determine how many businesses would potentially be involved. For example, how many firms with 50 to 59 workers that currently do not offer health insurance may be compelled to eliminate positions to maintain a firm size of less than 50 to avoid penalties and having to offer mandated health coverage?
In 2011, benefits survey questionnaires were completed by 2,031 Wyoming employers including both the private-sector and state & local government (Leonard & Saulcy, 2012). In total, these employers represented 9.3% of Wyoming’s firms. The results specific to the 2011 benefits survey questionnaire presented in Table 1 are actual sample responses, rather than extrapolated estimates for the entire population of employers. It should be noted that Research & Planning (R&P) uses a model that classifies business sizes by 1-4, 5-9, 10-19, 20-49 and 50+ employees to generalize responses to the entire population. Because of this, the capability to make accurate estimations of the newly defined size classifications (<50, 50-59, 60-79, 80-99, >100) for this particular study is not possible. Data presented in tables 3, 4, and 5 use generalized population estimates from 2011 benefits survey information. For a full description of the methodology to determine estimates, refer to the methods section of the Wyoming Benefits Survey (2011).
Workforce Demographics and Employment Methodology
Historical demographic data were analyzed to identify trends related to the composition of the workforce by gender, wages, proportion of nonresident workers,
industry sectors, and county employment information using longitudinal labor market information collected by R&P.
Additionally, 2011 income data stratified by age, gender, and industry sector were analyzed to make reasonable approximations regarding the number of resident workers who theoretically would have met the definition of low-income and may have qualified for coverage under an expanded Medicaid program. For discussion purposes, the 2011 Health and Human Services (HHS) poverty guidelines (used to determine financial eligibility of Medicaid programs) were used to define those living in poverty at 100% of the Federal Poverty Level (FPL), or earning an annual income of $10,890 for individuals and $22,350 for a family of four. Low-income individuals, who will gain coverage January 1, 2014 under an expanded Medicaid program, will be defined as those earning an annual income of between 100% and 138% FPL. The PPACA will apply what is called a standard disregard that will exclude 5% of an individual’s income, making the de facto threshold for eligibility 138% rather than 133% FPL. Using 2011 HHS poverty guidelines, that means individuals with an annual income of $15,028 (138% FPL; equivalent to a full-time job paying a minimum wage of $7.25
Table 1: Wyoming Benefits Survey Response Rate, by Number of Employees, 2011
Firm Size
Returned Surveys
Total Firms
Response Rate Employees
<50 1,859 21,068 8.8% 15,767
50-59 24 140 17.1% 1,299
60-79 25 166 15.1% 1,699
80-99 28 89 31.5% 2,492
>100 95 418 22.7% 50,992
All Sizes 2,031 21,881 9.3% 72,249

© WYOMING LABOR FORCE TRENDSWyoming Department of Workforce Services Research & Planning
http://doe.state.wy.us/LMIPage 6 September 2012
per hour) and a family of four earning $30,843 or less are considered low income.
Results
Employer Size Composition
In fourth quarter 2011, Wyoming had 21,881 unique and active Unemployment Insurance (UI) accounts. Of those, 21,068 (96.3%) were employers with fewer than 50 workers; 395 UI accounts were linked to employers with a workforce between 50 and 99; and the remaining 418 businesses employed more than 100 employees. Table 2 shows the distribution of firms by size and industry sector. The three largest industry sectors in terms of number of firms in the state were construction (3,534
firms, 16.2% of all firms), professional & business services (4,011, 18.3%), and trade, transportation, & utilities (4,063, 18.6%); these three sectors accounted for more than half (53.1%) of all firms in Wyoming.
Employer Sponsored Benefits
Data from the 2011 Wyoming Benefits Survey (Research & Planning, 2011) showed that among firms with more than 50 employees, 91.4% offered health insurance, and as the number of employees decreased below 50, the percentage of workers offered benefits also declined. The survey also revealed that the majority of direct compensation costs (84.6%) were tied to wages and salaries, whereas 5.0% of indirect total compensation consisted of defined-benefit
Table 2: Wyoming Firms by Industry Sector and Number of Employees, Fourth Quarter 2011
Number of Employees per Firm Total Firms
% of All Firms<50 50-59 60-79 80-99 >100
n % n % n % n % n % n %Total Responses 21,068 100.0% 140 100.0% 166 100.0% 89 100.0% 418 100.0% 21,881 100.0%Natural Resources & Mining
1,342 6.4% 10 7.1% 17 10.2% 15 16.9% 54 12.9% 1,438 6.6%
Construction 3,480 16.5% 11 7.9% 16 9.6% 5 5.6% 22 5.3% 3,534 16.2%Manufacturing 543 2.6% 4 2.9% 7 4.2% 7 7.9% 22 5.3% 583 2.7%Trade, Transp., & Utilities 3,917 18.6% 30 21.4% 40 24.1% 12 13.5% 63 15.1% 4,063 18.6%Information 281 1.3% 5 3.6% 8 4.8% 2 2.2% 6 1.4% 302 1.4%Financial Activities 1,689 8.0% 12 8.6% 9 5.4% 5 5.6% 12 2.9% 1,727 7.9%Prof. & Business Services
3,972 18.9% 11 7.9% 15 9.0% 2 2.2% 11 2.6% 4,011 18.3%
Educational & Health Services
1,798 8.5% 24 17.1% 22 13.3% 10 11.2% 115 27.5% 1,970 9.0%
Leisure & Hospitality 1,999 9.5% 25 17.9% 23 13.9% 17 19.1% 48 11.5% 2,113 9.7%Other Services 1,767 8.4% 3 2.1% 2 1.2% 2 2.2% 6 1.4% 1,780 8.1%Public Admin. (State & Local Government)
280 1.3% 5 3.6% 7 4.2% 12 13.5% 59 14.1% 363 1.7%
Source: Quarterly Census of Employment and Wages.

© WYOMING LABOR FORCE TRENDS
Page 7http://doe.state.wy.us/LMISeptember 2012
Wyoming Department of Workforce ServicesResearch & Planning
and defined-contribution plans, and 10.4% was allocated to medical, dental, and vision insurance plans.
Frequencies of responses from the 2011 benefits survey were computed (see Table 1). Consistent with previous findings, full-time employees who work in firms with a workforce of more than 50 employees are
more likely to work for employers that offer insurance, than are part-time workers in smaller firms with less than 50 employees (see Table 3).
Table 4 (see page 8) represents generalized data from the 2008 through 2011 benefits surveys to generate approximations across all employers
Table 3: Estimated Number and Percentage of Firms Offering, Workers Offered, and Workers Enrolled in Employer-Provided Health Insurance and Dependent Health Insurance Coverage in Wyoming, 2011
Firm Size (by Number of Employees)
Total, All Firm
Sizes<50 50-59 60-79 80-99 >100
Full-Time Employment18.9% 1.5% 2.3% 3.2% 74.2% 100.0%
43,039 3,452 5,193 7,249 169,085 228,018
Total Firms96.5% 0.7% 0.7% 0.4% 1.7%22,351 157 167 89 397 23,161
Firms Offering Health Insurance40.8% 95.8% 76.0% 96.4% 97.9%
9,119 150 127 86 389 9,871
Workers Offered Health Insurance60.1% 88.5% 81.9% 95.0% 93.9%
25,867 3,055 4,253 6,887 158,771 198,832
Workers Enrolled in Health Insurance12.2% 1.4% 1.9% 3.6% 81.0%5,242 49 97 258 136,897 142,543
Firms Offering Dependent Health Insurance33.6% 95.8% 76.0% 89.3% 97.9%7,510 150 127 79 389 8,255
Workers Offered Dependent Health Insurance52.3% 86.4% 79.8% 89.5% 92.0%22,510 2,982 4,144 6,488 155,558 191,682
Part-Time Employment36.4% 3.2% 2.7% 4.8% 52.9% 100.0%16,770 1,476 1,252 2,204 24,346 46,048
Firms Offering Health Insurance2.9% 20.8% 0.0% 10.7% 28.4%
648 33 0 10 113 803
Workers Offered Health Insurance4.0% 14.1% 0.0% 2.6% 24.5%
671 208 0 57 5,965 6,901
Workers Enrolled in Health Insurance10.5% 4.9% 0.0% 0.8% 83.9%1,762 72 0 17 20,418 22,268
Firms Offering Dependent Health Insurance2.1% 16.7% 0.0% 10.7% 27.4%469 26 0 10 109 614
Workers Offered Dependent Health Insurance3.6% 6.4% 0.0% 2.6% 17.3%
604 94 0 57 4,212 4,967
Source: Wyoming Benefits Survey.

© WYOMING LABOR FORCE TRENDSWyoming Department of Workforce Services Research & Planning
http://doe.state.wy.us/LMIPage 8 September 2012
for full- and part-time workers, while Table 5 (see page 9) shows the estimated percentage of workers offered selected benefits by full- or part-time working status and industry sector. Workers classified as full-time employees in construction, leisure & hospitality, and other services are less likely to receive selected benefits, whereas those employed in mining, state & local government, and educational & health services are more likely to be offered selected benefits, specifically health insurance.
Workforce
The PPACA expands access to medicaid care for the non-elderly workforce through several mechanisms, including the expansion of Medicaid to low-income
individuals who earn incomes up to 138% of the FPL, and through health insurance exchanges that act as marketplaces for small employers and individuals to purchase coverage. In Wyoming, these two reforms will have the most significant impact on the workforce as most employers will not be required to provide health insurance coverage because of firm size. Examining the composition of the workforce by wages, gender, age, industry sectors, and the impact of nonresident workers are important factors to consider.
According to Wyoming wage records, in 2011 the average annual wage in Wyoming was $32,219, with men earning $43,989 and women earning $25,719
Table 4: Percentage of Employers Offering Selected Benefits to Their Full- and Part-Time Employees in Wyoming, 2008-2011
Full-Time Part-TimeBenefit Type 2008 2009 2010 2011 2008 2009 2010 2011
Child Care 2.6% 1.7% 2.5% 2.0% 1.1% 1.1% 1.4% 1.1%Dental Plan 27.2% 28.3% 29.2% 30.7% 3.3% 4.1% 3.4% 5.3%Dependent Health Insurance 34.3% 36.1% 35.5% 34.9% 2.7% 4.8% 3.9% 4.7%Educational/Tuition Assistance 23.2% 21.9% 22.2% 22.9% 10.8% 7.5% 8.7% 9.4%Flexible Spending Account 9.9% 11.8% 12.2% 11.4% 1.8% 2.0% 2.4% 2.4%Health Insurance 42.7% 44.3% 44.6% 42.5% 6.0% 6.1% 6.0% 5.6%Hiring Bonus 6.4% 6.2% 4.9% 5.2% 1.6% 1.1% 0.6% 1.3%Life Insurance 26.9% 28.0% 27.5% 27.7% 4.6% 4.1% 3.5% 4.0%Long-Term Disability 11.2% 12.5% 12.7% 12.7% 2.0% 1.6% 1.8% 2.1%Paid Holidays 55.5% 54.7% 56.0% 54.8% 18.1% 17.6% 17.7% 15.8%Paid Personal Leave 23.6% 30.6% 25.3% 20.6% 6.9% 6.8% 6.2% 5.5%Paid Sick Leave 26.9% 28.7% 27.8% 27.7% 5.5% 6.7% 5.1% 5.1%Paid Vacation 55.3% 56.0% 52.7% 49.5% 12.9% 11.9% 11.3% 10.7%Retirement Plan 34.8% 31.0% 32.3% 32.3% 8.1% 6.5% 6.2% 6.1%Short-Term Disability 11.9% 12.0% 12.3% 13.4% 1.6% 1.7% 2.1% 2.4%Vision Plan 15.5% 16.6% 17.8% 18.5% 1.8% 2.3% 3.5% 3.5%
Source: Wyoming Benefits Survey.
(Text continued on page 10)

© WYOMING LABOR FORCE TRENDS
Page 9http://doe.state.wy.us/LMISeptember 2012
Wyoming Department of Workforce ServicesResearch & Planning
Table 5: Percentage of Full- and Part-Time Employees Offered Selected Benefits in Wyoming by Industry, 2011
Industry
Benefit Type All
Indu
stri
es
Min
ing
Cons
truc
tion
Man
ufac
turi
ng
Trad
e, T
rans
p., &
U
tilit
ies
Info
rmat
ion
Fina
ncia
l A
ctiv
itie
s
Prof
. & B
usin
ess
Serv
ices
Educ
atio
nal &
H
ealt
h Sv
cs.
Leis
ure
&
Hos
pita
lity
Oth
er S
ervi
ces
Stat
e &
Loc
al
Gov
t.
Full-Time EmployeesChild Care 9.1 6.3 2.5 3.5 0.1 0.5 0.2 2.7 16.1 24.9 3.8 21.6Dental Plan 70.4 86.0 47.2 74.2 62.9 81.7 73.2 52.9 84.6 31.6 50.4 96.5Dependent Health Insurance 73.9 89.5 51.1 80.9 71.1 83.5 73.7 61.9 84.3 32.5 57.2 96.6Educational/Tuition Assistance 51.8 76.8 28.1 68.5 44.0 21.4 51.1 36.8 64.1 17.0 17.6 69.7Flexible Spending Account 51.9 72.7 17.8 57.2 34.5 32.3 55.9 34.7 75.0 32.1 30.1 66.5Health Insurance 77.7 91.0 57.3 85.6 75.5 86.7 79.9 70.5 87.8 34.6 62.8 97.0Hiring Bonus 19.6 67.2 8.1 11.6 12.2 2.0 27.1 3.6 21.0 9.7 4.0 0.1Life Insurance 68.8 86.6 45.4 80.7 60.3 61.1 70.1 52.9 81.4 29.0 50.6 95.6Long-Term Disability 46.8 76.1 18.5 64.8 33.7 41.9 64.0 28.9 60.7 11.8 24.5 56.8Paid Holidays 78.9 90.7 62.5 93.9 80.3 93.1 89.3 79.3 84.4 19.9 66.2 99.5Paid Personal Leave 35.2 40.6 29.8 19.0 40.0 50.7 44.3 27.7 45.9 11.4 24.2 27.9Paid Sick Leave 50.9 59.4 17.3 52.6 35.3 41.7 53.9 41.6 72.6 40.8 20.4 73.0Paid Vacation 73.0 85.0 49.6 89.9 73.3 53.0 72.3 63.7 78.0 66.0 74.0 73.5Retirement Plan 73.4 87.8 61.5 86.3 65.7 79.5 80.0 71.9 83.6 44.5 52.0 76.2Short-Term Disability 39.8 73.3 23.9 62.1 30.3 44.1 53.9 27.1 42.9 14.7 31.7 32.2Vision Plan 56.2 80.8 28.6 51.3 42.1 67.6 56.0 37.2 71.8 22.2 35.5 86.2Part-Time EmployeesChild Care 6.6 2.3 1.2 3.1 0.0 0.3 0.0 0.0 11.4 12.4 0.0 7.2Dental Plan 9.9 5.8 1.7 7.4 7.4 2.8 17.7 6.3 21.9 3.8 0.8 12.2Dependent Health Insurance 8.1 5.3 1.9 7.4 7.1 1.4 13.0 4.0 16.2 3.7 0.4 11.7Educational/Tuition Assistance 12.8 15.5 7.9 20.5 3.9 0.4 18.2 8.3 29.2 11.1 3.0 4.6Flexible Spending Account 9.7 9.2 0.9 7.4 0.6 1.1 17.0 1.8 35.3 4.0 0.4 15.3Health Insurance 9.7 6.5 2.0 7.4 9.8 2.8 11.2 4.0 20.6 3.7 2.4 11.8Hiring Bonus 1.7 6.8 0.0 8.4 0.2 0.0 5.8 0.8 2.7 2.6 0.0 0.0Life Insurance 9.3 6.7 1.9 7.4 8.3 4.3 12.2 5.3 19.4 2.3 1.7 17.0Long-Term Disability 4.9 5.8 0.2 0.0 0.2 0.4 2.2 5.0 14.7 0.5 0.4 10.9Paid Holidays 19.7 14.0 9.2 20.0 15.6 4.4 24.4 18.9 35.5 10.6 12.2 26.3Paid Personal Leave 13.0 15.6 2.3 0.5 0.2 1.4 22.5 6.1 43.0 4.5 9.5 0.1Paid Sick Leave 14.7 9.0 2.7 1.6 6.1 0.0 15.3 4.3 43.4 2.0 3.5 22.6Paid Vacation 14.6 17.2 2.5 10.9 4.7 2.6 22.5 12.9 20.9 16.9 12.5 22.9Retirement Plan 24.9 17.2 3.7 19.6 17.0 19.1 32.9 18.9 52.9 14.3 7.3 20.7Short-Term Disability 4.6 5.8 0.2 0.0 0.2 4.3 2.3 6.4 13.6 0.8 0.4 5.8Vision Plan 7.9 5.8 2.2 7.4 1.7 0.4 6.7 2.2 21.2 4.3 1.2 12.2
Source: Wyoming Benefits Survey.

© WYOMING LABOR FORCE TRENDSWyoming Department of Workforce Services Research & Planning
http://doe.state.wy.us/LMIPage 10 September 2012
annually (Earnings in Wyoming, 2012). The average annual wage of $32,219 was driven down due to the high proportion of nonresident workers (17.7%) who earned what was considered low income ($16,579). According to the U.S. Census Bureau’s Current Population Survey (CPS), the median annual income in Wyoming is $53,236. CPS data are based on a household survey, unlike Wyoming wage records data. Table 6 summarizes 2011 earnings by gender and age. Women age 20-24 were more likely to be classified as low-income earners than were men in the same age group, mostly due to the large proportion of men in industries that pay higher wages, such as mining or construction. Excluding ages 0-19 and 65 and older, the largest proportion of low-income earners was in the 20-24 age group, with women consistently earning less in all industry sectors. Table 7 (see page 11) shows the number of women and men in the 20-24 age range and their average annual wages by industry. Shaded areas depict average annual wages at or around the 2011 poverty threshold of 138% FPL ($15,028). To
(Text continued from page 8)Table 6: Average Earnings in Wyoming by Age Group and Gender, All Counties, 2011
Gender Age n Age %Gender
%
Average Annual Wage
Wom
en
0-19 9,461 7.1% $4,59120-24 14,921 11.1% $12,34225-34 28,852 21.5% $23,76835-44 24,310 18.1% $30,50445-54 28,387 21.2% $33,35155-64 22,218 16.6% $33,28165+ 5,991 4.5% $18,167Nonresident* 7 0.0% $18,943Total 134,147 100.0% 37.8% $25,719
Men
0-19 9,698 6.2% $5,94020-24 16,992 10.8% $20,64425-34 37,150 23.6% $39,97235-44 30,069 19.1% $51,55445-54 31,557 20.0% $57,28455-64 24,777 15.7% $57,84565+ 7,256 4.6% $33,614Nonresident* 10 0.0% $35,650Total 157,509 100.0% 44.4% $43,989
Non
resi
dent
*
0-19 22 0.0% $37,96620-24 33 0.1% $17,19925-34 461 0.7% $43,87535-44 535 0.9% $53,49045-54 482 0.8% $58,93755-64 520 0.8% $56,22165+ 102 0.2% $38,644Nonresident* 60,629 96.6% $15,324Total 62,784 100.0% 17.7% $16,579
Tota
l
0-19 19,181 5.4% $5,31120-24 31,946 9.0% $16,76325-34 66,463 18.8% $32,96535-44 54,914 15.5% $42,25445-54 60,426 17.0% $46,05455-64 47,515 13.4% $46,34165+ 13,349 3.8% $26,720Nonresident* 60,646 17.1% $15,328Total 354,440 100.0% 100.0% $32,219
Source: Wyoming Wage Records. Available at http://doe.state.wy.us/LMI/earnings_tables/2012/index.htm.
*Nonresidents are workers who do not have a Wyoming-issued driver’s license and work less than four quarters in Wyoming (Jones, 2002). Demographic data are not available for these workers. More information is available at http://doe.state.wy.us/LMI/1102/a1.htm.

© WYOMING LABOR FORCE TRENDS
Page 11http://doe.state.wy.us/LMISeptember 2012
Wyoming Department of Workforce ServicesResearch & Planning
view earnings by industry and more age categories see the R&P website; http://doe.state.wy.us/LMI/.
According to Kaiser Family Foundation data, approximately 73,300 non-elderly adults in Wyoming lack health insurance, roughly 16% of the 19-64 age group (Kaiser, 2011).
Wyoming has a higher proportion of aging workers and has seen a decline in workers less than 44 years old. Table 8 (see page 12) shows a substantial increase in workers of unknown age that are not Wyoming residents, and a significant reduction in younger workers, especially those in the 35-44 age group (-9.06% from 1992 to 2010).
Data reaching back to 1992 provides needed context to explain the increase in workers age 55-64. In some states, this increase was due to older workers returning to the workforce due to poor economic conditions, but in Wyoming it was more likely a function of Wyoming’s population aging faster than the nation, paired with an exodus of younger potential workers (Research & Planning, 2012). Figure 1 (see page 13) shows the changing composition of the workforce by age group from 1992 to 2010.
Nonresident Workers
Since 2006, the state has seen dramatic increases in the numbers of nonresident employees in-migrating.
Table 7: Average Annual Wages of 20- to 24-Year-Olds in Wyoming by Industry and Gender, 2011
Women Men
n
Average Annual Wages
% of FPLa n
Average Annual Wages
% of FPLa
Natural Resources & Mining 301 $21,938 201.5% 2,729 $38,146 350.3%
Construction 235 $15,439 141.8% 2,494 $21,031 193.1%
Manufacturing 243 $15,020 137.9% 760 $25,153 231.0%
Wholesale Trade, Transportation & Utilities 373 $16,668 153.1% 1,131 $30,713 282.0%
Retail Trade 2,963 $10,696 98.2% 2,661 $14,556 133.7%
Information 173 $13,975 128.3% 183 $15,104 138.7%
Financial Activities 638 $15,814 145.2% 350 $20,483 188.1%
Professional & Business Services 870 $11,698 107.4% 1,265 $16,386 150.5%
Educational Services 1,035 $12,735 116.9% 549 $9,624 88.4%
Health Care & Social Assistance 2,902 $15,418 141.6% 535 $15,599 143.2%
Leisure & Hospitality 4,058 $8,832 81.1% 2,840 $9,495 87.2%
Other Services 468 $11,796 108.3% 601 $21,628 198.6%
Public Admin. (State & Local Govt.) 604 $15,891 145.9% 776 $19,346 177.6%
aFPL = Federal Poverty Level. In 2011, the Federal Poverty Level was $10,890 annually; Workers earning less than 138% of the FPL ($15,028) were considered low-income. Shaded cells indicate average annual wages lower than the 138% of FPL standard for low income.

© WYOMING LABOR FORCE TRENDSWyoming Department of Workforce Services Research & Planning
http://doe.state.wy.us/LMIPage 12 September 2012
Nonresident workers are defined as those workers who do not have a Wyoming-issued driver’s license and who work less than four quarters in the state. Jones (2002) found that nonresidents work in the state, on average, only two quarters, and likely have quarterly earnings that are significantly lower than more permanent residents.
In 1992 nonresident workers composed 9.4% of the workforce. Less than two decades later that percentage has nearly doubled (18.4%): close to one-fifth of the workforce consists of nonresidents. Historical data have been collected on Wyoming’s workforce by age, gender, industry, and residence status. Observing nonresident trends over the past two decades exposes significant changes
in Wyoming’s workforce composition, particularly as they relate to the increasing number of nonresident workers and age distribution, where workers age 44 and younger are decreasing as a percentage of the workforce and those 45 and older are increasing. Both male and female resident workers have declined as a percentage of Wyoming’s workforce despite population growth (see Figure 2, page 14), but it appears women have been most impacted by the in-migration of nonresident workers. Table 9 (see page 15) summarizes the distribution of nonresident workers by county. Counties that rely heavily on nonresident workers are Campbell, Crook, Park, Sublette, Teton, Uinta, and Weston where industries such as natural resources & mining and leisure & hospitality are predominant.
Table 8: Workers in Wyoming by Age Group, 1992 to 2010
Year
Age Category
0-19 20-24 25-34 35-44 45-54 55-64 65+
Nonresident*1992 10.1% 11.0% 23.1% 24.3% 13.5% 6.6% 2.1% 9.4%1993 10.6% 11.5% 22.9% 24.9% 14.2% 6.6% 2.0% 7.4%1994 10.7% 11.5% 22.0% 25.0% 14.9% 6.8% 2.2% 7.1%1995 10.6% 11.4% 21.7% 25.0% 15.5% 6.8% 2.0% 7.1%1996 10.5% 11.2% 21.0% 24.6% 16.2% 6.9% 2.2% 7.6%1997 10.5% 11.4% 20.3% 24.3% 16.9% 7.1% 2.1% 7.5%1998 10.4% 11.2% 19.3% 23.4% 17.3% 7.4% 2.2% 8.9%1999 10.3% 11.0% 18.5% 22.2% 17.6% 7.6% 2.2% 10.6%2000 10.4% 11.2% 18.2% 21.6% 18.3% 7.8% 2.3% 10.2%2001 9.7% 10.8% 17.3% 19.9% 18.3% 8.0% 2.4% 13.6%2002 9.4% 10.8% 17.5% 19.2% 18.9% 8.8% 2.5% 12.9%2003 8.9% 10.8% 17.4% 18.1% 19.0% 9.3% 2.6% 14.0%2004 8.7% 10.8% 17.7% 17.6% 19.3% 9.9% 2.8% 13.1%2005 8.5% 10.7% 17.6% 16.9% 19.3% 10.4% 2.9% 13.8%2006 8.2% 10.0% 17.2% 16.1% 18.6% 10.6% 3.0% 16.4%2007 7.6% 9.7% 17.1% 15.4% 17.9% 10.9% 3.1% 18.4%2008 6.9% 9.4% 17.4% 15.1% 17.6% 11.3% 3.2% 19.1%2009 5.9% 9.3% 18.3% 15.5% 18.0% 12.4% 3.5% 17.2%2010 5.3% 8.8% 18.2% 15.2% 17.5% 13.0% 3.6% 18.4%
*Nonresidents are workers who do not have a Wyoming-issued driver’s license and work less than four quarters in Wyoming (Jones, 2002). Demographic data are not available for these workers. More information is available at http://doe.state.wy.us/LMI/1102/a1.htm.

© WYOMING LABOR FORCE TRENDS
Page 13http://doe.state.wy.us/LMISeptember 2012
Wyoming Department of Workforce ServicesResearch & Planning
Discussion
Employers with Fewer than 50 Workers
Small businesses with fewer than 50 workers comprise the majority (96%) of employers in the state. Hence, most Wyoming businesses will not be directly impacted by employer-sponsored health insurance provisions. There are two choices available for this employer size: either voluntarily provide health insurance to receive tax credits or place the responsibility on the workforce to purchase individual insurance through
exchanges or, if qualified, enroll in the state’s expanded Medicaid program.
A recent initiative sponsored by the Robert Wood Johnson Foundation called Buying Value (http://www.buyingvalue.org/) “seeks to achieve better care and lower health costs for the people it represents by replacing the current volume-based purchasing model in health care with one based on quality and patient safety.” Efforts like these could be key for sparsely populated states like Wyoming and help attract small employers by helping them purchase insurance for their employees, ensuring a well-populated state exchange that has the ability to thrive (Krueger, Alexander, 2011).
0.0%
20.0%
40.0%
60.0%
80.0%
100.0% 0-19
20-24
25-34
35-44
45-54
55-64
65+
Nonresident*2010200820062004200220001998199619941992
Source: Wyoming Wage Records Database.* Nonresidents are workers who do not have a Wyoming-issued driver’s license and work less than four quarters in Wyoming (Jones, 2002). Demographic data are not available for these workers. More information is available at http://doe.state.wy.us/LMI/1102/a1.htm.
Figure 1: Composition of Wyoming Workforce by Age Group, 1992-2010

© WYOMING LABOR FORCE TRENDSWyoming Department of Workforce Services Research & Planning
http://doe.state.wy.us/LMIPage 14 September 2012
Employers with 50 to 99 Workers
The PPACA will likely rearrange incentives to support certain activities and strategies for firms that employ between 50 to 99 workers. Even though the 2011 Benefits Survey estimates 96% of firms that employ between 50 to 59 workers already offer health insurance, 2011 survey estimates reveal only 57.6% of those in construction and 34.6% of those employed in leisure & hospitality are offered employer-sponsored health insurance. Of the 140 firms employing between 50 to 59 employees, it is plausible that under current economic conditions, paired with the high cost of providing insurance, a modest number of jobs could be lost. Specifically, one would expect a higher probability of jobs in the 36 firms found in the construction and leisure & hospitality sectors to maintain a workforce with fewer than 50 employees to avoid penalties or the additional cost of offering health insurance. Labor market responses have documented employer reactions to offering insurance, and often there has been a false presumption of lower wages, when in fact the
reaction by employers is to increase the number of working hours. Cutler and Madrian (1998) argued that health insurance costs are fixed, and as insurance becomes more expensive to provide, there is an employer incentive to increase hours thereby maintaining a smaller workforce. Other possible, but perhaps less likely scenarios include a shift in other benefits. For example, some employers may reduce life insurance or retirement offers to employees.
Businesses that employ between 50 and 99 workers, and in particular those with between 60
and 79 workers, may seek an advantage by dividing their company in half, applying for two separate UI accounts, and subsequently moving a portion of their employees to the new account. This could be construed as a form of what is called SUTA (State Unemployment Tax Act) dumping. The working definition of SUTA dumping involves a tax evasion scheme where shell companies are “formed and are creatively manipulated to obtain low UI tax rates” (California Employment Development Department, N.D.). When a new lower rate is obtained, payroll from the original entity
0.0%
10.0%
20.0%
30.0%
40.0%
50.0%
% Male Workers
% Female Workers
% Nonresident* Workers
2010200820062004200220001998199619941992
Source: Wyoming Wage Records Database.Nonresidents are workers who do not have a Wyoming-issued driver’s license and work less than four quarters in Wyoming (Jones, 2002). Demographic data are not available for these workers. More information is available at http://doe.state.wy.us/LMI/1102/a1.htm.
Figure 2: Composition of Wyoming Workforce by Gender, 1992-2010

© WYOMING LABOR FORCE TRENDS
Page 15http://doe.state.wy.us/LMISeptember 2012
Wyoming Department of Workforce ServicesResearch & Planning
with a high UI tax rate is shifted to the account with the lower rate. The entity with the higher rate is then “dumped.” Related to the PPACA provision to provide coverage by firms with more than 50 workers, the actual “dumping” of the original tax entity would not occur. For example a firm with 70 employees could divide the entity into equal halves and employ 35 workers between two UI accounts, thus avoiding requirements of the law by manipulating the UI system
to gain advantage from penalties. The potential gain for this strategy for companies employing 80 to 99 workers is assumed to be less than with firms with 60 to 79 workers, as it would hinder the ability for future growth.
Another potential concern for employers with 51-99 workers is that effective January 1, 2016, the small market group will be defined as 100 workers or less. This change may induce firms of this size to
Table 9: Number and Percentage of Nonresident Workers in Wyoming by County, 2006-2011
2006 2007 2008 2009 2010 2011n % n % n % n % n % n %
Statewide 56,837 16.1 67,147 18.0 70,328 18.5 56,440 15.9 64,347 18.4 62,784 17.7%Albany 2,256 12.4 2,393 12.7 2,313 12.5 2,078 11.5 2,260 13.0 2,262 14.1Big Horn 347 7.1 435 8.6 441 8.6 394 8.1 464 9.5 508 9.9Campbell 8,543 21.8 10,170 24.1 11,903 26.0 9,789 22.9 10,126 24.9 4,038 12.1Carbon 1,314 14.9 1,545 16.4 1,673 17.3 1,339 15.0 2,017 22.0 1,409 16.8Converse 506 8.7 696 11.3 969 14.4 694 11.0 774 12.4 787 12.0Crook 658 20.9 729 22.1 812 23.3 744 22.2 851 25.4 338 13.5Fremont 1,753 8.7 2,124 10.1 2,269 10.6 2,101 10.1 2,411 11.7 2,534 12.5Goshen 756 13.5 807 14.1 1,068 17.6 972 16.3 1,050 17.5 638 11.8Hot Springs 157 6.6 165 6.8 183 7.2 189 7.7 232 9.6 235 9.6Johnson 510 12.3 545 12.7 627 14.2 559 13.2 561 13.6 419 10.7Laramie 7,230 13.5 8,329 15.0 8,057 14.5 7,112 13.4 7,736 14.9 8,112 16.7Lincoln 919 12.0 2,601 26.1 1,901 20.9 1,135 14.5 1,000 13.9 1,331 16.5Natrona 5,992 11.7 5,785 11.1 6,753 12.5 4,668 9.4 5,621 11.6 4,480 9.4Niobrara 93 9.5 96 9.4 117 11.1 123 11.4 133 12.6 84 8.4Park 3,579 19.4 3,813 20.1 3,872 20.3 3,712 19.9 4,139 22.5 2,240 14.4Platte 593 13.4 578 13.3 564 13.3 550 12.8 629 14.3 535 12.5Sheridan 1,199 7.9 1,534 9.6 1,555 9.6 1,334 8.7 1,474 10.0 1,438 10.1Sublette 1,393 22.5 1,626 23.8 1,743 24.2 1,392 21.3 1,645 26.0 2,304 29.6Sweetwater 4,882 15.4 6,022 17.8 6,307 18.2 3,967 13.1 5,029 16.7 4,038 13.5Teton 7,481 30.9 8,471 33.5 8,812 34.4 7,076 30.9 7,342 33.5 6,895 30.5Uinta 2,332 18.5 2,248 17.4 2,562 18.9 1,425 12.3 1,965 17.0 2,110 18.9Washakie 354 7.5 443 9.1 543 10.7 435 9.0 506 10.3 339 7.6Weston 1,767 35.0 2,353 40.6 2,072 37.7 2,070 38.3 2,140 41.3 248 9.2Nonresident, Unknown County
2,223 3.9 3,639 5.4 3,212 4.6 2,582 4.6 4,242 6.6 15,462 24.6

© WYOMING LABOR FORCE TRENDSWyoming Department of Workforce Services Research & Planning
http://doe.state.wy.us/LMIPage 16 September 2012
shift towards self-insurance prior to the change, resulting in risk separation and adverse selection against the small group market. The state should be cognizant of efforts to employ the use of loopholes to circumvent consumer protections and monitor movement into the self-insurance market; or alternatively explore proactively defining small business as up to 100 employees to align with the Federal definition prior to 2016. This will broaden the risk pool and protect against adverse selection in the small group market.
Employers with More than 100 Workers
Similar to the small employer group, businesses with more than 100 workers will face two choices: continue or start to offer employer-sponsored health insurance coverage, or pay a penalty to help cover the cost of their employees’ individual coverage paid in part or whole by federal subsidies.
In 2011, it was estimated that 90.6% of employers with more than 100 workers offered health insurance. This size of employer will likely remain stable and continue to offer health benefits. The current market allows businesses to enter and exit the employer sponsored health insurance market without penalty. Therefore, it is counter-intuitive to expect that a large number of employers of this size will choose to pay penalties that offer no tax incentive or direct benefit to their employees. Health benefits are still viewed as highly attractive to job seekers and often are a driving factor in employee retention. Rather, employers currently offering benefits may explore cost containment strategies and ways to encourage employees to become healthier through the implementation of health
promotion and wellness program efforts.
No consensus has been reached on how likely firms are to drop coverage, but based on literature related to the Massachusetts health reform initiative, a mass exodus from the health care market by employers seems unlikely. Speculative estimates have ranged from 1% to 10% of employers anticipating they will drop employer-sponsored health insurance. Because of a lack of consistent information, projections based on Wyoming employers will not be made.
Workforce
Because most employers in Wyoming will not be required under the PPACA to offer health insurance to employees, the burden to acquire coverage will be placed on the workforce. Data regarding low-income workers indicate men and women age 20-24 will most benefit from the PPACA by having the ability to obtain coverage through an expanded Medicaid program or through their parent’s health insurance.
A review of 2011 wage earnings in Wyoming by age and industry reveals average annual wages for those age 25 to 64 to be well above 138% of the FPL of $10,890 ($10,890 * 138% = $15,028). The only group consistently near or below the 138% FPL threshold are women age 20-24. Kaiser State Health facts (2010) estimates 8% of Wyoming residents between the ages of 19 and 64 could become Medicaid eligible due to low income between 100% and 138% FPL. Tables 6 and 7 show that of 291,656 resident workers of all age groups (134,147 women, 157,509 men), there were 22,595 employees (14,562 women, 8,033 men) age 20-27 in various

© WYOMING LABOR FORCE TRENDS
Page 17http://doe.state.wy.us/LMISeptember 2012
Wyoming Department of Workforce ServicesResearch & Planning
industries who were near or below the 138% FPL threshold (see Table 7). That number accounts for 7.7% of the workforce who would be income eligible under an expanded Medicaid program. However, that figure may be inflated because many 20- to 24-year-olds qualify for dependent coverage on their parent’s health insurance. Further, some who are included in the 22,595 number will earn wages above the mean income listed disqualifying them from eligibility. However, many workers in other industries earn below-average wages for their industry of employment, possibly making them Medicaid eligible. Hence, the monetary impact of expansion may not be as severe as predicted and could even yield positive results. A recent study in the New England Journal of Medicine (Sommers, Baicker, Epstein, 2012) conceded that the effects of Medicaid on adults’ health remains unclear, however the authors were able to show a decrease in mortality in states that had expanded their Medicaid program compared to states that had not. More specifically, Medicaid expansions were associated with significant reductions in adjusted all-cause mortality (by 19.6 deaths per 100,000 adults, for a relative reduction of 6.1%). Expansions increased Medicaid coverage, decreased rates of uninsured, decreased rates of delayed care because of costs, and increased rates of self-reported health status of “excellent” or “very good.”
Another key factor is age. Wyoming’s population is aging faster than the rest of the nation. In almost two decades, the state has seen dramatic decreases in those age 44 and younger and growth in residents 45 and older. This has important implications for Wyoming because Section 1201 of the PPACA allows insurers, including those in the individual and
small group market, to vary rates based on family composition, geographic area, tobacco use, and age. This may directly cause higher premiums for older workers due to the age rating, and may also have an indirect impact because there will be fewer younger and healthier individuals to distribute the risk.
Lastly, the proportion of nonresident workers in the state has seen rapid growth and could present several challenges to health care delivery in the state. The primary reason for individual mandated coverage was to reduce costs across the entire population by broadening the risk pool by increasing the number of insured. However, those employed in industry sectors that have traditionally high rates of un-insured may be slow to obtain coverage. Nonresident, uninsured workers could drive up the cost of care received in Wyoming’s hospitals and health care facilities.
Research, Propositions, and Hypothesis
Provisions of the PPACA will have substantial effects on Wyoming employers, workers, health care facilities, the state health department, and other state agencies and governing bodies. This analysis creates insight into further inquiry for planning and implementation purposes. R&P offers a wealth of information to inform data-driven solutions for PPACA implementation tailored to Wyoming’s needs and unique challenges as a rural/frontier state. Emerging research questions, suggestions, and hypotheses for planning purposes may examine Medicaid expansion and state health exchanges, addressing

© WYOMING LABOR FORCE TRENDSWyoming Department of Workforce Services Research & Planning
http://doe.state.wy.us/LMIPage 18 September 2012
workforce and employer needs, and surveillance efforts.
Medicaid Expansion and State Health Insurance Exchange
Further study should, in depth and scope, compare the percentage of workers who are unlikely to receive benefits from their employer by industry, firm size, gender, and wages. This information has tangible consequences for joint state/federal administered programs, and could be used to drive public-private partnerships to help cover more resident workers in the small group market. Other suggestions include:
● Examine the feasibility of creating a statewide basic health program to reduce churn between Medicaid and exchanges (Hwang, Rosenbaum, Sommers, 2012) due to Wyoming’s notable percentage of positions that are low-income earning, in small firms, with high turnover and short tenure that are occupied by nonresidents, youth, and women. In 2005 R&P, in conjunction with the Wyoming Health Care Commission, published an extensive study (Gallagher, Harris, Hiatt, Leonard, Saulcy, & Shinkle) titled “Private Sector Employee Access to Health Insurance and the Potential Wyo-Care Market.” Although somewhat dated, this work is relevant to many of the key policy questions surrounding the creation of a state health insurance exchange and state health program efforts but should be updated.
● Wyoming, like other rural states, may have issues adequately populating a state health exchange. Opportunities to collaborate with other states or gain policy flexibility could be examined.
Alternatively, the state could explore ways to provide value-based coverage through an exchange that would enhance administrative efficiencies, and also explore high-value based plans that are affordable (Kingsdale, 2012).
● Conduct comprehensive analyses and modeling exercises to better understand the effects of merging the individual and small group markets and proactively expanding the definition of small business to 1 to 100 employees.
● Rating enrollees based on health status is not allowable under the PPACA. However, consumers, especially in Wyoming, given its small population and poor health status in some counties like Fremont and Carbon (http://www.countyhealthrankings.org/#app/), may experience higher-than-expected premiums, as a result of insurer risk segmentation. State regulators must ensure that the allowable geographic rating is not used as a proxy for health status. This could be addressed by passing more protective rating restrictions than those found at the federal level.
Addressing Workforce and Employer Needs
Conducting analysis and addressing the impact of nonresident workers on health care facilities and resources is an issue that should be investigated. Close to one-fifth of the state’s workforce is supplied by nonresidents. Wyoming should engage in planning regarding the impact and the development of solutions to

© WYOMING LABOR FORCE TRENDS
Page 19http://doe.state.wy.us/LMISeptember 2012
Wyoming Department of Workforce ServicesResearch & Planning
address the prospect of non-compliant uninsured nonresident workers and the out-migration of covered individuals to surrounding states on Wyoming health care facilities. Data collection and analysis efforts should address:
● Industries that utilize nonresident workers that have traditionally high uninsured rates, with less than 50 employees (i.e. construction). R&P has annual information by industry showing which sectors employ the most nonresident workers.
● Industries (i.e. leisure & hospitality) and counties (Teton and Park) that employ temporary and or foreign workers in the U.S. on work visas.
Surveillance
There are numerous loopholes and ways to manipulate the law to “game” the system for advantages. Identification of legal ambiguity, active monitoring, and appropriate policy solutions should be enacted to curb practices like SUTA dumping and shifts towards self-insurance. R&P can monitor changes in unemployment insurance accounts.
Sarah Trimmer was a research intern at R&P for summer 2012. She is a master of public health candidate at Georgia State University.
References
Buchmueller, T. C., DiNardo, J., & Valetta, R. G. (2011). “The effect of an employer health insurance mandate on health insurance coverage and the demand for labor: Evidence from Hawaii.” American Economic
Journal-Economic Policy 3(4): 25-51.
California Development Department. (N.D.). SUTA dumping and unemployment insurance rate manipulation. Retrieved from: http://www.edd.ca.gov/payroll_taxes/SUTA_Dumping.htm
Cutler, D. M. & Madrian, B. C. (1998). “Labor market responses to rising health insurance costs: Evidence on hours worked.” Rand Journal of Economics 29(3): 509-530.
Earnings in Wyoming, 1992-2011 by County, Industry, Age, & Gender. (2012). Wyoming Department of Workforce Services, Research & Planning. Average earnings by age and gender in all counties in 2011. Retrieved from http://doe.state.wy.us/LMI/earnings_tables/2012/WR_Demographics2011/County/by_county476.html
Gabel, J. R., & Whitmore, H. (2008). “Report from Massachusetts: Employers largely support health care reform, and few signs of crowd-out appear.” Health Affairs 27(1): W13-W23.
Gallagher, T., Harris, M., Hiatt, M., Leonard, D., Saulcy, S., & Shinkle, K. (2005). Private sector employee access to health insurance and the potential Wyo-Care market. Wyoming Department of Employment, Research & Planning. Retrieved from http://doe.state.wy.us/LMI/HCCFinal.htm
Hall, M. A., & Swartz, K. (2012). Establishing health insurance exchanges: Three states’ progress. Washington, D.C., The Commonwealth Fund.
Health and Human Services Poverty Guidelines. (2011). Retrieved from: http://aspe.hhs.gov/poverty/11poverty.shtml

© WYOMING LABOR FORCE TRENDSWyoming Department of Workforce Services Research & Planning
http://doe.state.wy.us/LMIPage 20 September 2012
H.R. 3590—111th Congress: Patient Protection and Affordable Care Act. (2009). In GovTrack.us (database of federal legislation). Retrieved September 18, 2012, from http://www.govtrack.us/congress/bills/111/hr3590
Hwang, A., Rosenbaum, S., & Sommers, B. D. (2012). Creation of state basic health programs would lead to 4 percent fewer people churning between Medicaid and exchanges. Health Affairs 31(6): 1314-1320.
Internal Revenue Service. (2010). Internal Revenue Service Bulletin 2010-22. Retrieved November 23, 2012, from http://www.irs.gov/irb/2010-22_IRB/ar12.html
Kaiser Family Foundation. (2010). State Health Facts. Retrieved from: http://www.statehealthfacts.org/comparetable.jsp?typ=1&ind=130&cat=3&sub=39#
Kingsdale, J. (2012). “How small-business health exchanges can offer value to their future customers – and why they must.” Health Affairs 31(2): 275-283.
Krueger, K., & Alexander, A. (2011). Microsimulated Impacts of the Patient Protection and Affordable Care Act on Wyoming. [White Paper].
Leonard, D. W., & Saulcy, S. (2012). Wyoming Benefits Survey, 2011. In M. Moore & P. Ellsworth (Eds.). Casper, WY: Wyoming Department of Workforce Services, Research & Planning. Retrieved September 19, 2012, from http://doe.state.wy.us/LMI/benefits2011/benefits_2011.pdf
Long, S. K., Stockley, K., & Dahlen H. (2012). Massachusetts health reforms: Uninsurance remains low, Self-Reported health status improves as state prepares to tackle costs. Health Affairs 31(2): 444-451.
Moore, M., & Glover, T. (2012). A decade later: Tracking Wyoming’s youth in to the labor force. In D. Bullard, V. A. Davis, P. Ellsworth, & M. Moore (Eds.). Casper, WY: Wyoming Department of Workforce Services. Retrieved September 19, 2012, from http://doe.state.wy.us/LMI/w_r_research/A_Decade_Later.pdf
Sentell, T. (2012). Implications for reform: Survey of California adults suggest low health literacy predicts likelihood of being uninsured. Health Affairs 31(5): 1039-1048.
Sinaiko, A. D. (2004). Employers’ responses to a play-or-pay mandate: An analysis of California’s Health Insurance Act of 2003. Health Affairs 23(6): W4469-W4479.
Sommers, B. D., Baicker, K., & Epstein, A. M. (2012). Mortality and access to care among adults after state Medicaid expansions. New England Journal of Medicine. On-line special article.
U.S. Census Bureau. Current Population Survey, 2008 to 2010. Annual social and economic supplements. Three-year-average median household income by state: 2008-2010 and two-year-average median household income by state: 2009 to 2010. Retrieved from http://www.census.gov/hhes/www/income/data/statemedian/index.html
U.S. Department of Health and Human Services. (2012, February 2). In The 2011 HHS poverty guidelines: One version of the [U.S.] federal poverty measure. Retrieved September 19, 2012, from http://aspe.hhs.gov/poverty/11poverty.shtml
Research & PlanningWyoming DWS

© WYOMING LABOR FORCE TRENDS
Page 21http://doe.state.wy.us/LMISeptember 2012
Wyoming Department of Workforce ServicesResearch & Planning
Even as Wyoming added nearly 5,000 jobs from 2010 to
2011, the total number of jobs with access to key benefits remained relatively flat or continued to decline, according to the Wyoming Benefits Survey 2012.
From 2008 to 2010, the total number of jobs in Wyoming declined from an estimated 273,720 to 258,356. As this happened, the number of jobs offered access to health insurance remained flat, while the number of jobs offered access to a retirement plan continued to decline (see Figure).
In 2008, before Wyoming entered into an economic downturn, 174,522 jobs were offered access to health insurance, which was 63.8% of total employment. In 2011, 160,064 jobs were offered access to health insurance, which was 60.8% of total employment.
In 2011, the Research & Planning (R&P) section of the Wyoming Department of Workforce Services mailed benefits survey questionnaires to 2,729 randomly selected Wyoming employers found in the Quarterly Census of Employment and Wages (QCEW). Data
for the QCEW come from Unemployment Insurance-covered employment records. Approximately 98% of employment is covered by Unemployment Insurance in the U.S., making it a near-census of employment in the states (U.S. Department of Labor, Bureau of Labor Statistics, n.d.). Among the types of firms excluded are railroads and some agricultural operations.
In contrast, the Current Employment Statistics (CES) program produces estimates of nonfarm payroll employment, including some employee groups that are excluded from QCEW. These groups include employees of railroads, churches, small nonprofit organizations, elected officials, and work-study students at colleges and universities.
The Wyoming Benefits Survey 2012 contains information on which jobs have access to these benefits and what types of employers offer health insurance, retirement, and many other benefits based on industry, employer size-class, and full- or part-time work status. This publication will be available online at http://doe.state.wy.us/LMI/benefits.htm.
Wyoming Benefits Survey 2012 Available Soonhttp://doe.state.wy.us/LMI/benefits.htm
150,000
200,000
250,000
300,000
Retirement Plan
Dependent Health Insurance
Health Insurance
Total Number of Jobs
2011201020092008
273,720267,859
258,356263,254
Figure: Total Number of Jobs in Wyoming and Number of Jobs Offered Selected Benefits, 2008 to 2011

© WYOMING LABOR FORCE TRENDSWyoming Department of Workforce Services Research & Planning
http://doe.state.wy.us/LMIPage 22 September 2012
The Research & Planning section of the Wyoming Department of Workforce Services has reported that the
number of occupational fatalities fell from 33 in 2010 to 29 in 2011, a decrease of four deaths (-12.1%). There were 34 occupational fatalities each year on average from 1992 to 2011, and 2011 marks the fourth consecutive year that workplace deaths have been lower than average (see Figure 1).
Variations in fatalities from year to year are to some extent the result of the random nature of work-related accidents.
Additionally, there is not always a direct relationship between workplace fatalities and workplace safety. For example, suicides and homicides that occur in the workplace are included as occupational fatalities. In other cases, a sudden illness may be nearly coincidental with an accident that results in a workplace fatality. Occupational fatalities are counted in the state where the injury occurred, not necessarily the state of residence or the state of death.
In 2011, the largest number of deaths occurred in trade, transportation, & utilities
Wyoming Occupational Fatalities Decrease in 2011 by: David Bullard, Senior Economist
0
10
20
30
40
50
2011
2010
2009
2008
2007
2006
2005
2004
2003
2002
2001
2000
1999
1998
1997
1996
1995
1994
1993
1992
26
36 3532
28 29
33 32
36
40
33
37
43
46
36
48
33
19
33
Num
ber o
f Fat
alit
ies
Source: U.S. Department of Labor, Bureau of Labor Statistics, Census of Fatal Occupational Injuries, in cooperation with state and federal agencies.
29
Figure 1: Wyoming Occupational Fatalities, 1992-2011

© WYOMING LABOR FORCE TRENDS
Page 23http://doe.state.wy.us/LMISeptember 2012
Wyoming Department of Workforce ServicesResearch & Planning
(11, or 37.9% of all deaths; see Table 1). There were nine deaths (31.0%) in natural resources & mining and nine deaths (31.0%) in all other industries. Nearly six out of 10 (58.6%) workplace fatalities were the result of transportation incidents.
Each year from 2003 to 2011, transportation incidents made up more than half of all workplace deaths (see Figure 2). Transportation incidents include highway crashes as well as incidents involving aircraft and other vehicles.
Table 1: Wyoming Occupational Fatalities by Selected Industry and Event, 2011
TotalTransportation
Accidentsa
Industry N Column % N Row %Natural Resources & Mining 9 31.0 4 44.4Trade, Transp., & Utilities 11 37.9 10 90.9
Transp. & Warehousing 9 31.0 9 100.0All Other Industries 9 31.0 3 33.3Total 29 100.0 17 58.6aTransportation incidents involve transportation vehicles, powered industrial vehicles or powered mobile industrial equipment in which at least one vehicle (or mobile equipment) is in normal operation and the injury/illness was due to collision or other type of traffic accident regardless of the location where the event occurred. Examples of vehicles included are automobiles, airplanes, trucks, forklifts, all-terrain vehicles (ATVs), and animals used for transportation purposes.Note: Data for 2011 are preliminary.Source: U.S. Department of Labor, Bureau of Labor Statistics, in cooperation with State and Federal Agencies, Census of Fatal Occupational Injuries.
0
10
20
30
40
50
Transportation Incidents
Occupational Fatalities
201120102009200820072006200520042003
26
37
26
43
28
46
25
32
36
40
23
48
3433
1719
11
33
18
Num
ber o
f Fat
alit
ies
Source: U.S. Department of Labor, Bureau of Labor Statistics, Census of Fatal Occupational Injuries, in cooperation with state and federal agencies.
29
17
Figure 2: Wyoming Occupational Fatalities and Transportation Incidents, 2003 to 2011

© WYOMING LABOR FORCE TRENDSWyoming Department of Workforce Services Research & Planning
http://doe.state.wy.us/LMIPage 24 September 2012
The Research & Planning (R&P) section of the Wyoming Department of Workforce Services released fatality
counts for 2011 from the Census of Fatal Occupational Injuries (CFOI) in September 2012. However, many members of the public are more interested in fatality rates in order to rank states, and not in the actual fatality counts.
Fatality rates for 2011 will not be available from the U.S. Bureau of Labor Statistics (BLS) for some time. In the past, as much as two years has elapsed between the count release and the state rankings on workplace death. For example, on Sept. 10, 2010, the BLS released the 2008 fatality rates by state, almost two years after the end of the reference period (see Table 1,
Table 1: 2008 Census of Fatal Occupational Injuries Fatal Work Injury Rates by State
Research & Planning
Calculations
U.S. Bureau of Labor Statistics
Calculations
State
Annual CES Employment
(in Thousands)
CPS Hours
Worked FatalitiesFatality
Rate RankFatality
Rate RankRate Diff.
Rank Diff.
Wyoming 298.2 601.6 33 11.0 1 12.4 1 -1.4 0Alaska 322.1 649.9 33 10.2 2 10.6 2 -0.4 0North Dakota 367.3 741.1 28 7.6 4 8.3 3 -0.7 1Montana 445.8 899.4 40 8.9 3 8.2 4 0.7 -1Louisiana 1,937.5 3,909.1 135 6.9 7 7.3 5 -0.4 2West Virginia 762.0 1,537.4 53 6.9 7 7.2 6 -0.3 1South Dakota 411.4 830.0 30 7.2 5 6.9 7 0.3 -2Arkansas 1,202.5 2,426.2 85 7.0 6 6.8 8 0.2 -2Oklahoma 1,592.7 3,213.4 102 6.3 10 6.4 9 -0.1 1Mississippi 1,147.5 2,315.2 80 6.9 7 6.3 10 0.6 -3Iowa 1,524.4 3,075.6 93 6.0 11 5.9 11 0.1 0Kentucky 1,851.7 3,736.0 106 5.7 12 5.9 11 -0.2 1Nebraska 965.0 1,947.0 53 5.4 14 5.7 13 -0.3 1Missouri 2,789.1 5,627.3 148 5.3 15 5.4 14 -0.1 1Alabama 1,992.1 4,019.3 107 5.3 15 5.3 15 0.0 0Kansas 1,390.6 2,805.7 73 5.2 17 5.3 15 -0.1 2Idaho 648.8 1,309.0 36 5.5 13 5.1 17 0.4 -4Tennessee 2,774.8 5,598.4 135 4.8 19 5.1 17 -0.3 2Utah 1,252.5 2,527.0 64 5.1 18 5.1 17 0.0 1Indiana 2,956.7 5,965.4 143 4.8 19 5.0 20 -0.2 -1South Carolina 1,926.3 3,886.5 87 4.5 21 4.5 21 0.0 0Texas 10,607.0 21,400.7 463 4.3 24 4.4 22 -0.1 2Colorado 2,350.3 4,742.0 105 4.4 22 4.2 23 0.2 -1Georgia 4,102.2 8,276.6 182 4.4 22 4.2 23 0.2 -1Pennsylvania 5,799.4 11,700.9 241 4.1 25 4.1 25 0.0 0Virginia 3,762.9 7,592.0 156 4.1 25 4.1 25 0.0 0Maine 617.2 1,245.3 24 3.9 27 3.9 27 0.0 0
2008 CFOI Fatality Rates: Accuracy vs. Timeliness by: Carola Cowan, BLS Programs Supervisor
Table continued on page 25

© WYOMING LABOR FORCE TRENDS
Page 25http://doe.state.wy.us/LMISeptember 2012
Wyoming Department of Workforce ServicesResearch & Planning
pages 24 and 25). The release of these data was delayed while the BLS obtained data on employment and hours worked from the U.S. Census Bureau. These numbers are needed to develop the denominator to calculate the fatality rate.
During this time, R&P received several inquiries on Wyoming’s fatality rate and how it compared to fatality rates from other states. In order to better accommodate customers and meet their requests, R&P calculated fatality rates
using data available from the Current Employment Statistics (CES) and the Current Population Statistics (CPS) programs. The CES produces employment numbers for each state and the CPS publishes average hours worked for the nation.
The purpose of this project was to see how closely R&P’s fatality state rankings resembled those published by the BLS, and if the ranks by state were equivalent, even if the rates were slightly off.
Table 1: 2008 Census of Fatal Occupational Injuries Fatal Work Injury Rates by State
Research & Planning
Calculations
U.S. Bureau of Labor Statistics
Calculations
State
Annual CES Employment
(in Thousands)
CPS Hours
Worked FatalitiesFatality
Rate RankFatality
Rate RankRate Diff.
Rank Diff.
North Carolina 4,135.1 8,343.0 161 3.9 27 3.9 27 0.0 0Florida 7,735.7 15,607.5 291 3.7 30 3.5 29 0.2 1New Mexico 846.8 1,708.5 31 3.6 31 3.5 29 0.1 2Arizona 2,616.3 5,278.6 100 3.8 29 3.4 31 0.4 -2Illinois 5,949.7 12,004.1 193 3.2 32 3.3 32 -0.1 0Nevada 1,263.6 2,549.4 41 3.2 32 3.3 32 -0.1 0Ohio 5,362.4 10,819.2 168 3.1 36 3.2 34 -0.1 2Vermont 307.2 619.8 10 3.2 32 3.2 34 0.0 -2District of Columbia 703.9 1,420.2 9 1.3 49 3.1 36 -1.8 13Oregon 1,718.4 3,467.0 55 3.2 32 3.1 36 0.1 -4California 14,981.4 30,226.5 465 3.1 36 2.8 38 0.3 -2Michigan 4,161.7 8,396.6 123 2.9 39 2.8 38 0.1 1Wisconsin 2,878.1 5,806.9 77 2.7 41 2.7 40 0.0 1Washington 2,958.9 5,969.9 84 2.8 40 2.6 41 0.2 -1Minnesota 2,763.0 5,574.6 65 2.3 44 2.5 42 -0.2 2Hawaii 619.2 1,249.3 19 3.0 38 2.4 43 0.6 -5New York 8,792.8 17,740.4 213 2.4 43 2.4 43 0.0 0Delaware 436.1 879.9 11 2.5 42 2.3 45 0.2 -3New Jersey 4,048.4 8,168.1 92 2.3 44 2.3 45 0.0 -1Maryland 2,600.0 5,245.8 60 2.3 44 2.2 47 0.1 -3Massachusetts 3,290.0 6,637.9 68 2.0 47 2.2 47 -0.2 0Connecticut 1,699.0 3,427.9 28 1.6 48 1.6 49 0.0 -1Rhode Island 481.9 972.3 6 1.2 50 1.2 50 0.0 0New Hampshire 646.1 1,303.6 7 1.1 51 1.1 51 0.0 0
(Table continued from page 24)

© WYOMING LABOR FORCE TRENDSWyoming Department of Workforce Services Research & Planning
http://doe.state.wy.us/LMIPage 26 September 2012
Methodology
For the reference years 1992 through 2007, the BLS published CFOI fatal injury rates on an employment basis (U.S. BLS, 2010). The risk of fatal injury was measured regardless of hours worked. In 2008, the BLS changed the denominator to average hours worked for all employees rather than employment alone. This is a more accurate measurement because it takes into consideration exposure to potential life-threatening hazards. In addition to reference year 2008, the BLS also recalculated fatality rates for 2007 to the hours-based rate. Since the denominator is substantially different from the prior method, hours-based state fatality rates should not be compared to the employment-based rates from prior years (U.S. BLS, 2010).
For both the employment-based model and the hours-based model, the BLS obtained data from the CPS. The scope of the CPS differs from CFOI in both models. For example, the CPS does not count workers under the age of 16, military workers and volunteers, whereas these are included in CFOI counts. Because of this, the BLS adjusted CFOI fatal injury counts used in calculating rates to maintain consistency between the numerator (number of fatal injuries) and the denominator (annual average employment and/or average hours worked). Workers under the age of 16 were previously excluded from the employment-based model. They are also excluded from the hours-based model, along with military and volunteers, since reliable hours-worked data cannot be obtained.
Rates for all 50 states were calculated
using CES and CPS data because CPS data is not available by state; these calculations were not adjusted for workers under the age of 16. Military and volunteers are not included in the CES numbers. Nationwide CPS data were used for average hours worked. R&P then multiplied the average hours worked per week by 52 weeks to annualize the data and multiplied that by the annual average CES employment for each state. To calculate the fatality rate, R&P divided the hours worked for each state by the number of fatalities in each state and multiplied that number by 200,000,000 (base for 100,000 equivalent full-time workers working 40 hours per week, 50 weeks per year). Fatality rates are calculated per 100,000 full-time workers. This is the same method used by the BLS to calculate hours-based rates (Northwood, 2010).
Results
R&P’s method for calculating the 2008 fatality rates resulted in some differences from the fatality rates calculated by the BLS (see Table 1). The differences in the fatality rates ranged from 0.0 to 1.8. There was no difference in 14 states, 12 states had a difference of .1, and 10 states had a difference of .2 in their fatality rates. Two states had differences of more than 1.0.
Ranking the states by fatalities resulted in similar results (see Table 1). Fifteen states had no difference in their ranking, 17 states were off by one, and 12 were off by two places in the ranking. Seven states were off by more than two, with one state being an extreme outlier that was off by 13 places.
Comparing fatality rates between states is not recommended due to the different
© WYOMING LABOR FORCE TRENDS
Page 27http://doe.state.wy.us/LMISeptember 2012
Wyoming Department of Workforce ServicesResearch & Planning
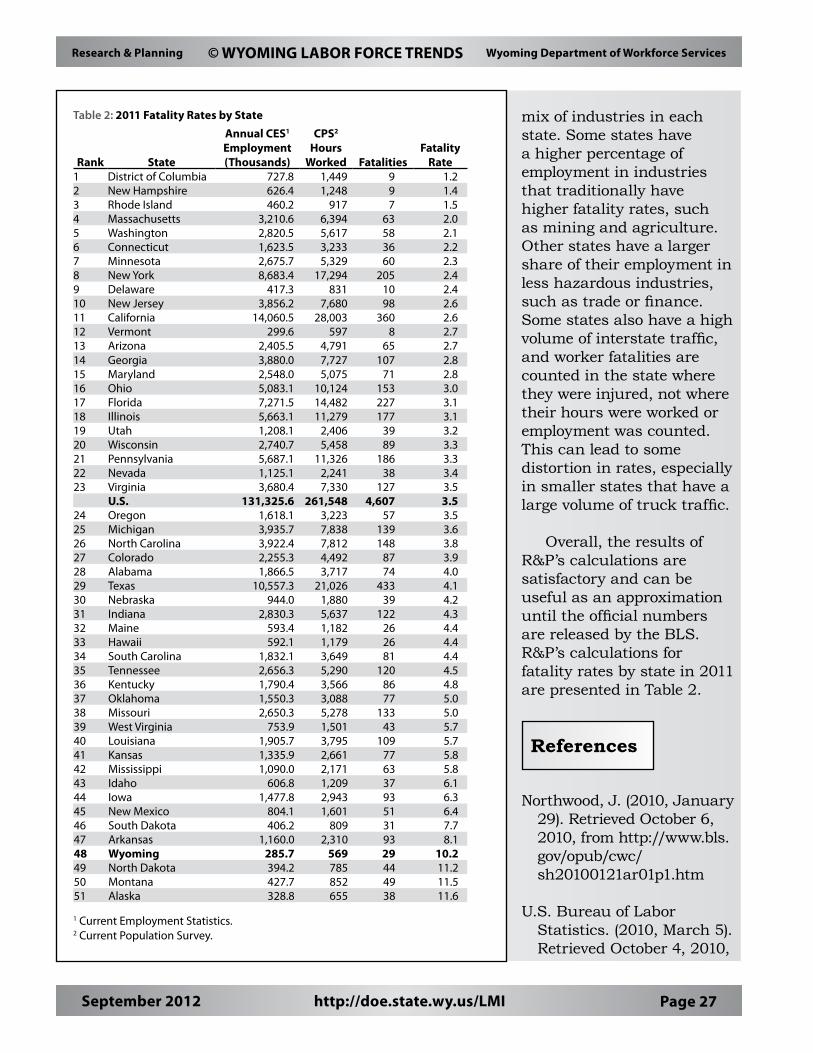
mix of industries in each state. Some states have a higher percentage of employment in industries that traditionally have higher fatality rates, such as mining and agriculture. Other states have a larger share of their employment in less hazardous industries, such as trade or finance. Some states also have a high volume of interstate traffic, and worker fatalities are counted in the state where they were injured, not where their hours were worked or employment was counted. This can lead to some distortion in rates, especially in smaller states that have a large volume of truck traffic.
Overall, the results of R&P’s calculations are satisfactory and can be useful as an approximation until the official numbers are released by the BLS. R&P’s calculations for fatality rates by state in 2011 are presented in Table 2.
References
Northwood, J. (2010, January 29). Retrieved October 6, 2010, from http://www.bls.gov/opub/cwc/sh20100121ar01p1.htm
U.S. Bureau of Labor Statistics. (2010, March 5). Retrieved October 4, 2010,
Table 2: 2011 Fatality Rates by State
Rank State
Annual CES1 Employment (Thousands)
CPS2 Hours
Worked FatalitiesFatality
Rate1 District of Columbia 727.8 1,449 9 1.22 New Hampshire 626.4 1,248 9 1.43 Rhode Island 460.2 917 7 1.54 Massachusetts 3,210.6 6,394 63 2.05 Washington 2,820.5 5,617 58 2.16 Connecticut 1,623.5 3,233 36 2.27 Minnesota 2,675.7 5,329 60 2.38 New York 8,683.4 17,294 205 2.49 Delaware 417.3 831 10 2.410 New Jersey 3,856.2 7,680 98 2.611 California 14,060.5 28,003 360 2.612 Vermont 299.6 597 8 2.713 Arizona 2,405.5 4,791 65 2.714 Georgia 3,880.0 7,727 107 2.815 Maryland 2,548.0 5,075 71 2.816 Ohio 5,083.1 10,124 153 3.017 Florida 7,271.5 14,482 227 3.118 Illinois 5,663.1 11,279 177 3.119 Utah 1,208.1 2,406 39 3.220 Wisconsin 2,740.7 5,458 89 3.321 Pennsylvania 5,687.1 11,326 186 3.322 Nevada 1,125.1 2,241 38 3.423 Virginia 3,680.4 7,330 127 3.5
U.S. 131,325.6 261,548 4,607 3.524 Oregon 1,618.1 3,223 57 3.525 Michigan 3,935.7 7,838 139 3.626 North Carolina 3,922.4 7,812 148 3.827 Colorado 2,255.3 4,492 87 3.928 Alabama 1,866.5 3,717 74 4.029 Texas 10,557.3 21,026 433 4.130 Nebraska 944.0 1,880 39 4.231 Indiana 2,830.3 5,637 122 4.332 Maine 593.4 1,182 26 4.433 Hawaii 592.1 1,179 26 4.434 South Carolina 1,832.1 3,649 81 4.435 Tennessee 2,656.3 5,290 120 4.536 Kentucky 1,790.4 3,566 86 4.837 Oklahoma 1,550.3 3,088 77 5.038 Missouri 2,650.3 5,278 133 5.039 West Virginia 753.9 1,501 43 5.740 Louisiana 1,905.7 3,795 109 5.741 Kansas 1,335.9 2,661 77 5.842 Mississippi 1,090.0 2,171 63 5.843 Idaho 606.8 1,209 37 6.144 Iowa 1,477.8 2,943 93 6.345 New Mexico 804.1 1,601 51 6.446 South Dakota 406.2 809 31 7.747 Arkansas 1,160.0 2,310 93 8.148 Wyoming 285.7 569 29 10.249 North Dakota 394.2 785 44 11.250 Montana 427.7 852 49 11.551 Alaska 328.8 655 38 11.6
1 Current Employment Statistics.2 Current Population Survey.

© WYOMING LABOR FORCE TRENDSWyoming Department of Workforce Services Research & Planning
http://doe.state.wy.us/LMIPage 28 September 2012
From 2010 to 2011, the number of fatal occupational
injuries decreased in 26 states, increased in 23 states, and remained the same in two states (see Table).
During this period, the number of fatalities decreased in Wyoming (-4, or -12.1%) and three surrounding states: Nebraska (-15, or -27.8%), South Dakota (-5, or -13.9%), and Utah (-2, or -4.9%). The number of fatalities increased in four surrounding states: Colorado (2, or 2.4%), Idaho (4, or 12.1%), Montana (13, or 36.1%), and North Dakota (14, or 46.7%).
The most significant decreases were seen in West Virginia (-52, or -54.7%) and Washington (-46, -44.2%).
The number of fatalities in Texas declined from 461 in 2010 to 433 in 2011, but that state still had the highest number of fatalities for both years.
Table: Fatal Occupational Injuries by State, 2010-2011
Total Fatal Injuries1 Change2011(p)3 2010(r)2 N %
Alabama 74 92 -18 -19.6Alaska 38 39 -1 -2.6Arizona 65 77 -12 -15.6Arkansas 93 88 5 5.7California 360 326 34 10.4Colorado 87 85 2 2.4Connecticut 36 49 -13 -26.5Delaware 10 8 2 25.0District of Columbia 9 16 -7 -43.8Florida 227 225 2 0.9Georgia 107 108 -1 -0.9Hawaii 26 19 7 36.8Idaho 37 33 4 12.1Illinois 177 206 -29 -14.1Indiana 122 118 4 3.4Iowa 93 77 16 20.8Kansas 77 85 -8 -9.4Kentucky 86 69 17 24.6Louisiana 109 111 -2 -1.8Maine 26 20 6 30.0Maryland 71 71 0 0.0Massachusetts 63 54 9 16.7Michigan 139 146 -7 -4.8Minnesota 60 70 -10 -14.3Mississippi 63 68 -5 -7.4Missouri 133 106 27 25.5Montana 49 36 13 36.1Nebraska 39 54 -15 -27.8Nevada 38 38 0 0.0New Hampshire 9 6 3 50.0New Jersey 98 81 17 21.0New Mexico 51 38 13 34.2New York 205 182 23 12.6North Carolina 148 139 9 6.5North Dakota 44 30 14 46.7Ohio 153 161 -8 -5.0Oklahoma 77 94 -17 -18.1Oregon 57 47 10 21.3Pennsylvania 186 221 -35 -15.8Rhode Island 7 9 -2 -22.2South Carolina 81 69 12 17.4South Dakota 31 36 -5 -13.9Tennessee 120 138 -18 -13.0Texas 433 461 -28 -6.1Utah 39 41 -2 -4.9Vermont 8 12 -4 -33.3Virginia 127 107 20 18.7Washington 58 104 -46 -44.2West Virginia 43 95 -52 -54.7Wisconsin 89 91 -2 -2.2Wyoming 29 33 -4 -12.11 State totals include other events and exposures, such as bodily reaction, in addition to those shown separately.2 Totals for 2010 are revised and final. Preliminary 2010 data issued August 25, 2011, reported a total of 4,547 fatal work injuries for calendar year 2010. Since then, an additional 143 job-related fatal injuries were identified, bringing the total job-related fatal injury count for 2010 to 4,690. Includes one fatal injury that occurred within the territorial boundaries of the United States, but a state of incident could not be determined.3 Includes two fatal injuries that occurred within the territorial boundaries of the United States, but a State of incident could not be determined.(p) Data for 2011 are preliminary. (r) Revised and final 2011 data are scheduled to be released in Spring 2013.Source: U.S. Department of Labor, Bureau of Labor Statistics, in cooperation with State, New York City, District of Columbia, and Federal agencies, Census of Fatal Occupational Injuries.
Fatal Occupational Injuries, 2010 and 2011

© WYOMING LABOR FORCE TRENDS
Page 29http://doe.state.wy.us/LMISeptember 2012
Wyoming Department of Workforce ServicesResearch & Planning
The Research & Planning section of the Wyoming Department of Workforce Services has reported that the state’s
seasonally adjusted1 unemployment rate increased from 5.4% in June to 5.6% in July (not a statistically significant change). July was the second month in a row that Wyoming’s jobless rate has increased. However, the state’s unemployment rate was somewhat lower than its July 2011 level (6.0%) and significantly lower than the current U.S. unemployment rate (8.3%). Seasonally adjusted employment of Wyoming residents fell by 1,728 individuals (-0.6%) from June to July.
From June to July, most county unemployment rates followed their normal seasonal pattern and decreased slightly. Employment tends to increase in July, with seasonal job gains in construction, professional & business services, leisure & hospitality, and other sectors. The largest decrease in unemployment occurred in Teton County, where the jobless rate fell from 5.1% in June to 4.1% in July. Jobless rates increased slightly in Big Horn (up from 6.5% to 6.7%), Fremont (up from 6.9% to 7.0%),
1 Seasonal adjustment is a statistical procedure to remove the impact of normal regularly recurring events (such as weather, major holidays, and the opening and closing of schools) from economic time series to better understand changes in economic conditions from month to month.
and Lincoln (up from 7.1% to 7.2%) counties.
The lowest jobless rates in July were found in Sublette (3.6%), Teton (4.1%), Hot Springs (4.3%), Converse (4.3%), and Campbell (4.3%) counties. Lincoln County posted the highest unemployment rate (7.2%). It was followed by Fremont (7.0%), Big Horn (6.7%), and Sheridan (6.2%) counties.
From July 2011 to July 2012, unemployment rates fell in 14 counties, increased in 6 counties, and were unchanged in 3 counties. Teton County reported the largest decrease, falling from 4.8% to 4.1%. Sizeable decreases were also seen in Hot Springs (down from 5.0% to 4.3%), Natrona (down from 5.6% to 5.0%), and Johnson (down from 6.2% to 5.6%) counties.
Total nonfarm employment in Wyoming (measured by place of work) fell from 294,700 in July 2011 to 293,900 in July 2012, a decrease of 800 jobs (-0.3%; not a statistically significant change).
Wyoming Jobless Rate Increases to 5.6% in July 2012 by: David Bullard, Senior Economist
4.0%
6.0%
8.0%
10.0%
4.0%
6.0%
8.0%
10.0%
US
WY
(p)JU
L12
(r)JU
N
MAYAP
R
MARFE
B
JAN
DEC
NOV
OCTSE
P
AUG
JUL1
1
JUN
MAYAP
R
MARFE
B
JAN
DEC
NOV
OCTSE
P
AUG
JUL1
0
(r) Revised.(p) Preliminary.
Seasonally Adjusted Unemployment Rate
Research & PlanningWyoming DWS

© WYOMING LABOR FORCE TRENDSWyoming Department of Workforce Services Research & Planning
http://doe.state.wy.us/LMIPage 30 September 2012
State Unemployment RatesJuly 2012
(Seasonally Adjusted)
Unemp.State RatePuerto Rico 13.7Nevada 12.0Rhode Island 10.8California 10.7New Jersey 9.8North Carolina 9.6South Carolina 9.6Georgia 9.3Mississippi 9.1New York 9.1Michigan 9.0District of Columbia 8.9Illinois 8.9Florida 8.8Oregon 8.7Connecticut 8.5Washington 8.5Tennessee 8.4Alabama 8.3Arizona 8.3Colorado 8.3Kentucky 8.3United States 8.3Indiana 8.2Pennsylvania 7.9Alaska 7.7Louisiana 7.6Maine 7.6Idaho 7.5West Virginia 7.4Arkansas 7.3Wisconsin 7.3Missouri 7.2Ohio 7.2Texas 7.2Maryland 7.0Delaware 6.8New Mexico 6.6Hawaii 6.4Montana 6.4Kansas 6.3Massachusetts 6.1Utah 6.0Virginia 5.9Minnesota 5.8Wyoming 5.6New Hampshire 5.4Iowa 5.3Vermont 5.0Oklahoma 4.9South Dakota 4.4Nebraska 4.0North Dakota 3.0
-7.0%
-6.0%-5.0%
-4.0%
-3.0%
-2.0%
-1.0%
0.0%
1.0%
2.0%
3.0%
4.0%
5.0%
6.0%
-7.0%
-6.0%-5.0%
-4.0%
-3.0%
-2.0%
-1.0%
0.0%
1.0%
2.0%
3.0%
4.0%
5.0%
6.0%
7/127/117/107/09
US WY
Nonagricultural Employment Growth (Percentage Change Over Previous Year)
2012
2008200920102011
270,000
280,000
290,000
300,000
310,000
DECNOVOCTSEPAUGJULJUNMAYAPRMARFEBJAN
Wyoming Nonagricultural Wage and Salary Employment
Industry Sector
Research & Planning’s Short-Term Projections
Current Employment
Statistics (CES) Estimates
N Difference
% Difference
Total Nonfarm Employment 296,486 293,900 -2,586 -0.9%Natural Resources & Mining 28,691 27,800 -891 -3.2%Construction 23,468 21,600 -1,868 -8.6%Manufacturing 9,489 9,000 -489 -5.4%Wholesale Trade 9,392 9,300 -92 -1.0%Retail Trade 30,600 30,700 100 0.3%Transportation & Utilities 14,962 14,000 -962 -6.9%Information 3,947 4,000 53 1.3%Financial Activities 10,791 10,700 -91 -0.9%Professional & Business Services 19,080 19,200 120 0.6%Educational & Health Services 26,815 27,600 785 2.8%Leisure & Hospitality 39,676 40,900 1,224 3.0%Other Services 12,166 11,800 -366 -3.1%Government 67,409 67,300 -109 -0.2%
Projections run in June 2012 and based on QCEW Data through March 2012.
Current Employment Statistics (CES) Estimates and Research & Planning’s Short-Term Projections, July 2012by: David Bullard, Senior Economist

© WYOMING LABOR FORCE TRENDS
Page 31http://doe.state.wy.us/LMISeptember 2012
Wyoming Department of Workforce ServicesResearch & Planning
State Unemployment RatesJuly 2012
(Not Seasonally Adjusted)
Unemp.State Rate
% Change
Employment in Thousands
Total EmploymentJun 12 Jul 11
Jul12
Jun12
Jul11
Jul12
Jul12
CAMPBELL COUNTY
TOTAL NONAG. WAGE & SALARY EMPLOYMENT 28.8 30.0 27.2 -4.0 5.9TOTAL PRIVATE 25.1 24.9 23.6 0.8 6.4GOODS PRODUCING 12.2 12.0 11.3 1.7 8.0
Natural Resources & Mining 9.0 8.9 8.3 1.1 8.4Construction 2.6 2.5 2.5 4.0 4.0Manufacturing 0.6 0.6 0.5 0.0 20.0
SERVICE PROVIDING 16.6 18.0 15.9 -7.8 4.4Trade, Transport., & Utilities 5.7 5.7 5.4 0.0 5.6Information 0.2 0.2 0.2 0.0 0.0Financial Activities 0.7 0.7 0.7 0.0 0.0Professional & Bus. Services 1.9 1.9 1.8 0.0 5.6Educational & Health Serv. 1.1 1.1 1.0 0.0 10.0Leisure & Hospitality 2.1 2.1 2.1 0.0 0.0Other Services 1.2 1.2 1.1 0.0 9.1
GOVERNMENT 3.7 5.1 3.6 -27.5 2.8
% Change
Employment in Thousands
Total EmploymentJun 12 Jul 11
Jul12
Jun12
Jul11
Jul12
Jul12
SWEETWATER COUNTYTOTAL NONAG. WAGE & SALARY EMPLOYMENT 25.7 26.3 25.1 -2.3 2.4TOTAL PRIVATE 21.5 21.2 20.9 1.4 2.9GOODS PRODUCING 9.5 9.4 9.3 1.1 2.2
Natural Resources & Mining 6.2 6.1 6.0 1.6 3.3Construction 1.8 1.8 1.9 0.0 -5.3Manufacturing 1.5 1.5 1.4 0.0 7.1
SERVICE PROVIDING 16.2 16.9 15.8 -4.1 2.5Trade, Transport., & Utilities 5.2 5.2 5.0 0.0 4.0Information 0.2 0.2 0.2 0.0 0.0Financial Activities 0.8 0.8 0.8 0.0 0.0Professional & Bus. Services 1.3 1.2 1.3 8.3 0.0Educational & Health Serv. 1.1 1.1 1.0 0.0 10.0Leisure & Hospitality 2.6 2.6 2.5 0.0 4.0Other Services 0.8 0.7 0.8 14.3 0.0
GOVERNMENT 4.2 5.1 4.2 -17.6 0.0
% Change
Employment in Thousands
Total EmploymentJun 12 Jul 11
Jul12
Jun12
Jul11
Jul12
Jul12
TETON COUNTYTOTAL NONAG. WAGE & SALARY EMPLOYMENT 20.9 20.1 20.6 4.0 1.5TOTAL PRIVATE 18.6 17.5 18.3 6.3 1.6GOODS PRODUCING 2.2 2.2 2.0 0.0 10.0
Nat. Res., Mining & Const. 2.0 2.0 1.8 0.0 11.1Manufacturing 0.2 0.2 0.2 0.0 0.0
SERVICE PROVIDING 18.7 17.9 18.6 4.5 0.5Trade, Transport., & Utilities 2.6 2.4 2.6 8.3 0.0Information 0.2 0.2 0.2 0.0 0.0Financial Activities 0.8 0.8 0.8 0.0 0.0Professional & Bus. Services 1.8 1.8 1.8 0.0 0.0Educational & Health Serv. 1.1 1.0 1.1 10.0 0.0Leisure & Hospitality 9.4 8.6 9.3 9.3 1.1Other Services 0.5 0.5 0.5 0.0 0.0
GOVERNMENT 2.3 2.6 2.3 -11.5 0.0
Puerto Rico 14.8Nevada 12.5Rhode Island 11.2California 10.9Michigan 10.3Mississippi 10.1New Jersey 10.1North Carolina 9.8Georgia 9.7South Carolina 9.6Connecticut 9.3Florida 9.3Illinois 9.3New York 9.1Alabama 9.0District of Columbia 9.0Oregon 8.9Tennessee 8.8Arizona 8.7United States 8.6Kentucky 8.5Washington 8.4Colorado 8.3Indiana 8.3Pennsylvania 8.3Louisiana 7.9Arkansas 7.8Missouri 7.6Texas 7.5Maine 7.4New Mexico 7.4Ohio 7.4Wisconsin 7.4Alaska 7.3West Virginia 7.2Delaware 7.1Maryland 7.1Idaho 6.9Kansas 6.7Massachusetts 6.6Hawaii 6.4Utah 6.2Virginia 6.0Minnesota 5.9Montana 5.9New Hampshire 5.7Vermont 5.3Wyoming 5.3Iowa 5.2Oklahoma 5.1South Dakota 4.4Nebraska 4.3North Dakota 2.9
Wyoming Nonagricultural Wage and Salary Employmentby: David Bullard, Senior Economist

© WYOMING LABOR FORCE TRENDSWyoming Department of Workforce Services Research & Planning
http://doe.state.wy.us/LMIPage 32 September 2012
Economic Indicatorsby: Margaret Hiatt, Administrative/Survey Support Specialist
The Baker Hughes rig count for Wyoming fell from 50 in July 2011 to 46 in July 2012, an 8.0% decrease.
40
50
60
40
50
60
7/127/117/10
Baker Hughes North American Rotary Rig Count for Wyoming
Jul Jun Jul Percent Change2012 (p) 2012 (r) 2011 (b) Month Year
Wyoming Total Nonfarm Employment 293,900 298,200 294,700 -1.4 -0.3Wyoming State Government 16,600 16,700 16,500 -0.6 0.6
Laramie County Nonfarm Employment 45,900 46,400 44,900 -1.1 2.2Natrona County Nonfarm Employment 41,400 41,800 40,300 -1.0 2.7
Selected U.S. Employment DataU.S. Multiple Jobholders 6,741,000 6,707,000 6,724,000 0.5 0.3
As a percent of all workers 4.7% 4.7% 4.8% N/A N/AU.S. Discouraged Workers 852,000 821,000 1,119,000 3.8 -23.9U.S. Part Time for Economic Reasons 8,316,000 8,394,000 8,514,000 -0.9 -2.3
Wyoming Unemployment InsuranceWeeks Compensated 17,689 15,519 17,288 14.0 2.3Benefits Paid $6,111,804 $5,319,736 $5,633,695 14.9 8.5Average Weekly Benefit Payment $345.51 $342.79 $325.87 0.8 6.0State Insured Covered Jobs1 272,954 277,518 266,887 -1.6 2.3Insured Unemployment Rate 2.1% 2.1% 1.8% N/A N/A
Consumer Price Index (U) for All U.S. Urban Consumers (1982 to 1984 = 100)
All Items 229.1 229.5 225.9 -0.2 1.4Food & Beverages 233.6 233.5 228.3 0.0 2.3Housing 223.3 223.1 220.2 0.1 1.4Apparel 122.3 125.2 118.8 -2.3 3.0Transportation 214.3 216.4 216.2 -1.0 -0.9Medical Care 416.8 415.3 400.3 0.3 4.1Recreation (Dec. 1997=100) 114.9 115.1 113.5 -0.1 1.3Education & Communication (Dec. 1997=100) 133.5 133.5 130.9 0.1 2.1Other Goods & Services 395.4 394.0 386.5 0.4 2.3
Producer Prices (1982 to 1984 = 100)All Commodities 200.0 200.4 204.6 -0.2 -2.2
Wyo. Bldg. Permits (New Privately Owned Housing Units Authorized)Total Units 133 159 288 -16.4 -53.8
Valuation $29,324,000 $41,531,000 $47,570,000 -29.4 -38.4Single Family Homes 126 147 164 -14.3 -23.2
Valuation $28,689,000 $40,278,000 $38,162,000 -28.8 -24.8Casper MSA2 Building Permits 21 26 67 -19.2 -68.7
Valuation $4,516,000 $4,979,000 $5,963,000 -9.3 -24.3Cheyenne MSA Building Permits 27 34 14 -20.6 92.9
Valuation $3,242,000 $6,953,000 $2,398,000 -53.4 35.2
Baker Hughes North American Rotary Rig Count for Wyoming 46 40 50 15.0 -8.0
(p) Preliminary. (r) Revised. (b) Benchmarked. 1Local Area Unemployment Statistics Program estimates.2Metropolitan Statistical Area.Note: Production worker hours and earnings data have been dropped from the Economic Indicators page because of problems with accuracy due to a small sample size and high item nonresponse. The Bureau of Labor Statistics will continue to publish these data online at http://www.bls.gov/eag/eag.wy.htm.

© WYOMING LABOR FORCE TRENDS
Page 33http://doe.state.wy.us/LMISeptember 2012
Wyoming Department of Workforce ServicesResearch & Planning
Wyoming County Unemployment Ratesby: Carola Cowan, BLS Programs Supervisor
Lincoln County posted the highest unemployment rate (7.2%) in July 2012.
Labor Force Employed Unemployed Unemployment Rates
Jul Jun Jul Jul Jun Jul Jul Jun Jul Jul Jun Jul
REGION 2012 2012 2011 2012 2012 2011 2012 2012 2011 2012 2012 2011
County (p) (r) (b) (p) (r) (b) (p) (r) (b) (p) (r) (b)
NORTHWEST 49,144 49,267 49,300 46,178 46,272 46,471 2,966 2,995 2,829 6.0 6.1 5.7Big Horn 5,216 5,344 5,370 4,867 4,998 5,031 349 346 339 6.7 6.5 6.3
Fremont 19,758 19,840 19,434 18,371 18,475 18,114 1,387 1,365 1,320 7.0 6.9 6.8
Hot Springs 2,613 2,682 2,678 2,500 2,555 2,545 113 127 133 4.3 4.7 5.0
Park 17,215 17,053 17,302 16,334 16,138 16,514 881 915 788 5.1 5.4 4.6
Washakie 4,342 4,348 4,516 4,106 4,106 4,267 236 242 249 5.4 5.6 5.5
NORTHEAST 55,457 56,843 54,415 52,630 53,837 51,556 2,827 3,006 2,859 5.1 5.3 5.3Campbell 28,217 28,986 27,110 26,990 27,645 25,891 1,227 1,341 1,219 4.3 4.6 4.5
Crook 3,645 3,750 3,597 3,465 3,555 3,413 180 195 184 4.9 5.2 5.1
Johnson 4,113 4,207 4,131 3,881 3,955 3,873 232 252 258 5.6 6.0 6.2
Sheridan 16,280 16,654 16,399 15,263 15,619 15,377 1,017 1,035 1,022 6.2 6.2 6.2
Weston 3,202 3,246 3,178 3,031 3,063 3,002 171 183 176 5.3 5.6 5.5
SOUTHWEST 68,749 68,390 68,495 65,441 64,843 65,022 3,308 3,547 3,473 4.8 5.2 5.1Lincoln 8,432 8,568 8,538 7,825 7,957 7,926 607 611 612 7.2 7.1 7.2
Sublette 7,843 7,735 8,018 7,559 7,436 7,765 284 299 253 3.6 3.9 3.2
Sweetwater 25,244 25,607 25,222 24,068 24,355 23,994 1,176 1,252 1,228 4.7 4.9 4.9
Teton 15,711 15,001 15,785 15,062 14,229 15,022 649 772 763 4.1 5.1 4.8
Uinta 11,519 11,479 10,932 10,927 10,866 10,315 592 613 617 5.1 5.3 5.6
SOUTHEAST 76,842 77,599 76,586 72,409 72,940 72,109 4,433 4,659 4,477 5.8 6.0 5.8Albany 18,990 19,354 19,001 18,059 18,319 18,124 931 1,035 877 4.9 5.3 4.6
Goshen 6,383 6,536 6,407 6,002 6,138 6,027 381 398 380 6.0 6.1 5.9
Laramie 45,947 45,974 45,641 43,132 43,071 42,729 2,815 2,903 2,912 6.1 6.3 6.4
Niobrara 1,315 1,353 1,339 1,254 1,288 1,278 61 65 61 4.6 4.8 4.6
Platte 4,207 4,382 4,198 3,962 4,124 3,951 245 258 247 5.8 5.9 5.9
CENTRAL 60,011 60,232 58,878 57,050 57,102 55,649 2,961 3,130 3,229 4.9 5.2 5.5Carbon 8,098 8,304 7,924 7,657 7,830 7,459 441 474 465 5.4 5.7 5.9
Converse 8,059 8,127 7,660 7,715 7,750 7,300 344 377 360 4.3 4.6 4.7
Natrona 43,854 43,801 43,294 41,678 41,522 40,890 2,176 2,279 2,404 5.0 5.2 5.6
STATEWIDE 310,205 312,329 307,675 293,709 294,994 290,807 16,496 17,335 16,868 5.3 5.6 5.5
Statewide Seasonally Adjusted .............................................................................................................................................. 5.6 5.4 6.0
U.S. ................................................................................................................................................................................................. 8.6 8.4 9.3
U.S. Seasonally Adjusted .......................................................................................................................................................... 8.3 8.2 9.1
Prepared in cooperation with the Bureau of Labor Statistics. Benchmarked 02/2012. Run Date 08/2012.
Data are not seasonally adjusted except where otherwise specified.
(p) Preliminary. (r) Revised. (b) Benchmarked.

© WYOMING LABOR FORCE TRENDSWyoming Department of Workforce Services Research & Planning
http://doe.state.wy.us/LMIPage 34 September 2012
Wyoming Normalizeda Unemployment Insurance Statistics: Initial Claimsby: Sherry Wen, Senior Economist
Initial claims increased 5.0% compared to July 2011. Significant increases were seen in natural resources & mining (43.8%) and construction (15.2%).
0 100 200 300 400 500
July 2011
July 2012
Unclassi�edGovernment
Leisure & Hosp.Ed. & Health Serv.
Prof. & Business Serv.Financial Activ.
InformationTrade, Trans., & Util.
ManufacturingConstruction
Natural Res. & Mining
Claims Filed
Indu
stry
0 100 200 300 400 500 600
July 2011
July 2012
Out of StateUnknown (WY)
WestonWashakie
UintaTeton
SweetwaterSubletteSheridan
PlattePark
NiobraraNatronaLincoln
LaramieJohnson
Hot SpringsGoshen
FremontCrook
ConverseCarbon
CampbellBig Horn
Albany
Cou
nty
Claims FiledaAn average month is considered 4.33 weeks. If a month has four weeks, the normalization factor is 1.0825. If the month has five weeks, the normalization factor is 0.866. The number of raw claims is multiplied by the normalization factor to achieve the normalized claims counts.
Initial Unemployment Insurance Claims by Industry, July 2012
Initial Unemployment Insurance Claims by County, July 2012
Initial Claims
Claims Filed
Percent Change Claims Filed
Jul 12 Jul 12
Jul 12 Jun 12 Jul 11 Jun 12 Jul 11
Wyoming StatewideTOTAL CLAIMS FILED 2,333 2,374 2,222 -1.7 5.0TOTAL GOODS-PRODUCING 813 820 664 -0.9 22.4 Natural Res. & Mining 230 212 160 8.5 43.8 Mining 205 182 144 12.6 42.4 Oil & Gas Extraction 10 12 10 -16.7 0.0 Construction 500 540 434 -7.4 15.2 Manufacturing 83 68 70 22.1 18.6TOTAL SERVICE-PROVIDING 1,000 989 977 1.1 2.4 Trade, Transp., & Utilities 328 323 324 1.5 1.2 Wholesale Trade 56 47 44 19.1 27.3 Retail Trade 194 191 188 1.6 3.2 Transp., Warehousing & Utilities 78 85 92 -8.2 -15.2 Information 13 15 14 -13.3 -7.1 Financial Activities 38 39 54 -2.6 -29.6 Prof. and Business Svcs. 182 157 154 15.9 18.2 Educational & Health Svcs. 153 203 173 -24.6 -11.6 Leisure & Hospitality 215 192 206 12.0 4.4 Other Svcs., exc. Public Admin. 71 60 52 18.3 36.5TOTAL GOVERNMENT 231 223 214 3.6 7.9 Federal Government 32 35 38 -8.6 -15.8 State Government 35 22 32 59.1 9.4 Local Government 164 166 144 -1.2 13.9 Local Education 54 90 53 -40.0 1.9UNCLASSIFIED 289 342 367 -15.5 -21.3
Laramie County
TOTAL CLAIMS FILED 327 339 330 -3.5 -0.9TOTAL GOODS-PRODUCING 77 93 70 -17.2 10.0 Construction 57 77 58 -26.0 -1.7TOTAL SERVICE-PROVIDING 203 209 217 -2.9 -6.5 Trade, Transp., & Utilities 63 74 79 -14.9 -20.3 Financial Activities 8 10 15 -20.0 -46.7 Prof. & Business Svcs. 45 31 41 45.2 9.8 Educational & Health Svcs. 34 39 30 -12.8 13.3 Leisure & Hospitality 40 41 39 -2.4 2.6TOTAL GOVERNMENT 37 27 35 37.0 5.7UNCLASSIFIED 10 10 8 0.0 25.0
Natrona County
TOTAL CLAIMS FILED 270 277 264 -2.5 2.3TOTAL GOODS-PRODUCING 80 85 90 -5.9 -11.1 Construction 36 55 43 -34.5 -16.3TOTAL SERVICE-PROVIDING 161 172 150 -6.4 7.3 Trade, Transp., & Utilities 55 48 54 14.6 1.9 Financial Activities 2 2 3 0.0 -33.3 Prof. & Business Svcs. 28 34 15 -17.6 86.7 Educational & Health Svcs. 25 33 37 -24.2 -32.4 Leisure & Hospitality 37 36 27 2.8 37.0TOTAL GOVERNMENT 20 10 19 100.0 5.3UNCLASSIFIED 9 10 5 -10.0 80.0

© WYOMING LABOR FORCE TRENDS
Page 35http://doe.state.wy.us/LMISeptember 2012
Wyoming Department of Workforce ServicesResearch & Planning
0 2,000 4,000 6,000
July 2011
July 2012
Out of StateUnknown (WY)
WestonWashakie
UintaTeton
SweetwaterSubletteSheridan
PlattePark
NiobraraNatronaLincoln
LaramieJohnson
Hot SpringsGoshen
FremontCrook
ConverseCarbon
CampbellBig Horn
Albany
Cou
nty
Weeks Claimed
0 1,000 2,000 3,000 4,000 5,000
July 2011
July 2012
Unclassi�edGovernment
Leisure & Hosp.Ed. & Health Serv.
Prof. & Business Serv.Financial Activities
InformationTrade, Trans., & Util.
ManufacturingConstruction
Natural Res. & Mining
Weeks ClaimedIn
dust
ry
Wyoming Normalizeda Unemployment Insurance Statistics: Continued Claimsby: Sherry Wen, Senior Economist
Total weeks claimed decreased by 9.3% from July 2011, but a significant increase in the number of weeks claimed was seen in natural resources & mining (50.5%).
aAn average month is considered 4.33 weeks. If a month has four weeks, the normalization factor is 1.0825. If the month has five weeks, the normalization factor is 0.866. The number of raw claims is multiplied by the normalization factor to achieve the normalized claims counts.bDoes not include claimants receiving extended benefits.
Continued Unemployment Insurance Claims by County, July 2012
Continued Unemployment Insurance Claims by Industry, July 2012
Continued Claims
Claims Filed
Percent Change Claims Filed
Jul 12 Jul 12Jul 12 Jun 12 Jul 11 Jun 12 Jul 11
Wyoming StatewideTOTAL WEEKS CLAIMED 18,673 19,241 20,595 -3.0 -9.3EXTENDED WEEKS CLAIMED 6,587 7,358 13,255 -10.5 -50.3TOTAL UNIQUE CLAIMANTSb 5,300 5,618 5,894 -5.7 -10.1Benefit Exhaustions 463 462 684 0.2 -32.3Benefit Exhaustion Rates 8.7% 8.2% 11.6% 0.5% -2.9%TOTAL GOODS-PRODUCING 6,080 6,381 6,001 -4.7 1.3 Natural Res. & Mining 1,795 1,753 1,193 2.4 50.5 Mining 1,639 1,620 1,080 1.2 51.8 Oil & Gas Extraction 155 106 87 46.2 78.2 Construction 3,625 3,816 4,101 -5.0 -11.6 Manufacturing 660 812 707 -18.7 -6.6TOTAL SERVICE-PROVIDING 8,318 8,814 9,484 -5.6 -12.3 Trade, Transp., & Utilities 2,591 2,586 2,855 0.2 -9.2 Wholesale Trade 464 427 432 8.7 7.4 Retail Trade 1,467 1,465 1,851 0.1 -20.7 Transp., Warehousing & Utilities 660 694 572 -4.9 15.4 Information 146 128 202 14.1 -27.7 Financial Activities 437 438 480 -0.2 -9.0 Prof. & Business Services 1,454 1,501 1,471 -3.1 -1.2 Educational & Health Svcs. 1,649 1,490 1,929 10.7 -14.5 Leisure and Hospitality 1,552 2,174 1,968 -28.6 -21.1 Other Svcs., exc. Public Admin. 489 497 579 -1.6 -15.5TOTAL GOVERNMENT 1,856 1,739 2,094 6.7 -11.4 Federal Government 296 371 368 -20.2 -19.6 State Government 242 213 255 13.6 -5.1 Local Government 1,318 1,155 1,471 14.1 -10.4 Local Education 421 327 506 28.7 -16.8UNCLASSIFIED 2,419 2,307 3,016 4.9 -19.8
Laramie CountyTOTAL WEEKS CLAIMED 2,539 2,583 2,790 -1.7 -9.0TOTAL UNIQUE CLAIMANTS 729 729 803 0.0 -9.2TOTAL GOODS-PRODUCING 535 629 584 -14.9 -8.4 Construction 366 414 437 -11.6 -16.2TOTAL SERVICE-PROVIDING 1,597 1,531 1,745 4.3 -8.5 Trade, Transp., and Utilities 478 387 487 23.5 -1.8 Financial Activities 110 122 119 -9.8 -7.6 Prof. & Business Svcs. 323 348 297 -7.2 8.8 Educational and Health Svcs. 354 349 450 1.4 -21.3 Leisure & Hospitality 245 232 240 5.6 2.1TOTAL GOVERNMENT 304 306 384 -0.7 -20.8UNCLASSIFIED 103 117 77 -12.0 33.8
Natrona CountyTOTAL WEEKS CLAIMED 1,953 1,893 2,218 3.2 -11.9TOTAL UNIQUE CLAIMANTS 541 555 628 -2.5 -13.9TOTAL GOODS-PRODUCING 551 584 532 -5.7 3.6 Construction 266 330 254 -19.4 4.7TOTAL SERVICE-PROVIDING 1,231 1,143 1,523 7.7 -19.2 Trade, Transp., and Utilities 346 343 531 0.9 -34.8 Financial Activities 39 58 78 -32.8 -50.0 Professional & Business Svcs. 188 186 236 1.1 -20.3 Educational & Health Svcs. 321 261 323 23.0 -0.6 Leisure & Hospitality 188 157 187 19.7 0.5TOTAL GOVERNMENT 105 104 121 1.0 -13.2UNCLASSIFIED 66 62 42 6.5 57.1

Wyom
ing Departm
ent of W
orkforce ServicesR
esearch & Planning
P.O. B
ox 2760C
asper, WY 82602
Official B
usinessPenalty for Private U
se $300R
eturn Service R
equested