wyoming unemployment insurance claims...
TRANSCRIPT

Information for Wyoming by Industry and County of Residence of Claimant
by: Patrick Manning, Principal Economist, and Michael Moore, Editor Research & Planning, Wyoming Department of Workforce Services
Published November 6, 2017
Wyoming Unemployment Insurance Claims Report
October 2017

Wyoming Unemployment Insurance Claims Report, October 2017
Information for Wyoming by Industry and County of Residence of Claimant
Wyoming Department of Workforce Services John Cox, Director
Research & Planning Tony Glover, Manager
Carola Cowan, Bureau of Labor Statistics Programs Supervisor
Prepared by: Patrick Manning, Principal Economist
Michael Moore, Editor
Editorial Committee: David Bullard, Katelynd Faler, Elyse Gagne, Matthew Halama,
Chris McGrath, Lynae Mohondro, Michael Moore, and Carol Toups
Published November 6, 2017. ©2017 by the Wyoming Department of Workforce Services, Research & Planning
Department of Workforce Services Nondiscrimination Statement The Department of Workforce Services does not discriminate on the basis of race, color, religion,
national origin, sex, age, or disability. It is our intention that all individuals seeking services from our agency be given equal opportunity and that eligibility decisions be based upon
applicable statutes, rules, and regulations.
Research & Planning P.O. Box 2760
Casper, WY 82602 Phone: (307) 473-3807
Fax: (307) 473-3834
R&P Website: http://doe.state.wy.us/LMI/ Unemployment Insurance Claims: http://doe.state.wy.us/LMI/ui.htm
URL for this report: http://doe.state.wy.us/LMI/UI/UI_Claims_Oct_2017.pdf
“Your Source for Wyoming Labor Market Information”
Who We AreResearch & Planning (R&P) functions as an exclusively statistical entity within the Wyoming Department of Workforce Services. R&P collects, analyzes, and publishes timely and accurate labor market information (LMI) meeting established statistical standards. We work to make the labor market more efficient by providing the public and the public’s representatives with the information needed for evidence-based, informed decision making.
Page 2

Wyoming Unemployment Insurance Claims Report, October 2017 Initial and Continued Claims Decline Over the Yearby: Patrick Manning, Principal Economist, and Michael Moore, Editor
T he total number of initial Unemployment Insurance (UI) claims in
Wyoming continued to decline in October 2017, down 24.7% (-791 claims) from October 2016. The number of initial claims has decreased from prior-year levels every month since September 2016.
The decline in initial UI claims in Wyoming has coincided with a shrinking labor force (all employed and unemployed individuals). As noted by Bullard (2017), Wyoming’s labor force decreased significantly from September 2016 to September 2017 (-7,668 people, or -2.5%)1. There are several factors that could influence the continuing declines in the labor force and UI claims, such as:
● People left the workforce entirely.
● People lost their jobs and quickly found jobs in other states.
● People voluntarily separated from their employers and found work in other states.
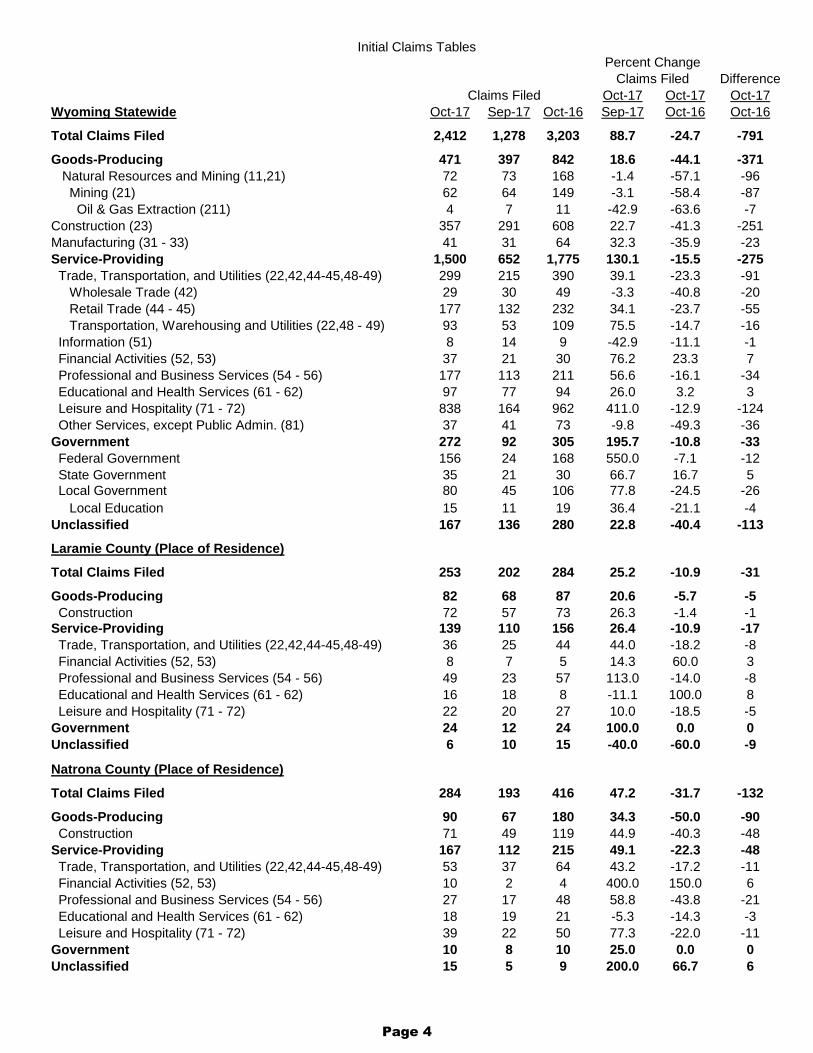
Initial Claims (see pages 4-5)
As shown in Figure 1, initial UI claims activity in Wyoming tends to follow a seasonal pattern. Initial UI claims increase substantially
from September to October as seasonal job losses are seen in leisure & hospitality, retail trade, and professional & business services. Initial claims increased 88.7% (1,134 claims) from September 2017 to October 2017.
Most industries experienced substantial over-the-year declines in inital claims, with the largest decreases seen in construction (-251, or -41.3%); leisure & hospitality (-124, or -12.9%); trade, transportation, & utilities (-91, or -23.3%); and mining (-87, or -58.4%).
At the county level, the greatest decreases in initial claims were seen in Natrona (-132, or -46.4%) and Campbell (-127, or -164.8%) counties. Initial claims by out-of-state claimants decreased by 195 (-26.9%).
Continued Claims (see pages 6-8)
Over the year, the number of unique claimants with continued claims decreased by 45.0% (-2,433 individuals). Total continued weeks claimed decreased by 46.4% (-8,309 weeks). The over-the-year decrease in continued weeks claimed began in November 2016 and has continued ever since. The number of workers exhausting their UI benefits declined by 59.5% (-329 individuals).
All industries and counties experienced over-the-year decreases in continued weeks claimed.
1 Bullard, D. (2017, October). Wyoming unemployment rate unchanged at 4.0% in September 2017. Research & Planning, Wyoming DWS. Retrieved November 2, 2017, from http://doe.state.wy.us/LMI/news.htm
Figure 1: Number of New Initial Unemployment Insurance Claims for Wyoming by Year and Month, 2013-2017
Source: Unemployment Insurance (UI) statistics. Research & Planning, WY DWS. Prepared by M. Moore, Research & Planning, WY DWS, 11/2/17.
1,000
2,000
3,000
4,000
5,000
DECNOVOCTSEPAUG JULJUNMAYAPRMARFEBJAN
20172016201520142013
Page 3
Difference
Oct-17 Oct-17 Oct-17
Wyoming Statewide Oct-17 Sep-17 Oct-16 Sep-17 Oct-16 Oct-16
Total Claims Filed 2,412 1,278 3,203 88.7 -24.7 -791
Goods-Producing 471 397 842 18.6 -44.1 -371
Natural Resources and Mining (11,21) 72 73 168 -1.4 -57.1 -96
Mining (21) 62 64 149 -3.1 -58.4 -87
Oil & Gas Extraction (211) 4 7 11 -42.9 -63.6 -7
Construction (23) 357 291 608 22.7 -41.3 -251
Manufacturing (31 - 33) 41 31 64 32.3 -35.9 -23
Service-Providing 1,500 652 1,775 130.1 -15.5 -275
Trade, Transportation, and Utilities (22,42,44-45,48-49) 299 215 390 39.1 -23.3 -91
Wholesale Trade (42) 29 30 49 -3.3 -40.8 -20
Retail Trade (44 - 45) 177 132 232 34.1 -23.7 -55
Transportation, Warehousing and Utilities (22,48 - 49) 93 53 109 75.5 -14.7 -16
Information (51) 8 14 9 -42.9 -11.1 -1
Financial Activities (52, 53) 37 21 30 76.2 23.3 7
Professional and Business Services (54 - 56) 177 113 211 56.6 -16.1 -34
Educational and Health Services (61 - 62) 97 77 94 26.0 3.2 3
Leisure and Hospitality (71 - 72) 838 164 962 411.0 -12.9 -124
Other Services, except Public Admin. (81) 37 41 73 -9.8 -49.3 -36
Government 272 92 305 195.7 -10.8 -33
Federal Government 156 24 168 550.0 -7.1 -12
State Government 35 21 30 66.7 16.7 5
Local Government 80 45 106 77.8 -24.5 -26
Local Education 15 11 19 36.4 -21.1 -4
Unclassified 167 136 280 22.8 -40.4 -113
Laramie County (Place of Residence)
Total Claims Filed 253 202 284 25.2 -10.9 -31
Goods-Producing 82 68 87 20.6 -5.7 -5
Construction 72 57 73 26.3 -1.4 -1
Service-Providing 139 110 156 26.4 -10.9 -17
Trade, Transportation, and Utilities (22,42,44-45,48-49) 36 25 44 44.0 -18.2 -8
Financial Activities (52, 53) 8 7 5 14.3 60.0 3
Professional and Business Services (54 - 56) 49 23 57 113.0 -14.0 -8
Educational and Health Services (61 - 62) 16 18 8 -11.1 100.0 8
Leisure and Hospitality (71 - 72) 22 20 27 10.0 -18.5 -5
Government 24 12 24 100.0 0.0 0
Unclassified 6 10 15 -40.0 -60.0 -9
Natrona County (Place of Residence)
Total Claims Filed 284 193 416 47.2 -31.7 -132
Goods-Producing 90 67 180 34.3 -50.0 -90
Construction 71 49 119 44.9 -40.3 -48
Service-Providing 167 112 215 49.1 -22.3 -48
Trade, Transportation, and Utilities (22,42,44-45,48-49) 53 37 64 43.2 -17.2 -11
Financial Activities (52, 53) 10 2 4 400.0 150.0 6
Professional and Business Services (54 - 56) 27 17 48 58.8 -43.8 -21
Educational and Health Services (61 - 62) 18 19 21 -5.3 -14.3 -3
Leisure and Hospitality (71 - 72) 39 22 50 77.3 -22.0 -11
Government 10 8 10 25.0 0.0 0
Unclassified 15 5 9 200.0 66.7 6
Claims Filed
Initial Claims TablesPercent Change
Claims Filed
Page 4

Initial Unemployment Insurance Claims by Major Industry, October 2017In
dust
ry
Claims Filed
0 200 400 600 800 1,000
Other
Government
Leisure & Hospitality
Education. & Health Svcs.
Pro. & Business Svcs.
Financial Activities
Information
Trade, Trans., & Utilities
Manufacturing
Construction
Natural Resources & Mining
0 200 400 600 800 1,000
Out of StateWeston
WashakieUintaTeton
SweetwaterSubletteSheridan
PlattePark
NiobraraNatronaLincoln
LaramieJohnson
Hot SpringsGoshen
FremontCrook
ConverseCarbon
CampbellBig Horn
Albany
Initial Unemployment Insurance Claims by County of Residence, October 2017
Oct 2016
Oct 2017
Coun
ty o
f Res
iden
ce
Claims Filed
Source: Research & Planning, Wyoming Department of Workforce Services. Retrieved from http://doe.state.wy.us/LMI/ui.htm.
Oct 2016
Oct 2017
Page 5

DifferenceOct-17 Oct-17 Oct-17
Wyoming Statewide Oct-17 Sep-17 Oct-16 Sep-17 Oct-16 Oct-16
Total Continued Weeks Claimed 9,580 9,403 17,889 1.9 -46.4 -8,309
Total Unique Claimants 2,970 2,697 5,403 10.1 -45.0 -2,433Benefit Exhaustions 224 217 553 3.2 -59.5 -329Benefit Exhaustion Rates 7.5% 8.0% 10.2% -0.5% -2.7%
Goods-Producing 2,383 2,530 6,478 -5.8 -63.2 -4,095 Natural Resources and Mining (11,21) 507 565 2,656 -10.3 -80.9 -2,149 Mining (21) 437 518 2,563 -15.6 -82.9 -2,126 Oil & Gas Extraction (211) 79 94 306 -16.0 -74.2 -227Construction (23) 1,648 1,664 3,136 -1.0 -47.4 -1,488Manufacturing (31 - 33) 227 299 686 -24.1 -66.9 -459Service-Providing 5,262 4,670 8,281 12.7 -36.5 -3,019 Trade, Transportation, and Utilities (22,42,44-45,48-49) 1,600 1,521 2,987 5.2 -46.4 -1,387 Wholesale Trade (42) 252 261 902 -3.4 -72.1 -650 Retail Trade (44 - 45) 959 903 1,264 6.2 -24.1 -305 Transportation, Warehousing and Utilities (22,48 - 49) 389 357 821 9.0 -52.6 -432 Information (51) 110 122 151 -9.8 -27.2 -41 Financial Activities (52, 53) 340 312 502 9.0 -32.3 -162 Professional and Business Services (54 - 56) 922 852 1,259 8.2 -26.8 -337 Educational and Health Services (61 - 62) 840 877 1,141 -4.2 -26.4 -301 Leisure and Hospitality (71 - 72) 1,214 747 1,752 62.5 -30.7 -538 Other Services, except Public Admin. (81) 230 232 481 -0.9 -52.2 -251Government 1,041 959 1,518 8.6 -31.4 -477 Federal Government 214 140 335 52.9 -36.1 -121 State Government 172 111 179 55.0 -3.9 -7 Local Government 654 706 1,003 -7.4 -34.8 -349 Local Education 226 246 260 -8.1 -13.1 -34Unclassified 893 1,242 1,610 -28.1 -44.5 -717
Laramie County (Place of Residence) ConstructionTotal Continued Weeks Claimed 1,380 1,346 1,650 2.5 -16.4 -270Total Unique Claimants 417 397 490 5.0 -14.9 -73
Goods-Producing 339 264 388 28.4 -12.6 -49 Construction 268 206 252 30.1 6.3 16Service-Providing 910 932 1,001 -2.4 -9.1 -91 Trade, Transportation, and Utilities (22,42,44-45,48-49) 219 300 356 -27.0 -38.5 -137 Financial Activities (52, 53) 90 90 67 0.0 34.3 23 Professional and Business Services (54 - 56) 283 225 209 25.8 35.4 74 Educational and Health Services (61 - 62) 157 152 156 3.3 0.6 1 Leisure and Hospitality (71 - 72) 63 76 120 -17.1 -47.5 -57Government 88 90 160 -2.2 -45.0 -72Unclassified 41 59 100 -30.5 -59.0 -59
Natrona County (Place of Residence)
Total Continued Weeks Claimed 1,554 1,536 3,264 1.2 -52.4 -1,710Total Unique Claimants 469 436 956 7.6 -50.9 -487
Goods-Producing 379 407 1,286 -6.9 -70.5 -907 Construction 278 271 552 2.6 -49.6 -274Service-Providing 1,024 985 1,794 4.0 -42.9 -770 Trade, Transportation, and Utilities (22,42,44-45,48-49) 338 309 747 9.4 -54.8 -409 Financial Activities (52, 53) 74 56 68 32.1 8.8 6 Professional and Business Services (54 - 56) 139 123 200 13.0 -30.5 -61 Educational and Health Services (61 - 62) 241 253 351 -4.7 -31.3 -110 Leisure and Hospitality (71 - 72) 161 157 258 2.5 -37.6 -97Government 99 95 110 4.2 -10.0 -11Unclassified 50 48 73 4.2 -31.5 -23
Continued Weeks Claimed TablesPercent Change Claims
Claims Filed
Page 6

Continued Unemployment Insurance Claims by Major Industry, October 2017
Continued Unemployment Insurance Claims by County of Residence, October 2017
Indu
stry
Weeks Claimed
0 500 1,000 1,500 2,000 2,500 3,000 3,500
Other
Government
Leisure & Hospitality
Education. & Health Svsc.
Pro. & Business Svcs.
Financial Activities
Information
Trade, Trans., & Utilities
Manufacturing
Construction
Natural Resources & Mining
Source: Research & Planning, Wyoming Department of Workforce Services. Retrieved from http://doe.state.wy.us/LMI/ui.htm.
Weeks Claimed
0 500 1,000 1,500 2,000 2,500 3,000 3,500
Out of StateWeston
WashakieUintaTeton
SweetwaterSubletteSheridan
PlattePark
NiobraraNatronaLincoln
LaramieJohnson
Hot SpringsGoshen
FremontCrook
ConverseCarbon
CampbellBig Horn
Albany
Coun
ty o
f Res
iden
ce
Oct 2016
Oct 2017
Oct 2016
Oct 2017
Page 7

Table: Wyoming Normalizeda Unemployment Statistics: Continued Claims by County of Residence, October 2017
Over-the-Year ChangeCounty Oct 2017 Oct 2016 N %
Albany 288 355 -67 -18.9Big Horn 107 162 -55 -34.0Campbell 640 2,064 -1,424 -69.0Carbon 246 369 -123 -33.3Converse 173 530 -357 -67.4Crook 73 122 -49 -40.2Fremont 655 1,337 -682 -51.0Goshen 81 149 -68 -45.6Hot Springs 45 118 -73 -61.9Johnson 122 152 -30 -19.7Laramie 1,380 1,651 -271 -16.4Lincoln 155 169 -14 -8.3Natrona 1,554 3,265 -1,711 -52.4Niobrara 9 40 -31 -77.5Park 347 537 -190 -35.4Platte 109 186 -77 -41.4Sheridan 504 523 -19 -3.6Sublette 54 185 -131 -70.8Sweetwater 628 1,341 -713 -53.2Teton 403 432 -29 -6.7Uinta 202 450 -248 -55.1Washakie 83 103 -20 -19.4Weston 99 264 -165 -62.5Out of State 1,619 3,381 -1,762 -52.1Normalized Totala
9,580 17,889 -8,309 -46.4
Real Totalb 8,850 16,526 -7,676 -46.4aAn average month is considered 4.33 weeks. If a month has four weeks, the normalization factor is 1.0825. If the month has five weeks, the normalization factor is 0.866. The number of raw claims is multiplied by the normalization factor to achieve the normalized claims counts.bRaw claims data that have not been multiplied by the normalization factor.
All totals are subject to rounding error and may not add to the sum of their respective components. The table above conforms to Wyoming Employment Security Law - Wyoming Statute 27-3-603 regarding confidentiality.
Source: Research & Planning, Wyoming Department of Workforce Services. Retrieved from http://doe.state.wy.us/LMI/ui.htm
Page 8