x-ray computerised tomography for fracture and facies … · 2019-08-28 · x-ray computerised...
TRANSCRIPT

AEGC 2019: From Data to Discovery – Perth, Australia 1
X-ray computerised tomography for fracture and facies characterisation and slab orientation in cores stored within aluminium tubes Lionel Esteban* Ishtar Barranco Joel Sarout CSIRO Chevron Australia Pty Ltd CSIRO 26 Dick Perry Avenue 250 St Georges Terrace 26 Dick Perry Avenue Kensington, WA 6152 Perth, WA 6000 Kensington, WA 6152 [email protected] [email protected] [email protected]
INTRODUCTION
X-ray Computerised Tomography (Medical XCT) is a radiological imaging system first developed by Hounsfield (1973) and further technically described in the literature (e.g. Wellington and Vinegar, 1987) where in-brief, CT-scan imagery corresponds to a 2D or 3D linear X-ray attenuation pixel matrix, where the attenuation is a function of the density and atomic number of the material being analysed. This non-destructive technique uses X-rays to create a three-dimensional data set of a sample by stacking contiguous cross-sectional two-dimensional images. The image type is a classical DICOM X-ray format reconstructed using an algorithm, provided by the manufacturer of the scanner. This limits possible noise and beam hardening artefacts and enhances specific features based on the operator needs for image processing.
In geo-materials studies, the application of CT scanning includes viewing full-diameter sample sections to determine orientation relative to bedding, identification of discontinuities (fractures and nodules) and pore quantification as a few examples. This technique is generally suitable for visualization from metre to millimetre scale and achieves a voxel resolution around 0.1 mm3 at best (0.1 mm x, y and Z axes). 3D image reconstruction helps to identify internal features that are not visible from outside. With proper software analysis, it is also possible to isolate and visualise specific features in different angles, and even compute for instance a bulk density profile that can then be converted into porosity with appropriate calibration.
METHOD AND RESULTS
The cores from this study were preserved in aluminium barrels filled by expanding foam to avoid internal loose rock pieces moving during shipping/sample handling; and sealed with metal rings on both end caps. A few cores were fully stored in wax or with >1 cm thick steel barrels. For the latter, X-rays cannot fully penetrate steel, especially wall thicknesses >1 cm, preventing any image acquisition, though some major faults & fractures can still be visible inside the centre of the core. A total of 210 metres cores (4 inch diameter tube and ± 1 metre long) were scanned at CSIRO that are primarily composed of sandstones with varying degrees of carbonate cementation (siderite).
Figure 1. Siemens medical X-ray CT scanner SOMATOM Definition AS used at CSIRO-Energy (Perth, WA). Best voxel resolution at 0.1 mm3 with 64 channels and maximum beam power at 140 kV.
SUMMARY A 3D image of a whole core section can be generated by stacking contiguous cross-sectional slices from Medical X-ray Computerised Tomography (Medical XCT). This methodology was applied in cores sealed within aluminium barrels allowing selective and orientated slabbing. It was also used in wax-preserved cores. The resolution of the 3D images (~120 µm) was similar to core photos allowing direct sedimentological and fracture description of the preserved core sections while maintaining the preservation. The 3D image reconstruction of the Medical XCT helped to identify internal features such as faults, macro-pores and fluids. With proper software analysis and appropriate calibration, it was also possible to measure angles of those particular geological and/or induced features with respect to a reference. This non-destructive technique was used on 210 metres of core, composed of sandstones with different intensities of carbonate cement, to measure the orientation of geological fractures and sedimentological structures. It provided the best slabbing angle for sections that were selected for further core characterisation. This technology can also be used to derive properties such as mineralogy, total porosity, connected porosity, pore shape and their orientation.
X-ray tomography for fracture and facies characterisation Lionel, Barranco and Sarout
AEGC 2019: From Data to Discovery – Perth, Australia 2
The 2D and 3D XCT data of the cores were acquired using a Siemens SOMATOM definition AS with 64 slices from CSIRO facility in Perth (Western Australia) (Figure 1). An energy beam of 100 kV/300 mAs with a helical acquisition (0.35 mm pitch and 0.6 mm thick XCT slice) was applied on the 4-inch diameter tube allowing high-resolution transversal images of 0.12 x 0.12 x 0.40 mm in x, y and z axes respectively. This setting was sufficient to pass through the entire core diameter and aluminium barrel wall thickness with little X-ray attenuation. With this lower energy beam, the scanner can perform non-stop XCT acquisition with small X-ray tube cooling time of about 10 minutes every 1 hour. The total acquisition time for 210 metres of core, including sample handling was about 6 working days. The highest edge detection algorithm provided by the manufacturer (H70s from Siemens) was used to generate the sharpest image to maximise the density contrasts. This was typically between the grain matrix background and cracks (i.e. voids) or between siderite and grain matrix background (i.e. mostly quartz) or between the core and aluminium barrels. The down-side of such an algorithm is that it generates speckled noise on the image, as any small change in density will be enhanced on the reconstructed image (grain to grain contacts by instance, etc.). A filter was therefore applied to remove such speckled noise without reducing the sharpness of the image. A 3 x 3 voxels blur despeckle filter was used to remove the noise before the start of 2D/3D image processing sensu stricto. Osirix software (Pixmeo Ltd) was used to process the X-ray images. The processing was divided into three sequential stages:
1. Generate 2D images along the core axis: orthogonal views as exemplified in the figures 2 to 5.
2. Generate 3D movie of the core to detect siderite occurrence: 3D Siderite segmentation (CT >3000 HU).
3. Generate 3D movie of the core to detect the cracks/faults: 3D Fractures segmentation (500 < CT < 1000).
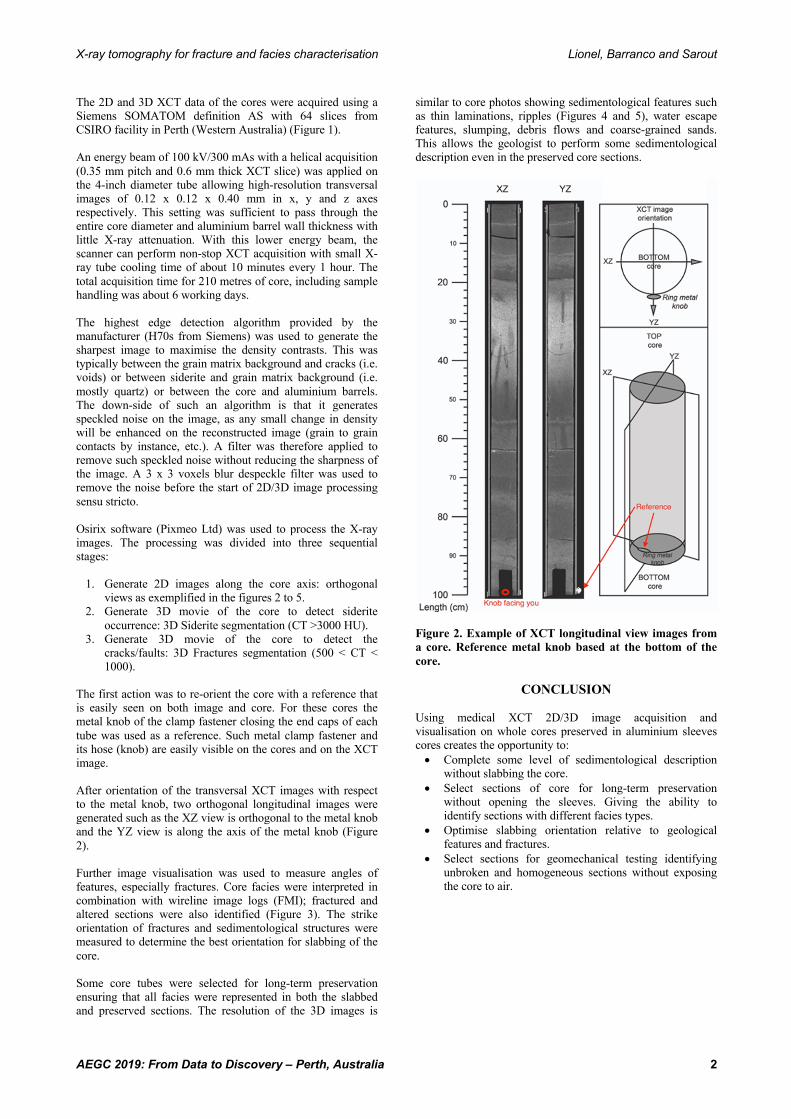
The first action was to re-orient the core with a reference that is easily seen on both image and core. For these cores the metal knob of the clamp fastener closing the end caps of each tube was used as a reference. Such metal clamp fastener and its hose (knob) are easily visible on the cores and on the XCT image. After orientation of the transversal XCT images with respect to the metal knob, two orthogonal longitudinal images were generated such as the XZ view is orthogonal to the metal knob and the YZ view is along the axis of the metal knob (Figure 2). Further image visualisation was used to measure angles of features, especially fractures. Core facies were interpreted in combination with wireline image logs (FMI); fractured and altered sections were also identified (Figure 3). The strike orientation of fractures and sedimentological structures were measured to determine the best orientation for slabbing of the core. Some core tubes were selected for long-term preservation ensuring that all facies were represented in both the slabbed and preserved sections. The resolution of the 3D images is
similar to core photos showing sedimentological features such as thin laminations, ripples (Figures 4 and 5), water escape features, slumping, debris flows and coarse-grained sands. This allows the geologist to perform some sedimentological description even in the preserved core sections.
Figure 2. Example of XCT longitudinal view images from a core. Reference metal knob based at the bottom of the core.
CONCLUSION Using medical XCT 2D/3D image acquisition and visualisation on whole cores preserved in aluminium sleeves cores creates the opportunity to: • Complete some level of sedimentological description
without slabbing the core. • Select sections of core for long-term preservation
without opening the sleeves. Giving the ability to identify sections with different facies types.
• Optimise slabbing orientation relative to geological features and fractures.
• Select sections for geomechanical testing identifying unbroken and homogeneous sections without exposing the core to air.
X-ray tomography for fracture and facies characterisation Lionel, Barranco and Sarout
AEGC 2019: From Data to Discovery – Perth, Australia 3
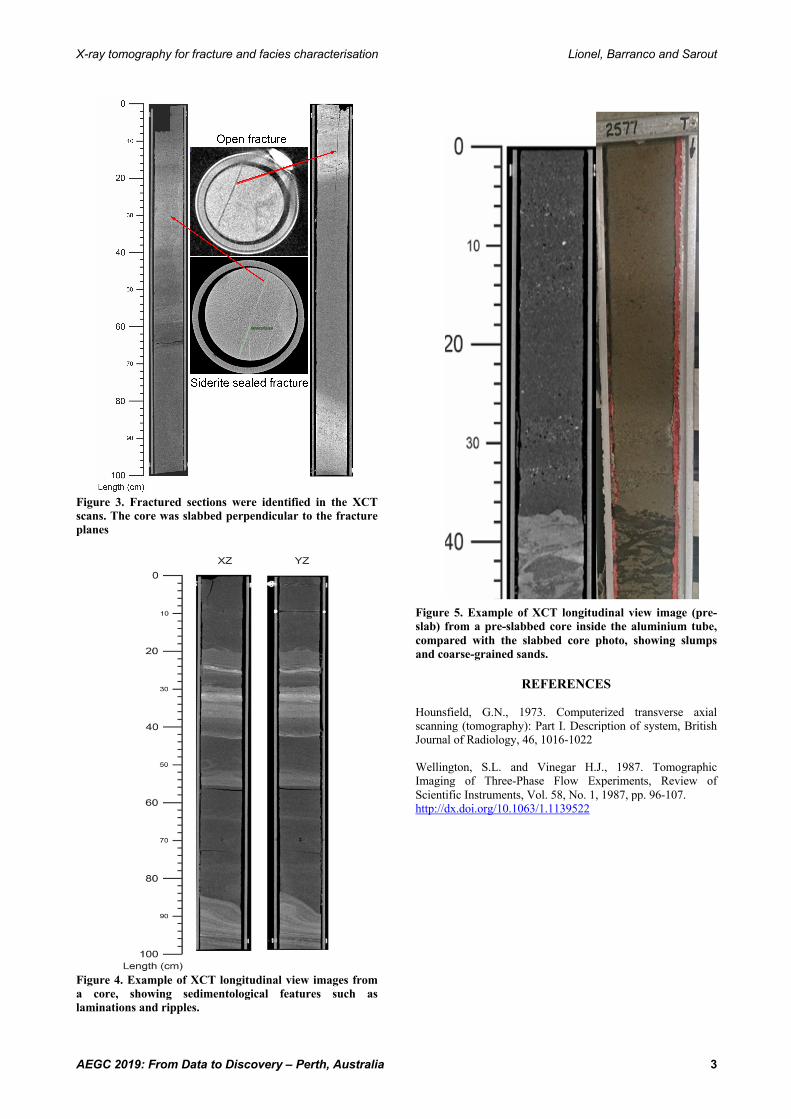
Figure 3. Fractured sections were identified in the XCT scans. The core was slabbed perpendicular to the fracture planes
Figure 4. Example of XCT longitudinal view images from a core, showing sedimentological features such as laminations and ripples.
Figure 5. Example of XCT longitudinal view image (pre-slab) from a pre-slabbed core inside the aluminium tube, compared with the slabbed core photo, showing slumps and coarse-grained sands.
REFERENCES
Hounsfield, G.N., 1973. Computerized transverse axial scanning (tomography): Part I. Description of system, British Journal of Radiology, 46, 1016-1022 Wellington, S.L. and Vinegar H.J., 1987. Tomographic Imaging of Three-Phase Flow Experiments, Review of Scientific Instruments, Vol. 58, No. 1, 1987, pp. 96-107. http://dx.doi.org/10.1063/1.1139522