x-ray ct imaging of pores and fractures in the kakkonda
TRANSCRIPT
X-RAY CT IMAGING OF PORES AND FRACTURES IN THE KAKKONDA GRANITE, NE JAPAN
Tomoyuki Ohtani, Yoshito Nakashima, Tsukasa Nakano and Hirofumi MuraokaGeological Survey of Japan, Higashi, Tsukuba, 305-8567 Japan
Key Words: pores, fractures, X-ray computerizedtomography, granite, Kakkonda geothermal field
ABSTRACT
Three-dimensional imaging of the Kakkonda granite from theborehole WD-1a was performed to clarify meso- andmicroscopic structures of pores and fractures in thegeothermal reservoir by medical and industrial X-raycomputerized tomography (CT) scanners. The granite wasrecovered from WD-1a drilled at the Kakkonda geothermalfield, NE Japan, by the New Energy and IndustrialTechnological Development Organization (NEDO).
A third-generation Hitachi Medical Corporation CT-W2000medical CT scanner enabled us to visualize millimeter-scalerock textures of the granite inside cores without anydestruction. Miarolitic cavities, enclaves, felsic minerals(quartz and feldspar) and mafic minerals (biotite andhornblende) were identified from CT images. Three-dimensional distribution of miarolitic cavities wasreconstructed from contiguous CT images and showedspatially heterogeneous distribution with the boundary thatstrikes N 20° E. Proportion of miarolitic cavities larger than2 mm3 was 0.33 /cm3 between 2936.722 and 2936.921 m.Porosity calculated from X-ray CT images was 0.9 % from2936.722 to 2936.821 m. We fitted ellipsoids with threearbitrary axes to the miarolitic cavities extracted from thecontiguous CT images and examined aspect ratio and shapepreferred orientations of ellipsoids. Fitted ellipsoids exhibitellipsoidal shape and shortest axis trends to E-W. Theseindicate that these cavities may be deformed by the sameregional stress as present one, which is E-W compression.The shape analysis of cavities would clarify the pastdeformational event.
A third-generation Nittetsu Elex Corporation ELE SCANindustrial CT scanner enabled us to visualize micron-scalemicrocracks in the granite. Microcracks are developed alonggrain boundary. These would be important to evaluatepercolation and storage of the hydrothermal fluid in thegranite.
1. INTRODUCTION
Understanding the distribution of the permeable zones in thegeothermal field is important for the exploration andassessment of the reservoir. The distribution of thepermeable zones such as pores and fractures is observed inthe rock samples. These structures of the permeable zoneswould influence storage and percolation of the hydrothermalfluids.
The geothermal boreholes have penetrated young plutonicbodies in and beneath geothermal reservoirs at manygeothermal fields in the world during the last two decades(Muraoka, 1993). For example, several boreholes confirmedthe presence of a plutonic body in the deeper part of theKakkonda geothermal field, NE Japan (Kato and Doi, 1993).The top of the plutonic body is expected to be a part of thegeothermal reservoir (Muraoka, 1993).
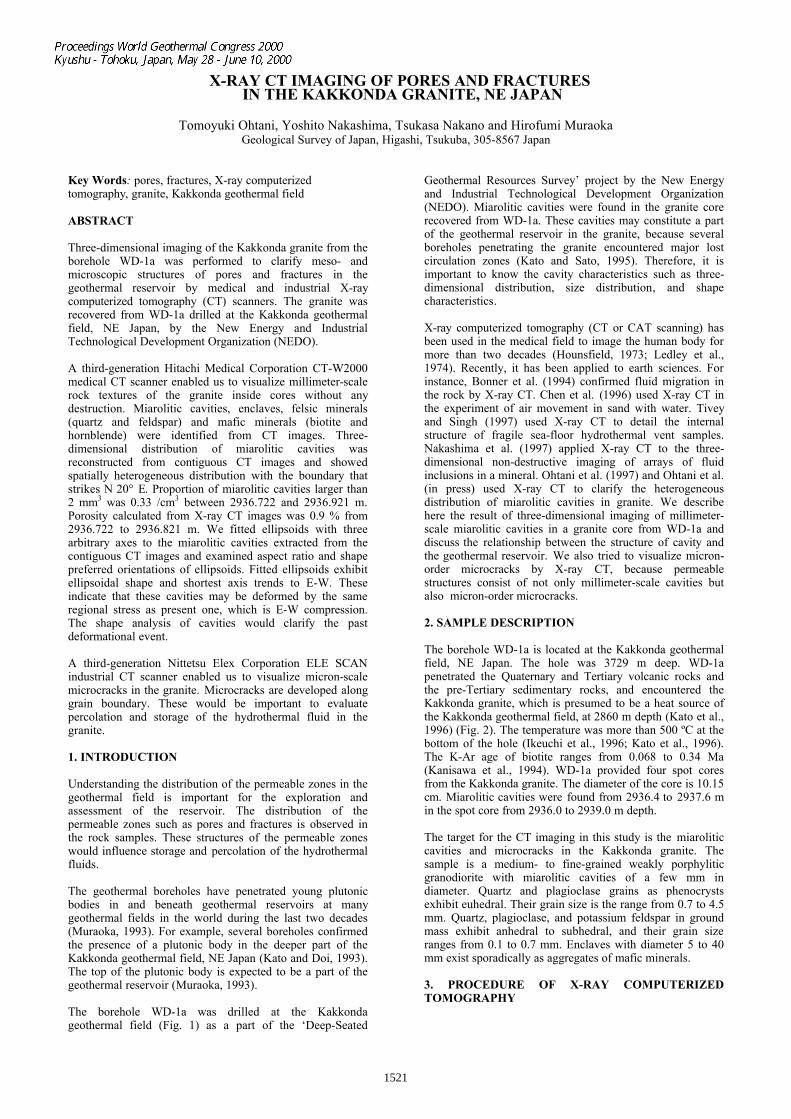
The borehole WD-1a was drilled at the Kakkondageothermal field (Fig. 1) as a part of the ‘Deep-Seated
Geothermal Resources Survey’ project by the New Energyand Industrial Technological Development Organization(NEDO). Miarolitic cavities were found in the granite corerecovered from WD-1a. These cavities may constitute a partof the geothermal reservoir in the granite, because severalboreholes penetrating the granite encountered major lostcirculation zones (Kato and Sato, 1995). Therefore, it isimportant to know the cavity characteristics such as three-dimensional distribution, size distribution, and shapecharacteristics.
X-ray computerized tomography (CT or CAT scanning) hasbeen used in the medical field to image the human body formore than two decades (Hounsfield, 1973; Ledley et al.,1974). Recently, it has been applied to earth sciences. Forinstance, Bonner et al. (1994) confirmed fluid migration inthe rock by X-ray CT. Chen et al. (1996) used X-ray CT inthe experiment of air movement in sand with water. Tiveyand Singh (1997) used X-ray CT to detail the internalstructure of fragile sea-floor hydrothermal vent samples.Nakashima et al. (1997) applied X-ray CT to the three-dimensional non-destructive imaging of arrays of fluidinclusions in a mineral. Ohtani et al. (1997) and Ohtani et al.(in press) used X-ray CT to clarify the heterogeneousdistribution of miarolitic cavities in granite. We describehere the result of three-dimensional imaging of millimeter-scale miarolitic cavities in a granite core from WD-1a anddiscuss the relationship between the structure of cavity andthe geothermal reservoir. We also tried to visualize micron-order microcracks by X-ray CT, because permeablestructures consist of not only millimeter-scale cavities butalso micron-order microcracks.
2. SAMPLE DESCRIPTION
The borehole WD-1a is located at the Kakkonda geothermalfield, NE Japan. The hole was 3729 m deep. WD-1apenetrated the Quaternary and Tertiary volcanic rocks andthe pre-Tertiary sedimentary rocks, and encountered theKakkonda granite, which is presumed to be a heat source ofthe Kakkonda geothermal field, at 2860 m depth (Kato et al.,1996) (Fig. 2). The temperature was more than 500 ºC at thebottom of the hole (Ikeuchi et al., 1996; Kato et al., 1996).The K-Ar age of biotite ranges from 0.068 to 0.34 Ma(Kanisawa et al., 1994). WD-1a provided four spot coresfrom the Kakkonda granite. The diameter of the core is 10.15cm. Miarolitic cavities were found from 2936.4 to 2937.6 min the spot core from 2936.0 to 2939.0 m depth.
The target for the CT imaging in this study is the miaroliticcavities and microcracks in the Kakkonda granite. Thesample is a medium- to fine-grained weakly porphyliticgranodiorite with miarolitic cavities of a few mm indiameter. Quartz and plagioclase grains as phenocrystsexhibit euhedral. Their grain size is the range from 0.7 to 4.5mm. Quartz, plagioclase, and potassium feldspar in groundmass exhibit anhedral to subhedral, and their grain sizeranges from 0.1 to 0.7 mm. Enclaves with diameter 5 to 40mm exist sporadically as aggregates of mafic minerals.
3. PROCEDURE OF X-RAY COMPUTERIZEDTOMOGRAPHY
1521

Ohtani et al.
X-ray CT reconstructs internal images from the distributionof the X-ray absorption coefficient inside the sample deducedfrom the projection of X-ray through a sample. The X-rayabsorption coefficient is usually called CT number (χ)defined as
χ = (ν-ν0) / ν0 × 1000
where ν is the linear attenuation of the sample and ν0 is thelinear attenuation of the standard reference. In hospitalapplications water is normally used as a standard referencefor scanning human tissue. In mesoscopic observation, thesame definition of CT number as hospital application wasused. The CT number of water appears with a value of 0, andthat of nonattenuating material like air appears with a valueof -1000. The CT number is a function of the average densityand composition of the material in any voxel. For example,the CT number increases gradually in order of air, water,felsic minerals, biotite, hornblende and pyrite. This indicatesthat X-ray CT enables us to do non-destructive imaging ofminerals with different density in the rock.
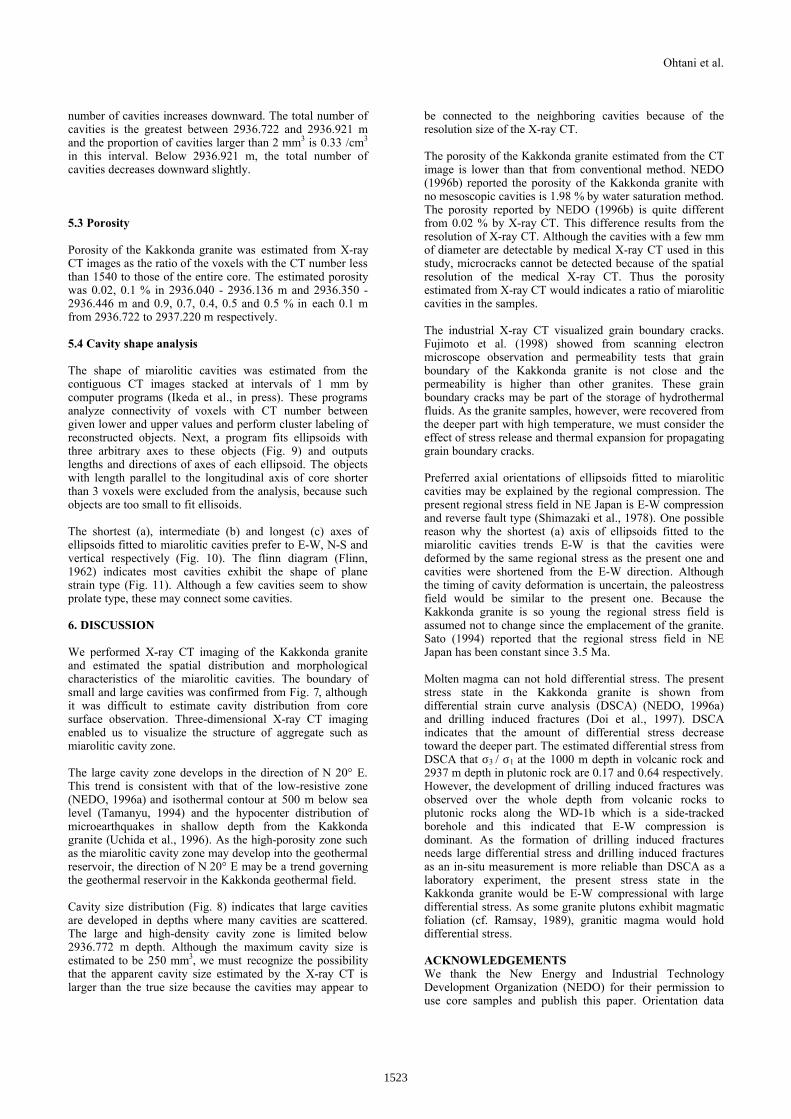
A third-generation Hitachi Medical Corporation CT-W2000CT scanner was used for mesoscopic observation. Thisscanner is equipped with an X-ray emission source and 768elements of X-ray detector (Fig. 3). The performance of thisscanner is 0.75 mm for spatial resolution, 1mm for minimumslice thickness, 130 kV for maximum voltage of the X-raytube, and 160 mm for minimum imaging diameter.
The procedure of the CT imaging was as follows. First, wetook contiguous CT images at intervals of 1 mm. Theimaging condition is 1.0 mm for slice thickness, 0.313 ×0.313 × 1 mm for voxel size, 4.0 seconds for scan time, 175mA for X-ray tube current, 130 kV for X-ray tube voltage,160 mm for imaging diameter, and 512 × 512 for matrix size.The CT imaging of 99 slices took 53 minutes. Second, three-dimensional image of the sample was reconstructed byMacintosh software ‘Fortner Slicer’. This software enabledus to visualize three-dimensional cavity distribution. Third,volume measurement and ellipsoid fitting were performed.Axes orientations and aspect ratios of ellipsoids fitted to themiarolitic cavities were estimated.
A third-generation Nittetsu Elex ELE-SCAN NX-NCP-C80-I4 industrial CT scanner was used for microscopicobservation. This scanner equipped with an X-ray emissionsource and 1024 linear sensors of X-ray detector, and in-plane resolution is 5.05 µm. The imaging condition is 8.08µm for slice thickness, 5.05 × 5.05 × 8.08 µm for voxel size,100 µA for X-ray tube current, 46 kV for X-ray tube voltage,5.2 mm for imaging diameter, and 1024 × 1024 for matrixsize. The CT imaging of 200 slices took 60 minutes.
4. TWO-DIMENSIONAL OBSERVATION OF X-RAYCT IMAGES
4.1 Mesoscopic observation
Some CT images were compared with cutting surface of thecore to identify the CT image as rock textures. Voxels withCT number less than 1540 correspond to the miaroliticcavities in the granite (a in Fig. 4). The enclaves arerecognized as aggregates of voxels with CT number morethan 2350 (b in Fig. 4). Voxels with CT number more than2350 correspond to the coarse mafic minerals (c in Fig. 4).The fine mafic minerals have lower CT number than the
coarse ones. This results from the influence of thesurrounding minerals with low CT number. Voxels with CTnumber from 1540 to 2350 except fine mafic mineralscorrespond to quartz and feldspar. The three traces of thescribe knife carved on the core surface are recognized, sincethis core is oriented.
4.2 Microscopic observation
We tried to visualize microcracks using two ways of CTimaging. First, we took CT images of a cylindrical sample(φ5mm×10mm) from a granite core. Grains exhibit severalCT numbers (Fig. 5a). This may indicate different minerals.Textures such as microcracks are not recognized. The reasonwould be that the thickness of microcracks is less than in-plane resolution of X-ray CT. Next, saturated KI solutionwas infiltrated into the sample. Nakashima (in press) showedthat KI solution greatly increases the CT number. Toinfiltrate KI solution, the sample was vacuumed in saturatedKI solution for several hours, and then it was put in the sameKI solution under atmospheric pressure. The KI solutionfilled microcracks were detected by X-ray CT (Fig. 5b).Microcracks exhibit as voxels with a CT number higher thanthose of surrounding minerals, because KI solution infiltratedinto microcracks shows a high CT number. Microcracks aredeveloped along grain boundaries.
5. THREE-DIMENSIONAL ANALYSIS OF X-RAY CTIMAGES
5.1 Cavity distribution
The stacking of the two-dimensional CT slice images enablesus to view the three-dimensional objects. Fig. 6 shows thethree-dimensional distribution of miarolitic cavities in thecore. The air surrounding the granite core and voxels with aCT number more than 1540 are made transparent, hence thedistribution of voxels with the CT number less than 1540 inthe granite core is visualized. The voxels with the CTnumber less than 1540 inside the granite correspond to themiarolitic cavities.
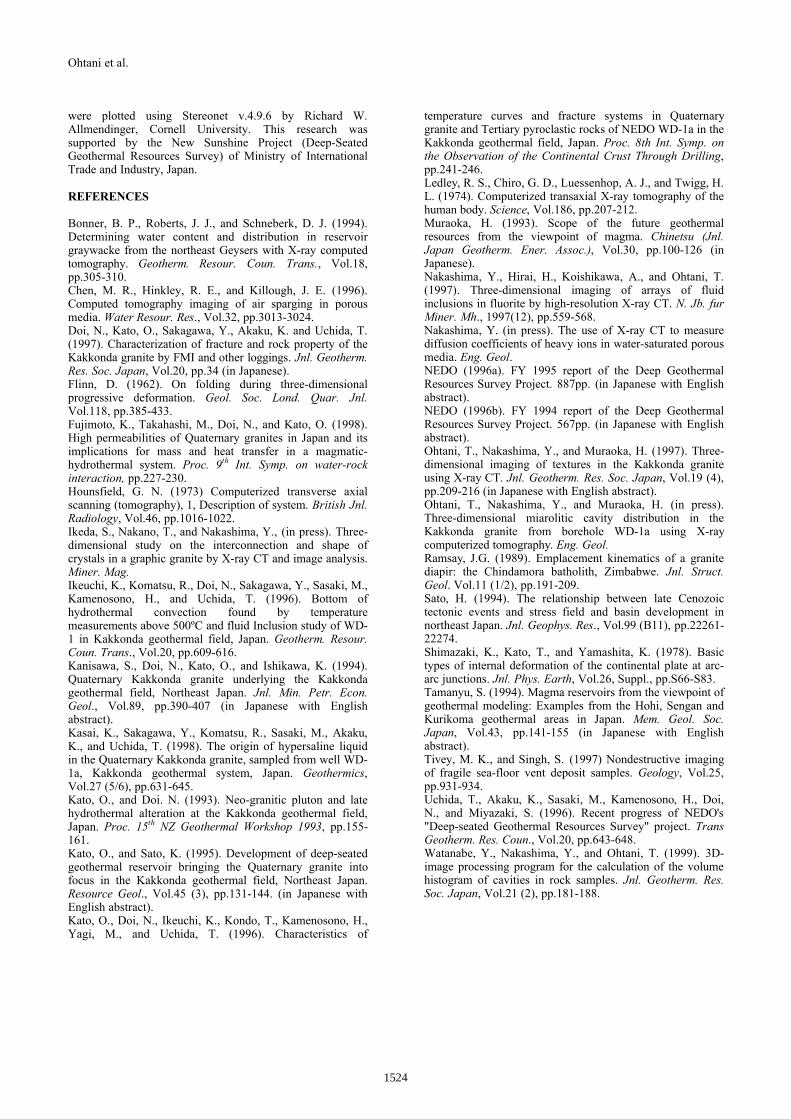
Fig. 7 shows perspectives of granite and visualizes miaroliticcavities from top, south and west. Only small cavities arerecognized from 2936.040 to 2936.136 m. Large cavitiesdevelop with the inclined boundary from 2936.350 to2936.446 m. The apparent boundary of two kinds of cavitiesstrikes N 16° E as shown solid lines in Fig. 7b. As correctedby drilling azimuth S 72.23° W and dip 10.27° at 2940 mdepth of WD-1a (NEDO, 1996a), the true boundary is N 20°E. Large cavities develop widely in 2936.822 to 2937.120 m.The boundary of large cavities appears again in 2937.121 to2937.220m. Thus, we conducted that the large cavitiesexisted between 2936.350 and 2937.220 m on the basis ofthe cavity distribution
5.2 Cavity size distribution
Cavity size distribution was calculated by the computerprogram of Watanabe et al. (1999). This program checks theconnectivity of adjacent voxels, carries out cluster labelingand calculates the volume of each cluster. The results of thecalculation are shown in Fig. 8. Although the cavities smallerthan 2mm3 are abundant in each interval, these may containnoise and error of the X-ray CT. A few small cavities appearin the interval from 2936.04 to 2936.14 m. Above 2936.722m, the cavities larger than 50 mm3 are very few and the total
1522
Ohtani et al.
number of cavities increases downward. The total number ofcavities is the greatest between 2936.722 and 2936.921 mand the proportion of cavities larger than 2 mm3 is 0.33 /cm3
in this interval. Below 2936.921 m, the total number ofcavities decreases downward slightly.
5.3 Porosity
Porosity of the Kakkonda granite was estimated from X-rayCT images as the ratio of the voxels with the CT number lessthan 1540 to those of the entire core. The estimated porositywas 0.02, 0.1 % in 2936.040 - 2936.136 m and 2936.350 -2936.446 m and 0.9, 0.7, 0.4, 0.5 and 0.5 % in each 0.1 mfrom 2936.722 to 2937.220 m respectively.
5.4 Cavity shape analysis
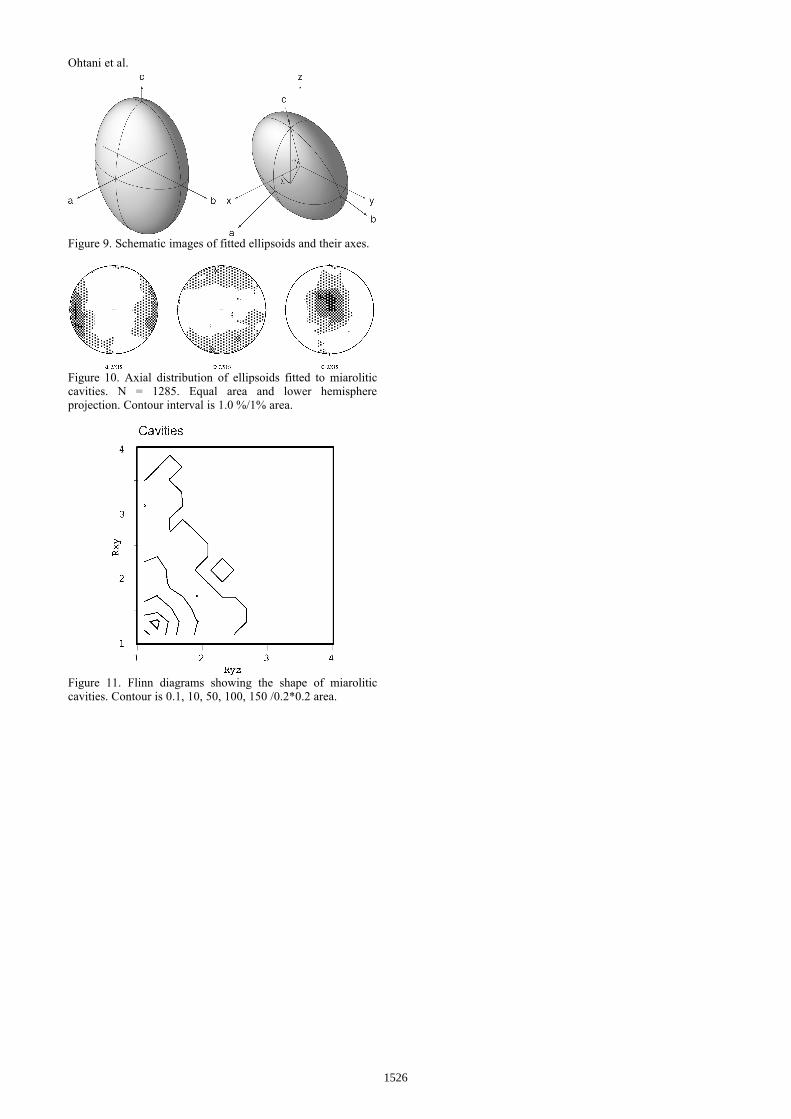
The shape of miarolitic cavities was estimated from thecontiguous CT images stacked at intervals of 1 mm bycomputer programs (Ikeda et al., in press). These programsanalyze connectivity of voxels with CT number betweengiven lower and upper values and perform cluster labeling ofreconstructed objects. Next, a program fits ellipsoids withthree arbitrary axes to these objects (Fig. 9) and outputslengths and directions of axes of each ellipsoid. The objectswith length parallel to the longitudinal axis of core shorterthan 3 voxels were excluded from the analysis, because suchobjects are too small to fit ellisoids.
The shortest (a), intermediate (b) and longest (c) axes ofellipsoids fitted to miarolitic cavities prefer to E-W, N-S andvertical respectively (Fig. 10). The flinn diagram (Flinn,1962) indicates most cavities exhibit the shape of planestrain type (Fig. 11). Although a few cavities seem to showprolate type, these may connect some cavities.
6. DISCUSSION
We performed X-ray CT imaging of the Kakkonda graniteand estimated the spatial distribution and morphologicalcharacteristics of the miarolitic cavities. The boundary ofsmall and large cavities was confirmed from Fig. 7, althoughit was difficult to estimate cavity distribution from coresurface observation. Three-dimensional X-ray CT imagingenabled us to visualize the structure of aggregate such asmiarolitic cavity zone.
The large cavity zone develops in the direction of N 20° E.This trend is consistent with that of the low-resistive zone(NEDO, 1996a) and isothermal contour at 500 m below sealevel (Tamanyu, 1994) and the hypocenter distribution ofmicroearthquakes in shallow depth from the Kakkondagranite (Uchida et al., 1996). As the high-porosity zone suchas the miarolitic cavity zone may develop into the geothermalreservoir, the direction of N 20° E may be a trend governingthe geothermal reservoir in the Kakkonda geothermal field.
Cavity size distribution (Fig. 8) indicates that large cavitiesare developed in depths where many cavities are scattered.The large and high-density cavity zone is limited below2936.772 m depth. Although the maximum cavity size isestimated to be 250 mm3, we must recognize the possibilitythat the apparent cavity size estimated by the X-ray CT islarger than the true size because the cavities may appear to
be connected to the neighboring cavities because of theresolution size of the X-ray CT.
The porosity of the Kakkonda granite estimated from the CTimage is lower than that from conventional method. NEDO(1996b) reported the porosity of the Kakkonda granite withno mesoscopic cavities is 1.98 % by water saturation method.The porosity reported by NEDO (1996b) is quite differentfrom 0.02 % by X-ray CT. This difference results from theresolution of X-ray CT. Although the cavities with a few mmof diameter are detectable by medical X-ray CT used in thisstudy, microcracks cannot be detected because of the spatialresolution of the medical X-ray CT. Thus the porosityestimated from X-ray CT would indicates a ratio of miaroliticcavities in the samples.
The industrial X-ray CT visualized grain boundary cracks.Fujimoto et al. (1998) showed from scanning electronmicroscope observation and permeability tests that grainboundary of the Kakkonda granite is not close and thepermeability is higher than other granites. These grainboundary cracks may be part of the storage of hydrothermalfluids. As the granite samples, however, were recovered fromthe deeper part with high temperature, we must consider theeffect of stress release and thermal expansion for propagatinggrain boundary cracks.
Preferred axial orientations of ellipsoids fitted to miaroliticcavities may be explained by the regional compression. Thepresent regional stress field in NE Japan is E-W compressionand reverse fault type (Shimazaki et al., 1978). One possiblereason why the shortest (a) axis of ellipsoids fitted to themiarolitic cavities trends E-W is that the cavities weredeformed by the same regional stress as the present one andcavities were shortened from the E-W direction. Althoughthe timing of cavity deformation is uncertain, the paleostressfield would be similar to the present one. Because theKakkonda granite is so young the regional stress field isassumed not to change since the emplacement of the granite.Sato (1994) reported that the regional stress field in NEJapan has been constant since 3.5 Ma.
Molten magma can not hold differential stress. The presentstress state in the Kakkonda granite is shown fromdifferential strain curve analysis (DSCA) (NEDO, 1996a)and drilling induced fractures (Doi et al., 1997). DSCAindicates that the amount of differential stress decreasetoward the deeper part. The estimated differential stress fromDSCA that σ3 / σ1 at the 1000 m depth in volcanic rock and2937 m depth in plutonic rock are 0.17 and 0.64 respectively.However, the development of drilling induced fractures wasobserved over the whole depth from volcanic rocks toplutonic rocks along the WD-1b which is a side-trackedborehole and this indicated that E-W compression isdominant. As the formation of drilling induced fracturesneeds large differential stress and drilling induced fracturesas an in-situ measurement is more reliable than DSCA as alaboratory experiment, the present stress state in theKakkonda granite would be E-W compressional with largedifferential stress. As some granite plutons exhibit magmaticfoliation (cf. Ramsay, 1989), granitic magma would holddifferential stress.
ACKNOWLEDGEMENTSWe thank the New Energy and Industrial TechnologyDevelopment Organization (NEDO) for their permission touse core samples and publish this paper. Orientation data
1523
Ohtani et al.
were plotted using Stereonet v.4.9.6 by Richard W.Allmendinger, Cornell University. This research wassupported by the New Sunshine Project (Deep-SeatedGeothermal Resources Survey) of Ministry of InternationalTrade and Industry, Japan.
REFERENCES
Bonner, B. P., Roberts, J. J., and Schneberk, D. J. (1994).Determining water content and distribution in reservoirgraywacke from the northeast Geysers with X-ray computedtomography. Geotherm. Resour. Coun. Trans., Vol.18,pp.305-310.Chen, M. R., Hinkley, R. E., and Killough, J. E. (1996).Computed tomography imaging of air sparging in porousmedia. Water Resour. Res., Vol.32, pp.3013-3024.Doi, N., Kato, O., Sakagawa, Y., Akaku, K. and Uchida, T.(1997). Characterization of fracture and rock property of theKakkonda granite by FMI and other loggings. Jnl. Geotherm.Res. Soc. Japan, Vol.20, pp.34 (in Japanese).Flinn, D. (1962). On folding during three-dimensionalprogressive deformation. Geol. Soc. Lond. Quar. Jnl.Vol.118, pp.385-433.Fujimoto, K., Takahashi, M., Doi, N., and Kato, O. (1998).High permeabilities of Quaternary granites in Japan and itsimplications for mass and heat transfer in a magmatic-hydrothermal system. Proc. 9th Int. Symp. on water-rockinteraction, pp.227-230.Hounsfield, G. N. (1973) Computerized transverse axialscanning (tomography), 1, Description of system. British Jnl.Radiology, Vol.46, pp.1016-1022.Ikeda, S., Nakano, T., and Nakashima, Y., (in press). Three-dimensional study on the interconnection and shape ofcrystals in a graphic granite by X-ray CT and image analysis.Miner. Mag.Ikeuchi, K., Komatsu, R., Doi, N., Sakagawa, Y., Sasaki, M.,Kamenosono, H., and Uchida, T. (1996). Bottom ofhydrothermal convection found by temperaturemeasurements above 500ºC and fluid Inclusion study of WD-1 in Kakkonda geothermal field, Japan. Geotherm. Resour.Coun. Trans., Vol.20, pp.609-616.Kanisawa, S., Doi, N., Kato, O., and Ishikawa, K. (1994).Quaternary Kakkonda granite underlying the Kakkondageothermal field, Northeast Japan. Jnl. Min. Petr. Econ.Geol., Vol.89, pp.390-407 (in Japanese with Englishabstract).Kasai, K., Sakagawa, Y., Komatsu, R., Sasaki, M., Akaku,K., and Uchida, T. (1998). The origin of hypersaline liquidin the Quaternary Kakkonda granite, sampled from well WD-1a, Kakkonda geothermal system, Japan. Geothermics,Vol.27 (5/6), pp.631-645.Kato, O., and Doi. N. (1993). Neo-granitic pluton and latehydrothermal alteration at the Kakkonda geothermal field,Japan. Proc. 15th NZ Geothermal Workshop 1993, pp.155-161.Kato, O., and Sato, K. (1995). Development of deep-seatedgeothermal reservoir bringing the Quaternary granite intofocus in the Kakkonda geothermal field, Northeast Japan.Resource Geol., Vol.45 (3), pp.131-144. (in Japanese withEnglish abstract).Kato, O., Doi, N., Ikeuchi, K., Kondo, T., Kamenosono, H.,Yagi, M., and Uchida, T. (1996). Characteristics of
temperature curves and fracture systems in Quaternarygranite and Tertiary pyroclastic rocks of NEDO WD-1a in theKakkonda geothermal field, Japan. Proc. 8th Int. Symp. onthe Observation of the Continental Crust Through Drilling,pp.241-246.Ledley, R. S., Chiro, G. D., Luessenhop, A. J., and Twigg, H.L. (1974). Computerized transaxial X-ray tomography of thehuman body. Science, Vol.186, pp.207-212.Muraoka, H. (1993). Scope of the future geothermalresources from the viewpoint of magma. Chinetsu (Jnl.Japan Geotherm. Ener. Assoc.), Vol.30, pp.100-126 (inJapanese).Nakashima, Y., Hirai, H., Koishikawa, A., and Ohtani, T.(1997). Three-dimensional imaging of arrays of fluidinclusions in fluorite by high-resolution X-ray CT. N. Jb. furMiner. Mh., 1997(12), pp.559-568.Nakashima, Y. (in press). The use of X-ray CT to measurediffusion coefficients of heavy ions in water-saturated porousmedia. Eng. Geol.NEDO (1996a). FY 1995 report of the Deep GeothermalResources Survey Project. 887pp. (in Japanese with Englishabstract).NEDO (1996b). FY 1994 report of the Deep GeothermalResources Survey Project. 567pp. (in Japanese with Englishabstract).Ohtani, T., Nakashima, Y., and Muraoka, H. (1997). Three-dimensional imaging of textures in the Kakkonda graniteusing X-ray CT. Jnl. Geotherm. Res. Soc. Japan, Vol.19 (4),pp.209-216 (in Japanese with English abstract).Ohtani, T., Nakashima, Y., and Muraoka, H. (in press).Three-dimensional miarolitic cavity distribution in theKakkonda granite from borehole WD-1a using X-raycomputerized tomography. Eng. Geol.Ramsay, J.G. (1989). Emplacement kinematics of a granitediapir: the Chindamora batholith, Zimbabwe. Jnl. Struct.Geol. Vol.11 (1/2), pp.191-209.Sato, H. (1994). The relationship between late Cenozoictectonic events and stress field and basin development innortheast Japan. Jnl. Geophys. Res., Vol.99 (B11), pp.22261-22274.Shimazaki, K., Kato, T., and Yamashita, K. (1978). Basictypes of internal deformation of the continental plate at arc-arc junctions. Jnl. Phys. Earth, Vol.26, Suppl., pp.S66-S83.Tamanyu, S. (1994). Magma reservoirs from the viewpoint ofgeothermal modeling: Examples from the Hohi, Sengan andKurikoma geothermal areas in Japan. Mem. Geol. Soc.Japan, Vol.43, pp.141-155 (in Japanese with Englishabstract).Tivey, M. K., and Singh, S. (1997) Nondestructive imagingof fragile sea-floor vent deposit samples. Geology, Vol.25,pp.931-934.Uchida, T., Akaku, K., Sasaki, M., Kamenosono, H., Doi,N., and Miyazaki, S. (1996). Recent progress of NEDO's"Deep-seated Geothermal Resources Survey" project. TransGeotherm. Res. Coun., Vol.20, pp.643-648.Watanabe, Y., Nakashima, Y., and Ohtani, T. (1999). 3D-image processing program for the calculation of the volumehistogram of cavities in rock samples. Jnl. Geotherm. Res.Soc. Japan, Vol.21 (2), pp.181-188.
1524
Ohtani et al.
Figure 1. Location of the Kakkonda geothermal field and thedrill site of the borehole WD-1a.
Figure 2. Geological profile of the Kakkonda geothermal fieldand the traces of WD-1a and WD-1b (modified from Kato etal., 1996 and Kasai et al., 1998).
Figure 3. Outline of third-generation X-ray CT scanner
Figure 4. (a) X-ray CT image of a granite from WD-1a at2936.445 m depth. (b) The photograph of polished surface.
The slice positions of a and b are identical to each other. Bothimages are taken from downside. a: Miarolitic cavity, b:Enclave, c: Mafic mineral.
Figure 5. Industrial X-ray CT images. (left) Microcracks filledby air. (right) Microcracks enhanced by saturated KI solution.
Figure 6. Binary three-dimensional X-ray CT image. Gray andlight gray indicate the miarolitic cavities and the surface ofcore sample, respectively. The diameter and length of the coresample is 10.15 cm and 9.6 cm, respectively.
a b cN
E
S
W
N
E
S
W
N
E
S
W
up
down
up
down
up
down
up
down
up
down
up
down
EWN S EWN S EWN S
2936.040-2936.136m 2936.350-2936.446m 2937.000-2937.096m
Figure 7. Binary perspectives of miarolitic cavities from upside(left), south (center) and west (right). Solid lines indicate theboundary of small and large cavities.
Figure 8. Histogram of cavity size distribution.
1525
Ohtani et al.
Figure 9. Schematic images of fitted ellipsoids and their axes.
Figure 10. Axial distribution of ellipsoids fitted to miaroliticcavities. N = 1285. Equal area and lower hemisphereprojection. Contour interval is 1.0 %/1% area.
Figure 11. Flinn diagrams showing the shape of miaroliticcavities. Contour is 0.1, 10, 50, 100, 150 /0.2*0.2 area.
1526