x4l sdit - survey data in teaching a resource for students and teachers module 2
TRANSCRIPT

X4L SDiT - Survey Data in Teaching
A resource for students and teachers
Module 2
UK Data Archive 2003
Module 2
How much crime is there? The British Crime Survey: Trends and Methodology

UK Data Archive 2003
In this Module:
• There are different ways to record crime• The official report says that although crime is
really falling, the public think it is increasing• Actually when we look at time graphs the
position is complex • A usual explanation is that the media create
unnecessary worry• There are other factors involved though, such
as social class

UK Data Archive 2003
Section A: Measuring Crime Rates Differently
• The British Crime Survey (BCS) is a survey of a sample of the population that asks respondents in England and Wales about their personal experiences of crime over the previous 12 months. It is thus sometimes referred to as a victimisation survey.
• Respondents provide answers to as set of questions to an interviewer, the individual details of which are confidential, that is they cannot be passed on to any other organisations, for example, like the Police.
UK Data Archive 2003
Measuring Crime Rates Differently
• The BCS is considered by many experts to be more comprehensive and consistent than the police figures and thus a better indicator of the true level of crime in England and Wales.

UK Data Archive 2003
Measuring Crime Rates Differently
“For the offences it covers, and the victims within its scope, the BCS gives a more complete estimate of crime in England and Wales since it covers both unreported and unrecorded crime and provides more reliable data on trends.”
(Simmons and Dodd p. 1)
UK Data Archive 2003
Measuring Crime Rates Differently
“The BCS measures the amount of crime in England and Wales by asking people about crimes they have experienced in the last year. The BCS includes crimes which are not reported to the police, so it is an important alternative to police records. Victims do not report crime for various reasons. Without the BCS the government would have no information on these unreported crimes.”
(Home Office Website)
UK Data Archive 2003
Measuring Crime Rates Differently
The British Crime Survey provides just one measure of crime in England and Wales. Remember, the BCS asks adult respondents whether they themselveshave been a victim of crime in the last 12 months. However, not all crimes are recorded. Box 2.1 sets out what are and what are not counted.
UK Data Archive 2003
Box 2.1: Comparison of BCS and
Police Crime Comparing the British Crime Survey and police recorded crime
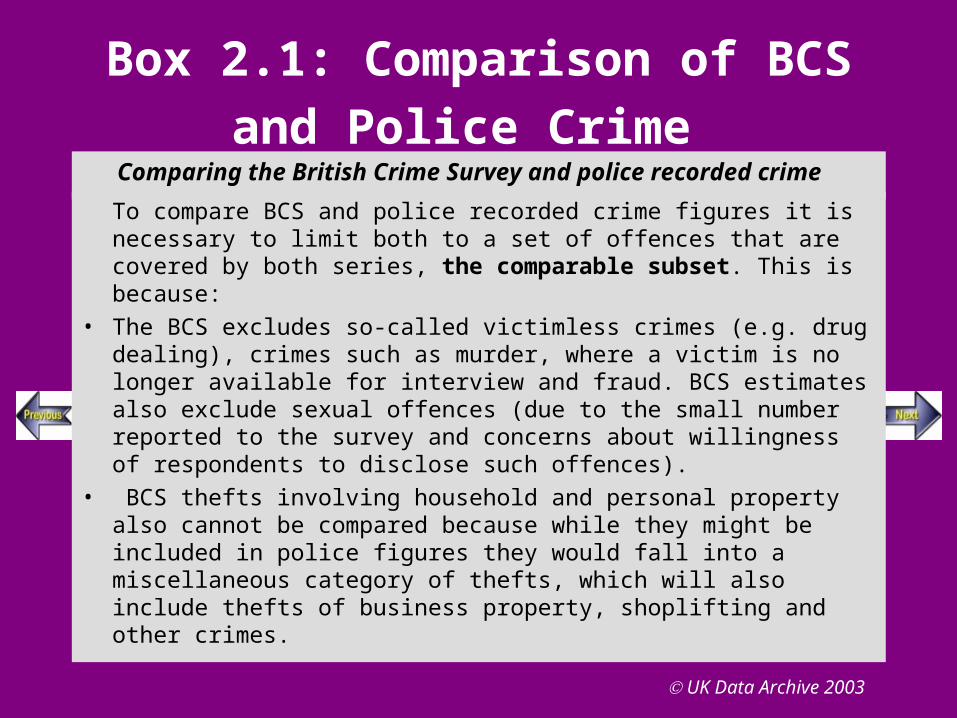
To compare BCS and police recorded crime figures it is necessary to limit both to a set of offences that are covered by both series, the comparable subset. This is because:
• The BCS excludes so-called victimless crimes (e.g. drug dealing), crimes such as murder, where a victim is no longer available for interview and fraud. BCS estimates also exclude sexual offences (due to the small number reported to the survey and concerns about willingness of respondents to disclose such offences).
• BCS thefts involving household and personal property also cannot be compared because while they might be included in police figures they would fall into a miscellaneous category of thefts, which will also include thefts of business property, shoplifting and other crimes.
UK Data Archive 2003
Box 2.1: Comparison of BCS and
Police Crime Comparing the British Crime Survey and police recorded crime
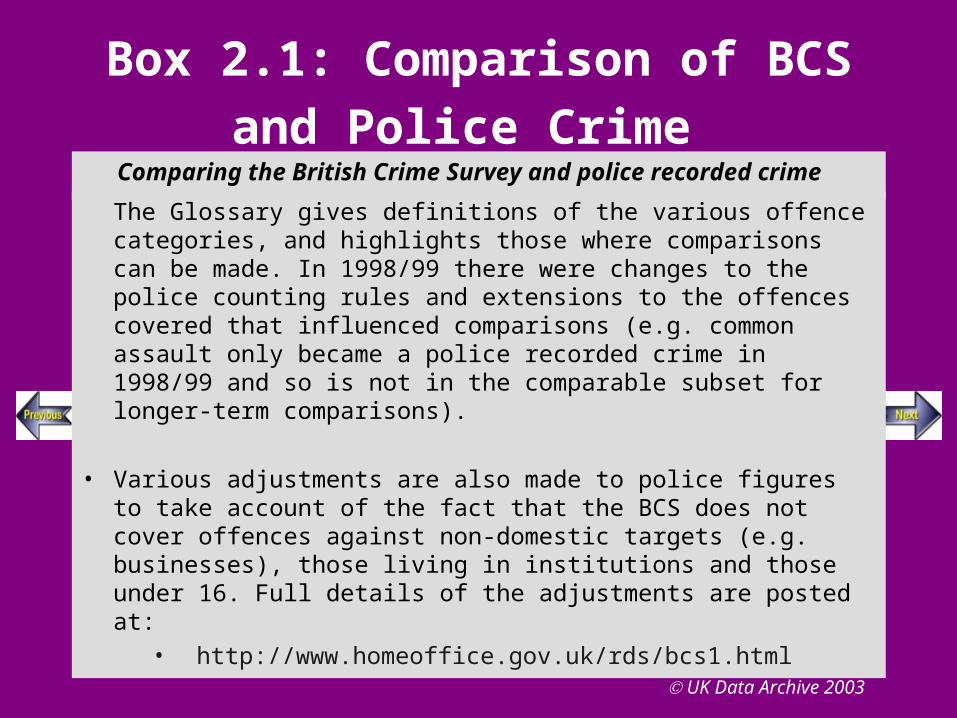
The Glossary gives definitions of the various offence categories, and highlights those where comparisons can be made. In 1998/99 there were changes to the police counting rules and extensions to the offences covered that influenced comparisons (e.g. common assault only became a police recorded crime in 1998/99 and so is not in the comparable subset for longer-term comparisons).
• Various adjustments are also made to police figures to take account of the fact that the BCS does not cover offences against non-domestic targets (e.g. businesses), those living in institutions and those under 16. Full details of the adjustments are posted at:
• http://www.homeoffice.gov.uk/rds/bcs1.html
UK Data Archive 2003
Box 2.1: Comparison of BCS and
Police Crime Comparing the British Crime Survey and police recorded crime
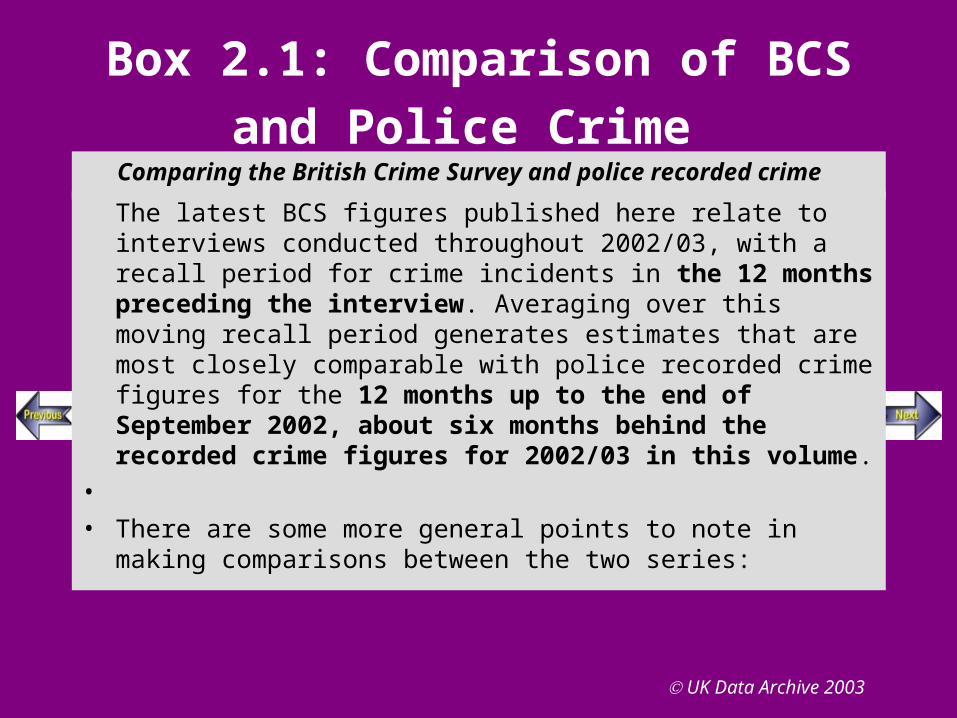
The latest BCS figures published here relate to interviews conducted throughout 2002/03, with a recall period for crime incidents in the 12 months preceding the interview. Averaging over this moving recall period generates estimates that are most closely comparable with police recorded crime figures for the 12 months up to the end of September 2002, about six months behind the recorded crime figures for 2002/03 in this volume.
• • There are some more general points to note in making
comparisons between the two series:
UK Data Archive 2003
Box 2.1: Comparison of BCS and
Police Crime Comparing the British Crime Survey and police recorded crime
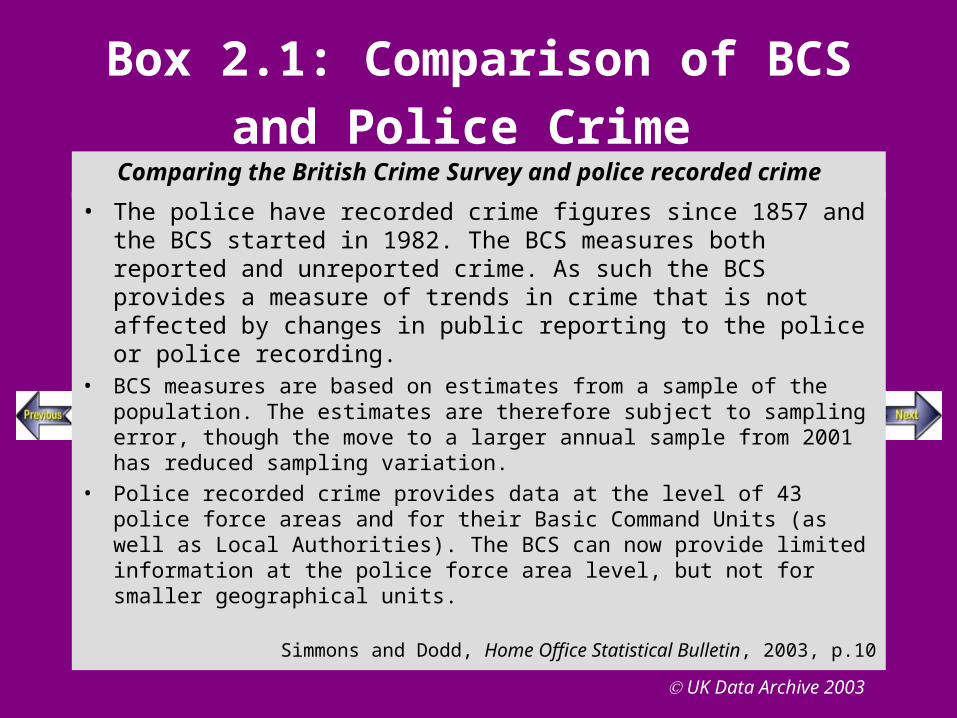
• The police have recorded crime figures since 1857 and the BCS started in 1982. The BCS measures both reported and unreported crime. As such the BCS provides a measure of trends in crime that is not affected by changes in public reporting to the police or police recording.
• BCS measures are based on estimates from a sample of the population. The estimates are therefore subject to sampling error, though the move to a larger annual sample from 2001 has reduced sampling variation.
• Police recorded crime provides data at the level of 43 police force areas and for their Basic Command Units (as well as Local Authorities). The BCS can now provide limited information at the police force area level, but not for smaller geographical units.
Simmons and Dodd, Home Office Statistical Bulletin, 2003, p.10

UK Data Archive 2003
Q1. Using the information in box 2.1 answer the following question
a. Is burglary included in the British Crime survey? Yes No
Comparing the British Crime Survey and police recorded crime
To compare BCS and police recorded crime figures it is necessary to limit both to a set of offences that are covered by both series, the comparable subset. This is because:
• The BCS excludes so-called victimless crimes (e.g. drug dealing), crimes such as murder, where a victim is no longer available for interview and fraud. BCS estimates also exclude sexual offences (due to the small number reported to the survey and concerns about willingness of respondents to disclose such offences).
• BCS thefts involving household and personal property also cannot be compared because while they might be included in police figures they would fall into a miscellaneous category of thefts, which will also include thefts of business property, shoplifting and other crimes.
UK Data Archive 2003
Q1. Using the information in box 2.1 answer the following question
a. Is burglary included in the British Crime survey? Yes
UK Data Archive 2003
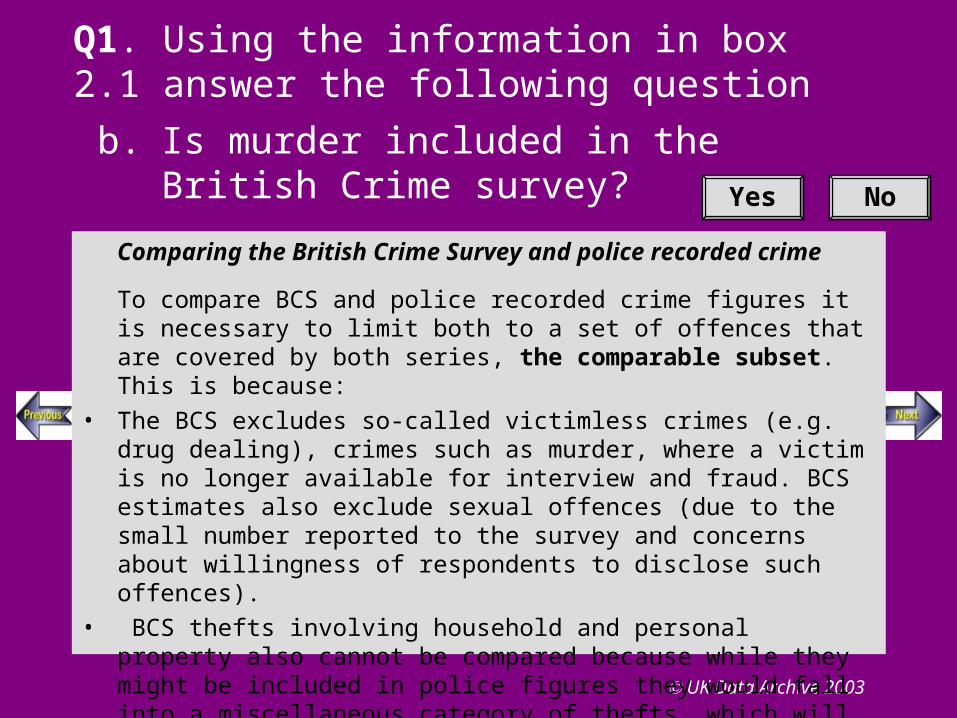
Q1. Using the information in box 2.1 answer the following question
b. Is murder included in the British Crime survey? NoYes
Comparing the British Crime Survey and police recorded crime
To compare BCS and police recorded crime figures it is necessary to limit both to a set of offences that are covered by both series, the comparable subset. This is because:
• The BCS excludes so-called victimless crimes (e.g. drug dealing), crimes such as murder, where a victim is no longer available for interview and fraud. BCS estimates also exclude sexual offences (due to the small number reported to the survey and concerns about willingness of respondents to disclose such offences).
• BCS thefts involving household and personal property also cannot be compared because while they might be included in police figures they would fall into a miscellaneous category of thefts, which will also include thefts of business property, shoplifting and other crimes.
UK Data Archive 2003
Q1. Using the information in box 2.1 answer the following question
b. Is murder included in the British Crime survey?
(The victim cannot report the crime)
No
UK Data Archive 2003
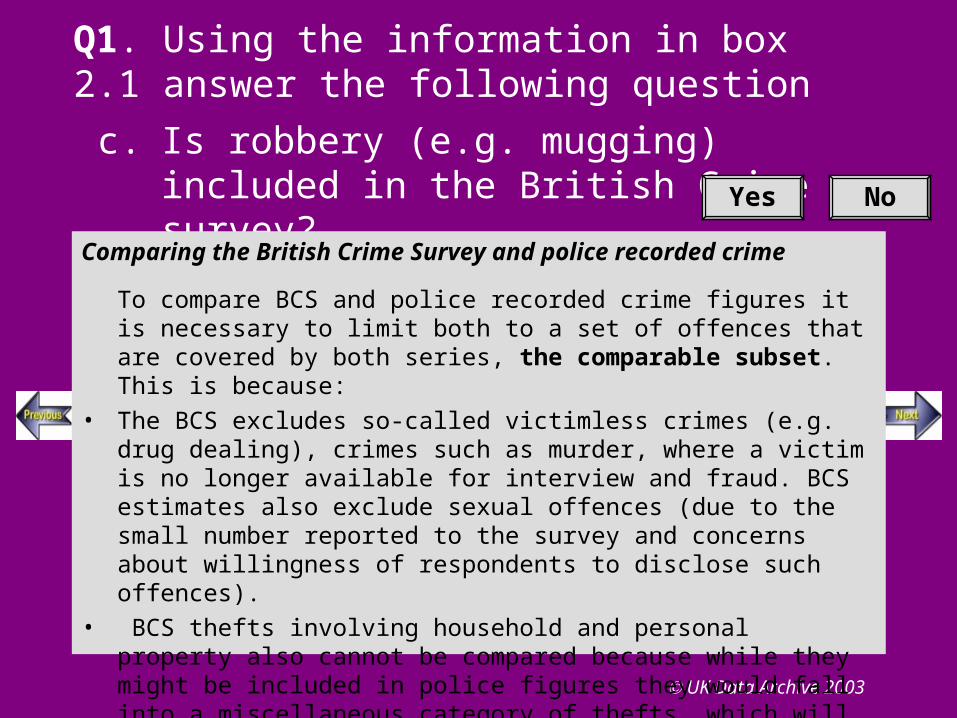
Q1. Using the information in box 2.1 answer the following question
c. Is robbery (e.g. mugging) included in the British Crime survey? NoYes
Comparing the British Crime Survey and police recorded crime
To compare BCS and police recorded crime figures it is necessary to limit both to a set of offences that are covered by both series, the comparable subset. This is because:
• The BCS excludes so-called victimless crimes (e.g. drug dealing), crimes such as murder, where a victim is no longer available for interview and fraud. BCS estimates also exclude sexual offences (due to the small number reported to the survey and concerns about willingness of respondents to disclose such offences).
• BCS thefts involving household and personal property also cannot be compared because while they might be included in police figures they would fall into a miscellaneous category of thefts, which will also include thefts of business property, shoplifting and other crimes.
UK Data Archive 2003
Q1. Using the information in box 2.1 answer the following question
c. Is robbery (e.g. mugging) included in the British Crime survey? Yes

UK Data Archive 2003
Q1. Using the information in box 2.1 answer the following question
d. Is rape and other sexual offences included in the British Crime survey? NoYes
Comparing the British Crime Survey and police recorded crime
To compare BCS and police recorded crime figures it is necessary to limit both to a set of offences that are covered by both series, the comparable subset. This is because:
• The BCS excludes so-called victimless crimes (e.g. drug dealing), crimes such as murder, where a victim is no longer available for interview and fraud. BCS estimates also exclude sexual offences (due to the small number reported to the survey and concerns about willingness of respondents to disclose such offences).
• BCS thefts involving household and personal property also cannot be compared because while they might be included in police figures they would fall into a miscellaneous category of thefts, which will also include thefts of business property, shoplifting and other crimes.
UK Data Archive 2003
Q1. Using the information in box 2.1 answer the following question
d. Is rape and other sexual offences included in the British Crime survey?
(Individuals are unlikely to volunteer this information)
No
UK Data Archive 2003
Q1. Using the information in box 2.1 answer the following question
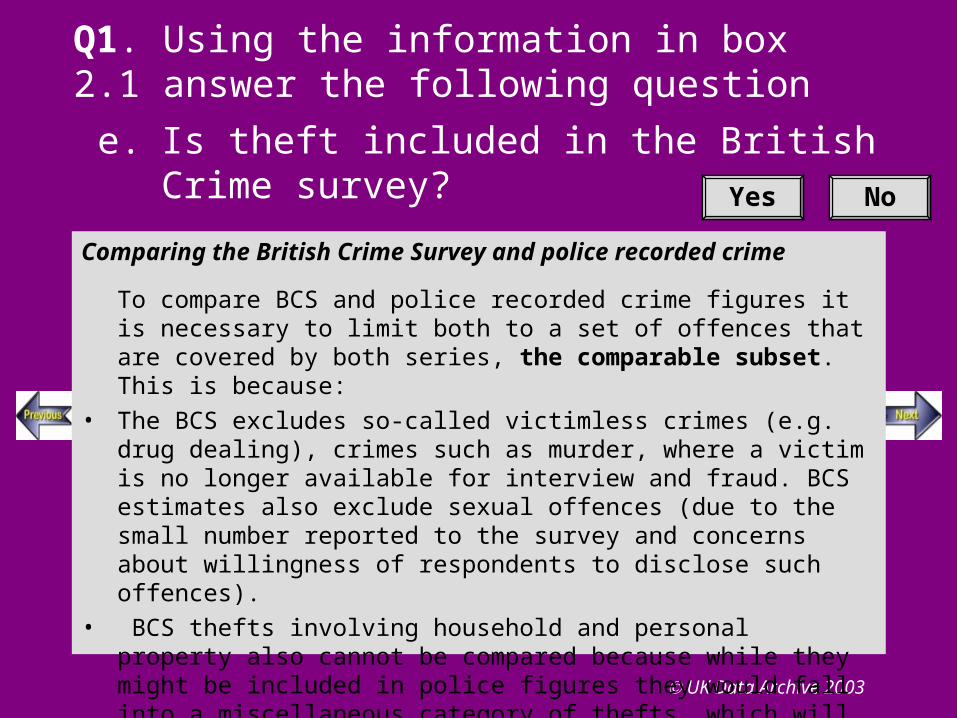
e. Is theft included in the British Crime survey?
NoYes
Comparing the British Crime Survey and police recorded crime
To compare BCS and police recorded crime figures it is necessary to limit both to a set of offences that are covered by both series, the comparable subset. This is because:
• The BCS excludes so-called victimless crimes (e.g. drug dealing), crimes such as murder, where a victim is no longer available for interview and fraud. BCS estimates also exclude sexual offences (due to the small number reported to the survey and concerns about willingness of respondents to disclose such offences).
• BCS thefts involving household and personal property also cannot be compared because while they might be included in police figures they would fall into a miscellaneous category of thefts, which will also include thefts of business property, shoplifting and other crimes.

UK Data Archive 2003
Q1. Using the information in box 2.1 answer the following question
e. Is theft included in the British Crime survey?
Yes
UK Data Archive 2003
Q1. Using the information in box 2.1 answer the following question
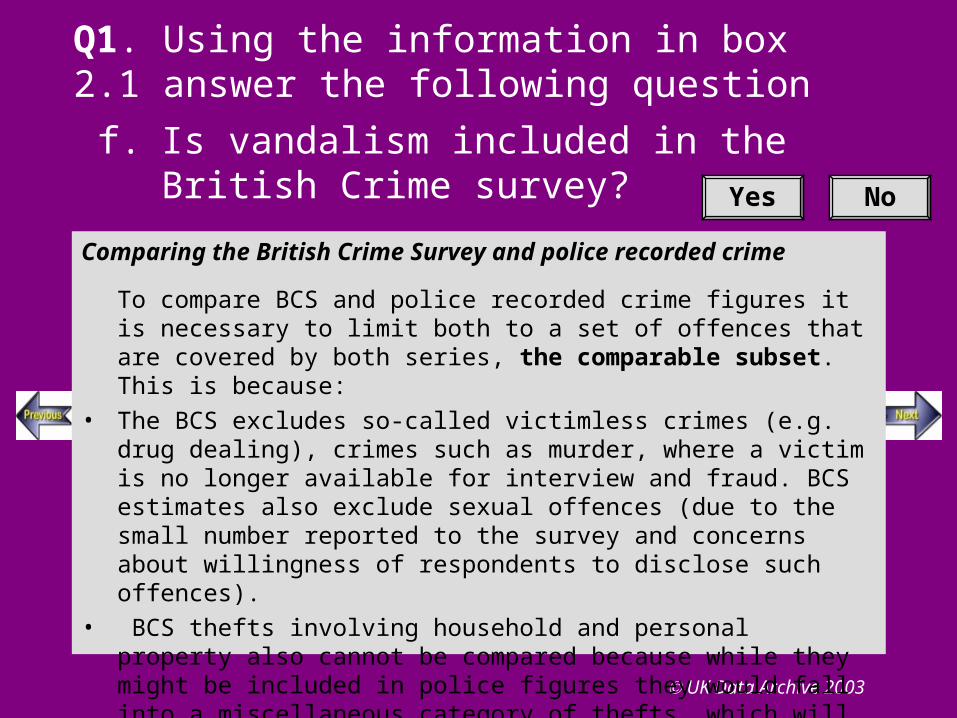
f. Is vandalism included in the British Crime survey? NoYes
Comparing the British Crime Survey and police recorded crime
To compare BCS and police recorded crime figures it is necessary to limit both to a set of offences that are covered by both series, the comparable subset. This is because:
• The BCS excludes so-called victimless crimes (e.g. drug dealing), crimes such as murder, where a victim is no longer available for interview and fraud. BCS estimates also exclude sexual offences (due to the small number reported to the survey and concerns about willingness of respondents to disclose such offences).
• BCS thefts involving household and personal property also cannot be compared because while they might be included in police figures they would fall into a miscellaneous category of thefts, which will also include thefts of business property, shoplifting and other crimes.

UK Data Archive 2003
Q1. Using the information in box 2.1 answer the following question
f. Is vandalism included in the British Crime survey? Yes

UK Data Archive 2003
Q1. Using the information in box 2.1 answer the following question
g. Are shoplifting and fraud included in the British Crime survey? NoYes
Comparing the British Crime Survey and police recorded crime
To compare BCS and police recorded crime figures it is necessary to limit both to a set of offences that are covered by both series, the comparable subset. This is because:
• The BCS excludes so-called victimless crimes (e.g. drug dealing), crimes such as murder, where a victim is no longer available for interview and fraud. BCS estimates also exclude sexual offences (due to the small number reported to the survey and concerns about willingness of respondents to disclose such offences).
• BCS thefts involving household and personal property also cannot be compared because while they might be included in police figures they would fall into a miscellaneous category of thefts, which will also include thefts of business property, shoplifting and other crimes.

UK Data Archive 2003
Q1. Using the information in box 2.1 answer the following question
g. Are shoplifting and fraud included in the British Crime survey?
(The crime is not committed against an individual, but against a corporation)
No
UK Data Archive 2003
Q1. Using the information in box 2.1 answer the following question
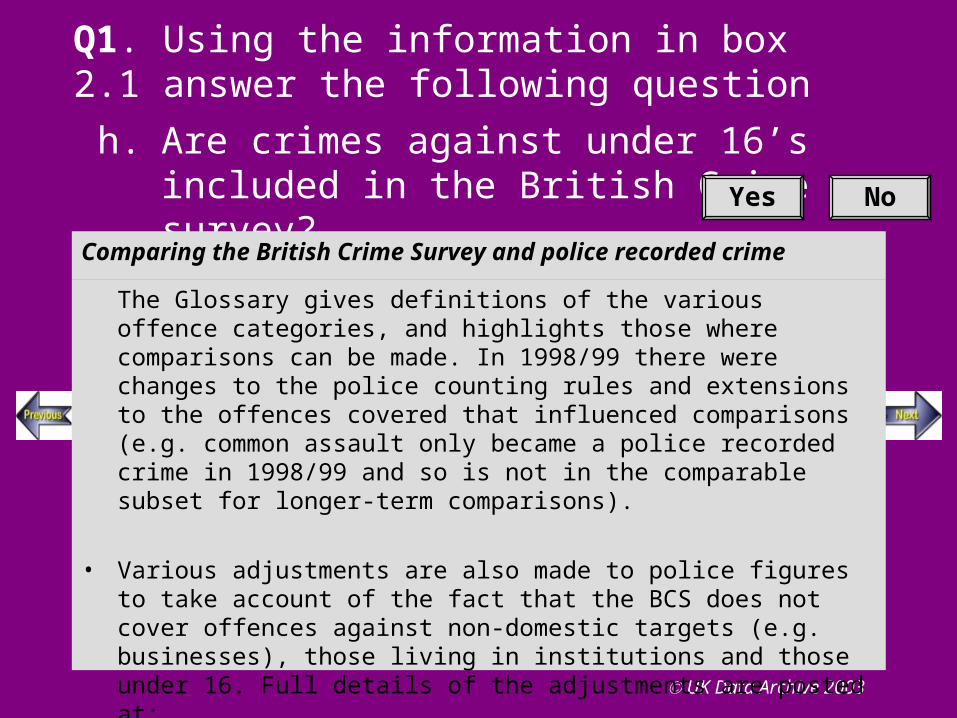
h. Are crimes against under 16’s included in the British Crime survey? NoYes
The Glossary gives definitions of the various offence categories, and highlights those where comparisons can be made. In 1998/99 there were changes to the police counting rules and extensions to the offences covered that influenced comparisons (e.g. common assault only became a police recorded crime in 1998/99 and so is not in the comparable subset for longer-term comparisons).
• Various adjustments are also made to police figures to take account of the fact that the BCS does not cover offences against non-domestic targets (e.g. businesses), those living in institutions and those under 16. Full details of the adjustments are posted at:
• http://www.homeoffice.gov.uk/rds/bcs1.html
Comparing the British Crime Survey and police recorded crime

UK Data Archive 2003
Q1. Using the information in box 2.1 answer the following question
h. Are crimes against under 16’s included in the British Crime survey? No
(BCS only surveys adults over 16)

UK Data Archive 2003
Q1. Using the information in box 2.1 answer the following question
i. Is drug dealing included in the British Crime survey? NoYes
Comparing the British Crime Survey and police recorded crime
To compare BCS and police recorded crime figures it is necessary to limit both to a set of offences that are covered by both series, the comparable subset. This is because:
• The BCS excludes so-called victimless crimes (e.g. drug dealing), crimes such as murder, where a victim is no longer available for interview and fraud. BCS estimates also exclude sexual offences (due to the small number reported to the survey and concerns about willingness of respondents to disclose such offences).
• BCS thefts involving household and personal property also cannot be compared because while they might be included in police figures they would fall into a miscellaneous category of thefts, which will also include thefts of business property, shoplifting and other crimes.

UK Data Archive 2003
Q1. Using the information in box 2.1 answer the following question
i. Is drug dealing included in the British Crime survey? No
(An alleged victimless crime)

UK Data Archive 2003
SECTION B, Trends in Crime 1981-2003
• The top line in the graph in Figure 2.1 sets out the number of crimes reported in the British Crime Survey.
• Let us contrast these with the figures that we saw in Module 1 which were crimes recorded by the Police over the same period, set out on the bottom line in the graph.

Figure 2.1: Trends in Crime 1981:2003
02468
101214161820
19
81
19
82
19
83
19
84
19
85
19
86
19
87
19
88
19
89
19
90
19
91
19
92
19
93
19
94
19
95
19
96
19
97
19
97
/8
19
98
/9
19
99
/00
20
00
/01
20
01
/02
20
02
/3
Cri
me
s (
mill
ion
s)
BCS Reported old rules new rules adjusted
Comparing the two trends above, answer the following questions:
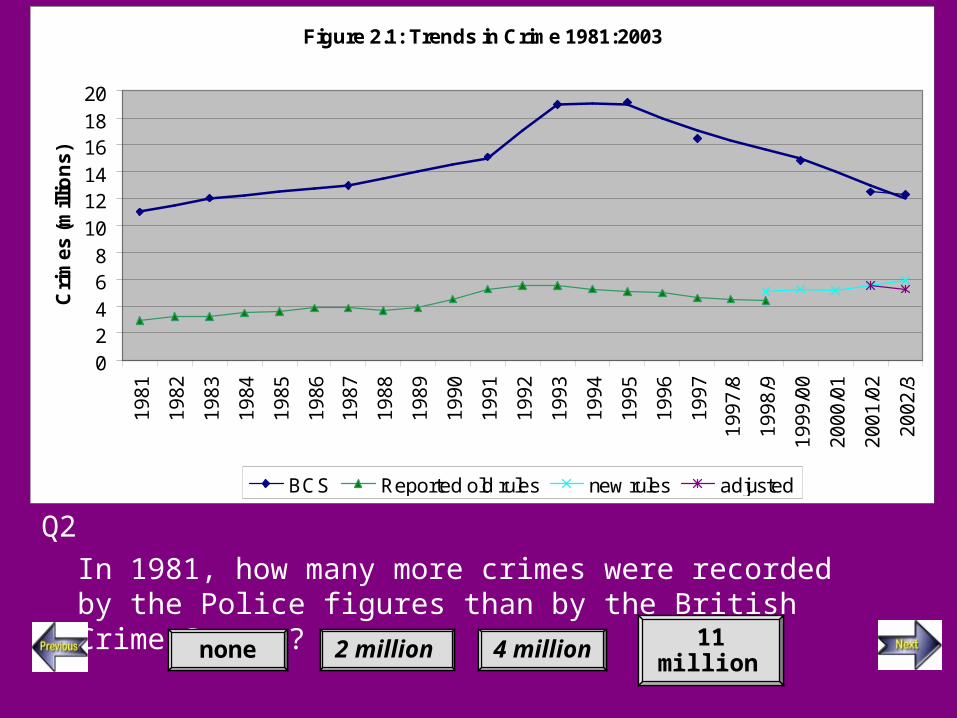
Figure 2.1: Trends in Crime 1981:2003
02468
101214161820
19
81
19
82
19
83
19
84
19
85
19
86
19
87
19
88
19
89
19
90
19
91
19
92
19
93
19
94
19
95
19
96
19
97
19
97
/8
19
98
/9
19
99
/00
20
00
/01
20
01
/02
20
02
/3
Cri
me
s (
mill
ion
s)
BCS Reported old rules new rules adjusted
Q2
In 1981, how many more crimes were recorded by the Police figures than by the British Crime Survey?
none 2 million 4 million 11 million
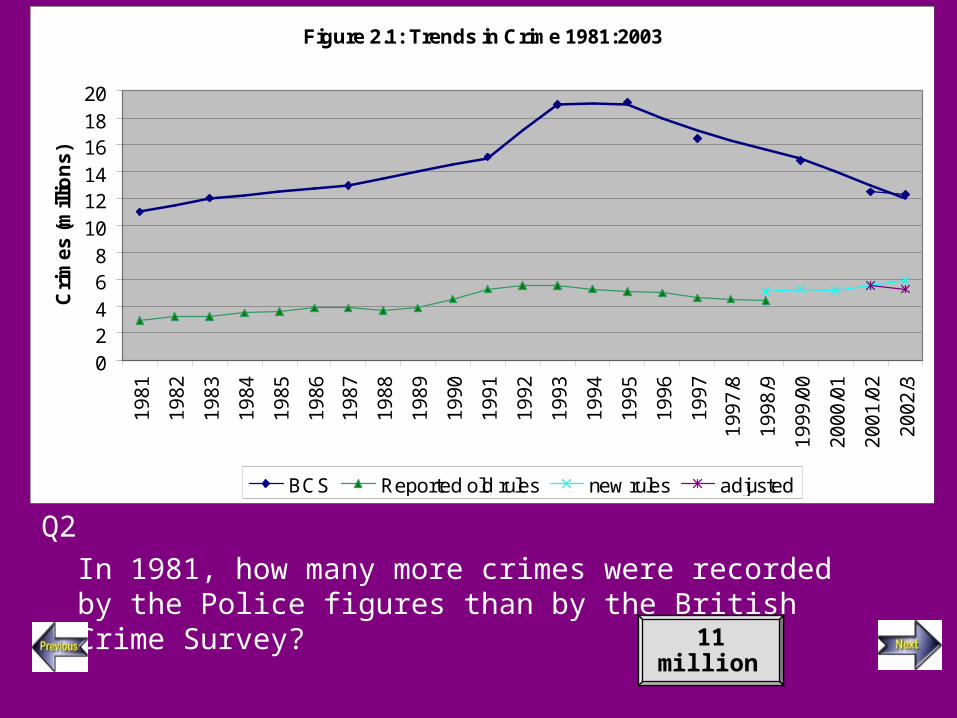
Figure 2.1: Trends in Crime 1981:2003
02468
101214161820
19
81
19
82
19
83
19
84
19
85
19
86
19
87
19
88
19
89
19
90
19
91
19
92
19
93
19
94
19
95
19
96
19
97
19
97
/8
19
98
/9
19
99
/00
20
00
/01
20
01
/02
20
02
/3
Cri
me
s (
mill
ion
s)
BCS Reported old rules new rules adjusted
Q2
In 1981, how many more crimes were recorded by the Police figures than by the British Crime Survey?
11 million
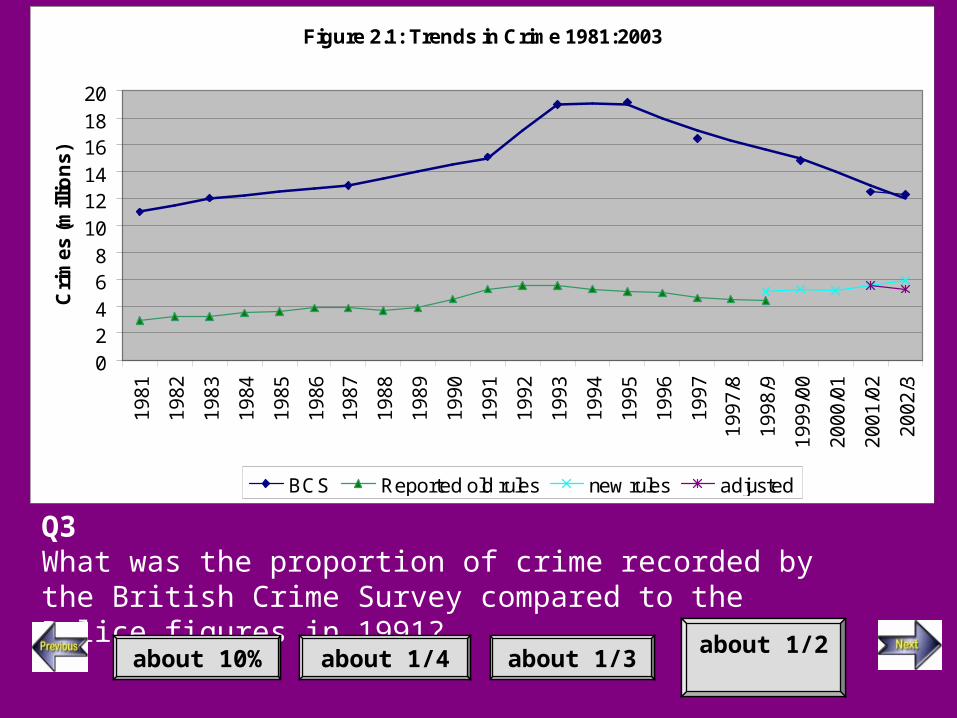
Figure 2.1: Trends in Crime 1981:2003
02468
101214161820
19
81
19
82
19
83
19
84
19
85
19
86
19
87
19
88
19
89
19
90
19
91
19
92
19
93
19
94
19
95
19
96
19
97
19
97
/8
19
98
/9
19
99
/00
20
00
/01
20
01
/02
20
02
/3
Cri
me
s (
mill
ion
s)
BCS Reported old rules new rules adjusted
Q3What was the proportion of crime recorded by the British Crime Survey compared to the Police figures in 1991?
about 10% about 1/4 about 1/3 about 1/2

Figure 2.1: Trends in Crime 1981:2003
02468
101214161820
19
81
19
82
19
83
19
84
19
85
19
86
19
87
19
88
19
89
19
90
19
91
19
92
19
93
19
94
19
95
19
96
19
97
19
97
/8
19
98
/9
19
99
/00
20
00
/01
20
01
/02
20
02
/3
Cri
me
s (
mill
ion
s)
BCS Reported old rules new rules adjusted
Q3What was the proportion of crime recorded by the British Crime Survey compared to the Police figures in 1991?
about 1/3

Figure 2.1: Trends in Crime 1981:2003
02468
101214161820
19
81
19
82
19
83
19
84
19
85
19
86
19
87
19
88
19
89
19
90
19
91
19
92
19
93
19
94
19
95
19
96
19
97
19
97
/8
19
98
/9
19
99
/00
20
00
/01
20
01
/02
20
02
/3
Cri
me
s (
mill
ion
s)
BCS Reported old rules new rules adjusted
Q4 Look at the trends shown in the BCS and in the Recorded Crime figures. Are they:
Broadly similar
Significantly different
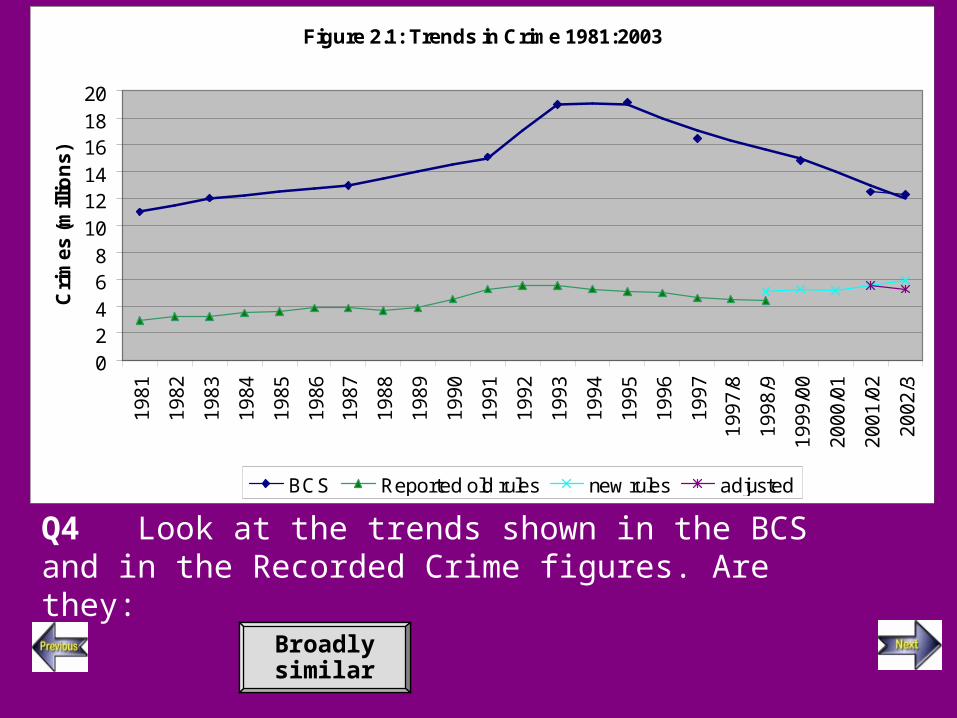
Figure 2.1: Trends in Crime 1981:2003
02468
101214161820
19
81
19
82
19
83
19
84
19
85
19
86
19
87
19
88
19
89
19
90
19
91
19
92
19
93
19
94
19
95
19
96
19
97
19
97
/8
19
98
/9
19
99
/00
20
00
/01
20
01
/02
20
02
/3
Cri
me
s (
mill
ion
s)
BCS Reported old rules new rules adjusted
Q4 Look at the trends shown in the BCS and in the Recorded Crime figures. Are they:
Broadly similar
UK Data Archive 2003
What do you think?
What might be the main reasons for the difference between the BCS and Recorded Crime Figures?
UK Data Archive 2003
Version 1: Moral panic
The report Crime in England and Wales, published by the Home Office, suggests that
“In spite of the significant falls in the main volume crimes in recent years, almost three-quarters of the public still believe that the national crime rate has been rising” (Introduction).
Simmonds J and Dodd T (eds) Crime in England and Wales2002/2003, Home Office Statistical Bulletin 07/03, London: HMSO, 2003 http://www.homeoffice.gov.uk/rds/crimeew0203.html
Simmonds J and Dodd T (eds) Crime in England and Wales2002/2003, Home Office Statistical Bulletin 07/03, London: HMSO, 2003 http://www.homeoffice.gov.uk/rds/crimeew0203.html

UK Data Archive 2003
This statement involves two claims:
1.The level of crime has indeed been falling2.The public hold mistaken views about crime levels
This module will use data to examine these claims. However, it will also be seen that the use of data cannot be separated from theories and concepts about how crime affects society; data analysis is not ‘neutral’ in this sense.
0
5
10
15
20
25
1981
1983
1987
1991
1993
1995
1997
1999
2001
/2
2002
/3
crim
es (m
illio
ns)
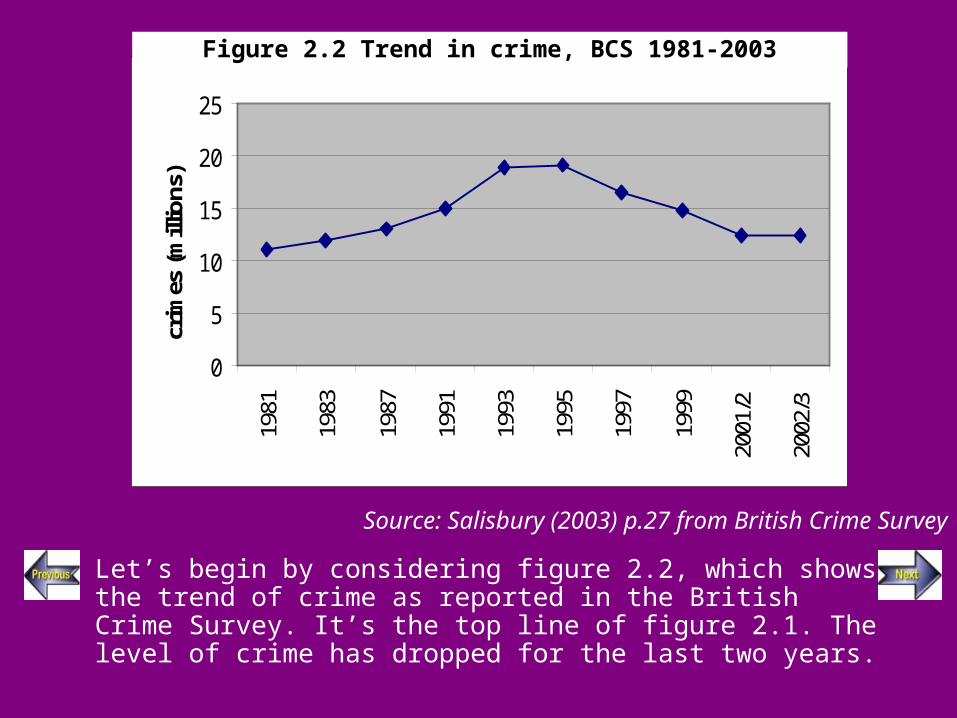
Let’s begin by considering figure 2.2, which shows the trend of crime as reported in the British Crime Survey. It’s the top line of figure 2.1. The level of crime has dropped for the last two years.
Source: Salisbury (2003) p.27 from British Crime Survey
Figure 2.2 Trend in crime, BCS 1981-2003

Now look at figure 2.3, which shows the beliefs respondents had about the change in crime:
Figure 2.3 Beliefs about crime 1996-2003
30 3325 30
2934
3134
4638
2935
0
10
20
30
40
50
60
70
80
90
100
1996 1998 2000 2001 2001/2 2002/3
% b
elie
ve c
rim
e ra
te u
p
little more
lot more
73% thought crime had increased, and 38% thought it had increased a lot.

It would seem there is a clear discrepancy between the public perception of crime rates and the trend in actual crime
Figure 2.3: beliefs about crime 1996-2003
30 3325 30
2934
3134
4638
2935
0
10
20
30
40
50
60
70
80
90
100
1996 1998 2000 2001 2001/2 2002/3
% b
elie
ve c
rim
e ra
te u
plittle more
lot more
Figure 2.1: Trends in Crime 1981:2003
02468
101214161820
19
81
19
82
19
83
19
84
19
85
19
86
19
87
19
88
19
89
19
90
19
91
19
92
19
93
19
94
19
95
19
96
19
97
19
97
/8
19
98
/9
19
99
/00
20
00
/01
20
01
/02
20
02
/3
Cri
me
s (
mill
ion
s)
BCS Reported old rules new rules adjusted

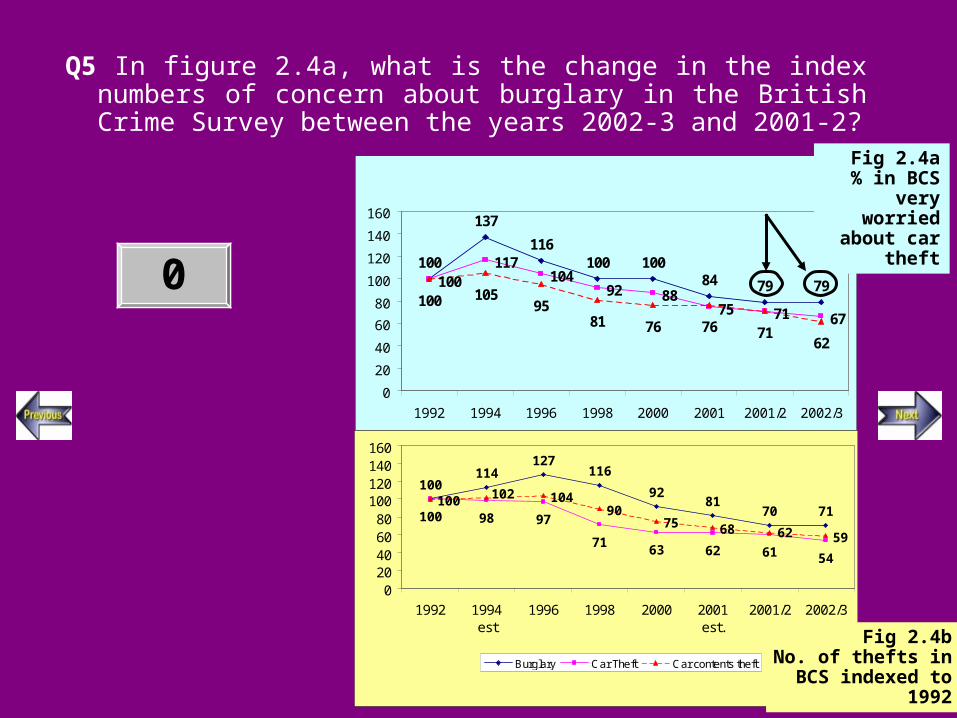
Actually the picture is far from clear-cut. Figures 2.4a and 2.4b compare time indices of worry about theft to the levels of crime as reported in the British Crime Survey.
100100
117104
92 8875 71 67
100797984
100100116
137
105
76 76 7162
8195
0
20
40
60
80
100
120
140
160
1992 1994 1996 1998 2000 2001 2001/2 2002/3
100
127116
9281
71100
7163
100 10490
75 6859
70
114
546162
98 9762
102
020406080
100120140160
1992 1994est
1996 1998 2000 2001est.
2001/2 2002/3
Burglary Car Theft Car contents theft
To create a time index:
•Pick a base year •Call this value 100•Compare all other years to this year•This helps in comparing different trends with each other [more…]
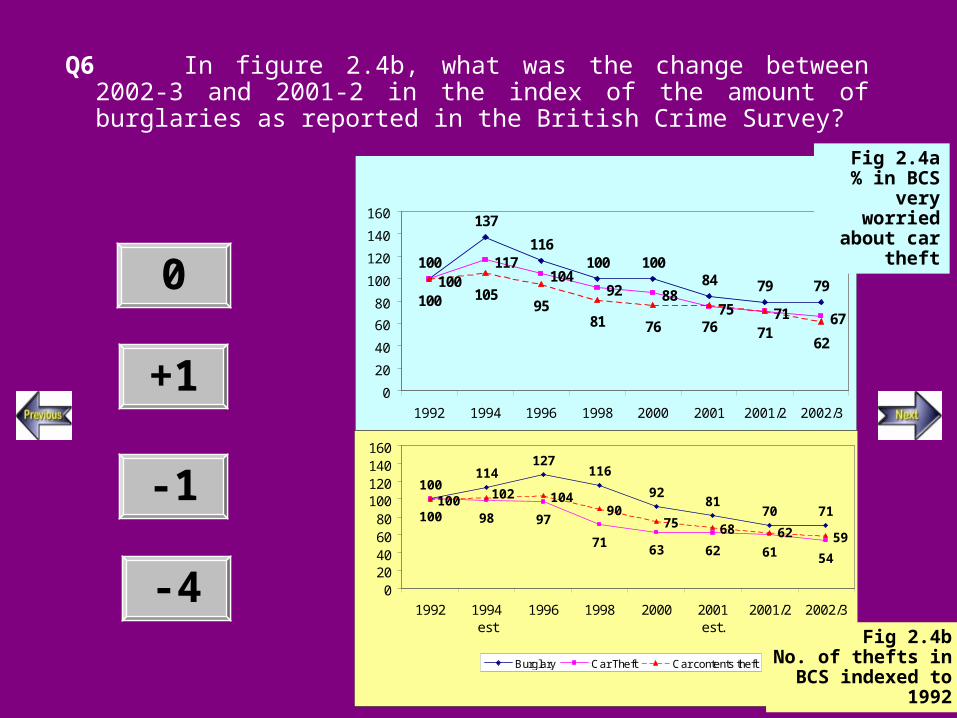
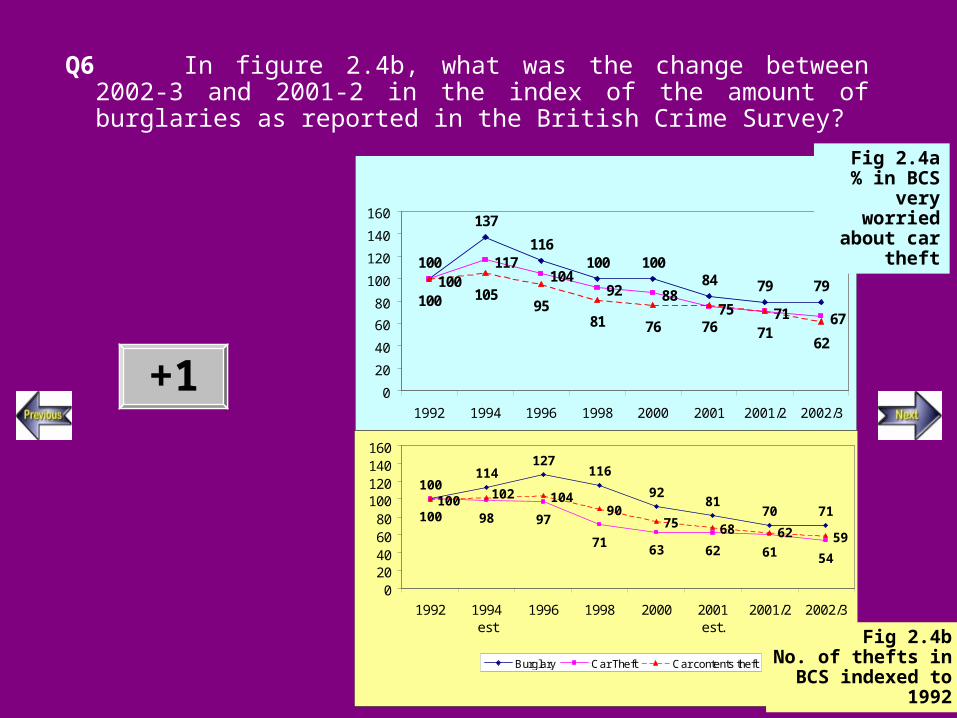
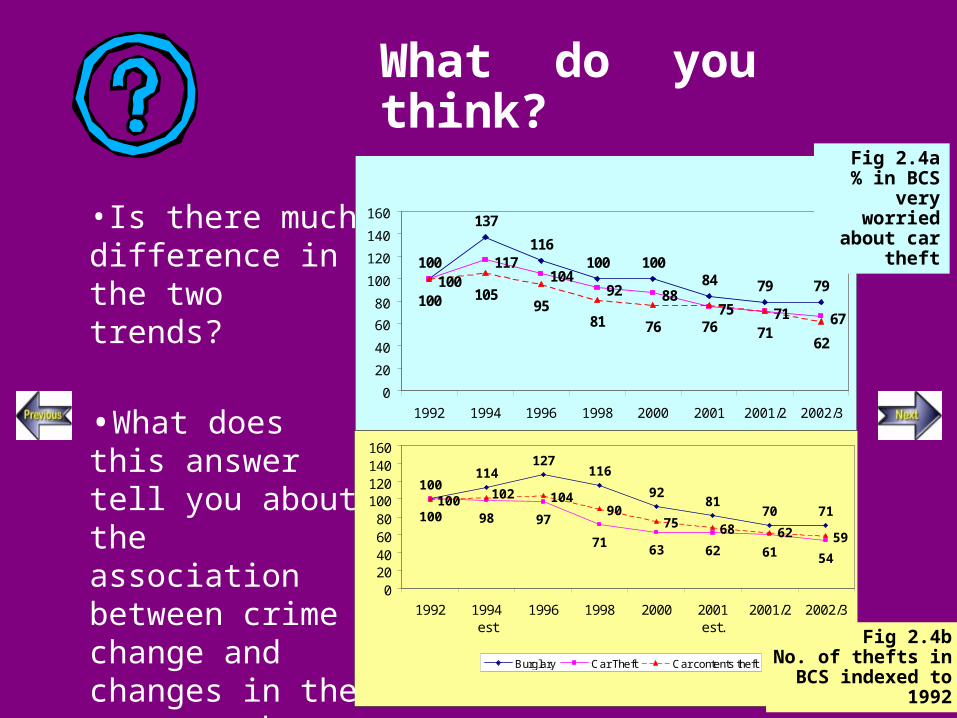
Fig 2.4a% in BCS
very worried about car
theft
Fig 2.4bNo. of thefts in BCS
indexed to 1992

UK Data Archive 2003
Q5 In figure 2.4a, what is the change in the index numbers of concern about burglary in the British Crime Survey between the years 2002-3 and 2001-2?
100100
117104
92 8875 71 67
100797984
100100116
137
105
76 76 7162
8195
0
20
40
60
80
100
120
140
160
1992 1994 1996 1998 2000 2001 2001/2 2002/3
100
127116
9281
71100
7163
100 10490
75 6859
70
114
546162
98 9762
102
020406080
100120140160
1992 1994est
1996 1998 2000 2001est.
2001/2 2002/3
Burglary Car Theft Car contents theft
Fig 2.4a% in BCS
very worried about car
theft
Fig 2.4bNo. of thefts in BCS
indexed to 1992
0
+1
-1
-4
UK Data Archive 2003
Q5 In figure 2.4a, what is the change in the index numbers of concern about burglary in the British Crime Survey between the years 2002-3 and 2001-2?
100100
117104
92 8875 71 67
100797984
100100116
137
105
76 76 7162
8195
0
20
40
60
80
100
120
140
160
1992 1994 1996 1998 2000 2001 2001/2 2002/3
100
127116
9281
71100
7163
100 10490
75 6859
70
114
546162
98 9762
102
020406080
100120140160
1992 1994est
1996 1998 2000 2001est.
2001/2 2002/3
Burglary Car Theft Car contents theft
Fig 2.4a% in BCS
very worried about car
theft
Fig 2.4bNo. of thefts in BCS
indexed to 1992
0
UK Data Archive 2003
Q6 In figure 2.4b, what was the change between 2002-3 and 2001-2 in the index of the amount of burglaries as reported in the British Crime Survey?
100100
117104
92 8875 71 67
100797984
100100116
137
105
76 76 7162
8195
0
20
40
60
80
100
120
140
160
1992 1994 1996 1998 2000 2001 2001/2 2002/3
100
127116
9281
71100
7163
100 10490
75 6859
70
114
546162
98 9762
102
020406080
100120140160
1992 1994est
1996 1998 2000 2001est.
2001/2 2002/3
Burglary Car Theft Car contents theft
Fig 2.4a% in BCS
very worried about car
theft
Fig 2.4bNo. of thefts in BCS
indexed to 1992
0
+1
-1
-4
UK Data Archive 2003
Q6 In figure 2.4b, what was the change between 2002-3 and 2001-2 in the index of the amount of burglaries as reported in the British Crime Survey?
100100
117104
92 8875 71 67
100797984
100100116
137
105
76 76 7162
8195
0
20
40
60
80
100
120
140
160
1992 1994 1996 1998 2000 2001 2001/2 2002/3
100
127116
9281
71100
7163
100 10490
75 6859
70
114
546162
98 9762
102
020406080
100120140160
1992 1994est
1996 1998 2000 2001est.
2001/2 2002/3
Burglary Car Theft Car contents theft
Fig 2.4a% in BCS
very worried about car
theft
Fig 2.4bNo. of thefts in BCS
indexed to 1992
+1
UK Data Archive 2003
What do you think?
100100
117104
92 8875 71 67
100797984
100100116
137
105
76 76 7162
8195
0
20
40
60
80
100
120
140
160
1992 1994 1996 1998 2000 2001 2001/2 2002/3
100
127116
9281
71100
7163
100 10490
75 6859
70
114
546162
98 9762
102
020406080
100120140160
1992 1994est
1996 1998 2000 2001est.
2001/2 2002/3
Burglary Car Theft Car contents theft
Fig 2.4a% in BCS
very worried about car
theft
Fig 2.4bNo. of thefts in BCS
indexed to 1992
•Is there much difference in the two trends?
•What does this answer tell you about the association between crime change and changes in the concern about crime?
UK Data Archive 2003
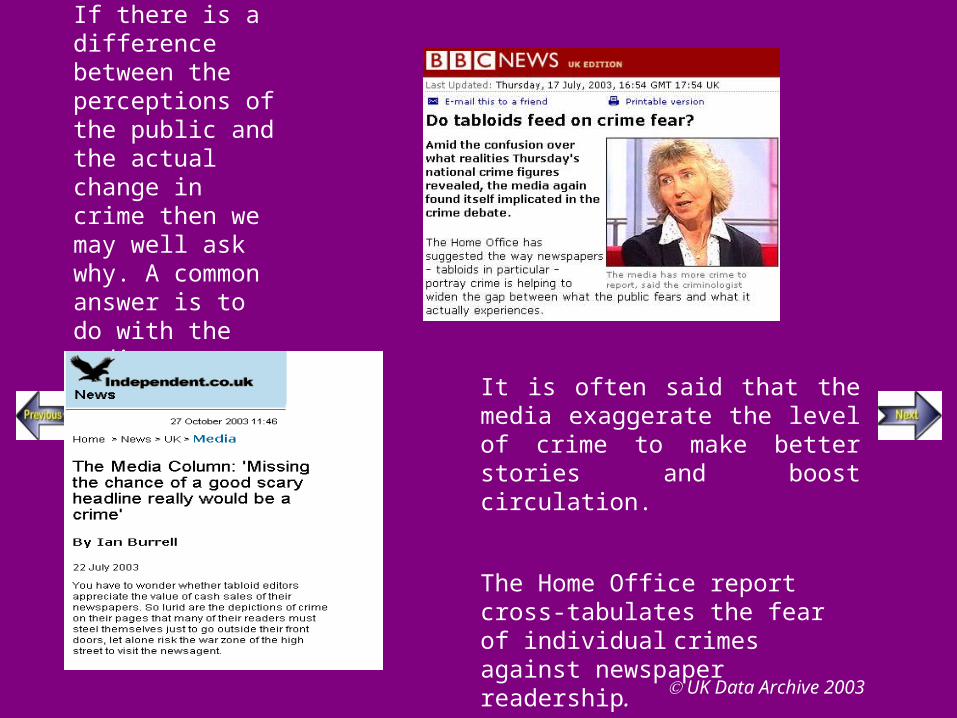
If there is a difference between the perceptions of the public and the actual change in crime then we may well ask why. A common answer is to do with the media.
It is often said that the media exaggerate the level of crime to make better stories and boost circulation.
The Home Office report cross-tabulates the fear of individual crimes against newspaper readership.
UK Data Archive 2003
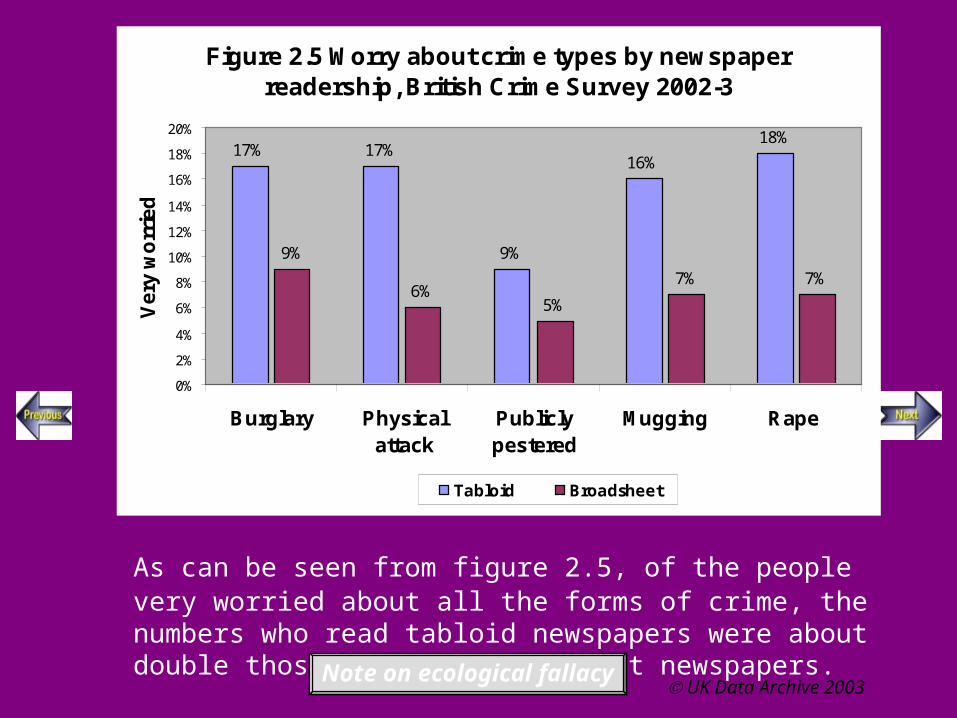
As can be seen from figure 2.5, of the people very worried about all the forms of crime, the numbers who read tabloid newspapers were about double those who read broadsheet newspapers.
Figure 2.5 Worry about crime types by newspaper readership, British Crime Survey 2002-3
17% 17%
9%
16%
18%
9%
6%5%
7% 7%
0%
2%
4%
6%
8%
10%
12%
14%
16%
18%
20%
Burglary Physicalattack
Publiclypestered
Mugging Rape
Ve
ry w
orr
ied
Tabloid Broadsheet
Note on ecological fallacy

UK Data Archive 2003
Figure 2.5 Worry about crime types by newspaper readership, British Crime survey 2002-3
17% 17%
9%
16%
18%
9%
6%5%
7% 7%
0%
2%
4%
6%
8%
10%
12%
14%
16%
18%
20%
Burglary Physicalattack
Publiclypestered
Mugging Rape
Ve
ry w
orr
ied
Tabloid Broadsheet
What do you think?
This table suggests that there is a correlation between readership of tabloid newspapers and perception of crime rates. Do you think it is a causal relationship (reading tabloids causes people to perceive more crime than there actually is)? If newspaper choice does not cause fear of crime, why should newspaper choice be correlated or associated with fear of crime?

UK Data Archive 2003
Q6 Why might tabloid readers fear crime more than readers of broadsheet newspapers?
Q7 Write two paragraphs which discuss the other factors that may impact on people’s fear of crime (e.g. Age)
UK Data Archive 2003
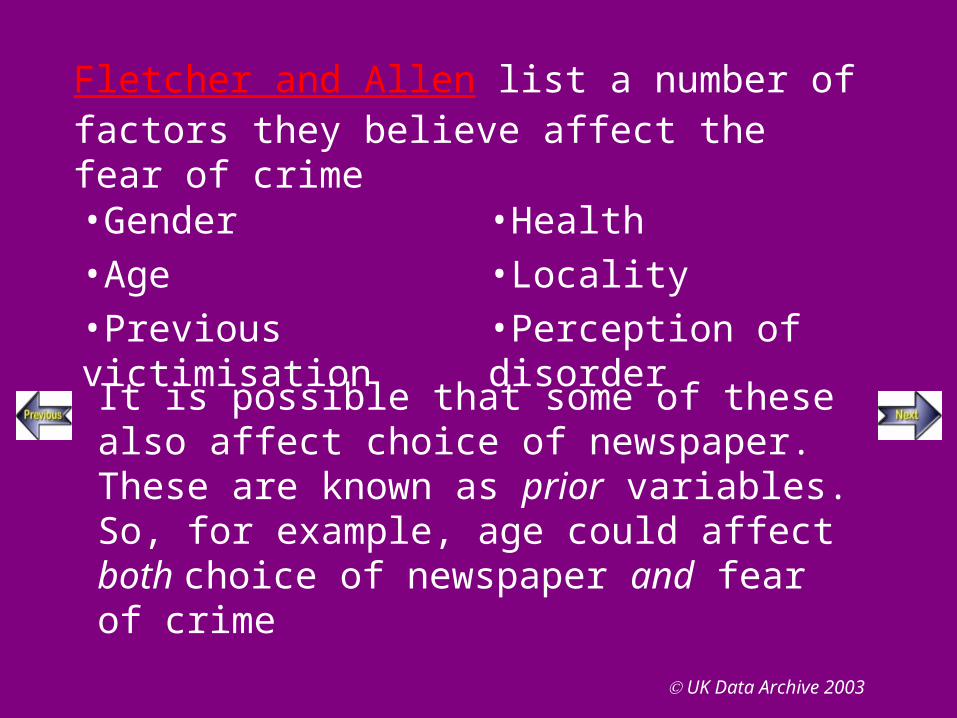
Fletcher and Allen list a number of factors they believe affect the fear of crime
•Gender•Age•Previous victimisation
•Health•Locality•Perception of disorder
It is possible that some of these also affect choice of newspaper. These are known as prior variables. So, for example, age could affect both choice of newspaper and fear of crime

UK Data Archive 2003
Fletcher and Allen list a number of factors they believe affect the fear of crime
•Gender•Age•Previous victimisation
•Health•Locality•Perception of disorder
It is possible that some of these also affect choice of newspaper. These are known as prior variables. So, for example, age could affect both choice of newspaper and fear of crime
It is also possible that newspaper readership does not affect fear of crime directly, but can affect it indirectly if, say, there is a previous victimisation. Victimisation is then called an intervening variable
UK Data Archive 2003
What do you think?
What are the main factors influencing the fear of crime?
UK Data Archive 2003
Version 2 : Class differences
The argument about the effect of newspapers in the Home Office report bears a striking resemblance to the concept of ‘moral panic’.
This concept was developed by the sociologist Stanley Cohen, originally to describe what he called the ‘amplification’ of the perception of disorder between the ‘Mods’ and ‘Rockers’ in the 1970s.
Criminal Act
Media mis-
representation
Selection of crime as
news
Amplification
Moral PanicPublic
reaction
Officially-defined
crime
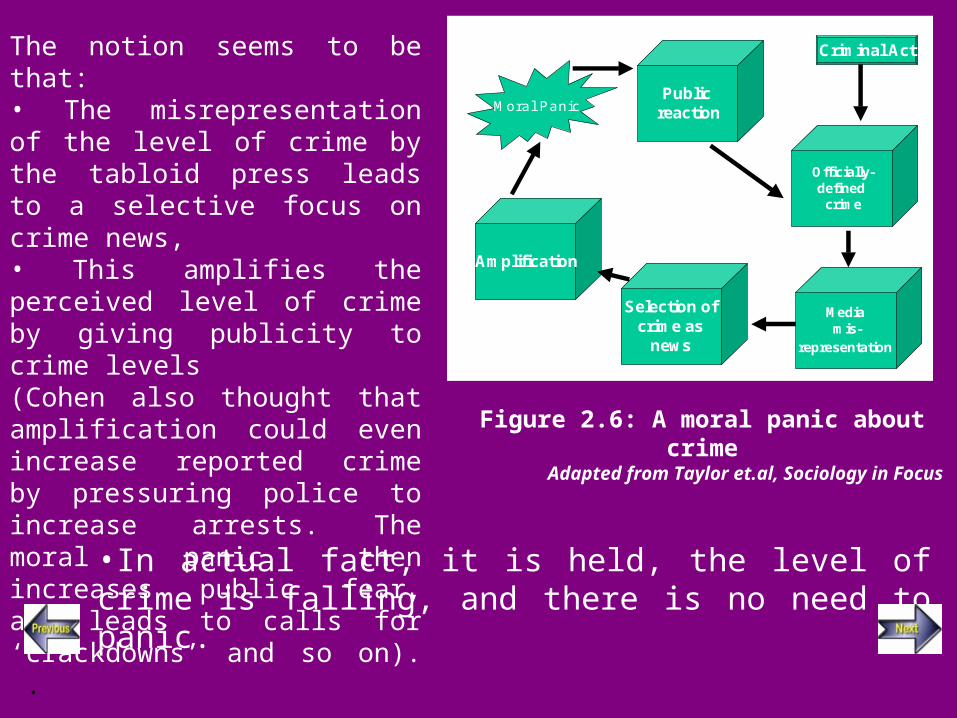
Figure 3.5: A moral panic about crime
Adapted from Taylor et.al, Sociology in Focus
Figure 2.6: A moral panic about crimeAdapted from Taylor et.al, Sociology in Focus
The notion seems to be that:• The misrepresentation of the level of crime by the tabloid press leads to a selective focus on crime news, • This amplifies the perceived level of crime by giving publicity to crime levels (Cohen also thought that amplification could even increase reported crime by pressuring police to increase arrests. The moral panic then increases public fear, and leads to calls for ‘crackdowns’ and so on). i.
•In actual fact, it is held, the level of crime is falling, and there is no need to panic.

UK Data Archive 2003
An alternative approach to explaining crime is to use a notion of class. Class is a difficult concept, and we will be investigating alternative measures later on. Also there are many different aspects to class, so for the purposes of the discussion here class will be taken as being measured by income. Figure 2.7 classifies income against both the risk and the fear of crime. Question 8a – 8e asks you to look at the level of crime victimisation:
Figure 2.7% fearing crime and % household crime victims by income,
BCS 1992
2530
3841
4749
38
2924 23
0
10
20
30
40
50
60
Poorest fifth 2nd poorestfifth
Middle fifth 2nd richestfifth
Richest fifth
Income quintiles
Perc
en
tag
e
Victims Fear
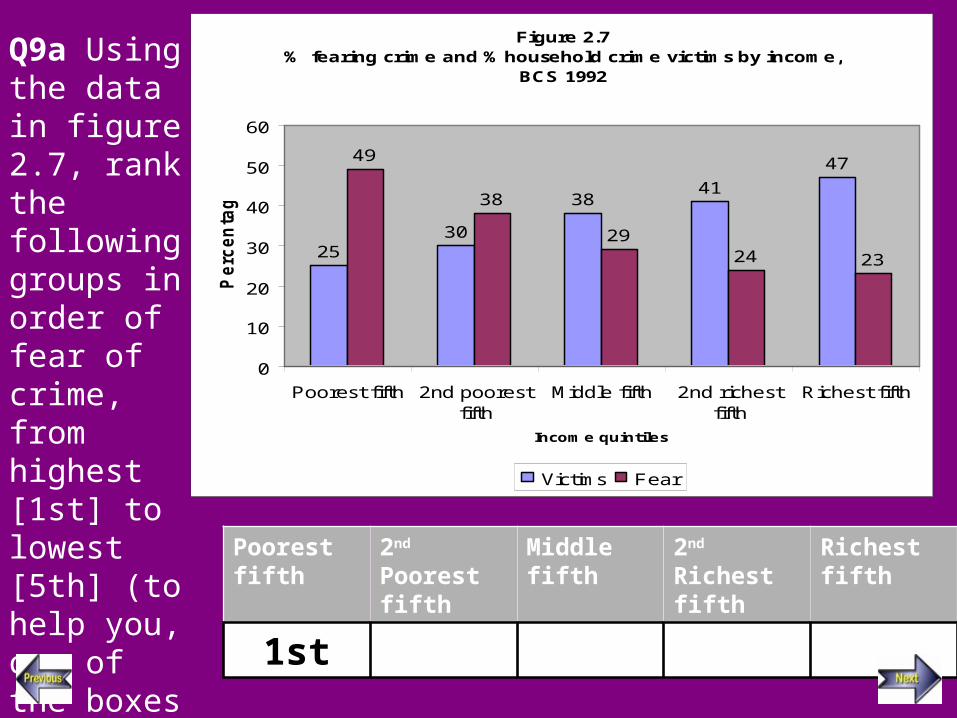
Q9a Using the data in figure 2.7, rank the following groups in order of fear of crime, from highest [1st] to lowest [5th] (to help you, one of the boxes is already filled in):
Poorest fifth 2nd Poorest fifth
Middle fifth 2nd Richest fifth
Richest fifth
1st
Figure 2.7% fearing crime and % household crime victims by income,
BCS 1992
2530
3841
4749
38
2924 23
0
10
20
30
40
50
60
Poorest fifth 2nd poorestfifth
Middle fifth 2nd richestfifth
Richest fifth
Income quintiles
Perc
en
tag
e
Victims Fear
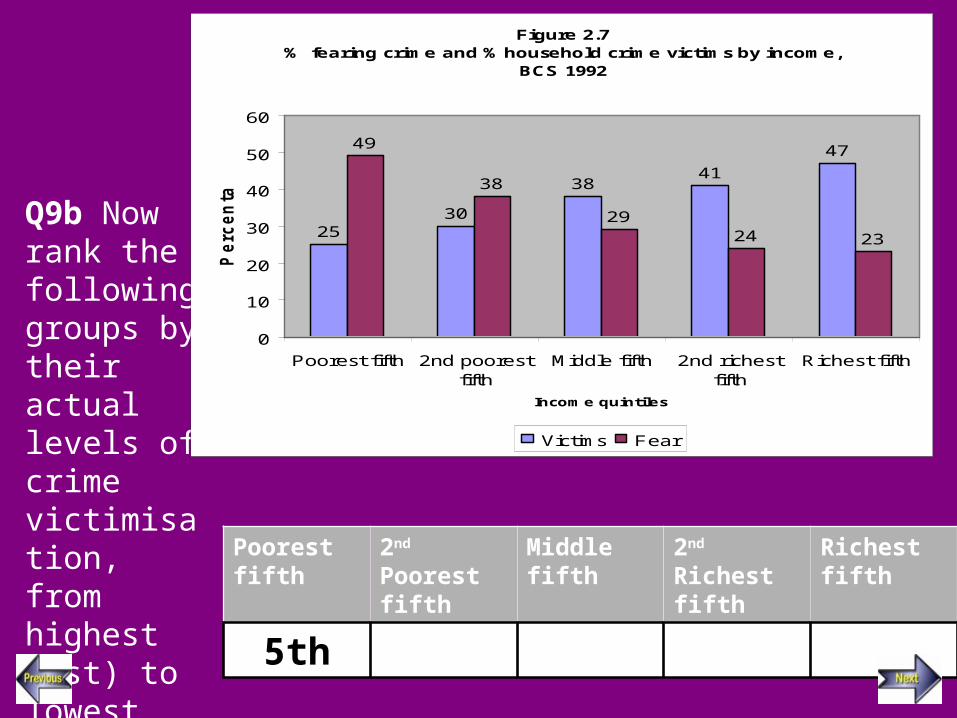
Q9b Now rank the following groups by their actual levels of crime victimisation, from highest (1st) to lowest (5th):
Poorest fifth 2nd Poorest fifth
Middle fifth 2nd Richest fifth
Richest fifth
5th
Figure 2.7% fearing crime and % household crime victims by income,
BCS 1992
2530
3841
4749
38
2924 23
0
10
20
30
40
50
60
Poorest fifth 2nd poorestfifth
Middle fifth 2nd richestfifth
Richest fifth
Income quintiles
Perc
en
tag
e
Victims Fear
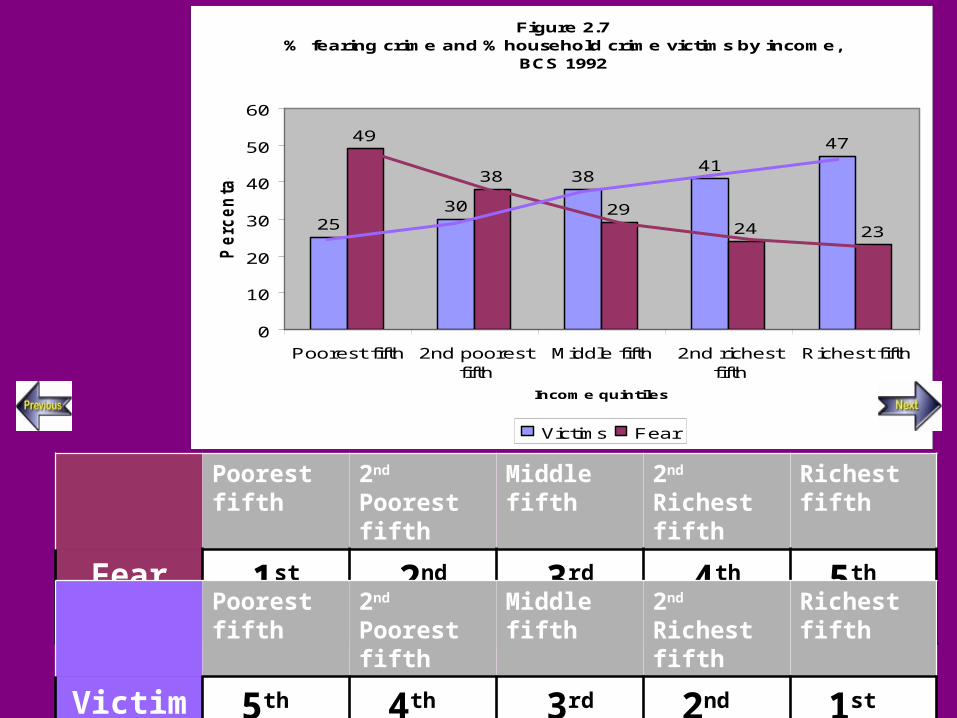
Figure 2.7% fearing crime and % household crime victims by income,
BCS 1992
2530
3841
4749
38
2924 23
0
10
20
30
40
50
60
Poorest fifth 2nd poorestfifth
Middle fifth 2nd richestfifth
Richest fifth
Income quintiles
Perc
en
tag
e
Victims Fear
Poorest fifth 2nd Poorest fifth
Middle fifth 2nd Richest fifth
Richest fifth
Fear 1st 2nd 3rd 4th 5th Poorest fifth 2nd Poorest
fifth Middle fifth 2nd Richest
fifth Richest fifth
Victims 5th 4th 3rd 2nd 1st
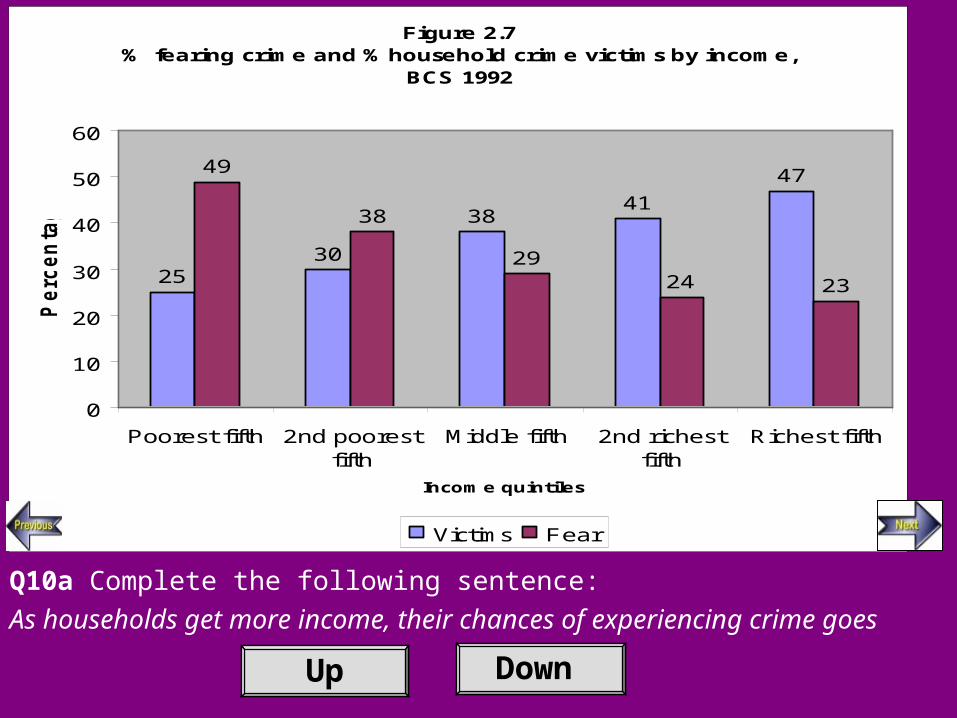
Figure 2.7% fearing crime and % household crime victims by income,
BCS 1992
2530
3841
4749
38
2924 23
0
10
20
30
40
50
60
Poorest fifth 2nd poorestfifth
Middle fifth 2nd richestfifth
Richest fifth
Income quintiles
Perc
en
tag
e
Victims Fear
Q10a Complete the following sentence:
As households get more income, their chances of experiencing crime goes
Up Down
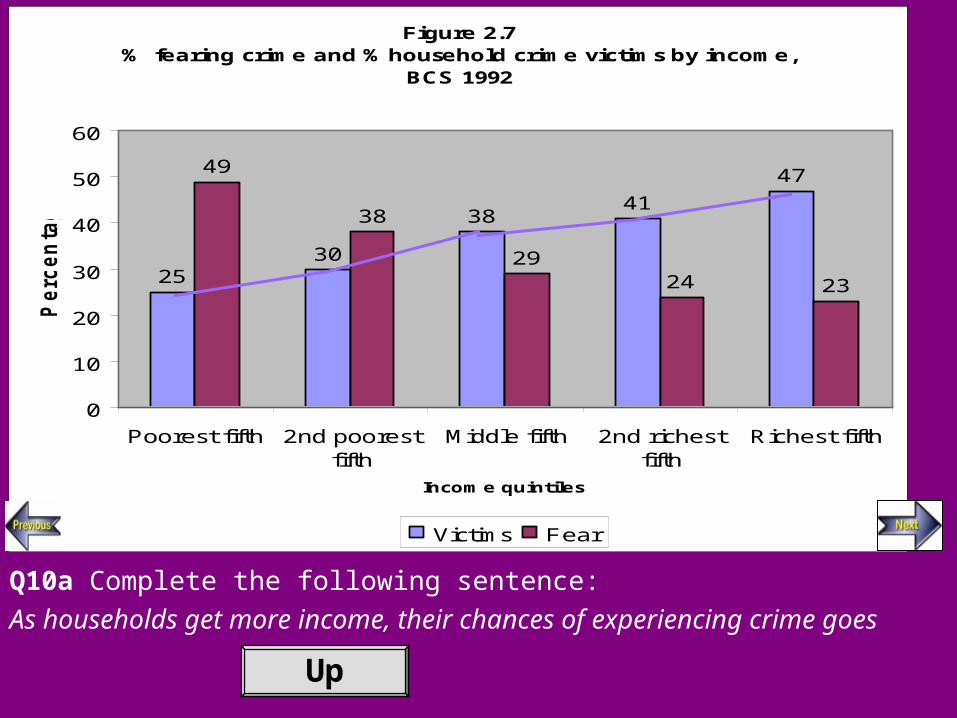
Figure 2.7% fearing crime and % household crime victims by income,
BCS 1992
2530
3841
4749
38
2924 23
0
10
20
30
40
50
60
Poorest fifth 2nd poorestfifth
Middle fifth 2nd richestfifth
Richest fifth
Income quintiles
Perc
en
tag
e
Victims Fear
Q10a Complete the following sentence:
As households get more income, their chances of experiencing crime goes
Up
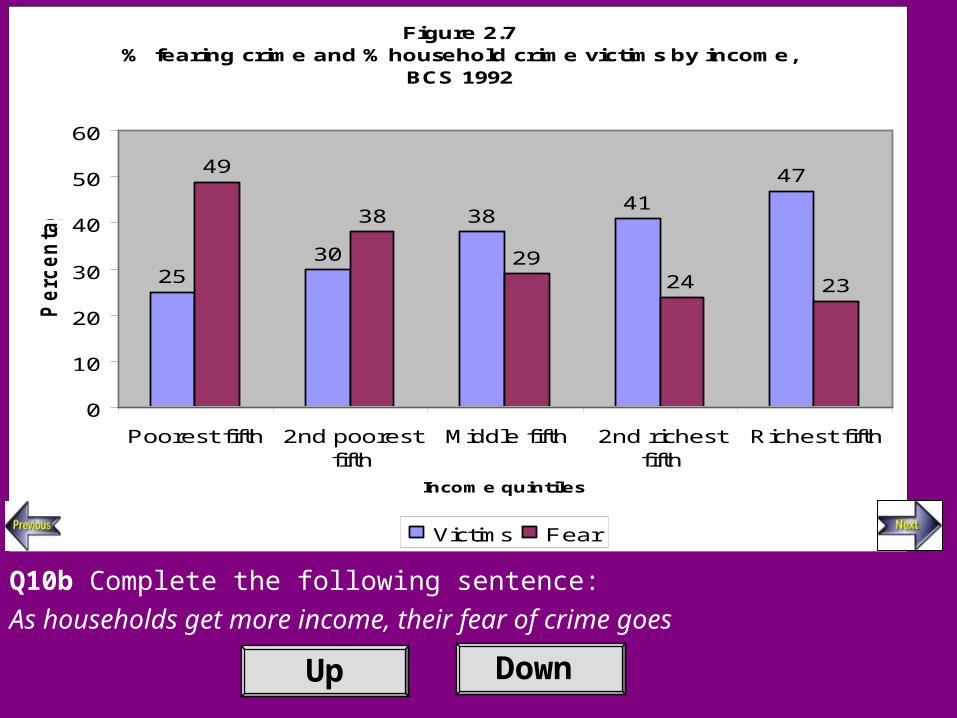
Figure 2.7% fearing crime and % household crime victims by income,
BCS 1992
2530
3841
4749
38
2924 23
0
10
20
30
40
50
60
Poorest fifth 2nd poorestfifth
Middle fifth 2nd richestfifth
Richest fifth
Income quintiles
Perc
en
tag
e
Victims Fear
Q10b Complete the following sentence:
As households get more income, their fear of crime goes
Up Down

Figure 2.7% fearing crime and % household crime victims by income,
BCS 1992
2530
3841
4749
38
2924 23
0
10
20
30
40
50
60
Poorest fifth 2nd poorestfifth
Middle fifth 2nd richestfifth
Richest fifth
Income quintiles
Perc
en
tag
e
Victims Fear
Q10b Complete the following sentence:
As households get more income, their fear of crime goes
Down

UK Data Archive 2003
• The risk of crime goes up as households gain more income, but the fear of crime goes down. This seems to be somewhat contradictory.
What do you think?
What might explain this data?
UK Data Archive 2003
• Pantazis and Gordon1 suggest that the reason for the apparent discrepancy between fear of crime and its risk is that crime has a larger effect on poor people.
• They point to the apparent effects of insurance on the fear of crime
UK Data Archive 2003
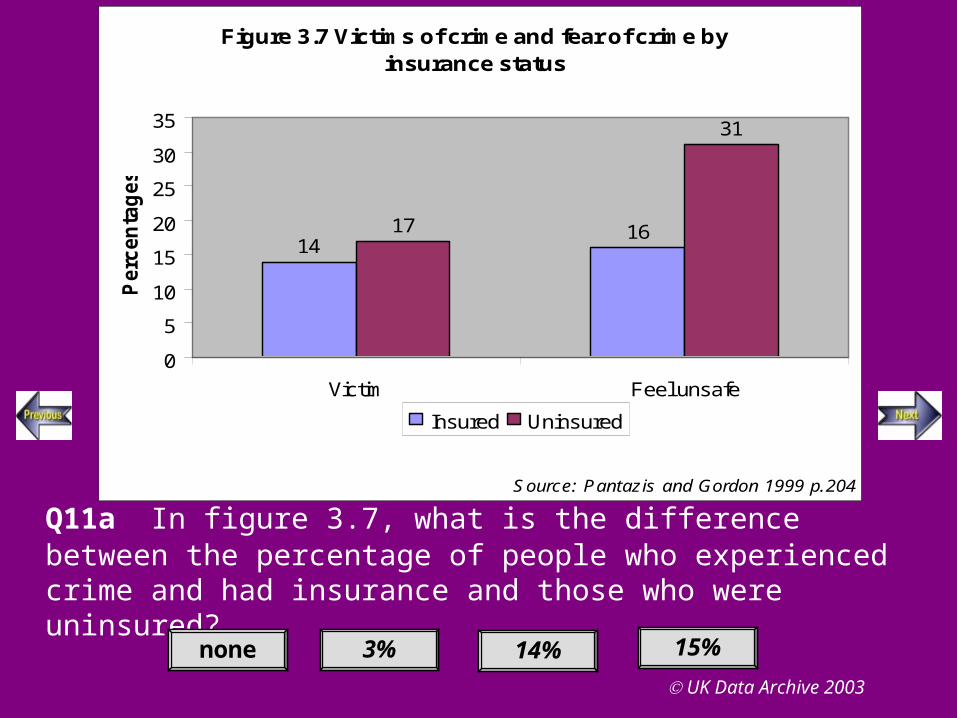
Q11a In figure 3.7, what is the difference between the percentage of people who experienced crime and had insurance and those who were uninsured?
Figure 3.7 Victims of crime and fear of crime by insurance status
141617
31
0
5
10
15
20
25
30
35
Victim Feel unsafe
Source: Pantazis and Gordon 1999 p.204
Perc
en
tag
es
Insured Uninsured
none 3% 14% 15%

UK Data Archive 2003
Q11a In figure 3.7, what is the difference between the percentage of people who experienced crime and had insurance and those who were uninsured?
Figure 3.7 Victims of crime and fear of crime by insurance status
141617
31
0
5
10
15
20
25
30
35
Victim Feel unsafe
Source: Pantazis and Gordon 1999 p.204
Perc
en
tag
es
Insured Uninsured
3%

UK Data Archive 2003
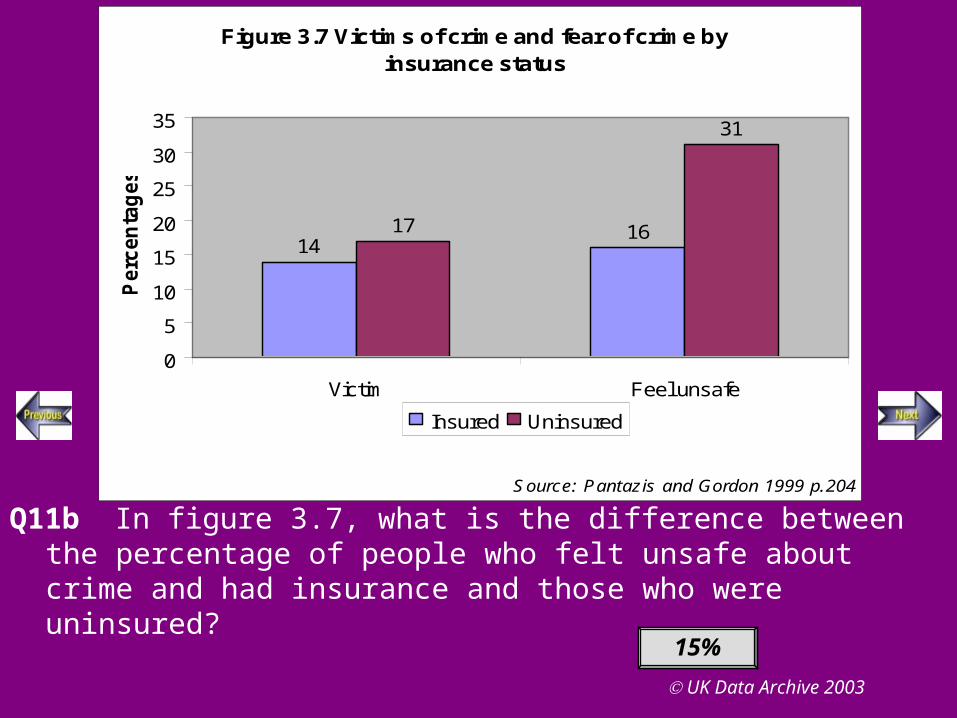
Q11b In figure 3.7, what is the difference between the percentage of people who felt unsafe about crime and had insurance and those who were uninsured?
Figure 3.7 Victims of crime and fear of crime by insurance status
141617
31
0
5
10
15
20
25
30
35
Victim Feel unsafe
Source: Pantazis and Gordon 1999 p.204
Perc
en
tag
es
Insured Uninsured
none 3% 16% 15%
UK Data Archive 2003
Q11b In figure 3.7, what is the difference between the percentage of people who felt unsafe about crime and had insurance and those who were uninsured?
Figure 3.7 Victims of crime and fear of crime by insurance status
141617
31
0
5
10
15
20
25
30
35
Victim Feel unsafe
Source: Pantazis and Gordon 1999 p.204
Perc
en
tag
es
Insured Uninsured
15%

The difference between the levels of crime experienced by the insured and the uninsured was only 3 per cent, but the difference between those who report they feel unsafe is much higher.
• Pantazis and Gordon suggest that what counts is the differing effect of household crime on lower income households, who are more likely to be uninsured and therefore would not get compensated for lost effects.
Figure 3.7 Victims of crime and fear of crime by insurance status
141617
31
0
5
10
15
20
25
30
35
Victim Feel unsafe
Source: Pantazis and Gordon 1999 p.204
Per
cen
tag
es
Insured Uninsured

UK Data Archive 2003
So we now have two views about the perception of crime:1. Crime is falling, but people are misled by the
tabloids into thinking it is going up
2. Crime makes a bigger difference to poor people than rich people, so it is hardly surprising that they are more worried about it.
What do you think?
1. Which –- if either – of the two views do you think is right?2. What data could you use to back up your opinion?

UK Data Archive 2003
SUMMARY
• Data analysis cannot be separated from theory
• Different theories will lead to different questions being asked
• In this module we compared two approaches to perceptions of crime, the ‘moral panic’ approach and a class-based approach. Both used different analysis of the same data to back up their viewpoint.

UK Data Archive 2003
NEXT UP….
You may have trouble deciding which, if any, of the approaches you think is correct. In the next modules you will find out how you can investigate data yourself and test out your own theories.
Notes
Simmonds J and Dodd T (eds) Crime in England and Wales 2002/2003, Home Office Statistical Bulletin 07/03, London: HMSO, 2003 http://www.homeoffice.gov.uk/rds/crimeew0203.html
Fletcher G and Allen J, ‘Perceptions of and Concern about Crime’ chapter 8 in Simmonds and Dodd (eds) Crime in England and Wales 2002/2003.
Cohen S. Folk Devils and Moral Panics, Oxford: Blackwell 1987 3rd ed.
Taylor P. et al, Sociology in Focus, Ormskirk: Causeway 1995 pp.42-43
Irwin A., Citizen Science, London: Routledge p.26Pantazis C and Gordon D, ‘Are Crime and Fear of Crime more likely
to be experienced by the poor?’ in Dorling D and Simpson S (eds) Statistics in Society, London: Arnold 1999
Stop