xcode tricks - cs491f10.files.wordpress.com · 13/10/2010 · nomenclature •much of tonights...
TRANSCRIPT

Xcode TricksiOS App DevelopmentFall 2010 — Lecture 13

Questions?

Announcements
• Reminder:
• Assignment #3 due Monday, October 18th by 11:59pm

Today’s Topics
• Building & Running Code
• Troubleshooting
• Debugging
• Clang Static Analyzer
• Editor Shortcuts
• Refactoring

Notes
• I’m showing the relevant portions of the view controller interfaces and implementations in these notes
• Remember to release relevant memory in the -dealloc methods — they are not shown here
• You will also need to wire up outlets and actions in IB
•Where delegates or data sources are used, they too require wiring in IB

Nomenclature

Nomenclature
• Much of tonights material involves keyboard shortcuts
• Just to make sure that everyone is on the same, the following common symbols are used to represent the associated keys
⎋!the escape key
⌃! the control key
⇧!the shift key
⌘!the command key
⌥!the option key
↩!the return key
← ↑ → ↓ the arrow keys

Building & Running Code

Building & Running
• Most of you have probably already been using the keyboard shortcuts for building source code
• If not, they warrant repeating...
•⌘B performs a build of the project
•⌘↩ build and run the project

Dealing with Errors & Warnings
• If we have errors in our code, these are called out to us in Xcode with messages that look like this...

Dealing with Errors & Warnings
•⇧⌘B brings up build results window which contains all of the messages in a single window which we can use to jump to the code associated with each method

Dealing with Errors & Warnings
• Alternatively you can use the following keyboard shortcuts to jump between the lines of code referenced by these compiler errors and warnings...
•⌘= jumps forwards to the next line/message
•⇧⌘= jumps backwards to the previous line/message

Running Code

Running Code• Again, I know that most of you have already been using the
keyboard shortcut for running your app...
•⇧⌘R opens the console and brings it to the foreground, then you can press ⌘↩ to build and run your app
• The console can get cluttered any you may wish to clear it occasionally, there are buttons on the toolbar for this, or you could use the keyboard sequence
• ⌃⌥⌘R clears the console

Running the Console Automatically
• There’s also a setting under preferences which you can bring up with ⌘,

Troubleshooting
The “HERE” Log Message
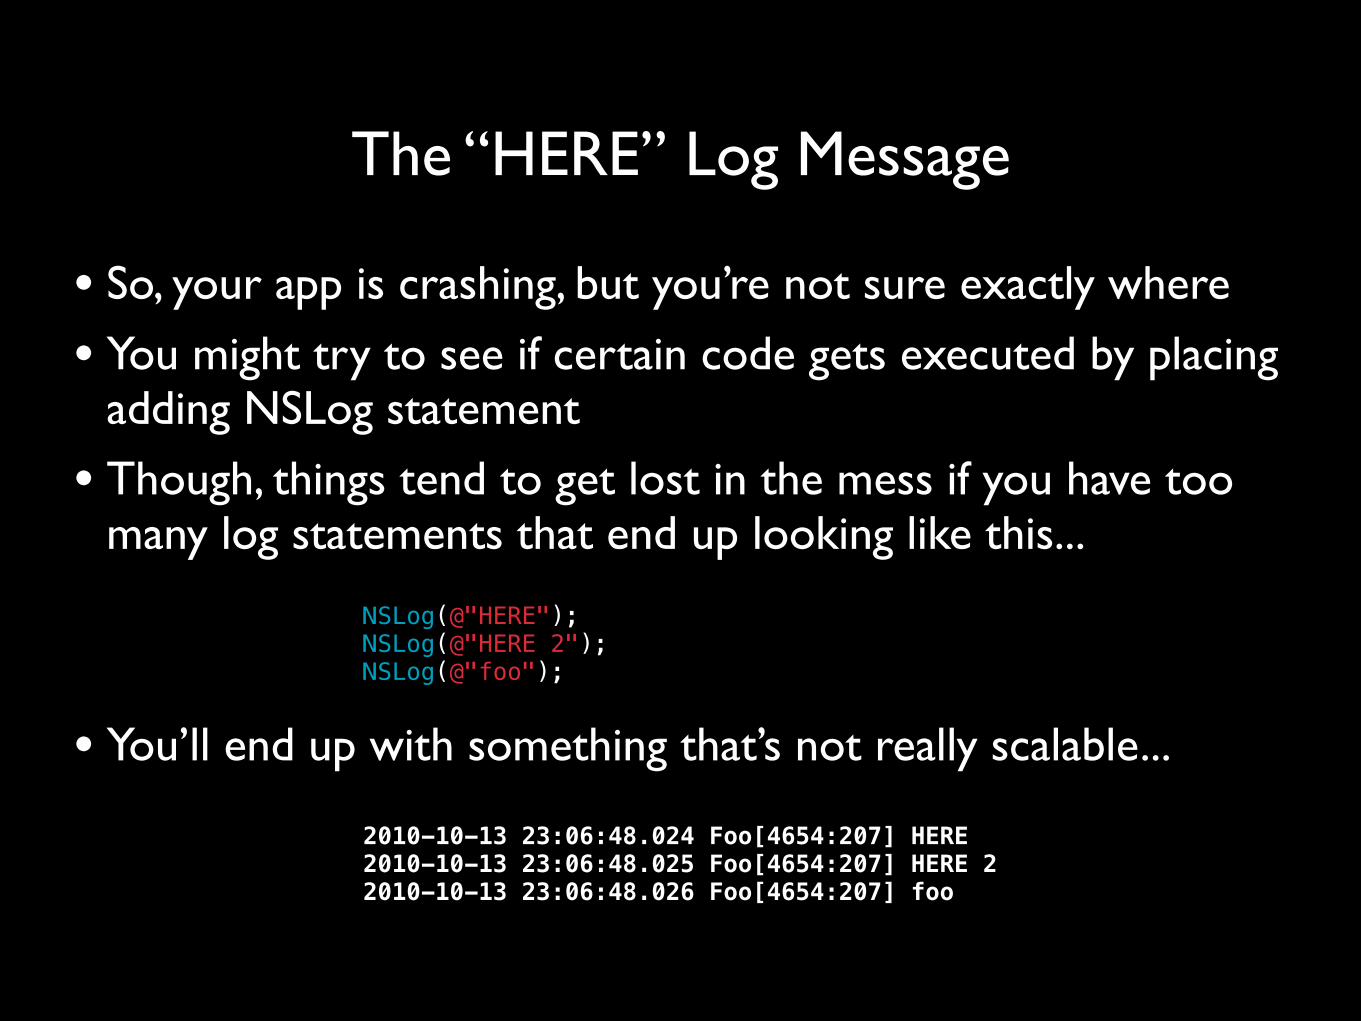
• So, your app is crashing, but you’re not sure exactly where
• You might try to see if certain code gets executed by placing adding NSLog statement
• Though, things tend to get lost in the mess if you have too many log statements that end up looking like this...
• You’ll end up with something that’s not really scalable...
NSLog(@"HERE");NSLog(@"HERE 2");NSLog(@"foo");
2010-10-13 23:06:48.024 Foo[4654:207] HERE2010-10-13 23:06:48.025 Foo[4654:207] HERE 22010-10-13 23:06:48.026 Foo[4654:207] foo

Slightly Improved “HERE” Log Message
• You can use some identifiers which the pre-processor replaces with data about your file
• For example, the following code...
• Outputs the slightly more useful...
• Can quickly copy and paste as needed without having to type a bunch of log statements and change the messages
- (void)someMethodOrAnother { NSLog(@"%s:%d:%s", __FILE__, __LINE__, __FUNCTION__);}
2010-10-13 23:08:47.210 Foo[4689:207] /Users/Dan/Desktop/Foo/Classes/FooViewController.m:62:-[FooViewController someMethodOrAnother]

Using the Debugger
• If you find the process of using log statements tedious (edit, save, build, run, repeat), then you may wish to use the built in debugger
• If that’s your cup of tea, you’ll be glad to know that Xcode has a great debugger integrated right into Xcode

GDB

GDB
• Same GNU Project debugger you’re accustomed to on Linux
• Allows you to see what is going on inside your program while it executes (or what it was doing when it crashed)
• GDB can do four main kinds of things...
• Start your app, specifying things that might affect its behavior
• Make your app stop on specified conditions
• Examine what happened, when your app has stopped
• Change things in your app, so you can experiment with changing the state of variables, etc.

Running GDB
• If you are used to pressing the Build button in the toolbar you can simply hold down the ⌥ key while pressing the button to toggle between normal and debug modes...
• If your app crashes the raw GDB text interface will be in the run console
• You’ll need to have the active configuration set to “Debug”
• This is the default unless you changed it

If You Take One Thing Away...
• If your app crashes, there’s a good chance you can get a meaningful stack trace by issuing the where command...
Start from the top and work your
way down looking for your code

Basic Usage Demo
• For an even more details you can bring the full blown debugger using the ⇧⌘Y shortcut

Basic Usage Demo
• Using the run/debugger console...
• Skip over, step into, step out of
• Continue
• Printing variables (p, po)
• Setting/removing breakpoints
• See the GDB manual for a full list of commands
• http://www.gnu.org/software/gdb/documentation/

LLVM & Clang

LLVM & Clang
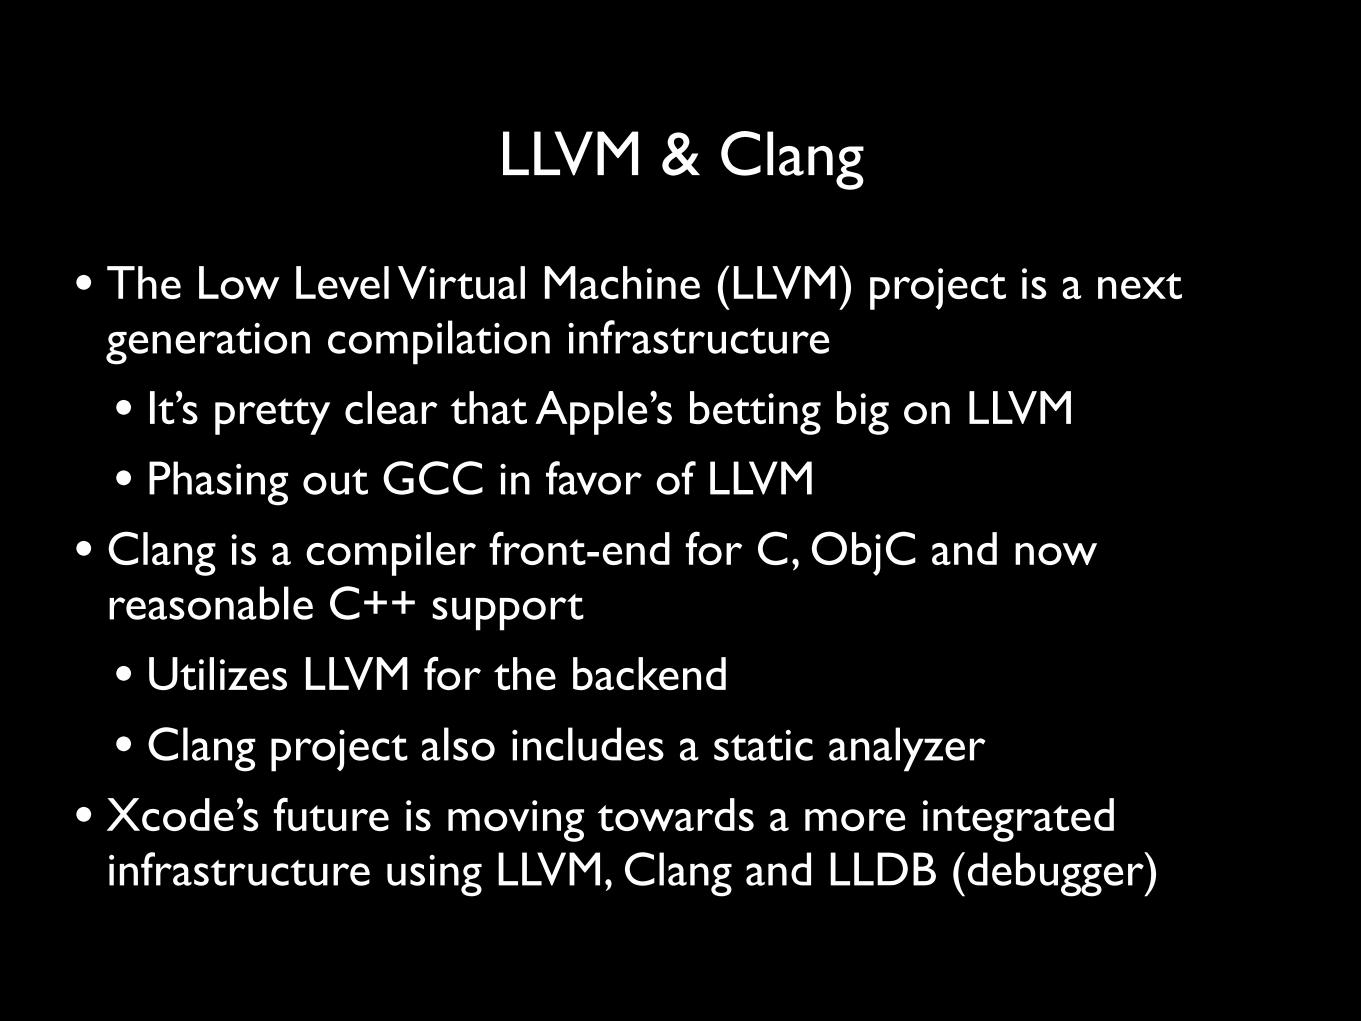
• The Low Level Virtual Machine (LLVM) project is a next generation compilation infrastructure
• It’s pretty clear that Apple’s betting big on LLVM
• Phasing out GCC in favor of LLVM
• Clang is a compiler front-end for C, ObjC and now reasonable C++ support
• Utilizes LLVM for the backend
• Clang project also includes a static analyzer
• Xcode’s future is moving towards a more integrated infrastructure using LLVM, Clang and LLDB (debugger)
Parser
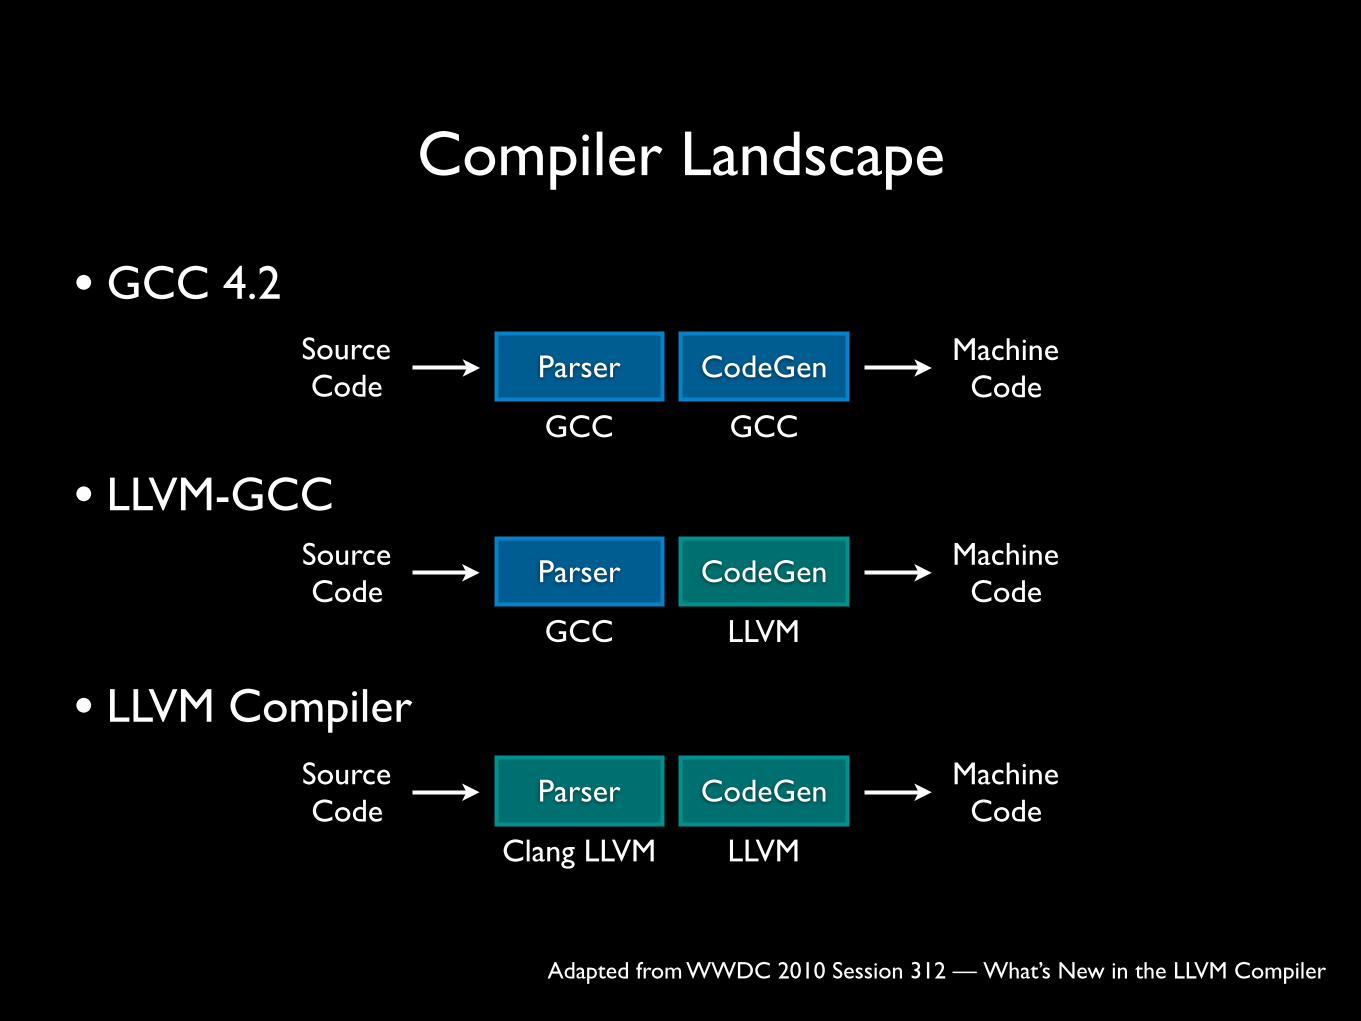
• GCC 4.2
• LLVM-GCC
• LLVM Compiler
CodeGen
Compiler Landscape
Adapted from WWDC 2010 Session 312 — What’s New in the LLVM Compiler
Source Code
Parser CodeGen Machine Code
GCC GCC
Source Code
Parser CodeGen Machine Code
GCC LLVM
Source Code
Machine Code
Clang LLVM LLVM

Clang Static Analyzer
• Think of static analysis as an advanced warnings tool that can identify bugs in your code without having to execute it
• Memory leaks
• Values never read
• Uninitialized variables
• To run the static analysis tool, you can a build and analyze using ⇧⌘A
• Seems like there’s a bug in Xcode 3.2.4 (iOS SDK 4.1) where it refuses to run when the target is set to Simulator
• Simply switch to Device to do analysis

Clang Static Analyzer

Clang Static Analyzer

Editor Shortcuts

Basic Editor Shortcuts
•We’ve already discussed numerous basic shortcuts, such as...
• Pressing ⎋ to bring up autocompletion
• Using ⌃/ to jump to the next section in an autocomplete
• Commenting/uncommenting sections of code by first selecting them and then pressing ⌘/
• Switching between header and implementation files by using ⌥⌘↑

Getting Help
•We’ve also discussed bringing up the help documentation window using the ⇧⌥⌘? shortcut
• Additionally, we’ve discussed in class using the following shortcuts which can be used from the editor window
•⌥ double click on a method/class in Xcode to bring up the documentation for that method/class/etc.
•⌘ double click on a method/class in Xcode to jump to that method/class declaration in its header
Editing Pane Options
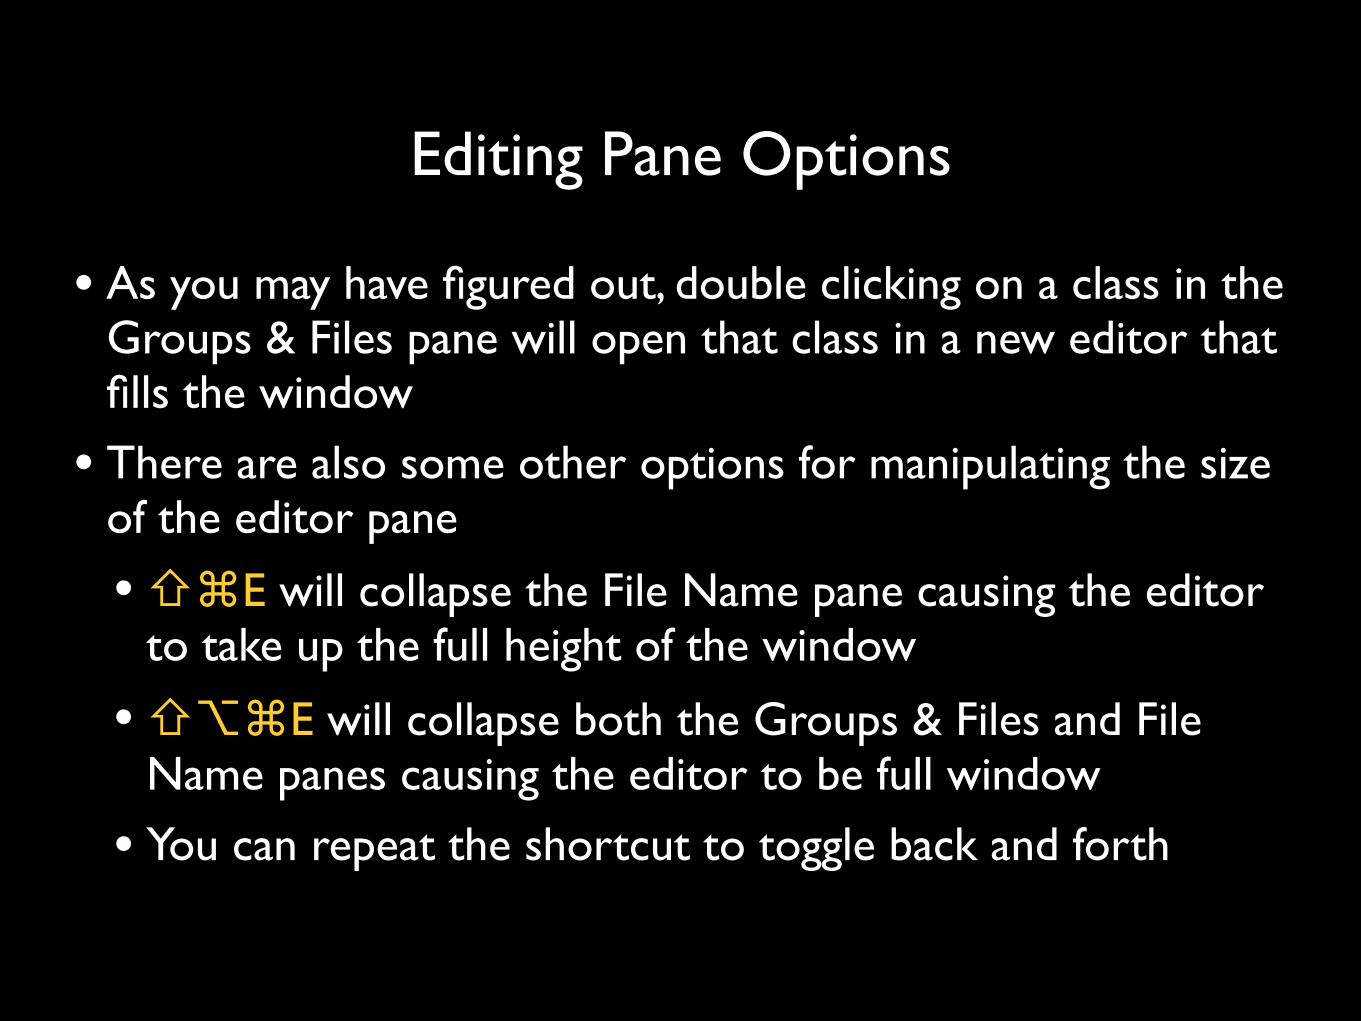
• As you may have figured out, double clicking on a class in the Groups & Files pane will open that class in a new editor that fills the window
• There are also some other options for manipulating the size of the editor pane
•⇧⌘E will collapse the File Name pane causing the editor to take up the full height of the window
•⇧⌥⌘E will collapse both the Groups & Files and File Name panes causing the editor to be full window
• You can repeat the shortcut to toggle back and forth

Folding Blocks of Code
• You can collapse and expand blocks of code within Xcode with a couple of shortcuts (you can also do this from the gutter to the left of the source code)
• ⌃⌘← collapses the current block
• ⌃⌘→ expands the current block
• ⌃⌘↑ collapses all methods in a class
• ⌃⌘↓ expands all methods in a class
• There’s also a mode that shades out everything but the current block that can be toggled on and off via ⌃⌥⌘F

Position Related Items
•⌘L opens a dialog that lets you type in a line or column number and jump to that line of code in the current file
• ⌃L centers the current line in the middle of the buffer

Line and Column Numbering
• Line or column numbers can be enabled under preferences...

Navigating Between Files
• You can bring up the open files drop down with ⌃1• Just start typing file name, then press ↩ (or use ↑ and ↓)
Navigating Between Files
• The forward and backward arrows atop the editor act as a history of where you’ve been (sort of like a web browser)
• Can be used to cycle between open files
• Can also use the ⌥⌘← and ⌥⌘→ shortcuts

Navigating Between Files
• There’s also a powerful open quickly window that lets you open any resource (including NIBs) directly from Xcode
• Use ⇧⌘D to bring up the open quickly window
• Just start typing the resource name and it will list matches
• Use ↑ & ↓ to change files, press ↩ to open

Navigating Within a File
• Similar to the file drop down, there’s also a function/method drop down that you can bring up by pressing ⌃2

Navigating Within a File
• You may have noticed that there were also labels mixed in with the function/method names
• These titles are inserting a #pragma mark statement...
#pragma mark -#pragma mark Drawing Methods
- (void)drawCircle {!}
- (void)drawSquare {!}
- (void)drawTriangle {!}
Ignored by the compiler, but
read by Xcode General form is:#pragma mark <title>
(a ‘-’ draws a separator)

Navigating Within a File
• The functions/method drop down with our title and separator section...

Navigating Within a File
• In addition to the #pragma mark style notations, we can also put special comments in the code and have then show up in the functions/methods menu as well...
// TODO: blah
// FIXME: blah
// ???: label
// !!!: label

Custom Key Bindings
• Xcode is very flexible and allows you to add your own new keybindings or even re-wire the existing bindings
• This can be configured under Preferences as well...

Refactoring

Refactor Local Variables
• You can chance in scope instances of a variable in a given scope by first selecting the variable, then pressing ⌃⌘T
• This will draw a box around the variable and as you type, all instances of it in the scope will change...

Refactor Instance Variables
• This change in scope feature works well for local variables, but doesn’t work for class level instance variables
• To refactor all instances of a property across a class you can use ⇧⌘J over the property to bring up the refactoring dialog...

Refactor Instance Variables
• Renaming a property by refactoring has the added benefit that it will even go into the NIB file and make changes there
• Additionally, you can also preview (and approve or deny) what’s going to change before Xcode actually does it

Refactor Classes
• You can also use refactoring to rename classes
• In this case, in addition to renaming everything in the implementation, header and NIB files Xcode will also rename the files themselves for you...

Refactor to Extract Code into Method
•We can also use the refactor command to automatically separate out a chunk of inline code to its own method
• Simply select the section of code and press ⇧⌘J...

Refactor to Extract Code into Method
• This will do some analysis of the code and suggest a method signature based on what’s going on in the code
• Here’s the stubbed out method signature for our selection...

Refactor to Extract Code into Method
•We can give it a name, and preview the changes...

Refactor to Extract Code into Method
• The result of refactoring and extracting some code into a method...

Additional Resources
• Xcode Workspace Guide
• http://developer.apple.com/library/ios/#documentation/DeveloperTools/Conceptual/XcodeWorkspace/
• Xcode Debugging Guide
• http://developer.apple.com/library/ios/#documentation/DeveloperTools/Conceptual/XcodeDebugging/
•What's New in Xcode
• http://developer.apple.com/library/ios/#documentation/DeveloperTools/Conceptual/WhatsNewXcode/
•WWDC ’10 Session 330 Developer Tools State of the Union
• https://developer.apple.com/videos/wwdc/2010/

For Next Class
• Location Awareness Programming Guide
• http://developer.apple.com/library/ios/#documentation/UserExperience/Conceptual/LocationAwarenessPG/