xdsl & ngn - itu · pdf filexdsl & ngn. 2 contents kt vision & strategy converged...
TRANSCRIPT
‘‘s Broadband Strategys Broadband Strategy
InsungInsung Jun, Ph.D.Jun, Ph.D.Vice PresidentVice PresidentNetwork Engineering CenterNetwork Engineering CenterKT Corp.KT Corp.
December 2003December 2003
xDSLxDSL & NGN& NGN
2
ContentsContents
KT Vision & Strategy
Converged Services
Global Leader: KT

3
Global Leader: KTGlobal Leader: KT
4
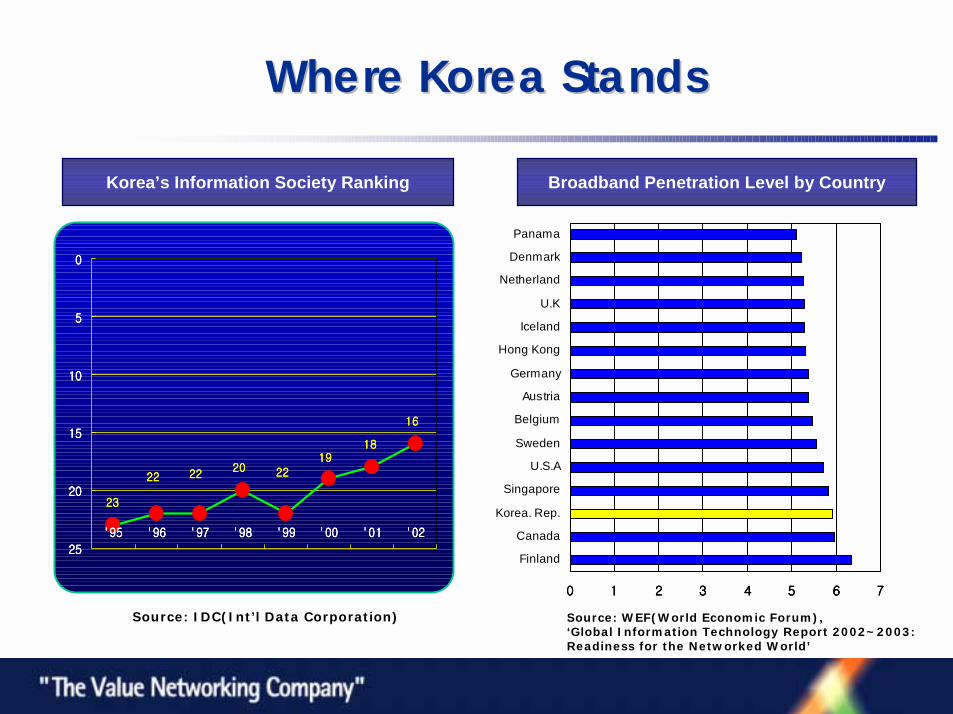
Where Korea StandsWhere Korea Stands
Korea’s Information Society Ranking
Source: IDC(Int’l Data Corporation)
16161616
1818181819191919
22222222202020202222222222222222
23232323
0000
5555
10101010
15151515
20202020
25252525
'95'95'95'95 '96'96'96'96 '97'97'97'97 '98'98'98'98 '99'99'99'99 '00'00'00'00 '01'01'01'01 '02'02'02'02
Broadband Penetration Level by Country
0000 1111 2222 3333 4444 5555 6666 7777
Finland
Canada
Korea. Rep.
Singapore
U.S.A
Sweden
Belgium
Austria
Germany
Hong Kong
Iceland
U.K
Netherland
Denmark
Panama
Source: WEF(World Economic Forum), ‘Global Information Technology Report 2002~2003: Readiness for the Networked World’
5
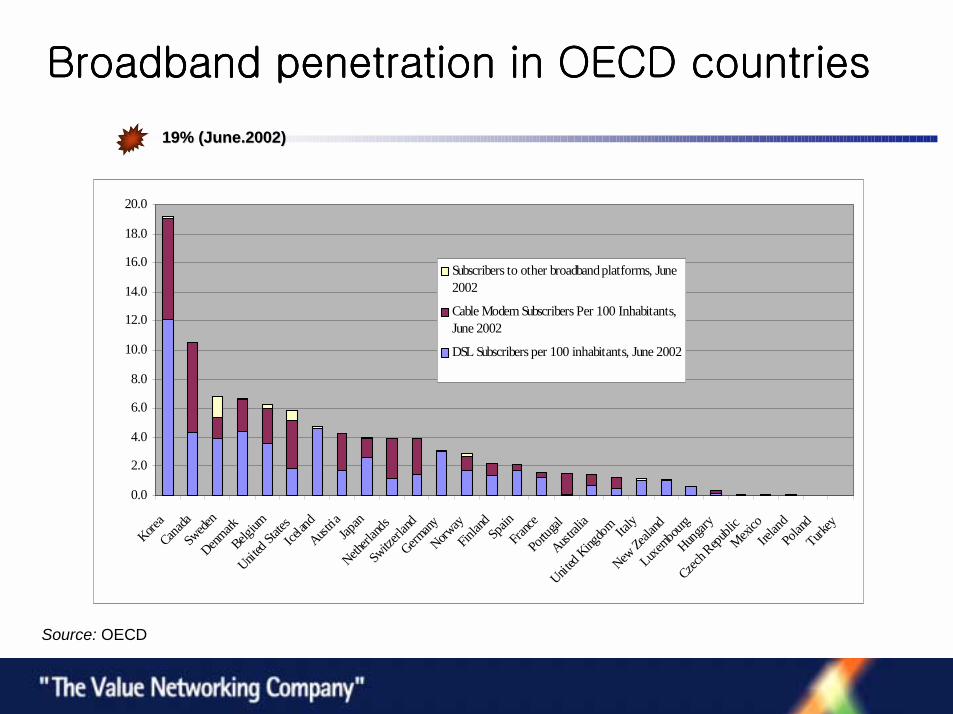
Broadband penetration in OECD countriesBroadband penetration in OECD countriesBroadband penetration in OECD countriesBroadband penetration in OECD countries
Source: OECD
19% (June.2002)19% (June.2002)
0.0
2.0
4.0
6.0
8.0
10.0
12.0
14.0
16.0
18.0
20.0
Korea
Canada
Swede
n Denm
ark
Belgium
United
States
Ice
land
Austria
Jap
anNeth
erland
s Sw
itzerla
nd Germ
any
Norway
Fin
land
Spain
Fra
nce
Portu
gal
Australi
a
United
Kingdo
m Ita
ly New
Zeala
nd Luxe
mbourg
Hungary
Czech R
epubli
c Mexi
co
Irelan
d Po
land
Turkey
Subscribers to other broadband platforms, June2002
Cable Modem Subscribers Per 100 Inhabitants,June 2002
DSL Subscribers per 100 inhabitants, June 2002

6
Traffics of Major KT ServicesTraffics of Major KT Services
0.E+00
1.E+09
2.E+09
3.E+09
4.E+09
5.E+09
6.E+09
7.E+09
1998
1999
2000
2001
Local call Long distance call
International call LM call
ML call
7
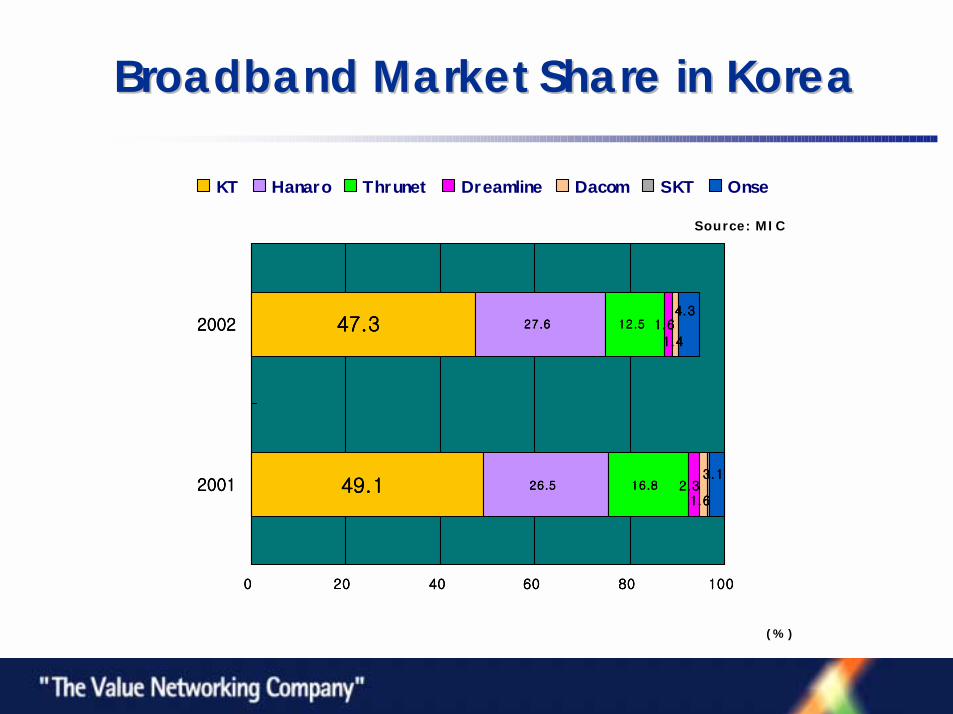
Broadband Market Share in Korea Broadband Market Share in Korea
49.149.149.149.1
47.347.347.347.3
26.526.526.526.5
27.627.627.627.6
16.816.816.816.8
12.512.512.512.5
2.32.32.32.3
1.61.61.61.6
1.61.61.61.6
1.41.41.41.4
3.13.13.13.1
4.34.34.34.3
0000 20202020 40404040 60606060 80808080 100100100100
2001200120012001
2002200220022002
KT Hanaro Thrunet Dreamline Dacom SKT Onse
Source: MIC
(%)
8
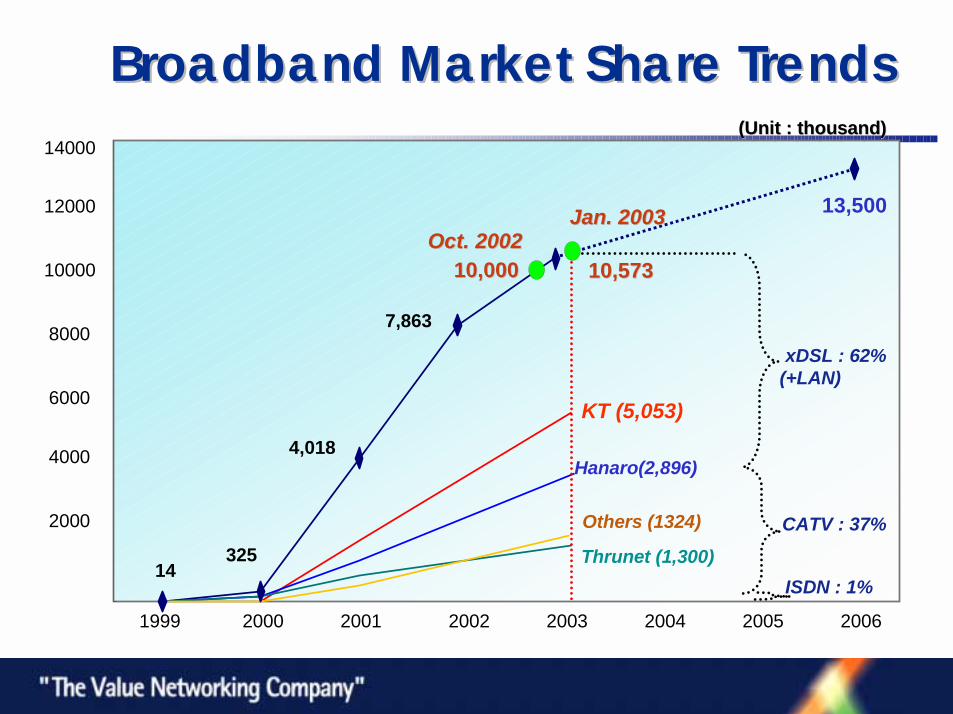
Broadband Market Share TrendsBroadband Market Share Trends
2000
4000
6000
8000
10000
12000
1999 2000 2001 2002 2003 2004 2005 2006
(Unit : thousand)(Unit : thousand)
4,018
7,863
13,500
32514
10,00010,000
CATV : 37%
ISDN : 1%
xDSL : 62%(+LAN)
Oct. 2002Oct. 2002
14000
Jan. 2003Jan. 2003
KT (5,053)
Hanaro(2,896)
Thrunet (1,300)
Others (1324)
10,57310,573
9
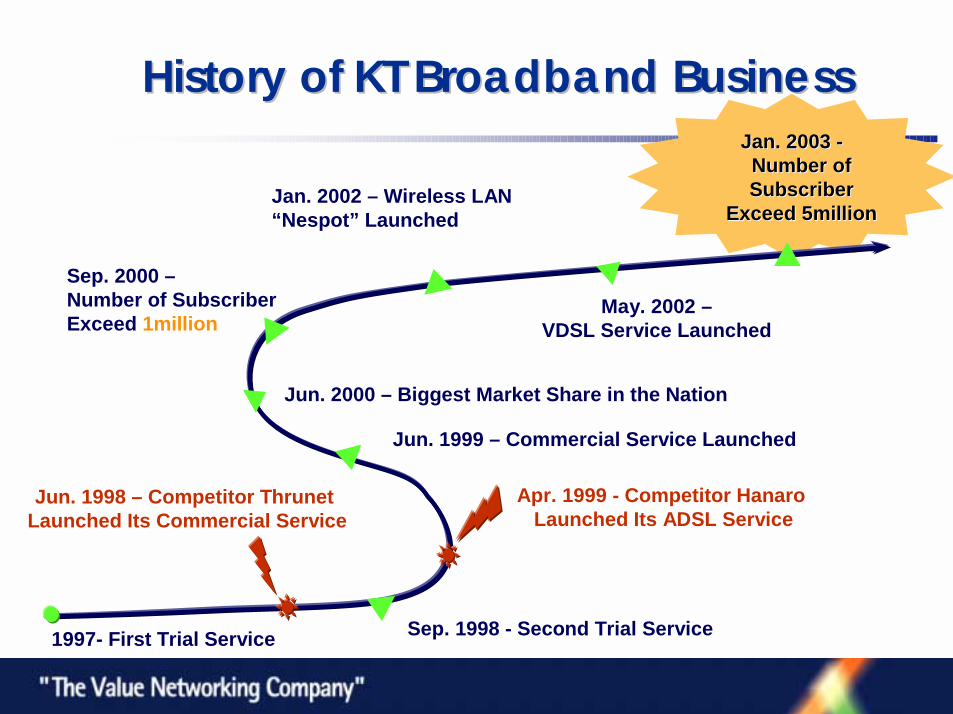
History of KT Broadband Business History of KT Broadband Business
1997- First Trial Service
Sep. 2000 –Number of Subscriber Exceed 1million
Jun. 1999 – Commercial Service Launched
Jun. 2000 – Biggest Market Share in the Nation
Jan. 2003 Jan. 2003 --Number of Number of Subscriber Subscriber
Exceed 5millionExceed 5millionJan. 2002 – Wireless LAN“Nespot” Launched
May. 2002 –VDSL Service Launched
Apr. 1999 - Competitor HanaroLaunched Its ADSL Service
Jun. 1998 – Competitor ThrunetLaunched Its Commercial Service
Sep. 1998 - Second Trial Service
10
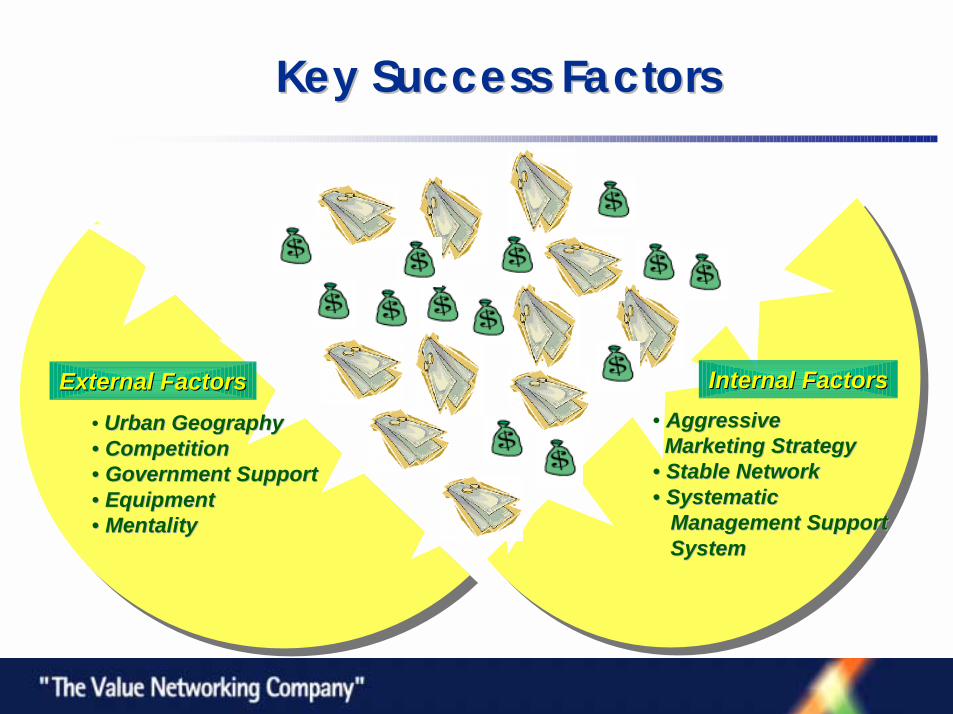
Key Success Factors Key Success Factors
• Urban GeographyUrban Geography•• CompetitionCompetition•• Government SupportGovernment Support•• EquipmentEquipment•• MentalityMentality
External FactorsExternal Factors Internal FactorsInternal Factors• Aggressive Aggressive
Marketing StrategyMarketing Strategy•• Stable NetworkStable Network•• Systematic Systematic
Management Support Management Support System System
11
Converged ServicesConverged Services
12
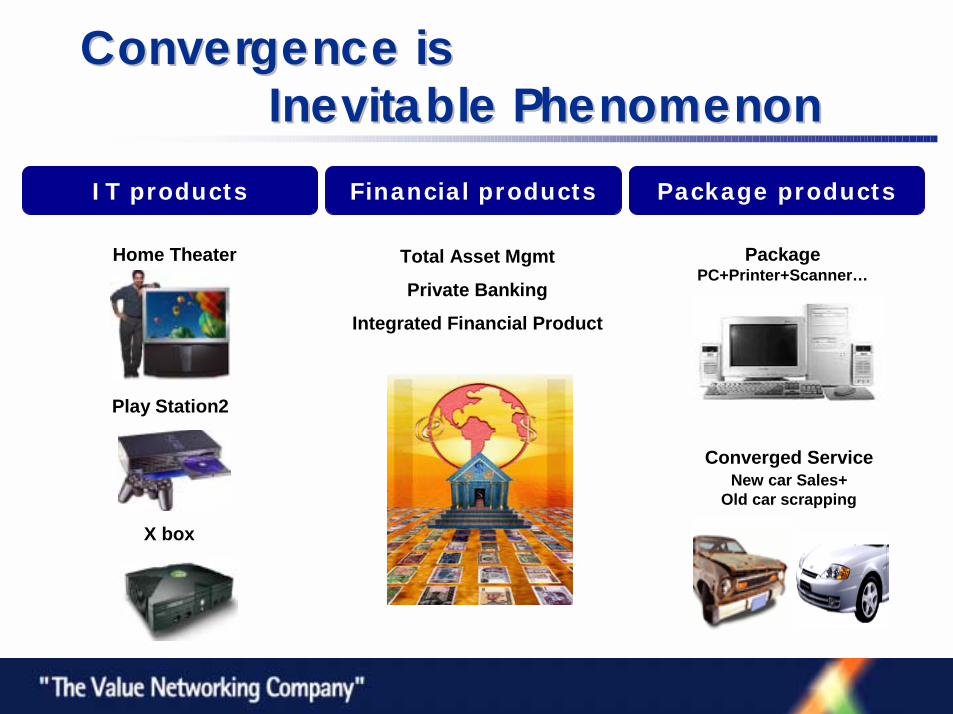
Convergence is Convergence is Inevitable PhenomenonInevitable Phenomenon
IT products
Home Theater
X box
Play Station2
Package products
PackagePC+Printer+Scanner…
Converged ServiceNew car Sales+
Old car scrapping
Financial products
Total Asset Mgmt
Private Banking
Integrated Financial Product

13
What Triggers Convergence?What Triggers Convergence?
Customer Needs
Multi-Function
Convenience
Affordable Price
Development of Technology: Digitalization
Product Convergence
Marketing Convergence
Network Convergence
Device Convergence
Content Convergence
Media Convergence

14
KTKT’’ss Service Evolution Phases Service Evolution Phases
ADSL
VDSL
NESPOT
Sep. 2000: Number of Subscriber Exceed 1 MillionJun. 1999: Commercial Service Launched
Jan. 2002: Service Launched
May. 2002: Service Launched
xDSL
Telephone
NGN
May. 1997: The Number of Telephone Subscribers Exceed 20 Million
Oct. 1988: The Number of Telephone Subscribers Exceed 10 Million
Jan. 2003: Number of Subscriber Exceed 5 Million
Home Digital Service
DMB
2.3GHz

15
KT WLAN: NESPOTKT WLAN: NESPOT
BusinessObjective
•To Meet an Ever-growing Needs for Mobile Internet Service•To Develop ‘front-end service’ by Combining Widespread Broadband and Wireless Solutions
Target Market
Hot Spot•About 18,000 Hot Spots is available in Korea•25,000 Hot Spots accessible through the global roaming by the end of 2003
Service Launch March, 2002
No. of Subscribers 293,000 as of Aug. 2003
Residential Customer, Enterprise Customers, Travelers

16
Public WLAN Positioning
CDMA/Phone
Megapass
PC
Mobility
Speed
Students at home
WEB
PC
high
Home, Office
MegapassMegapass
Ordinary
Voice, Short Message
Phone, PDA
slow
Wide area
CDMACDMA
Students on Campus
Businessman at Hotel, etc
Customers
E-book, VOD, AOD,
POP3 Mail, Messenger
Application
PDA, NotebookTerminals
highThroughput
Hot spots
Wireless LANWireless LAN
Coverage
Stationary MobileQuasi-
W-LAN
PDA
10Mbps
2Mbps
17
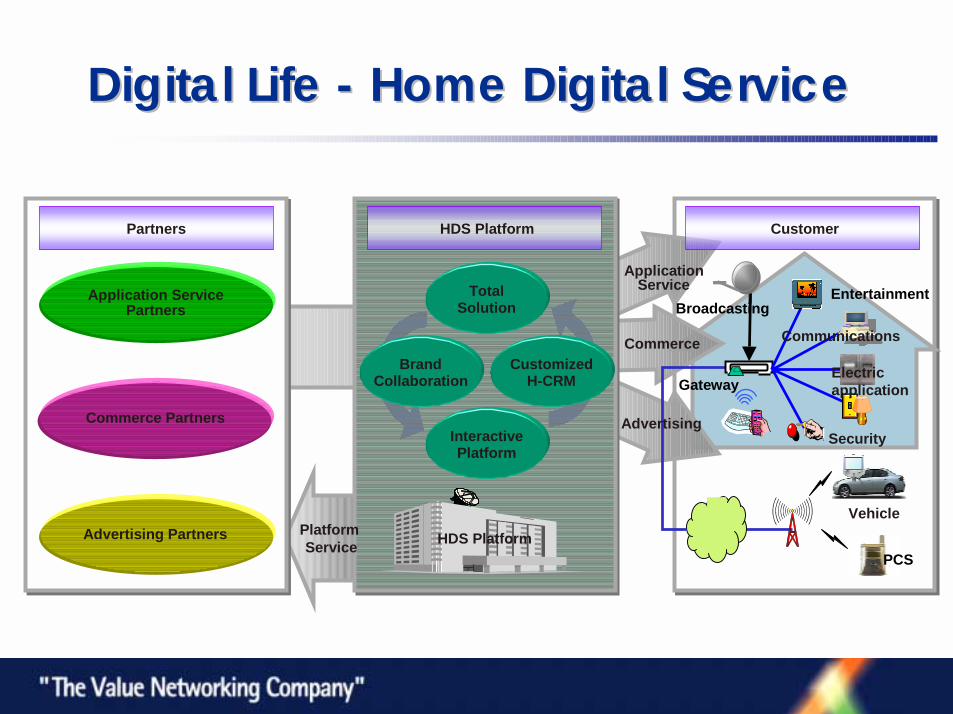
Digital Life Digital Life -- Home Digital ServiceHome Digital Service
TotalSolution
InteractivePlatform
Commerce
ApplicationService
Platform Service HDS Platform
Partners HDS Platform Customer
Application ServicePartners
Commerce Partners
Advertising Partners
CustomizedH-CRM
BrandCollaboration
PCS
Vehicle
Advertising
BroadcastingEntertainment
Communications
Electric application
Security
Gateway
18
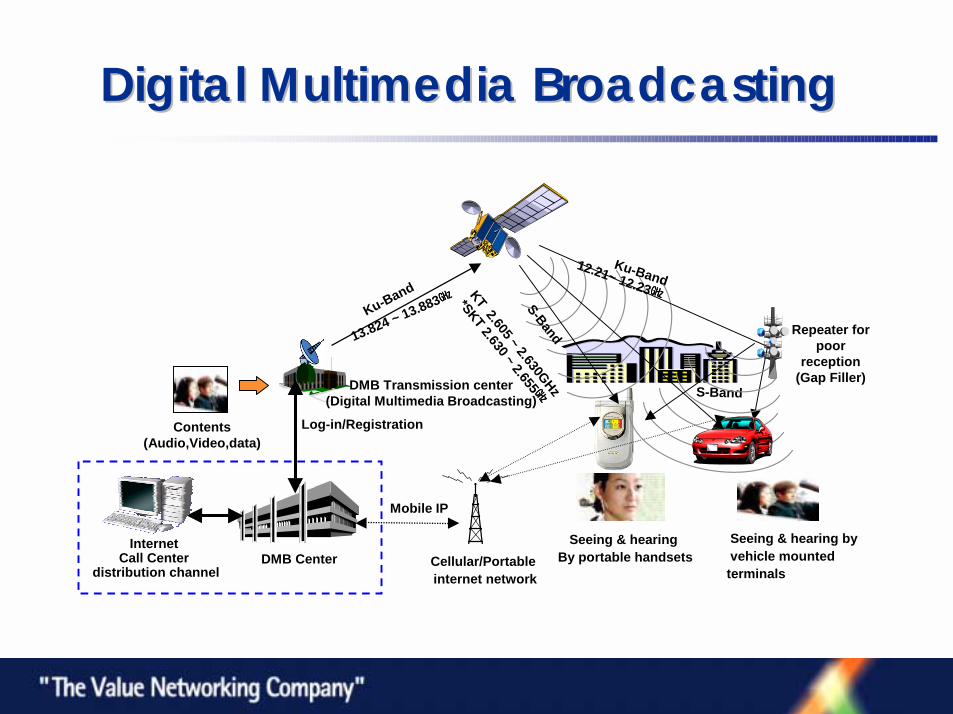
Digital Multimedia BroadcastingDigital Multimedia Broadcasting
InternetCall Center
distribution channel
Repeater for poor
reception (Gap Filler)
Seeing & hearing By portable handsets
Log-in/Registration
Cellular/Portable internet network
Contents(Audio,Video,data)
Seeing & hearing by vehicle mounted terminals
DMB Transmission center(Digital Multimedia Broadcasting)
Ku-Band
Ku-Band
S-Band13.824 ~ 13.883㎓㎓㎓㎓
KT 2.605 ~ 2.630GHz
*SKT 2.630 ~ 2.655㎓㎓㎓㎓
12.21~ 12.23㎓㎓㎓㎓
Mobile IP
DMB Center
S-Band

19
KT Vision & StrategyKT Vision & Strategy
20
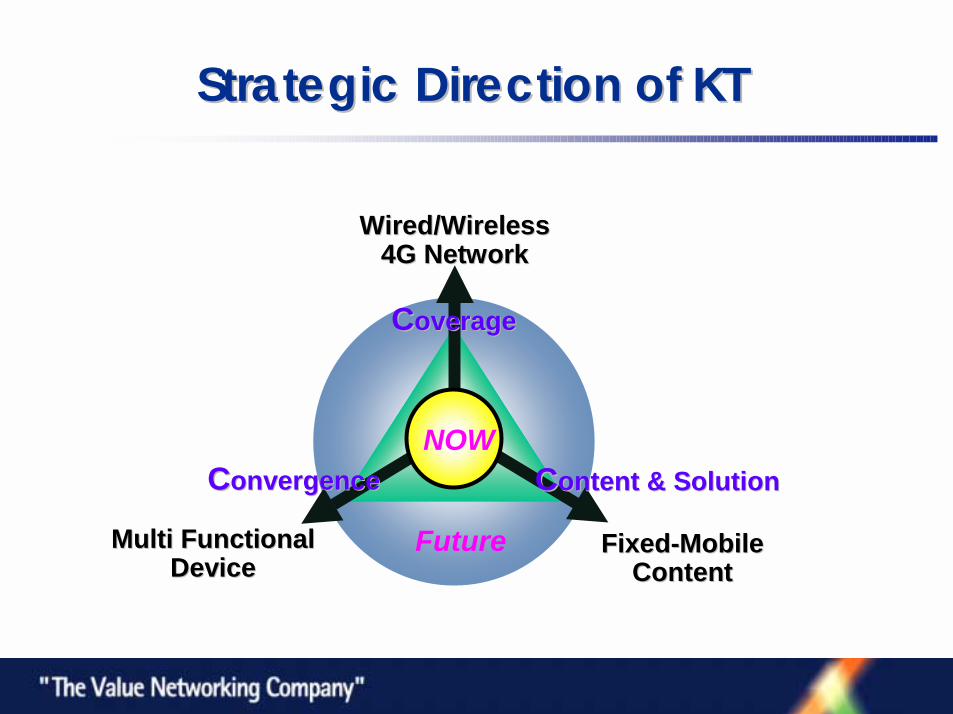
Strategic Direction of KTStrategic Direction of KT
Wired/WirelessWired/Wireless4G Network4G Network
FixedFixed--MobileMobileContentContent
Multi FunctionalMulti FunctionalDeviceDevice
NOWCConvergenceonvergence CContent & Solutionontent & Solution
CCoverageoverage
Future

21
Next Generation NetworkNext Generation Network
TodaySingle-service Network
Servers
Clients
Backbone Network
AccessAccess
NGNMulti-service NW/client-server
Communication Control
Content Content
Access
Dat
a/IP
Net
wor
ks
PLM
N
PSTN
/ISD
N
CA
TV
Services
Access Transport & Switching Networks
22
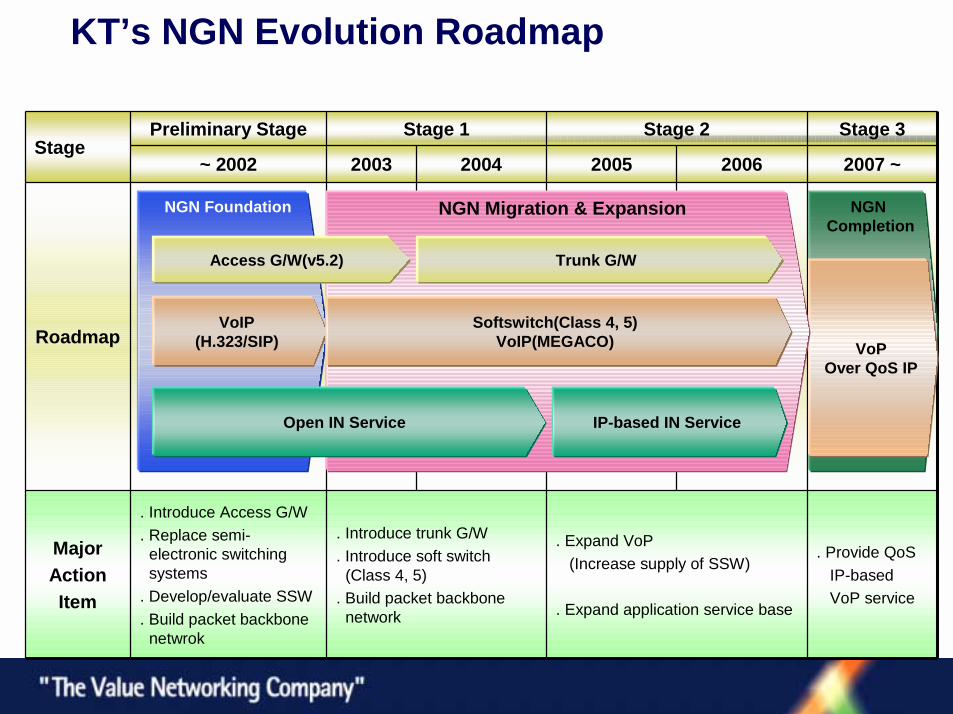
KT’s NGN Evolution Roadmap
Roadmap
. Provide QoSIP-basedVoP service
. Expand VoP(Increase supply of SSW)
. Expand application service base
. Introduce trunk G/W
. Introduce soft switch (Class 4, 5)
. Build packet backbone network
. Introduce Access G/W
. Replace semi-electronic switching systems
. Develop/evaluate SSW
. Build packet backbone netwrok
MajorActionItem
2007 ~2006200520042003~ 2002
Stage 3Stage 2Stage 1Preliminary StageStage
NGN Foundation
VoIP(H.323/SIP)
NGN Completion
VoPOver QoS IP
NGN Migration & Expansion
Access G/W(v5.2)
Open IN Service
Trunk G/W
Softswitch(Class 4, 5)VoIP(MEGACO)
IP-based IN Service
23
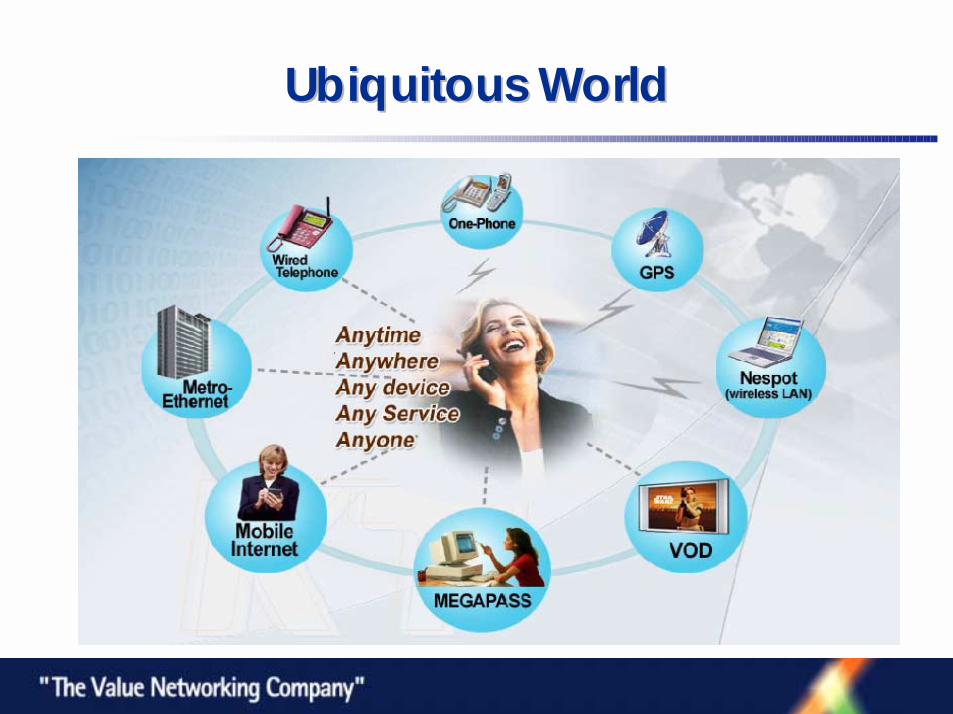
Ubiquitous WorldUbiquitous World

24
Converged Broadband Services on Converged Broadband Services on NGN Will Guarantee NGN Will Guarantee KTKT’’ss Continuous Continuous Lead in Global IT IndustryLead in Global IT Industry
Thank you!Thank you!