xenon gamma detector project support · xenon gamma detector project support ... final technical...
TRANSCRIPT
BNL-80335-2008
Xenon Gamma Detector Project Support
Peter E. Vanier and Leon Forman
April 2008
Nonproliferation and National Security Department Detector Development and Testing Division
Brookhaven National Laboratory P.O. Box 5000
Upton, NY 11973-5000 www.bnl.gov
Prepared as a Final Technical Report
to DOE NA-22 on project
BL04-BL300-DP05 Notice: This manuscript has been authored by employees of Brookhaven Science Associates, LLC under Contract No. DE-AC02-98CH10886 with the U.S. Department of Energy. The publisher by accepting the manuscript for publication acknowledges that the United States Government retains a non-exclusive, paid-up, irrevocable, world-wide license to publish or reproduce the published form of this manuscript, or allow others to do so, for United States Government purposes.
1
DISCLAIMER
This report was prepared as an account of work sponsored by an agency of the United States Government. Neither the United States Government nor any agency thereof, nor any of their employees, nor any of their contractors, subcontractors, or their employees, makes any warranty, express or implied, or assumes any legal liability or responsibility for the accuracy, completeness, or any third party’s use or the results of such use of any information, apparatus, product, or process disclosed, or represents that its use would not infringe privately owned rights. Reference herein to any specific commercial product, process, or service by trade name, trademark, manufacturer, or otherwise, does not necessarily constitute or imply its endorsement, recommendation, or favoring by the United States Government or any agency thereof or its contractors or subcontractors. The views and opinions of authors expressed herein do not necessarily state or reflect those of the United States Government or any agency thereof.
2
Xenon Gamma Detector Project Support
Peter E. Vanier and Leon Forman
Contents Executive Summary 3
1. Introduction 4
2. Historical background and summary of prior work 5
3. Project Narrative 6
4. Conclusions and Comments 14
3
Executive Summary
This project provided funding of $48,500 for part of one year to support the development of compressed xenon spectrometers at BNL. This report describes upgrades that were made to the existing detector system electronics during that period, as well as subsequent testing with check sources and Special Nuclear Materials. Previous testing of the equipment extended only up to the energy of 1.3 MeV, and did not include a spectrum of Pu-239. The new electronics allowed one-button activation of the high voltage ramp that was previously controlled by manual adjustments. Mechanical relays of the charging circuit were replaced by a tera-ohm resistor chain and an optical switch. The preamplifier and shaping amplifier were replaced by more modern custom designs. We found that the xenon purity had not been degraded since the chamber was filled 10 years earlier. The resulting spectra showed significantly better resolution than sodium iodide spectra, and could be analyzed quite effectively by methods using peak area templates.
4

1.0 Introduction In 2004, BNL submitted a lifecycle plan for resuming development of compressed xenon gamma spectrometers which had been the subject of an earlier NN-20 project during 1993-95. It was proposed to design and construct new designs of xenon tube, and to begin to stack them together into arrays in order to obtain higher sensitivity without loss of spectral resolution. The proposal requested $350k per year for 3 years. After delays in funding due to a continuing budget resolution, BNL received mid-year funding for $48.5k on project BL04-BL300-DP05 Xenon Detector Project Support. With this amount of funding, it was clear that the original plan could not be accomplished, and a more modest scope of work had to be defined. BNL opted to use the NA-22 funds to carry out tests on SNM sources with the existing portable BNL xenon spectrometer, which was being refurbished with new electronics by the Instrumentation Division under a Lab-Directed Research and Development project. Previously, this detector had not been used to measure a Pu-239 spectrum, and earlier tests with an HEU foil had only extended to 1028 keV. It was important to show whether the xenon spectrometer was useful for gamma energies up to 3 MeV. These spectra were analyzed using available spectroscopy tools such as PeakEasy and GADRAS. BNL also made some progress on an automated analysis algorithm based on the method developed for BNL by Ray Gunnink for a previous NA-22 project entitled Controlled intrusiveness Verification Technology. This economical method used a template matching approach based on base-line-subtracted peak areas in specific regions of interest. The method worked well for high-resolution spectra obtained with high purity germanium spectrometers, but was not applicable to low-resolution spectra obtained with sodium iodide, which required full-spectrum fitting. Since the resolution of xenon spectrometers is intermediate between the two standard instruments, it was not initially obvious which method of template matching would be most appropriate. Nor was it clear how good the energy resolution needed to be in order to provide a significant advantage over sodium iodide technology.
5

2.0 Historical background and summary of prior work Research on high pressure xenon gamma spectrometers was pioneered by scientists at the Moscow Engineering and Physics Institute (MEPhI). A prototype spectrometer was used on board the MIR space station to monitor gamma radiation experienced by astronauts in low earth orbit.1 A project was funded by NN-20 at BNL during 1993-95 to develop a planar Frisch Grid high pressure xenon spectrometer. The resulting device, shown in Fig. 1, achieved a resolution of 2.5 % at 662 keV, but only used 88 g of xenon within the sensitive volume of 160 cm3, and therefore had low absolute sensitivity.2 One drawback of the planar design is the inefficient use of the total volume of xenon, much of which (~1 liter) is outside of the high-field charge-collection region. One advantage is the uniform field within the collection region, which helps to give good energy resolution.
Fig. 1. The internal electrode structure of a prototype compressed xenon detector built at BNL. Note the cathode disk at the top, two field-shaping rings, a Frisch grid mesh, and the anode plate near the center. Much of the xenon-filled space was not used, except as insulation.
1 A.E.Bolotnikov, V.V.Dmitrenko, A.S.Romanuk, S.I.Suchkov and Z.M.Uteshev Z.M., Journal of Technical Physics (USSR), Vol.58, p.734 (1988). Translation in Sov. Phys.-Technical Phys. (USA), .33, 449 (1988) 2 G.J. Mahler, B. Yu, G.C Smith, W.R. Kane, and J.R. Lemley, “A portable gamma –ray spectrometer using compressed xenon”, IEEE Transactions on Nuclear Science, 45(3), 1029 (1998).
6
HPXe has a high stopping power for gamma-rays, is mechanically and chemically stable, and is a relatively low cost material (the current market price for high-purity xenon is about $1/g, compared to $50/g for HPGe or $300/g for CZT). There are no fundamental limitations for the size of HPXe detectors, which may be built in a variety of configurations. These detectors have been demonstrated to have good energy resolution, high detection efficiency and long-term stability. They should be cost-effective, robust, and could potentially be arranged in large systems with square meters of detecting area. The high reliability of HPXe detectors has been demonstrated in industrial facilities, during field applications (e.g., helicopter-borne systems), and onboard the space station MIR (~10-year operation period).
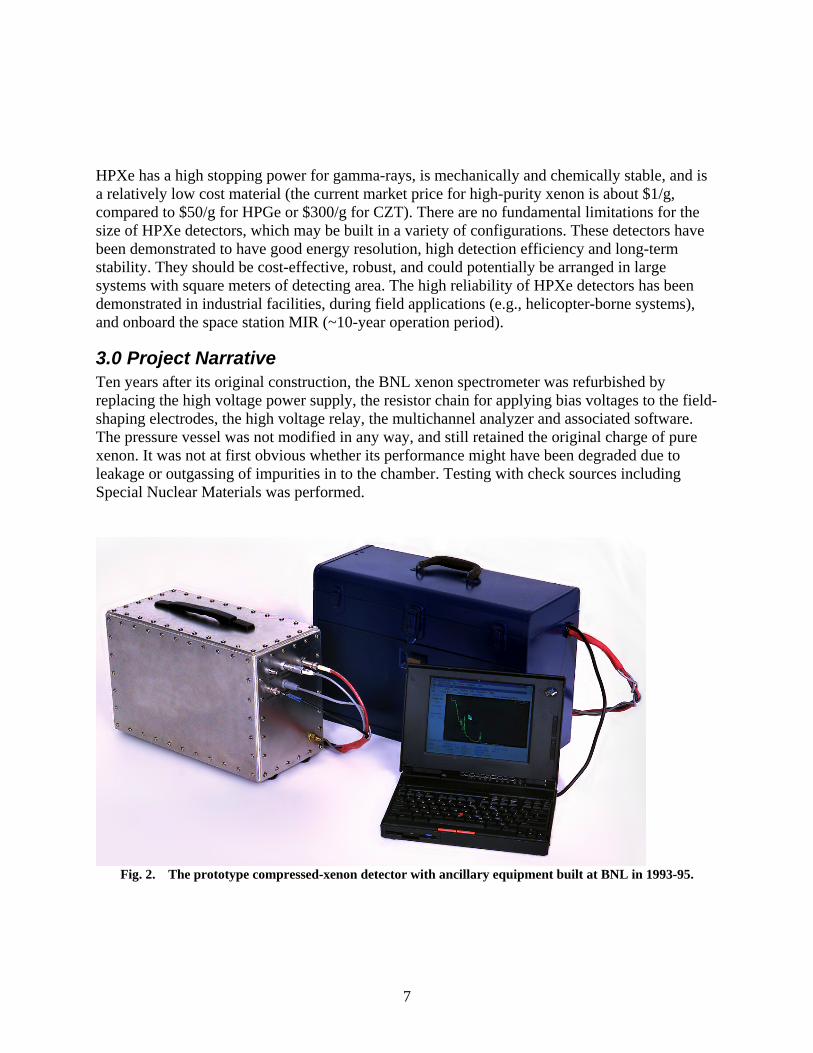
3.0 Project Narrative Ten years after its original construction, the BNL xenon spectrometer was refurbished by replacing the high voltage power supply, the resistor chain for applying bias voltages to the field-shaping electrodes, the high voltage relay, the multichannel analyzer and associated software. The pressure vessel was not modified in any way, and still retained the original charge of pure xenon. It was not at first obvious whether its performance might have been degraded due to leakage or outgassing of impurities in to the chamber. Testing with check sources including Special Nuclear Materials was performed.
Fig. 2. The prototype compressed-xenon detector with ancillary equipment built at BNL in 1993-95.
7
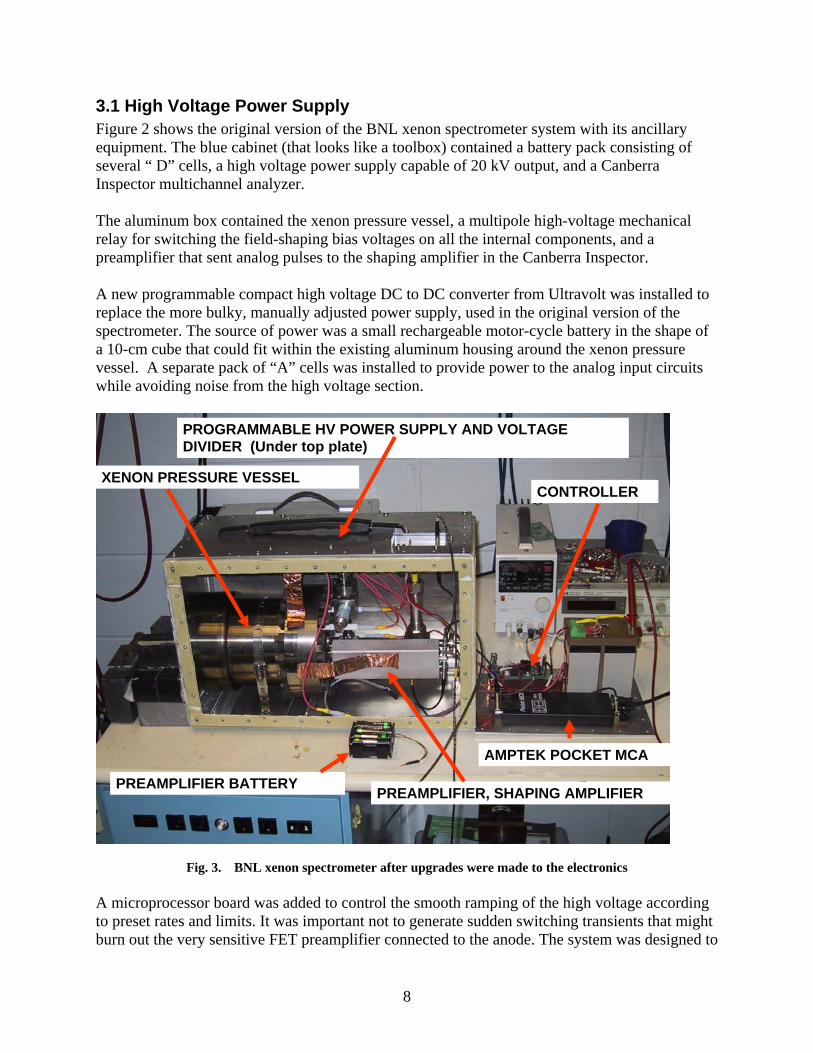
3.1 High Voltage Power Supply Figure 2 shows the original version of the BNL xenon spectrometer system with its ancillary equipment. The blue cabinet (that looks like a toolbox) contained a battery pack consisting of several “ D” cells, a high voltage power supply capable of 20 kV output, and a Canberra Inspector multichannel analyzer. The aluminum box contained the xenon pressure vessel, a multipole high-voltage mechanical relay for switching the field-shaping bias voltages on all the internal components, and a preamplifier that sent analog pulses to the shaping amplifier in the Canberra Inspector. A new programmable compact high voltage DC to DC converter from Ultravolt was installed to replace the more bulky, manually adjusted power supply, used in the original version of the spectrometer. The source of power was a small rechargeable motor-cycle battery in the shape of a 10-cm cube that could fit within the existing aluminum housing around the xenon pressure vessel. A separate pack of “A” cells was installed to provide power to the analog input circuits while avoiding noise from the high voltage section.
Fig. 3. BNL xenon spectrometer after upgrades were made to the electronics A microprocessor board was added to control the smooth ramping of the high voltage according to preset rates and limits. It was important not to generate sudden switching transients that might burn out the very sensitive FET preamplifier connected to the anode. The system was designed to
PREAMPLIFIER BATTERY
XENON PRESSURE VESSEL
PROGRAMMABLE HV POWER SUPPLY AND VOLTAGE DIVIDER (Under top plate)
CONTROLLER
AMPTEK POCKET MCA
PREAMPLIFIER, SHAPING AMPLIFIER
8
charge up capacitors on the electrodes, then disconnect and switch off the HV power supply during measurement periods. Before 1 % of the voltage on the capacitors had time to leak away, the HV was cyclically reconnected for brief charging periods representing an overall dead time of about 1 %. During each charging phase, the preamplifier was protected from transients by grounding the input. All of these processes were programmed to happen automatically, so that the operator just had to turn on a single switch and wait for the system to reach the voltage set-point before starting to acquire data. Light-emitting diode indicators were installed to show the status of the system.
3.2 Resistor chain and relay One novel feature of the new system was the replacement of a bulky bank of mechanical relay contacts with a single optical switch and a tera-ohm resistor chain. This modification still allowed minimal current requirements for the high voltage supply to provide the series of bias voltages, and enabled the timing of the recharge circuit to be adjusted by programming. The glass-encapsulated resistors were further protected from moisture and leakage currents by embedding them in an epoxy block.
3.3 Preamplifier and analog electronics The analog input circuit, consisting of a field effect transistor (FET) preamplifier and a customized hybrid shaping amplifier, was designed for minimum noise with a shaping time of about 16 microseconds. This parameter is a compromise between integrating the slower components of the collected charge cloud in the xenon and avoiding integrating the low frequency 1/f noise. Longer integration times would tend to reduce the ballistic deficit for higher energy events, but would also add to the noise component. The electronics in the previous version made use of a modified board in the Canberra Inspector that increased the integration time beyond the standard settings used for HPGe and NaI. However, it was not clear that the modified board was optimized for the xenon application.
3.4 Multichannel Analyzer In place of the Canberra Inspector, a compact multichannel analyzer from Amptek, the Pocket MCA -8000A, was installed, and its spectral analysis software was loaded in the laptop computer. Although there are some issues with the performance of this instrument, it is quite adequate for testing compressed xenon spectrometers. The system stores spectral files in two formats, one of which is a simple text file that can be plotted by Excel and read by PeakEasy or Cambio analysis applications. In earlier trials of the spectrometer, we had difficulties transferring the Canberra (.CNF) files into a format that could be read by the analysis and plotting programs. A LabView virtual instrument was created to read the text files and plot them, in preparation for developing an isotope identification algorithm based on the code developed for the CIVET project.
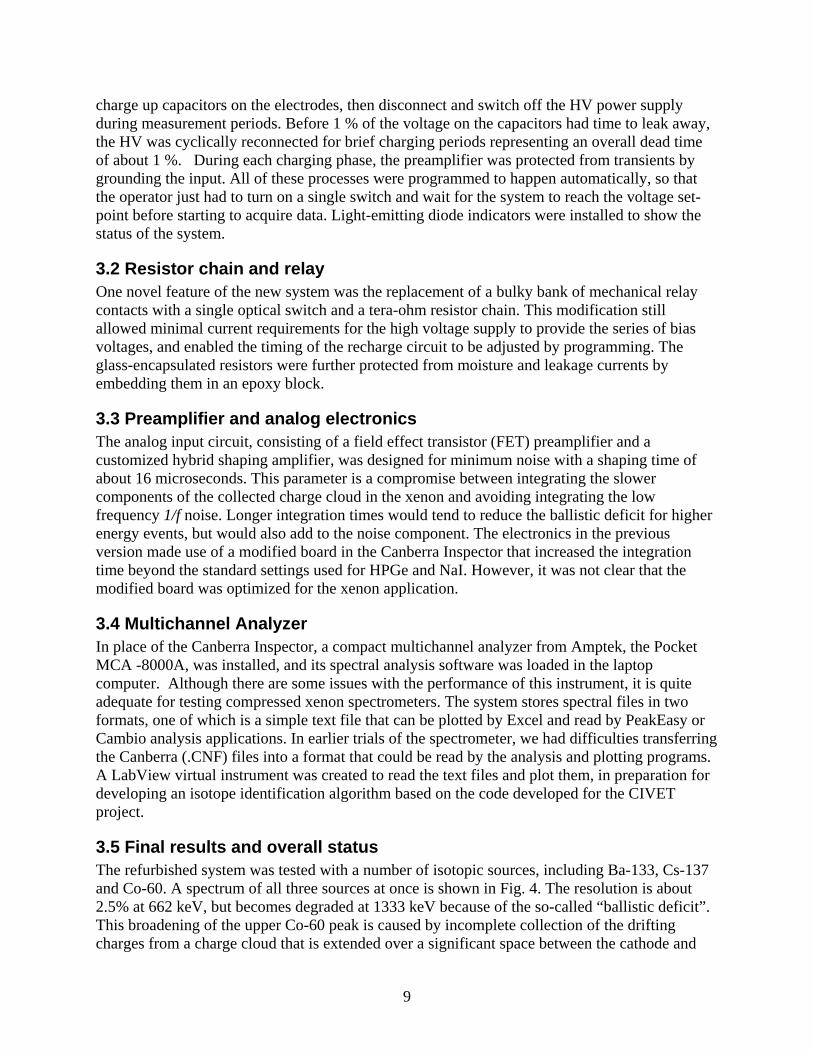
3.5 Final results and overall status The refurbished system was tested with a number of isotopic sources, including Ba-133, Cs-137 and Co-60. A spectrum of all three sources at once is shown in Fig. 4. The resolution is about 2.5% at 662 keV, but becomes degraded at 1333 keV because of the so-called “ballistic deficit”. This broadening of the upper Co-60 peak is caused by incomplete collection of the drifting charges from a charge cloud that is extended over a significant space between the cathode and
9
the Frish grid. Since the drift velocity is about 1 mm per microsecond, an integration time of 16 microseconds is inadequate to collect a charge cloud spread out over more than 16 mm. This also explains why the full energy peak for the 2.6 MeV line from Th-232 is not seen by this detector. The spectrum also shows a spurious peak at the low energy end, just above the lower level discriminator threshold. This response is due to the electronic noise in the system, which prevents measurements of peaks below about 80 keV. Since photons with energies below about 100 keV are highly attenuated by the pressure vessel and the dead layer of xenon in front of the anode, there is no loss of information due to the electronic noise. It would have been better to set a slightly higher discriminator threshold so as to avoid showing the appearance of a low energy peak.
10
100
1000
10000
100000
0 500 1000 1500 2000 2500
ENERGY (keV)
CO
UN
TS
Ba-133
Cs-137
Co-60
Fig. 4. A test of the BNL xenon spectrometer using three check sources at once. The system shows better
resolution than NaI spectrometers. Figure 5 shows a closer look at a Cs-137 spectrum, analyzed using the PeakEasy software. Features such as the Compton edge and the backscatter peak show clearly, and are useful to the spectroscopy analyst in identifying isotopes in spectra. The energy resolution, shown in Figure 6 as 2.5 % at 662 keV, is much better than that of NaI spectrometers, making it easier for the analyst to distinguish between peaks that are close together. The peak-to-Compton ratio is about 2, which is not as good as can be obtained with some other detectors, partly due to the Compton scattering in the pressure vessel walls and the xenon dead layer.
10
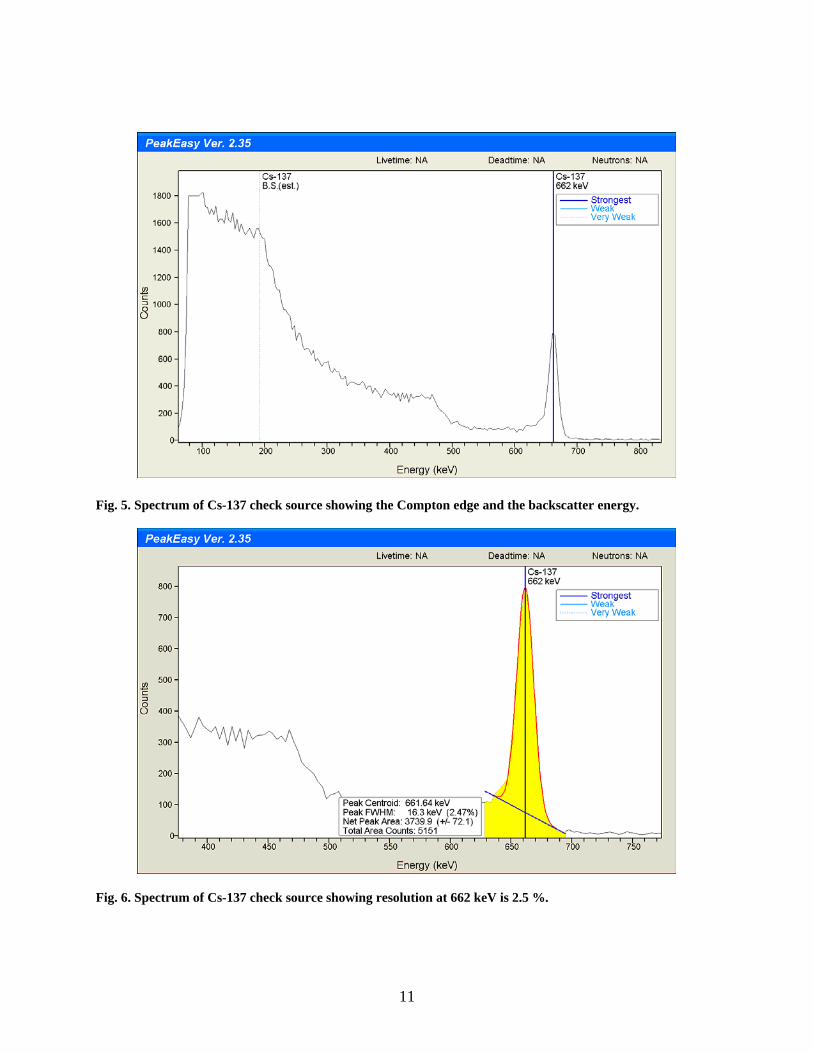
Fig. 5. Spectrum of Cs-137 check source showing the Compton edge and the backscatter energy.
Fig. 6. Spectrum of Cs-137 check source showing resolution at 662 keV is 2.5 %.
11
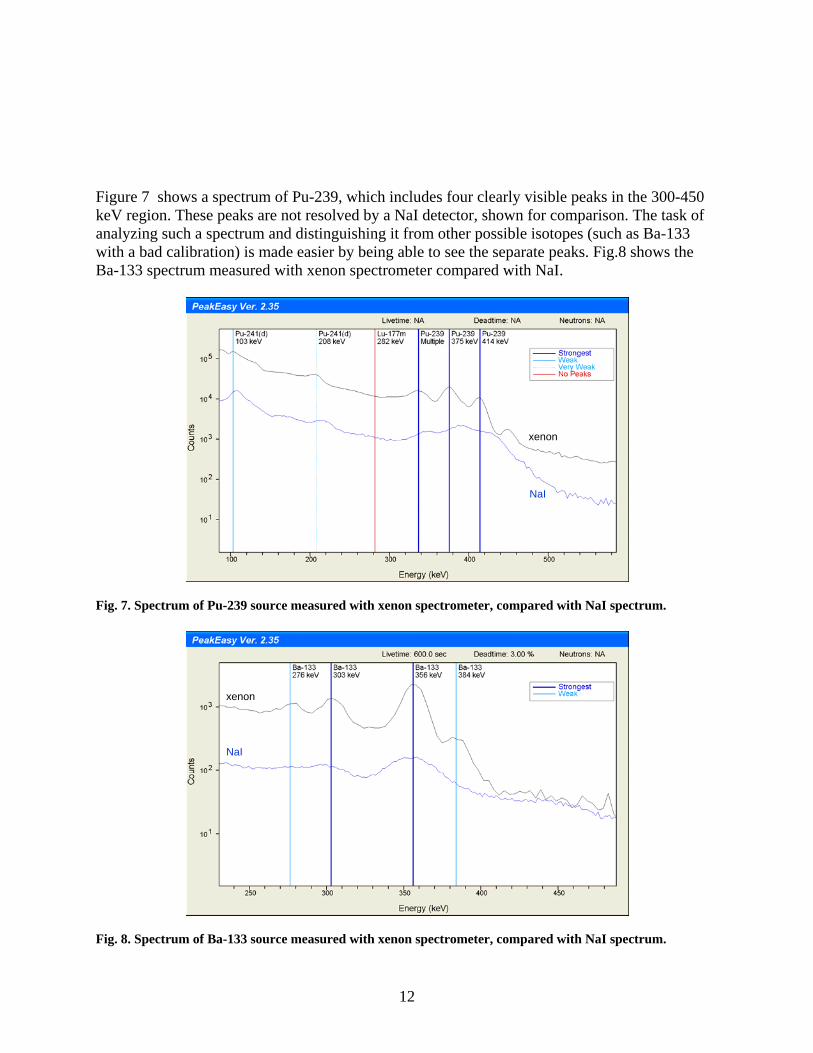
Figure 7 shows a spectrum of Pu-239, which includes four clearly visible peaks in the 300-450 keV region. These peaks are not resolved by a NaI detector, shown for comparison. The task of analyzing such a spectrum and distinguishing it from other possible isotopes (such as Ba-133 with a bad calibration) is made easier by being able to see the separate peaks. Fig.8 shows the Ba-133 spectrum measured with xenon spectrometer compared with NaI.
Fig. 7. Spectrum of Pu-239 source measured with xenon spectrometer, compared with NaI spectrum.
Fig. 8. Spectrum of Ba-133 source measured with xenon spectrometer, compared with NaI spectrum.
NaI
xenon
NaI
xenon
12
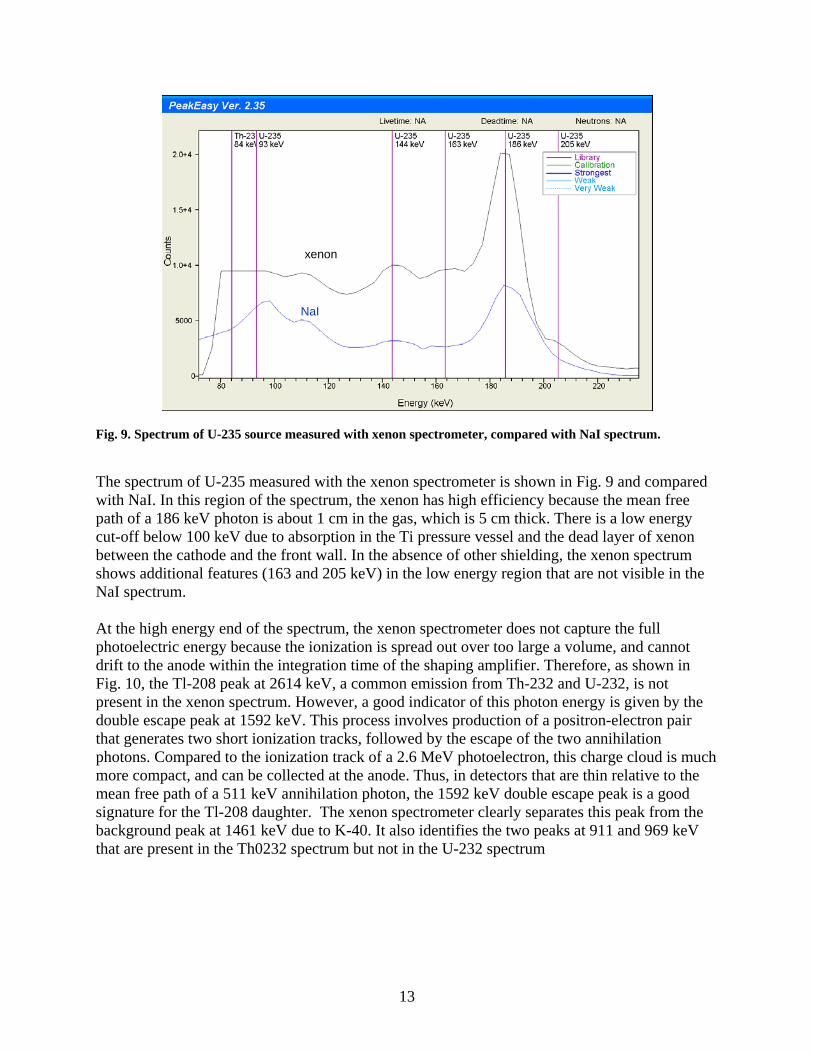
Fig. 9. Spectrum of U-235 source measured with xenon spectrometer, compared with NaI spectrum. The spectrum of U-235 measured with the xenon spectrometer is shown in Fig. 9 and compared with NaI. In this region of the spectrum, the xenon has high efficiency because the mean free path of a 186 keV photon is about 1 cm in the gas, which is 5 cm thick. There is a low energy cut-off below 100 keV due to absorption in the Ti pressure vessel and the dead layer of xenon between the cathode and the front wall. In the absence of other shielding, the xenon spectrum shows additional features (163 and 205 keV) in the low energy region that are not visible in the NaI spectrum. At the high energy end of the spectrum, the xenon spectrometer does not capture the full photoelectric energy because the ionization is spread out over too large a volume, and cannot drift to the anode within the integration time of the shaping amplifier. Therefore, as shown in Fig. 10, the Tl-208 peak at 2614 keV, a common emission from Th-232 and U-232, is not present in the xenon spectrum. However, a good indicator of this photon energy is given by the double escape peak at 1592 keV. This process involves production of a positron-electron pair that generates two short ionization tracks, followed by the escape of the two annihilation photons. Compared to the ionization track of a 2.6 MeV photoelectron, this charge cloud is much more compact, and can be collected at the anode. Thus, in detectors that are thin relative to the mean free path of a 511 keV annihilation photon, the 1592 keV double escape peak is a good signature for the Tl-208 daughter. The xenon spectrometer clearly separates this peak from the background peak at 1461 keV due to K-40. It also identifies the two peaks at 911 and 969 keV that are present in the Th0232 spectrum but not in the U-232 spectrum
NaI
xenon
13

Fig. 10. Spectrum of Th-232 source measured with xenon spectrometer, compared with NaI spectrum. Some effort was put into creating a detector description file for the xenon spectrometer, in order to use GADRAS software to identify isotopes. Fig. 10 shows an example of a calibration spectrum using Cs-137 that was fit to a GADRAS template. The one-dimensional calculation in GADRAS is approximately correct at reproducing the shape of the continuum, including the Compton edge and the backscatter peak.
0 100 200 300 400 500 600 700 800 900
Cs-137 BNL xenon2.pcf,1 - ! live-time(s) = 0.02 chi-square = 13.66
Channel Number
Energy (keV)
50 100 150 200 250
Cou
nts
/ keV
0
500
1000
1500
2000
2500
3000
3500
4000
Fig. 10. Spectrum of Cs-137 source measured with xenon spectrometer, fit to GADRAS template calculated from the geometry and resolution of the detector, using small empirical adjustments to the peak shape.
14
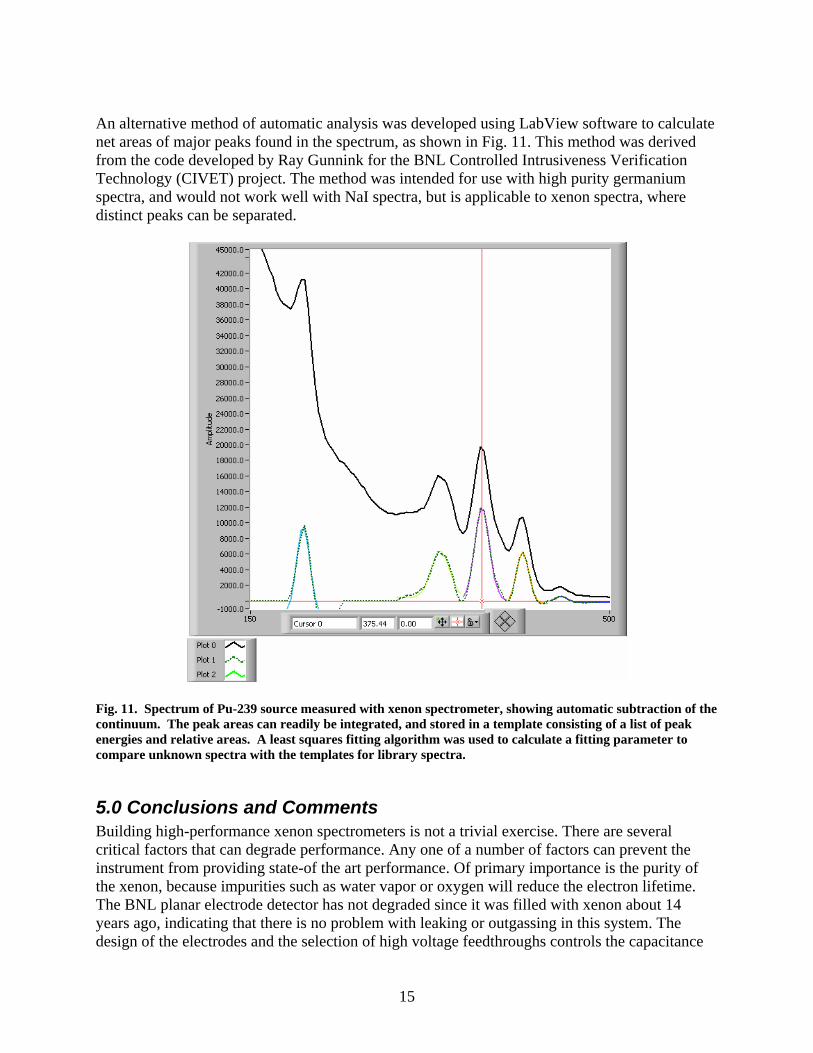
An alternative method of automatic analysis was developed using LabView software to calculate net areas of major peaks found in the spectrum, as shown in Fig. 11. This method was derived from the code developed by Ray Gunnink for the BNL Controlled Intrusiveness Verification Technology (CIVET) project. The method was intended for use with high purity germanium spectra, and would not work well with NaI spectra, but is applicable to xenon spectra, where distinct peaks can be separated.
Fig. 11. Spectrum of Pu-239 source measured with xenon spectrometer, showing automatic subtraction of the continuum. The peak areas can readily be integrated, and stored in a template consisting of a list of peak energies and relative areas. A least squares fitting algorithm was used to calculate a fitting parameter to compare unknown spectra with the templates for library spectra.
5.0 Conclusions and Comments Building high-performance xenon spectrometers is not a trivial exercise. There are several critical factors that can degrade performance. Any one of a number of factors can prevent the instrument from providing state-of the art performance. Of primary importance is the purity of the xenon, because impurities such as water vapor or oxygen will reduce the electron lifetime. The BNL planar electrode detector has not degraded since it was filled with xenon about 14 years ago, indicating that there is no problem with leaking or outgassing in this system. The design of the electrodes and the selection of high voltage feedthroughs controls the capacitance
15
16
connected to the input preamplifier. A low capacitance (less than 30 pF) is essential in order to obtain good signal-to-noise ratios and therefore minimal contribution of the electronic noise to the instrument resolution. There is also a possibility that noise can be introduced into the analog input amplifiers from fluctuations in the high voltage power supply, so it should be de-energized during the measurement cycle and turned on for a short fraction of the time to charge the capacitors. The use of a tera-ohm resistor chain and an optical switch for this purpose has been demonstrated successfully. The integration time of the shaping amplifier needs to be adjusted for optimum performance. Too short an integration time will cause incomplete collection of the charge ionized by a gamma ray event. Too long an integration time will include excessive amplifier noise in the signal. If all these factors are controlled adequately, a xenon spectrometer can provide significant advantages over a NaI spectrometer. The improved resolution helps significantly in identifying isotopes by unique peaks in the spectra. In particular, the main peaks that identify Pu-239 and U-235 can be resolved by the BNL xenon spectrometer. However, the BNL xenon spectrometer has limitations that could be addressed by future designs. The absolute sensitivity of the detector is equivalent to a hand-held search instrument because the mass of xenon actually used for detection is about 88 g. However, the overall weight of the system is several kilograms, including the pressure vessel, the outer housing and the battery, making it clumsy for hand-held applications. For photon energies below about 400 keV, this 5-cm thickness of xenon exceeds the mean free path of the photons, and provides higher absolute sensitivity than a 2” diameter NaI detector, as well as better resolution. At photon energies above 1 MeV, the mean free path of the photons becomes greater than the dimensions of the detector, and the track length of the ionization cloud becomes too great for the drifting charges to be completely collected during the preamplifier integration time. However, the important emission at 2614 keV from U-232 can be detected indirectly by means of the double escape peak at 1592 keV. Competing technologies with resolution better than NaI include LaBr3 scintillators and CZT semiconductors. However, these technologies rely on the difficult process of crystal growth and are not yet available in sufficient quantities and low enough prices for constructing large area spectroscopic portals. Even high purity germanium crystals, which are highly developed as the best high resolution spectrometers, are not available in volumes needed for spectroscopic portal monitors. In principle, xenon spectrometers could compete in large volume production if the details described in this paper are sufficiently heeded. In order to expand the detector to volumes comparable with spectroscopic portals, a different geometry needs to be exploited. More efficient use of the gas volume could be made by using a coaxial electrode design, but if the tube is very long this tends to increase the capacitance of the cylindrical anode, which degrades the resolution. Ideally, a short coaxial design would have low capacitance and effective use of the xenon volume. Alternatively, one could use a segmented electrode with several independent sections, each having a low capacitance.