x»¼sº bÖuàyj¬%»fd18rn0p25nwr6d.cloudfront.net/cik-0001564822/24468dcc-7c00-4141... ·...
TRANSCRIPT

Table of Contents
UNITED STATESSECURITIES AND EXCHANGE COMMISSION
Washington, D.C. 20549_____________________
FORM 10-Q_____________________
ý QUARTERLY REPORT PURSUANT TO SECTION 13 OR 15(d) OF THE SECURITIES EXCHANGE ACT OF1934
For the quarterly period ended September 25, 2016
OR
¨ TRANSITION REPORT PURSUANT TO SECTION 13 OR 15(d) OF THE SECURITIES EXCHANGE ACT OF1934
For the transition period from ____________to _____________.
Commission File Number 001-35844___________________________________
Pinnacle Foods Inc.(Exact name of registrant as specified in its charter)
___________________________________
Delaware 35-2215019(State or other jurisdiction of incorporation or organization) (I.R.S. Employer Identification No.)
399 Jefferson Road
Parsippany, New Jersey 07054(Address of Principal Executive Offices) (Zip Code)
Registrant’s telephone number, including area code: (973) 541-6620___________________________________
Indicate by check mark whether the registrant: (1) has filed all reports required to be filed by Section 13 or 15(d) of the Securities Exchange Act of 1934during the preceding 12 months (or for such shorter period that the registrant was required to file such reports), and (2) has been subject to such filingrequirements for the past 90 days. Yes ýNo ¨
Indicate by check mark whether the registrant has submitted electronically and posted on its corporate Web site, if any, every Interactive Data Filerequired to be submitted and posted pursuant to Rule 405 of Regulation S-T during the preceding 12 months (or for such shorter period that theregistrant was required to submit and post such files). Yes ý No ¨
Indicate by check mark whether the registrant is a large accelerated filer, an accelerated filer, a non-accelerated filer, or a smaller reporting company.See definitions of “large accelerated filer," “accelerated filer” and “smaller reporting company” in Rule 12b-2 of the Exchange Act (Check One):
Large accelerated filer ý Accelerated filer ¨
Non-accelerated filer (Do not check if a smaller reporting company) ¨ Smaller Reporting Company ¨Indicate by check mark whether the registrant is a shell company (as defined in Rule 12b-2 of the Exchange Act)Yes ¨ No ý
The Registrant had 118,070,602 shares of common stock, $0.01 par value, outstanding at October 25, 2016 .
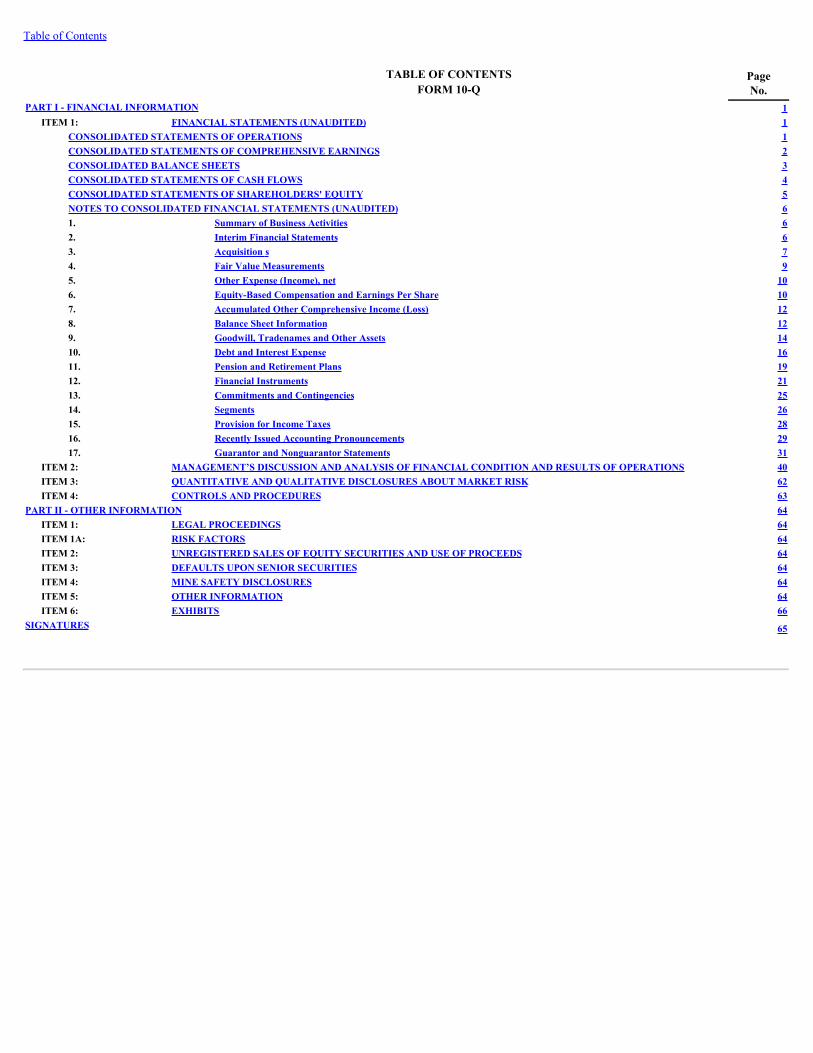
Table of Contents
TABLE OF CONTENTSFORM 10-Q
PageNo.
PART I - FINANCIAL INFORMATION 1ITEM 1: FINANCIAL STATEMENTS (UNAUDITED) 1
CONSOLIDATED STATEMENTS OF OPERATIONS 1CONSOLIDATED STATEMENTS OF COMPREHENSIVE EARNINGS 2CONSOLIDATED BALANCE SHEETS 3CONSOLIDATED STATEMENTS OF CASH FLOWS 4CONSOLIDATED STATEMENTS OF SHAREHOLDERS' EQUITY 5NOTES TO CONSOLIDATED FINANCIAL STATEMENTS (UNAUDITED) 61. Summary of Business Activities 62. Interim Financial Statements 63. Acquisition s 74. Fair Value Measurements 95. Other Expense (Income), net 106. Equity-Based Compensation and Earnings Per Share 107. Accumulated Other Comprehensive Income (Loss) 128. Balance Sheet Information 129. Goodwill, Tradenames and Other Assets 1410. Debt and Interest Expense 1611. Pension and Retirement Plans 1912. Financial Instruments 2113. Commitments and Contingencies 2514. Segments 2615. Provision for Income Taxes 2816. Recently Issued Accounting Pronouncements 2917. Guarantor and Nonguarantor Statements 31
ITEM 2: MANAGEMENT’S DISCUSSION AND ANALYSIS OF FINANCIAL CONDITION AND RESULTS OF OPERATIONS 40ITEM 3: QUANTITATIVE AND QUALITATIVE DISCLOSURES ABOUT MARKET RISK 62ITEM 4: CONTROLS AND PROCEDURES 63
PART II - OTHER INFORMATION 64ITEM 1: LEGAL PROCEEDINGS 64ITEM 1A: RISK FACTORS 64ITEM 2: UNREGISTERED SALES OF EQUITY SECURITIES AND USE OF PROCEEDS 64ITEM 3: DEFAULTS UPON SENIOR SECURITIES 64ITEM 4: MINE SAFETY DISCLOSURES 64ITEM 5: OTHER INFORMATION 64ITEM 6: EXHIBITS 66
SIGNATURES 65

Table of Contents
PART I - FINANCIAL INFORMATION
ITEM 1. FINANCIAL STATEMENTS
PINNACLE FOODS INC. AND SUBSIDIARIESCONSOLIDATED STATEMENTS OF OPERATIONS (unaudited)(thousands, except per share amounts)
Three months ended Nine months ended
September 25,
2016September 27,
2015 September 25,
2016 September 27,
2015Net sales $ 758,821 $ 636,287 $ 2,269,457 $ 1,933,314Cost of products sold 530,117 459,432 1,620,994 1,415,633
Gross profit 228,704 176,855 648,463 517,681
Marketing and selling expenses 53,879 44,155 173,813 136,862Administrative expenses 36,439 26,467 126,030 81,918Research and development expenses 4,564 3,247 13,847 9,888Tradename impairment charges 11,200 — 11,200 —Other expense (income), net 4,354 5,193 17,238 12,936
110,436 79,062 342,128 241,604Earnings before interest and taxes 118,268 97,793 306,335 276,077
Interest expense 36,473 22,315 103,601 66,130Interest income 27 7 131 172
Earnings before income taxes 81,822 75,485 202,865 210,119Provision for income taxes 29,469 27,387 79,892 76,806Net earnings 52,353 48,098 122,973 133,313Less: Net loss attributable to non-controlling interest — — — —Net earnings attributable to Pinnacle Foods, Inc. and Subsidiaries commonstockholders $ 52,353 $ 48,098 $ 122,973 $ 133,313
Net earnings per share attributable to Pinnacle Foods, Inc. and Subsidiariescommon stockholders:
Basic $ 0.45 $ 0.41 $ 1.05 $ 1.15Weighted average shares outstanding - basic 117,224 116,085 116,666 116,007Diluted $ 0.44 $ 0.41 $ 1.04 $ 1.14Weighted average shares outstanding - diluted 118,390 117,470 117,923 117,262Dividends declared $ 0.285 $ 0.255 $ 0.795 $ 0.725
SeeaccompanyingNotestoUnauditedConsolidatedFinancialStatements
1

Table of Contents
PINNACLE FOODS INC. AND SUBSIDIARIESCONSOLIDATED STATEMENTS OF COMPREHENSIVE EARNINGS (unaudited)(thousands)
Three months ended Nine months ended
September 25, 2016 September 27, 2015 September 25, 2016 September 27, 2015
Pre-taxamount
Tax(expense)
benefit After-taxamount
Pre-taxamount
Tax(expense)
benefit After-taxamount
Pre-taxamount
Tax(expense)
benefit After-taxamount
Pre-taxamount
Tax(expense)
benefit After-taxamount
Net earnings $ 52,353 $ 48,098 $122,973 $133,313Other comprehensive earnings(loss)
Foreign currencytranslation:
Foreign currencytranslation adjustments (1,526) — (1,526) (1,581) 612 (969) 4,040 — 4,040 (3,519) 1,369 (2,150)
Cash-flow hedges: Unrealized gains (losses)arising during the period 537 (212) 325 (13,531) 5,245 (8,286) (18,580) 7,178 (11,402) (23,893) 9,301 (14,592)Reclassificationadjustment for (gains)losses included in netearnings 2,560 (986) 1,574 197 (111) 86 6,176 (2,373) 3,803 288 (197) 91
Pension: Reclassification of netactuarial loss included innet earnings 309 (117) 192 261 (99) 162 926 (351) 575 780 (297) 483
Other comprehensive earnings(loss) 1,880 (1,315) 565 (14,654) 5,647 (9,007) (7,438) 4,454 (2,984) (26,344) 10,176 (16,168)
Total comprehensive earnings 52,918 39,091 119,989 117,145Less: Comprehensive lossattributable to non-controllinginterest — — — —Comprehensive earningsattributable to Pinnacle FoodsInc. and Subsidiaries $ 52,918 $ 39,091 $119,989 $117,145
SeeaccompanyingNotestoUnauditedConsolidatedFinancialStatements
2

Table of Contents
PINNACLE FOODS INC. AND SUBSIDIARIESCONSOLIDATED BALANCE SHEETS (unaudited)(thousands, except share and per share amounts)
September 25,
2016 December 27,
2015Current assets:
Cash and cash equivalents $ 164,928 $ 180,549Accounts receivable, net of allowances of $11,278 and $7,902, respectively 302,259 219,736Inventories 502,052 403,101Other current assets 9,163 13,677Deferred tax assets 54,858 40,571
Total current assets 1,033,260 857,634Plant assets, net of accumulated depreciation of $470,697 and $408,294, respectively 708,952 631,109Tradenames 2,529,680 2,001,048Other assets, net 176,035 120,364Goodwill 2,169,431 1,714,008
Total assets $ 6,617,358 $ 5,324,163
Current liabilities:
Short-term borrowings $ 1,197 $ 2,225Current portion of long-term obligations 23,714 14,847Accounts payable 251,836 211,039Accrued trade marketing expense 44,600 46,228Accrued liabilities 161,385 100,510Dividends payable 34,883 30,798
Total current liabilities 517,615 405,647Long-term debt 3,141,063 2,257,012Pension and other postretirement benefits 62,640 63,454Other long-term liabilities 63,681 54,506Deferred tax liabilities 955,485 738,015
Total liabilities 4,740,484 3,518,634Commitments and contingencies (Note 13)Shareholders' equity:
Pinnacle preferred stock: $.01 per share, 50,000,000 shares authorized, none issued — —Pinnacle common stock: par value $.01 per share, 500,000,000 shares authorized; issued119,048,643 and 117,619,695, respectively 1,191 1,176Additional paid-in-capital 1,422,483 1,378,521Retained earnings 546,762 517,330Accumulated other comprehensive loss (62,372) (59,388)
Capital stock in treasury, at cost, 1,000,000 common shares (32,110) (32,110)Total Pinnacle Foods Inc. and Subsidiaries stockholders' equity 1,875,954 1,805,529
Non-controlling interest 920 —Total Equity 1,876,874 1,805,529
Total liabilities and equity $ 6,617,358 $ 5,324,163
SeeaccompanyingNotestoUnauditedConsolidatedFinancialStatements
3
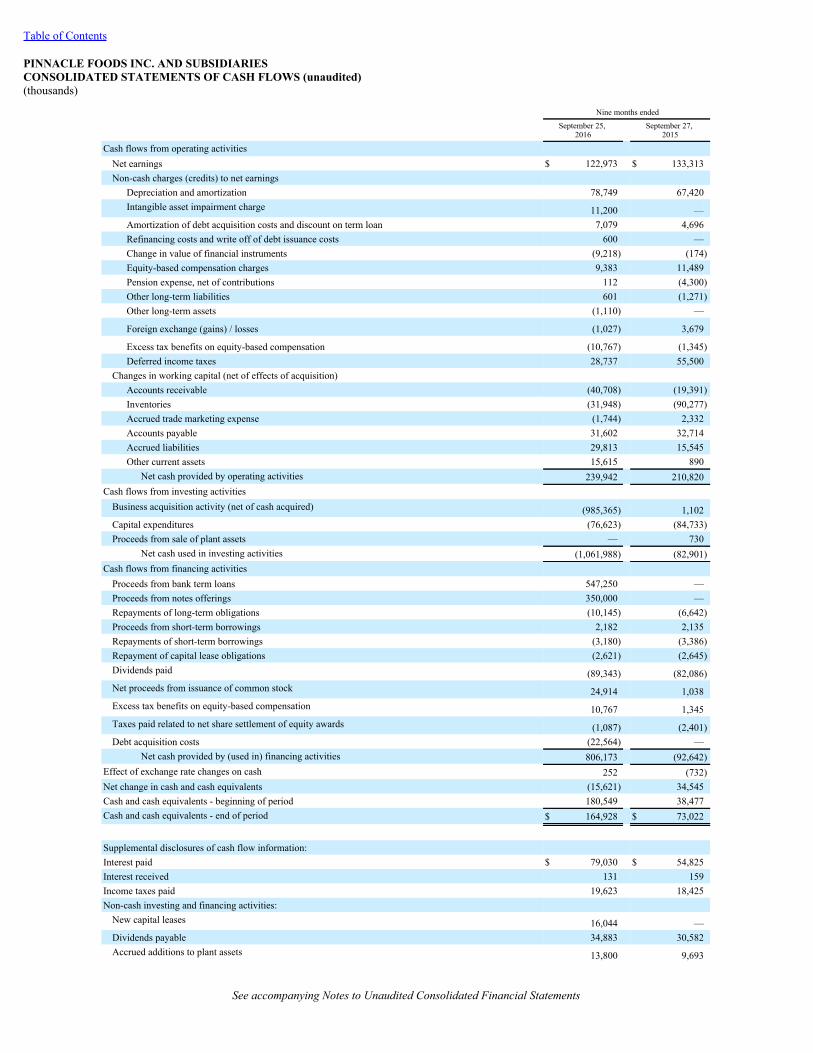
Table of Contents
PINNACLE FOODS INC. AND SUBSIDIARIESCONSOLIDATED STATEMENTS OF CASH FLOWS (unaudited)(thousands)
Nine months ended
September 25,
2016September 27,
2015
Cash flows from operating activitiesNet earnings $ 122,973 $ 133,313Non-cash charges (credits) to net earnings
Depreciation and amortization 78,749 67,420Intangible asset impairment charge 11,200 —Amortization of debt acquisition costs and discount on term loan 7,079 4,696Refinancing costs and write off of debt issuance costs 600 —Change in value of financial instruments (9,218) (174)Equity-based compensation charges 9,383 11,489Pension expense, net of contributions 112 (4,300)Other long-term liabilities 601 (1,271)Other long-term assets (1,110) —
Foreign exchange (gains) / losses (1,027) 3,679
Excess tax benefits on equity-based compensation (10,767) (1,345)Deferred income taxes 28,737 55,500
Changes in working capital (net of effects of acquisition)Accounts receivable (40,708) (19,391)Inventories (31,948) (90,277)Accrued trade marketing expense (1,744) 2,332Accounts payable 31,602 32,714Accrued liabilities 29,813 15,545Other current assets 15,615 890
Net cash provided by operating activities 239,942 210,820Cash flows from investing activities
Business acquisition activity (net of cash acquired) (985,365) 1,102Capital expenditures (76,623) (84,733)Proceeds from sale of plant assets — 730
Net cash used in investing activities (1,061,988) (82,901)Cash flows from financing activities
Proceeds from bank term loans 547,250 —Proceeds from notes offerings 350,000 —Repayments of long-term obligations (10,145) (6,642)Proceeds from short-term borrowings 2,182 2,135Repayments of short-term borrowings (3,180) (3,386)Repayment of capital lease obligations (2,621) (2,645)Dividends paid (89,343) (82,086)Net proceeds from issuance of common stock 24,914 1,038Excess tax benefits on equity-based compensation 10,767 1,345Taxes paid related to net share settlement of equity awards (1,087) (2,401)Debt acquisition costs (22,564) —
Net cash provided by (used in) financing activities 806,173 (92,642)Effect of exchange rate changes on cash 252 (732)Net change in cash and cash equivalents (15,621) 34,545Cash and cash equivalents - beginning of period 180,549 38,477Cash and cash equivalents - end of period $ 164,928 $ 73,022
Supplemental disclosures of cash flow information:Interest paid $ 79,030 $ 54,825Interest received 131 159Income taxes paid 19,623 18,425Non-cash investing and financing activities:
New capital leases 16,044 —Dividends payable 34,883 30,582Accrued additions to plant assets 13,800 9,693
SeeaccompanyingNotestoUnauditedConsolidatedFinancialStatements

4

Table of Contents
PINNACLE FOODS INC. AND SUBSIDIARIESCONSOLIDATED STATEMENTS OF SHAREHOLDERS' EQUITY (unaudited)(thousands, except share and per share amounts)
Common Stock Treasury Stock Additional
Paid InCapital
RetainedEarnings
AccumulatedOther
ComprehensiveLoss
TotalShareholders'
Equity
Non-Controlling
Interest Total
EquityShares Amount Shares Amount Balance, December28, 2014 117,293,745 $ 1,173 (1,000,000) $(32,110) $1,363,129 $ 419,531 $ (37,734) $ 1,713,989 $ — $ 1,713,989Equity-basedcompensation plans 313,269 3 11,468 11,471 11,471Dividends ($0.725per share) (a) (84,819) (84,819) (84,819)Comprehensiveearnings 133,313 (16,168) 117,145 117,145Balance, September27, 2015 117,607,014 $ 1,176 (1,000,000) $(32,110) $1,374,597 $ 468,025 $ (53,902) $ 1,757,786 $ — $ 1,757,786
Balance, December27, 2015 117,619,695 $ 1,176 (1,000,000) $(32,110) $1,378,521 $ 517,330 $ (59,388) $ 1,805,529 $ — $ 1,805,529Equity-basedcompensation plans 1,428,948 15 43,962 43,977 43,977Dividends ($0.795per share) (b) (93,541) (93,541) (93,541)Non-controllinginterest inacquisition — 920 920Comprehensiveearnings 122,973 (2,984) 119,989 — 119,989Balance, September25, 2016 119,048,643 $ 1,191 (1,000,000) $(32,110) $1,422,483 $ 546,762 $ (62,372) $ 1,875,954 $ 920 $ 1,876,874
(a) $0.235 per share declared February 2015 and June 2015, $0.255 per share declared September 2015(b) $0.255 per share declared February 2016 and June 2016, $0.285 per share declared August 2016
SeeaccompanyingNotestoUnauditedConsolidatedFinancialStatements
5

Table of ContentsPINNACLE FOODS INC. AND SUBSIDIARIESNOTES TO CONSOLIDATED FINANCIAL STATEMENTS (unaudited)(thousands, except share and per share amounts and where noted in millions)
1. Summary of Business ActivitiesBusiness OverviewPinnacle Foods Inc. (the "Company") is a leading manufacturer, marketer and distributor of high quality, branded convenience food products, the products andoperations of which are managed and reported in four operating segments: (i) Birds Eye Frozen, (ii) Duncan Hines Grocery, (iii) Boulder Brands and (iv) SpecialtyFoods. The Company’s United States retail frozen vegetables ( BirdsEye), frozen complete bagged meals ( BirdsEyeVoila!), frozen seafood ( VandeKamp’sand Mrs.Paul’s), plant-based protein frozen products ( gardein), full-calorie single-serve frozen dinners and entrées ( Hungry-Man), frozen breakfast ( AuntJemima), frozen and refrigerated bagels ( Lender’s), and frozen pizza for one ( Celeste) are reported in the Birds Eye Frozen segment. The Company’s bakingmixes and frostings ( Duncan Hines ), shelf-stable pickles ( Vlasic ), liquid and dry-mix salad dressings ( Wish-Bone and Western ), table syrups ( Mrs.Butterworth’sand LogCabin), canned meat ( Armour, Nalleyand Brooks), pie and pastry fillings ( DuncanHinesComstockand Wilderness), barbecue sauces (OpenPit) and Canadian operations other than gardeinare reported in the Duncan Hines Grocery segment. The Boulder Brands segment is comprised of health andwellness brands including gluten-free products ( Udi'sand Glutino), natural frozen meal offerings ( EVOL), refrigerated and shelf-stable spreads (SmartBalance),and plant-based refrigerated and shelf-stable spreads ( EarthBalance). The Specialty Foods segment consists of snack products ( Tim’sCascadeand SnyderofBerlin) and the Company’s food service and private label businesses, other than Boulder Brands and gardein.
History and Current Ownership
On April 2, 2007, the Company was acquired by, and became a wholly owned subsidiary of Peak Holdings LLC (“Peak Holdings”), an entity controlled byinvestment funds affiliated with The Blackstone Group L.P. (“Blackstone”). We refer to this merger transaction and related financing transactions as theBlackstone Transaction. As a result of the Blackstone Transaction, Blackstone owned, through Peak Holdings, approximately 98% of the common stock of theCompany.
As of the launch of our initial public offering on April 3, 2013 (the “IPO”), we were controlled by Blackstone. Effective September 12, 2014, as a result ofBlackstone’s reduced ownership in the Company, we no longer qualified as a “controlled company” under applicable New York Stock Exchange listing standards.On May 8, 2015, Blackstone sold their final 5,000,000 shares in an underwritten public offering. Upon completion of the offering, Blackstone no longerbeneficially owned any of the Company's outstanding common stock.
2. Interim Financial Statements
Basis of Presentation
In the opinion of management, the accompanying unaudited consolidated financial statements contain all adjustments (consisting primarily of normal recurringadjustments) necessary for a fair statement of the Company’s financial position as of September 25, 2016 , the results of operations for the three and nine monthsended September 25, 2016 and September 27, 2015 , and the cash flows for the nine months ended September 25, 2016 and September 27, 2015 . The results ofoperations are not necessarily indicative of the results to be expected for the full fiscal year. The accompanying unaudited consolidated financial statements andnotes thereto should be read in conjunction with the audited consolidated financial statements and notes thereto for the fiscal year ended December 27, 2015 .
Recently Adopted Accounting Pronouncements
In 2016, the Company changed the presentation of debt issuance costs in line with the guidance set forth by Accounting Standards Update ("ASU") No. 2015-03"Simplifying the Presentation of Debt Issuance Costs". The Company now presents such costs in the balance sheet as a direct deduction from the related debtliability, rather than as an asset. Amortization of the costs continue to be reported as interest expense. The changes in presentation were applied retrospectively toall periods presented. As of December 27, 2015 the cumulative effect of these changes on the balance sheet were decreases of $15.9 million in Long-term debt aswell as in Other assets, net.
6

Table of ContentsPINNACLE FOODS INC. AND SUBSIDIARIESNOTES TO CONSOLIDATED FINANCIAL STATEMENTS (unaudited)(thousands, except share and per share amounts and where noted in millions)
3. Acquisitions
The Company accounts for business combinations by using the acquisition method of accounting. The following acquisition has been accounted for in accordancewith these standards.
Acquisition of Boulder Brands Inc. (the "Boulder acquisition")
On January 15, 2016, the Company acquired 100% of the capital stock of Boulder Brands Inc. ("Boulder") which manufactures a portfolio of health and wellnessbrands, including Udi'sand Glutinogluten-free products, EVOLnatural frozen meal offerings, Smart Balance refrigerated and shelf-stable spreads and EarthBalanceplant-based refrigerated and shelf-stable spreads. The Boulder acquisition expands the Company's presence in growing and complementary health andwellness categories and in the natural and organic retail channels.
The Company has preliminarily allocated the purchase price to tangible and identifiable intangible assets acquired and liabilities assumed based on their estimatedfair values. The Company is in the process of completing the valuation of various assets and pre-acquisition contingencies and, therefore, the fair values set forthbelow are subject to adjustment upon finalizing the valuations. The amount of these potential adjustments could be significant.
The cost of the Boulder acquisition was $1,001,419 , which included the repayment of debt. The following table summarizes the preliminary allocation of the totalcost of the acquisition to the assets acquired and liabilities assumed:
Assets acquired: Cash $ 16,054 Accounts receivable 41,064 Inventories 66,893 Other current assets 12,043 Deferred tax asset 24,949 Property and equipment 59,405 Tradenames 539,600 Distributor relationships 40,600 Customer relationships 11,400 Other assets 12,298 Goodwill 450,720 Fair value of assets acquired 1,275,026Liabilities assumed Accounts payable 16,022 Accrued liabilities 41,094 Capital lease obligations 7,486 Long term deferred tax liability 203,804 Other long-term liabilities 4,282 Non-controlling interest 919
Total cost of acquisition $ 1,001,419
Based upon the preliminary allocation, the value assigned to intangible assets and goodwill totaled $1,042.3 million . The goodwill was generated primarily as aresult of expected synergies to be achieved because of the Boulder acquisition. Distributor relationships and customer relationships are being amortized on anaccelerated basis over 30 and 10 years, respectively. These useful lives are based on an attrition rate based on industry experience, which management believes isappropriate in the Company's circumstances. The Company has also assigned $539.6 million to the value of the tradenames acquired, which is not subject toamortization but is reviewed annually for impairment. Goodwill, which is also not subject to amortization, totaled $450.7 million (tax deductible
7

Table of ContentsPINNACLE FOODS INC. AND SUBSIDIARIESNOTES TO CONSOLIDATED FINANCIAL STATEMENTS (unaudited)(thousands, except share and per share amounts and where noted in millions)
goodwill of $21.7 million resulted from the Boulder acquisition). The Boulder acquisition is reported in the Company's newly formed Boulder Brands operatingsegment.
During the nine months ended September 25, 2016 , the Boulder acquisition resulted in an additional $344.4 million of net sales and net earnings of $0.6 million ,related to Boulder operations from January 15, 2016 to September 25, 2016 , which included a $10.4 million charge related to the fair value step-up of inventoriesacquired and sold during the period, $17.3 million of restructuring costs, primarily severance and $6.8 million of acquisition costs described below.
In accordance with the requirements of the accounting for acquisitions, inventories obtained in the Boulder acquisition were required to be valued at fair value (netrealizable value, which is defined as estimated selling prices less the sum of (a) costs of disposal and (b) a reasonable profit allowance for the selling effort of theacquiring entity), which is $10.4 million higher than historical manufacturing costs. Cost of products sold for the nine months ended September 25, 2016 includespre-tax charges of $10.4 million related to the inventory acquired, which were subsequently sold. The Boulder acquisition was financed through borrowings of $550.0 million in incremental term loans (the "Tranche I Term Loans") due 2023, $350.0 million of5.875% Senior Notes (the "5.875% Senior Notes) due 2024, $118.3 million of cash on hand, prior to transaction costs of $6.8 million and $1.7 million in the threemonths ended September 25, 2016 and fiscal year ended December 27, 2015, respectively, and debt acquisition costs of $24.0 million and $0.4 million in the threemonths ended September 25, 2016 and fiscal year ended December 27, 2015, respectively. The debt acquisition costs, which included original issue discount arebeing amortized over the life of the associated debt using the effective interest method and are recorded in Long-Term debt on the Consolidated Balance Sheet. Formore information, see Note 10 to the Consolidated Financial Statements, Debt and Interest Expense. Included in the acquisition costs of $6.8 million for the ninemonths ended September 25, 2016 are $6.1 million of merger, acquisition and advisory fees and $0.7 million of other costs. The $1.7 million of transaction costsincurred in fiscal 2015 primarily relate to legal, accounting and other professional fees. The transaction costs are recorded in Other expense (income), net in theConsolidated Statements of Operations.
Pro forma Information The following unaudited pro forma summary presents the Company's consolidated results of operations as if Boulder had been acquired on December 29, 2014.These amounts adjusted Boulder's historical results to reflect the additional depreciation and amortization that would have been charged assuming the fair valueadjustments to plant assets and intangible assets had been applied from December 29, 2014, together with the consequential tax effects. These adjustments alsoreflect the additional interest expense incurred on the debt to finance the purchase. The nine months ended September 25, 2016 pro forma earnings were adjusted toexclude the acquisition related and restructuring costs incurred and the nonrecurring expense related to the fair value inventory step-up adjustment. The ninemonths ended September 27, 2015 pro forma earnings were adjusted to include these charges. The pro forma financial information presented below is forinformational purposes only and is not indicative of the results of operations that would have been achieved if the acquisition and borrowings undertaken to financethe acquisition had taken place at the beginning of 2015.
Amounts in millions:
Nine months endedSeptember 25, 2016
(unaudited)
Nine months endedSeptember 27, 2015
(unaudited)Net sales $ 2,287.1 $ 2,312.9Net earnings $ 154.0 $ 99.7
Boulder Brands Restructuring
As a result of the Boulder acquisition, the Company expects to incur approximately $18.0 million of restructuring charges in 2016, primarily related to employeetermination and retention benefits. Charges of $0.6 million and $17.3 million were incurred during the three and nine months ended September 25, 2016 ,respectively and were recorded in Administrative expenses in the Consolidated Statements of Operations.
8

Table of ContentsPINNACLE FOODS INC. AND SUBSIDIARIESNOTES TO CONSOLIDATED FINANCIAL STATEMENTS (unaudited)(thousands, except share and per share amounts and where noted in millions)
The following table summarizes total restructuring charges accrued as of September 25, 2016 . These amounts are recorded in our Consolidated Balance Sheet inAccrued Liabilities.
Balance BalanceDescription December 27, 2015 Expense Payments September 25, 2016
Accrued restructuring charges $ — $ 17,267 $ (10,423) $ 6,844
4. Fair Value MeasurementsThe authoritative guidance for financial assets and liabilities discusses valuation techniques, such as the market approach (comparable market prices), the incomeapproach (present value of future income or cash flow), and the cost approach (cost to replace the service capacity of an asset or replacement cost). The guidanceutilizes a fair value hierarchy that prioritizes the inputs to valuation techniques used to measure fair value into three broad levels. The following is a briefdescription of those three levels:
Level 1: Observable inputs such as quoted prices (unadjusted) in active markets for identical assets or liabilities.Level 2: Inputs other than quoted prices that are observable for the asset or liability, either directly or indirectly. These include quoted prices for similar
assets or liabilities in active markets and quoted prices for identical or similar assets or liabilities in markets that are not active.Level 3: Unobservable inputs that reflect the Company’s assumptions.
The Company’s financial assets and liabilities subject to recurring fair value measurements and the required disclosures are as follows:
Fair Value
as of September 25,
2016
Fair Value MeasurementsUsing Fair Value Hierarchy
Fair Value as of
December 27,2015
Fair Value MeasurementsUsing Fair Value Hierarchy
Level 1 Level 2 Level 3 Level 1 Level 2 Level 3Assets Foreign currency derivatives $ 101 $ — $ 101 $ — $ 471 $ — $ 471 $ —Total assets at fair value $ 101 $ — $ 101 $ — $ 471 $ — $ 471 $ —
Liabilities Interest rate derivatives $ 30,912 $ — $ 30,912 $ — $ 18,868 $ — $ 18,868 $ —Commodity derivatives 787 — 787 — 10,013 — 10,013 —Total liabilities at fair value $ 31,699 $ — $ 31,699 $ — $ 28,881 $ — $ 28,881 $ —
The Company manages economic risks, including interest rate, liquidity and credit risk, primarily by managing the amount, sources and duration of its debtfunding and the use of derivative financial instruments. The primary risks managed by using derivative instruments are interest rate risk, foreign currency exchangerisk and commodity price risk.
The valuations of these instruments are determined using widely accepted valuation techniques, including discounted cash flow analysis on the expected cash flowsof each derivative. This analysis reflects the contractual terms of the derivatives, including the period to maturity, and uses observable market-based inputs,including interest rate, commodity, and foreign exchange forward curves. The fair values of interest rate swaps are determined using the market standardmethodology of netting the discounted future fixed cash payments (or receipts) and the discounted expected variable cash receipts (or payments). The variable cashreceipts (or payments) are based on an expectation of future interest rates (forward curves) derived from observable market interest rate curves. To comply with theprovisions of the authoritative guidance for fair value disclosure, the Company incorporates credit valuation adjustments to appropriately reflect both its own non-performance risk and the respective counterparty’s non-performance risk in the fair value measurements. In adjusting the fair value of its derivative contracts forthe effect of non-performance risk, the Company has considered the impact of netting and any applicable credit enhancements, such as collateral postings,thresholds,
9

Table of ContentsPINNACLE FOODS INC. AND SUBSIDIARIESNOTES TO CONSOLIDATED FINANCIAL STATEMENTS (unaudited)(thousands, except share and per share amounts and where noted in millions)
mutual puts and guarantees. The Company had no fair value measurements based upon significant unobservable inputs (Level 3) as of September 25, 2016 orDecember 27, 2015 .
In addition to the instruments named above, the Company also makes fair value measurements in connection with its annual goodwill and tradename impairmenttesting. These measurements fall into Level 3 of the fair value hierarchy.
5. Other Expense (Income), net
OtherExpense(Income),net
Three months ended Nine months ended
September 25,
2016 September 27,
2015 September 25,
2016 September 27,
2015Other expense (income), net consists of:
Amortization of intangibles/other assets $ 4,309 $ 3,397 $ 12,665 $ 10,158Foreign exchange (gains) losses 256 2,101 (1,027) 3,679Boulder acquisition costs (Note 3) — — 6,781 —Royalty income and other (211) (305) (1,181) (901)Total other expense (income), net $ 4,354 $ 5,193 $ 17,238 $ 12,936
Foreign exchange (gains) losses. These represent foreign exchange (gains) losses from intra-entity loans resulting from the Company's November 2014 GardenProtein acquisition that are anticipated to be settled in the foreseeable future.
6. Equity-Based Compensation Expense and Earnings Per Share
Equity-based Compensation
The Company currently grants equity awards under the Amended and Restated 2013 Omnibus Incentive Plan (the “Incentive Plan”). Equity-based compensationexpense recognized during the period is based on the value of the portion of equity-based payment awards that is ultimately expected to vest during the period. Asequity-based compensation expense recognized in the Consolidated Statements of Operations is based on awards ultimately expected to vest, it has been reducedfor estimated forfeitures. The authoritative guidance for equity-based compensation requires forfeitures to be estimated at the time of grant and revised, ifnecessary, in subsequent periods if actual forfeitures differ from those estimates.Expense Information
The following table summarizes equity-based compensation expense which was allocated as follows:
Three months ended Nine months ended
September 25, 2016 September 27, 2015 September 25, 2016 September 27, 2015
Cost of products sold $ 91 $ 502 $ 994 $ 2,373Marketing and selling expenses 1,500 975 4,058 2,969Administrative expenses 2,517 1,871 3,930 5,827Research and development expenses 144 79 401 320Pre-tax equity-based compensation expense 4,252 3,427 9,383 11,489Income tax benefit (1,616) (1,296) (3,509) (4,263)
Net equity-based compensation expense $ 2,636 $ 2,131 $ 5,874 $ 7,226
10

Table of ContentsPINNACLE FOODS INC. AND SUBSIDIARIESNOTES TO CONSOLIDATED FINANCIAL STATEMENTS (unaudited)(thousands, except share and per share amounts and where noted in millions)
Amended and Restated 2013 Omnibus Incentive Plan
The Incentive Plan provides for the issuance of up to 11,300,000 shares of the Company's common stock under (1) equity awards granted as a result of theconversion of unvested performance interest units ("PIU's") into restricted common stock of the Company, (2) stock options and other equity awards granted inconnection with the completion of the IPO, and (3) awards granted by the Company under the Incentive Plan following the completion of the IPO. Awards grantedsubsequent to the IPO include nonqualified stock options, non-vested shares and restricted stock units ("RSU's"), the majority of which vest in full three years fromthe date of grant. The Company also granted non-vested performance shares ("PS's") and grants performance share units ("PSU's"), both of which vest based onachievement of relative total shareholder return performance goals over a three -year performance period.
During the second quarter of 2016, as part of our ongoing equity compensation program and in connection with the hiring of our new Chief Executive Officer:
• We granted 633,709 nonqualified stock options with grant date fair values ranging from $8.97 to $9.44 and exercise prices ranging from $42.08 to $45.28using the BlackScholes pricing method to value the awards.
• We granted 223,204 PSU's and PS's with grant date fair values ranging from $44.32 to $53.07 using the Monte Carlo simulation model to value theawards.
• We granted 313,795 RSU's with grant date fair values ranging from $42.08 to $45.28 , which was the closing price of our stock on the date of grant.
During the third quarter of 2016, as part of our ongoing equity compensation program:
• We granted 9,244 nonqualified stock options with grant date fair values of $11.10 and exercise prices of $50.36 using the BlackScholes pricing method tovalue the awards.
• We granted 2,036 PS's with grant date fair values of $53.04 using the Monte Carlo simulation model to value the awards.
Earnings Per Share
Basic earnings per common share is computed by dividing net earnings or loss for common shareholders by the weighted-average number of common sharesoutstanding during the period. Diluted earnings per common share are calculated by dividing net earnings by weighted-average common shares outstanding duringthe period plus dilutive potential common shares, which are determined as follows:
Three months ended Nine months ended
September 25,
2016 September 27, 2015 September 25,
2016 September 27,
2015
Weighted-average common shares 117,224,410 116,084,948 116,666,296 116,007,184Effect of dilutive securities: 1,165,356 1,385,093 1,256,560 1,255,156
Dilutive potential common shares 118,389,766 117,470,041 117,922,856 117,262,340
Dilutive potential common shares are calculated in accordance with the treasury stock method, which assumes that proceeds from the exercise of all warrants andoptions are used to repurchase common stock at market value. The amount of shares remaining after the proceeds are exhausted represents the potentially dilutiveeffect of the securities. For the three and nine months ended September 25, 2016 , conversion of securities totaling 640,650 and 499,192 , respectively, intocommon share equivalents were excluded from this calculation as their effect would have been anti-dilutive. For the three and nine months ended September 27,2015 , conversion of securities totaling 354,423 and 353,992 , respectively, into common share equivalents were excluded from this calculation as their effectwould have been anti-dilutive.
11

Table of ContentsPINNACLE FOODS INC. AND SUBSIDIARIESNOTES TO CONSOLIDATED FINANCIAL STATEMENTS (unaudited)(thousands, except share and per share amounts and where noted in millions)
7. Accumulated Other Comprehensive Loss
The components of Accumulated other comprehensive loss consist of the following:
Currency translation
adjustments Gains (Losses) oncash flow hedges Change in pensions Total
Balance, December 27, 2015 $ (6,418) $ (9,232) $ (43,738) $ (59,388)
Other comprehensive (loss)/income before reclassification 4,040 (11,402) — (7,362)
Amounts reclassified from accumulated other comprehensive loss — 3,803 575 4,378
Net current period other comprehensive (loss)/income 4,040 (7,599) 575 (2,984)
Balance, September 25, 2016 $ (2,378) $ (16,831) $ (43,163) $ (62,372)
Currency translation
adjustments Gains (Losses) oncash flow hedges Change in pensions Total
Balance, December 28, 2014 $ (2,054) $ 4,124 $ (39,804) $ (37,734)
Other comprehensive loss before reclassification (2,150) (14,592) — (16,742)
Amounts reclassified from accumulated other comprehensive loss — 91 483 574
Net current period other comprehensive (loss)/income (2,150) (14,501) 483 (16,168)
Balance, September 27, 2015 $ (4,204) $ (10,377) $ (39,321) $ (53,902)
The following table presents amounts reclassified out of Accumulated Other Comprehensive Loss ("AOCL") and into Net earnings for the three and nine monthsended September 25, 2016 and September 27, 2015 , respectively.
Gain/(Loss) Amounts Reclassified from AOCL Three months ended Nine months ended
Details about Accumulated Other Comprehensive LossComponents
September 25,2016
September 27,2015
September 25,2016
September 27,2015 Reclassified from AOCL to:
Gains and losses on financial instrument contracts
Interest rate contracts $ (2,606) $ (1,113) $ (6,277) $ (2,516) Interest expense
Foreign exchange contracts 46 916 101 2,228 Cost of products sold
Total pre-tax (2,560) (197) (6,176) (288)
Tax benefit (expense) 986 111 2,373 197 Provision for income taxes
Net of tax (1,574) (86) (3,803) (91)
Pension actuarial assumption adjustments
Amortization of actuarial loss (309) (261) (926) (780) (a) Cost of products sold
Tax benefit 117 99 351 297 Provision for income taxes
Net of tax (192) (162) (575) (483)
Net reclassifications into net earnings $ (1,766) $ (248) $ (4,378) $ (574)
(a) This is included in the computation of net periodic pension cost (see Note 11 for additional details).
8. Balance Sheet Information
Accounts Receivable. Customer accounts receivable are recorded at the invoiced amount and do not bear interest. The allowance for cash discounts, returns andbad debts is the Company's best estimate of these amounts. The Company determines the allowance based on historical discounts taken and write-off experience.The Company reviews its allowance for doubtful accounts quarterly. Account balances are charged off against the allowance when the Company concludes it isprobable the receivable will not be
12

Table of ContentsPINNACLE FOODS INC. AND SUBSIDIARIESNOTES TO CONSOLIDATED FINANCIAL STATEMENTS (unaudited)(thousands, except share and per share amounts and where noted in millions)
recovered. The Company does not have any off-balance sheet credit exposure related to its customers. Accounts receivable are as follows:
September 25,
2016 December 27, 2015
Customers $ 304,778 $ 219,352Allowances for cash discounts, bad debts and returns (11,278) (7,902)
Subtotal 293,500 211,450Other receivables 8,759 8,286
Total $ 302,259 $ 219,736
Inventories. Inventories are as follows:
September 25,
2016 December 27,
2015Raw materials $ 84,814 $ 57,145Work in progress (1) 69,351 61,527Finished product 347,887 284,429
Total $ 502,052 $ 403,101
(1) Included in work in progress is primarily agricultural inventory.
The Company has various purchase commitments for raw materials and certain finished products within the ordinary course of business. Such commitments arenot at prices in excess of current market prices.
Other Current Assets. Other Current Assets are as follows:
September 25, 2016 December 27, 2015
Prepaid expenses and other $ 8,357 $ 8,166Prepaid income taxes 806 5,511
Total $ 9,163 $ 13,677
Plant Assets. Plant assets are as follows:
September 25, 2016 December 27, 2015
Land $ 15,747 $ 14,948Buildings 271,074 246,988Machinery and equipment 804,216 716,314Projects in progress 88,612 61,153
Subtotal 1,179,649 1,039,403Accumulated depreciation (470,697) (408,294)
Total $ 708,952 $ 631,109
Depreciation was $ 22,768 and $66,084 during the three and nine months ended September 25, 2016 , respectively. Depreciation was $20,866 and $57,262 duringthe three and nine months ended September 27, 2015 , respectively. As of September 25, 2016 and December 27, 2015 , Machinery and equipment included assetsunder capital lease with a book value of $20,712 and $16,372 (net of accumulated depreciation of $12,490 and $11,018 ), respectively.
13

Table of ContentsPINNACLE FOODS INC. AND SUBSIDIARIESNOTES TO CONSOLIDATED FINANCIAL STATEMENTS (unaudited)(thousands, except share and per share amounts and where noted in millions)
Accrued Liabilities. Accrued liabilities are as follows:
September 25,
2016December 27,
2015Employee compensation and benefits $ 63,013 $ 55,416Interest payable 23,197 12,127Consumer coupons 7,404 2,035Accrued restructuring charges (see note 3) 6,844 —Accrued financial instrument contracts (see note 12) 5,881 5,957Accrued broker commissions 8,047 4,651Accrued income taxes 10,776 842Other 36,223 19,482
Total $ 161,385 $ 100,510
Other Long-Term Liabilities. Other long-term liabilities are as follows:
September 25,
2016 December 27,
2015 Employee compensation and benefits $ 12,653 $ 9,806 Long-term rent liability and deferred rent allowances 7,052 7,774 Liability for uncertain tax positions 11,113 7,712 Accrued financial instrument contracts (see note 12) 27,216 22,924 Other 5,647 6,290
Total $ 63,681 $ 54,506
9. Goodwill, Tradenames and Other AssetsGoodwillGoodwill by segment is as follows:
Birds Eye
Frozen
DuncanHines
Grocery Boulder Brands Specialty
Foods TotalBalance, December 27, 2015 $ 603,432 $ 936,615 $ — $ 173,961 $ 1,714,008
Boulder acquisition (Note 3) — — 450,940 — 450,940Foreign currency adjustment 1,162 — 3,321 — 4,483
Balance, September 25, 2016 $ 604,594 $ 936,615 $ 454,261 $ 173,961 $ 2,169,431
The authoritative guidance for business combinations requires that all business combinations be accounted for at fair value under the acquisition method ofaccounting. The authoritative guidance for goodwill provides that goodwill will not be amortized, but will be tested for impairment on an annual basis or moreoften when events indicate. The Company completed its annual testing in the third quarter of 2016, which indicated no impairment. Other than the recently valuedBoulder Brands reporting units, all reporting units tested had a fair value that exceeded their carrying value by at least 70%
14

Table of ContentsPINNACLE FOODS INC. AND SUBSIDIARIESNOTES TO CONSOLIDATED FINANCIAL STATEMENTS (unaudited)(thousands, except share and per share amounts and where noted in millions)
TradenamesTradenames by segment are as follows:
Birds Eye Frozen Duncan Hines
Grocery Boulder Specialty Foods Total
Balance, December 27, 2015 $ 846,336 $ 1,118,712 $ — $ 36,000 $ 2,001,048
Boulder acquisition (Note 3) — — 539,600 — 539,600Foreign currency adjustment 232 — — — 232Impairments (10,300) — — (900) $ (11,200)
Balance, September 25, 2016 $ 836,268 $ 1,118,712 $ 539,600 $ 35,100 $ 2,529,680
The authoritative guidance for indefinite-lived assets provides that indefinite-lived assets will not be amortized, but will be tested for impairment on an annualbasis or more often when events indicate. Upon completion of the annual testing in the third quarter of 2016, the Company recorded tradename impairments of$7.3 million on Celeste , $3.0 million on AuntJemimaand $0.9 million on Snyder of Berlin . Celesteand AuntJemimaare reported in our Birds Eye Frozensegment and Snyder of Berlin is reported in the Specialty Foods segment. These charges were the result of the Company's reassessment of the long-term salesprojections for the brands during our annual planning cycle which occurs during the third quarter each year. The total carrying value of the three tradenames as ofSeptember 25, 2016 is $66.4 million .
To estimate the fair value of our Tradenames we use the relief from royalty method, which utilizes forecasted discounted cash flows to estimate the fair value. Theutilization of this method requires us to make significant assumptions including sales growth rates, implied royalty rates and discount rates. Other than the recentlyvalued Boulder Brands tradenames, in the course of our testing, we identified an additional three tradenames which do not have a fair value that exceeded theircarrying value by at least 15% . The total carrying value of these tradenames as of September 25, 2016 is $25.5 million .
Other Assets
September 25, 2016
WeightedAvg Life
GrossCarryingAmount
AccumulatedAmortization Net
Amortizable intangibles Recipes 10 $ 60,125 $ (51,639) $ 8,486Customer relationships - Distributors 34 182,735 (52,556) 130,179Customer relationships - Food Service 10 11,400 (1,587) 9,813Customer relationships - Private Label 7 1,290 (590) 700License 7 6,175 (6,081) 94
Total amortizable intangibles $ 261,725 $ (112,453) $ 149,272Financial instruments (see Note 12) 1,166 — 1,166Other (1) 30,293 (4,696) 25,597
Total other assets, net $ 176,035
Amortizable intangibles by segment Birds Eye Frozen $ 55,532 Duncan Hines Grocery 41,661 Boulder Brands 48,530 Specialty Foods 3,549
$ 149,272
15

Table of ContentsPINNACLE FOODS INC. AND SUBSIDIARIESNOTES TO CONSOLIDATED FINANCIAL STATEMENTS (unaudited)(thousands, except share and per share amounts and where noted in millions)
December 27, 2015
WeightedAvg Life
GrossCarryingAmount
AccumulatedAmortization Net
Amortizable intangibles Recipes 10 $ 60,094 $ (47,077) $ 13,017Customer relationships - Distributors 35 142,129 (46,507) 95,622Customer relationships - Private Label 7 1,290 (399) 891License 7 6,175 (5,800) 375
Total amortizable intangibles $ 209,688 $ (99,783) $ 109,905Other (2) 14,779 (4,320) 10,459
Total other assets, net $ 120,364
Amortizable intangibles by segment Birds Eye Frozen $ 60,510 Duncan Hines Grocery 45,503 Specialty Foods 3,892
$ 109,905
(1) As of September 25, 2016 , Other primarily consists of cost basis investments in companies in the natural and organic food and beverage industries acquiredthrough the Boulder acquisition as well as security deposits, supplemental savings plan investments and debt acquisition costs associated with the Company'srevolver.(2) As of December 27, 2015 , Other primarily consists of security deposits and supplemental savings plan investments.
Amortization of intangible assets was $4,309 and $12,665 for the three and nine months ended September 25, 2016 , respectively. Amortization of intangible assetswas $3,397 and $10,158 for the three and nine months ended September 27, 2015 , respectively. Estimated amortization expense for each of the next five years andthereafter is as follows: remainder of 2016 - $4,400 ; 2017 - $11,800 ; 2018 - $9,600 ; 2019 - $8,900 ; 2020 - $8,200 and thereafter - $106,400 .
10. Debt and Interest Expense
September 25, 2016
December 27, 2015
Short-term borrowings - Notes payable $ 1,197 $ 2,225
Total short-term borrowings $ 1,197 $ 2,225
Long-term debt - Amended Credit Agreement - Tranche G Term Loans due 2020 1,409,625 1,409,625- Amended Credit Agreement - Tranche H Term Loans due 2020 510,563 514,500- Amended Credit Agreement - Tranche I Term Loans due 2023 547,250 —- 4.875% Senior Notes due 2021 350,000 350,000- 5.875% Senior Notes due 2024 350,000 —- 3.0% Note payable to Gilster Mary Lee Corporation 6,023 8,878- Unamortized discount on long term debt and deferred financing costs (44,263) (26,267)- Capital lease obligations 35,579 15,123
3,164,777 2,271,859Less: current portion of long-term obligations 23,714 14,847
Total long-term debt $ 3,141,063 $ 2,257,012
16
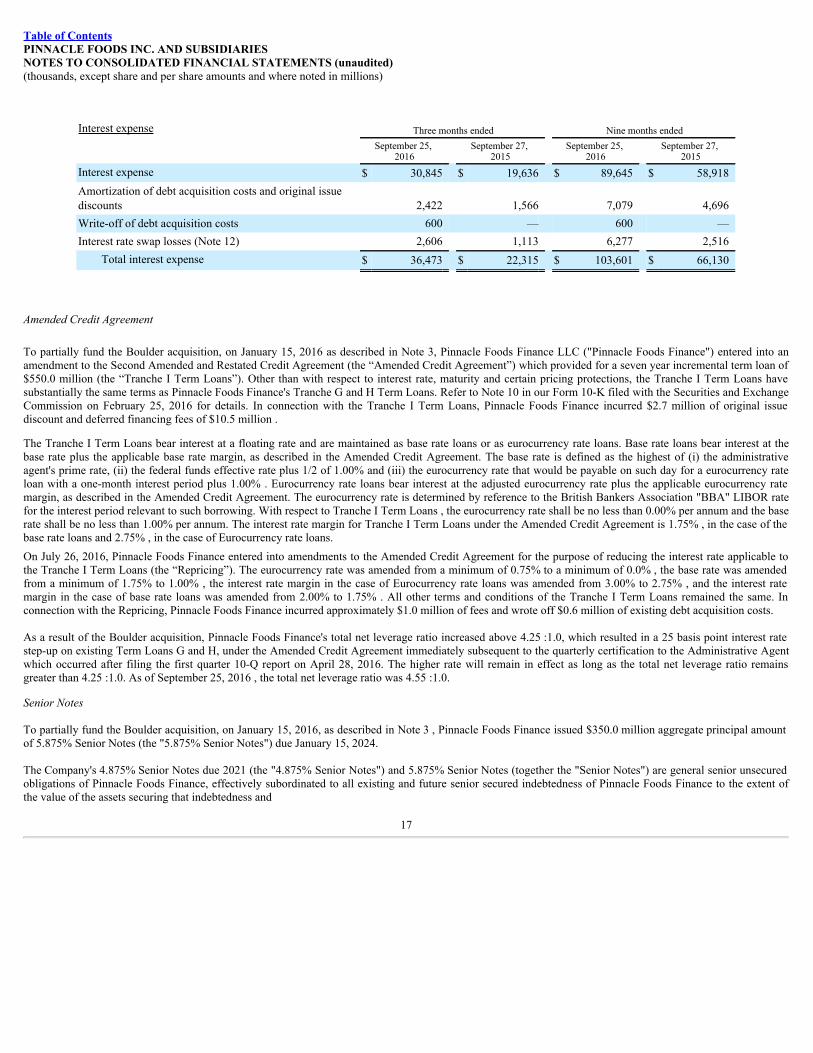
Table of ContentsPINNACLE FOODS INC. AND SUBSIDIARIESNOTES TO CONSOLIDATED FINANCIAL STATEMENTS (unaudited)(thousands, except share and per share amounts and where noted in millions)
Interest expense Three months ended Nine months ended
September 25,
2016 September 27,
2015 September 25,
2016 September 27,
2015Interest expense $ 30,845 $ 19,636 $ 89,645 $ 58,918Amortization of debt acquisition costs and original issuediscounts 2,422 1,566 7,079 4,696Write-off of debt acquisition costs 600 — 600 —Interest rate swap losses (Note 12) 2,606 1,113 6,277 2,516
Total interest expense $ 36,473 $ 22,315 $ 103,601 $ 66,130
AmendedCreditAgreement
To partially fund the Boulder acquisition, on January 15, 2016 as described in Note 3, Pinnacle Foods Finance LLC ("Pinnacle Foods Finance") entered into anamendment to the Second Amended and Restated Credit Agreement (the “Amended Credit Agreement”) which provided for a seven year incremental term loan of$550.0 million (the “Tranche I Term Loans”). Other than with respect to interest rate, maturity and certain pricing protections, the Tranche I Term Loans havesubstantially the same terms as Pinnacle Foods Finance's Tranche G and H Term Loans. Refer to Note 10 in our Form 10-K filed with the Securities and ExchangeCommission on February 25, 2016 for details. In connection with the Tranche I Term Loans, Pinnacle Foods Finance incurred $2.7 million of original issuediscount and deferred financing fees of $10.5 million .
The Tranche I Term Loans bear interest at a floating rate and are maintained as base rate loans or as eurocurrency rate loans. Base rate loans bear interest at thebase rate plus the applicable base rate margin, as described in the Amended Credit Agreement. The base rate is defined as the highest of (i) the administrativeagent's prime rate, (ii) the federal funds effective rate plus 1/2 of 1.00% and (iii) the eurocurrency rate that would be payable on such day for a eurocurrency rateloan with a one-month interest period plus 1.00% . Eurocurrency rate loans bear interest at the adjusted eurocurrency rate plus the applicable eurocurrency ratemargin, as described in the Amended Credit Agreement. The eurocurrency rate is determined by reference to the British Bankers Association "BBA" LIBOR ratefor the interest period relevant to such borrowing. With respect to Tranche I Term Loans , the eurocurrency rate shall be no less than 0.00% per annum and the baserate shall be no less than 1.00% per annum. The interest rate margin for Tranche I Term Loans under the Amended Credit Agreement is 1.75% , in the case of thebase rate loans and 2.75% , in the case of Eurocurrency rate loans.On July 26, 2016, Pinnacle Foods Finance entered into amendments to the Amended Credit Agreement for the purpose of reducing the interest rate applicable tothe Tranche I Term Loans (the “Repricing”). The eurocurrency rate was amended from a minimum of 0.75% to a minimum of 0.0% , the base rate was amendedfrom a minimum of 1.75% to 1.00% , the interest rate margin in the case of Eurocurrency rate loans was amended from 3.00% to 2.75% , and the interest ratemargin in the case of base rate loans was amended from 2.00% to 1.75% . All other terms and conditions of the Tranche I Term Loans remained the same. Inconnection with the Repricing, Pinnacle Foods Finance incurred approximately $1.0 million of fees and wrote off $0.6 million of existing debt acquisition costs.
As a result of the Boulder acquisition, Pinnacle Foods Finance's total net leverage ratio increased above 4.25 :1.0, which resulted in a 25 basis point interest ratestep-up on existing Term Loans G and H, under the Amended Credit Agreement immediately subsequent to the quarterly certification to the Administrative Agentwhich occurred after filing the first quarter 10-Q report on April 28, 2016. The higher rate will remain in effect as long as the total net leverage ratio remainsgreater than 4.25 :1.0. As of September 25, 2016 , the total net leverage ratio was 4.55 :1.0.
SeniorNotes
To partially fund the Boulder acquisition, on January 15, 2016, as described in Note 3 , Pinnacle Foods Finance issued $350.0 million aggregate principal amountof 5.875% Senior Notes (the "5.875% Senior Notes") due January 15, 2024.
The Company's 4.875% Senior Notes due 2021 (the "4.875% Senior Notes") and 5.875% Senior Notes (together the "Senior Notes") are general senior unsecuredobligations of Pinnacle Foods Finance, effectively subordinated to all existing and future senior secured indebtedness of Pinnacle Foods Finance to the extent ofthe value of the assets securing that indebtedness and
17
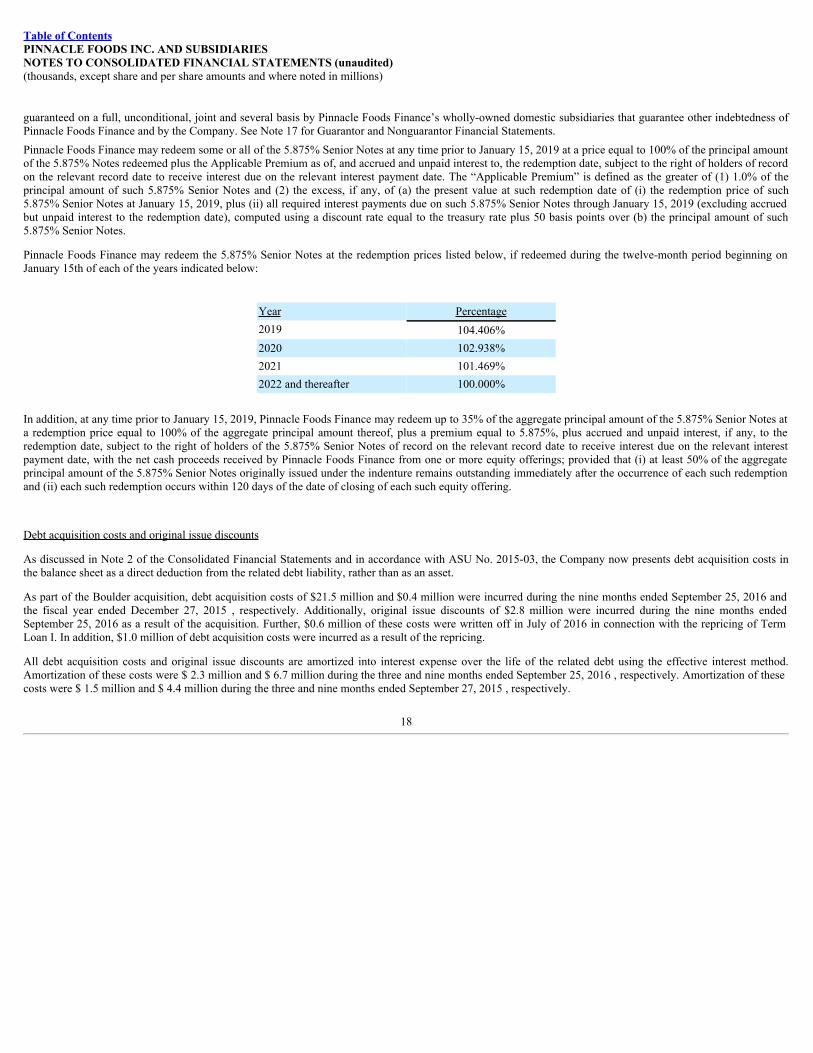
Table of ContentsPINNACLE FOODS INC. AND SUBSIDIARIESNOTES TO CONSOLIDATED FINANCIAL STATEMENTS (unaudited)(thousands, except share and per share amounts and where noted in millions)
guaranteed on a full, unconditional, joint and several basis by Pinnacle Foods Finance’s wholly-owned domestic subsidiaries that guarantee other indebtedness ofPinnacle Foods Finance and by the Company. See Note 17 for Guarantor and Nonguarantor Financial Statements.Pinnacle Foods Finance may redeem some or all of the 5.875% Senior Notes at any time prior to January 15, 2019 at a price equal to 100% of the principal amountof the 5.875% Notes redeemed plus the Applicable Premium as of, and accrued and unpaid interest to, the redemption date, subject to the right of holders of recordon the relevant record date to receive interest due on the relevant interest payment date. The “Applicable Premium” is defined as the greater of (1) 1.0% of theprincipal amount of such 5.875% Senior Notes and (2) the excess, if any, of (a) the present value at such redemption date of (i) the redemption price of such5.875% Senior Notes at January 15, 2019, plus (ii) all required interest payments due on such 5.875% Senior Notes through January 15, 2019 (excluding accruedbut unpaid interest to the redemption date), computed using a discount rate equal to the treasury rate plus 50 basis points over (b) the principal amount of such5.875% Senior Notes.
Pinnacle Foods Finance may redeem the 5.875% Senior Notes at the redemption prices listed below, if redeemed during the twelve-month period beginning onJanuary 15th of each of the years indicated below:
Year Percentage2019 104.406%2020 102.938%2021 101.469%2022 and thereafter 100.000%
In addition, at any time prior to January 15, 2019, Pinnacle Foods Finance may redeem up to 35% of the aggregate principal amount of the 5.875% Senior Notes ata redemption price equal to 100% of the aggregate principal amount thereof, plus a premium equal to 5.875%, plus accrued and unpaid interest, if any, to theredemption date, subject to the right of holders of the 5.875% Senior Notes of record on the relevant record date to receive interest due on the relevant interestpayment date, with the net cash proceeds received by Pinnacle Foods Finance from one or more equity offerings; provided that (i) at least 50% of the aggregateprincipal amount of the 5.875% Senior Notes originally issued under the indenture remains outstanding immediately after the occurrence of each such redemptionand (ii) each such redemption occurs within 120 days of the date of closing of each such equity offering.
Debt acquisition costs and original issue discounts
As discussed in Note 2 of the Consolidated Financial Statements and in accordance with ASU No. 2015-03, the Company now presents debt acquisition costs inthe balance sheet as a direct deduction from the related debt liability, rather than as an asset.
As part of the Boulder acquisition, debt acquisition costs of $21.5 million and $0.4 million were incurred during the nine months ended September 25, 2016 andthe fiscal year ended December 27, 2015 , respectively. Additionally, original issue discounts of $2.8 million were incurred during the nine months endedSeptember 25, 2016 as a result of the acquisition. Further, $0.6 million of these costs were written off in July of 2016 in connection with the repricing of TermLoan I. In addition, $1.0 million of debt acquisition costs were incurred as a result of the repricing.
All debt acquisition costs and original issue discounts are amortized into interest expense over the life of the related debt using the effective interest method.Amortization of these costs were $ 2.3 million and $ 6.7 million during the three and nine months ended September 25, 2016 , respectively. Amortization of thesecosts were $ 1.5 million and $ 4.4 million during the three and nine months ended September 27, 2015 , respectively.
18

Table of ContentsPINNACLE FOODS INC. AND SUBSIDIARIESNOTES TO CONSOLIDATED FINANCIAL STATEMENTS (unaudited)(thousands, except share and per share amounts and where noted in millions)
The following summarizes debt acquisition cost and original issue discount activity during the nine months ended September 25, 2016 :
GrossCarryingAmount
AccumulatedAmortization Net
Balance, December 27, 2015 $ 58,036 $ (31,769) $ 26,2672016 - Additions 25,314 — 25,3142016 - Amortization — (6,718) (6,718)2016 - Write off (600) (600)
Balance, September 25, 2016 $ 82,750 $ (38,487) $ 44,263
Estimatedfairvalue
The estimated fair value of the Company’s long-term debt, including the current portion, as of September 25, 2016 , is as follows:
September 25, 2016
Issue Face Value Fair Value
Amended Credit Agreement - Tranche G Term Loans $ 1,409,625 $ 1,414,982Amended Credit Agreement - Tranche H Term Loans 510,563 512,503Amended Credit Agreement - Tranche I Term Loans 547,250 550,6983.0% Note payable to Gilster Mary Lee Corporation 6,023 6,0234.875% Senior Notes 350,000 359,6255.875% Senior Notes 350,000 372,313
$ 3,173,461 $ 3,216,144
The estimated fair value of the Company’s long-term debt, including the current portion, as of December 27, 2015 , is as follows:
December 27, 2015
Issue Face Value Fair Value
Amended Credit Agreement - Tranche G Term Loans $ 1,409,625 $ 1,384,957Amended Credit Agreement - Tranche H Term Loans 514,500 505,4963.0% Note payable to Gilster Mary Lee Corporation 8,878 8,8784.875% Senior Notes 350,000 337,750
$ 2,283,003 $ 2,237,081
The estimated fair values of the Company's long-term debt are classified as Level 2 in the fair value hierarchy. The fair value is based on the quoted market pricefor such notes and loans and borrowing rates currently available to the Company for notes and loans with similar terms and maturities.
11. Pension and Retirement PlansThe Company accounts for pension and retirement plans in accordance with the authoritative guidance for retirement benefit compensation .This guidance requiresrecognition of the funded status of a benefit plan in the statement of financial position. The guidance also requires recognition in accumulated other comprehensiveearnings of certain gains and losses that arise during the period but are deferred under pension accounting rules.
19
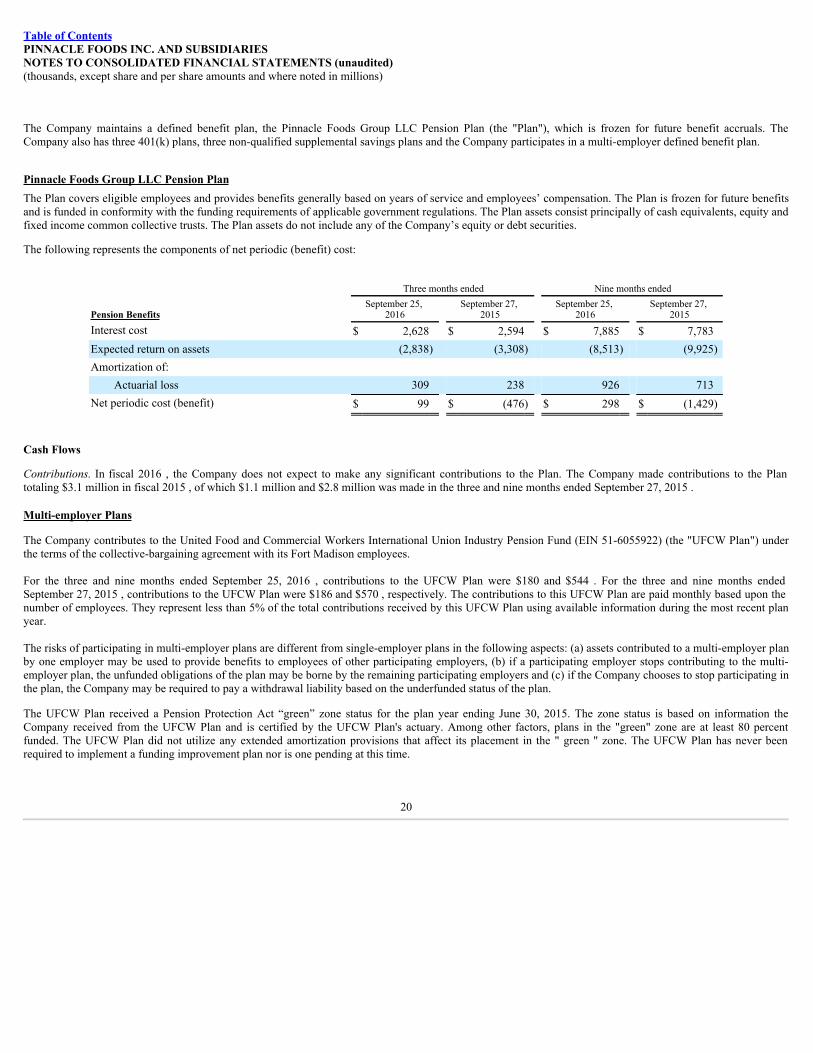
Table of ContentsPINNACLE FOODS INC. AND SUBSIDIARIESNOTES TO CONSOLIDATED FINANCIAL STATEMENTS (unaudited)(thousands, except share and per share amounts and where noted in millions)
The Company maintains a defined benefit plan, the Pinnacle Foods Group LLC Pension Plan (the "Plan"), which is frozen for future benefit accruals. TheCompany also has three 401(k) plans, three non-qualified supplemental savings plans and the Company participates in a multi-employer defined benefit plan.
Pinnacle Foods Group LLC Pension PlanThe Plan covers eligible employees and provides benefits generally based on years of service and employees’ compensation. The Plan is frozen for future benefitsand is funded in conformity with the funding requirements of applicable government regulations. The Plan assets consist principally of cash equivalents, equity andfixed income common collective trusts. The Plan assets do not include any of the Company’s equity or debt securities.
The following represents the components of net periodic (benefit) cost:
Three months ended Nine months ended
Pension BenefitsSeptember 25,
2016 September 27,
2015 September 25,
2016 September 27,
2015Interest cost $ 2,628 $ 2,594 $ 7,885 $ 7,783Expected return on assets (2,838) (3,308) (8,513) (9,925)Amortization of:
Actuarial loss 309 238 926 713Net periodic cost (benefit) $ 99 $ (476) $ 298 $ (1,429)
Cash Flows
Contributions.In fiscal 2016 , the Company does not expect to make any significant contributions to the Plan. The Company made contributions to the Plantotaling $3.1 million in fiscal 2015 , of which $1.1 million and $2.8 million was made in the three and nine months ended September 27, 2015 .
Multi-employer Plans The Company contributes to the United Food and Commercial Workers International Union Industry Pension Fund (EIN 51-6055922) (the "UFCW Plan") underthe terms of the collective-bargaining agreement with its Fort Madison employees.
For the three and nine months ended September 25, 2016 , contributions to the UFCW Plan were $180 and $544 . For the three and nine months endedSeptember 27, 2015 , contributions to the UFCW Plan were $186 and $570 , respectively. The contributions to this UFCW Plan are paid monthly based upon thenumber of employees. They represent less than 5% of the total contributions received by this UFCW Plan using available information during the most recent planyear.
The risks of participating in multi-employer plans are different from single-employer plans in the following aspects: (a) assets contributed to a multi-employer planby one employer may be used to provide benefits to employees of other participating employers, (b) if a participating employer stops contributing to the multi-employer plan, the unfunded obligations of the plan may be borne by the remaining participating employers and (c) if the Company chooses to stop participating inthe plan, the Company may be required to pay a withdrawal liability based on the underfunded status of the plan. The UFCW Plan received a Pension Protection Act “green” zone status for the plan year ending June 30, 2015. The zone status is based on information theCompany received from the UFCW Plan and is certified by the UFCW Plan's actuary. Among other factors, plans in the "green" zone are at least 80 percentfunded. The UFCW Plan did not utilize any extended amortization provisions that affect its placement in the " green " zone. The UFCW Plan has never beenrequired to implement a funding improvement plan nor is one pending at this time.
20

Table of ContentsPINNACLE FOODS INC. AND SUBSIDIARIESNOTES TO CONSOLIDATED FINANCIAL STATEMENTS (unaudited)(thousands, except share and per share amounts and where noted in millions)
12. Financial Instruments
Risk Management Objective of Using DerivativesThe Company is exposed to certain risks arising from both its business operations and economic conditions. The Company principally manages its exposures to awide variety of business and operational risks through management of its core business activities. The Company manages economic risks, including interest rate,liquidity, and credit risk primarily by managing the amount, sources, and duration of its debt funding and the use of derivative financial instruments. The primaryrisks managed by using derivative instruments are interest rate risk, foreign currency exchange risk and commodity price risk. Specifically, the Company entersinto derivative financial instruments to manage exposures that arise from business activities that result in the receipt or payment of future known and uncertaincash amounts, the value of which are determined by interest rates, foreign exchange rates or commodity prices.
The Company manages interest rate risk based on the varying circumstances of anticipated borrowings and existing variable and fixed rate debt, including theCompany’s revolving credit facility. Examples of interest rate management strategies include capping interest rates using targeted interest cost benchmarks,hedging portions of the total amount of debt, or hedging a period of months and not always hedging to maturity, and at other times locking in rates to fix interestscosts.
Certain parts of the Company’s foreign operations in Canada expose the Company to fluctuations in foreign exchange rates. The Company’s goal is to reduce itsexposure to such foreign exchange risks on its foreign currency cash flows and fair value fluctuations on recognized foreign currency denominated assets,liabilities and unrecognized firm commitments to acceptable levels primarily through the use of foreign exchange-related derivative financial instruments. TheCompany enters into derivative financial instruments to protect the value or fix the amount of certain obligations in terms of its functional currency. The Companydoes not enter into these transactions for non-hedging purposes.
The Company purchases raw materials in quantities expected to be used in a reasonable period of time in the normal course of business. The Company generallyenters into agreements for either spot market delivery or forward delivery. The prices paid in the forward delivery contracts are generally fixed, but may also bevariable within a capped or collared price range. Forward derivative contracts on certain commodities are entered into to manage the price risk associated withforecasted purchases of materials used in the Company’s manufacturing processes.
Cash Flow Hedges of Interest Rate Risk
The Company’s objectives in using interest rate derivatives are to add stability to interest expense and to manage its exposure to interest rate movements. Toaccomplish this objective, the Company primarily uses interest rate swaps. Interest rate swaps designated as cash flow hedges involve the receipt of variable-rateamounts from a counterparty in exchange for the Company making fixed-rate payments over the life of the agreements without exchange of the underlyingnotional amount. During the three and nine months ended September 25, 2016 and September 27, 2015 , such derivatives were used to hedge the variable cashflows associated with existing variable-rate debt.
As of September 25, 2016 , the Company had the following interest rate swaps that were designated as cash flow hedges of interest rate risk:
Product Number ofInstruments
CurrentNotionalAmount Fixed Rate Range Index Trade Dates
MaturityDates
Interest Rate Swaps
10
$ 1,316,300
1.45% - 2.97%
USD-LIBOR-BBA
Apr 2013 - Oct2013
Nov 2016 - Apr2020
The effective portion of changes in the fair value of derivatives designated and that qualify as cash flow hedges is recorded in AOCL in the Consolidated BalanceSheets and is subsequently reclassified into earnings in the period that the hedged forecasted transaction affects earnings. The ineffective portion of the change infair value of the derivatives is recognized directly in earnings. Amounts reported in AOCL related to derivatives will be reclassified to Interest expense as interestpayments are made on the Company’s variable-rate debt. During the next twelve months, the Company estimates that an additional $9,654 will be reclassified asan increase to Interest expense.
21

Table of ContentsPINNACLE FOODS INC. AND SUBSIDIARIESNOTES TO CONSOLIDATED FINANCIAL STATEMENTS (unaudited)(thousands, except share and per share amounts and where noted in millions)
Cash Flow Hedges of Foreign Exchange RiskThe Company’s operations in Canada expose the Company to changes in the U.S. Dollar – Canadian Dollar ("USD-CAD") foreign exchange rate. From time totime, the Company’s Canadian subsidiary purchases inventory denominated in U.S. Dollars ("USD"), a currency other than its functional currency. The subsidiarysells that inventory in Canadian dollars ("CAD"). The subsidiary uses currency forward and collar agreements to manage its exposure to fluctuations in the USD-CAD exchange rate. Currency forward agreements involve fixing the USD-CAD exchange rate for delivery of a specified amount of foreign currency on aspecified date. Currency collar agreements involve the sale of CAD currency in exchange for receiving USD if exchange rates rise above an agreed upon rate andpurchase of USD currency in exchange for paying CAD currency if exchange rates fall below an agreed upon rate at specified dates.
As of September 25, 2016 , the Company had the following foreign currency exchange contracts (in aggregate) that were designated as cash flow hedges of foreignexchange risk:
Product Number ofInstruments
Notional Sold inAggregate in CAD
NotionalPurchased in
Aggregate in USD
USD to CADExchange
Rates Trade Date Maturity
Dates
CAD $ Contracts
6
$ 7,500
$ 5,798
1.281 - 1.312
Oct 2015 - April2016
Oct 2016 - Dec2016
The effective portion of changes in the fair value of derivatives designated that qualify as cash flow hedges of foreign exchange risk is recorded in AOCL in theConsolidated Balance Sheets and subsequently reclassified into earnings in the period that the hedged forecasted transaction affects earnings. The ineffectiveportions of the change in fair value of the derivative, as well as amounts excluded from the assessment of hedge effectiveness, are recognized directly in Cost ofproducts sold in the Consolidated Statements of Operations.
Non-designated Hedges of Commodity RiskDerivatives not designated as hedges are not speculative and are used to manage the Company’s exposure to commodity price risk but do not meet the authoritativeguidance for hedge accounting. From time to time, the Company enters into commodity forward contracts to fix the price of diesel fuel, heating oil, natural gas andsoybean oil purchases and other commodities at a future delivery date. Changes in the fair value of derivatives not designated in hedging relationships are recordeddirectly in Cost of products sold in the Consolidated Statements of Operations.
As of September 25, 2016 , the Company had the following derivative instruments that were not designated in qualifying hedging relationships:
Commodity Contracts Number ofInstruments
Notional Purchased inAggregate Price/Index Trade Dates
MaturityDates
Diesel Fuel Contracts
1
7,025,182 Gallons
$3.68 - $3.80 perGallon
Nov 2014
Dec 2016
Heating Oil Contracts
5
8,709,974 Gallons
$1.25 - $1.82 perGallon
Jan 2015 - Feb2016
Dec 2016 - Dec2017
Natural Gas Contracts
2
690,000 MMBTU's
2.41 - 3.23 perMMBTU
March 2016 - July2016
Dec 2016 - June2017
22

Table of ContentsPINNACLE FOODS INC. AND SUBSIDIARIESNOTES TO CONSOLIDATED FINANCIAL STATEMENTS (unaudited)(thousands, except share and per share amounts and where noted in millions)
The table below presents the fair value of the Company’s derivative financial instruments as well as their classification in the Consolidated Balance Sheets as ofSeptember 25, 2016 and December 27, 2015 .
Tabular Disclosure of Fair Values of Derivative Instruments
Asset Derivatives Liability Derivatives
Balance Sheet
Location
Fair Value as of
September 25, 2016 Balance Sheet
Location
Fair Value as of
September 25, 2016Derivatives designated as hedging instruments Interest Rate Contracts Accrued liabilities $ 3,696
Other long-termliabilities 27,216
Foreign Exchange Contracts Other current assets $ 101 Total derivatives designated as hedging instruments $ 101 $ 30,912Derivatives not designated as hedging instruments Commodity Contracts Other current assets $ 232 Accrued liabilities $ 2,185 Other assets, net 1,166 Total derivatives not designated as hedging instruments $ 1,398 $ 2,185
Balance Sheet
Location
Fair Value as of
December 27, 2015 Balance Sheet
Location
Fair Value as of
December 27, 2015Derivatives designated as hedging instruments Interest Rate Contracts Accrued liabilities $ 3,921
Other long-termliabilities 14,947
Foreign Exchange Contracts Other current assets $ 471 Total derivatives designated as hedging instruments $ 471 $ 18,868Derivatives not designated as hedging instruments Commodity Contracts Accrued liabilities $ 2,036
Other long-termliabilities 7,977
Total derivatives not designated as hedging instruments $ — $ 10,013
The Company has elected not to offset the fair values of derivative assets and liabilities executed with the same counterparty that are generally subject toenforceable netting agreements. However, if the Company were to offset and record the asset and liability balances of derivatives on a net basis, the amountspresented in the Consolidated Balance Sheets as of September 25, 2016 and December 27, 2015 would be adjusted as detailed in the following table:
September 25, 2016 December 27, 2015
Derivative Instrument
Gross AmountsPresented in the
Consolidated BalanceSheet
Gross Amounts NotOffset in the
Consolidated BalanceSheet Subject to
Netting Agreements Net Amount
Gross AmountsPresented in the
Consolidated BalanceSheet
Gross Amounts NotOffset in the
Consolidated BalanceSheet Subject to
Netting Agreements Net Amount
Total asset derivatives $ 1,499 (1,499) $ — $ 471 (471) $ — Total liability derivatives $ 33,097 (1,499) $ 31,598 $ 28,881 (471) $ 28,410
23
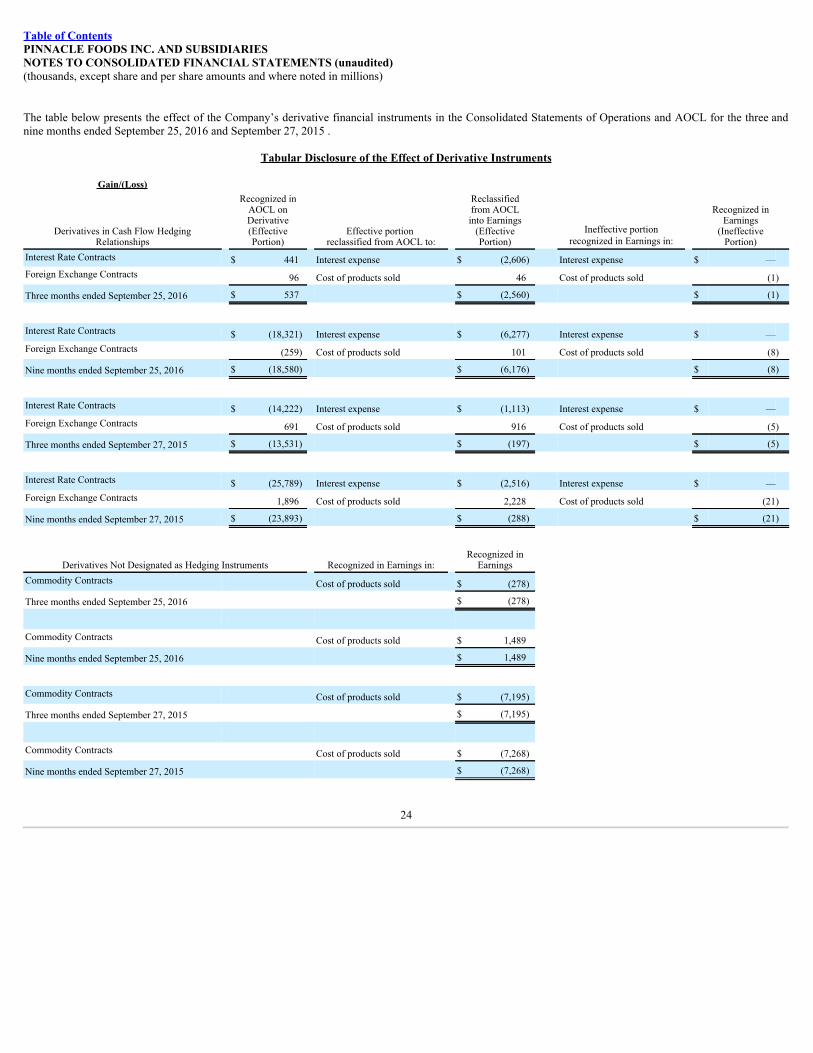
Table of ContentsPINNACLE FOODS INC. AND SUBSIDIARIESNOTES TO CONSOLIDATED FINANCIAL STATEMENTS (unaudited)(thousands, except share and per share amounts and where noted in millions)
The table below presents the effect of the Company’s derivative financial instruments in the Consolidated Statements of Operations and AOCL for the three andnine months ended September 25, 2016 and September 27, 2015 .
Tabular Disclosure of the Effect of Derivative Instruments
Gain/(Loss)
Derivatives in Cash Flow HedgingRelationships
Recognized inAOCL onDerivative(EffectivePortion)
Effective portion reclassified from AOCL to:
Reclassifiedfrom AOCLinto Earnings
(EffectivePortion)
Ineffective portionrecognized in Earnings in:
Recognized inEarnings
(IneffectivePortion)
Interest Rate Contracts $ 441 Interest expense $ (2,606) Interest expense $ —Foreign Exchange Contracts 96 Cost of products sold 46 Cost of products sold (1)
Three months ended September 25, 2016 $ 537 $ (2,560) $ (1)
Interest Rate Contracts $ (18,321) Interest expense $ (6,277) Interest expense $ —Foreign Exchange Contracts (259) Cost of products sold 101 Cost of products sold (8)
Nine months ended September 25, 2016 $ (18,580) $ (6,176) $ (8)
Interest Rate Contracts $ (14,222) Interest expense $ (1,113) Interest expense $ —Foreign Exchange Contracts 691 Cost of products sold 916 Cost of products sold (5)
Three months ended September 27, 2015 $ (13,531) $ (197) $ (5)
Interest Rate Contracts $ (25,789) Interest expense $ (2,516) Interest expense $ —Foreign Exchange Contracts 1,896 Cost of products sold 2,228 Cost of products sold (21)
Nine months ended September 27, 2015 $ (23,893) $ (288) $ (21)
Derivatives Not Designated as Hedging Instruments Recognized in Earnings in: Recognized in
Earnings Commodity Contracts Cost of products sold $ (278)
Three months ended September 25, 2016 $ (278)
Commodity Contracts Cost of products sold $ 1,489
Nine months ended September 25, 2016 $ 1,489
Commodity Contracts Cost of products sold $ (7,195)
Three months ended September 27, 2015 $ (7,195)
Commodity Contracts Cost of products sold $ (7,268)
Nine months ended September 27, 2015 $ (7,268)
24

Table of ContentsPINNACLE FOODS INC. AND SUBSIDIARIESNOTES TO CONSOLIDATED FINANCIAL STATEMENTS (unaudited)(thousands, except share and per share amounts and where noted in millions)
Credit risk-related contingent featuresThe Company has agreements with certain counterparties that contain a provision whereby the Company could be declared in default on its derivative obligationsif repayment of the underlying indebtedness is accelerated by the lender due to the Company’s default on the indebtedness. As of September 25, 2016 , theCompany has not posted any collateral related to these agreements. If the Company had breached this provision at September 25, 2016 , it could have beenrequired to settle its obligations under the agreements at their termination value, which differs from the recorded fair value. The table below summarizes theaggregate fair values of those derivatives that contain credit risk-related contingent features as of September 25, 2016 and December 27, 2015 .
September 25, 2016
Asset/(Liability)
Counterparty Contract
Type Termination
Value
PerformanceRisk
Adjustment AccruedInterest
Fair Value(excludinginterest)
Barclays Interest Rate Contracts $ (16,697) $ 996 $ (516) $ (15,185) Foreign Exchange Contracts 94 — — 94 Commodity Contracts (1,492) 7 — (1,485)Bank of America Interest Rate Contracts (14,674) 1,167 — (13,507) Foreign Exchange Contracts 7 — — 7 Commodity Contracts 230 1 — 231Credit Suisse Interest Rate Contracts (2,078) 22 (530) (1,526)Macquarie Interest Rate Contracts (992) 3 (294) (695) Commodity Contracts 467 — — 467Total $ (35,135) $ 2,197 $ (1,340) $ (31,598)
December 27, 2015
Asset/(Liability)
Counterparty Contract
Type Termination
Value
PerformanceRisk
Adjustment AccruedInterest
Fair Value(excludinginterest)
Barclays Interest Rate Contracts $ (9,616) $ 773 $ (260) $ (8,583) Commodity Contracts (7,035) 116 — (6,919)Bank of America Interest Rate Contracts (5,879) 790 — (5,089) Foreign Exchange Contracts 470 1 — 471 Commodity Contracts (1,737) 29 — (1,709)Credit Suisse Interest Rate Contracts (2,627) 53 (260) (2,314)Macquarie Interest Rate Contracts (3,137) 47 (209) (2,882) Commodity Contracts (1,408) 23 — (1,386)Total $ (30,970) $ 1,831 $ (728) $ (28,410)
13. Commitments and ContingenciesGeneralFrom time to time, the Company and its subsidiaries are parties to, or targets of, lawsuits, claims, investigations, and proceedings, which are being handled anddefended in the ordinary course of business. Although the outcome of such items cannot be determined with certainty, the Company’s general counsel andmanagement are of the opinion that the final outcome of these matters will not have a material effect on the Company’s financial condition, results of operations orcash flows.
25

Table of ContentsPINNACLE FOODS INC. AND SUBSIDIARIESNOTES TO CONSOLIDATED FINANCIAL STATEMENTS (unaudited)(thousands, except share and per share amounts and where noted in millions)
No single item individually is, nor are all of them in the aggregate, material.
14. Segments
The Company is a leading manufacturer, marketer and distributor of high quality, branded food products in North America. Subsequent to the Boulder acquisition,the Company manages the business in four operating segments: Birds Eye Frozen, Duncan Hines Grocery, Boulder Brands and Specialty Foods.
The Birds Eye Frozen segment is comprised of our Leadership Brands in the retail frozen vegetables ( BirdsEye), frozen complete bagged meals ( BirdsEyeVoila!), plant-based protein frozen products ( gardein) and frozen prepared seafood ( VandeKamp’sand Mrs.Paul’s) categories, as well as our FoundationBrands in the full-calorie single-serve frozen dinners and entrées ( Hungry-Man ), frozen pancakes / waffles / French Toast ( Aunt Jemima ), frozen andrefrigerated bagels ( Lender’s) and frozen pizza for one ( Celeste) categories.
The Duncan Hines Grocery segment is comprised of our Leadership Brands in the baking mixes and frostings ( DuncanHines), shelf-stable pickles ( Vlasic),liquid and dry-mix salad dressings ( Wish-Boneand Western), and table syrups ( Mrs.Butterworth’sand LogCabin) categories, and our Foundation Brands in thecanned meat ( Armour,Nalleyand Brooks), pie and pastry fillings ( DuncanHinesComstockandWilderness), and barbecue sauces ( OpenPit) categories as wellas Canadian operations, excluding Garden Protein.
The Company refers to the sum of the Birds Eye Frozen segment and the Duncan Hines Grocery segment as the North America Retail business.
The Boulder Brands segment is comprised of health and wellness brands including gluten-free products ( Udi'sand Glutino) , natural frozen meal offerings (EVOL), refrigerated and shelf-stable spreads ( SmartBalance),and plant-based refrigerated and shelf-stable spreads ( EarthBalance).
The Specialty Foods segment consists of snack products ( Tim'sCascadeand SnyderofBerlin), foodservice and private label business.
As the Company continues to integrate the Boulder Brands segment into its operations and financial reporting systems, the Company’s management expects toreevaluate its internal reporting, which may require reporting of its results in different reportable segments in future periods.
Segment performance is evaluated by the Company’s Chief Operating Decision Maker and is based on earnings before interest and taxes. Transfers betweensegments and geographic areas are recorded at cost plus markup or at market. Identifiable assets are those assets, including goodwill, which are identified with theoperations in each segment or geographic region. Corporate assets consist of prepaid and deferred tax assets. Unallocated corporate expenses consist of corporateoverhead such as executive management, finance and legal functions.
26

Table of ContentsPINNACLE FOODS INC. AND SUBSIDIARIESNOTES TO CONSOLIDATED FINANCIAL STATEMENTS (unaudited)(thousands, except share and per share amounts and where noted in millions)
Three months ended Nine months endedSEGMENT INFORMATION September 25,
2016 September 27,
2015 September 25,
2016September 27,
2015Net sales
Birds Eye Frozen $ 308,938 $ 296,709 $ 924,104 $ 883,458Duncan Hines Grocery 249,545 257,387 763,201 796,579Boulder Brands 120,926 — 344,381 —Specialty Foods 79,412 82,191 237,771 253,277
Total $ 758,821 $ 636,287 $ 2,269,457 $ 1,933,314Earnings before interest and taxes
Birds Eye Frozen $ 54,188 $ 51,953 $ 156,223 $ 133,208Duncan Hines Grocery 48,127 44,223 142,987 138,471Boulder Brands (1) 16,082 — 11,884 —Specialty Foods 6,322 7,788 19,575 23,087Unallocated corporate expenses (2) (6,451) (6,171) (24,334) (18,689)
Total $ 118,268 $ 97,793 $ 306,335 $ 276,077Depreciation and amortization
Birds Eye Frozen $ 11,022 $ 11,989 $ 33,064 $ 33,404Duncan Hines Grocery 7,123 7,781 22,285 22,862Boulder Brands 4,714 — 12,406 —Specialty Foods 4,218 4,492 10,994 11,154
Total $ 27,077 $ 24,262 $ 78,749 $ 67,420Capital expenditures (3)
Birds Eye Frozen $ 16,882 $ 18,688 $ 53,325 $ 36,440Duncan Hines Grocery 6,644 14,799 28,464 40,610Boulder Brands 2,898 — 5,391 —Specialty Foods 1,470 3,078 5,487 7,683
Total $ 27,894 $ 36,565 $ 92,667 $ 84,733
NET SALES BY PRODUCT TYPE Net sales
Frozen $ 402,468 $ 335,888 $ 1,198,785 $ 1,000,362Shelf stable meals and meal enhancers 239,694 204,067 739,869 646,992Desserts 79,028 70,806 223,792 207,939Snacks 37,631 25,526 107,011 78,021
Total $ 758,821 $ 636,287 $ 2,269,457 $ 1,933,314
GEOGRAPHIC INFORMATION Net sales
United States $ 707,803 $ 633,063 $ 2,194,442 $ 1,920,698Canada 34,989 28,260 112,103 88,825United Kingdom 2,681 — 8,370 —Intercompany 13,348 (25,036) (45,458) (76,209)
Total $ 758,821 $ 636,287 $ 2,269,457 $ 1,933,314
27

Table of ContentsPINNACLE FOODS INC. AND SUBSIDIARIESNOTES TO CONSOLIDATED FINANCIAL STATEMENTS (unaudited)(thousands, except share and per share amounts and where noted in millions)
(1) Includes $10.4 million of charges related to the fair value step-up of inventories acquired and $17.3 million of restructuring costs in the nine monthsended September 25, 2016 .
(2) Includes $6.8 million of acquisition costs in the nine months ended September 25, 2016 .(3) Includes new capital leases.
SEGMENT INFORMATIONSeptember 25,
2016 December 27,
2015Total assets
Birds Eye Frozen $ 2,275,786 $ 2,263,159Duncan Hines Grocery 2,683,785 2,664,966Boulder Brands 1,245,984 —Specialty Foods 347,744 351,499Corporate 64,059 44,539
Total $ 6,617,358 $ 5,324,163GEOGRAPHIC INFORMATION Plant assets
United States $ 673,512 $ 615,123Canada 31,920 15,986United Kingdom 3,520 —
Total $ 708,952 $ 631,109
15. Provision for Income Taxes
The provision for income taxes and related effective tax rates for the three and nine months ended September 25, 2016 and September 27, 2015 , respectively, wereas follows:
Three months ended Nine months ended
Provision for Income TaxesSeptember 25,
2016 September 27,
2015 September 25,
2016 September 27,
2015Current $ 19,759 $ 5,010 $ 51,155 $ 21,306Deferred 9,710 22,377 28,737 55,500Total $ 29,469 $ 27,387 $ 79,892 $ 76,806
Effective tax rate 36.0% 36.3% 39.4% 36.6%
Income taxes are accounted for in accordance with the authoritative guidance for accounting for income taxes under which deferred tax assets and liabilities aredetermined based on the difference between their financial statement basis and tax basis, using enacted tax rates in effect for the year in which the differences areexpected to reverse.
In connection with our acquisition of Boulder, our effective income tax rate for the nine months ended September 25, 2016 was increased by 3.7% due to the taxeffect of certain non-deductible acquisition costs and compensation payments, a charge for an increase in our non-current state deferred income tax liabilitybalance and a charge related to the tax effect of foreign operations, principally attributable to a valuation allowance on our foreign tax credit carryforward. Ourincome tax rate for the nine months September 27, 2015 reflects a deferred tax benefit of 0.9% for changes related to our state tax profile.
For the three months ended September 25, 2016 and September 27, 2015 our rate reflects the benefit of the domestic production activities deduction and tax creditsand the effect of enacted state tax legislation. For the three months ended September 25, 2016 our tax effective tax rate also benefits from a decrease in our liabilityfor uncertain tax positions.
The Company regularly evaluates its deferred tax assets for future realization. A valuation allowance is established when the Company believes that it is morelikely than not that some portion of its deferred tax assets will not be realized. Changes in
28

Table of ContentsPINNACLE FOODS INC. AND SUBSIDIARIESNOTES TO CONSOLIDATED FINANCIAL STATEMENTS (unaudited)(thousands, except share and per share amounts and where noted in millions)
valuation allowances from period to period are included in the Company's tax provision in the period of change and as noted above, for the nine months endedSeptember 25, 2016, a valuation allowance was recorded on our foreign tax credit carryforward in connection with our acquisition of Boulder Brands. There wasno significant movement in our valuation allowances on state attribute carryforwards during the three and nine months ended September 25, 2016 and for the threeand nine months ended September 27, 2015.
The Company is a loss corporation as defined by Internal Revenue Code (“the Code”) Section 382. Section 382 places an annual limitation on our ability to use ourfederal net operating loss (“NOL”) carryovers and other attributes to reduce future taxable income. As of September 25, 2016 , we have federal NOL carryovers of$439.4 million subject to an annual limitation of $17.1 million . As a result, $237.2 million of the carryovers exceed the estimated available Section 382 limitation.The Company has reduced its deferred tax assets for this limitation.
On January 15, 2016 we acquired Boulder which is a loss corporation. As of the acquisition date, Boulder had approximately $50.8 million of federal NOLcarryovers subject to the Section 382 provisions. The annual limitation is approximately $26.5 million subject to increase for recognized built in gains during therecognition period. Based on our analysis, we anticipate we will be able to utilize the acquired NOL balance in our 2016 tax year without limitation.
In connection with our acquisition of Boulder we also recorded, in purchase accounting, reserves for uncertain positions of approximately $5.4 million for mattersrelated to their foreign operations.
16. Recently Issued Accounting Pronouncements
In May 2014, the Financial Accounting Standards Board (“FASB”) issued Accounting Standards Update (“ASU”) No. 2014-09, “Revenue from Contracts withCustomers (Topic 606).” This ASU supersedes the revenue recognition requirements in ASC 605, Revenue Recognition. ASU No. 2014-09 will require an entity torecognize revenue when it transfers promised goods or services to customers using a five-step model that requires entities to exercise judgment when consideringthe terms of contracts with customers. This ASU can be adopted either retrospectively to each prior reporting period presented or as a cumulative-effect adjustmentas of the date of adoption. In August 2015, the FASB issued ASU 2015-14 “Revenue from Contracts with Customers (Topic 606) – Deferral of the Effective Date”providing for a one-year deferral of the effective date of ASU 2014-09 from January 1, 2017 to January 1, 2018; however, early adoption is still permissible as ofJanuary 1, 2017 for public entities. In March 2016, the FASB issued ASU No. 2016-08, “Revenue from Contracts with Customers (Topic 606) – Principal versusAgent Considerations.” The amendments under this ASU clarify the implementation guidance on principal versus agent considerations included within ASU 2014-09. In April 2016, the FASB issued ASU No. 2016-10, “Revenue from Contracts with Customers (Topic 606) – Identifying Performance Obligations andLicensing.” This ASU includes updates which are intended to reduce the cost and complexity of applying guidance on identifying promised goods and servicesunder Topic 606. In May 2016, the FASB issued ASU No. 2016-12, “Revenue from Contracts with Customers (Topic 606) – Narrow-Scope Improvements andPractical Expedients.” This ASU clarifies several aspects of Topic 606 such as the assessment of collectability, presentation of sales taxes, noncash consideration,and completed contracts and contract modifications at transition. The Company is currently evaluating the impact that the new guidance will have on theconsolidated financial statements, as well as which transition method it will use.
In March 2016, the FASB issued Accounting Standards Update (“ASU”) No. 2016-09, "Improvements to Employee Share-Based Payment Accounting". The areasfor simplification in this ASU involve several aspects of the accounting for share-based payment transactions, including the income tax consequences,classification of awards as either equity or liabilities, and classification on the statement of cash flows. The updated guidance will be effective for fiscal yearsbeginning after December 15, 2016, and interim periods within those annual periods. Early application is permitted. The amendments related to the timing of whenexcess tax benefits are recognized are to be applied using a modified retrospective approach. The amendments related to the presentation of employee taxes paid onthe statement of cash flows are to be applied retrospectively. The amendments requiring recognition of excess tax benefits and tax deficiencies in the incomestatement are to be applied prospectively. The Company is in the process of evaluating this guidance.
In February 2016, the FASB issued ASU No. 2016-02, “Leases”. The FASB is amending the FASB Accounting Standards Codification ("ASC") and creatingTopic 842, Leases, which will supersede Topic 840, Leases. The main difference between previous GAAP and Topic 842 is the recognition of lease assets andlease liabilities by lessees for those leases classified as operating
29

Table of ContentsPINNACLE FOODS INC. AND SUBSIDIARIESNOTES TO CONSOLIDATED FINANCIAL STATEMENTS (unaudited)(thousands, except share and per share amounts and where noted in millions)
leases under previous GAAP. Under the new guidance, lessees will be required to recognize the assets and liabilities arising from leases on the balance sheet. Theupdated guidance will be effective for fiscal years beginning after December 15, 2018, including interim periods within those fiscal years. Early application ispermitted. In transition to the new guidance, entities are required to recognize and measure leases at the beginning of the earliest period presented using a modifiedretrospective approach. The Company is in the process of evaluating this guidance.
In November 2015, the FASB issued ASU No. 2015-17, “Balance Sheet Classification of Deferred Taxes”. The new guidance eliminates the requirement toseparate deferred income tax liabilities and assets into current and noncurrent amounts. The amendments will require that deferred tax liabilities and assets beclassified as noncurrent in a classified statement of financial position. The updated guidance will be effective for fiscal years beginning after December 15, 2016,including interim periods within those annual periods. Early adoption is permitted, and the amendments may be applied either prospectively to all deferred taxliabilities and assets or retrospectively to all periods presented. The Company is in the process of evaluating this guidance.
In September 2015, the FASB issued ASU No. 2015-16, “Simplifying the Accounting for Measurement-Period Adjustments”. The new guidance eliminates therequirement to retrospectively account for adjustments to provisional amounts recognized in a business combination. Under the ASU, the adjustments to theprovisional amounts will be recognized in the reporting period in which the adjustment amounts are determined. The updated guidance will be effective for fiscalyears beginning after December 15, 2015, including interim periods within those fiscal years. Early adoption is permitted, and the ASU should be appliedprospectively. The Company has implemented this guidance in 2016 without material effect on the consolidated financial statements.
In July 2015, the FASB issued ASU No. 2015-11, "Simplifying the Measurement of Inventory", which requires entities to measure most inventory “at the lower ofcost and net realizable value,” thereby simplifying the current guidance under which an entity must measure inventory at the lower of cost or market. The ASU willnot apply to inventories that are measured by using either the last-in, first-out (LIFO) method or the retail inventory method (RIM). The updated guidance will beeffective for annual reporting periods beginning after December 15, 2016, including interim periods within that reporting period. Early adoption is permitted. TheCompany is in the process of evaluating this guidance.
In April 2015, the FASB issued ASU No. 2015-03, “Simplifying the Presentation of Debt Issuance Costs". The new guidance changes the presentation of debtissuance costs in financial statements. Under the ASU, an entity presents such costs in the balance sheet as a direct deduction from the related debt liability ratherthan as an asset. Amortization of the costs will continue to be reported as interest expense. The Company implemented this guidance in 2016. Refer to Note 2 forinformation.
In April 2015, the FASB issued ASU No. 2015-04, “Compensation-Retirement Benefits (Topic 715): Practical Expedient for the Measurement Date of anEmployer’s Defined Benefit Obligation and Plan Assets". The new guidance gives an employer whose fiscal year-end does not coincide with a calendar month-end(e.g., an entity that has a 52- or 53-week fiscal year, as the Company does) the ability, as a practical expedient, to measure defined benefit retirement obligationsand related plan assets as of the month- end that is closest to its fiscal year-end. The updated guidance will be effective for annual reporting periods beginning afterDecember 31, 2015, including interim periods within that reporting period. Early application is permitted, and the ASU should be applied prospectively. TheCompany implemented this guidance in 2015 without material effect on the consolidated financial statements.
30

Table of ContentsPINNACLE FOODS INC. AND SUBSIDIARIESNOTES TO CONSOLIDATED FINANCIAL STATEMENTS (unaudited)(thousands, except share and per share amounts and where noted in millions)
17. Guarantor and Nonguarantor Statements
The Senior Notes are general senior unsecured obligations of Pinnacle Foods Finance, effectively subordinated in right of payment to all existing and future seniorsecured indebtedness of Pinnacle Foods Finance and guaranteed on a full, unconditional, joint and several basis by the Company and Pinnacle Foods Finance's100% owned domestic subsidiaries that guarantee other indebtedness of the Pinnacle Foods Finance. The indenture governing the Senior Notes contains customaryexceptions under which a guarantee of a guarantor subsidiary will terminate, including (1) the sale, exchange or transfer (by merger or otherwise) of the capitalstock or all or substantially all of the assets of such guarantor subsidiary, (2) the release or discharge of the guarantee by such guarantor subsidiary of the AmendedCredit Agreement or other guarantee that resulted in the creation of the guarantee, (3) the designation of such guarantor subsidiary as an “unrestricted subsidiary”in accordance with the indentures governing the Senior Notes and (4) upon the legal defeasance or covenant defeasance or discharge of the indentures governingthe Senior Notes.
The following condensed consolidating financial information presents:(1) (a) Condensed consolidating balance sheets as of September 25, 2016 and December 27, 2015 .
(b) The related condensed consolidating statements of operations and comprehensive earnings for the Company, Pinnacle Foods Finance, all guarantorsubsidiaries and the non-guarantor subsidiaries for the following:
i. Three and nine months ended September 25, 2016 ; andii. Three and nine months ended September 27, 2015 .
(c) The related condensed consolidating statements of cash flows for the Company, Pinnacle Foods Finance, all guarantor subsidiaries and the non-guarantor subsidiaries for the following:
i. Nine months ended ended September 25, 2016 ; andii. Nine months ended ended September 27, 2015 .
(2) Elimination entries necessary to consolidate the Company, Pinnacle Foods Finance with its guarantor subsidiaries and non-guarantor subsidiaries.
Investments in subsidiaries are accounted for by the parent using the equity method of accounting. The guarantor subsidiaries are presented on a combined basis.The principal elimination entries eliminate investments in subsidiaries and intercompany balances and transactions and include a reclassification entry of net non-current deferred tax assets to non-current deferred tax liabilities.
31

Table of ContentsPINNACLE FOODS INC. AND SUBSIDIARIESNOTES TO CONSOLIDATED FINANCIAL STATEMENTS (unaudited)(thousands, except share and per share amounts and where noted in millions)
Pinnacle Foods Inc.Condensed Consolidating Balance Sheet
September 25, 2016
PinnacleFoodsInc.
PinnacleFoods
Finance LLC Guarantor
Subsidiaries NonguarantorSubsidiaries
Eliminationsand
Reclassifications Consolidated
TotalCurrent assets:
Cash and cash equivalents $ — $ — $ 155,728 $ 9,200 $ — $ 164,928Accounts receivable, net — — 291,791 10,468 — 302,259Intercompany accounts receivable 96,577 — 824,475 — (921,052) —Inventories, net — — 482,754 19,298 — 502,052Other current assets — 333 7,750 1,080 — 9,163Deferred tax assets — 1,670 52,099 1,089 — 54,858
Total current assets 96,577 2,003 1,814,597 41,135 (921,052) 1,033,260Plant assets, net — — 673,512 35,440 — 708,952Investment in subsidiaries 1,814,437 2,521,093 37,892 — (4,373,422) —Intercompany note receivable — 3,011,509 44,858 9,800 (3,066,167) —Tradenames — — 2,525,200 4,480 — 2,529,680Other assets, net — 1,967 162,839 11,229 — 176,035Deferred tax assets — 345,820 — 933 (346,753) —Goodwill — — 2,115,105 54,326 — 2,169,431
Total assets $ 1,911,014 $ 5,882,392 $ 7,374,003 $ 157,343 $ (8,707,394) $ 6,617,358Current liabilities:
Short-term borrowings $ — $ — $ 1,197 $ — $ — $ 1,197Current portion of long-term obligations — 10,750 12,949 15 — 23,714Accounts payable — 39 245,148 6,649 — 251,836Intercompany accounts payable — 888,312 — 32,740 (921,052) —Accrued trade marketing expense — — 42,213 2,387 — 44,600Accrued liabilities 177 29,083 128,086 4,039 — 161,385Dividends payable 34,883 — — — — 34,883
Total current liabilities 35,060 928,184 429,593 45,830 (921,052) 517,615Long-term debt — 3,112,555 28,210 298 — 3,141,063Intercompany note payable — — 3,001,465 64,702 (3,066,167) —Pension and other postretirement benefits — — 62,640 — — 62,640Other long-term liabilities — 27,216 33,126 3,339 — 63,681Deferred tax liabilities — — 1,297,876 4,362 (346,753) 955,485
Total liabilities 35,060 4,067,955 4,852,910 118,531 (4,333,972) 4,740,484Commitments and contingencies (Note 13)
Shareholders' equity:
Pinnacle common stock 1,191 — — — — 1,191Additional paid-in-capital 1,422,483 1,423,674 1,345,619 33,015 (2,802,308) 1,422,483Retained earnings 546,762 453,135 1,212,123 12,787 (1,678,045) 546,762Accumulated other comprehensive loss (62,372) (62,372) (36,649) (7,910) 106,931 (62,372)
Capital stock in treasury, at cost (32,110) — — — — (32,110)Total Pinnacle Foods Inc. and Subsidiariesstockholders' equity 1,875,954 1,814,437 2,521,093 37,892 (4,373,422) 1,875,954
Non-controlling interest — — — 920 — 920Total Equity 1,875,954 1,814,437 2,521,093 38,812 (4,373,422) 1,876,874Total liabilities and equity $ 1,911,014 $ 5,882,392 $ 7,374,003 $ 157,343 $ (8,707,394) $ 6,617,358
32

Table of ContentsPINNACLE FOODS INC. AND SUBSIDIARIESNOTES TO CONSOLIDATED FINANCIAL STATEMENTS (unaudited)(thousands, except share and per share amounts and where noted in millions)
Pinnacle Foods Inc.Condensed Consolidating Balance Sheet
December 27, 2015
PinnacleFoodsInc.
PinnacleFoods
Finance LLC Guarantor
Subsidiaries NonguarantorSubsidiaries
Eliminationsand
Reclassifications Consolidated
TotalCurrent assets:
Cash and cash equivalents $ — $ — $ 177,669 $ 2,880 $ — $ 180,549Accounts receivable, net — — 214,690 5,046 — 219,736Intercompany accounts receivable 92,475 — 725,074 — (817,549) —Inventories, net — — 392,404 10,697 — 403,101Other current assets — 470 11,860 1,347 — 13,677Deferred tax assets — 1,670 38,516 385 — 40,571
Total current assets 92,475 2,140 1,560,213 20,355 (817,549) 857,634Plant assets, net — — 615,123 15,986 — 631,109Investment in subsidiaries 1,744,015 2,428,472 26,433 — (4,198,920) —Intercompany note receivable — 2,084,130 8,398 9,800 (2,102,328) —Tradenames — — 1,996,800 4,248 — 2,001,048Other assets, net — 935 118,621 808 — 120,364Deferred tax assets — 332,372 — — (332,372) —Goodwill — — 1,692,715 21,293 — 1,714,008
Total assets $ 1,836,490 $ 4,848,049 $ 6,018,303 $ 72,490 $ (7,451,169) $ 5,324,163
Current liabilities: Short-term borrowings $ — $ — $ 2,225 $ — $ — $ 2,225Current portion of long-term obligations — 5,250 9,515 82 — 14,847Accounts payable — — 206,082 4,957 — 211,039Intercompany accounts payable — 815,100 — 2,449 (817,549) —Accrued trade marketing expense — — 44,096 2,132 — 46,228Accrued liabilities 163 18,152 79,468 2,727 — 100,510Dividends payable 30,798 — — — — 30,798
Total current liabilities 30,961 838,502 341,386 12,347 (817,549) 405,647Long-term debt — 2,242,608 14,055 349 — 2,257,012Intercompany note payable — — 2,075,113 27,215 (2,102,328) —Pension and other postretirement benefits — — 63,454 — — 63,454Other long-term liabilities — 22,924 28,195 3,387 — 54,506Deferred tax liabilities — — 1,067,628 2,759 (332,372) 738,015
Total liabilities 30,961 3,104,034 3,589,831 46,057 (3,252,249) 3,518,634Commitments and contingencies (Note 13)
Shareholders' equity: Pinnacle common stock 1,176 — — — — 1,176Additional paid-in-capital 1,378,521 1,379,697 1,301,642 20,476 (2,701,815) 1,378,521Retained earnings 517,330 423,706 1,169,032 14,212 (1,606,950) 517,330Accumulated other comprehensive loss (59,388) (59,388) (42,202) (8,255) 109,845 (59,388)
Capital stock in treasury, at cost (32,110) — — — — (32,110)
Total Shareholders' equity 1,805,529 1,744,015 2,428,472 26,433 (4,198,920) 1,805,529Total liabilities and shareholders' equity $ 1,836,490 $ 4,848,049 $ 6,018,303 $ 72,490 $ (7,451,169) $ 5,324,163
33

Table of ContentsPINNACLE FOODS INC. AND SUBSIDIARIESNOTES TO CONSOLIDATED FINANCIAL STATEMENTS (unaudited)(thousands, except share and per share amounts and where noted in millions)
Pinnacle Foods Inc.Condensed Consolidating Statement of Operations and Comprehensive Earnings
For the three months ended September 25, 2016
PinnacleFoodsInc.
PinnacleFoods
Finance LLC Guarantor
Subsidiaries NonguarantorSubsidiaries Eliminations
ConsolidatedTotal
Net sales $ — $ — $ 730,853 $ 37,670 $ (9,702) $ 758,821Cost of products sold — — 503,863 35,243 (8,989) 530,117
Gross profit — — 226,990 2,427 (713) 228,704
Marketing and selling expenses — — 52,666 1,213 — 53,879Administrative expenses — — 34,552 1,887 — 36,439Research and development expenses — — 4,392 172 — 4,564Tradename impairment charges — — 11,200 — — 11,200Intercompany royalties — — (106) (73) 179 —Intercompany management fees — — — 642 (642) —Intercompany technical service fees — — — 250 (250) —Other expense (income), net — 256 3,681 417 — 4,354Equity in (earnings) loss of investees (52,353) (57,978) 3,176 — 107,155 —
(52,353) (57,722) 109,561 4,508 106,442 110,436Earnings before interest and taxes 52,353 57,722 117,429 (2,081) (107,155) 118,268
Intercompany interest (income) expense — (26,919) 25,745 1,174 — —Interest expense — 35,945 517 11 — 36,473Interest income — — 12 15 — 27
Earnings before income taxes 52,353 48,696 91,179 (3,251) (107,155) 81,822Provision (benefit) for income taxes — (3,657) 33,201 (75) — 29,469Net earnings 52,353 52,353 57,978 (3,176) (107,155) 52,353Less: Net loss attributable to non-controlling interest — — — — — —Net earnings attributable to Pinnacle Foods, Inc. andSubsidiaries common stockholders $ 52,353 $ 52,353 $ 57,978 $ (3,176) $ (107,155) $ 52,353
Total comprehensive earnings 52,918 52,918 56,677 (4,704) (104,891) 52,918Less: Comprehensive loss attributable to non-controlling interest — — — — — —Comprehensive earnings attributable to PinnacleFoods, Inc. and Subsidiaries $ 52,918 $ 52,918 $ 56,677 $ (4,704) $ (104,891) $ 52,918
34

Table of ContentsPINNACLE FOODS INC. AND SUBSIDIARIESNOTES TO CONSOLIDATED FINANCIAL STATEMENTS (unaudited)(thousands, except share and per share amounts and where noted in millions)
Pinnacle Foods Inc.Condensed Consolidating Statement of Operations and Comprehensive Earnings
For the three months ended September 27, 2015
PinnacleFoodsInc.
PinnacleFoods
Finance LLC Guarantor
Subsidiaries NonguarantorSubsidiaries Eliminations
ConsolidatedTotal
Net sales $ — $ — $ 633,063 $ 28,260 $ (25,036) $ 636,287Cost of products sold — 7 460,515 23,694 (24,784) 459,432
Gross profit — (7) 172,548 4,566 (252) 176,855
Marketing and selling expenses — — 42,683 1,472 — 44,155Administrative expenses — — 24,932 1,535 — 26,467Research and development expenses — — 3,103 144 — 3,247Intercompany royalties — — — 3 (3) —Intercompany technical service fees — — — 249 (249) —Other expense (income), net — 1,568 3,593 32 — 5,193Equity in (earnings) loss of investees (48,098) (52,034) (721) — 100,853 —
(48,098) (50,466) 73,590 3,435 100,601 79,062Earnings before interest and taxes 48,098 50,459 98,958 1,131 (100,853) 97,793
Intercompany interest (income) expense — (17,172) 16,913 259 — —Interest expense — 21,852 454 9 — 22,315Interest income — — — 7 — 7
Earnings before income taxes 48,098 45,779 81,591 870 (100,853) 75,485Provision (benefit) for income taxes — (2,319) 29,557 149 — 27,387Net earnings $ 48,098 $ 48,098 $ 52,034 $ 721 $ (100,853) $ 48,098
Total comprehensive earnings (loss) $ 39,091 $ 39,091 $ 51,050 $ (424) $ (89,717) $ 39,091
35

Table of ContentsPINNACLE FOODS INC. AND SUBSIDIARIESNOTES TO CONSOLIDATED FINANCIAL STATEMENTS (unaudited)(thousands, except share and per share amounts and where noted in millions)
Pinnacle Foods Inc.Condensed Consolidating Statement of Operations and Comprehensive Earnings
For the nine months ended September 25, 2016
PinnacleFoodsInc.
PinnacleFoods
Finance LLC Guarantor
Subsidiaries NonguarantorSubsidiaries Eliminations
ConsolidatedTotal
Net sales $ — $ — $ 2,217,492 $ 120,473 $ (68,508) $ 2,269,457Cost of products sold — — 1,577,814 109,224 (66,044) 1,620,994
Gross profit — — 639,678 11,249 (2,464) 648,463
Marketing and selling expenses — — 169,559 4,254 — 173,813Administrative expenses — — 119,625 6,405 — 126,030Research and development expenses — — 13,295 552 — 13,847Tradename impairment charges — — 11,200 — — 11,200Intercompany royalties — — (410) 410 — —Intercompany management fees — — — 1,716 (1,716) —Intercompany technical service fees — — — 748 (748) —Other expense (income), net — (1,027) 17,716 549 — 17,238Equity in (earnings) loss of investees (122,973) (136,635) 4,841 — 254,767 —
(122,973) (137,662) 335,826 14,634 252,303 342,128Earnings before interest and taxes 122,973 137,662 303,852 (3,385) (254,767) 306,335
Intercompany interest (income) expense — (78,611) 77,327 1,284 — —Interest expense — 102,072 1,496 33 — 103,601Interest income — — 83 48 — 131
Earnings (loss) before income taxes 122,973 114,201 225,112 (4,654) (254,767) 202,865Provision (benefit) for income taxes — (8,772) 88,477 187 — 79,892Net earnings (loss) 122,973 122,973 136,635 (4,841) (254,767) 122,973Less: Net earnings attributable to non-controllinginterest — — — — — —Net earnings (loss) attributable to Pinnacle Foods,Inc. and Subsidiaries common stockholders $ 122,973 $ 122,973 $ 136,635 $ (4,841) $ (254,767) $ 122,973
Total comprehensive earnings 119,989 119,989 141,015 (1,070) (259,934) 119,989Less: Comprehensive earnings attributable to non-controlling interest — — — — — —Comprehensive earnings attributable to PinnacleFoods, Inc. and Subsidiaries $ 119,989 $ 119,989 $ 141,015 $ (1,070) $ (259,934) $ 119,989
36

Table of ContentsPINNACLE FOODS INC. AND SUBSIDIARIESNOTES TO CONSOLIDATED FINANCIAL STATEMENTS (unaudited)(thousands, except share and per share amounts and where noted in millions)
Pinnacle Foods Inc.Condensed Consolidating Statement of Operations and Comprehensive Earnings
For the nine months ended September 27, 2015
PinnacleFoodsInc.
PinnacleFoods
Finance LLC Guarantor
Subsidiaries NonguarantorSubsidiaries Eliminations
ConsolidatedTotal
Net sales $ — $ — $ 1,920,698 $ 88,825 $ (76,209) $ 1,933,314Cost of products sold — 23 1,417,751 73,303 (75,444) 1,415,633
Gross profit — (23) 502,947 15,522 (765) 517,681
Marketing and selling expenses — — 129,294 7,568 — 136,862Administrative expenses — 3 77,180 4,735 — 81,918Research and development expenses — — 9,493 395 — 9,888Intercompany royalties — — — 17 (17) —Intercompany technical service fees — — — 748 (748) —Other expense (income), net — 2,879 9,989 68 — 12,936Equity in (earnings) loss of investees (133,313) (143,486) (1,058) — 277,857 —
(133,313) (140,604) 224,898 13,531 277,092 241,604Earnings before interest and taxes 133,313 140,581 278,049 1,991 (277,857) 276,077
Intercompany interest (income) expense — (51,531) 50,742 789 — —Interest expense — 64,781 1,317 32 — 66,130Interest income — — 147 25 — 172
Earnings (loss) before income taxes 133,313 127,331 226,137 1,195 (277,857) 210,119Provision (benefit) for income taxes — (5,982) 82,651 137 — 76,806Net earnings (loss) $ 133,313 $ 133,313 $ 143,486 $ 1,058 $ (277,857) $ 133,313
Total comprehensive earnings (loss) $ 117,145 $ 117,145 $ 141,561 $ (1,349) $ (257,357) $ 117,145
37
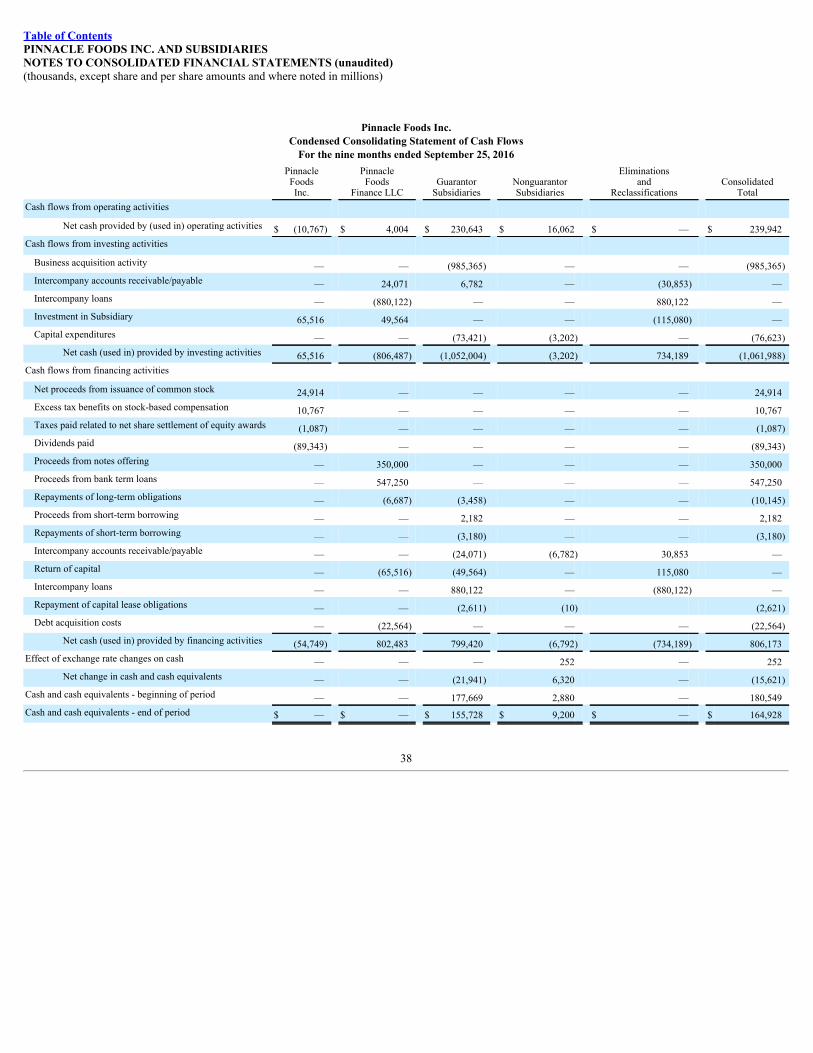
Table of ContentsPINNACLE FOODS INC. AND SUBSIDIARIESNOTES TO CONSOLIDATED FINANCIAL STATEMENTS (unaudited)(thousands, except share and per share amounts and where noted in millions)
Pinnacle Foods Inc.Condensed Consolidating Statement of Cash Flows
For the nine months ended September 25, 2016
PinnacleFoodsInc.
PinnacleFoods
Finance LLC Guarantor
Subsidiaries NonguarantorSubsidiaries
Eliminationsand
Reclassifications Consolidated
TotalCash flows from operating activities
Net cash provided by (used in) operating activities $ (10,767) $ 4,004 $ 230,643 $ 16,062 $ — $ 239,942Cash flows from investing activities
Business acquisition activity — — (985,365) — — (985,365)Intercompany accounts receivable/payable — 24,071 6,782 — (30,853) —Intercompany loans — (880,122) — — 880,122 —Investment in Subsidiary 65,516 49,564 — — (115,080) —Capital expenditures — — (73,421) (3,202) — (76,623)
Net cash (used in) provided by investing activities 65,516 (806,487) (1,052,004) (3,202) 734,189 (1,061,988)Cash flows from financing activities
Net proceeds from issuance of common stock 24,914 — — — — 24,914Excess tax benefits on stock-based compensation 10,767 — — — — 10,767Taxes paid related to net share settlement of equity awards (1,087) — — — — (1,087)Dividends paid (89,343) — — — — (89,343)Proceeds from notes offering — 350,000 — — — 350,000Proceeds from bank term loans — 547,250 — — — 547,250Repayments of long-term obligations — (6,687) (3,458) — — (10,145)Proceeds from short-term borrowing — — 2,182 — — 2,182Repayments of short-term borrowing — — (3,180) — — (3,180)Intercompany accounts receivable/payable — — (24,071) (6,782) 30,853 —Return of capital — (65,516) (49,564) — 115,080 —Intercompany loans — — 880,122 — (880,122) —Repayment of capital lease obligations — — (2,611) (10) (2,621)Debt acquisition costs — (22,564) — — — (22,564)
Net cash (used in) provided by financing activities (54,749) 802,483 799,420 (6,792) (734,189) 806,173Effect of exchange rate changes on cash — — — 252 — 252
Net change in cash and cash equivalents — — (21,941) 6,320 — (15,621)Cash and cash equivalents - beginning of period — — 177,669 2,880 — 180,549Cash and cash equivalents - end of period $ — $ — $ 155,728 $ 9,200 $ — $ 164,928
38

Table of ContentsPINNACLE FOODS INC. AND SUBSIDIARIESNOTES TO CONSOLIDATED FINANCIAL STATEMENTS (unaudited)(thousands, except share and per share amounts and where noted in millions)
Pinnacle Foods Inc.Condensed Consolidating Statement of Cash Flows
For the nine months ended September 27, 2015
PinnacleFoodsInc.
PinnacleFoods
Finance LLC Guarantor
Subsidiaries NonguarantorSubsidiaries
Eliminationsand
Reclassifications Consolidated
TotalCash flows from operating activities
Net cash provided by (used in) operatingactivities $ — $ (5,277) $ 225,386 $ (9,289) $ — $ 210,820
Cash flows from investing activities Payments for business acquisitions — — 1,102 — — 1,102Intercompany accounts receivable/payable — — (24,754) — 24,754 —Intercompany loans — — (7,209) — 7,209 —Investment in subsidiaries 82,104 — — — (82,104) —Capital expenditures — — (81,954) (2,779) — (84,733)Sale of plant assets — — 730 — — 730
Net cash (used in) provided by investingactivities 82,104 — (112,085) (2,779) (50,141) (82,901)
Cash flows from financing activities Proceeds from the issuance of common stock 1,038 — — — — 1,038Excess tax benefits on stock-based compensation 1,345 — — — — 1,345Taxes paid related to net share settlement of equityawards (2,401) — — — — (2,401)Dividends paid (82,086) — — — — (82,086)Repayments of long-term obligations — (3,934) (2,708) — — (6,642)Proceeds from short-term borrowing — — 2,135 — — 2,135Repayments of short-term borrowing — — (3,386) — — (3,386)Intercompany accounts receivable/payable — 9,211 — 15,543 (24,754) —Proceeds from Intercompany loans — — — 7,209 (7,209) —Parent investment — — (82,104) — 82,104 —Repayment of capital lease obligations — — (2,645) — — (2,645)
Net cash (used in) provided by financingactivities (82,104) 5,277 (88,708) 22,752 50,141 (92,642)
Effect of exchange rate changes on cash — — — (732) — (732)Net change in cash and cash equivalents — — 24,593 9,952 — 34,545
Cash and cash equivalents - beginning of period — — 32,942 5,535 — 38,477Cash and cash equivalents - end of period $ — $ — $ 57,535 $ 15,487 $ — $ 73,022
39

Table of Contents
SPECIAL NOTE REGARDING FORWARD-LOOKING STATEMENTS
This report contains “forward-looking statements.” These statements are made pursuant to the safe harbor provisions of the Private Securities LitigationReform Act of 1995. All statements, other than our financial statements, including the Notes thereto, and statements of historical facts included elsewhere in thisReport on Form 10-Q, including statements concerning our plans, objectives, goals, strategies, future events, future revenues or performance, financing needs,plans or intentions relating to acquisitions, business trends and other information referred to under “Management's Discussion and Analysis of Financial Conditionand Results of Operations” are forward-looking statements. When used in this report, the words “estimates,” “expects,” “contemplates”, “anticipates,” “projects,”“plans,” “intends,” “believes,” “forecasts,” “may,” “should” and variations of such words or similar expressions are intended to identify forward-lookingstatements. The forward-looking statements are not historical facts, and are based upon our current expectations, beliefs and projections, and various assumptions,many of which, by their nature, are inherently uncertain and beyond our control. Our expectations, beliefs and projections are expressed in good faith and webelieve there is a reasonable basis for them. However, there can be no assurance that management's expectations, beliefs and projections will result or be achievedand actual results may vary materially from what is expressed in or indicated by the forward-looking statements.
There are a number of risks, uncertainties and other important factors that could cause our actual results to differ materially from the forward-lookingstatements contained in this report. Such risks, uncertainties and other important factors include, among others, the risks, uncertainties and factors set forth in ourForm 10-K filed with the SEC on February 25, 2016 under the section entitled “Risk Factors,” the section entitled “Management's Discussion and Analysis ofFinancial Condition and Results of Operations” in this report and the following risks, uncertainties and factors:
• competition;• our ability to predict, identify, interpret and respond to changes in consumer preferences;• the loss of any of our major customers;• our reliance on a single source provider for the manufacturing, co-packing and distribution of many of our products;• fluctuations in the price and supply of food ingredients, packaging materials and freight;• volatility in commodity prices and our failure to mitigate the risks related to commodity price fluctuation and foreign exchange risk through the use of
derivative instruments;• costs and timeliness of integrating future acquisitions or our failure to realize anticipated cost savings, revenue enhancements or other synergies
therefrom;• litigation or claims regarding our intellectual property rights or termination of our material licenses;• our ability to drive revenue growth in our key product categories or to add products that are in faster growing and more profitable categories;• potential product liability claims;• seasonality;• the funding of our defined benefit pension plan;• changes in our collective bargaining agreements or shifts in union policy;• changes in the cost of compliance with laws and regulations, including environmental, worker health and workplace safety laws and regulations;• our failure to comply with U.S Food & Drug Administration, U.S. Department of Agriculture or Federal Trade Commission regulations and the impact of
governmental budget cuts;• disruptions in our information technology systems;• future impairments of our goodwill and intangible assets;• difficulty in the hiring or the retention of key management personnel; and• changes in tax statutes, tax rates, or case laws which impact tax positions we have taken.
You should evaluate all forward-looking statements made in this report in the context of these risks and uncertainties.
We caution you that the risks, uncertainties and other factors referenced above may not contain all of the risks, uncertainties and other factors that areimportant to you. In addition, we cannot assure you that we will realize the results, benefits or developments that we expect or anticipate or, even if substantiallyrealized, that they will result in the consequences or affect us or our business in the way expected. All forward-looking statements in this report apply only as of thedate made and are expressly qualified in their entirety by the cautionary statements included in this report. We undertake no obligation to publicly update or reviseany forward-looking statements to reflect subsequent events or circumstances.
40

Table of Contents
ITEM 2: MANAGEMENT’S DISCUSSION AND ANALYSIS OF FINANCIAL CONDITION AND RESULTS OF OPERATIONS
(dollars in millions, except where noted)
Youshouldreadthefollowingdiscussionofourresultsofoperationsandfinancialconditiontogetherwiththeauditedconsolidatedfinancialstatementsappearingin our annual report on Form 10-K filed with the Securities and Exchange Commission (the "SEC") on February 25, 2016 and the unaudited ConsolidatedFinancialStatementsandthenotestheretoincludedinthisquarterlyreport.Thisdiscussioncontainsforward-lookingstatementsandinvolvesnumerousrisksanduncertainties, including, but not limitedto, thosedescribedin the“Risk Factors”sectionof ourForm10-K, andthe sectionentitled “Special Note RegardingForward-LookingStatements”inthisreport.Actualresultsmaydiffermateriallyfromthosecontainedinanyforward-lookingstatements.
Overview
We are a leading manufacturer, marketer and distributor of high quality, branded food products in North America. The business is comprised of four segments:Birds Eye Frozen, Duncan Hines Grocery, Boulder Brands and Specialty Foods. The Company’s United States retail frozen vegetables ( Birds Eye ), frozencomplete bagged meals ( BirdsEyeVoila!), frozen seafood ( VandeKamp’sand Mrs.Paul’s), plant-based protein frozen products ( gardein), full-calorie single-serve frozen dinners and entrées ( Hungry-Man), frozen breakfast ( AuntJemima), frozen and refrigerated bagels ( Lender’s), and frozen pizza for one ( Celeste)are reported in the Birds Eye Frozen segment. The Company’s baking mixes and frostings ( DuncanHines), shelf-stable pickles ( Vlasic), liquid and dry-mixsalad dressings ( Wish-Boneand Western), table syrups ( Mrs.Butterworth’sand LogCabin), canned meat ( Armour, Nalleyand Brooks), pie and pastry fillings( DuncanHinesComstockand Wilderness), barbecue sauces ( OpenPit) and Canadian operations other than gardeinare reported in the Duncan Hines Grocerysegment. The Boulder Brands segment is comprised of health and wellness brands including gluten-free products ( Udi's and Glutino) , natural frozen mealofferings ( EVOL), refrigerated and shelf-stable spreads ( SmartBalance),and plant-based refrigerated and shelf-stable spreads ( EarthBalance). The SpecialtyFoods segment consists of snack products ( Tim’sCascadeand SnyderofBerlin) and the Company’s food service and private label businesses, other than BoulderBrands and gardein.
Segment performance is evaluated by the Company’s Chief Operating Decision Maker and is based on earnings before interest and taxes. Transfers betweensegments and geographic areas are recorded at cost plus markup or at market. Identifiable assets are those assets, including goodwill, which are identified with theoperations in each segment or geographic region. Corporate assets consist of prepaid and deferred tax assets. Unallocated corporate expenses consist of corporateoverhead such as executive management and finance and legal functions.
Business Drivers and Measures
In operating our business and monitoring its performance, we pay attention to trends in the food manufacturing industry and a number of performance measuresand operational factors. The industry experiences volatility in overall commodity prices from time to time, which has historically been managed by increasingretail prices. However, over the past several years, significant macroeconomic weakness and ongoing pressures on the consumer have resulted in shiftingconsumer buying patterns for grocery products. As a result, industry volumes have come under pressure, hampering the ability of the industry to pass along higherinput costs.
Industry Trends
Growth in our industry is driven primarily by population growth, changes in product selling prices and changes in consumption between out-of-home and in-homeeating. In the current economic environment, consumers are looking for value alternatives, which have caused an increase in the percentage of products sold onpromotion and a shift from traditional retail grocery to mass merchandisers, club stores and dollar store channels. We believe we are well positioned in grocery andnon-traditional channels, maintaining strong customer relationships across key retailers in each segment.
41
Table of Contents
In order to maintain and grow our business, we must successfully react to, and offer products that respond to, evolving consumer needs, such as changing healthtrends, the focus on convenience and the growth of smaller households. Incremental growth in the industry is principally driven by product and packaginginnovation.
Revenue Factors
Our net sales are driven principally by the following factors:• Grosssales, which change as a function of changes in volume and list price; and• the costs that we deduct from gross sales to arrive at net sales, which consist of:
◦ Cashdiscounts,returnsandotherallowances.◦ Trademarketingexpenses , which include the cost of temporary price reductions (“on sale” prices), promotional displays and advertising
space in store circulars.◦ New product introductory (slotting) expenses , which are the costs of having certain retailers stock a new product, including amounts
retailers charge for updating their warehousing systems, allocating shelf space and in-store systems set-up, among other things.◦ Consumercouponredemptionexpenses, which are costs from the redemption of coupons we circulate as part of our marketing efforts.
Cost Factors
• Costs recorded in Cost of products sold in the consolidated statement of operations include:• Rawmaterials,such as vegetables and fruits, proteins, grains and oils, sugars, seafood and other agricultural products, among others, are available
from numerous independent suppliers but are subject to price fluctuations due to a number of factors, including changes in crop size, federal and stateagricultural programs, export demand, weather conditions and insects, among others.
• Packagingcosts.Our broad array of products entails significant costs for packaging and is subject to fluctuations in the price of steel, aluminum, glassjars, plastic bottles, corrugated fiberboard, and various poly-films.
• Conversioncosts,which include all costs necessary to convert raw materials into finished product. Key components of this cost include direct labor,and plant overhead such as salaries, benefits, utilities and depreciation.
• Freightanddistribution.We use a combination of common carriers and inter-modal rail to transport our products from our manufacturing facilities todistribution centers and to deliver products to our customers from both those centers and directly from our manufacturing plants. Our freight anddistribution costs are influenced by fuel costs as well as capacity within the industry.
• Costs recorded in marketing and selling expenses in the consolidated statement of operations include:• Advertisingandothermarketingexpenses.These expenses represent advertising and other consumer and trade-oriented marketing programs.• Brokeragecommissionsandotheroverheadexpenses.
• Costs recorded in administrative and research and development expenses in the consolidated statement of operations include:• Administrativeexpenses.These expenses consist of personnel and facility charges and also include third party professional and other services. Our
lean, nimble structure and efficient internal processes have enabled us to consistently hold our overhead costs (i.e., selling, general and administrativeexpenses, excluding one-time items affecting comparability) to approximately 9% of net sales on an annual basis.
• ResearchandDevelopment.These expenses consist of personnel and facility charges and include expenditures on new products and the improvementand maintenance of existing products and processes.
Working Capital
Our working capital is primarily driven by accounts receivable and inventories, which fluctuate throughout the year due to seasonality in both sales and production.See “Seasonality” below. We will continue to focus on reducing our working capital requirements while simultaneously maintaining our customer service levelsand fulfilling our production requirements. We have historically relied on internally generated cash flows and temporary borrowings under our revolving creditfacility to satisfy our working capital requirements.
42

Table of Contents
Other Factors
Other factors that have influenced our results of operations and may do so in the future include:
• Interest Expense . Our IPO and debt refinancings have improved our debt profile and significantly reduced our leverage. However, as a result of ourprevious acquisitions and the recent Boulder transaction, we still have significant indebtedness. Although we expect to continue to reduce our leverage overtime, we expect interest expense to continue to be a significant component of our expenses.
• CashTaxes. We had significant tax-deductible intangible asset amortization and federal and state NOLs, which resulted in minimal federal and state cashtaxes through 2015. Continued amortization and utilization of our remaining NOLs will generate modest annual cash savings for 2016 and thereafter.
• AcquisitionsandConsolidations . We believe we have the expertise to identify and integrate value-enhancing acquisitions to grow our business and wehave done so successfully in the past. On November 14, 2014, we acquired Garden Protein for $156.5 million, the rapidly growing manufacturer of theplant-based protein brand gardein . On August 20, 2015 we acquired a manufacturing facility in Hagerstown, Maryland for approximately $8.0 million.The site will be used to expand production capabilities for the gardeinbrand and provide an East coast footprint to supplement the existing Richmond,British Columbia manufacturing location. We expect to invest approximately $31.0 million for the gardeincapacity expansion in 2016. We also expect toincur approximately $6.0 million of additional charges to integrate the location in 2016, of which $2.5 million was incurred through the first nine months of2016. As previously mentioned, on January 15, 2016, the Company acquired Boulder Brands for a cost of $1,001.4 million (which included $16.1 millionof cash acquired), which included the repayment of debt. Total acquisition and financing costs of $32.9 million have been incurred, of which $2.1 millionwas incurred in the fourth quarter of 2015, with the remainder in the first quarter of 2016. Included in this total is $24.4 million of debt acquisition costs,including original issue discount. During 2016, we expect one-time costs associated with the integration of Boulder to approximate $30.0 million, of which$27.9 million was incurred in the first nine months of 2016.
• In October 2016, we voluntarily ceased production at our private label gluten free bakery operation, which is based in the United Kingdom. For the ninemonths ended September 25, 2016 , net sales were $8.4 million and the business incurred a loss before interest, taxes, depreciation and amortization of $3.6million. As part of the transaction, we may incur certain restructuring charges, to be determined in the fourth quarter of 2016. We do not expect thesecharges to be significant.
• ImpairmentofGoodwill, TradenamesandLong-LivedAssets . We test our goodwill and intangible assets annually or more frequently (if necessary) forimpairment and have recorded impairment charges in the current year. Upon completion of the annual testing in the third quarter of 2016, the Companyrecorded tradename impairments of $7.3 million on Celeste, $3.0 million on AuntJemimaand $0.9 million on SnyderofBerlin. Celesteand AuntJemimaare reported in our Birds Eye Frozen segment and Snyder of Berlin is reported in the Specialty Foods segment. These charges were the result of theCompany's reassessment of the long-term sales projections for the brands during our annual planning cycle which occurs during the third quarter each year.
SeasonalityOur sales and cash flows are affected by seasonal cyclicality. Sales of frozen foods, including frozen vegetables and frozen complete bagged meals, tend to bemarginally higher during the winter months. Seafood sales peak during Lent, in advance of the Easter holiday. Sales of pickles, relishes, barbecue sauces, potatochips and salad dressings tend to be higher in the spring and summer months, and demand for DuncanHinesproducts, BirdsEyevegetables and our pie and pastryfruit fillings tend to be higher around the Easter, Thanksgiving, and Christmas holidays. Since many of the raw materials we process under the BirdsEye, Vlasic,DuncanHinesComstockandWildernessbrands are agricultural crops, production of these products is predominantly seasonal, occurring during and immediatelyfollowing the purchase of such crops. We also increase our DuncanHinesinventories in advance of the peak fall selling season. As a result, our inventory levelstend to be higher during August, September, and October, and thus we require more working capital during these months.
Inflation
To the extent possible, we strive to offset the effects of inflation with cost reduction and productivity programs.We expect to spend approximately $2.3 billionannually on Cost of products sold, therefore each 1% change in our weighted average cost of inputs would increase our Cost of products sold by approximately $23million. If we experience significant inflation, price increases may be necessary in order to preserve our margins and returns. However, over the past several years,significant macroeconomic weakness and ongoing pressures on the consumer have resulted in shifting consumer buying patterns for grocery products. As a result,industry volumes have come under pressure, hampering our ability to pass along higher input costs. Severe increases in inflation could have an adverse impact onour business, financial condition and results of operations.
43

Table of Contents
Results of Operations:
Consolidated Statements of OperationsThe following tables set forth our statement of operations data expressed in dollars and as a percentage of net sales.
Three months ended Nine months ended
September 25,
2016 September 27,
2015 September 25,
2016 September 27,
2015Net sales $ 758.8 100.0% $ 636.3 100.0% $ 2,269.5 100.0% $ 1,933.3 100.0%Cost of products sold 530.1 69.9% 459.4 72.2% 1,621.0 71.4% 1,415.6 73.2%
Gross profit 228.7 30.1% 176.9 27.8% 648.5 28.6% 517.7 26.8%
Marketing and sellingexpenses $ 53.9 7.1% $ 44.2 6.9% $ 173.8 7.7% $ 136.9 7.1%Administrative expenses 36.4 4.8% 26.5 4.2% 126.0 5.6% 81.9 4.2%Research and developmentexpenses 4.6 0.6% 3.2 0.5% 13.8 0.6% 9.9 0.5%Tradename impairmentcharges 11.2 1.5% — —% 11.2 0.5% — —%Other expense (income),net 4.4 0.6% 5.2 0.8% 17.2 0.8% 12.9 0.7%
$ 110.4 14.5% $ 79.1 12.4% $ 342.1 15.1% $ 241.6 12.5%Earnings before interest andtaxes $ 118.3 15.6% $ 97.8 15.4% $ 306.3 13.5% $ 276.1 14.3%
Three months ended Nine months ended
September 25,
2016 September 27,
2015 September 25,
2016 September 27,
2015Net sales
Birds Eye Frozen $ 308.9 $ 296.7 $ 924.1 $ 883.5Duncan Hines Grocery 249.5 257.4 763.2 796.6 North America Retail 558.5 554.1 1,687.3 1,680.0
Boulder Brands 120.9 — 344.4 —Specialty Foods 79.4 82.2 237.8 253.3
Total $ 758.8 $ 636.3 $ 2,269.5 $ 1,933.3
Earnings (loss) before interest and taxes Birds Eye Frozen $ 54.2 $ 52.0 $ 156.2 $ 133.2Duncan Hines Grocery 48.1 44.2 143.0 138.5Boulder Brands 16.1 — 11.9 —Specialty Foods 6.3 7.8 19.6 23.1Unallocated corporate expense (6.5) (6.2) (24.3) (18.7)
Total $ 118.3 $ 97.8 $ 306.3 $ 276.1
Depreciation and amortization Birds Eye Frozen $ 11.0 $ 12.0 $ 33.1 $ 33.4Duncan Hines Grocery 7.1 7.8 22.3 22.9Boulder Brands 4.7 — 12.4 —Specialty Foods 4.2 4.5 11.0 11.2
Total $ 27.1 $ 24.3 $ 78.7 $ 67.4
44
Table of Contents
Three months ended September 25, 2016 compared to the three months ended September 27, 2015NetsalesNet sales for the three months ended September 25, 2016 increased $122.5 million , or 19.3% , versus year-ago to $758.8 million , reflecting a 19.0% increase fromthe benefit of the Boulder acquisition, higher net price realization of 0.2%, and an increase of 0.1% from volume/mix.Net sales in our North America Retail business for the three months ended September 25, 2016 increased $4.4 million , or 0.8% , versus year-ago to $558.5 million, reflecting a 0.5% increase from volume/mix and higher net price realization of 0.3%. Our North American Retail business continued to outpace the performanceof our composite categories, with market share growth of 0.6 percentage points in the quarter.
Birds Eye Frozen Segment:Net sales in the three months ended September 25, 2016 increased $12.2 million , or 4.1% , versus year-ago to $308.9 million , reflecting a 3.8% increasefrom volume/mix and higher net price realization of 0.3%. The increase is primarily attributable to continued growth in the Birds Eye franchise, ourgardeinplant-based protein products and higher sales of Hungry-Manproducts. Recently-introduced innovation behind the BirdsEyeFlavorFull, BirdsEye Protein Blends and Birds EyeDisney-themed platforms, along with the new Birds Eye Veggie Made Rice side dishes, just-launched Birds EyeSignatureSkilletspremium meals and the continued retail expansion of BirdsEyeVoila!fueled the performance of the franchise. These increases werepartially offset by lower sales of our AuntJemimabreakfast products, Celestepizza and Lendersfrozen bagels.
Duncan Hines Grocery Segment:Net sales in the three months ended September 25, 2016 were $249.5 million , a decline of $7.8 million , or 3.0% versus year-ago, reflecting a 3.3%decrease from volume/mix, partially offset by higher net price realization of 0.3%. The period benefited from higher sales of Wish-Boneproducts, drivenby our new Wish-BoneEVOOand Wish-BoneRistoranteItalianoproduct lines and increased sales of our Armourcanned meats. More than offsetting thisincrease were lower net sales of our Vlasicpickles, Duncan Hinesbaking products and lower sales from our syrup business all driven by a highlycompetitive environment and category weakness.
Boulder Brands Segment:Net sales in the three months ended September 25, 2016 were $120.9 million . Retail consumption has advanced versus year ago for the Glutino, Udi's,EarthBalanceand EVOLbrands, offset by a decline for SmartBalance.
Specialty Foods Segment:Net sales in the three months ended September 25, 2016 were $79.4 million , a decline of $2.8 million , or 3.4% versus year-ago, reflecting a 2.4%decrease from volume/mix and lower net price realization of 1.0%. This decrease was primarily driven by lower sales of private label canned meat.
GrossprofitGross profit for the three months ended September 25, 2016 was $228.7 million , or 30.1% of net sales, compared to $176.9 million , or 27.8% of net sales, in thecomparable prior year period reflecting strong productivity, favorable product mix, including the benefit of Boulder and the impact of items affectingcomparability, primarily higher mark to market gains on financial instruments. Partially offsetting these positive drivers were inflation and other items. Excludingitems affecting comparability, Adjusted gross profit advanced 24.2% to $229.1 million and Adjusted gross profit percentage increased approximately 120 basispoints to 30.2% .The following table outlines the factors resulting in the year on year change in gross profit and gross margin percentage in the three months ended September 25,2016 .
45

Table of Contents
$ (in millions) Gross margin %Productivity $ 19.0 2.5 %Favorable product mix (including Boulder) 12.7 1.2Higher mark to market gains on financial instruments 6.1 0.8Higher net price realization, including slotting 0.8 0.1Inflation (11.0) (1.4)Higher depreciation expense (0.3) —Other (a) (5.7) (0.9)
Subtotal $ 21.6 2.3 %
Higher sales volume (including Boulder Brands) 30.2
Total $ 51.8
(a) Consists primarily of investment in new Birds-Eyestand-up packaging and higher product obsolescence.
MarketingandsellingexpensesMarketing and selling expenses increased 22.0% to $53.9 million , or 7.1% of net sales, for the three months ended September 25, 2016 , compared to $44.2million , or 6.9% of net sales for the prior year period. The increase was primarily driven by the addition of Boulder.
AdministrativeexpensesAdministrative expenses were $36.4 million , or 4.8% of net sales, for the three months ended September 25, 2016 , compared to $26.5 million , or 4.2% of netsales, for the comparable prior year period. The increase was primarily driven by the addition of Boulder.
ResearchanddevelopmentexpensesResearch and development expenses were $4.6 million , or 0.6% of net sales, for the three months ended September 25, 2016 compared to $3.2 million , or 0.5% ofnet sales, for the prior year period primarily reflecting higher expenses as a result of the Boulder acquisition.
Otherincomeandexpense
Three months ended
September 25,
2016 September 27,
2015Other expense (income), net consists of:
Amortization of intangibles/other assets $ 4.3 $ 3.4Foreign exchange gains 0.3 2.1Royalty income and other (0.2) (0.3)
Total other expense (income), net $ 4.4 $ 5.2
Foreignexchangegains.Represents foreign exchange gains from intra-entity loans resulting from the November 2014 Garden Protein acquisition that areanticipated to be settled in the foreseeable future.
Tradenameimpairmentcharges
In the third quarter of 2016, the Company recorded tradename impairments of $7.3 million on Celeste, $3.0 million on AuntJemimaand $0.9 million on SnyderofBerlin. See Note 9 for further details.
46
Table of Contents
Earningsbeforeinterestandtaxes
Earnings before interest and taxes increased $20.5 million , or 20.9% , to $118.3 million , reflecting the growth in gross profit, partially offset by higher marketingand selling, and administrative expenses primarily due to the inclusion of Boulder Brands. Also impacting the comparison was items affecting comparability,which were charges of $16.3 million and $10.2 million in the three months ended September 25, 2016 and September 27, 2015 , respectively. The variance in theseitems primarily resulted from tradename impairment charges, higher restructuring and integration costs resulting from the Boulder acquisition partially offset byhigher unrealized mark to market gains on financial instruments. Excluding items affecting comparability, Adjusted earnings before interest and taxes increased$26.6 million to $134.6 million , or 24.6% .
Birds Eye Frozen Segment:Earnings before interest and taxes for the three months ended September 25, 2016 increased 4.3% , or $2.2 million , versus year-ago to $54.2 million forthe three months ended September 25, 2016 , reflecting the benefits of net sales growth, productivity savings and favorable mix, partially offset by inputcost inflation, investment in new Birds-Eye stand-up packaging and higher items affecting comparability, most notably $10.3 million of Tradenameimpairment charges. Excluding items affecting comparability, Adjusted earnings before interest and taxes advanced 13.5% to $65.0 million .
Duncan Hines Grocery Segment:Earnings before interest and taxes for the three months ended September 25, 2016 were $48.1 million , an increase of 8.8% , or $3.9 million , as comparedto the year-ago period reflecting productivity savings and items affecting comparability more than offset by lower volumes, unfavorable product mix andinput cost inflation. Excluding items affecting comparability, Adjusted earnings before interest and taxes decreased 2.5% to $47.5 million .
Boulder Brands Segment:
Earnings before interest and taxes for the three months ended September 25, 2016 were $16.1 million , reflecting significant restructuring expenses.Excluding items affecting comparability, Adjusted earnings before interest and taxes for the Boulder Brands segment totaled $21.3 million .
Specialty Foods Segment:Earnings before interest and taxes for the three months ended September 25, 2016 were $6.3 million , a decline of 18.8% , or $1.5 million , as comparedto the year-ago period, largely reflecting the decline in net sales and a $0.9 million Tradename impairment charge. Excluding items affectingcomparability, Adjusted earnings before interest and taxes decreased 12.1% , to $7.1 million .
Unallocated corporate expense:Unallocated corporate expense for the three months ended September 25, 2016 was $6.5 million , an increase of $0.3 million , as compared to the year-ago period.
Interestexpense,net
Net interest expense increased 63.4% , or $14.1 million , to $36.4 million in the three months ended September 25, 2016 , compared to $22.3 million in the threemonths ended September 27, 2015 . The increase was largely driven by additional debt issued to finance the Boulder acquisition and, to a lesser extent, the impactof higher interest expense for floating rate debt. Also impacting the comparison were $0.6 million of charges associated with the re-pricing of Term Loan I duringthe quarter and higher interest rate swap losses described below.
We utilize interest rate swap agreements to reduce the potential exposure to interest rate movements and to achieve a desired proportion of variable versus fixedrate debt. Any gains or losses realized on the interest rate swap agreements, excluding the AOCL portion, are recorded as an adjustment to interest expense.Included in net interest expense was $2.6 million and $1.1 million for the third quarters of 2016 and 2015, respectively, recorded from losses on interest rate swapagreements.
47

Table of Contents
Provisionforincometaxes
The effective tax rate was 36.0% for the three months ended September 25, 2016 compared to 36.3% for the three months ended September 27, 2015.
For the three months ended September 25, 2016 and the three months ended September 27, 2015 our rate reflects the benefit of the domestic production activitiesdeduction and tax credits and the effect of enacted state tax legislation. For the three months ended September 25, 2016 our effective tax rate benefits from adecrease in our liability for uncertain tax positions.
The Company is a loss corporation as defined by Section 382 of the Code. Section 382 places an annual limitation on our ability to use our NOL carryovers andother attributes to reduce future taxable income. As of September 25, 2016, we have federal NOL carryovers of $439.4 million subject to an annual limitation of$17.1 million. As a result, $237.2 million of the carryovers exceed the estimated available Section 382 limitation. The Company has reduced its deferred tax assetsfor this limitation.
We have significant tax-deductible intangible asset amortization and federal and state NOLs, which resulted in minimal federal and state cash taxes through 2015.We expect continued amortization and utilization of our NOLs will generate modest annual cash tax savings in 2016 and thereafter.
Nine months ended September 25, 2016 compared to the nine months ended September 27, 2015NetsalesNet sales for the nine months ended September 25, 2016 increased $336.1 million , or 17.4% , versus year-ago to $2.27 billion , reflecting a 17.8% increase fromthe benefit of the Boulder acquisition and higher net price realization of 0.5% partially offset by a 0.8% decrease from volume/mix. Also impacting the comparisonwas unfavorable foreign currency translation of 0.1%.Net sales in our North American retail business for the nine months ended September 25, 2016 increased 0.4% versus year-ago to $1.69 billion , reflecting highernet price realization of 0.6%, offset by a 0.1% decrease from volume/mix. Also impacting the comparison was unfavorable foreign currency translation of 0.1%.We continued to outpace the performance of our composite categories, with market share growth in the nine months of 0.7 percentage points.
Birds Eye Frozen Segment:Net sales in the nine months ended September 25, 2016 increased 4.6% versus year-ago to $924.1 million , reflecting a 3.6% increase from volume/mixand higher net price realization of 1.0%. The increase is primarily attributable to continued strong sales from the BirdsEyefranchise, our gardeinplant-based protein products and our Hungry-Manfrozen entrées. Products launched in 2015 such as Birds Eye Steamfresh Flavor Full, Birds Eye ProteinBlendsand BirdsEyeDisney-themed side dishes for kids, continue to fuel the growth of BirdsEyevegetables, while distribution gains and the expansionof Family Size offerings and premium tier varieties drove the growth of BirdsEyeVoila!. Partially offsetting these positive drivers were lower sales ofour Seafood business, driven by category weakness, and lower sales of our Aunt-Jemima,Lender'sand Celesteproducts.
Duncan Hines Grocery Segment:Net sales in the nine months ended September 25, 2016 were $763.2 million , a decline of 4.2% , reflecting higher net price realization of 0.3% more thanoffset by a 4.2% decrease from volume/mix and unfavorable foreign currency translation of 0.3%. The period benefited from higher sales of our Armourcanned meats. This increase was more than offset by lower sales of our Duncan Hines baking products due to category weakness and lower sales of Wish-Boneproducts, reflecting a highly competitive category environment and new product introductory expenses from the launch of our two new productlines, Wish-BoneEVOOand Wish-BoneRistoranteItalianodressing. Also impacting the period was lower sales of our syrup business driven by a highlycompetitive environment and lower net sales from our Canadian operations, including the unfavorable impact from foreign exchange.
Boulder Brands Segment:Net sales in the nine months ended September 25, 2016 were $344.4 million , representing the January 15, 2016 to September 25, 2016 time period inwhich Boulder Brands was consolidated.
48

Table of Contents
Specialty Foods Segment:Net sales in the nine months ended September 25, 2016 decreased 6.1% versus year-ago to $237.8 million , reflecting a 5.7% decline from volume/mixand lower net pricing of 0.4%. This decline was primarily driven by decreased sales of private label canned meat.
GrossprofitGross profit for the nine months ended September 25, 2016 was $648.5 million , or 28.6% of net sales, compared to $517.7 million , or 26.8% of net sales, in thecomparable prior year period reflecting strong productivity, favorable product mix, the benefits of higher net price realization and the impact of items affectingcomparability, partially offset by the impacts of input cost inflation, higher depreciation and other items. Excluding these and other items affecting comparability,Adjusted gross profit advanced 24.2% to $653.3 million and Adjusted gross profit percentage increased 160 basis points to 28.8% .The following table outlines the factors resulting in the year on year change in gross profit and gross margin percentage in the nine months ended September 25,2016 .
$ (in millions) Gross margin %Productivity $ 50.0 2.1 %Favorable product mix (Including Boulder) 26.4 0.9Higher net price realization, net of slotting 9.0 0.3Higher mark-to-market gains on financial instruments 9.0 0.3Inflation (25.0) (1.1)Effects of adjustments related to the application ofpurchase accounting (a)
(10.4) (0.4)Higher depreciation expense (b) (2.5) (0.1)Other (c) (8.7) (0.2)
Subtotal $ 47.8 1.8 %
Higher sales volume 83.0
Total $ 130.8
(a) Represents expense related to the write-up to fair market value of inventories acquired as a result of the Boulder acquisition.(b) The increase primarily relates to the insourcing of the manufacturing of Wish-Boneinto our St. Elmo, Illinois location.(c) Consists primarily of investment in new Birds-Eyestand-up packaging, higher product obsolescence, and the unfavorable impact of currency.
MarketingandsellingexpensesMarketing and selling expenses were $173.8 million , or 7.7% of net sales, for the nine months ended September 25, 2016 , compared to $136.9 million , or 7.1%of net sales, for the comparable prior year period. The increase primarily reflected the impact of the Boulder acquisition and an increase in marketing investment,including new product introductions.
AdministrativeexpensesAdministrative expenses were $126.0 million , or 5.6% of net sales, for the nine months ended September 25, 2016 , compared to $81.9 million , or 4.2% of netsales, for the comparable prior year period. The increase was primarily driven by the addition of Boulder, which included $17.3 million of restructuring costs in thecurrent period.
Researchanddevelopmentexpenses:Research and development expenses were $13.8 million , or 0.6% of net sales, for the nine months ended September 25, 2016 compared to $9.9 million , or 0.5%of net sales, for the comparable prior year period. The increase primarily reflected higher expenses as a result of the Boulder acquisition and innovation relatedexpenses.
49

Table of Contents
Otherincomeandexpense
Nine months ended
September 25,
2016 September 27,
2015Other expense (income), net consists of:
Amortization of intangibles/other assets $ 12.7 $ 10.2Foreign exchange losses (1.0) 3.7Boulder acquisition costs 6.8 —Royalty income and other (1.2) (0.9)
Total other expense (income), net $ 17.2 $ 12.9
Foreignexchangelosses. Represents foreign exchange losses from intra-entity loans resulting from the Garden Protein acquisition that are anticipated to be settledin the foreseeable future.
Tradenameimpairmentcharges
In the third quarter of 2016, the Company recorded tradename impairments of $7.3 million on Celeste, $3.0 million on AuntJemimaand $0.9 million on SnyderofBerlin. See Note 9 for further details.
Earningsbeforeinterestandtaxes
Earnings before interest and taxes for the nine months ended September 25, 2016 increased $30.3 million , or 11.0% , versus year-ago to $306.3 million , primarilyresulting from increased gross profit, partially offset by the impact of items affecting comparability, most notably acquisition related expenses and tradenameimpairment charges, and higher marketing and selling and administrative expenses due to the consolidation of the Boulder acquisition. Excluding items affectingcomparability, Adjusted earnings before interest and taxes increased $65.7 million to $356.1 million , or 22.6% .
Birds Eye Frozen Segment:Earnings before interest and taxes for the nine months ended September 25, 2016 were $156.2 million , an increase of $23.0 million , or 17.3% , ascompared to the year-ago period largely reflecting increased gross profit driven by the benefit of net sales growth and productivity savings, partially offsetby input cost inflation. Excluding items affecting comparability, Adjusted earnings before interest and taxes increased $23.2 million to $163.8 million , or16.5% .
Duncan Hines Grocery Segment:Earnings before interest and taxes for the nine months ended September 25, 2016 were $143.0 million , an increase of $4.5 million , or 3.3% , ascompared to the year-ago period, largely reflecting lower volume, higher new product introductory expenses, higher depreciation expenses and input costinflation, partially offset by productivity savings and the impact of items affecting comparability. Excluding items affecting comparability, Adjustedearnings before interest and taxes declined $6.2 million to $139.2 million , or 4.2% .
Boulder Brands Segment:
Earnings before interest and taxes was $11.9 million , reflecting significant acquisition related expenses. Excluding items affecting comparability,Adjusted earnings before interest and taxes for the Boulder Brands segment totaled $50.8 million .
Specialty Foods Segment:Earnings before interest and taxes for the nine months ended September 25, 2016 were $19.6 million , a decline of $3.5 million , or 15.2% , versus year-ago largely reflecting the decline in net sales and unfavorable product mix. Excluding items affecting comparability, Adjusted earnings before interest andtaxes decreased $3.3 million to $19.9 million or 14.3% .
50

Table of Contents
Unallocated corporate expense:Unallocated corporate expense for the nine months ended September 25, 2016 was $24.3 million , as compared to $18.7 million in the year ago period.The increase primarily reflected the impact of the Boulder acquisition costs partially offset by lower equity based compensation expense driven by thechange in CEO.
Interestexpense,netNet interest expense increased 56.9% , or $37.5 million , to $103.5 million in the nine months ended September 25, 2016 from $66.0 million in the nine monthsended September 27, 2015 . The increase was largely driven by additional debt issued to finance the Boulder acquisition and, to a lesser extent, the impact ofhigher interest expense for floating rate debt. Also impacting the comparison were $0.6 million of charges associated with the re-pricing of Term Loan I during theperiod and higher interest rate swap losses described below.
We utilize interest rate swap agreements to reduce the potential exposure to interest rate movements and to achieve a desired proportion of variable versus fixedrate debt. Any gains or losses realized on the interest rate swap agreements, excluding the AOCL portion, are recorded as an adjustment to interest expense.Included in net interest expense was $6.3 million and $2.5 million for the first nine months of 2016 and 2015, respectively, recorded from losses on interest rateswap agreements.
ProvisionforincometaxesThe effective tax rate was 39.4% for the nine months ended September 25, 2016 compared to 36.6% for the nine months ended September 27, 2015.In connection with our acquisition of Boulder, our effective income tax rate for the nine months ended September 25, 2016 increased by 3.7% due to the tax effectof certain non-deductible acquisition costs and compensation payments, a charge for an increase in our non-current state deferred income tax liability balance and acharge related to the tax effect of foreign operations, principally attributable to a valuation allowance on our foreign tax credit carryforward. Our income tax ratefor the nine months September 27, 2015 reflects a deferred tax benefit of 0.9% for changes related to our state tax profile.The Company is a loss corporation as defined by Section 382 of the Code. Section 382 places an annual limitation on our ability to use our NOL carryovers andother attributes to reduce future taxable income. As of September 26, 2016, we have NOL carryovers of $439.4 million subject to an annual limitation of $17.1million. As a result, $237.2 million of the carryovers exceed the estimated available Section 382 limitation. The Company has reduced its deferred tax assets forthis limitation.On January 15, 2016 we acquired Boulder which is a loss corporation. As of the acquisition date, Boulder had approximately $50.8 million of federal NOLcarryovers subject to the Section 382 provisions. The annual limitation is approximately $26.5 million subject to increase for recognized built in gains during therecognition period. Based on our analysis, we anticipate we will be able to utilize the acquired NOL balance in our 2016 tax year without limitation.We have significant tax-deductible intangible asset amortization and federal and state NOLs, which resulted in minimal federal and state cash taxes through 2015.We expect continued amortization and utilization of our NOLs will generate modest annual cash tax savings in 2016 and thereafter.
Liquidity and Capital Resources
HistoricalOur cash flows are seasonal. Typically we are a net user of cash in the third quarter of the calendar year (i.e., the quarter ending in September) and a net generatorof cash over the balance of the year.
Our principal liquidity requirements have been, and we expect will be, for working capital and general corporate purposes, including capital expenditures, debtservice and our quarterly dividend program. Currently, the quarterly payment is $0.285 per share, or approximately $34 million per quarter. Capital expendituresare expected to be approximately $110 to $120 million in 2016, including Boulder. We have historically satisfied our liquidity requirements with internallygenerated cash flows and availability under our revolving credit facility. We expect that our ability to generate cash from our operations and ability to borrow fromour credit facilities should be sufficient to support working capital needs, planned growth, capital expenditures, debt service and dividends for the next 12 monthsand for the foreseeable future. We have cash in foreign accounts, primarily related to the operations of our Canadian businesses. Tax liabilities related to bringingthese funds back into the United States would not be significant and have been accrued.
51

Table of Contents
Statements of cash flows for the nine months ended September 25, 2016 compared to the nine months ended September 27, 2015
For the nine months ended September 25, 2016 , net cash flow decreased $15.6 million compared to an increase in net cash flow of $34.5 million for the ninemonths ended September 27, 2015 .
Net cash provided by operating activities was $239.9 million for the nine months ended September 25, 2016 , and was the result of net earnings, excluding non-cash charges and credits, of $237.3 million and an increase in working capital of $2.6 million . The increase in working capital was primarily the result of a $40.7million increase in accounts receivable primarily due to an increase in days sales outstanding, a $31.9 million increase in inventories during the harvest season anda $1.7 million decrease in accrued trade marketing expense. These were partially offset by a $31.6 million increase in accounts payable resulting from seasonalityand timing of disbursements, a $29.8 million increase in accrued liabilities, primarily attributable to higher interest and restructuring accruals and a $15.6 milliondecrease in other current assets primarily from lower prepaid tax balances.
Net cash provided by operating activities was $210.8 million for the nine months ended September 27, 2015, and was the result of net earnings, excluding non-cashcharges and credits, of $270.4 million and an increase in working capital of $59.5 million. The increase in working capital was primarily the result of a $90.3million increase in inventories resulting from favorable agricultural crop yields and innovation related inventory build, and a $19.4 million increase in accountsreceivable driven by the timing of sales. The aging profile of accounts receivable has not changed significantly from December 2014. This was partially offset by a$32.7 million increase in accounts payable resulting from seasonal timing, a $14.2 million increase in accrued liabilities, primarily attributable to consumercoupons and higher interest accruals and a $2.3 million decrease in accrued trade marketing expense. All other working capital accounts generated a net $0.9million cash inflow.
Net cash used in investing activities was $1,062.0 million , for the nine months ended September 25, 2016 and included $985.4 million for the acquisition ofBoulder as well as $76.6 million for capital expenditures.
Net cash used in investing activities was $82.9 million, for the nine months ended September 27, 2015 and included $84.7 million for capital expenditures as wellas $1.1 million of cash inflows from a Garden Protein acquisition post closing working capital adjustment. Capital expenditures during the first nine months of2015 included approximately $21.8 million of costs related to our acquisition integration projects. Investing activities also included $0.7 million of proceeds fromthe sale of assets.
Net cash provided by financing activities for the nine months ended September 25, 2016 was $806.2 million and consisted of $547.3 million of net proceeds fromour new Tranche I Term Loans, $350.0 million from our notes offering and $34.6 million of net cash inflows related to our equity based compensation plans whichwere partially offset by $89.3 million of dividends paid, $22.6 million of debt acquisition costs, $10.1 million of debt repayments, $3.7 million of net cash outflowsfor capital leases and notes payable activity.
Net cash used by financing activities for the nine months ended September 27, 2015 was $92.6 million and consisted of $82.1 million of dividends paid, $6.6million of debt repayments and $3.9 million of net capital leases and notes payable activity.
Debt
For more information on our debt, see Note 10 of the Consolidated Financial Statements "Debt and Interest Expense".
Covenant Compliance
The following is a discussion of the financial covenants contained in our debt agreements. See section below for detailed calculation.
AmendedCreditAgreementOur Amended Credit Agreement contains a number of covenants that, among other things, restrict, subject to certain exceptions, our ability to:
• incur additional indebtedness and make guarantees;• create liens on assets;• engage in mergers or consolidations;
52
Table of Contents
• sell assets;• pay dividends and distributions or repurchase our capital stock;• make investments, loans and advances, including acquisitions; and• engage in certain transactions with affiliates.
The Amended Credit Agreement also contains certain customary affirmative covenants and events of default.
5.875%SeniorNotesand4.875%SeniorNotes
In April 2013, we issued the 4.875% Senior Notes. In January 2016, we issued the 5.875% Senior Notes. We refer to the 4.875% Notes and the 5.875% Notes asthe "Senior Notes". The Senior Notes are general senior unsecured obligations, effectively subordinated to all of our existing and future secured indebtedness to theextent of the value of the assets securing that indebtedness, and guaranteed on a full, unconditional, joint and several basis by the Company and Pinnacle FoodsFinance's wholly-owned domestic subsidiaries that guarantee our other indebtedness.
The indentures governing the Senior Notes limits our (and our restricted subsidiaries’) ability to, subject to certain exceptions:• incur additional debt or issue certain preferred shares;• pay dividends on or make other distributions in respect of our capital stock or make other restricted payments;• make certain investments;• sell certain assets;• create liens on certain assets to secure debt;• consolidate, merge, sell or otherwise dispose of all or substantially all of our assets;• enter into certain transactions with our affiliates; and• designate our subsidiaries as unrestricted subsidiaries.
Subject to certain exceptions, the indenture governing the Senior Notes permits us and our restricted subsidiaries to incur additional indebtedness, includingsecured indebtedness.
Non-GAAP Financial Measures
Pinnacle uses the following non-GAAP financial measures as defined by the Securities and Exchange Commission in its financial communications. These non-GAAP financial measures should be considered as supplements to the GAAP reported measures, should not be considered replacements for, or superior to, theGAAP measures and may not be comparable to similarly named measures used by other companies.
• Adjusted gross profit• Adjusted gross profit as a % of sales• Adjusted EBITDA• Adjusted Earnings before Interest and Taxes (Adjusted EBIT)• Covenant Compliance EBITDA
Adjusted gross profitPinnacle defines Adjusted gross profit as gross profit before accelerated depreciation related to restructuring activities, certain non-cash items, acquisition, mergerand other restructuring charges and other adjustments. The Company believes that the presentation of Adjusted gross profit is useful to investors in the evaluationof the operating performance of companies in similar industries. The Company believes this measure is useful to investors because it increases transparency andassists investors in understanding the underlying performance of the Company and in the analysis of ongoing operating trends. In addition, Adjusted gross profit isone of the components used to evaluate the performance of Company’s management. Such targets include, but are not limited to, measurement of sales efficiency,productivity measures and recognition of acquisition synergies.
Adjusted EBITDAPinnacle defines Adjusted EBITDA as earnings before interest expense, taxes, depreciation and amortization (“EBITDA”), further adjusted to exclude certain non-cash items, non-recurring items and certain other adjustment items permitted in calculating Covenant Compliance EBITDA under the Senior Secured CreditFacility and the indentures governing the Senior Notes. Adjusted EBITDA does not include adjustments for equity-based compensation and certain otheradjustments related to acquisitions, both of which are permitted in calculating Covenant Compliance EBITDA.
53

Table of Contents
Management uses Adjusted EBITDA as a key metric in the evaluation of underlying Company performance, in making financial, operating and planning decisionsand, in part, in the determination of cash bonuses for its executive officers and employees. The Company believes this measure is useful to investors because itincreases transparency and assists investors in understanding the underlying performance of the Company and in the analysis of ongoing operating trends.Additionally, Pinnacle believes the presentation of Adjusted EBITDA provides investors with useful information, as it is an important component in determiningour ability to service debt and meet any payment obligations. In addition, Pinnacle believes that Adjusted EBITDA is frequently used by analysts, investors andother interested parties in their evaluation of companies, many of which present an Adjusted EBITDA measure when reporting their results. The Company hashistorically reported Adjusted EBITDA to analysts and investors and believes that its continued inclusion provides consistency in financial reporting and enablesanalysts and investors to perform meaningful comparisons of past, present and future operating results.
Adjusted EBITDA should not be considered as an alternative to operating or net earnings (loss), determined in accordance with GAAP, as an indicator of theCompany’s operating performance, as an alternative to cash flows from operating activities, determined in accordance with GAAP, as an indicator of cash flows,or as a measure of liquidity.
Adjusted Earnings before Interest and Taxes (Adjusted EBIT)Adjusted earnings before interest and taxes is provided because Pinnacle believes it is useful information in understanding our EBIT results by improving thecomparability of year-to-year results. Additionally, Adjusted EBIT provides transparent and useful information to management, investors, analysts and otherparties in evaluating and assessing the Company and its segments, primary operating results from period to period after removing the impact of unusual, non-operational or restructuring-related activities that affect comparability. Adjusted EBIT is one of the measures management uses for planning and budgeting,monitoring and evaluating financial and operating results and in the analysis of ongoing operating trends.
Covenant Compliance EBITDACovenant Compliance EBITDA is defined as earnings before interest expense, taxes, depreciation and amortization, further adjusted to exclude non-cash items,extraordinary, unusual or non-recurring items and other adjustment items permitted in calculating Covenant Compliance EBITDA under the Amended CreditAgreement and the indenture governing the Senior Notes. We believe that the inclusion of supplementary adjustments to EBITDA applied in presenting CovenantCompliance EBITDA is appropriate to provide additional information to investors to demonstrate compliance with our financial covenants.
EBITDA, Adjusted EBITDA and Covenant Compliance EBITDA do not represent net earnings or (loss) or cash flow from operations as those terms are defined byGAAP and do not necessarily indicate whether cash flows will be sufficient to fund cash needs. In particular, the definitions of Covenant Compliance EBITDA inthe Senior Secured Credit Facility and the indentures allow Pinnacle to add back certain non-cash, extraordinary, unusual or non-recurring charges that arededucted in calculating net earnings or loss. However, these are expenses that may recur, vary greatly and are difficult to predict. While EBITDA, AdjustedEBITDA and Covenant Compliance EBITDA and similar measures are frequently used as measures of operations and the ability to meet debt servicerequirements, they are not necessarily comparable to other similarly titled captions of other companies due to the potential inconsistencies in the method ofcalculation.
Pursuant to the terms of the Amended Credit Agreement, Pinnacle Foods Finance is required to maintain a ratio of Net First Lien Secured Debt to CovenantCompliance EBITDA of no greater than 5.75 to 1.00. Net First Lien Secured Debt is defined as Pinnacle Foods Finance's aggregate consolidated securedindebtedness secured on a first lien basis, less the aggregate amount of all unrestricted cash and cash equivalents.
In addition, under the Amended Credit Agreement and the indenture governing the Senior Notes, our ability to engage in activities such as incurring additionalindebtedness, making investments and paying dividends is tied to the Senior Secured Leverage Ratio (which is currently the same as the ratio of Net First LienSecured Debt to Covenant Compliance EBITDA described above), in the case of the Amended Credit Agreement, or to the ratio of Covenant Compliance EBITDAto fixed charges for the most recently concluded four consecutive fiscal quarters, in the case of the Senior Notes. We believe that these covenants are materialterms of these agreements and that information about the covenants is material to an investor's understanding our financial performance. As of September 25, 2016, we were in compliance with all covenants and other obligations under the Amended Credit Agreement and the indentures governing the Senior Notes.
Our ability to meet the covenants specified above in future periods will depend on events beyond our control, and we cannot assure you that we will meet thoseratios. A breach of any of these covenants in the future could result in a default under, or an inability to undertake certain activities in compliance with, theAmended Credit Agreement and the indentures governing the Senior Notes, at which time the lenders could elect to declare all amounts outstanding under theAmended Credit Agreement to be immediately due and payable. Any such acceleration would also result in a default under the indentures governing the SeniorNotes.
54

Table of Contents
The following table provides a reconciliation from our net earnings to EBITDA, Adjusted EBITDA and Covenant Compliance EBITDA for the three and ninemonths ended September 25, 2016 and September 27, 2015 , and the fiscal year ended December 27, 2015 . The terms and related calculations are defined in theAmended Credit Agreement and the indentures governing the Senior Notes.
(thousands of dollars) Three months ended Nine months ended Fiscal Year Ended
September 25,
2016 September 27, 2015 September 25, 2016 September 27, 2015 December 27, 2015Net earnings $ 52,353 $ 48,098 $ 122,973 $ 133,313 $ 212,508Interest expense, net 36,446 22,308 103,470 65,958 88,315Income tax expense 29,469 27,387 79,892 76,806 123,879Depreciation and amortization expense 27,077 24,263 78,749 67,420 89,660EBITDA $ 145,345 $ 122,056 $ 385,084 $ 343,497 $ 514,362Non-cash items (a) 9,732 6,494 11,338 5,029 4,315Acquisition, merger and other restructuring charges (b) 6,568 2,578 38,455 8,235 12,926Adjusted EBITDA $ 161,645 $ 131,128 $ 434,877 $ 356,761 $ 531,603Wish-Bone, Garden Protein and Boulder acquisition adjustments(1) (3,929) 20,134 24,126 37,855 60,533Non-cash equity-based compensation charges (2) 4,252 3,427 9,383 9,922 13,555
Covenant Compliance EBITDA $ 161,968 $ 154,689 $ 468,386 $ 404,538 $ 605,691
Last twelve months Covenant Compliance EBITDA $ 669,539
(1) For the three and nine months ended September 25, 2016 and fiscal 2015, represents proforma additional EBITDA from Boulder for the period prior to theacquisition and net cost savings projected to be realized from acquisition synergies from the Boulder, Garden Protein and Wish-Bone acquisitions,calculated consistent with the definition of Covenant Compliance EBITDA. For the three and nine months ended September 27, 2015 , represents the netcost savings projected to be realized from acquisition synergies from both the Garden Protein and Wish-Bone acquisitions, calculated consistent with thedefinition of Covenant Compliance EBITDA.
(2) Represents non-cash compensation charges related to the granting of equity awards that occur in the normal course of business. Awards that were issued asa result of the termination of the Hillshire merger agreement are being treated as an adjustment in the determination of Adjusted EBITDA. See Non-cashitems below for details.
(a) Non-cash items are comprised of the following:
(thousands of dollars) Three months ended Nine months ended Fiscal Year Ended
September 25, 2016 September 27, 2015 September 25, 2016 September 27, 2015 December 27, 2015Unrealized (gains) losses resulting from hedging activities (1) $ (1,724) $ 4,392 $ (9,217) $ (218) $ (1,983)Effects of adjustments related to the application of purchaseaccounting (2) — — 10,382 — —Tradename impairment charges (3) 11,200 — 11,200 — —Non-cash compensation charges (4) — — — 1,567 1,567Foreign exchange (gains) losses (5) 256 2,102 (1,027) 3,680 4,731Total non-cash items $ 9,732 $ 6,494 $ 11,338 $ 5,029 $ 4,315
_________________(1) Represents non-cash gains resulting from mark-to-market adjustments of obligations under derivative contracts.(2) For the nine months ended September 25, 2016 , represents expense related to the write-up to fair market value of inventories acquired as a result of the
Boulder acquisition.
55

Table of Contents
(3) For the three and nine months ended September 25, 2016 , represents tradename impairment on Celeste($7.3 million), AuntJemima($3.0 million) andSnyderofBerlin($0.9 million).
(4) For the nine months ended September 27, 2015 and fiscal 2015, represents non-cash employee incentives and retention charges resulting from thetermination of the Hillshire merger agreement.
(5) Represents foreign exchange (gains) losses resulting from intra-entity loans that are anticipated to be settled in the foreseeable future.
(b) Acquisition, merger and other restructuring charges are comprised of the following:
(thousands of dollars) Three months ended Nine months ended Fiscal Year Ended
September 25, 2016 September 27,
2015 September 25,
2016 September 27, 2015 December 27, 2015Expenses in connection with an acquisition or other non-recurring merger costs (1) $ — $ — $ 6,781 $ 1,128 $ 2,735Restructuring charges, integration costs and other businessoptimization expenses (2) 6,568 2,353 31,674 6,882 9,504Employee severance (3) — 225 — 225 687Total acquisition, merger and other restructuring charges $ 6,568 $ 2,578 $ 38,455 $ 8,235 $ 12,926
_________________(1) For the nine months ended September 25, 2016 , represents Boulder acquisition costs. For the nine months ended September 27, 2015 , represents expenses
related to the secondary offerings of common stock. For fiscal 2015, represents Boulder acquisition costs and expenses related to the secondary offerings ofcommon stock.
(2) For the three and nine months ended September 25, 2016 , primarily represents restructuring charges and integration costs of the Boulder and GardenProtein acquisitions. For the three and nine months September 27, 2015 and fiscal 2015, primarily represents integration costs of the Garden Protein andWish-Bone acquisitions.
(3) Represents severance costs not related to business acquisitions paid, or to be paid, to terminated employees.
_________________
Our covenant requirements and actual ratios for the twelve months ended September 25, 2016 are as follows:
Covenant
Requirement Actual RatioAmended Credit Agreement
Net First Lien Leverage Ratio (1) 5.75 to 1.00 3.49Total Leverage Ratio (2) Not applicable 4.55
Senior Notes (3) Minimum Covenant Compliance EBITDA to fixed charges ratio required to incur additionaldebt pursuant to ratio provisions (4) 2.00 to 1.00 5.71
_________________(1) Pursuant to the terms of the Amended Credit Agreement, Pinnacle Foods Finance is required to maintain a ratio of Net First Lien Secured Debt to Covenant
Compliance EBITDA of no greater than 5.75 to 1.00. Net First Lien Secured Debt is defined as Pinnacle Foods Finance's aggregate consolidated securedindebtedness secured on a first lien priority basis, less the aggregate amount of all unrestricted cash and cash equivalents.
(2) The Total Leverage Ratio is not a financial covenant but is used to determine the applicable margin rate under the Amended Credit Agreement. As ofSeptember 25, 2016 , our total net leverage ratio was greater than 4.25:1.0, which results in an additional 25 basis point margin on existing Term Loans G andH under the Amended Credit Agreement. The Total Leverage Ratio is calculated by dividing consolidated total debt less the aggregate amount of allunrestricted cash and cash equivalents by Covenant Compliance EBITDA.
(3) Our ability to incur additional debt and make certain restricted payments under the indentures governing the Senior Notes, subject to specified exceptions, istied to a Covenant Compliance EBITDA to fixed charges ratio of at least 2.00 to 1.00.
(4) Fixed charges is defined in the indenture governing the Senior Notes as (i) consolidated interest expense (excluding specified items) plus consolidatedcapitalized interest lessconsolidated interest income, plus(ii) cash dividends and distributions paid on preferred stock or disqualified stock.
56

Table of Contents
Pinnacle Foods Inc.Reconciliation of Non-GAAP measures (Unaudited)
Adjusted gross profit and Adjusted gross profit as a % of sales(thousands)
Three months ended Nine months ended Fiscal Year
Ended
September 25,
2016 September 27,
2015 September 25,
2016 September 27,
2015 December 27,
2015Gross profit $ 228,704 $ 176,855 $ 648,463 $ 517,681 $ 740,506Accelerated depreciation expense (a) — 1,131 — 1,131 1,131Non-cash items (b) (1,724) 4,392 1,165 736 (1,029)Acquisition, merger and other restructuring charges (c) 2,102 2,011 3,711 6,307 9,217Adjusted gross profit $ 229,082 $ 184,389 $ 653,339 $ 525,855 $ 749,825
Adjusted gross profit as a % of sales 30.2% 29.0% 28.8% 27.2% 28.2%
(a) Reflects accelerated depreciation related to in-sourcing of Wish-Bone production.
(b) Non-cash items are comprised of the following:
(thousands of dollars) Three months ended Nine months ended Fiscal Year Ended
September 25, 2016 September 27, 2015 September 25, 2016 September 27, 2015 December 27, 2015
Unrealized gains resulting from hedging activities (1) $ (1,724) $ 4,392 $ (9,217) $ (218) $ (1,983)Effects of adjustments related to the application of purchaseaccounting (2) — — 10,382 — —Non-cash compensation charges (3) — — — 954 954Non-cash items $ (1,724) $ 4,392 $ 1,165 $ 736 $ (1,029)
_________________
(1) Represents non-cash gains and losses resulting from mark-to-market obligations under derivative contracts.(2) For the nine months ended September 25, 2016 , represents expense related to the write-up to fair market value of inventories acquired as a result
of the Boulder acquisition.(3) Represents non-cash employee incentives and retention charges resulting from the termination of the Hillshire merger agreement
(c) Acquisition, merger and other restructuring charges are comprised of the following:
(thousands of dollars) Three months ended Nine months ended Fiscal Year Ended
September 25, 2016 September 27, 2015 September 25, 2016 September 27, 2015 December 27, 2015Expenses in connection with an acquisition orother non-recurring merger costs (1) $ — $ — $ — $ 130 $ 130
Restructuring charges, integration costs and other businessoptimization expenses (2) 2,102 2,011 $ 3,711 $ 6,177 8,625
Employee severance and recruiting (3) — — — — 462
Total acquisition, merger and other restructuring charges $ 2,102 $ 2,011 $ 3,711 $ 6,307 $ 9,217
_________________
(1) For the nine months ended September 27, 2015 and for fiscal 2015, represents expenses incurred related to the terminated agreement withHillshire.
57

Table of Contents
(2) For the three and nine months ended September 25, 2016 , primarily represents integration costs of the Garden Protein and Boulder acquisition.For the nine months ended September 27, 2015 and for fiscal 2015, primarily represents integration costs of the Garden Protein and Wish-Boneacquisitions.
(3) Represents severance costs paid or accrued to terminated employees.
58

Table of Contents
Pinnacle Foods Inc. and SubsidiariesReconciliation of Non-GAAP measures (Unaudited)
Adjusted EBIT (1)(thousands)
Three months ended Nine months ended September 25, 2016 September 27, 2015 September 25, 2016 September 27, 2015Net earnings attributable to Pinnacle Foods Inc. andSubsidiaries common stockholders (as reported) $ 52,353 $ 48,098 $ 122,973 $ 133,313 Interest expense, net 36,446 22,308 103,470 65,958 Provision for income taxes 29,469 27,387 79,892 76,806 Net loss attributable to non-controlling interest — — — —Earnings before interest and taxes (as reported) 118,268 97,793 306,335 276,077
Accelerated depreciation expense (2) — 1,131 — 1,131Non-cash items
Unrealized (gains)/losses resulting from hedging (3) (1,724) 4,392 (9,217) (218)Purchase accounting adjustments (4) — — 10,382 — Tradename impairment charges (5) 11,200 — 11,200 —Non-cash compensation charges (6) — — — 1,567Foreign exchange (gains)/losses (7) 256 2,102 (1,027) 3,680
Acquisition, merger and other restructuring charges Acquisition or other non recurring expenses (8) — — 6,781 1,128Restructuring and integration costs (9) 6,568 2,353 31,674 6,882Employee severance (10) — 225 — 225
Adjusted EBIT $ 134,568 $ 107,996 $ 356,128 $ 290,472
(1) Excludes Boulder, Wish-Bone and Gardein anticipated synergies which are included in calculating Covenant compliance.(2) Reflects accelerated depreciation related to in-sourcing of Wish-Bone production.(3) Represents non-cash gains and losses resulting from mark-to-market obligations under derivative contracts.(4) For the nine months ended September 25, 2016 , represents expense related to the write-up to fair value of inventories acquired as a result of the Boulder
acquisition.(5) For the three and nine months ended September 25, 2016 , represents tradename impairment on Celeste($7.3 million), AuntJemima($3.0 million) and
SnyderofBerlin($0.9 million).(6) For the nine months ended September 27, 2015 , represents non-cash employee incentives and retention charges resulting from the termination of the
Hillshire merger agreement.(7) Represents foreign exchange (gains) losses resulting from intra-entity loans that are anticipated to be settled in the foreseeable future.(8) For the nine months ended September 25, 2016 , represents Boulder acquisition costs. For the nine months ended September 27, 2015 , represents
expenses related to the secondary offerings of common stock.(9) For the three and nine months ended September 25, 2016 , primarily represents restructuring charges and integration costs of the Boulder and Garden
Protein acquisitions. For the three and nine months September 27, 2015 , primarily represents integration costs of the Garden Protein and Wish-Boneacquisitions.
(10) Represents severance costs not related to business acquisitions paid, or to be paid, to terminated employees.
59

Table of Contents
Pinnacle Foods Inc.Reconciliation from Reported to Adjusted Segment Amounts (unaudited)
For the three and nine months ended September 25, 2016 and September 27, 2015(thousands)
Three months ended Nine months ended September 25, 2016 September 27, 2015 September 25, 2016 September 27, 2015
Earnings before interest & taxes - Reported Birds Eye Frozen $ 54,188 $ 51,953 $ 156,223 $ 133,208Duncan Hines Grocery 48,127 44,223 142,987 138,471Boulder Brands 16,082 — 11,884 —Specialty Foods 6,322 7,788 19,575 23,087Unallocated corporate expenses (6,451) (6,171) (24,334) (18,689)
Total $ 118,268 $ 97,793 $ 306,335 $ 276,077
Adjustments (Non GAAP - See separate table) Birds Eye Frozen $ 10,832 $ 5,350 $ 7,536 $ 7,305Duncan Hines Grocery (594) 4,529 (3,760) 6,919Boulder Brands 5,250 — 38,867 —Specialty Foods 812 324 368 171Unallocated corporate expenses — — 6,782 —
Total $ 16,300 $ 10,203 $ 49,793 $ 14,395
Earnings before interest & taxes - Adjusted (Non GAAP- See separate discussion and tables) Birds Eye Frozen $ 65,020 $ 57,303 $ 163,759 $ 140,513Duncan Hines Grocery 47,533 48,752 139,227 145,390Boulder Brands 21,332 — 50,751 —Specialty Foods 7,134 8,112 19,943 23,258Unallocated corporate expenses (6,451) (6,171) (17,552) (18,689)
Total $ 134,568 $ 107,996 $ 356,128 $ 290,472
60

Table of Contents
Pinnacle Foods Inc.Reconciliation from Reported to Adjusted Segment Amounts
Supplemental Schedule of Adjustments Detail (unaudited)For the three and nine months ended September 25, 2016 and September 27, 2015
(millions)
Adjustments to Earnings Before Interest and Taxes Three months ended Nine months ended September 25, 2016 September 27, 2015 September 25, 2016 September 27, 2015Birds Eye Frozen Restructuring and acquisition integration charges $ 1.3 $ 3.0 $ 1.6 $ 5.5Gardein acquisition related charges — — — 0.1Employee severance — 0.1 — 0.1Unrealized mark-to-market (gain)/loss (0.8) 2.2 (4.5) 0.4Hillshire merger termination-related employee compensationexpense — — — 0.8Tradename impairment charges 10.3 — 10.3 —Other — — 0.1 0.4
Total Birds Eye Frozen $ 10.8 $ 5.3 $ 7.5 $ 7.3
Duncan Hines Grocery Restructuring and acquisition integration charges $ — $ 2.6 $ — $ 6.2Employee severance — 0.1 — 0.1Unrealized mark-to-market (gain)/loss (0.6) 1.8 (3.9) (0.6)Hillshire merger termination-related employee compensationexpense — — — 0.8Other — — 0.1 0.4
Total Duncan Hines Grocery $ (0.6) $ 4.5 $ (3.8) $ 6.9
Boulder Brands Restructuring and acquisition integration charges $ 5.5 $ — $ 28.7 $ —Expense related to the write-up to fair market value ofinventories acquired — — 10.4 —Unrealized mark-to-market (gain)/loss (0.2) — (0.2) —
Total Boulder Brands $ 5.3 $ — $ 38.9 $ —
Specialty Foods Unrealized mark-to-market (gain)/loss $ (0.1) $ 0.3 $ (0.5) $ —Hillshire merger termination-related employee compensationexpense — — — 0.1Tradename impairment charges 0.9 — 0.9 —
Total Specialty Foods $ 0.8 $ 0.3 $ 0.4 $ 0.1
Unallocated Corporate Expenses Boulder acquisition related charges $ — $ — $ 6.8 $ —
Total Unallocated Corporate Expenses $ — $ — $ 6.8 $ —
Contractual Commitments
Our contractual commitments consist mainly of payments related to long-term debt and related interest, operating and capital lease payments, certain take-or-payarrangements entered into as part of the normal course of business and pension obligations. Refer to the “Contractual Commitments” section of the Management'sDiscussion and Analysis of Financial Condition and Results of Operations in our Form 10-K filed with the SEC on February 25, 2016, as well as the same sectionin our Form 10-Q filed with the SEC on April 28, 2016, for details on our contractual obligations and commitments.
61

Table of Contents
Off-Balance Sheet Arrangements
As of September 25, 2016 , we did not have any off-balance sheet obligations.
Critical Accounting Policies and Estimates
We have disclosed in "Management's Discussion and Analysis of Financial Condition and Results of Operations" included in our Form 10-K filed on February 25,2016, those accounting policies that we consider to be significant in determining our results of operations and financial condition. Other than the below disclosure,there have been no material changes to those policies that we consider to be significant since the filing of the 10-K. We believe that the accounting principlesutilized in preparing our unaudited consolidated financial statements conform in all material respects to GAAP.
Revenue recognition
Through the first six months of 2016, Boulder Brands recognized revenue upon the receipt and acceptance of product by the customer. The earnings process iscomplete once the customer order has been placed and approved and the product shipped has been received by the customer. For the base Pinnacle business,revenue from product sales is recognized upon shipment to the customers as terms are free on board ("FOB") shipping point, at which point title and risk of loss istransferred. In the third quarter of 2016, the Company aligned Boulder's revenue recognition policy with the base Pinnacle business.
ITEM 3: QUANTITATIVE AND QUALITATIVE DISCLOSURES ABOUT MARKET RISK
F INANCIAL INSTRUMENTS
RiskManagementStrategyWe are exposed to certain risks arising from both our business operations and economic conditions. We principally manage our exposures to a wide variety ofbusiness and operational risks through management of our core business activities. We manage economic risks, including interest rate, liquidity, and credit riskprimarily by managing the amount, sources, and duration of our debt funding and the use of derivative financial instruments. The primary risks managed by usingderivative instruments are interest rate risk, foreign currency exchange risk and commodity price risk. Specifically, we enter into derivative financial instruments tomanage exposures that arise from business activities that result in the receipt or payment of future known and uncertain cash amounts, the value of which aredetermined by interest rates, foreign exchange rates or commodity prices. Please refer to Note 12 of the Consolidated Financial Statements "Financial Instruments"for additional details regarding our derivatives and refer to Note 10 of the Consolidated Financial Statements "Debt and Interest Expense" for additional detailsregarding our debt instruments. There were no significant changes in our exposures to market risk since December 27, 2015 .See “Item 7A. Quantitative and Qualitative Disclosures about Market Risk” included in our Form 10-K filed on February 25, 2016.
62

Table of Contents
ITEM 4. CONTROLS AND PROCEDURES
DisclosureControlsandProcedures
We maintain disclosure controls and procedures that are designed to provide reasonable assurance that information required to be disclosed by us in our reports thatwe file or submit under the Exchange Act (as defined in Rules 13a-15(e) and 15d-15(e) of the Securities Exchange Act of 1934, as amended (the “Exchange Act”))is recorded, processed, summarized and reported within the time periods specified in the SEC's rules and forms, and that such information is accumulated andcommunicated to our management, with the participation of our Chief Executive Officer and Chief Financial Officer, as appropriate, to allow timely decisionsregarding required disclosures. Any controls and procedures, no matter how well designed and operated, can provide only reasonable assurance of achieving thedesired control objectives.
Our management, with the participation of our Chief Executive Officer and Chief Financial Officer, has evaluated the effectiveness of the design and operation ofour disclosure controls and procedures as of September 25, 2016 . Based upon that evaluation, our Chief Executive Officer and Chief Financial Officer concludedthat the design and operation of our disclosure controls and procedures are effective at a level of reasonable assurance.
ChangesinInternalControlOverFinancialReporting
There was no change in our internal control over financial reporting (as defined in Rule 15d-15(f) of the Exchange Act) that occurred during the fiscal quarterended September 25, 2016 that has materially affected, or is reasonably likely to materially affect, our internal control over financial reporting.
63
Table of Contents
PART II ITEM 1: LEGAL PROCEEDINGS
No material legal proceedings are currently pending.
ITEM 1A: RISK FACTORS
Our risk factors are summarized under the “RiskFactors”section of our Form 10-K filed on February 25, 2016. There have been no material changes to our riskfactors since the filing of the Form 10-K.
ITEM 2: UNREGISTERED SALES OF EQUITY SECURITIES AND USE OF PROCEEDSNone
ITEM 3: DEFAULTS UPON SENIOR SECURITIESNone
ITEM 4: MINE SAFETY DISCLOSURESNone
ITEM 5: OTHER INFORMATION
Rule 10b5-1 Plans
Our policy governing transactions in our securities by our directors, officers and employees permits such persons to adopt stock trading plans pursuant to Rule10b5-1 promulgated by the Securities and Exchange Commission under the Securities Exchange Act of 1934, as amended. Certain members of management haveand may from time to time establish such stock trading plans. We do not undertake any obligation to disclose, or to update or revise any disclosure regarding, anysuch plans and specifically do not undertake to disclose the adoption, amendment, termination or explanation of any such plans.
64
Table of Contents
ITEM 6: EXHIBITS
See the Exhibit Index immediately following the signature page hereto, which Exhibit Index is incorporated by reference as if fully set forth herein.
SIGNATURES Pursuant to the requirements of the Securities Exchange Act of 1934, the registrant has duly caused this report to be signed on its behalf by the undersigned,thereunto duly authorized.
PINNACLE FOODS INC.
By: /s/ Craig SteeneckName: Craig Steeneck
Title:
Executive Vice President and Chief Financial Officer (PrincipalFinancial Officer, Principal Accounting Officer and AuthorizedOfficer)
Date: October 27, 2016
65
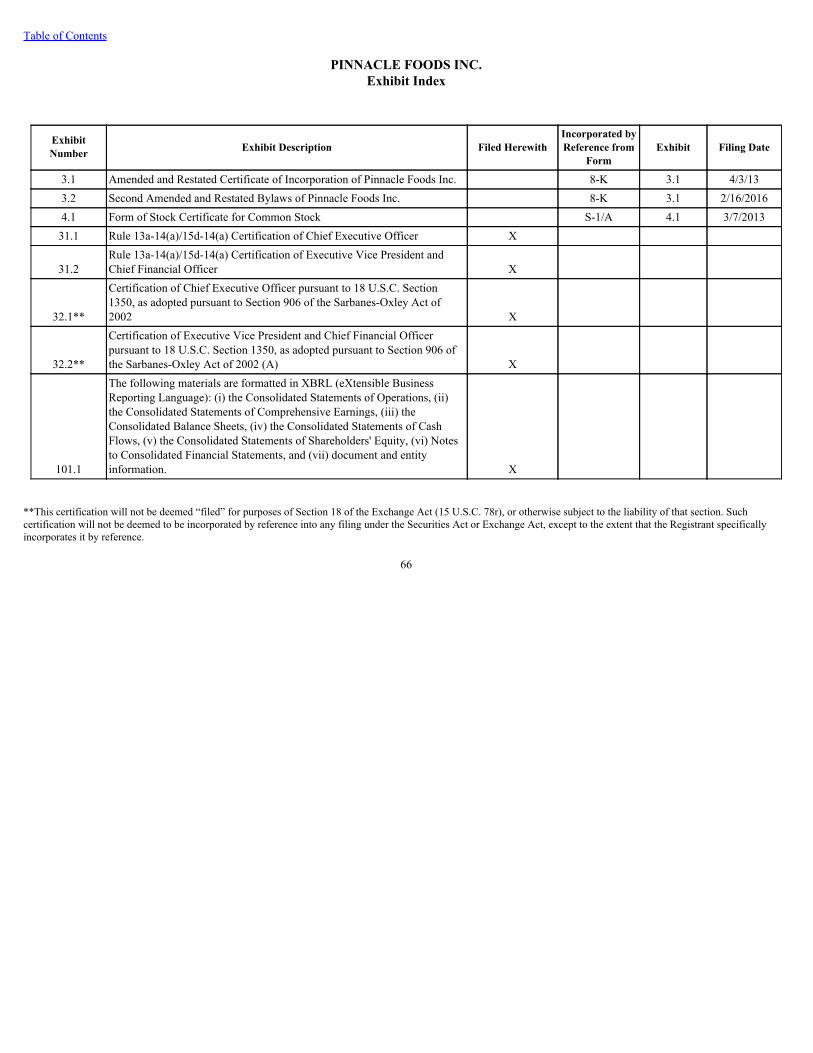
Table of Contents
PINNACLE FOODS INC.Exhibit Index
ExhibitNumber Exhibit Description Filed Herewith
Incorporated byReference from
FormExhibit Filing Date
3.1 Amended and Restated Certificate of Incorporation of Pinnacle Foods Inc. 8-K 3.1 4/3/133.2 Second Amended and Restated Bylaws of Pinnacle Foods Inc. 8-K 3.1 2/16/20164.1 Form of Stock Certificate for Common Stock S-1/A 4.1 3/7/201331.1 Rule 13a-14(a)/15d-14(a) Certification of Chief Executive Officer X
31.2Rule 13a-14(a)/15d-14(a) Certification of Executive Vice President andChief Financial Officer X
32.1**
Certification of Chief Executive Officer pursuant to 18 U.S.C. Section1350, as adopted pursuant to Section 906 of the Sarbanes-Oxley Act of2002 X
32.2**
Certification of Executive Vice President and Chief Financial Officerpursuant to 18 U.S.C. Section 1350, as adopted pursuant to Section 906 ofthe Sarbanes-Oxley Act of 2002 (A) X
101.1
The following materials are formatted in XBRL (eXtensible BusinessReporting Language): (i) the Consolidated Statements of Operations, (ii)the Consolidated Statements of Comprehensive Earnings, (iii) theConsolidated Balance Sheets, (iv) the Consolidated Statements of CashFlows, (v) the Consolidated Statements of Shareholders' Equity, (vi) Notesto Consolidated Financial Statements, and (vii) document and entityinformation. X
**This certification will not be deemed “filed” for purposes of Section 18 of the Exchange Act (15 U.S.C. 78r), or otherwise subject to the liability of that section. Suchcertification will not be deemed to be incorporated by reference into any filing under the Securities Act or Exchange Act, except to the extent that the Registrant specificallyincorporates it by reference.
66

Exhibit 31.1CERTIFICATION
I, Mark Clouse, certify that:
1. I have reviewed this quarterly report on Form 10-Q of Pinnacle Foods Inc. (the “Registrant”);2. Based on my knowledge, this report does not contain any untrue statement of a material fact or omit to state a material fact necessary to make the statements
made, in light of the circumstances under which such statements were made, not misleading with respect to the period covered by this report;3. Based on my knowledge, the financial statements, and other financial information included in this report, fairly present in all material respects the financial
condition, results of operations and cash flows of the Registrant as of, and for, the periods presented in this report;4. The Registrant’s other certifying officer(s) and I are responsible for establishing and maintaining disclosure controls and procedures (as defined in Exchange
Act Rules 13a-15(e) and 15d-15(e)) and internal control over financial reporting (as defined in Exchange Act Rules 13a-15(f) and 15d-15(f)) for the Registrantand have:
(a) Designed such disclosure controls and procedures, or caused such disclosure controls and procedures to be designed under our supervision, to ensure thatmaterial information relating to the Registrant, including its consolidated subsidiaries, is made known to us by others within those entities, particularlyduring the period in which this report is being prepared;
(b) Designed such internal control over financial reporting, or caused such internal control over financial reporting to be designed under our supervision, toprovide reasonable assurance regarding the reliability of financial reporting and the preparation of financial statements for external purposes inaccordance with generally accepted accounting principles;
(c) Evaluated the effectiveness of the Registrant’s disclosure controls and procedures and presented in this report our conclusions about the effectiveness ofthe disclosure controls and procedures, as of the end of the period covered by this report based on such evaluation; and
(d) Disclosed in this report any change in the Registrant’s internal control over financial reporting that occurred during the Registrant’s most recent fiscalquarter (the Registrant's fourth fiscal quarter in the case of an annual report) that has materially affected, or is reasonably likely to materially affect, theRegistrant’s internal control over financial reporting; and
5. The Registrant’s other certifying officer(s) and I have disclosed, based on our most recent evaluation of internal control over financial reporting, to theRegistrant’s auditors and the audit committee of the Registrant’s board of directors (or persons performing the equivalent functions):(a) All significant deficiencies and material weaknesses in the design or operation of internal control over financial reporting which are reasonably likely to
adversely affect the Registrant’s ability to record, process, summarize and report financial information; and(b) Any fraud, whether or not material, that involves management or other employees who have a significant role in the Registrant’s internal control over
financial reporting.
Date: October 27, 2016 /s/ MARK CLOUSE Mark Clouse Chief Executive Officer
Exhibit 31.2CERTIFICATION
I, Craig Steeneck, certify that:
1. I have reviewed this quarterly report on Form 10-Q of Pinnacle Foods Inc. (the “Registrant”);
2. Based on my knowledge, this report does not contain any untrue statement of a material fact or omit to state a material fact necessary to make the statementsmade, in light of the circumstances under which such statements were made, not misleading with respect to the period covered by this report;
3. Based on my knowledge, the financial statements, and other financial information included in this report, fairly present in all material respects the financialcondition, results of operations and cash flows of the Registrant as of, and for, the periods presented in this report;
4. The Registrant’s other certifying officer(s) and I are responsible for establishing and maintaining disclosure controls and procedures (as defined in ExchangeAct Rules 13a-15(e) and 15d-15(e)) and internal control over financial reporting (as defined in Exchange Act Rules 13a-15(f) and 15d-15(f)) for the Registrantand have:
(a) Designed such disclosure controls and procedures, or caused such disclosure controls and procedures to be designed under our supervision, to ensure thatmaterial information relating to the Registrant, including its consolidated subsidiaries, is made known to us by others within those entities, particularlyduring the period in which this report is being prepared;
(b) Designed such internal control over financial reporting, or caused such internal control over financial reporting to be designed under our supervision, toprovide reasonable assurance regarding the reliability of financial reporting and the preparation of financial statements for external purposes inaccordance with generally accepted accounting principles;
(c) Evaluated the effectiveness of the Registrant’s disclosure controls and procedures and presented in this report our conclusions about the effectiveness ofthe disclosure controls and procedures, as of the end of the period covered by this report based on such evaluation; and
(d) Disclosed in this report any change in the Registrant’s internal control over financial reporting that occurred during the Registrant’s most recent fiscalquarter (the Registrant's fourth fiscal quarter in the case of an annual report) that has materially affected, or is reasonably likely to materially affect, theRegistrant’s internal control over financial reporting; and
5. The Registrant’s other certifying officer(s) and I have disclosed, based on our most recent evaluation of internal control over financial reporting, to theRegistrant’s auditors and the audit committee of the Registrant’s board of directors (or persons performing the equivalent functions):
(a) All significant deficiencies and material weaknesses in the design or operation of internal control over financial reporting which are reasonably likely toadversely affect the Registrant’s ability to record, process, summarize and report financial information; and
(b) Any fraud, whether or not material, that involves management or other employees who have a significant role in the Registrant’s internal control overfinancial reporting.
Date: October 27, 2016 /s/ CRAIG STEENECK Craig Steeneck Executive Vice President and Chief Financial Officer

Exhibit 32.1CERTIFICATION PURSUANT TO
18 U.S.C. SECTION 1350,AS ADOPTED PURSUANT TO
SECTION 906 OF THE SARBANES-OXLEY ACT OF 2002
In connection with the Quarterly Report of Pinnacle Foods Inc. (the “Registrant”) on Form 10-Q for the fiscal quarter ended September 25, 2016 , as filed with theSecurities and Exchange Commission on the date hereof (the “Report”), I, Mark Clouse, Chief Executive Officer of the Registrant, certify, pursuant to 18 U.S.C.Section 1350, as adopted pursuant to Section 906 of the Sarbanes-Oxley Act of 2002, that:
1. The Report fully complies with the requirements of Section 13(a) or 15(d) of the Securities Exchange Act of 1934; and
2. The information contained in the Report fairly presents, in all material respects, the financial condition and results of operations of the Registrant.
Date: October 27, 2016 /s/ MARK CLOUSE Mark Clouse Chief Executive Officer
Exhibit 32.2CERTIFICATION PURSUANT TO
18 U.S.C. SECTION 1350,AS ADOPTED PURSUANT TO
SECTION 906 OF THE SARBANES-OXLEY ACT OF 2002
In connection with the Quarterly Report of Pinnacle Foods Inc. (the “Registrant”) on Form 10-Q for the fiscal quarter ended September 25, 2016 , as filed with theSecurities and Exchange Commission on the date hereof (the “Report”), I, Craig Steeneck, Chief Financial Officer of the Registrant, certify, pursuant to 18 U.S.C.Section 1350, as adopted pursuant to Section 906 of the Sarbanes-Oxley Act of 2002, that:
1. The Report fully complies with the requirements of Section 13(a) or 15(d) of the Securities Exchange Act of 1934; and
2. The information contained in the Report fairly presents, in all material respects, the financial condition and results of operations of the Registrant.
Date: October 27, 2016 /s/ CRAIG STEENECK Craig Steeneck Executive Vice President and Chief Financial Officer