yakutat water treatment plant energy audit report final
TRANSCRIPT
1
ComprehensiveEnergyAuditFor
YakutatWaterTreatmentPlant
Prepared For
City and Borough of Yakutat
March 6, 2018
Prepared by: Cody Uhlig, Kevin Ulrich, and Kelli Whelan
Alaska Native Tribal Health Consortium 4500 Diplomacy Drive Anchorage, AK 99508

2
TableofContents PREFACE ........................................................................................................................................................ 3 ACKNOWLEDGMENTS ................................................................................................................................... 3 1. EXECUTIVE SUMMARY .............................................................................................................................. 4 2. AUDIT AND ANALYSIS BACKGROUND ....................................................................................................... 8 2.1 Program Description ........................................................................................................................... 8 2.2 Audit Description ................................................................................................................................ 8 2.3. Method of Analysis ............................................................................................................................ 9 2.4 Limitations of Study .......................................................................................................................... 10
3. YAKUTAT WATER TREATMENT PLANT ................................................................................................... 10 3.1. Building Description ......................................................................................................................... 10 3.2 Predicted Energy Use ........................................................................................................................ 17 3.2.1 Energy Usage / Tariffs ................................................................................................................ 17 3.2.2 Energy Use Index (EUI) .............................................................................................................. 19
3.3 AkWarm© Building Simulation ......................................................................................................... 21 4. ENERGY COST SAVING MEASURES ......................................................................................................... 21 4.1 Summary of Results .......................................................................................................................... 21 4.2 Interactive Effects of Projects ........................................................................................................... 24 4.3 Electrical & Appliance Measures....................................................................................................... 24 4.3.1 Lighting Measures ...................................................................................................................... 24 4.3.2 Other Electrical Measures .......................................................................................................... 25 4.3.3 Other Measures ......................................................................................................................... 28
5. ENERGY EFFICIENCY ACTION PLAN ......................................................................................................... 29 APPENDICES ................................................................................................................................................ 30 Appendix A – Scanned Energy Billing Data ............................................................................................. 30 Appendix B – Energy Audit Report – Project Summary .......................................................................... 31 Appendix C – Photographs from AkWarm Program ............................................................................... 32 Appendix D – Actual Fuel Use versus Modeled Fuel Use ........................................................................ 34 Appendix E ‐ Electrical Demands ............................................................................................................ 35

3
PREFACE This energy audit was conducted using funds provided by the Denali Commission. Coordination with the
City of Yakutat has been undertaken to provide maximum accuracy in identifying facilities to audit and
coordinating potential follow up retrofit activities.
The Rural Energy Initiative at the Alaska Native Tribal Health Consortium (ANTHC) prepared this document
for the City and Borough of Yakutat, Alaska. The authors of this report are Cody Uhlig, Senior Project
Manager, Professional Engineer (PE), and Certified Energy Manager (CEM); Kelli Whelan, Energy Auditor I
(previously AmeriCorps VISTA); and Kevin Ulrich, Assistant Engineering Project Manager, Mechanical
Engineer in Training (EIT), and CEM.
The purpose of this report is to provide a comprehensive document of the findings and analysis that
resulted from an energy audit conducted in May of 2017 by the ANTHC Rural Energy Initiative. This report
analyzes historical energy use and identifies costs and savings of recommended energy conservation
measures. Discussions of site‐specific concerns, non‐recommended measures, and an energy
conservation action plan are also included in this report.
ACKNOWLEDGMENTS The ANTHC Rural Energy Initiative gratefully acknowledges the assistance of Mayor Ralph Wolfe; City and
Borough of Yakutat Manager Jon Erickson, EdD; and Utility Manager Ron Veebe.

4
1.EXECUTIVESUMMARY This report was prepared for the City and Borough of Yakutat. The scope of the audit focused on Yakutat
Water Treatment Plant. The scope of this report is a comprehensive energy study, which included an
analysis of building shell, interior and exterior lighting systems, heating and ventilation systems, and
electric loads. There is also a report for the Yakutat Wastewater Treatment Plant that complements the
contents of this report.
Based on electricity and fuel oil prices in effect at the time of the audit, the total predicted energy costs
for the Yakutat Water Treatment Plant are $47,430 per year, with all of the costs devoted to electricity
use.
The State of Alaska Power Cost Equalization (PCE) program provides a subsidy to rural communities across
the state to lower electricity costs and make energy affordable in rural Alaska. In Yakutat, the cost of
electricity without the PCE subsidy was approximately $0.389 per kilowatt hour (kWh) and the cost with
PCE was approximately $0.18 per kWh in 2017.
Table 1.1 lists the total usage of electricity in the Yakutat Water Treatment Plant before and after the
proposed retrofits.
Table 1.1: Predicted Annual Fuel Use for the Yakutat Water Treatment Plant
Predicted Annual Fuel Use Fuel Use Existing Building With Proposed Retrofits
Electricity 121,929 kWh 36,702 kWh
Benchmark figures facilitate comparing energy use between different buildings. Table 1.2 lists several
benchmarks for the audited building.
Table 1.2: Building Benchmarks for the Yakutat Water Treatment Plant
Building Benchmarks
Description EUI
(kBTU/Sq. Ft.) EUI/HDD
(Btu/Sq. Ft./HDD) ECI
($/Sq. Ft.)
Existing Building 1,304.5 143.60 $148.68
With Proposed Retrofits 392.7 43.23 $44.76
EUI: Energy Use Intensity ‐ The annual site energy consumption divided by the structure’s conditioned area. EUI/HDD: Energy Use Intensity per Heating Degree Day. ECI: Energy Cost Index ‐ The total annual cost of energy divided by the square footage of the conditioned space in the building.
Table 1.3 below summarizes the energy efficiency measures analyzed for the Yakutat Water Treatment
Plant. Listed are the estimates of the annual savings, installed costs, and two different financial measures
of investment return.

5
Table 1.3: Summary of Recommended Energy Efficiency Measures
PRIORITY LIST – ENERGY EFFICIENCY MEASURES
Rank Feature Improvement Description
Annual Energy Savings
Installed Cost
Savings to Investment Ratio, SIR1
Simple Payback (Years)2
CO2 Savings
1
Other Electrical: Water Storage Tank Panel Heater
Turn down panel heater and use only in
extreme cold situations.
$583 $250 27.39 0.4 2,397.3
2
Plant Operations Upgrade: 15HP Pressure Pump
Removal
Remove wood stave tank from piping arrangement. Tie
piping together and plumb well pump
directly to distribution. Directly related to
recommendations 3, 7, 8, and 11.
$30,968 $44,245 10.23 1.4 127,372.9
3
Plant Operations Upgrade: Remove Wood Stave Tank
Heat Tape
Remove wood stave tank from piping arrangement. Tie
piping together and plumb well pump
directly from well to distribution. Directly
related to recommendations 2, 7,
8, and 11.
$8 $13 3.77 1.6 32.6
4 Other Electrical: Water Storage Tank Heat Tape
Repair or replace thermostat for heat
tape. Shorten length of heat tape
$204 $1,035 2.32 5.1 839.9
5 Lighting: Well
House 1 Lighting
Replace with new, energy efficient, LED
equivalents.
$2 + $6 Maint. Savings
$30 2.00 3.9 7.0
6 Lighting: Well
House 2 Lighting
Replace with new, energy efficient, LED
equivalents.
$2 + $6 Maint. Savings
$30 2.00 3.9 7.1
7
Plant Operations Upgrade: Energy Savings due to Water Loss
Elimination (Well Pump 1)
Remove wood stave tank from piping arrangement. Tie
piping together and plumb well pump
directly from well to distribution. Directly
related to recommendation 2, 3,
8, and 11.
$286 + $225 Maint. Savings3
$5,003 1.50 9.8 1,176.6

6
PRIORITY LIST – ENERGY EFFICIENCY MEASURES
Rank Feature Improvement Description
Annual Energy Savings
Installed Cost
Savings to Investment Ratio, SIR1
Simple Payback (Years)2
CO2 Savings
8
Plant Operations Upgrade: Energy Savings due to Water Loss
Elimination (Well Pump 2)
Remove wood stave tank from piping arrangement. Tie
piping together and plumb well pump
directly from well to distribution. Directly
related to recommendations 2, 3,
7, and 11.
$782 + $225 Maint. Savings3
$13,665 1.08 13.6 3,214.8
9 Heating and
Insulation: Well House 1
Install programmable thermostat to maintain temperature. Install R‐
14 rigid board insulation on walls, ceiling, and floor. Replace door with
insulated door. Reduce air leakage through well house building shell upgrades.
$144 + $565 Maint. Savings4
$4,800 1.03 6.8 592.4
10 Heating and
Insulation: Well House 2
Replace existing non‐functional electric heater with similar‐sized model that is thermostatically
controlled. Install R‐14 rigid board insulation on walls, ceiling, and floor. Replace door with insulated door. Reduce air leakage through well house
building shell upgrades.
$144 + $566 Maint. Savings4
$5,100 0.98 7.2 592.4
11
Plant Operations Upgrade: Energy Savings due to Water Loss Elimination
(Chlorine Pump)
Remove wood stave tank from piping arrangement. Tie
piping together and plumb well pump
directly from well to distribution. Directly
related to recommendation 2, 3,
7, and 8.
$31 $2,060 0.22 65.6 129.2
TOTAL, all measures
$33,153 +
$1,593 Maint. Savings
$76,232 6.49 2.2 136,362.2

7
Table Notes:
1 Savings to Investment Ratio (SIR) is a life‐cycle cost measure calculated by dividing the total savings over the life of a project (expressed in today’s dollars) by its investment costs. The SIR is an indication of the profitability of a measure; the higher the SIR, the more profitable the project. An SIR greater than 1.0 indicates a cost‐effective project (i.e. more savings than cost). Remember that this profitability is based on the position of that Energy Efficiency Measure (EEM) in the overall list and assumes that the measures above it are implemented first.
2 Simple Payback (SP) is a measure of the length of time required for the savings from an EEM to payback the investment cost, not counting interest on the investment and any future changes in energy prices. It is calculated by dividing the investment cost by the expected first‐year savings of the EEM. 3 The maintenance savings figure in the Plant Operations Upgrade EEMs captures the energy and chemical treatment costs saved by eliminating the water loss at the wood stave tank. At the estimated water loss rate of 10 gallons per minute, approximately 131 pounds of chlorine is wasted every year. The savings from removing the wood stave tank is split between the two well pumps based on their pumping rates. 4 The maintenance savings figure in the Well House Heating and Insulation EEMs captures an estimated 30% reduction in electrical usage for space heating by installing temperature‐controlled thermostats for the electric space heaters.
With all of these energy efficiency measures in place, the annual utility cost can be reduced by $33,153
per year, or 69.9% of the buildings’ total energy costs. These measures are estimated to cost $76,232, for
an overall simple payback period of 2.2 years.
Table 1.4 below is a breakdown of the annual energy cost across various energy end use types, such as
space heating and freeze prevention. The first row in the table shows the breakdown for the building as
it is now. The second row shows the expected breakdown of energy cost for the building assuming all of
the retrofits in this report are implemented. Finally, the last row shows the annual energy savings that
will be achieved from the retrofits.
Table 1.4: Detailed Breakdown of Energy Costs in the Building
Annual Energy Cost Estimate Description Space Heating Lighting Other Electrical Total Cost
Existing Building $650 $103 $47,678 $47,430
With Proposed Retrofits $1,057 $99 $13,121 $14,277
Savings ‐$407 $3 $33,557 $33,153
Note: The negative space heating savings is primarily due to removing the 15 HP distribution pump in the Water Treatment Plant pump room. AkWarm accounts for heat radiated from large appliances and electrical loads.

8
2.AUDITANDANALYSISBACKGROUND
2.1ProgramDescription
This audit included services to identify, develop, and evaluate energy efficiency measures at the Yakutat
Water Treatment Plant. The scope of this project included evaluating building shell, lighting and other
electrical systems, and heating and ventilation equipment, motors and pumps. Measures were analyzed
based on life‐cycle‐cost techniques, which include the initial cost of the equipment, life of the equipment,
annual energy cost, annual maintenance cost, and a discount rate of 3.0% per year in excess of general
inflation.
2.2AuditDescription
Preliminary audit information was gathered in preparation for the site survey. The site survey provides
critical information in deciphering where energy is used and what opportunities exist within a building.
The entire site was surveyed to inventory the following to gain an understanding of how each building
operates:
Building envelope (roof, windows, etc.)
Heating, ventilation, and air conditioning equipment (HVAC)
Lighting systems and controls
Building‐specific equipment
The building site visit was performed to survey all major building components and systems. The site visit
included detailed inspection of energy consuming components. Summary of building occupancy
schedules, operating and maintenance practices, and energy management programs provided by the
building manager were collected along with the system and components to determine a more accurate
impact on energy consumption.
Details collected from Yakutat Water Treatment Plant enable a model of the building’s energy usage to
be developed, highlighting the building’s total energy consumption, energy consumption by specific
building component, and equivalent energy cost. The analysis involves distinguishing the different fuels
used on site, and analyzing their consumption in different activity areas of the building.
Yakutat Water Treatment Plant is made up of the following activity areas:
1. Pump Room: 256 square feet
2. Chemical Room: 63 square feet
3. Well House 1: 35 square feet (separate building)
4. Well House 2: 35 square feet (separate building)
The structure and space heating in both well houses were modeled separately, and were later appended
to the main Water Treatment Plant model. In addition to the activity areas above, there is an unheated

9
garage attached to the main Water Treatment Plant building. This space was omitted from the energy
model, because it has an infrequent and typical low energy demand.
The methodology involves taking into account a wide range of factors specific to the building. These
factors are used in the construction of the model of energy used. The factors include:
Occupancy hours
Local climate conditions
Prices paid for energy
2.3.MethodofAnalysis
Data collected was processed using AkWarm© Energy Use Software to estimate energy savings for each
of the proposed energy efficiency measures (EEMs). The recommendations focus on the building
envelope; heating and ventilation; lighting, electrical loads, and other electrical improvements; and motor
and pump systems that will reduce annual energy consumption.
EEMs are evaluated based on building use and processes, local climate conditions, building construction
type, function, operational schedule, existing conditions, and foreseen future plans. Energy savings are
calculated based on industry standard methods and engineering estimations.
Our analysis provides a number of tools for assessing the cost effectiveness of various improvement
options. These tools utilize Life‐Cycle Costing, which is defined in this context as a method of cost analysis
that estimates the total cost of a project over the period of time that includes both the construction cost
and ongoing maintenance and operating costs.
Savings to Investment Ratio (SIR) = Savings divided by Investment
Savings includes the total discounted dollar savings considered over the life of the improvement. When
these savings are added up, changes in future fuel prices as projected by the Department of Energy are
included. Future savings are discounted to the present to account for the time‐value of money (i.e.
money’s ability to earn interest over time). The Investment in the SIR calculation includes the labor and
materials required to install the measure. An SIR value of at least 1.0 indicates that the project is cost‐
effective—total savings exceed the investment costs.
Simple payback is a cost analysis method whereby the investment cost of a project is divided by the first
year’s savings of the project to give the number of years required to recover the cost of the investment.
This may be compared to the expected time before replacement of the system or component will be
required. For example, if a boiler costs $12,000 and results in a savings of $1,000 in the first year, the
payback time is 12 years. If the boiler has an expected life to replacement of 10 years, it would not be
financially viable to make the investment since the payback period of 12 years is greater than the project
life.

10
The Simple Payback calculation does not consider likely increases in future annual savings due to energy
price increases. As an offsetting simplification, simple payback does not consider the need to earn interest
on the investment (i.e. it does not consider the time‐value of money). Because of these simplifications,
the SIR figure is considered to be a better financial investment indicator than the Simple Payback measure.
Measures are implemented in order of cost‐effectiveness. The program first calculates individual SIRs,
and ranks all measures by SIR, higher SIRs at the top of the list. An individual measure must have an
individual SIR>=1 to make the cut. Next the building is modified and re‐simulated with the highest ranked
measure included. Now all remaining measures are re‐evaluated and ranked, and the next most cost‐
effective measure is implemented. AkWarm goes through this iterative process until all appropriate
measures have been evaluated and installed.
It is important to note that the savings for each recommendation is calculated based on implementing the
most cost effective measure first, and then cycling through the list to find the next most cost effective
measure. Implementation of more than one EEM often affects the savings of other EEMs. The savings may
in some cases be relatively higher if an individual EEM is implemented in lieu of multiple recommended
EEMs. For example, implementing a reduced operating schedule for inefficient lighting will result in
relatively high savings. Implementing a reduced operating schedule for newly installed efficient lighting
will result in lower relative savings, because the efficient lighting system uses less energy during each hour
of operation. If multiple EEM’s are recommended to be implemented, AkWarm calculates the combined
savings appropriately.
Cost savings are calculated based on estimated initial costs for each measure. Installation costs include
labor and equipment to estimate the full up‐front investment required to implement a change. Costs are
derived from Means Cost Data, industry publications, and local contractors and equipment suppliers.
2.4LimitationsofStudy
All results are dependent on the quality of input data provided, and can only act as an approximation. In
some instances, several methods may achieve the identified savings. This report is not intended as a final
design document. The design professional or other persons following the recommendations shall accept
responsibility and liability for the results.
3.YAKUTATWATERTREATMENTPLANT
3.1.BuildingDescription
The 319 square foot Yakutat Water Treatment Plant was constructed in the 1970s as the primary location
for all water intake, treatment, and distribution services for the community. The building is staffed for an
average of 2 hours per day throughout the week. Figure 1 shows an aerial view of Yakutat with the primary
features of the water treatment system marked with red circles. The local fish processing plant is marked
by a blue circle.

11
Figure 1: Aerial view of Yakutat water system facilities. Aerial photo courtesy of Google Earth (2018).
Groundwater is pumped from two wells, each approximately 175 feet deep. The well heads and plumbing
are protected by heated well houses. Raw water is injected with chlorine in the treatment plant before
being stored in a nearby 125,000‐gallon wood stave storage tank. Built in the 1970s, this tank is
particularly leaky (estimated at 10‐20 gallons per minute) and has notable damage from years of use (see
Figure 2 below). While chlorine is not required for microbial deactivation (the raw water source is
groundwater), it is a best practice to help protect public health.
Based on the water level in the reserve tank (1 Mil Water Storage Tank) and demand from the fish
processing plant, water is pumped from the wood stave tank by one of two distribution pumps in the
water treatment facility to the branched distribution system and the 1 Mil Water Storage Tank. The 1 Mil
Water Storage Tank provides head pressure to the distribution system and stores water for emergency
use. There is a separate distribution line for the fish processing plant.
Water Treatment Plant, Well Houses, and Wood Stave Tank
1 Mil Water Storage Tank
Wastewater Treatment Plant
Fish Processing Plant

12
Figure 2: Wood Stave Water Storage Tank near the Water Treatment Plant. The image on the right shows the rapid rate of water loss through the bottom and sides of the tank.
Figure 3: 1 Mil Water Storage Tank.
Description of Building Shell
The exterior walls have 2x4 wood framed construction with 16” on‐center studs. The stud cavities are
assumed to be filled with R‐13 fiberglass insulation. The exterior walls are eight feet high from the top of
the foundation (approximately 10.5 feet total). The backup generator garage is uninsulated.
The building has a cold attic over the pump and chemical injection rooms. The attic is 2x6 standard truss,
wood framed construction with 7.26 inches of R‐13 fiberglass batt insulation over the ceiling. The backup
generator garage does not have an attic space.
The building is constructed above grade with an insulated crawl space between the building and the
ground beneath. The crawlspace is approximately 2.5 feet high and sealed. Rigid foam insulation is present
in the floor structure.

13
There are no windows present in the facility. There are two single‐door entrances: one for the chemical
room and one for the pump room. These doors are insulated metal doors with no windows. The backup
generator garage is accessible through an exterior garage door.
Description of Heating Plants
The heating plants used in the building are:
Pump Room
Nameplate Information: Taskmaster TPI Corporation Model P3P5103CA1N
Fuel Type: Electricity
Input Rating: 3300 W
Steady State Efficiency: 100 %
Heat Distribution Type: Air
Figure 4: Pump Room unit heater in the Water Treatment Plant.
Chemical Room
Nameplate Information: Ceramic ceiling‐mounted unit heater
Fuel Type: Electricity
Input Rating: 312 W
Steady State Efficiency: 100 %
Heat Distribution Type: Air
Well House 1 Unit Heater
Fuel Type: Electricity
Input Rating: 1500 W
Steady State Efficiency: 100 %
Heat Distribution Type: Air

14
Figure 5: Well House 1 heater.
Well House 2 Unit Heater
Fuel Type: Electricity
Input Rating: 1500 W
Steady State Efficiency: 100 %
Heat Distribution Type: Air
Figure 6: Well House 2 heater.
Space Heating Distribution Systems
All space heating is achieved through the use of electric unit heaters and electric space heaters.
15
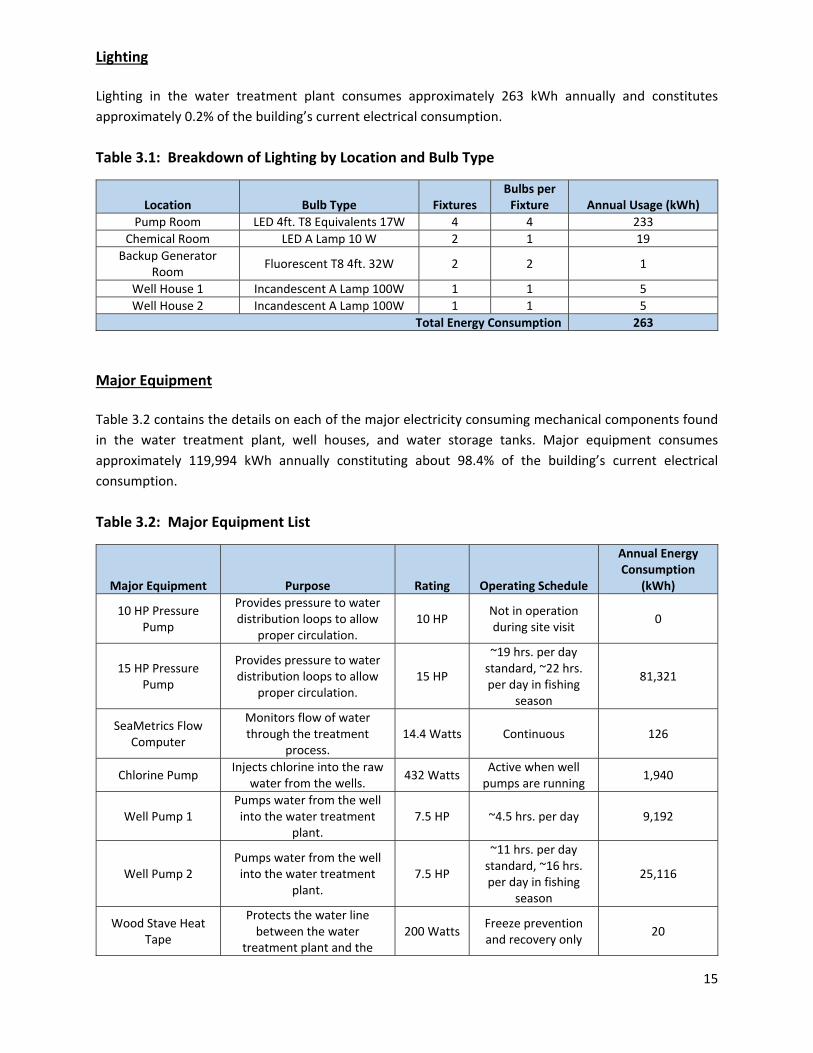
Lighting
Lighting in the water treatment plant consumes approximately 263 kWh annually and constitutes
approximately 0.2% of the building’s current electrical consumption.
Table 3.1: Breakdown of Lighting by Location and Bulb Type
Location Bulb Type Fixtures Bulbs per Fixture Annual Usage (kWh)
Pump Room LED 4ft. T8 Equivalents 17W 4 4 233
Chemical Room LED A Lamp 10 W 2 1 19
Backup Generator Room
Fluorescent T8 4ft. 32W 2 2 1
Well House 1 Incandescent A Lamp 100W 1 1 5
Well House 2 Incandescent A Lamp 100W 1 1 5
Total Energy Consumption 263
Major Equipment
Table 3.2 contains the details on each of the major electricity consuming mechanical components found
in the water treatment plant, well houses, and water storage tanks. Major equipment consumes
approximately 119,994 kWh annually constituting about 98.4% of the building’s current electrical
consumption.
Table 3.2: Major Equipment List
Major Equipment Purpose Rating Operating Schedule
Annual Energy Consumption
(kWh)
10 HP Pressure Pump
Provides pressure to water distribution loops to allow
proper circulation. 10 HP
Not in operation during site visit
0
15 HP Pressure Pump
Provides pressure to water distribution loops to allow
proper circulation. 15 HP
~19 hrs. per day standard, ~22 hrs. per day in fishing
season
81,321
SeaMetrics Flow Computer
Monitors flow of water through the treatment
process. 14.4 Watts Continuous 126
Chlorine Pump Injects chlorine into the raw
water from the wells. 432 Watts
Active when well pumps are running
1,940
Well Pump 1 Pumps water from the well into the water treatment
plant. 7.5 HP ~4.5 hrs. per day 9,192
Well Pump 2 Pumps water from the well into the water treatment
plant. 7.5 HP
~11 hrs. per day standard, ~16 hrs. per day in fishing
season
25,116
Wood Stave Heat Tape
Protects the water line between the water
treatment plant and the 200 Watts
Freeze prevention and recovery only
20

16
wood stave water storage tank from freezing.
Water Storage Tank Heat Tape
Protects the pressure transducer on 1 Mil Water Storage Tank from freezing
60 Watts Continuous 526
Water Storage Tank Panel Heater
Provides heat to the electrical components of the 1 Mil Water Storage Tank
control panel to allow proper operation.
200 Watts Continuous 1,753
Total Energy Consumption 119,994
Figure 7: 15 HP (left) and 10 HP (right) pressure pumps in the Pump Room in the Water Treatment Plant. The 10 HP pump is rarely used. The blue turbine at the top of the photo sends water to the fish processing plant.
Figure 8: Chlorine pump in the Chemical Injection Room at the Water Treatment Plant.

17
3.2PredictedEnergyUse
3.2.1EnergyUsage/Tariffs
The electric usage profile charts (below) represents the predicted electrical usage for the building. If
actual electricity usage records were available, the model used to predict usage was calibrated to
approximately match actual usage. The electric utility measures consumption in kilowatt‐hours (kWh) and
maximum demand in kilowatts (kW). One kWh usage is equivalent to 1,000 watts running for one hour.
One kW of electric demand is equivalent to 1,000 Watts running at a particular moment. The basic usage
charges are shown as generation service and delivery charges along with several non‐utility generation
charges.
The Alaska Village Electric Cooperative (AVEC) currently provides electricity to the residents of Yakutat as
well as to all public and commercial facilities. AVEC purchased the utility from Yakutat Power, Inc. after
the energy audit site visit.
The average cost of electricity is shown below in Table 3.3. This figure includes all surcharges, subsidies,
and utility customer charges:
Table 3.3: Energy Cost Rates for Each Fuel Type
Average Energy Cost (as of May 2017) Description Average Energy Cost Electricity $ 0.389/kWh
3.2.1.1TotalEnergyUseandCostBreakdown At 2017 rates, the City and Borough of Yakutat pays approximately $47,430 annually for electricity for the
Yakutat Water Treatment Plant, well houses, and water storage and distribution system. This figure does
not include utility subsidies such as PCE.
Figure 9 below reflects the estimated distribution of costs across the primary end uses of energy based
on the AkWarm© computer simulation. Comparing the “Retrofit” bar in the figure to the “Existing” bar
shows the potential savings from implementing all of the energy efficiency measures shown in this report.

18
Figure 9: Annual energy costs by end use. Figure 10 below shows how the annual energy cost of the building splits between the different fuels used
by the building. The “Existing” bar shows the breakdown for the building as it is now; the “Retrofit” bar
shows the predicted costs if all of the energy efficiency measures in this report are implemented.
Figure 10: Annual energy costs by fuel type. Figure 11 below addresses only space heating costs. The figure shows how each heat loss component
contributes to those costs; for example, the figure shows how much annual space heating cost is caused
by the heat loss through the walls and doors. For each component, the space heating cost for the existing
building is shown (blue bar) and the space heating cost assuming all retrofits are implemented (yellow
bar) are shown.
$0
$10,000
$20,000
$30,000
$40,000
$50,000
Existing Retrofit
Other ElectricalLightingSpace Heating
Annual Energy Costs by End Use

19
Figure 11: Annual space heating costs.
Note: The negative space heating savings is primarily due to removing the 15 HP distribution pump in the Water Treatment Plant pump room. AkWarm accounts for heat radiated from large appliances and electrical loads.
The tables below show AkWarm’s estimate of the monthly fuel use for each of the fuels used in the
building. For each fuel, the fuel use is broken down across the energy end uses.
Table 3.4: Estimated Electrical Consumption by Category
Electrical Consumption (kWh) Jan Feb Mar Apr May Jun Jul Aug Sept Oct Nov Dec
Space Heating 387 309 265 79 7 7 7 7 7 7 247 342
Lighting 23 21 22 22 22 22 22 22 22 23 22 23
Other Electrical
9,680 8,821 10,673 11,230 10,608 9,364 9,677 10,104 10,530 10,262 9,367 9,680
3.2.2EnergyUseIndex(EUI) Energy Use Index (EUI) is a measure of a building’s annual energy utilization per square foot of building.
This calculation is completed by converting all utility usage consumed by a building for one year, to British
Thermal Units (BTU) or kBTU, and dividing this number by the building square footage. EUI is a good
measure of a building’s energy use and is utilized regularly for comparison of energy performance for
similar building types. The Oak Ridge National Laboratory (ORNL) Buildings Technology Center under a
contract with the U.S. Department of Energy maintains a Benchmarking Building Energy Performance
Program. The ORNL website determines how a building’s energy use compares with similar facilities
throughout the U.S. and in a specific region or state.
Source use differs from site usage when comparing a building’s energy consumption with the national
average. Site energy use is the energy consumed by the building at the building site only. Source energy
use includes the site energy use as well as all of the losses to create and distribute the energy to the
building. Source energy represents the total amount of raw fuel that is required to operate the building.

20
It incorporates all transmission, delivery, and production losses, which allows for a complete assessment
of energy efficiency in a building. The type of utility purchased has a substantial impact on the source
energy use of a building. The U.S. Environmental Protection Agency (U.S. EPA) has determined that source
energy is the most comparable unit for evaluation purposes and overall global impact. Both the site and
source EUI ratings for the building are provided to understand and compare the differences in energy use.
The site and source EUIs for this building are calculated as follows. (See Table 3.5 for details):
Building Site EUI = (Electric Usage in kBTU + Fuel Usage in kBTU) Building Square Footage Building Source EUI = (Electric Usage in kBTU * SS Ratio + Fuel Usage in kBTU * SS Ratio) Building Square Footage where “SS Ratio” is the Source Energy to Site Energy ratio for the particular fuel.
Table 3.5: Building EUI Calculations for the Yakutat Water Treatment Plant
Energy Type Building Fuel Use per Year Site Energy Use per Year, kBTU
Source/Site Ratio
Source Energy Use per Year, kBTU
Electricity 121,929 kWh 416,143 3.340 1,389,918
Total 416,143 1,389,918
BUILDING AREA 319 Square Feet
BUILDING SITE EUI 1,305 kBTU/Ft²/Yr.
BUILDING SOURCE EUI 4,357 kBTU/Ft²/Yr.
* Site ‐ Source Ratio data is provided by the Energy Star Performance Rating Methodology for Incorporating Source Energy Use document issued March 2011.
Table 3.6: Building Benchmarks for the Yakutat Water Treatment Plant
Building Benchmarks
Description EUI
(kBTU/Sq. Ft.) EUI/HDD
(Btu/Sq. Ft./HDD) ECI
($/Sq. Ft.)
Existing Building 1,304.5 143.60 $148.68 With Proposed Retrofits 392.7 43.23 $44.76
EUI: Energy Use Intensity ‐ The annual site energy consumption divided by the structure’s conditioned area. EUI/HDD: Energy Use Intensity per Heating Degree Day. ECI: Energy Cost Index ‐ The total annual cost of energy divided by the square footage of the conditioned space in the building.

21
3.3AkWarm©BuildingSimulation
An accurate model of the building performance can be created by simulating the thermal performance of
the walls, roof, windows and floors of the building. Any heating and ventilation systems and central
heating plant are modeled as well, accounting for the outside air ventilation required by the building and
the heat recovery equipment in place.
The model uses local weather data and is trued up to historical energy use to ensure its accuracy. The
model can be used now and in the future to measure the utility bill impact of all types of energy projects,
including improving building insulation, modifying glazing, changing air handler schedules, increasing heat
recovery, installing high efficiency boilers, using variable air volume air handlers, adjusting outside air
ventilation and adding cogeneration systems.
For the purposes of this study, the Yakutat Water Treatment Plant was modeled using AkWarm© energy
use software to establish a baseline space heating energy usage. Climate data from Yakutat was used for
analysis. From this, the model was calibrated to predict the impact of theoretical energy savings measures.
Once annual energy savings from a particular measure were predicted and the initial capital cost was
estimated, payback scenarios were approximated.
Limitations of AkWarm© Models
1. The model is based on typical mean year weather data for Yakutat. This data represents the
average ambient weather profile as observed over approximately 30 years. As such, the gas and
electric profiles generated will not likely compare perfectly with actual energy billing information
from any single year. This is especially true for years with extreme warm or cold periods, or even
years with unexpectedly moderate weather.
2. The heating load model is a simple two‐zone model consisting of the building’s core interior
spaces and the building’s perimeter spaces. This simplified approach loses accuracy for buildings
that have large variations in heating loads across different parts of the building.
The energy balances shown in Section 3.1 were derived from the output generated by the AkWarm©
simulations.
4.ENERGYCOSTSAVINGMEASURES
4.1SummaryofResults
The energy saving measures are summarized in Table 4.1. Please refer to the individual measure
descriptions later in this report for more detail.

22
Table 4.1: Summary List of Recommended Energy Efficiency Measures Ranked by Economic Priority
PRIORITY LIST – ENERGY EFFICIENCY MEASURES
Rank Feature Improvement Description
Annual Energy Savings
Installed Cost
Savings to Investment Ratio, SIR1
Simple Payback (Years)2
CO2 Savings
1
Other Electrical:
Water Storage Tank Panel Heater
Turn down panel heater and use only in
extreme cold situations.
$583 $250 27.39 0.4 2,397.3
2
Plant Operations Upgrade:
15HP Pressure Pump
Removal
Remove wood stave tank from piping arrangement. Tie
piping together and plumb well pump
directly to distribution. Directly related to
recommendations 3, 7, 8, and 11.
$30,968 $44,245 10.23 1.4 127,372.9
3
Plant Operations Upgrade: Remove
Wood Stave Tank Heat
Tape
Remove wood stave tank from piping arrangement. Tie
piping together and plumb well pump
directly from well to distribution. Directly
related to recommendations 2, 7,
8, and 11.
$8 $13 3.77 1.6 32.6
4
Other Electrical:
Water Storage Tank Heat
Tape
Repair or replace thermostat for heat
tape. Shorten length of heat tape
$204 $1,035 2.32 5.1 839.9
5 Lighting: Well
House 1 Lighting
Replace with new, energy efficient, LED
equivalents.
$2 + $6 Maint. Savings
$30 2.00 3.9 7.0
6 Lighting: Well
House 2 Lighting
Replace with new, energy efficient, LED
equivalents.
$2 + $6 Maint. Savings
$30 2.00 3.9 7.1
7
Plant Operations Upgrade: Energy
Savings due to Water Loss Elimination
(Well Pump 1)
Remove wood stave tank from piping arrangement. Tie
piping together and plumb well pump
directly from well to distribution. Directly
related to recommendation 2, 3,
8, and 11.
$286 + $225 Maint. Savings3
$5,003 1.50 9.8 1,176.6

23
PRIORITY LIST – ENERGY EFFICIENCY MEASURES
Rank Feature Improvement Description
Annual Energy Savings
Installed Cost
Savings to Investment Ratio, SIR1
Simple Payback (Years)2
CO2 Savings
8
Plant Operations Upgrade: Energy
Savings due to Water Loss Elimination
(Well Pump 2)
Remove wood stave tank from piping arrangement. Tie
piping together and plumb well pump
directly from well to distribution. Directly
related to recommendations 2, 3,
7, and 11.
$782 + $225 Maint. Savings3
$13,665 1.08 13.6 3,214.8
9 Heating and Insulation:
Well House 1
Install programmable thermostat to maintain temperature. Install R‐
14 rigid board insulation on walls, ceiling, and floor. Replace door with
insulated door. Reduce air leakage through well house building shell upgrades.
$144 + $565 Maint. Savings4
$4,800 1.03 6.8 592.4
10 Heating and Insulation:
Well House 2
Replace existing non‐functional electric heater with similar‐sized model that is thermostatically
controlled. Install R‐14 rigid board insulation on walls, ceiling, and floor. Replace door with insulated door. Reduce air leakage through well house
building shell upgrades.
$144 + $566 Maint. Savings4
$5,100 0.98 7.2 592.4
11
Plant Operations Upgrade: Energy
Savings due to Water Loss Elimination (Chlorine Pump)
Remove wood stave tank from piping arrangement. Tie
piping together and plumb well pump
directly from well to distribution. Directly
related to recommendation 2, 3,
7, and 8.
$31 $2,060 0.22 65.6 129.2
TOTAL, all measures
$33,153 + $1,593 Maint. Savings
$76,232 6.49 2.2 136,362.2

24
Table Notes:
1 Savings to Investment Ratio (SIR) is a life‐cycle cost measure calculated by dividing the total savings over the life of a project (expressed in today’s dollars) by its investment costs. The SIR is an indication of the profitability of a measure; the higher the SIR, the more profitable the project. An SIR greater than 1.0 indicates a cost‐effective project (i.e. more savings than cost). Remember that this profitability is based on the position of that Energy Efficiency Measure (EEM) in the overall list and assumes that the measures above it are implemented first.
2 Simple Payback (SP) is a measure of the length of time required for the savings from an EEM to payback the investment cost, not counting interest on the investment and any future changes in energy prices. It is calculated by dividing the investment cost by the expected first‐year savings of the EEM. 3 The maintenance savings figure in the Plant Operations Upgrade EEMs captures the energy and chemical treatment costs saved by eliminating the water loss at the Wood Stave Tank. At the estimated water loss rate of 10 gallons per minute, approximately 131 pounds of chlorine is wasted every year. The savings from removing the wood stave tank is split between the two well pumps based on their pumping rates. 4 The maintenance savings figure in the Well House Heating and Insulation EEMs captures an estimated 30% reduction in electrical usage for space heating by installing temperature‐controlled thermostats for the electric space heaters.
4.2InteractiveEffectsofProjects
The savings for a particular measure are calculated assuming all recommended EEMs coming before that
measure in the list are implemented. If some EEMs are not implemented, savings for the remaining EEMs
will be affected. For example, if ceiling insulation is not added, then savings from a project to replace the
heating system will be increased, because the heating system for the building supplies a larger load.
In general, all projects are evaluated sequentially so energy savings associated with one EEM would not
also be attributed to another EEM. By modeling the recommended project sequentially, the analysis
accounts for interactive affects among the EEMs and does not “double count” savings.
Interior lighting, electric loads, facility equipment, and occupants generate heat within the building.
Lighting‐efficiency improvements are anticipated to slightly increase heating requirements. Heating
penalties benefits were included in the lighting project analysis.
4.3Electrical&ApplianceMeasures
4.3.1LightingMeasures
The goal of this section is to present any lighting energy conservation measures that may also be cost
beneficial. It should be noted that replacing current bulbs with more energy‐efficient equivalents will
have a small effect on the building heating and cooling loads. The building heating load will see a small
increase, as the more energy efficient bulbs give off less heat.

25
4.3.1aLightingMeasures–ReplaceExistingFixtures/Bulbs
4.3.2OtherElectricalMeasures
Rank Location Existing Condition Recommendation
5 Well House 1 Lighting INCAN A Lamp, Std 100W Replace with new, energy efficient, LED equivalents.
Installation Cost $30 Estimated Life of Measure (yrs) 9 Energy Savings ($/yr) $2
Breakeven Cost $60 Simple Payback (yrs) 4 Energy Savings (MMBTU/yr) 0.0 MMBTU
Savings‐to‐Investment Ratio 2.0 Maintenance Savings ($/yr) $6
Auditors Notes: Replace the bulb with a 12 W LED equivalent.
Rank Location Existing Condition Recommendation
6 Well House 2 Lighting INCAN A Lamp, Std 100W Replace with new, energy efficient, LED equivalents.
Installation Cost $30 Estimated Life of Measure (yrs) 9 Energy Savings ($/yr) $2
Breakeven Cost $60 Simple Payback (yrs) 4 Energy Savings (MMBTU/yr) 0.0 MMBTU
Savings‐to‐Investment Ratio 2.0 Maintenance Savings ($/yr) $6
Auditors Notes: Replace the bulb with a 12 W LED equivalent.
Rank Location Description of Existing Efficiency Recommendation
1 Water Storage Tank Panel Heater
Electric Heater Turn down panel heater at the 1 Mil Tank and use only in extreme cold situations.
Installation Cost $250 Estimated Life of Measure (yrs) 15 Energy Savings ($/yr) $583
Breakeven Cost $6,847 Simple Payback (yrs) 0 Energy Savings (MMBTU/yr) 5.1 MMBTU
Savings‐to‐Investment Ratio 27.4
Auditors Notes: Turn down panel heater and use only in extreme cold situations.
Rank Location Description of Existing Efficiency Recommendation
2 Plant Operations Upgrade: 15HP Pressure Pump Removal
Baldor Industrial Motor (15 HP) Remove wood stave tank from piping arrangement. Tie piping together and pump directly from well to distribution. Directly related to recommendations 3, 7, 8, and 11.
Installation Cost $44,245 Estimated Life of Measure (yrs) 20 Energy Savings ($/yr) $30,968
Breakeven Cost $452,439 Simple Payback (yrs) 1 Energy Savings (MMBTU/yr) 271.7 MMBTU
Savings‐to‐Investment Ratio 10.2
Auditors Notes: Approximately 10 gallons per minute of water is lost at the wood stave tank, amounting to 8.2% of the water production (estimated at 122 GPM in May 2017). The cost of the retrofit is a portion of the estimated $50,000 for an engineering plan set, permitting process, and State of Alaska DEC approval; $10,000 for the retrofit itself; and $4980 for labor costs. This retrofit cost is distributed between the chlorine pump, both well pumps, the 15HP pressure pump, and the Wood Stave heat tape based on their electrical consumption at the time of the onsite visit. The maintenance cost is the amount of electricity saved by using the pump 8.2% less (based on electrical prices in May 2017).

26
Rank Location Description of Existing Efficiency Recommendation
3 Plant Operations Upgrade: Remove Wood Stave Tank Heat Tape
Heat Tape‐ approximately 40 feet at 5W/ft. Remove wood stave tank from piping arrangement. Tie piping together and pump directly from well to distribution. Directly related to recommendations 2, 7, 8, and 11.
Installation Cost $13 Estimated Life of Measure (yrs) 7 Energy Savings ($/yr) $8
Breakeven Cost $49 Simple Payback (yrs) 2 Energy Savings (MMBTU/yr) 0.1 MMBTU
Savings‐to‐Investment Ratio 3.8
Auditors Notes: Approximately 10 gallons per minute of water is lost at the wood stave tank, amounting to 8.2% of the water production (estimated at 122 GPM in May 2017). The cost of the retrofit is a portion of the estimated $50,000 for an engineering plan set, permitting process, and State of Alaska DEC approval. This retrofit cost is distributed between the chlorine pump, both well pumps, the 15HP pressure pump, and the Wood Stave heat tape based on their electrical consumption at the time of the onsite visit. The maintenance cost is the amount of electricity saved by using the pump 8.2% less (based on electrical prices in May 2017). This savings is applied only to the chlorine pump and the two well pumps.
Rank Location Description of Existing Efficiency Recommendation
4 Other Electrical: Water Storage Tank Heat Tape
Heat Tape‐ approximately12 feet at 5W/ft. Repair thermostat for heat tape and eliminate unnecessary heat tape usage. Use only for emergency thaw purposes.
Installation Cost $1,035 Estimated Life of Measure (yrs) 15 Energy Savings ($/yr) $204
Breakeven Cost $2,399 Simple Payback (yrs) 5 Energy Savings (MMBTU/yr) 1.8 MMBTU
Savings‐to‐Investment Ratio 2.3
Auditors Notes: The wood stave tank is not needed for contact time for chlorine and the pressure pumps provide enough pressure for system distribution. The 1 Mil gallon water storage tank is the primary water storage location, so the wood stave tank is unnecessary. Additionally, with the wood stave tank leaking an estimated 10 GPM of treated water, this leads to excessive pumping and chemical costs. Assume this avoids 10 GPM of leaks, which results in 131 lbs. of chlorine waste. This is divided between both well pumps.
Rank Location Description of Existing Efficiency Recommendation
7 Plant Operations Upgrade: Energy Savings due to Water Loss Elimination (Well Pump 1)
Franklin Electric Submersible Pump (7.5 HP) Remove wood stave tank from piping arrangement. Tie piping together and pump directly from well to distribution. Directly related to recommendation 2, 3, 8, and 11.
Installation Cost $5,003 Estimated Life of Measure (yrs) 20 Energy Savings ($/yr) $286
Breakeven Cost $7,527 Simple Payback (yrs) 10 Energy Savings (MMBTU/yr) 2.5 MMBTU
Savings‐to‐Investment Ratio 1.5 Maintenance Savings ($/yr) $225
Auditors Notes: Remove the wood stave tank from piping arrangement. Tie piping together and pump directly from well to distribution. Assume this avoids 10 GPM of leaks, resulting in 131 lbs. of chlorine waste. This cost savings is divided between both Well Pumps 1 and 2 as maintenance savings. Approximately 10 gallons per minute of water is lost at the wood stave tank, amounting to 8.2% of the water production (estimated at 122 GPM in May 2017). The cost of the retrofit is a portion of the estimated $50,000 for an engineering plan set, permitting process, and State of Alaska DEC approval; $10,000 for the retrofit itself; and $4980 for labor costs. This retrofit cost is distributed between the chlorine pump, both well pumps, the 15HP pressure pump, and the Wood Stave heat tape based on their electrical consumption at the time of the onsite visit. The maintenance cost is the amount of electricity saved by using the pump 8.2% less (based on electrical prices in May 2017).

27
Rank Location Description of Existing Efficiency Recommendation
8 Plant Operations Upgrade: Energy Savings due to Water Loss Elimination (Well Pump 2)
Franklin Electric Submersible Pump (7.5 HP) Remove wood stave tank from piping arrangement. Tie piping together and pump directly from well to distribution. Directly related to recommendations 2, 3, 7, and 11.
Installation Cost $13,665 Estimated Life of Measure (yrs) 20 Energy Savings ($/yr) $782
Breakeven Cost $14,767 Simple Payback (yrs) 14 Energy Savings (MMBTU/yr) 6.9 MMBTU
Savings‐to‐Investment Ratio 1.1 Maintenance Savings ($/yr) $225
Auditors Notes: Remove the wood stave tank from piping arrangement. Tie piping together and pump directly from well to distribution. Assume this avoids 10 GPM of leaks, resulting in 131 lbs. of chlorine waste. This cost savings is divided between both Well Pumps 1 and 2 as maintenance savings. Approximately 10 gallons per minute of water is lost at the wood stave tank, amounting to 8.2% of the water production (estimated at 122 GPM in May 2017). The cost of the retrofit is a portion of the estimated $50,000 for an engineering plan set, permitting process, and State of Alaska DEC approval; $10,000 for the retrofit itself; and $4980 for labor costs. This retrofit cost is distributed between the chlorine pump, both well pumps, the 15HP pressure pump, and the Wood Stave heat tape based on their electrical consumption at the time of the onsite visit. The maintenance cost is the amount of electricity saved by using the pump 8.2% less (based on electrical prices in May 2017).
Rank Location Description of Existing Efficiency Recommendation
11 Plant Operations Upgrade: Energy Savings due to Water Loss Elimination (Chlorine Pump)
LMI Milton Roy Model C141‐36. 20.00 GPH max. Speed set to “15”.
Remove wood stave tank from piping arrangement. Tie piping together and pump directly from well to distribution. Directly related to recommendation 2, 3, 7, and 8.
Installation Cost $2,060 Estimated Life of Measure (yrs) 20 Energy Savings ($/yr) $31
Breakeven Cost $459 Simple Payback (yrs) 66 Energy Savings (MMBTU/yr) 0.3 MMBTU
Savings‐to‐Investment Ratio 0.2
Auditors Notes: Remove the wood stave tank from piping arrangement. Tie piping together and pump directly from well to distribution. Approximately 10 gallons per minute of water is lost at the wood stave tank, amounting to 8.2% of the water production (estimated at 122 GPM in May 2017). The cost of the retrofit is a portion of the estimated $50,000 for an engineering plan set, permitting process, and State of Alaska DEC approval; $10,000 for the retrofit itself; and $4980 for labor costs. This retrofit cost is distributed between the chlorine pump, both well pumps, the 15HP pressure pump, and the Wood Stave heat tape based on their electrical consumption at the time of the onsite visit. The maintenance cost is the amount of electricity saved by using the pump 8.2% less (based on electrical prices in May 2017).

28
4.3.3OtherMeasures
Rank Location Description of Existing Efficiency Recommendation
9 Heating and Insulation: Well House 1 Install programmable thermostat to maintain proper temperature in real time. Install R‐14 rigid board insulation on walls, ceiling, and floor. Replace door with insulated door. Reduce air leakage through well house building shell upgrades.
Installation Cost $4,800 Estimated Life of Measure (yrs) 8 Energy Savings ($/yr) $144
Breakeven Cost $4,968 Simple Payback (yrs) 7 Energy Savings (MMBTU/yr) 1.3 MMBTU
Savings‐to‐Investment Ratio 1.0 Maintenance Savings ($/yr) $565
Auditors Notes: All of the insulation measures will reduce the overall heat demand of the well house and make the space more efficient for heating purposes. The programmable thermostat will prevent the well house from being heated more than necessary to prevent freezing problems.
Rank Location Description of Existing Efficiency Recommendation
10 Heating and Insulation: Well House 2 Replace existing non‐functional electric heater with similar‐sized model that is thermostatically controlled. Install R‐14 Rigid board insulation on walls, ceiling, and floor. Replace door with insulated door. Reduce air leakage through well house building shell upgrades.
Installation Cost $5,100 Estimated Life of Measure (yrs) 8 Energy Savings ($/yr) $144
Breakeven Cost $4,975 Simple Payback (yrs) 7 Energy Savings (MMBTU/yr) 1.3 MMBTU
Savings‐to‐Investment Ratio 1.0 Maintenance Savings ($/yr) $566
Auditors Notes: All of the insulation measures will reduce the overall heat demand of the well house and make the space more efficient for heating purposes. An electric space heater with a programmable thermostat will prevent the well house from being heated more than necessary to prevent freezing problems.

29
5.ENERGYEFFICIENCYACTIONPLAN Through inspection of the energy‐using equipment on‐site and discussions with site facilities personnel,
this energy audit has identified several energy‐saving measures. The measures will reduce the amount of
fuel burned and electricity used at the site. The projects will not degrade the performance of the building
and, in some cases, will improve it.
Several types of EEMs can be implemented immediately by building staff, and others will require various
amounts of lead time for engineering and equipment acquisition. In some cases, there are logical
advantages to implementing EEMs concurrently. For example, if the same electrical contractor is used to
install both lighting equipment and motors, implementation of these measures should be scheduled to
occur simultaneously.
In the near future, a representative of ANTHC will be contacting the City and Borough of Yakutat to follow
up on the recommendations made in this report. ANTHC will provide assistance in understanding the
report and implementing the recommendations as desired by the City and Borough.

30
APPENDICES
AppendixA–ScannedEnergyBillingData1. Electricity Billing Data
Utility: AVEC (previously Yakutat Power, Inc.) Reading: Monthly Units: kWh
Month Water Treatment
Plant1 1 Mil Tank
June 2016 8,080 982
July 2016 9,040 825
August 2016 11,000 1,178
September 2016 10,000 1,867
October 2016 9,160 2,813
November 2016 6,720 2,673
December 2016 8,720 2,201
January 2017 10,440 2,666
February 2017 10,480 2,150
March 2017 14,080 2,756
April 2017 16,040 1,967
May 2017 11,640 4,177
1 Water Treatment Plant electrical data includes both well houses, the well pumps, the distribution pumps and
controls, the chemical add room loads, and the wood stave tank heat tape.

31
AppendixB–EnergyAuditReport–ProjectSummary
ENERGY AUDIT REPORT – PROJECT SUMMARY General Project Information PROJECT INFORMATION AUDITOR INFORMATION
Building: Yakutat Water Treatment Plant (CBY Arco Well)
Auditor Company: Alaska Native Tribal Health Consortium
Address: Water Tank Rd (off of Ocean Cape Rd.)
Auditor Name: Cody Uhlig and Kelli Whelan
City: Yakutat Auditor Address: 4500 Diplomacy Drive Anchorage, AK 99508 Client Name: Jon Erikson, EdD
Client Address: P.O. Box 160 Yakutat, AK 99689
Auditor Phone: (907) 729‐3589
Auditor FAX: (907) 729‐4047
Client Phone: (907) 784‐3323 Auditor Comment:
Client FAX: (907) 784‐3281
Design Data
Building Area: 319 square feet Design Indoor Temperature: 55 deg F (building average)
Typical Occupancy: 2 people Design Outdoor Temperature: 2.1 deg F
Actual City: Yakutat Heating Degree Days: 9,084 deg F‐days
Weather/Fuel City: Yakutat
Utility Information
Electric Utility: Alaska Village Electric Cooperative
Average Annual Cost/kWh: $0.389/kWh
Annual Energy Cost Estimate Description Space Heating Lighting Other Electrical Total Cost
Existing Building $650 $103 $46,678 $47,430
With Proposed Retrofits $1,057 $99 $13,121 $14,277
Savings ‐$407 $3 $33,557 $33,153
Building Benchmarks
Description EUI
(kBTU/Sq. Ft.) EUI/HDD
(Btu/Sq. Ft./HDD) ECI
($/Sq. Ft.)
Existing Building 1,304.5 143.60 $148.68
With Proposed Retrofits 392.7 43.23 $44.76
EUI: Energy Use Intensity ‐ The annual site energy consumption divided by the structure’s conditioned area. EUI/HDD: Energy Use Intensity per Heating Degree Day. ECI: Energy Cost Index ‐ The total annual cost of energy divided by the square footage of the conditioned space in the building.

32
AppendixC–PhotographsfromAkWarmProgram
Figure 12: Wood Stave Tank (left). Yakutat Water Treatment Plant exterior (right).
Figure 13: Well house exterior (door is open). Both well houses are identical structures.

33
Figure 14: Water Treatment Plant Pump Room interior.
Figure 15: Chemical Injection Room interior. The ceramic unit heater is the square object attached to the ceiling.

34
AppendixD–ActualFuelUseversusModeledFuelUse
The graphs below show the modeled energy usage results of the energy audit process compared to the
actual energy usage report data. The model was completed using AkWarm modeling software. The
orange bars show actual fuel use, and the blue bars are AkWarm’s prediction of fuel use.
Annual Energy Use
Electricity Use
Note on Electricity Use: the higher usage rate in March through May 2017 appeared to be an anomaly when
compared to data from previous years (2016 and 2015).

35
AppendixE‐ElectricalDemands
Estimated Peak Electrical Demand (kW) Jan Feb Mar Apr May Jun Jul Aug Sep Oct Nov Dec
Current 26.2 25.5 24.9 24.4 24.3 24.3 24.3 24.3 24.3 24.3 24.3 23.9
As Proposed 15.6 14.6 13.7 13.0 12.7 12.7 12.7 12.7 12.7 12.8 12.6 11.8
‐‐‐‐‐‐‐‐‐‐‐‐‐‐‐‐‐‐‐‐‐‐‐‐‐‐‐‐‐‐‐‐‐‐‐‐‐‐‐‐‐‐ AkWarmCalc Ver 2.8.0.0, Energy Lib 3/3/2017