yapı kredi 9m15 investor presentation resilient commercial
TRANSCRIPT
November 2015
Resilient commercial performance in a challenging environment
Yapı Kredi 9M15 Investor Presentation
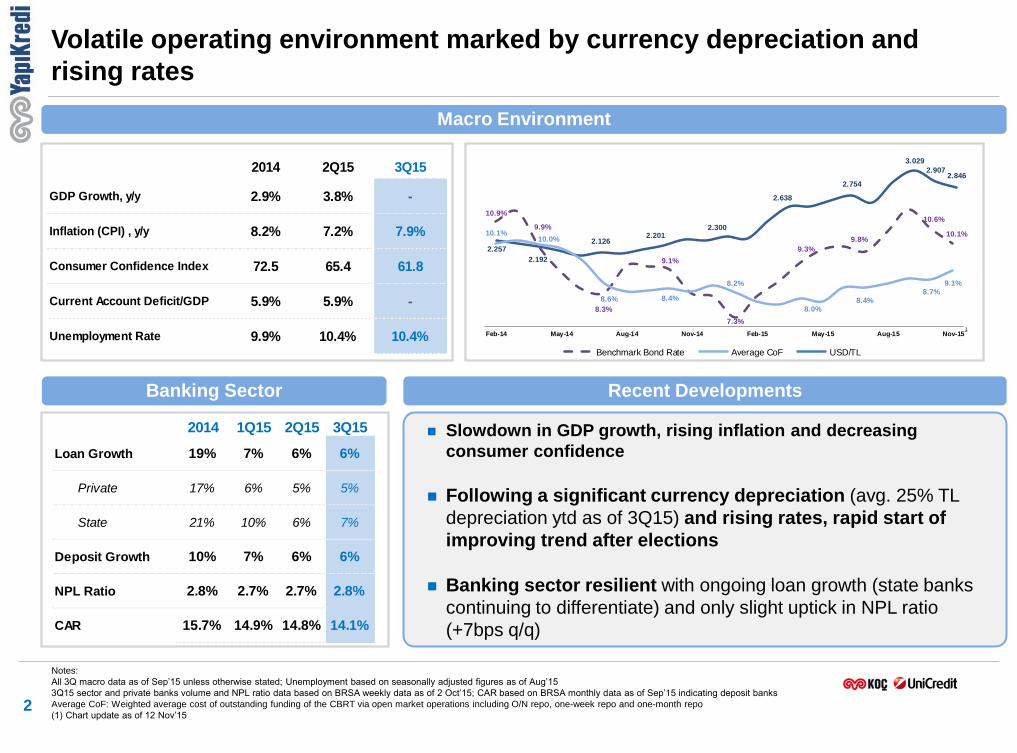
2014 2Q15 3Q15
GDP Growth, y/y 2.9% 3.8% -
Inflation (CPI) , y/y 8.2% 7.2% 7.9%
Consumer Confidence Index 72.5 65.4 61.8
Current Account Deficit/GDP 5.9% 5.9% -
Unemployment Rate 9.9% 10.4% 10.4%
Slowdown in GDP growth, rising inflation and decreasing
consumer confidence
Following a significant currency depreciation (avg. 25% TL
depreciation ytd as of 3Q15) and rising rates, rapid start of
improving trend after elections
Banking sector resilient with ongoing loan growth (state banks
continuing to differentiate) and only slight uptick in NPL ratio
(+7bps q/q)
2
Notes:
All 3Q macro data as of Sep’15 unless otherwise stated; Unemployment based on seasonally adjusted figures as of Aug’15
3Q15 sector and private banks volume and NPL ratio data based on BRSA weekly data as of 2 Oct’15; CAR based on BRSA monthly data as of Sep’15 indicating deposit banks
Average CoF: Weighted average cost of outstanding funding of the CBRT via open market operations including O/N repo, one-week repo and one-month repo
(1) Chart update as of 12 Nov’15
Volatile operating environment marked by currency depreciation and
rising rates
Banking Sector
Macro Environment
Recent Developments
2014 1Q15 2Q15 3Q15
Loan Growth 19% 7% 6% 6%
Private 17% 6% 5% 5%
State 21% 10% 6% 7%
Deposit Growth 10% 7% 6% 6%
NPL Ratio 2.8% 2.7% 2.7% 2.8%
CAR 15.7% 14.9% 14.8% 14.1%
2.257
2.192
2.1262.201
2.300
2.638
2.754
3.029
2.9072.846
10.9%
9.9%
8.3%
9.1%
7.3%
9.3%
9.8%
10.6%
10.1%10.1%10.0%
8.6% 8.4%
8.2%
8.0%8.4%
8.7%
9.1%
Feb-14 May-14 Aug-14 Nov-14 Feb-15 May-15 Aug-15 Nov-15
Benchmark Bond Rate Average CoF USD/TL
1
3
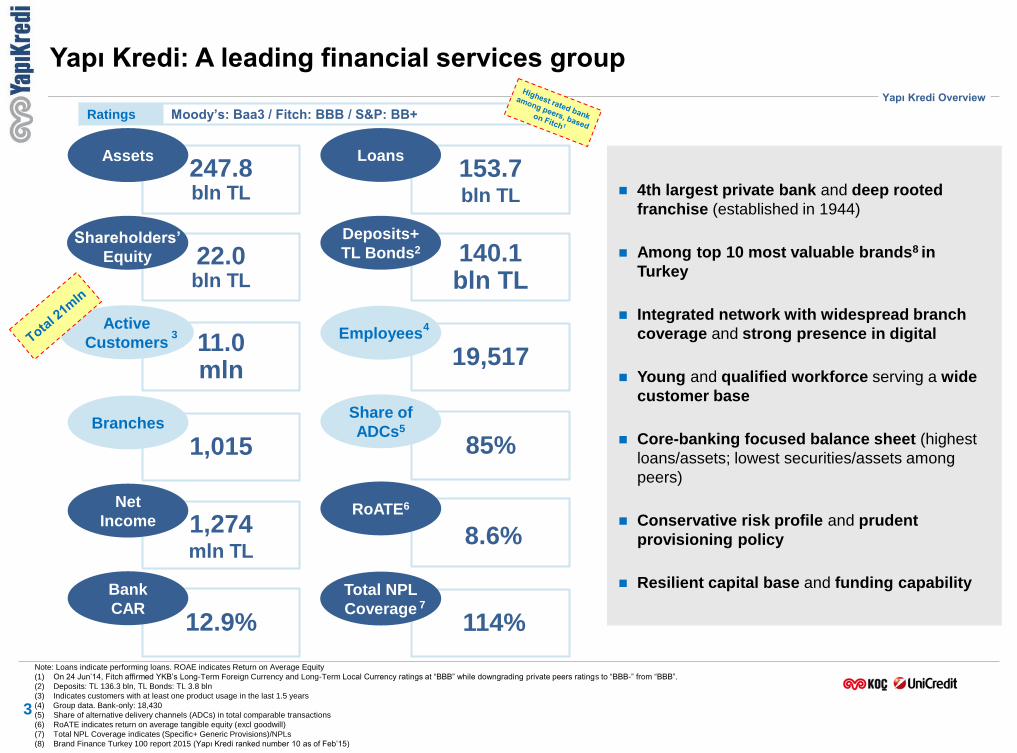
Yapı Kredi: A leading financial services group
247.8 bln TL
Assets 153.7 bln TL
Loans
140.1 bln TL
Deposits+
TL Bonds2
1,274 mln TL
Net
Income
22.0 bln TL
12.9%
Bank
CAR
11.0 mln
Active
Customers
1,015 Branches
85%
Share of
ADCs5
19,517 Employees
RoATE6
114%
Total NPL
Coverage
Ratings Moody’s: Baa3 / Fitch: BBB / S&P: BB+
4th largest private bank and deep rooted
franchise (established in 1944)
Among top 10 most valuable brands8 in
Turkey
Integrated network with widespread branch
coverage and strong presence in digital
Young and qualified workforce serving a wide
customer base
Core-banking focused balance sheet (highest
loans/assets; lowest securities/assets among
peers)
Conservative risk profile and prudent
provisioning policy
Resilient capital base and funding capability
Shareholders’
Equity
Yapı Kredi Overview
8.6%
Note: Loans indicate performing loans. ROAE indicates Return on Average Equity
(1) On 24 Jun’14, Fitch affirmed YKB’s Long-Term Foreign Currency and Long-Term Local Currency ratings at “BBB” while downgrading private peers ratings to “BBB-” from “BBB”.
(2) Deposits: TL 136.3 bln, TL Bonds: TL 3.8 bln
(3) Indicates customers with at least one product usage in the last 1.5 years
(4) Group data. Bank-only: 18,430
(5) Share of alternative delivery channels (ADCs) in total comparable transactions
(6) RoATE indicates return on average tangible equity (excl goodwill)
(7) Total NPL Coverage indicates (Specific+ Generic Provisions)/NPLs
(8) Brand Finance Turkey 100 report 2015 (Yapı Kredi ranked number 10 as of Feb’15)
3 4
7
11.4%
10.5%
10.5%
9.9%
9.1%
9.0%
8.8%
14.7%
12.5%
21.4%
19.4%
18.0%
9.9%
6.4%
9.7%
18.2%
17.4%
11.8%
17.5%
6.4%
7.1%
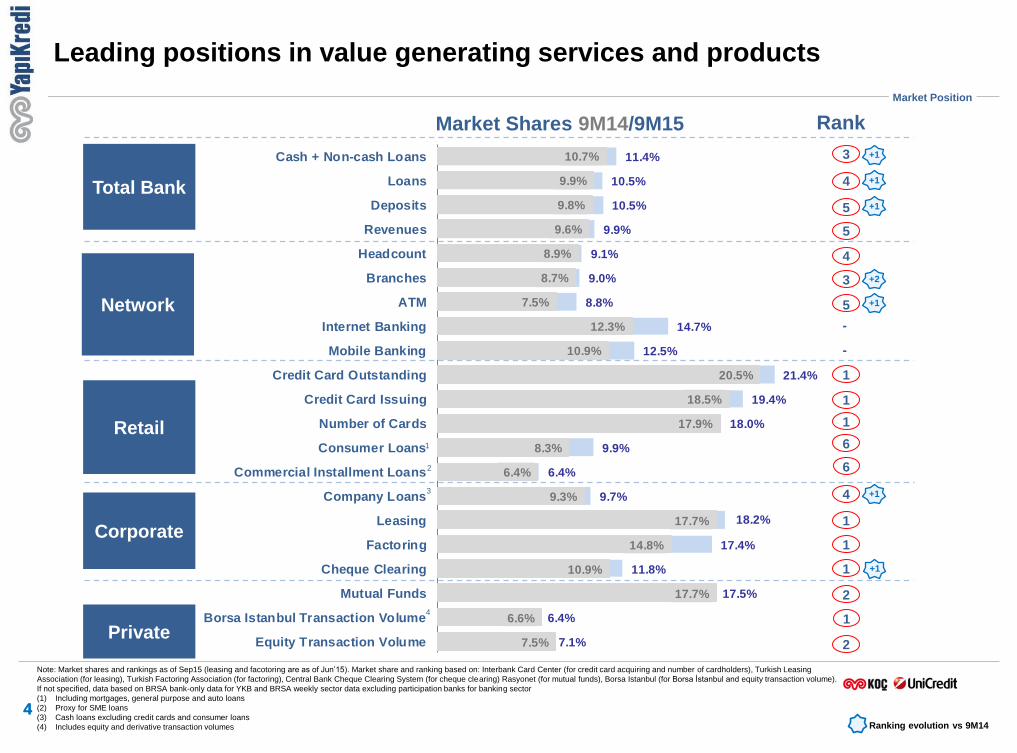
Cash + Non-cash Loans
Loans
Deposits
Revenues
Headcount
Branches
ATM
Internet Banking
Mobile Banking
Credit Card Outstanding
Credit Card Issuing
Number of Cards
Consumer Loans
Commercial Installment Loans
Company Loans
Leasing
Factoring
Cheque Clearing
Mutual Funds
Borsa Istanbul Transaction Volume
Equity Transaction Volume
10.7%
9.9%
9.8%
9.6%
8.9%
8.7%
7.5%
12.3%
10.9%
20.5%
18.5%
17.9%
8.3%
6.4%
9.3%
17.7%
14.8%
10.9%
17.7%
6.6%
7.5%
4 4
Note: Market shares and rankings as of Sep15 (leasing and facotoring are as of Jun’15). Market share and ranking based on: Interbank Card Center (for credit card acquiring and number of cardholders), Turkish Leasing
Association (for leasing), Turkish Factoring Association (for factoring), Central Bank Cheque Clearing System (for cheque clearing) Rasyonet (for mutual funds), Borsa Istanbul (for Borsa İstanbul and equity transaction volume).
If not specified, data based on BRSA bank-only data for YKB and BRSA weekly sector data excluding participation banks for banking sector
(1) Including mortgages, general purpose and auto loans
(2) Proxy for SME loans
(3) Cash loans excluding credit cards and consumer loans
(4) Includes equity and derivative transaction volumes
Total Bank
Retail
Private
Corporate
Rank Market Shares
Leading positions in value generating services and products
Market Position
Network
Ranking evolution vs 9M14
2
1
9M14/9M15
4
3
5
4
5 +1
+2
-
-
1
1
1
6
6
1
1
1
2
2
3 +1
4 +1
+1
5
3
+1
+1
1 4
5%
23% 32%
15%
3%
12%
20%
27%
1%
3%
25%
41%
32%17%
9%
25%31%
24%
57%
Revenues Loans Deposits AssetsUnder
Management
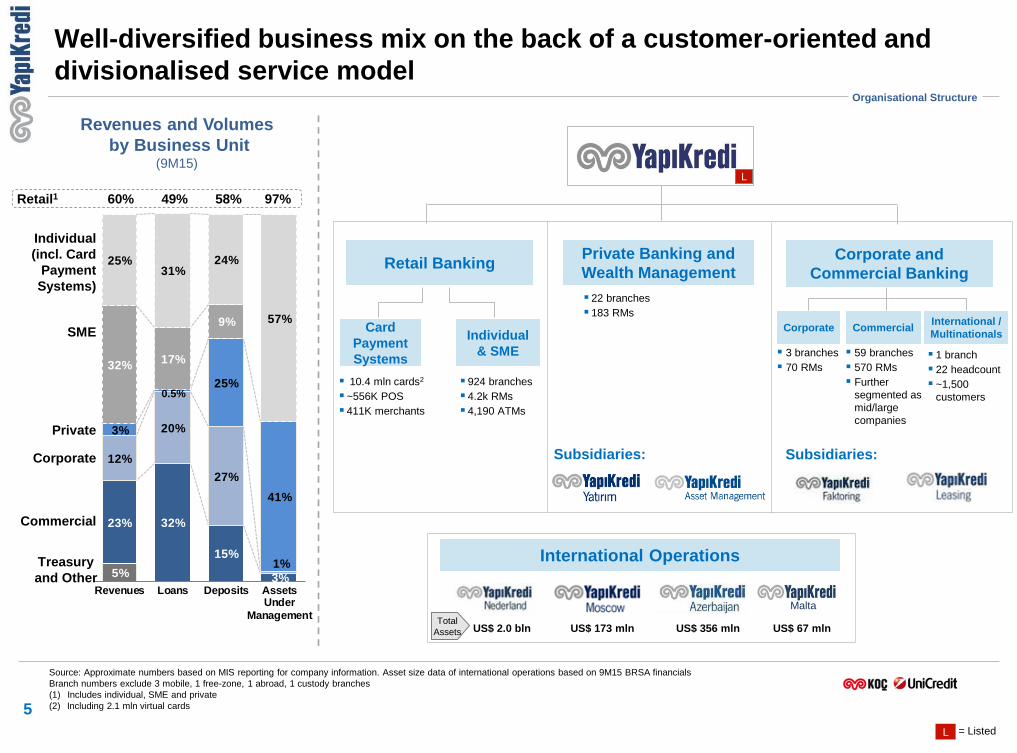
Well-diversified business mix on the back of a customer-oriented and
divisionalised service model
5
Revenues and Volumes
by Business Unit
(9M15)
SME
Private
Corporate
Commercial
Treasury
and Other
Individual
(incl. Card
Payment
Systems)
Retail1 60% 49%
Private Banking and
Wealth Management
Subsidiaries:
International Operations
Corporate and
Commercial Banking
Commercial Corporate
Retail Banking
Individual
& SME
Card
Payment
Systems
US$ 356 mln US$ 173 mln US$ 2.0 bln
10.4 mln cards2
~556K POS
411K merchants
924 branches
4.2k RMs
4,190 ATMs
3 branches
70 RMs
59 branches
570 RMs
Further
segmented as
mid/large
companies
22 branches
183 RMs
Total
Assets
International /
Multinationals
Source: Approximate numbers based on MIS reporting for company information. Asset size data of international operations based on 9M15 BRSA financials
Branch numbers exclude 3 mobile, 1 free-zone, 1 abroad, 1 custody branches
(1) Includes individual, SME and private
(2) Including 2.1 mln virtual cards
1 branch
22 headcount
~1,500
customers
58%
Organisational Structure
97%
Subsidiaries:
Malta
US$ 67 mln
L
L = Listed
0.5%
d
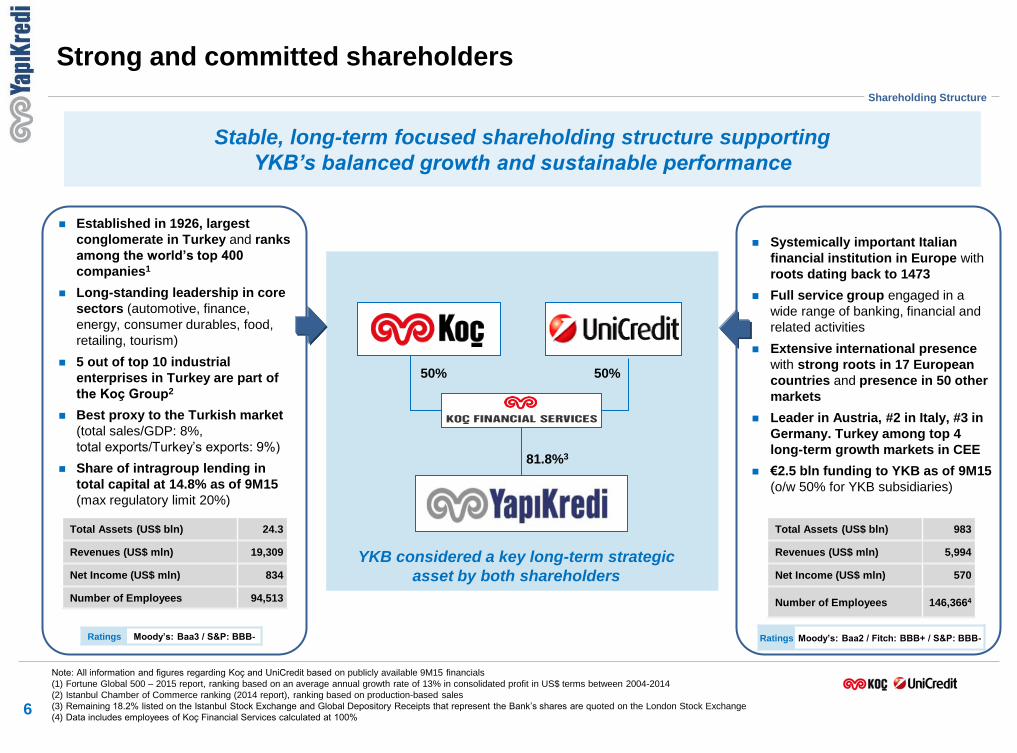
Strong and committed shareholders
50% 50%
81.8%3
Note: All information and figures regarding Koç and UniCredit based on publicly available 9M15 financials
(1) Fortune Global 500 – 2015 report, ranking based on an average annual growth rate of 13% in consolidated profit in US$ terms between 2004-2014
(2) Istanbul Chamber of Commerce ranking (2014 report), ranking based on production-based sales
(3) Remaining 18.2% listed on the Istanbul Stock Exchange and Global Depository Receipts that represent the Bank’s shares are quoted on the London Stock Exchange
(4) Data includes employees of Koç Financial Services calculated at 100% 6
Established in 1926, largest
conglomerate in Turkey and ranks
among the world’s top 400
companies1
Long-standing leadership in core
sectors (automotive, finance,
energy, consumer durables, food,
retailing, tourism)
5 out of top 10 industrial
enterprises in Turkey are part of
the Koç Group2
Best proxy to the Turkish market
(total sales/GDP: 8%,
total exports/Turkey’s exports: 9%)
Share of intragroup lending in
total capital at 14.8% as of 9M15
(max regulatory limit 20%)
Stable, long-term focused shareholding structure supporting
YKB’s balanced growth and sustainable performance
Systemically important Italian
financial institution in Europe with
roots dating back to 1473
Full service group engaged in a
wide range of banking, financial and
related activities
Extensive international presence
with strong roots in 17 European
countries and presence in 50 other
markets
Leader in Austria, #2 in Italy, #3 in
Germany. Turkey among top 4
long-term growth markets in CEE
€2.5 bln funding to YKB as of 9M15
(o/w 50% for YKB subsidiaries)
YKB considered a key long-term strategic
asset by both shareholders
Total Assets (US$ bln) 24.3
Revenues (US$ mln) 19,309
Net Income (US$ mln) 834
Number of Employees 94,513
Shareholding Structure
Ratings Moody’s: Baa3 / S&P: BBB- Ratings Moody’s: Baa2 / Fitch: BBB+ / S&P: BBB-
Total Assets (US$ bln) 983
Revenues (US$ mln) 5,994
Net Income (US$ mln) 570
Number of Employees 146,3664
7
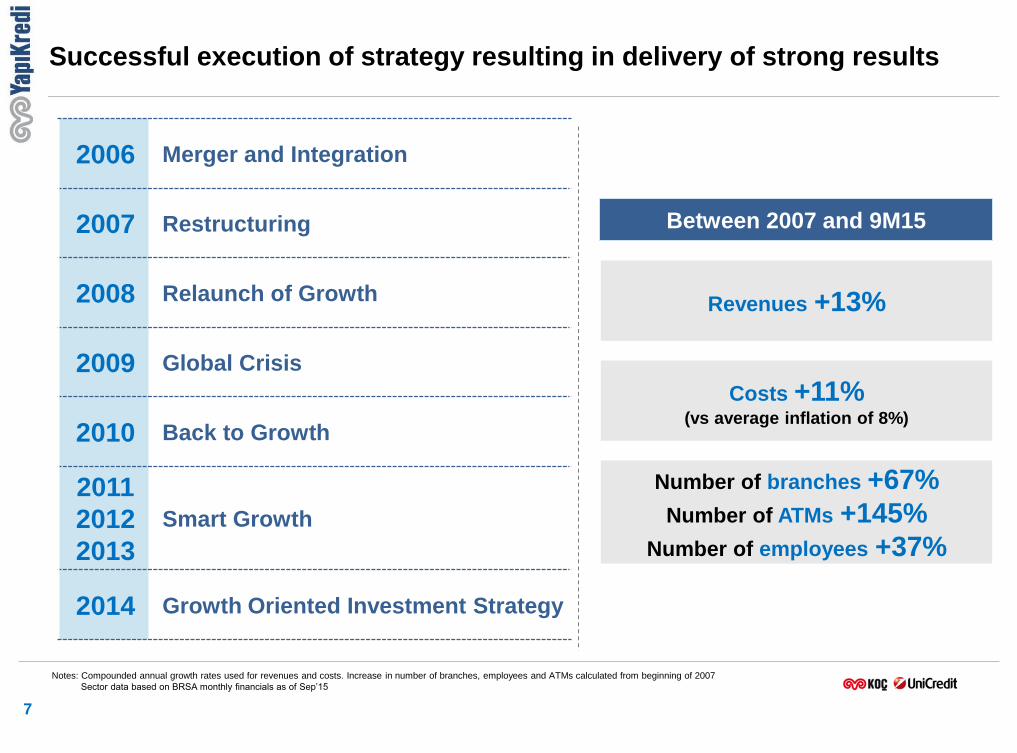
Successful execution of strategy resulting in delivery of strong results
Between 2007 and 9M15
Revenues +13%
Costs +11% (vs average inflation of 8%)
Number of branches +67%
Number of ATMs +145%
Number of employees +37%
Notes: Compounded annual growth rates used for revenues and costs. Increase in number of branches, employees and ATMs calculated from beginning of 2007
Sector data based on BRSA monthly financials as of Sep’15
2006 Merger and Integration
2007 Restructuring
2008 Relaunch of Growth
2009 Global Crisis
2010 Back to Growth
2011
2012
2013
Smart Growth
2014 Growth Oriented Investment Strategy
112%
108%110% 109%109%
109%111%
109%
2014 1Q15 1H15 9M15
11.7%10.6%
11.2%8.6%
9M14 9M15
3Q vs
2Q Δ
YKB YKBPrivate
Banks
State
Banks Sector
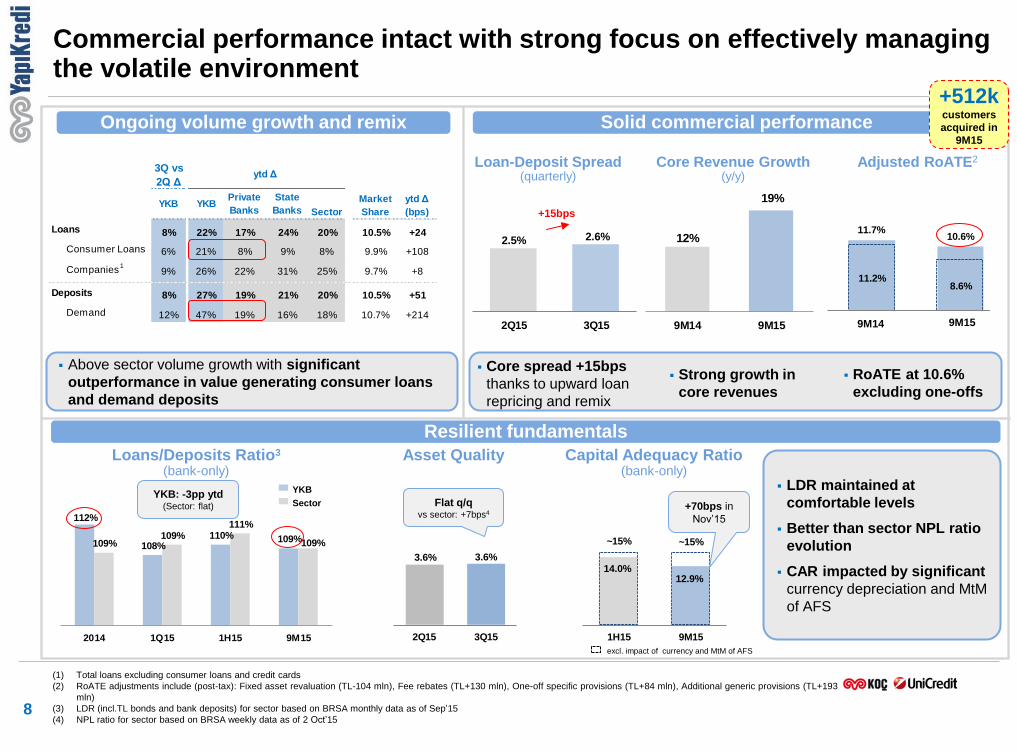
Loans 8% 22% 17% 24% 20% 10.5% +24
Consumer Loans 6% 21% 8% 9% 8% 9.9% +108
Companies1
9% 26% 22% 31% 25% 9.7% +8
Deposits 8% 27% 19% 21% 20% 10.5% +51
Demand 12% 47% 19% 16% 18% 10.7% +214
Market
Share
ytd Δ
(bps)
ytd Δ
2.5% 2.6%
2Q15 3Q15
3.6% 3.6%
2Q15 3Q15
12%
19%
9M14 9M15
Above sector volume growth with significant
outperformance in value generating consumer loans
and demand deposits
Capital Adequacy Ratio (bank-only)
Loans/Deposits Ratio3
(bank-only)
8
Ongoing volume growth and remix
Resilient fundamentals
Solid commercial performance
Loan-Deposit Spread (quarterly)
Commercial performance intact with strong focus on effectively managing the volatile environment
(1) Total loans excluding consumer loans and credit cards
(2) RoATE adjustments include (post-tax): Fixed asset revaluation (TL-104 mln), Fee rebates (TL+130 mln), One-off specific provisions (TL+84 mln), Additional generic provisions (TL+193
mln)
(3) LDR (incl.TL bonds and bank deposits) for sector based on BRSA monthly data as of Sep’15
(4) NPL ratio for sector based on BRSA weekly data as of 2 Oct’15
Core spread +15bps
thanks to upward loan
repricing and remix
Strong growth in
core revenues
RoATE at 10.6%
excluding one-offs
Core Revenue Growth (y/y)
Adjusted RoATE2
Asset Quality
LDR maintained at
comfortable levels
Better than sector NPL ratio
evolution
CAR impacted by significant
currency depreciation and MtM
of AFS
+15bps
9M14 9M15
Flat q/q vs sector: +7bps4
YKB
Sector
14.0%12.9%
1H15 9M15
~15% ~15%
excl. impact of currency and MtM of AFS
YKB: -3pp ytd (Sector: flat)
+512k customers
acquired in
9M15
+70bps in
Nov’15

Headcount and branch investments finalized; ATM network continues to expand
9
4,217
Market Share +130 bps y/y to 8.8%
2014: +600
9M15: +584
1,015
Market Share +26bps y/y to 9.0%
2014: +60 new (1)
9M15: +12 new(1)
Headcount
19,517
Market Share +23 bps y/y to 9.1%
2014: +1,850
9M15: +983
(1) Net increase
Branches ATMs
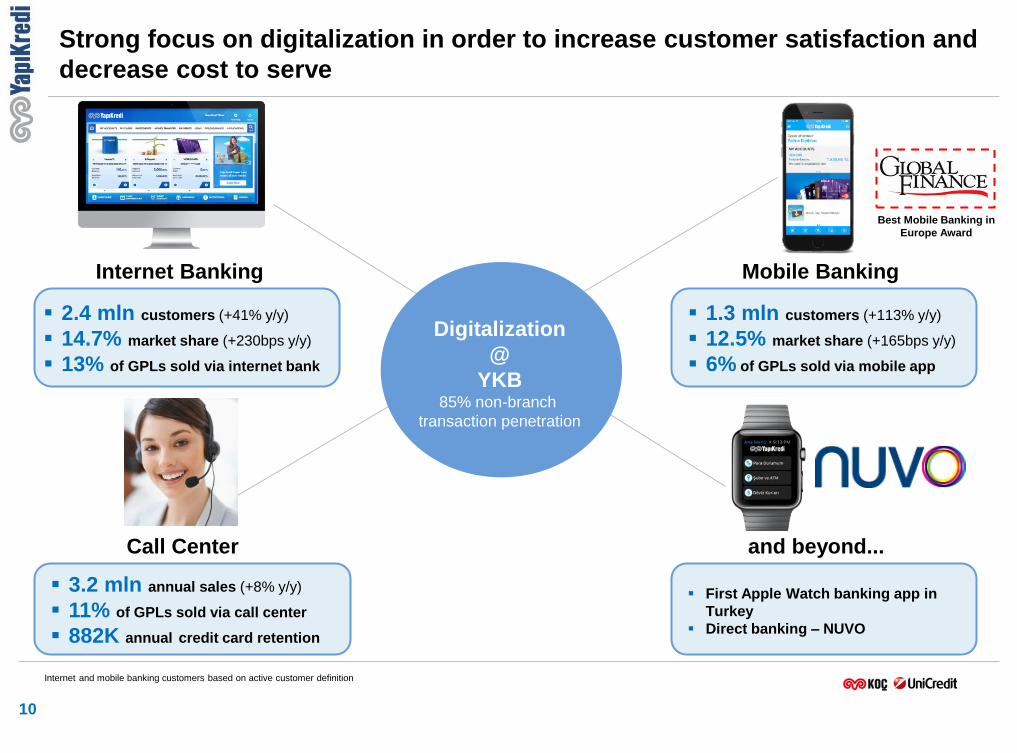
Strong focus on digitalization in order to increase customer satisfaction and
decrease cost to serve
1.3 mln customers (+113% y/y)
12.5% market share (+165bps y/y)
6% of GPLs sold via mobile app
3.2 mln annual sales (+8% y/y)
11% of GPLs sold via call center
882K annual credit card retention
2.4 mln customers (+41% y/y)
14.7% market share (+230bps y/y)
13% of GPLs sold via internet bank
First Apple Watch banking app in
Turkey
Direct banking – NUVO
10
Internet Banking Mobile Banking
Call Center and beyond...
Digitalization
@
YKB 85% non-branch
transaction penetration
Best Mobile Banking in
Europe Award
Internet and mobile banking customers based on active customer definition
38%
32%
29%
1%
54%
46%Corp/
Comm
1Q vs
2014 Δ
2Q vs
1Q Δ
3Q vs
2Q Δ
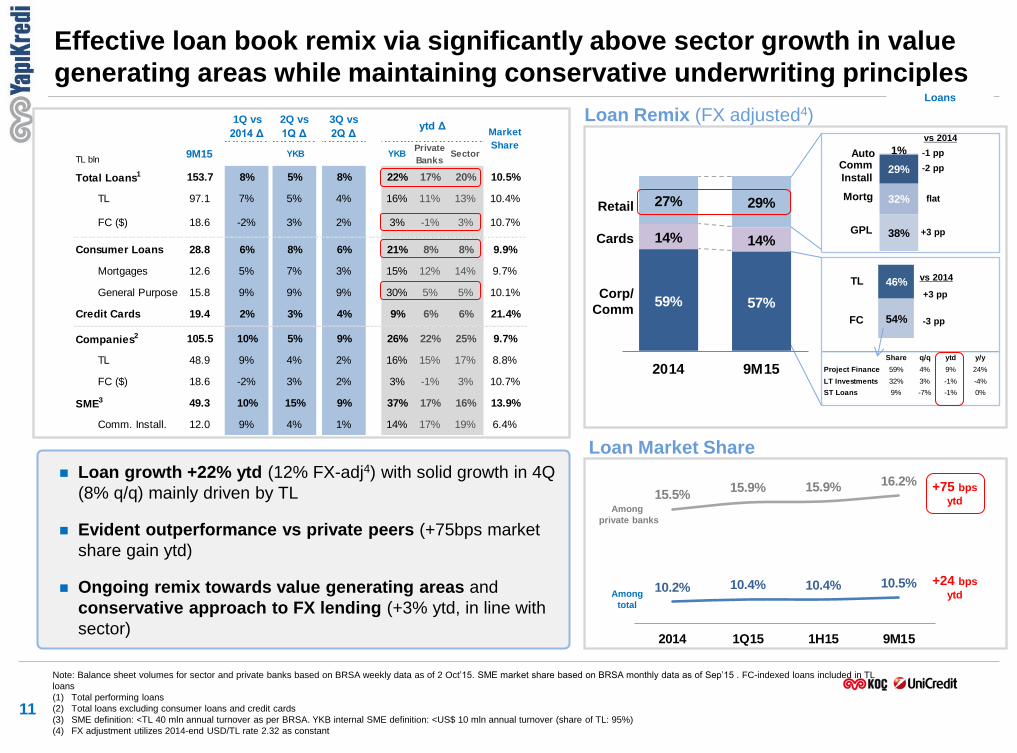
TL bln9M15 YKB
Private
BanksSector
Total Loans1 153.7 8% 5% 8% 22% 17% 20% 10.5%
TL 97.1 7% 5% 4% 16% 11% 13% 10.4%
FC ($) 18.6 -2% 3% 2% 3% -1% 3% 10.7%
Consumer Loans 28.8 6% 8% 6% 21% 8% 8% 9.9%
Mortgages 12.6 5% 7% 3% 15% 12% 14% 9.7%
General Purpose 15.8 9% 9% 9% 30% 5% 5% 10.1%
Credit Cards 19.4 2% 3% 4% 9% 6% 6% 21.4%
Companies2 105.5 10% 5% 9% 26% 22% 25% 9.7%
TL 48.9 9% 4% 2% 16% 15% 17% 8.8%
FC ($) 18.6 -2% 3% 2% 3% -1% 3% 10.7%
SME3 49.3 10% 15% 9% 37% 17% 16% 13.9%
Comm. Install. 12.0 9% 4% 1% 14% 17% 19% 6.4%
YKB
ytd ΔMarket
Share
11
Effective loan book remix via significantly above sector growth in value
generating areas while maintaining conservative underwriting principles
Loan growth +22% ytd (12% FX-adj4) with solid growth in 4Q
(8% q/q) mainly driven by TL
Evident outperformance vs private peers (+75bps market
share gain ytd)
Ongoing remix towards value generating areas and
conservative approach to FX lending (+3% ytd, in line with
sector)
Note: Balance sheet volumes for sector and private banks based on BRSA weekly data as of 2 Oct’15. SME market share based on BRSA monthly data as of Sep’15 . FC-indexed loans included in TL
loans
(1) Total performing loans
(2) Total loans excluding consumer loans and credit cards
(3) SME definition: <TL 40 mln annual turnover as per BRSA. YKB internal SME definition: <US$ 10 mln annual turnover (share of TL: 95%)
(4) FX adjustment utilizes 2014-end USD/TL rate 2.32 as constant
Retail
Cards
Loan Market Share
FC
TL vs 2014
+3 pp
-3 pp
Loan Remix (FX adjusted4)
10.2% 10.4% 10.4% 10.5%
15.5%15.9% 15.9% 16.2%
2014 1Q15 1H15 9M15
Among
total
Among
private banks
+75 bps
ytd
+24 bps
ytd
GPL
Mortg
Comm
Install
Auto
Share q/q ytd y/y
Project Finance 59% 4% 9% 24%
LT Investments 32% 3% -1% -4%
ST Loans 9% -7% -1% 0%
vs 2014
+3 pp
59% 57%
14% 14%
27% 29%
2014 9M15
-2 pp
-1 pp
flat
Loans
9M151Q vs
2014 Δ
2Q vs
1Q Δ
3Q vs
2Q ΔYKB Private Sector
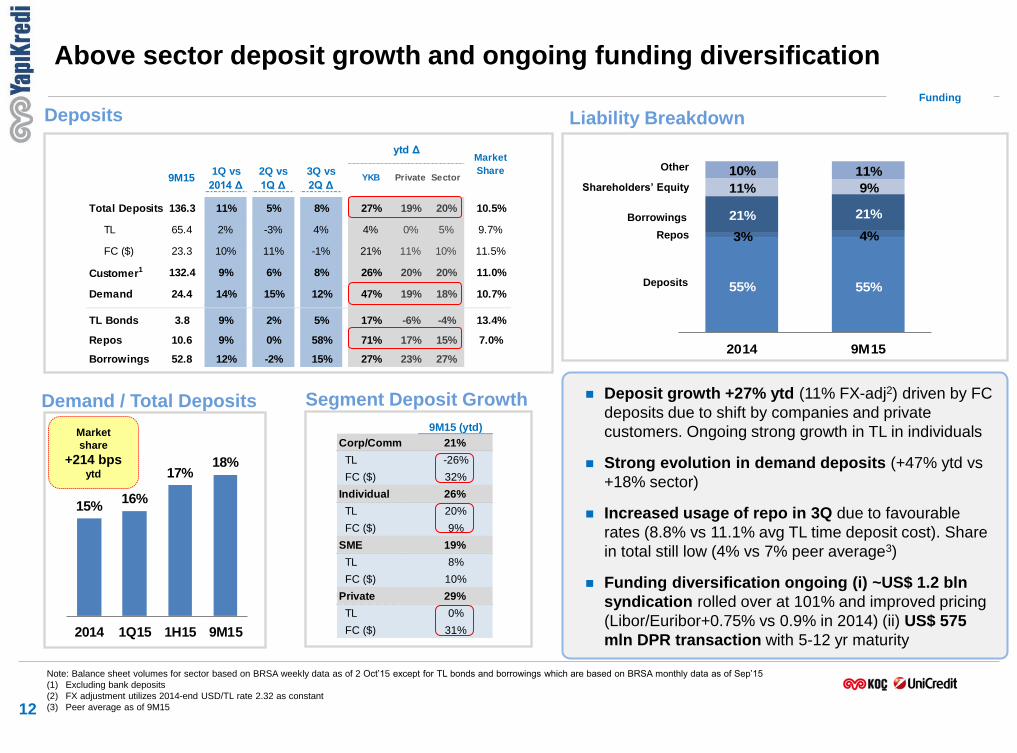
Total Deposits 136.3 11% 5% 8% 27% 19% 20% 10.5%
TL 65.4 2% -3% 4% 4% 0% 5% 9.7%
FC ($) 23.3 10% 11% -1% 21% 11% 10% 11.5%
Customer1 132.4 9% 6% 8% 26% 20% 20% 11.0%
Demand 24.4 14% 15% 12% 47% 19% 18% 10.7%
TL Bonds 3.8 9% 2% 5% 17% -6% -4% 13.4%
Repos 10.6 9% 0% 58% 71% 17% 15% 7.0%
Borrowings 52.8 12% -2% 15% 27% 23% 27%
ytd ΔMarket
Share
9M15 (ytd)
Corp/Comm 21%
TL -26%
FC ($) 32%
Individual 26%
TL 20%
FC ($) 9%
SME 19%
TL 8%
FC ($) 10%
Private 29%
TL 0%
FC ($) 31%
15%16%
17%18%
2014 1Q15 1H15 9M15
12
Deposits
Above sector deposit growth and ongoing funding diversification
Liability Breakdown
Note: Balance sheet volumes for sector based on BRSA weekly data as of 2 Oct’15 except for TL bonds and borrowings which are based on BRSA monthly data as of Sep’15
(1) Excluding bank deposits
(2) FX adjustment utilizes 2014-end USD/TL rate 2.32 as constant
(3) Peer average as of 9M15
Borrowings
Deposits
Other
Repos
Shareholders’ Equity
Deposit growth +27% ytd (11% FX-adj2) driven by FC
deposits due to shift by companies and private
customers. Ongoing strong growth in TL in individuals
Strong evolution in demand deposits (+47% ytd vs
+18% sector)
Increased usage of repo in 3Q due to favourable
rates (8.8% vs 11.1% avg TL time deposit cost). Share
in total still low (4% vs 7% peer average3)
Funding diversification ongoing (i) ~US$ 1.2 bln
syndication rolled over at 101% and improved pricing
(Libor/Euribor+0.75% vs 0.9% in 2014) (ii) US$ 575
mln DPR transaction with 5-12 yr maturity
55% 55%
3% 4%
21% 21%
11% 9%
10% 11%
2014 9M15
Funding
Demand / Total Deposits
Market
share
+214 bps ytd
Segment Deposit Growth
1,504 1,577
1,442 1,274
13
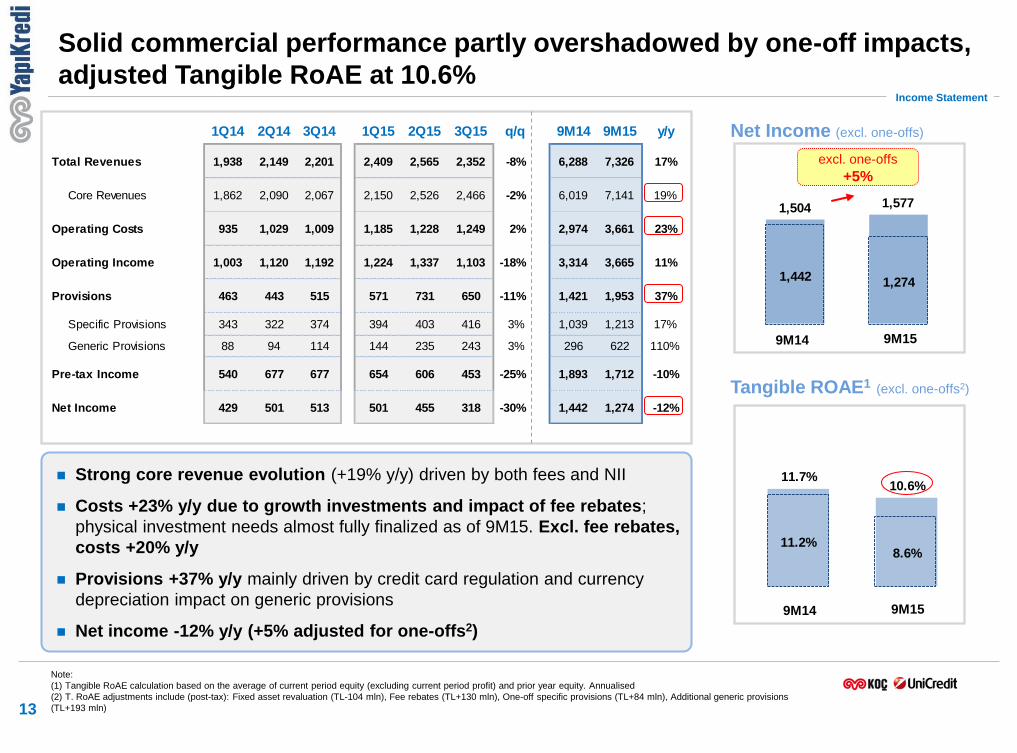
Income Statement
Solid commercial performance partly overshadowed by one-off impacts,
adjusted Tangible RoAE at 10.6%
Note:
(1) Tangible RoAE calculation based on the average of current period equity (excluding current period profit) and prior year equity. Annualised
(2) T. RoAE adjustments include (post-tax): Fixed asset revaluation (TL-104 mln), Fee rebates (TL+130 mln), One-off specific provisions (TL+84 mln), Additional generic provisions
(TL+193 mln)
Strong core revenue evolution (+19% y/y) driven by both fees and NII
Costs +23% y/y due to growth investments and impact of fee rebates;
physical investment needs almost fully finalized as of 9M15. Excl. fee rebates,
costs +20% y/y
Provisions +37% y/y mainly driven by credit card regulation and currency
depreciation impact on generic provisions
Net income -12% y/y (+5% adjusted for one-offs2)
1Q14 2Q14 3Q14 1Q15 2Q15 3Q15 q/q 9M14 9M15 y/y
Total Revenues 1,938 2,149 2,201 2,409 2,565 2,352 -8% 6,288 7,326 17%
Core Revenues 1,862 2,090 2,067 2,150 2,526 2,466 -2% 6,019 7,141 19%
Operating Costs 935 1,029 1,009 1,185 1,228 1,249 2% 2,974 3,661 23%
Operating Income 1,003 1,120 1,192 1,224 1,337 1,103 -18% 3,314 3,665 11%
Provisions 463 443 515 571 731 650 -11% 1,421 1,953 37%
Specific Provisions 343 322 374 394 403 416 3% 1,039 1,213 17%
Generic Provisions 88 94 114 144 235 243 3% 296 622 110%
Pre-tax Income 540 677 677 654 606 453 -25% 1,893 1,712 -10%
Net Income 429 501 513 501 455 318 -30% 1,442 1,274 -12%
Tangible ROAE1 (excl. one-offs2)
Net Income (excl. one-offs)
9M14 9M15
9M14 9M15
excl. one-offs
+5%
11.7%10.6%
11.2%8.6%

16%
18%19%
15%
16%
15%
1Q15 1H15 9M15
9%4% 2%
26%27% 28%
65% 69%
70%
9M13 9M14 9M15
14
6,288
NII
Fees
Other
+6%
+17% 7,326
5,931
Core
Revenues 5,379 6,019 7,141
(1) Core revenues indicate Net Interest Income + Fees & Commissions
(2) Private banks based on BRSA monthly data as of Sep’15
Core revenue evolution above private banks with a growing spread
Revenues (TL mln)
Revenues
Core revenues +19% y/y with significant
outperformance vs private banks (15% y/y)2
Total revenue growth lagging core revenue
growth (17% y/y) due to pressure from swap
costs and lower collections 1
19%
Core
revenues
y/y
Core revenue evolution vs private banks
Private banks YKB
2
10.9%11.1%
11.4%
11.4% 11.4% 11.6%
4.9% 4.7%5.0%
5.4%5.0%
5.5%
3Q14 4Q14 1Q15 2Q15 3Q15
2.6%2.3%
2.5% 2.6%
4Q14 1Q15 2Q15 3Q15
3.6%3.1%
3.6%3.1%
4Q14 1Q15 2Q15 3Q15
7.6%
8.1%8.6%
7.4%
7.8%8.2%
1.7% 1.5% 1.5%
1.7% 1.6% 1.5%
3Q14 4Q14 1Q15 2Q15 3Q15
8.1%
9.1%
7.0%
10.4%
6.4%
5.4% 5.4% 5.6%5.9%
5.7%
3Q14 4Q14 1Q15 2Q15 3Q15
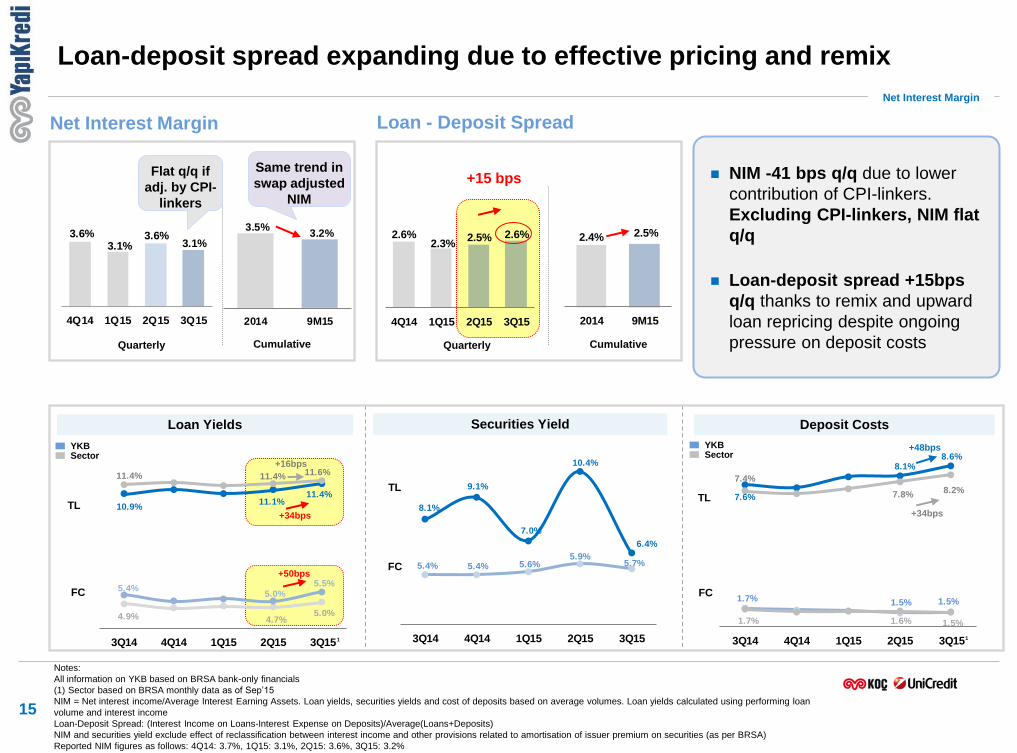
Loan-deposit spread expanding due to effective pricing and remix
15
Net Interest Margin
Notes:
All information on YKB based on BRSA bank-only financials
(1) Sector based on BRSA monthly data as of Sep’15
NIM = Net interest income/Average Interest Earning Assets. Loan yields, securities yields and cost of deposits based on average volumes. Loan yields calculated using performing loan
volume and interest income
Loan-Deposit Spread: (Interest Income on Loans-Interest Expense on Deposits)/Average(Loans+Deposits)
NIM and securities yield exclude effect of reclassification between interest income and other provisions related to amortisation of issuer premium on securities (as per BRSA)
Reported NIM figures as follows: 4Q14: 3.7%, 1Q15: 3.1%, 2Q15: 3.6%, 3Q15: 3.2%
Loan Yields Securities Yield Deposit Costs
Net Interest Margin
YKB Sector
TL
FC
TL
FC
TL
FC
NIM -41 bps q/q due to lower
contribution of CPI-linkers.
Excluding CPI-linkers, NIM flat
q/q
Loan-deposit spread +15bps
q/q thanks to remix and upward
loan repricing despite ongoing
pressure on deposit costs
Loan - Deposit Spread
+15 bps
Quarterly Cumulative Quarterly Cumulative
+16bps
+34bps
+48bps
+34bps
YKB Sector
3.5%3.2%
2014 9M15
2.4% 2.5%
2014 9M15
Same trend in
swap adjusted
NIM
+50bps
Flat q/q if
adj. by CPI-
linkers
1 1
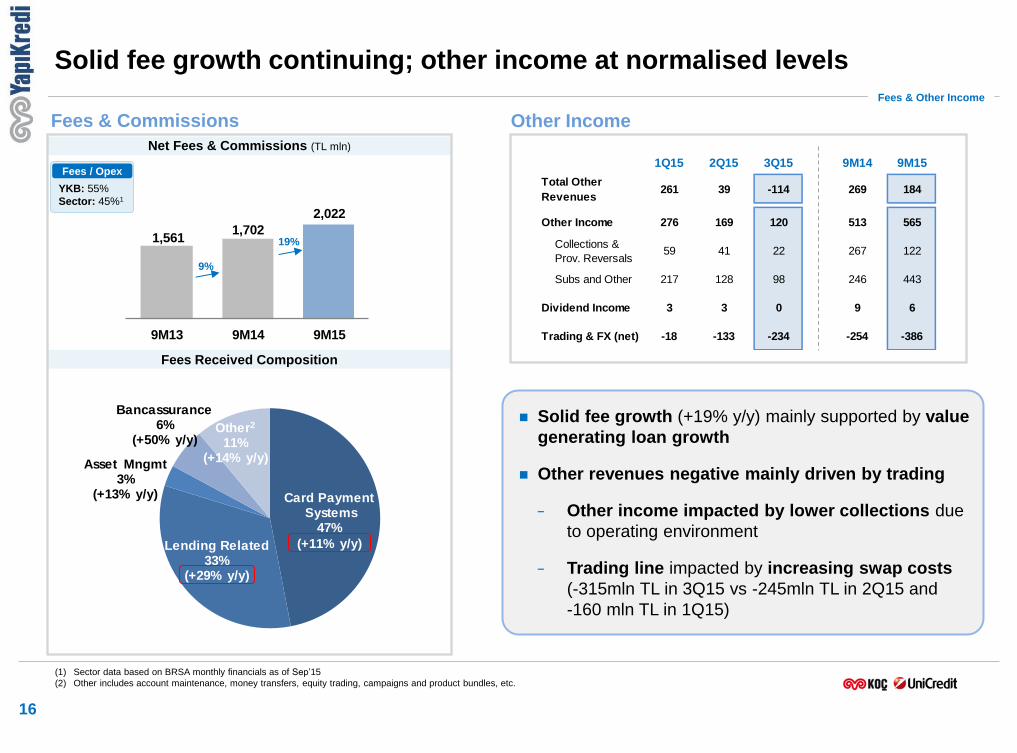
1Q15 2Q15 3Q15 9M14 9M15
Total Other
Revenues261 39 -114 269 184
Other Income 276 169 120 513 565
Collections &
Prov. Reversals59 41 22 267 122
Subs and Other 217 128 98 246 443
Dividend Income 3 3 0 9 6
Trading & FX (net) -18 -133 -234 -254 -386
Card PaymentSystems
47%
(+11% y/y)Lending Related 33%
(+29% y/y)
Asset Mngmt 3%
(+13% y/y)
Bancassurance 6%
(+50% y/y)Other2
11%(+14% y/y)
1,5611,702
2,022
9M13 9M14 9M15
Solid fee growth continuing; other income at normalised levels
16
Fees & Commissions
Fees Received Composition
Net Fees & Commissions (TL mln)
Other Income
Fees & Other Income
(1) Sector data based on BRSA monthly financials as of Sep’15
(2) Other includes account maintenance, money transfers, equity trading, campaigns and product bundles, etc.
Solid fee growth (+19% y/y) mainly supported by value
generating loan growth
Other revenues negative mainly driven by trading
− Other income impacted by lower collections due
to operating environment
− Trading line impacted by increasing swap costs
(-315mln TL in 3Q15 vs -245mln TL in 2Q15 and
-160 mln TL in 1Q15)
9%
19%
YKB: 55%
Sector: 45%1
Fees / Opex
17
Cost Breakdown
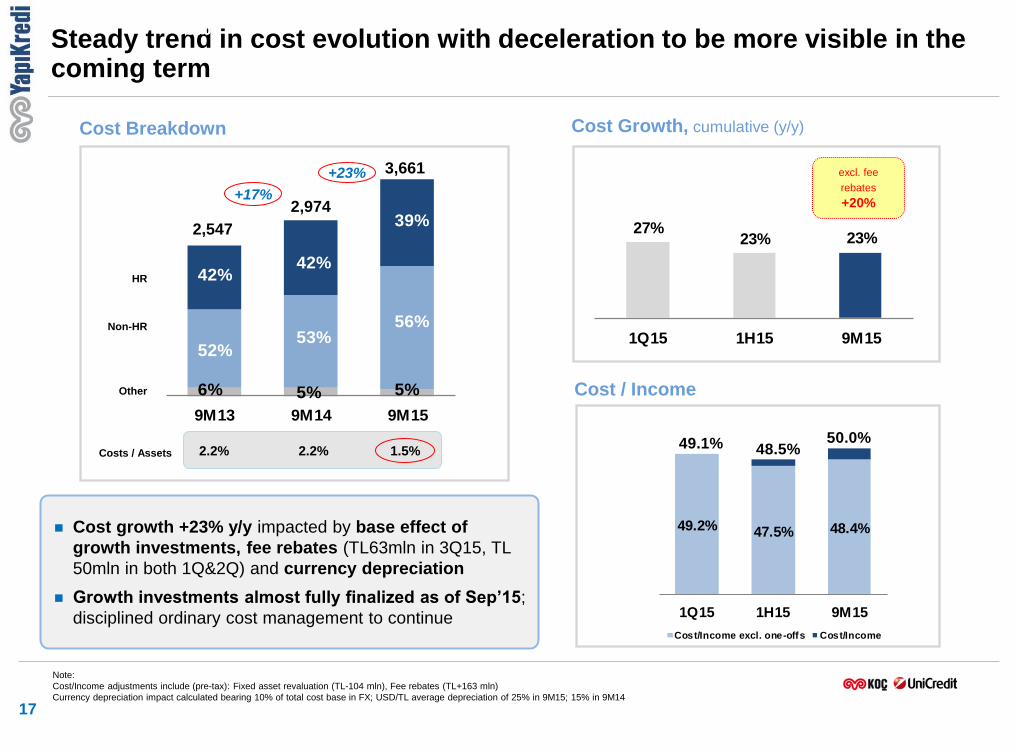
Steady trend in cost evolution with deceleration to be more visible in the coming term
9M13 9M14 9M15
39%
39%
56%53%
56%
42%
56%
52%
56%
42%
6% 5% 5%
2,974 +17%
+23% 3,661
2,547
HR
Non-HR
Other
Cost growth +23% y/y impacted by base effect of
growth investments, fee rebates (TL63mln in 3Q15, TL
50mln in both 1Q&2Q) and currency depreciation
Growth investments almost fully finalized as of Sep’15;
disciplined ordinary cost management to continue
Cost Growth, cumulative (y/y)
Costs / Assets 2.2% 2.2% 1.5%
27%23% 23%
1Q15 1H15 9M15
Cost / Income
Note:
Cost/Income adjustments include (pre-tax): Fixed asset revaluation (TL-104 mln), Fee rebates (TL+163 mln)
Currency depreciation impact calculated bearing 10% of total cost base in FX; USD/TL average depreciation of 25% in 9M15; 15% in 9M14
49.2% 47.5% 48.4%
1Q15 1H15 9M15
Cost/Income excl. one-offs Cost/Income
49.1% 50.0%48.5%
excl. fee
rebates
+20%
1.2% 1.0% 1.2% 1.1%
2014 1Q15 1H15 9M15
Restructured Loan Ratio Watch Loan Ratio
3.4% 3.5% 3.6% 3.6%
2014 1Q15 1H15 9M15
18
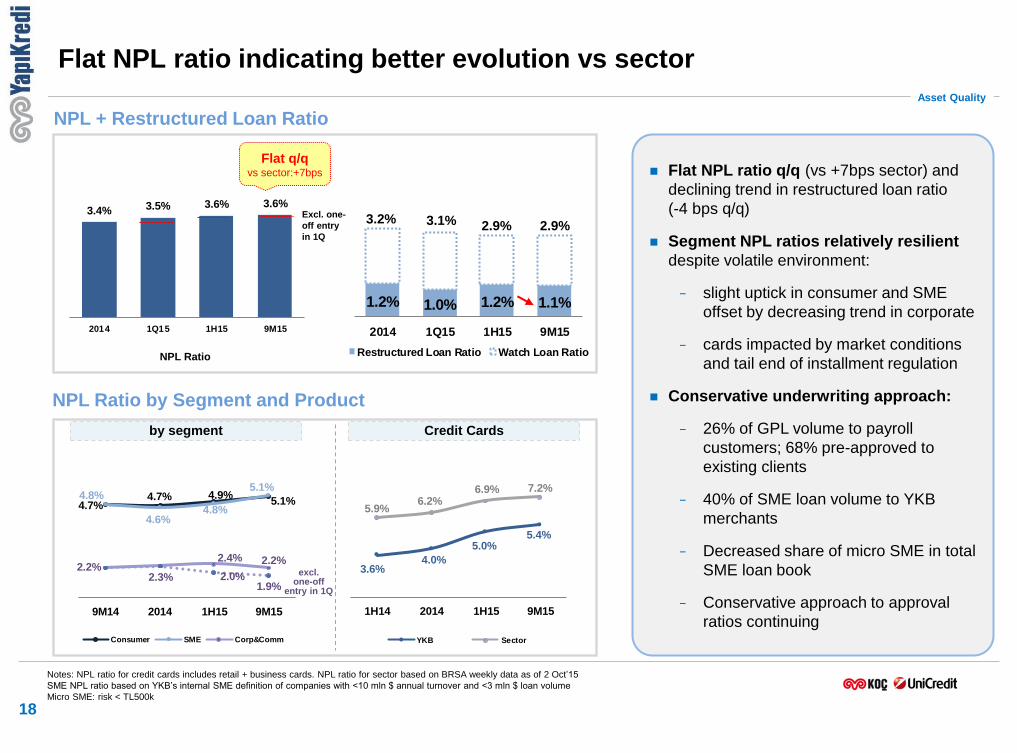
Flat NPL ratio indicating better evolution vs sector
NPL Ratio by Segment and Product
Asset Quality
Notes: NPL ratio for credit cards includes retail + business cards. NPL ratio for sector based on BRSA weekly data as of 2 Oct’15
SME NPL ratio based on YKB’s internal SME definition of companies with <10 mln $ annual turnover and <3 mln $ loan volume
Micro SME: risk < TL500k
by segment Credit Cards
Flat NPL ratio q/q (vs +7bps sector) and
declining trend in restructured loan ratio
(-4 bps q/q)
Segment NPL ratios relatively resilient
despite volatile environment:
− slight uptick in consumer and SME
offset by decreasing trend in corporate
− cards impacted by market conditions
and tail end of installment regulation
Conservative underwriting approach:
− 26% of GPL volume to payroll
customers; 68% pre-approved to
existing clients
− 40% of SME loan volume to YKB
merchants
− Decreased share of micro SME in total
SME loan book
− Conservative approach to approval
ratios continuing
4.7%4.7% 4.9%
5.1%4.8%
4.6%4.8%
5.1%
2.2%2.3%
2.4% 2.2%
2.0%1.9%
9M14 2014 1H15 9M15
Consumer SME Corp&Comm
3.6%4.0%
5.0%5.4%
5.9%6.2%
6.9% 7.2%
1H14 2014 1H15 9M15
YKB Sector
excl. one-off
entry in 1Q
NPL + Restructured Loan Ratio
NPL Ratio
3.2% 3.1% 2.9% Excl. one-
off entry
in 1Q 2.9%
Flat q/q vs sector:+7bps
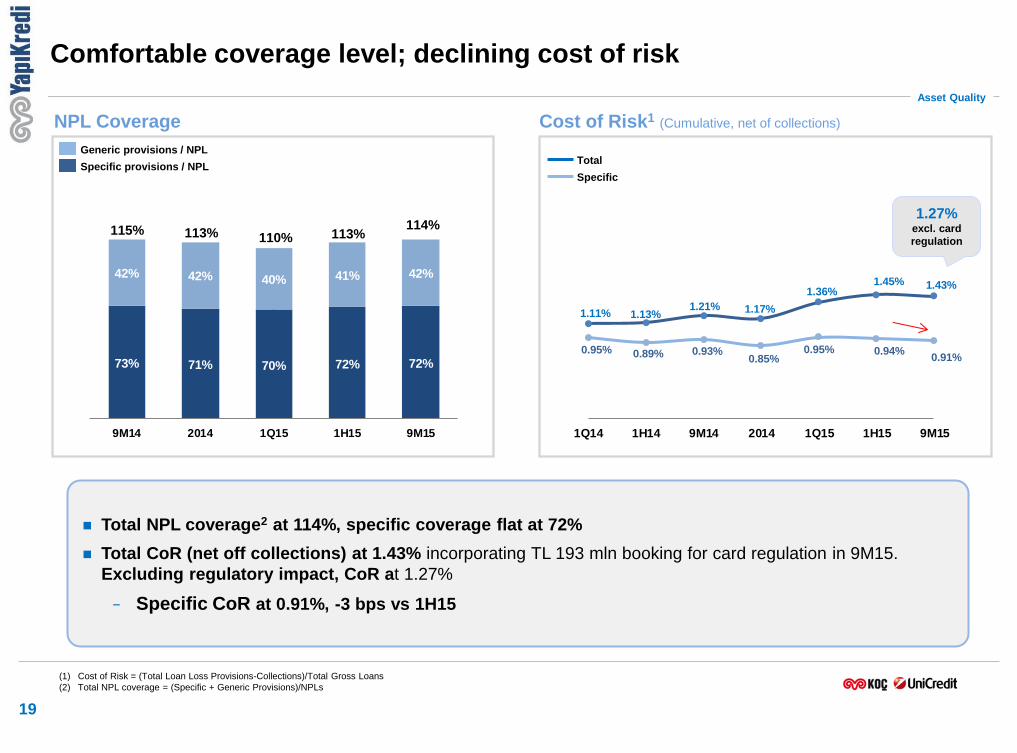
1.11% 1.13%1.21% 1.17%
1.36%1.45% 1.43%
0.95% 0.89% 0.93%0.85%
0.95% 0.94%0.91%
1Q14 1H14 9M14 2014 1Q15 1H15 9M15
42% 42% 40% 41% 42%
73% 71% 70% 72% 72%
9M14 2014 1Q15 1H15 9M15
Comfortable coverage level; declining cost of risk
19
NPL Coverage
Specific provisions / NPL
Generic provisions / NPL
Cost of Risk1 (Cumulative, net of collections)
Total
(1) Cost of Risk = (Total Loan Loss Provisions-Collections)/Total Gross Loans
(2) Total NPL coverage = (Specific + Generic Provisions)/NPLs
Asset Quality
Specific
115% 113%
Total NPL coverage2 at 114%, specific coverage flat at 72%
Total CoR (net off collections) at 1.43% incorporating TL 193 mln booking for card regulation in 9M15.
Excluding regulatory impact, CoR at 1.27%
− Specific CoR at 0.91%, -3 bps vs 1H15
110% 113%
1.27% excl. card
regulation
114%
9%
8%
7,1956,249
8,036
7,008
2012 2013 2014 2015E
Loans/Employee
20
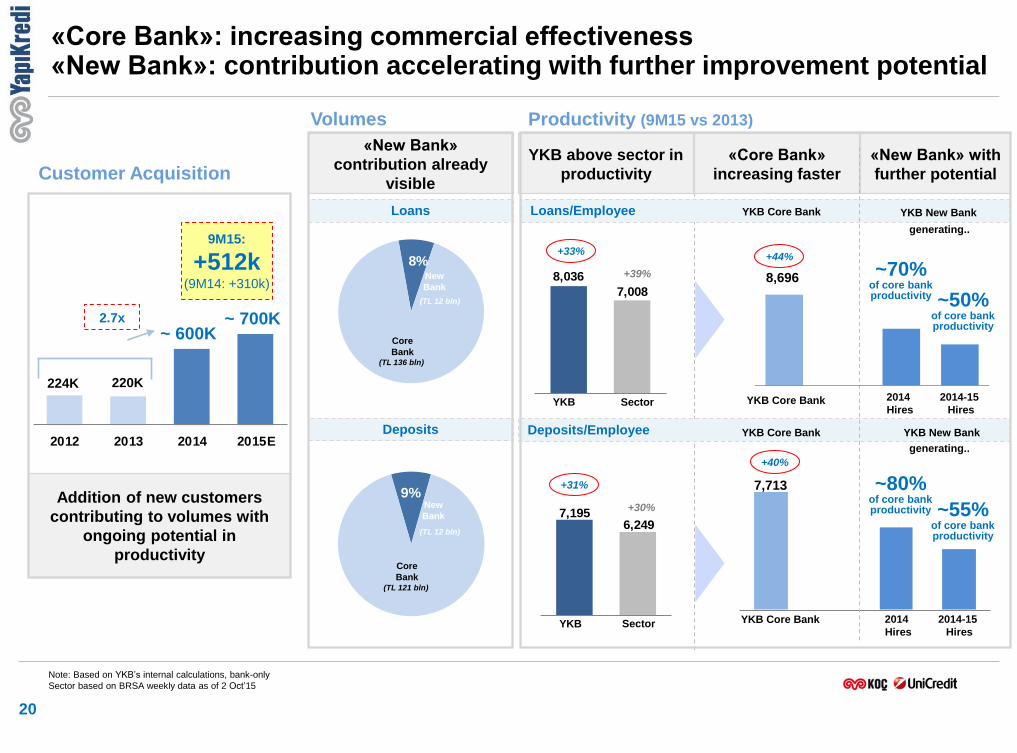
Customer Acquisition
«Core Bank»: increasing commercial effectiveness «New Bank»: contribution accelerating with further improvement potential
Volumes
Note: Based on YKB’s internal calculations, bank-only
Sector based on BRSA weekly data as of 2 Oct’15
220K
~ 600K
Addition of new customers
contributing to volumes with
ongoing potential in
productivity
224K
2.7x
«New Bank»
contribution already
visible
Core
Bank
Loans
Deposits
Productivity (9M15 vs 2013)
YKB Sector
YKB Sector
+39%
YKB Core Bank
+30%
YKB Core Bank
«Core Bank»
increasing faster
«New Bank» with
further potential
YKB above sector in
productivity
Deposits/Employee
New
Bank
New
Bank
+33%
(TL 12 bln)
(TL 12 bln)
(TL 136 bln)
Core
Bank (TL 121 bln)
+44%
YKB New Bank
+31%
~ 700K
YKB Core Bank YKB New Bank
9M15:
+512k (9M14: +310k)
~70% of core bank productivity ~50%
of core bank productivity
2014
Hires
2014-15
Hires YKB Core Bank
~80% of core bank productivity ~55%
of core bank productivity
+40%
2014
Hires
2014-15
Hires
generating..
generating..
8,696
7,713
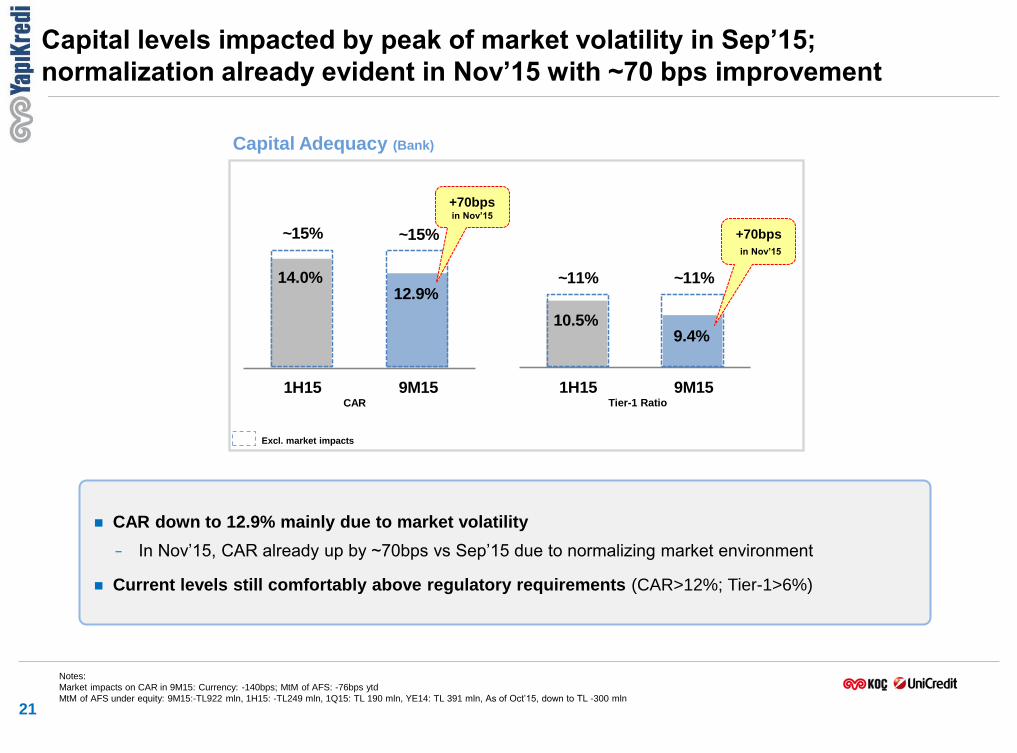
10.5%9.4%
1H15 9M15
~11% ~11%
21
Capital Adequacy (Bank)
CAR down to 12.9% mainly due to market volatility
− In Nov’15, CAR already up by ~70bps vs Sep’15 due to normalizing market environment
Current levels still comfortably above regulatory requirements (CAR>12%; Tier-1>6%)
Capital levels impacted by peak of market volatility in Sep’15;
normalization already evident in Nov’15 with ~70 bps improvement
Notes:
Market impacts on CAR in 9M15: Currency: -140bps; MtM of AFS: -76bps ytd
MtM of AFS under equity: 9M15:-TL922 mln, 1H15: -TL249 mln, 1Q15: TL 190 mln, YE14: TL 391 mln, As of Oct’15, down to TL -300 mln
14.0%12.9%
1H15 9M15
~15% ~15% +70bps
in Nov’15
+70bps in Nov’15
CAR Tier-1 Ratio
Excl. market impacts
22
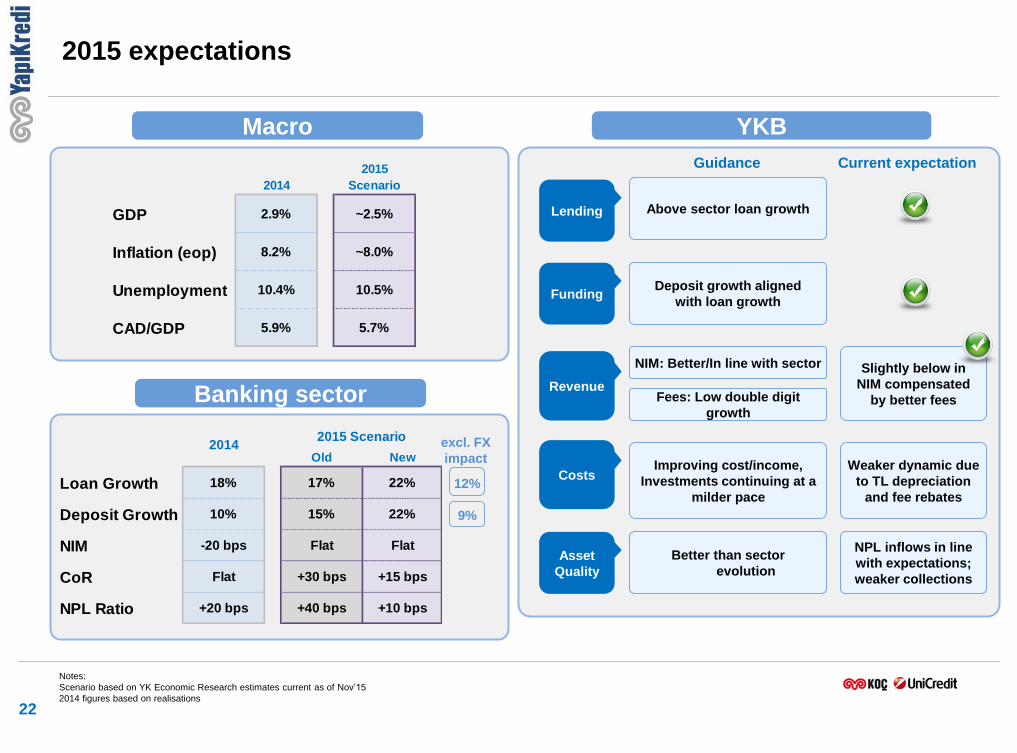
2015 expectations
Notes:
Scenario based on YK Economic Research estimates current as of Nov’15
2014 figures based on realisations
2014
2015
Scenario
GDP 2.9% ~2.5%
Inflation (eop) 8.2% ~8.0%
Unemployment 10.4% 10.5%
CAD/GDP 5.9% 5.7%
Old New
Loan Growth 18% 17% 22%
Deposit Growth 10% 15% 22%
NIM -20 bps Flat Flat
CoR Flat +30 bps +15 bps
NPL Ratio +20 bps +40 bps +10 bps
2015 Scenario2014
Macro
Banking sector
Lending
Funding
Revenue
Costs
Asset
Quality
Deposit growth aligned
with loan growth
NIM: Better/In line with sector
Better than sector
evolution
Guidance
Fees: Low double digit
growth
Improving cost/income,
Investments continuing at a
milder pace
YKB
Current expectation
Above sector loan growth
Slightly below in
NIM compensated
by better fees
Weaker dynamic due
to TL depreciation
and fee rebates
NPL inflows in line
with expectations;
weaker collections
excl. FX
impact
12%
9%
23
Annex
Agenda
Borrowings 21%
Repos 4%
Deposits 55%
Other 11%
Shareholders' Equity
9%
Loans 62%
Securities 13%
Other IEAs 20%
Other Assets
5%
24
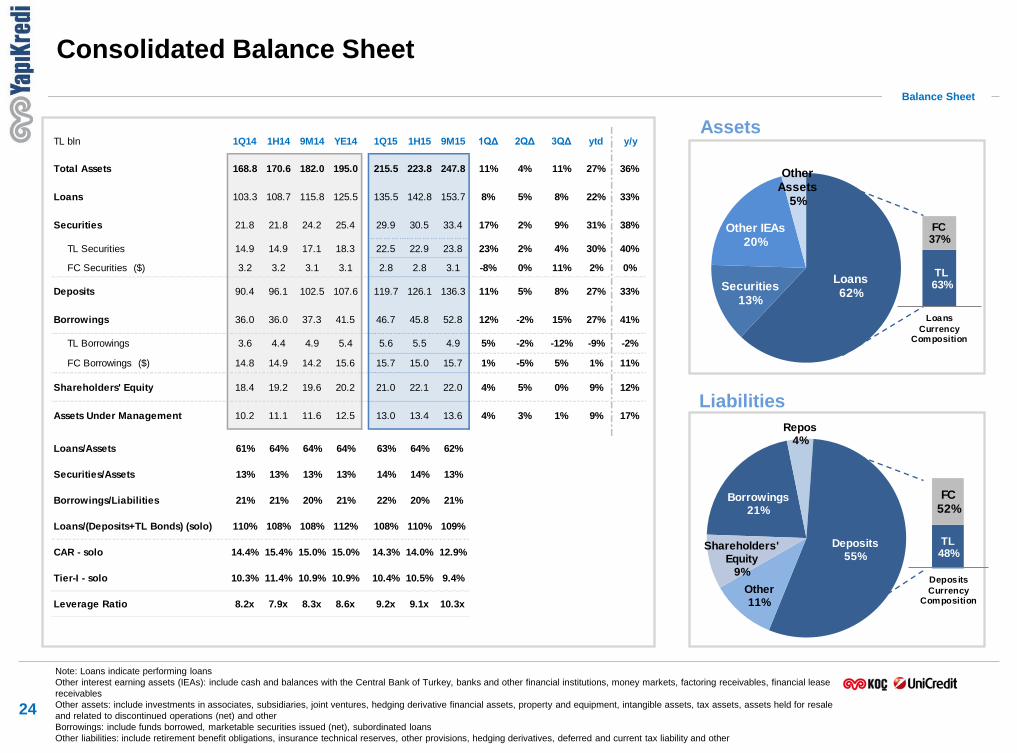
Balance Sheet
Assets
Liabilities
Consolidated Balance Sheet
TL63%
FC37%
Loans
CurrencyComposition
TL48%
FC52%
Deposits
CurrencyComposition
Note: Loans indicate performing loans
Other interest earning assets (IEAs): include cash and balances with the Central Bank of Turkey, banks and other financial institutions, money markets, factoring receivables, financial lease
receivables
Other assets: include investments in associates, subsidiaries, joint ventures, hedging derivative financial assets, property and equipment, intangible assets, tax assets, assets held for resale
and related to discontinued operations (net) and other
Borrowings: include funds borrowed, marketable securities issued (net), subordinated loans
Other liabilities: include retirement benefit obligations, insurance technical reserves, other provisions, hedging derivatives, deferred and current tax liability and other
TL bln 1Q14 1H14 9M14 YE14 1Q15 1H15 9M15 1QΔ 2QΔ 3QΔ ytd y/y
Total Assets 168.8 170.6 182.0 195.0 215.5 223.8 247.8 11% 4% 11% 27% 36%
Loans 103.3 108.7 115.8 125.5 135.5 142.8 153.7 8% 5% 8% 22% 33%
Securities 21.8 21.8 24.2 25.4 29.9 30.5 33.4 17% 2% 9% 31% 38%
TL Securities 14.9 14.9 17.1 18.3 22.5 22.9 23.8 23% 2% 4% 30% 40%
FC Securities ($) 3.2 3.2 3.1 3.1 2.8 2.8 3.1 -8% 0% 11% 2% 0%
Deposits 90.4 96.1 102.5 107.6 119.7 126.1 136.3 11% 5% 8% 27% 33%
Borrowings 36.0 36.0 37.3 41.5 46.7 45.8 52.8 12% -2% 15% 27% 41%
TL Borrowings 3.6 4.4 4.9 5.4 5.6 5.5 4.9 5% -2% -12% -9% -2%
FC Borrowings ($) 14.8 14.9 14.2 15.6 15.7 15.0 15.7 1% -5% 5% 1% 11%
Shareholders' Equity 18.4 19.2 19.6 20.2 21.0 22.1 22.0 4% 5% 0% 9% 12%
Assets Under Management 10.2 11.1 11.6 12.5 13.0 13.4 13.6 4% 3% 1% 9% 17%
Loans/Assets 61% 64% 64% 64% 63% 64% 62%
Securities/Assets 13% 13% 13% 13% 14% 14% 13%
Borrowings/Liabilities 21% 21% 20% 21% 22% 20% 21%
Loans/(Deposits+TL Bonds) (solo) 110% 108% 108% 112% 108% 110% 109%
CAR - solo 14.4% 15.4% 15.0% 15.0% 14.3% 14.0% 12.9%
Tier-I - solo 10.3% 11.4% 10.9% 10.9% 10.4% 10.5% 9.4%
Leverage Ratio 8.2x 7.9x 8.3x 8.6x 9.2x 9.1x 10.3x
25
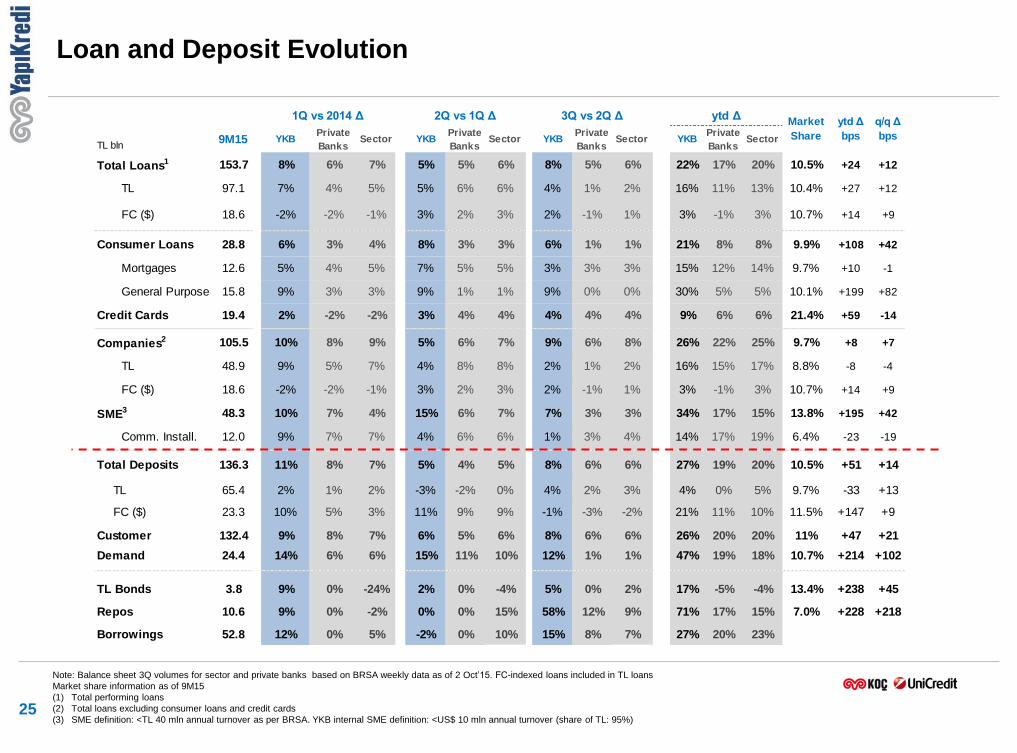
TL bln9M15 YKB
Private
BanksSector YKB
Private
BanksSector YKB
Private
BanksSector YKB
Private
BanksSector
Total Loans1 153.7 8% 6% 7% 5% 5% 6% 8% 5% 6% 22% 17% 20% 10.5% +24 +12
TL 97.1 7% 4% 5% 5% 6% 6% 4% 1% 2% 16% 11% 13% 10.4% +27 +12
FC ($) 18.6 -2% -2% -1% 3% 2% 3% 2% -1% 1% 3% -1% 3% 10.7% +14 +9
Consumer Loans 28.8 6% 3% 4% 8% 3% 3% 6% 1% 1% 21% 8% 8% 9.9% +108 +42
Mortgages 12.6 5% 4% 5% 7% 5% 5% 3% 3% 3% 15% 12% 14% 9.7% +10 -1
General Purpose 15.8 9% 3% 3% 9% 1% 1% 9% 0% 0% 30% 5% 5% 10.1% +199 +82
Credit Cards 19.4 2% -2% -2% 3% 4% 4% 4% 4% 4% 9% 6% 6% 21.4% +59 -14
Companies2 105.5 10% 8% 9% 5% 6% 7% 9% 6% 8% 26% 22% 25% 9.7% +8 +7
TL 48.9 9% 5% 7% 4% 8% 8% 2% 1% 2% 16% 15% 17% 8.8% -8 -4
FC ($) 18.6 -2% -2% -1% 3% 2% 3% 2% -1% 1% 3% -1% 3% 10.7% +14 +9
SME3 48.3 10% 7% 4% 15% 6% 7% 7% 3% 3% 34% 17% 15% 13.8% +195 +42
Comm. Install. 12.0 9% 7% 7% 4% 6% 6% 1% 3% 4% 14% 17% 19% 6.4% -23 -19
Total Deposits 136.3 11% 8% 7% 5% 4% 5% 8% 6% 6% 27% 19% 20% 10.5% +51 +14
TL 65.4 2% 1% 2% -3% -2% 0% 4% 2% 3% 4% 0% 5% 9.7% -33 +13
FC ($) 23.3 10% 5% 3% 11% 9% 9% -1% -3% -2% 21% 11% 10% 11.5% +147 +9
Customer 132.4 9% 8% 7% 6% 5% 6% 8% 6% 6% 26% 20% 20% 11% +47 +21
Demand 24.4 14% 6% 6% 15% 11% 10% 12% 1% 1% 47% 19% 18% 10.7% +214 +102
TL Bonds 3.8 9% 0% -24% 2% 0% -4% 5% 0% 2% 17% -5% -4% 13.4% +238 +45
Repos 10.6 9% 0% -2% 0% 0% 15% 58% 12% 9% 71% 17% 15% 7.0% +228 +218
Borrowings 52.8 12% 0% 5% -2% 0% 10% 15% 8% 7% 27% 20% 23%
q/q Δ
bps
1Q vs 2014 Δ 2Q vs 1Q Δ 3Q vs 2Q Δ ytd ΔMarket
Share
ytd Δ
bps
Loan and Deposit Evolution
Note: Balance sheet 3Q volumes for sector and private banks based on BRSA weekly data as of 2 Oct’15. FC-indexed loans included in TL loans
Market share information as of 9M15
(1) Total performing loans
(2) Total loans excluding consumer loans and credit cards
(3) SME definition: <TL 40 mln annual turnover as per BRSA. YKB internal SME definition: <US$ 10 mln annual turnover (share of TL: 95%)
26
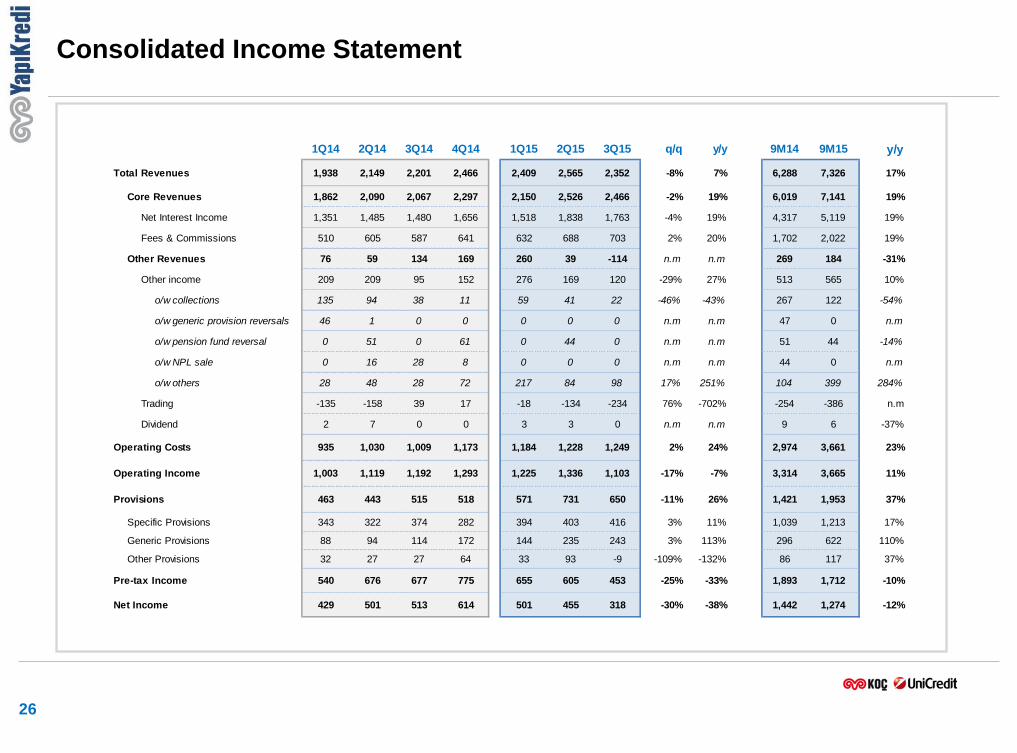
Consolidated Income Statement
1Q14 2Q14 3Q14 4Q14 1Q15 2Q15 3Q15 q/q y/y 9M14 9M15 y/y
Total Revenues 1,938 2,149 2,201 2,466 2,409 2,565 2,352 -8% 7% 6,288 7,326 17%
Core Revenues 1,862 2,090 2,067 2,297 2,150 2,526 2,466 -2% 19% 6,019 7,141 19%
Net Interest Income 1,351 1,485 1,480 1,656 1,518 1,838 1,763 -4% 19% 4,317 5,119 19%
Fees & Commissions 510 605 587 641 632 688 703 2% 20% 1,702 2,022 19%
Other Revenues 76 59 134 169 260 39 -114 n.m n.m 269 184 -31%
Other income 209 209 95 152 276 169 120 -29% 27% 513 565 10%
o/w collections 135 94 38 11 59 41 22 -46% -43% 267 122 -54%
o/w generic provision reversals 46 1 0 0 0 0 0 n.m n.m 47 0 n.m
o/w pension fund reversal 0 51 0 61 0 44 0 n.m n.m 51 44 -14%
o/w NPL sale 0 16 28 8 0 0 0 n.m n.m 44 0 n.m
o/w others 28 48 28 72 217 84 98 17% 251% 104 399 284%
Trading -135 -158 39 17 -18 -134 -234 76% -702% -254 -386 n.m
Dividend 2 7 0 0 3 3 0 n.m n.m 9 6 -37%
Operating Costs 935 1,030 1,009 1,173 1,184 1,228 1,249 2% 24% 2,974 3,661 23%
Operating Income 1,003 1,119 1,192 1,293 1,225 1,336 1,103 -17% -7% 3,314 3,665 11%
Provisions 463 443 515 518 571 731 650 -11% 26% 1,421 1,953 37%
Specific Provisions 343 322 374 282 394 403 416 3% 11% 1,039 1,213 17%
Generic Provisions 88 94 114 172 144 235 243 3% 113% 296 622 110%
Other Provisions 32 27 27 64 33 93 -9 -109% -132% 86 117 37%
Pre-tax Income 540 676 677 775 655 605 453 -25% -33% 1,893 1,712 -10%
Net Income 429 501 513 614 501 455 318 -30% -38% 1,442 1,274 -12%
Bank-Only Income Statement
27
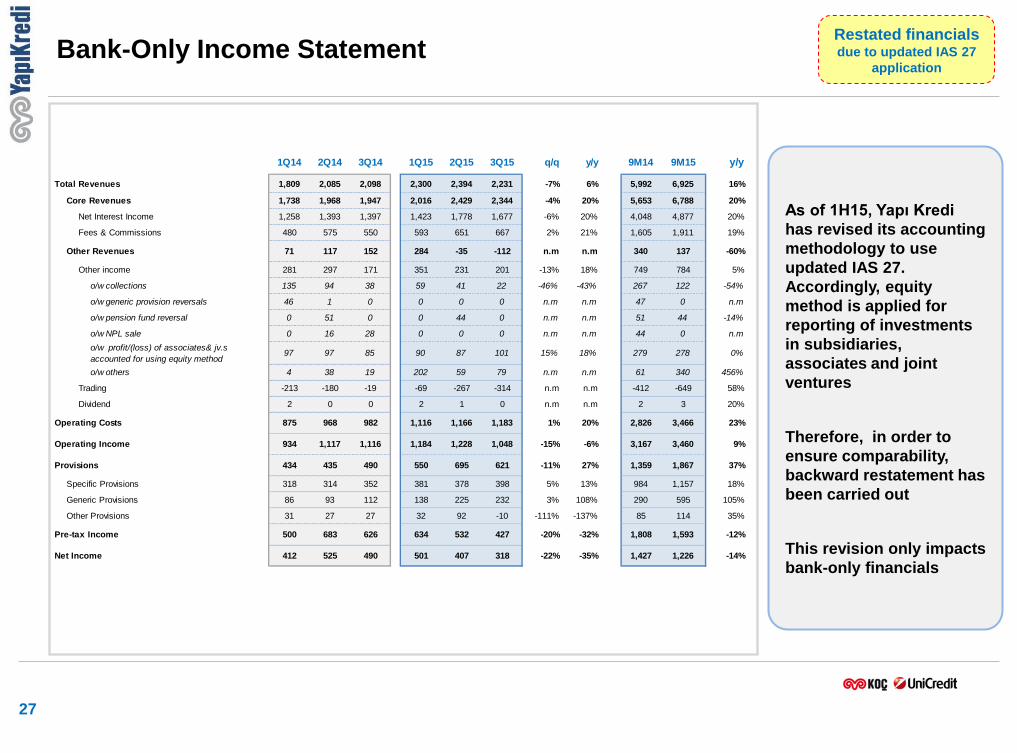
As of 1H15, Yapı Kredi
has revised its accounting
methodology to use
updated IAS 27.
Accordingly, equity
method is applied for
reporting of investments
in subsidiaries,
associates and joint
ventures
Therefore, in order to
ensure comparability,
backward restatement has
been carried out
This revision only impacts
bank-only financials
Restated financials due to updated IAS 27
application
1Q14 2Q14 3Q14 1Q15 2Q15 3Q15 q/q y/y 9M14 9M15 y/y
Total Revenues 1,809 2,085 2,098 2,300 2,394 2,231 -7% 6% 5,992 6,925 16%
Core Revenues 1,738 1,968 1,947 2,016 2,429 2,344 -4% 20% 5,653 6,788 20%
Net Interest Income 1,258 1,393 1,397 1,423 1,778 1,677 -6% 20% 4,048 4,877 20%
Fees & Commissions 480 575 550 593 651 667 2% 21% 1,605 1,911 19%
Other Revenues 71 117 152 284 -35 -112 n.m n.m 340 137 -60%
Other income 281 297 171 351 231 201 -13% 18% 749 784 5%
o/w collections 135 94 38 59 41 22 -46% -43% 267 122 -54%
o/w generic provision reversals 46 1 0 0 0 0 n.m n.m 47 0 n.m
o/w pension fund reversal 0 51 0 0 44 0 n.m n.m 51 44 -14%
o/w NPL sale 0 16 28 0 0 0 n.m n.m 44 0 n.m
o/w profit/(loss) of associates& jv.s
accounted for using equity method 97 97 85 90 87 101 15% 18% 279 278 0%
o/w others 4 38 19 202 59 79 n.m n.m 61 340 456%
Trading -213 -180 -19 -69 -267 -314 n.m n.m -412 -649 58%
Dividend 2 0 0 2 1 0 n.m n.m 2 3 20%
Operating Costs 875 968 982 1,116 1,166 1,183 1% 20% 2,826 3,466 23%
Operating Income 934 1,117 1,116 1,184 1,228 1,048 -15% -6% 3,167 3,460 9%
Provisions 434 435 490 550 695 621 -11% 27% 1,359 1,867 37%
Specific Provisions 318 314 352 381 378 398 5% 13% 984 1,157 18%
Generic Provisions 86 93 112 138 225 232 3% 108% 290 595 105%
Other Provisions 31 27 27 32 92 -10 -111% -137% 85 114 35%
Pre-tax Income 500 683 626 634 532 427 -20% -32% 1,808 1,593 -12%
Net Income 412 525 490 501 407 318 -22% -35% 1,427 1,226 -14%
3.49%3.25%
2.88%2.64%
46.7% 48.4%
Cost/Income excl. one-offs Cost/Income
47.3%50.0%
1,504 1,577
1,442 1,274
28
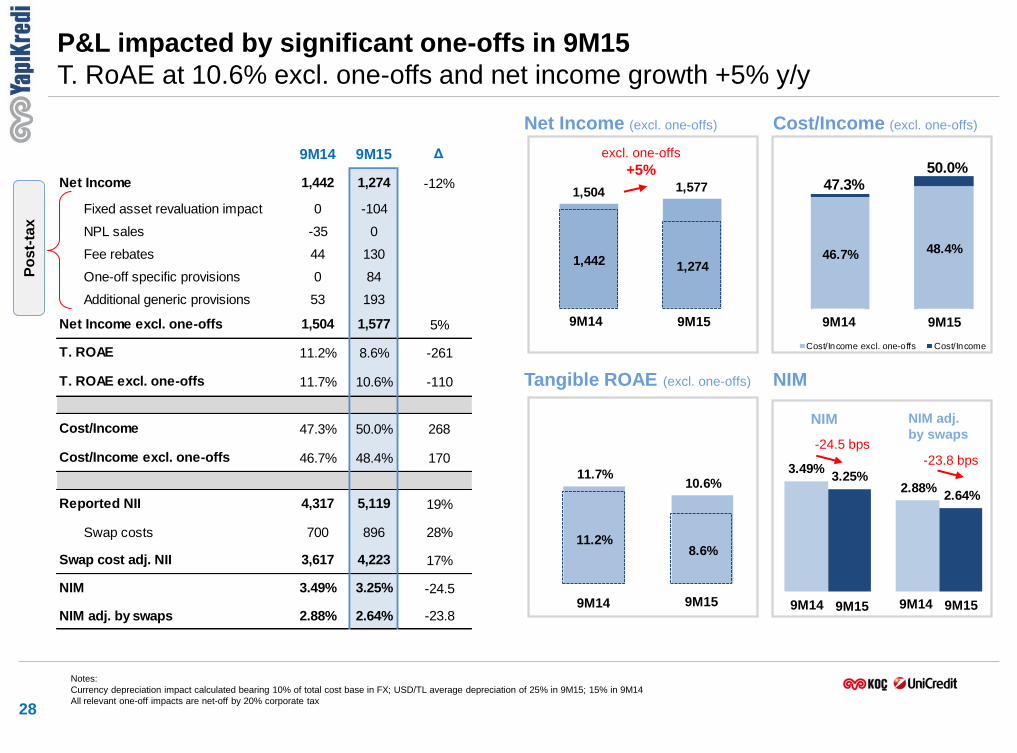
Notes:
Currency depreciation impact calculated bearing 10% of total cost base in FX; USD/TL average depreciation of 25% in 9M15; 15% in 9M14
All relevant one-off impacts are net-off by 20% corporate tax
Cost/Income (excl. one-offs)
NIM
P&L impacted by significant one-offs in 9M15
T. RoAE at 10.6% excl. one-offs and net income growth +5% y/y
9M14 9M15
9M14 9M15 Δ
Net Income 1,442 1,274 -12%
Fixed asset revaluation impact 0 -104
NPL sales -35 0
Fee rebates 44 130
One-off specific provisions 0 84
Additional generic provisions 53 193
Net Income excl. one-offs 1,504 1,577 5%
T. ROAE 11.2% 8.6% -261
T. ROAE excl. one-offs 11.7% 10.6% -110
Cost/Income 47.3% 50.0% 268
Cost/Income excl. one-offs 46.7% 48.4% 170
Reported NII 4,317 5,119 19%
Swap costs 700 896 28%
Swap cost adj. NII 3,617 4,223 17%
NIM 3.49% 3.25% -24.5
NIM adj. by swaps 2.88% 2.64% -23.8
Tangible ROAE (excl. one-offs)
Net Income (excl. one-offs)
9M14 9M15
9M14 9M15 9M14 9M15
excl. one-offs
+5%
Po
st-
tax
11.7%10.6%
11.2%8.6%
-24.5 bps
-23.8 bps
9M14 9M15
NIM NIM adj.
by swaps
29% 28%25% 29%
71% 72% 75% 71%
9M14 2014 1H15 9M15
29
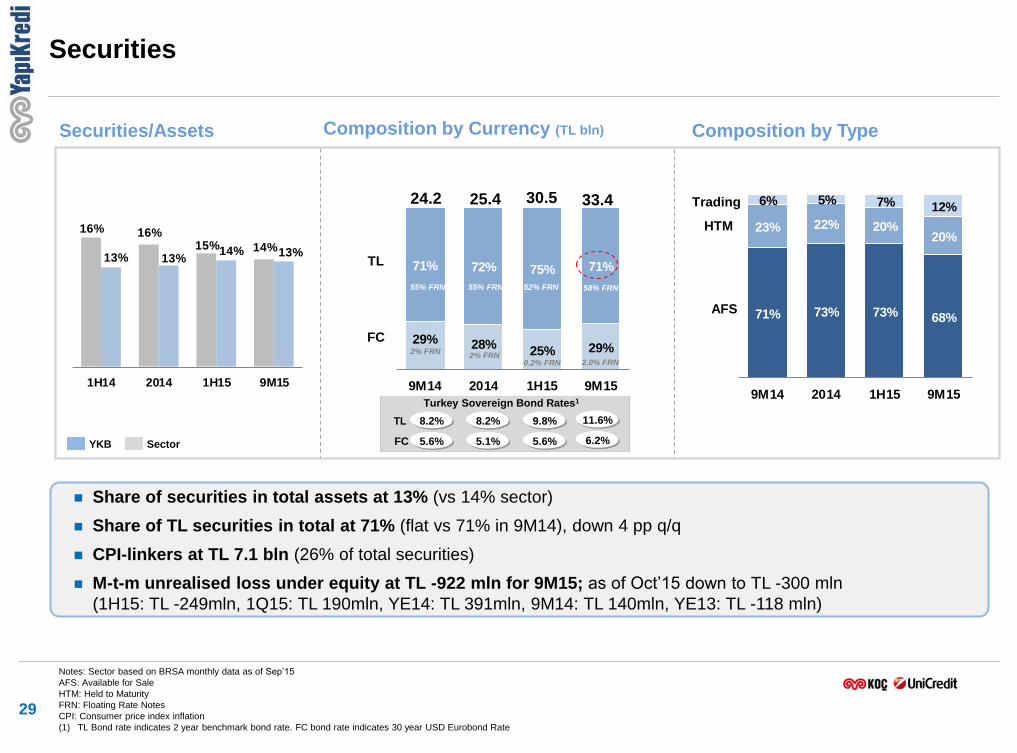
Notes: Sector based on BRSA monthly data as of Sep’15
AFS: Available for Sale
HTM: Held to Maturity
FRN: Floating Rate Notes
CPI: Consumer price index inflation
(1) TL Bond rate indicates 2 year benchmark bond rate. FC bond rate indicates 30 year USD Eurobond Rate
Share of securities in total assets at 13% (vs 14% sector)
Share of TL securities in total at 71% (flat vs 71% in 9M14), down 4 pp q/q
CPI-linkers at TL 7.1 bln (26% of total securities)
M-t-m unrealised loss under equity at TL -922 mln for 9M15; as of Oct’15 down to TL -300 mln
(1H15: TL -249mln, 1Q15: TL 190mln, YE14: TL 391mln, 9M14: TL 140mln, YE13: TL -118 mln)
Trading
AFS
HTM
Securities/Assets Composition by Currency (TL bln) Composition by Type
Sector YKB
Turkey Sovereign Bond Rates1
TL
FC
30.5
8.2%
5.6%
9.8%
5.6%
Securities
8.2%
5.1%
TL
FC
25.4 24.2
2% FRN
55% FRN
2% FRN
55% FRN
0.2% FRN
52% FRN
16% 16%15% 14%
13% 13%14% 13%
1H14 2014 1H15 9M15
33.4
58% FRN
2.0% FRN
11.6%
6.2%
71% 73% 73% 68%
23% 22% 20%20%
6% 5% 7% 12%
9M14 2014 1H15 9M15
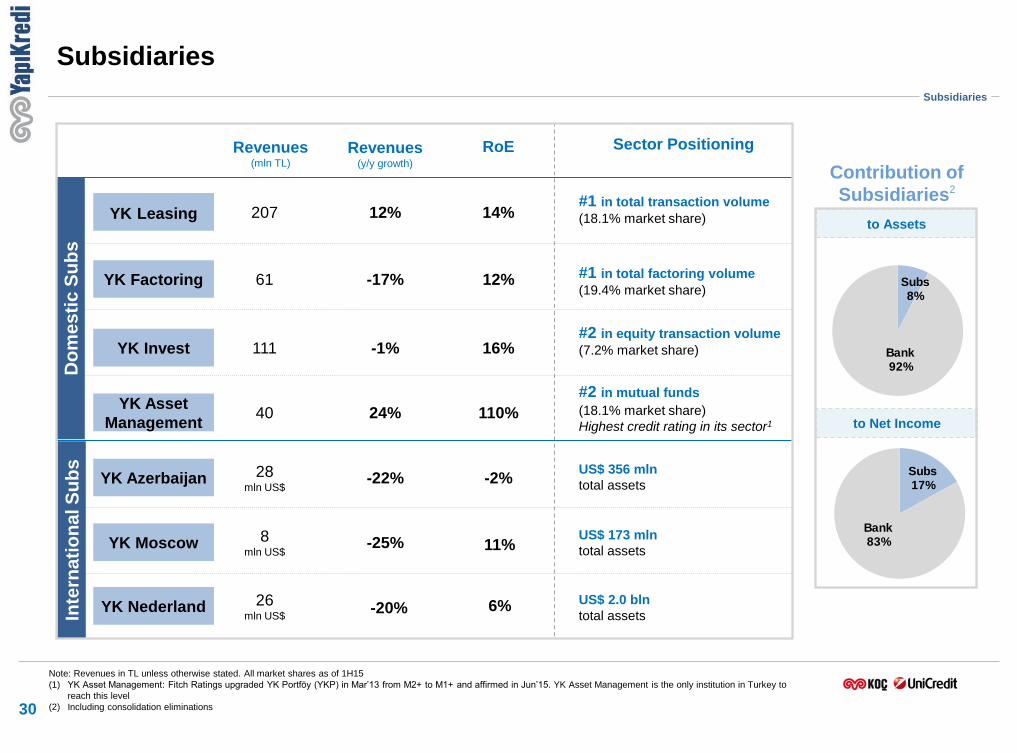
Subsidiaries
30
Revenues (y/y growth)
Sector Positioning
-22%
-25%
Note: Revenues in TL unless otherwise stated. All market shares as of 1H15
(1) YK Asset Management: Fitch Ratings upgraded YK Portföy (YKP) in Mar’13 from M2+ to M1+ and affirmed in Jun’15. YK Asset Management is the only institution in Turkey to
reach this level
(2) Including consolidation eliminations
-17%
12% #1 in total transaction volume
(18.1% market share)
#1 in total factoring volume
(19.4% market share)
-1%
#2 in equity transaction volume
(7.2% market share)
24%
#2 in mutual funds
(18.1% market share)
Highest credit rating in its sector1
US$ 356 mln
total assets
US$ 173 mln
total assets
US$ 2.0 bln
total assets Inte
rna
tio
na
l S
ub
s
Subsidiaries
to Net Income
Contribution of
Subsidiaries2
to Assets
RoE
-2%
12%
14%
16%
110%
YK Leasing
YK Factoring
YK Invest
YK Asset
Management
YK Moscow
YK Nederland
YK Azerbaijan
Revenues (mln TL)
207
61
28 mln US$
111
40
8 mln US$
26 mln US$
Do
me
sti
c S
ub
s
11%
6%
-20%
Subs17%
Bank83%
Subs8%
Bank92%
Borrowings
Borrowings: 21% of total liabilities In
tern
ati
on
al
Do
me
sti
c
31
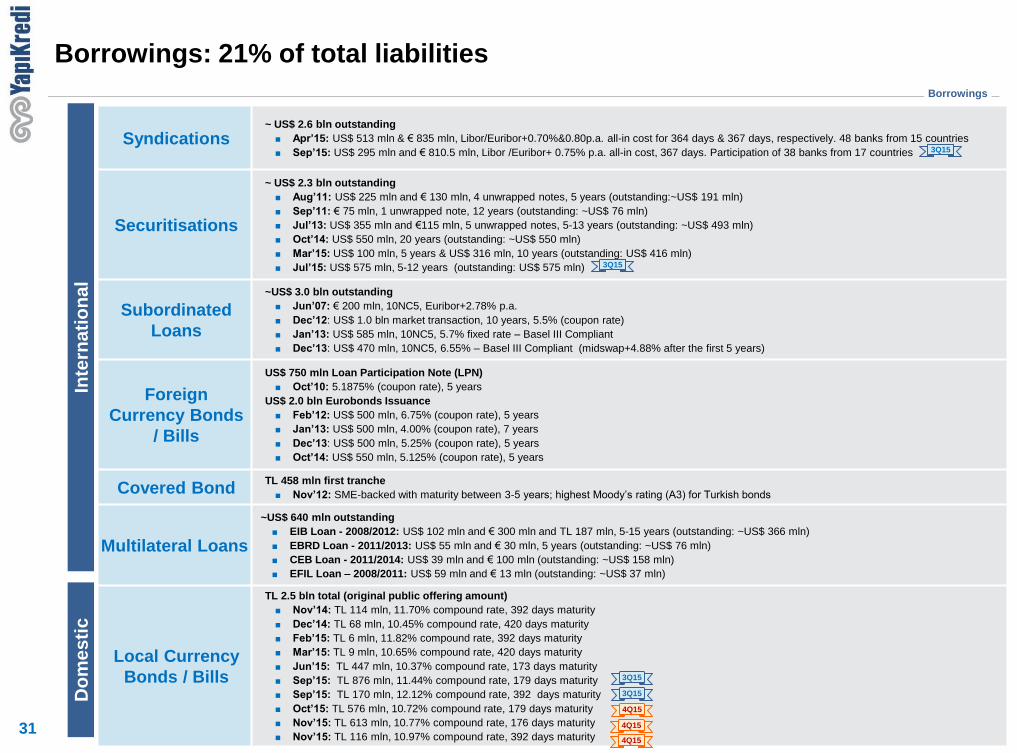
Syndications ~ US$ 2.6 bln outstanding
Apr’15: US$ 513 mln & € 835 mln, Libor/Euribor+0.70%&0.80p.a. all-in cost for 364 days & 367 days, respectively. 48 banks from 15 countries
Sep’15: US$ 295 mln and € 810.5 mln, Libor /Euribor+ 0.75% p.a. all-in cost, 367 days. Participation of 38 banks from 17 countries
Securitisations
~ US$ 2.3 bln outstanding
Aug’11: US$ 225 mln and € 130 mln, 4 unwrapped notes, 5 years (outstanding:~US$ 191 mln)
Sep’11: € 75 mln, 1 unwrapped note, 12 years (outstanding: ~US$ 76 mln)
Jul’13: US$ 355 mln and €115 mln, 5 unwrapped notes, 5-13 years (outstanding: ~US$ 493 mln)
Oct’14: US$ 550 mln, 20 years (outstanding: ~US$ 550 mln)
Mar’15: US$ 100 mln, 5 years & US$ 316 mln, 10 years (outstanding: US$ 416 mln)
Jul’15: US$ 575 mln, 5-12 years (outstanding: US$ 575 mln)
Subordinated
Loans
~US$ 3.0 bln outstanding
Jun’07: € 200 mln, 10NC5, Euribor+2.78% p.a.
Dec’12: US$ 1.0 bln market transaction, 10 years, 5.5% (coupon rate)
Jan’13: US$ 585 mln, 10NC5, 5.7% fixed rate – Basel III Compliant
Dec’13: US$ 470 mln, 10NC5, 6.55% – Basel III Compliant (midswap+4.88% after the first 5 years)
Foreign
Currency Bonds
/ Bills
US$ 750 mln Loan Participation Note (LPN)
Oct’10: 5.1875% (coupon rate), 5 years
US$ 2.0 bln Eurobonds Issuance
Feb’12: US$ 500 mln, 6.75% (coupon rate), 5 years
Jan’13: US$ 500 mln, 4.00% (coupon rate), 7 years
Dec’13: US$ 500 mln, 5.25% (coupon rate), 5 years
Oct’14: US$ 550 mln, 5.125% (coupon rate), 5 years
Covered Bond TL 458 mln first tranche
Nov’12: SME-backed with maturity between 3-5 years; highest Moody’s rating (A3) for Turkish bonds
Multilateral Loans
~US$ 640 mln outstanding
EIB Loan - 2008/2012: US$ 102 mln and € 300 mln and TL 187 mln, 5-15 years (outstanding: ~US$ 366 mln)
EBRD Loan - 2011/2013: US$ 55 mln and € 30 mln, 5 years (outstanding: ~US$ 76 mln)
CEB Loan - 2011/2014: US$ 39 mln and € 100 mln (outstanding: ~US$ 158 mln)
EFIL Loan – 2008/2011: US$ 59 mln and € 13 mln (outstanding: ~US$ 37 mln)
Local Currency
Bonds / Bills
TL 2.5 bln total (original public offering amount)
Nov’14: TL 114 mln, 11.70% compound rate, 392 days maturity
Dec’14: TL 68 mln, 10.45% compound rate, 420 days maturity
Feb’15: TL 6 mln, 11.82% compound rate, 392 days maturity
Mar’15: TL 9 mln, 10.65% compound rate, 420 days maturity
Jun’15: TL 447 mln, 10.37% compound rate, 173 days maturity
Sep’15: TL 876 mln, 11.44% compound rate, 179 days maturity
Sep’15: TL 170 mln, 12.12% compound rate, 392 days maturity
Oct’15: TL 576 mln, 10.72% compound rate, 179 days maturity
Nov’15: TL 613 mln, 10.77% compound rate, 176 days maturity
Nov’15: TL 116 mln, 10.97% compound rate, 392 days maturity
3Q15
3Q15
3Q15
3Q15
4Q15
4Q15
4Q15
32
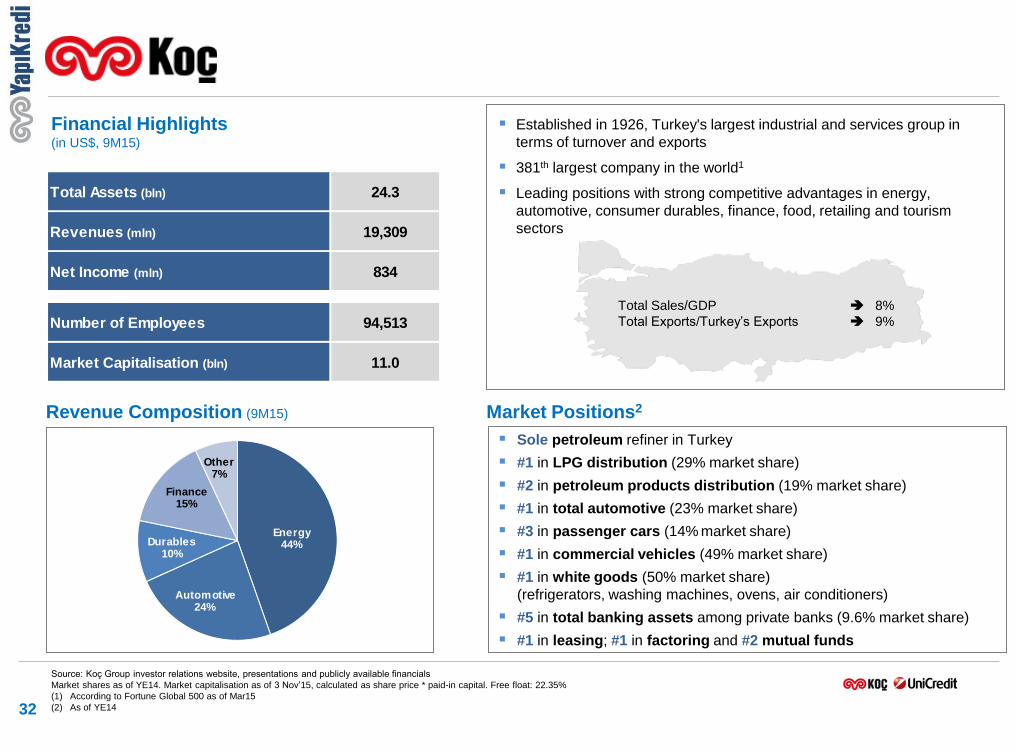
Sole petroleum refiner in Turkey
#1 in LPG distribution (29% market share)
#2 in petroleum products distribution (19% market share)
#1 in total automotive (23% market share)
#3 in passenger cars (14% market share)
#1 in commercial vehicles (49% market share)
#1 in white goods (50% market share)
(refrigerators, washing machines, ovens, air conditioners)
#5 in total banking assets among private banks (9.6% market share)
#1 in leasing; #1 in factoring and #2 mutual funds
Established in 1926, Turkey's largest industrial and services group in
terms of turnover and exports
381th largest company in the world1
Leading positions with strong competitive advantages in energy,
automotive, consumer durables, finance, food, retailing and tourism
sectors
Total Sales/GDP
Total Exports/Turkey’s Exports
8%
9%
Source: Koç Group investor relations website, presentations and publicly available financials
Market shares as of YE14. Market capitalisation as of 3 Nov’15, calculated as share price * paid-in capital. Free float: 22.35%
(1) According to Fortune Global 500 as of Mar15
(2) As of YE14
Revenue Composition (9M15) Market Positions2
Financial Highlights (in US$, 9M15)
Energy44%
Automotive24%
Durables10%
Finance15%
Other7%
Total Assets (bln) 24.3
Revenues (mln) 19,309
Net Income (mln) 834
Number of Employees 94,513
Market Capitalisation (bln) 11.0
Italy50%
CEE16%
Poland7%
Germany18%
Austria9%
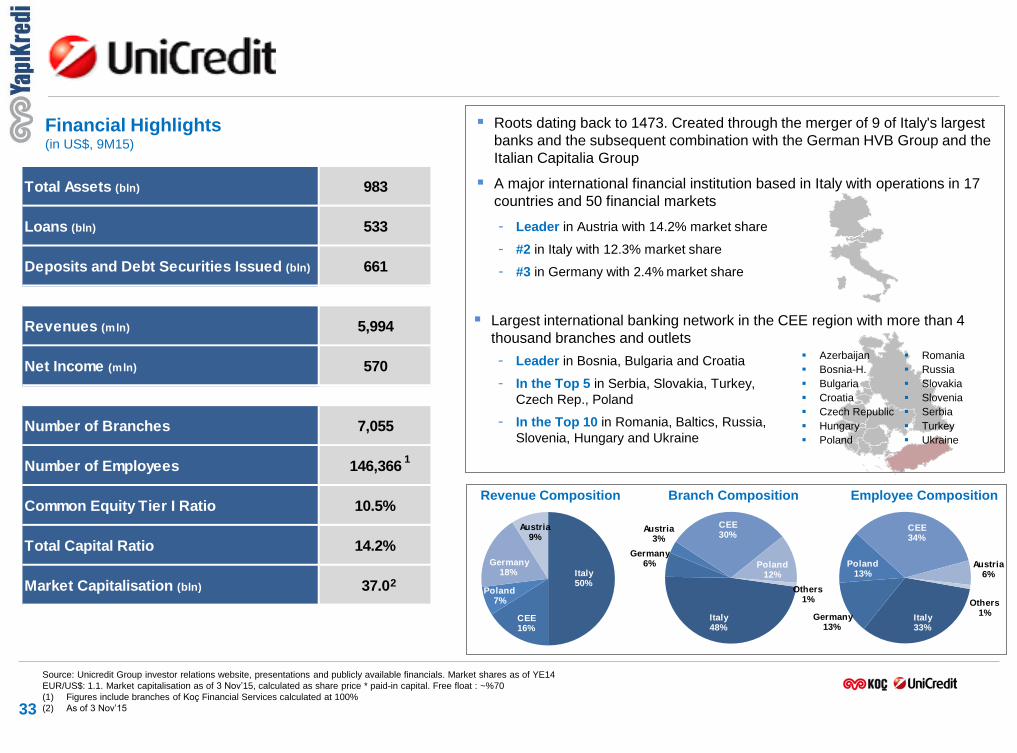
Total Assets (bln) 983
Loans (bln) 533
Deposits and Debt Securities Issued (bln) 661
Revenues (mln) 5,994
Net Income (mln) 570
Number of Branches 7,055
Number of Employees 146,366
Common Equity Tier I Ratio 10.5%
Total Capital Ratio 14.2%
Market Capitalisation (bln) 37.0
Italy48%
Germany6%
Austria3%
CEE30%
Poland12%
Others1%
- Leader in Austria with 14.2% market share
- #2 in Italy with 12.3% market share
- #3 in Germany with 2.4% market share
33
Azerbaijan
Bosnia-H.
Bulgaria
Croatia
Czech Republic
Hungary
Poland
Roots dating back to 1473. Created through the merger of 9 of Italy's largest
banks and the subsequent combination with the German HVB Group and the
Italian Capitalia Group
A major international financial institution based in Italy with operations in 17
countries and 50 financial markets
- Leader in Bosnia, Bulgaria and Croatia
- In the Top 5 in Serbia, Slovakia, Turkey,
Czech Rep., Poland
- In the Top 10 in Romania, Baltics, Russia,
Slovenia, Hungary and Ukraine
Largest international banking network in the CEE region with more than 4
thousand branches and outlets
Revenue Composition Employee Composition Branch Composition
Financial Highlights (in US$, 9M15)
Source: Unicredit Group investor relations website, presentations and publicly available financials. Market shares as of YE14
EUR/US$: 1.1. Market capitalisation as of 3 Nov’15, calculated as share price * paid-in capital. Free float : ~%70
(1) Figures include branches of Koç Financial Services calculated at 100%
(2) As of 3 Nov’15
Romania
Russia
Slovakia
Slovenia
Serbia
Turkey
Ukraine
1
2
Italy 33%
Germany13%
Poland13%
CEE34%
Austria6%
Others1%
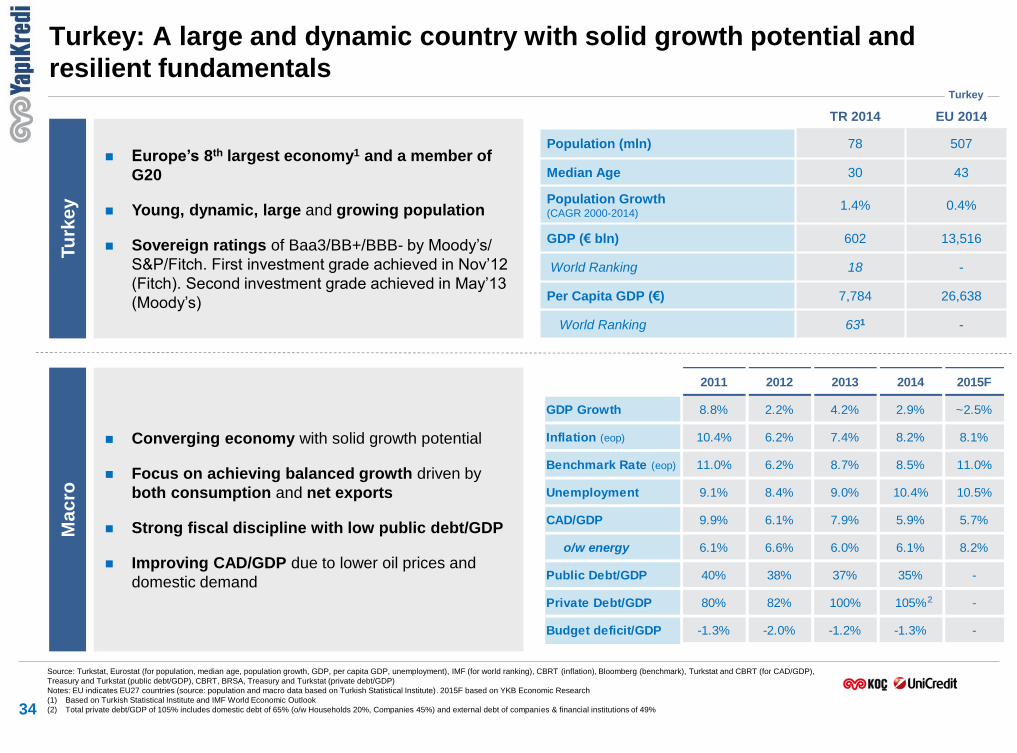
2011 2012 2013 2014 2015F
GDP Growth 8.8% 2.2% 4.2% 2.9% ~2.5%
Inflation (eop) 10.4% 6.2% 7.4% 8.2% 8.1%
Benchmark Rate (eop) 11.0% 6.2% 8.7% 8.5% 11.0%
Unemployment 9.1% 8.4% 9.0% 10.4% 10.5%
CAD/GDP 9.9% 6.1% 7.9% 5.9% 5.7%
o/w energy 6.1% 6.6% 6.0% 6.1% 8.2%
Public Debt/GDP 40% 38% 37% 35% -
Private Debt/GDP 80% 82% 100% 105% -
Budget deficit/GDP -1.3% -2.0% -1.2% -1.3% -
Turkey: A large and dynamic country with solid growth potential and
resilient fundamentals
34
Europe’s 8th largest economy1 and a member of
G20
Young, dynamic, large and growing population
Sovereign ratings of Baa3/BB+/BBB- by Moody’s/
S&P/Fitch. First investment grade achieved in Nov’12
(Fitch). Second investment grade achieved in May’13
(Moody’s)
Tu
rke
y
Converging economy with solid growth potential
Focus on achieving balanced growth driven by
both consumption and net exports
Strong fiscal discipline with low public debt/GDP
Improving CAD/GDP due to lower oil prices and
domestic demand
Source: Turkstat, Eurostat (for population, median age, population growth, GDP, per capita GDP, unemployment), IMF (for world ranking), CBRT (inflation), Bloomberg (benchmark), Turkstat and CBRT (for CAD/GDP),
Treasury and Turkstat (public debt/GDP), CBRT, BRSA, Treasury and Turkstat (private debt/GDP)
Notes: EU indicates EU27 countries (source: population and macro data based on Turkish Statistical Institute). 2015F based on YKB Economic Research
(1) Based on Turkish Statistical Institute and IMF World Economic Outlook
(2) Total private debt/GDP of 105% includes domestic debt of 65% (o/w Households 20%, Companies 45%) and external debt of companies & financial institutions of 49%
Ma
cro
TR 2014 EU 2014
Population (mln) 78 507
Median Age 30 43
Population Growth (CAGR 2000-2014)
1.4% 0.4%
GDP (€ bln) 602 13,516
World Ranking 18 -
Per Capita GDP (€) 7,784 26,638
World Ranking 631 -
2
Turkey
20%
7%
42%
23%
7%
8%
2007 2008 2009 2010 2011 2012 2013 2014
59%
67%
118%
82%
55%
59%
2007 2008 2009 2010 2011 2012 2013 2014
402
145
EU-27 Turkey
225%
137%
EU-27 Turkey
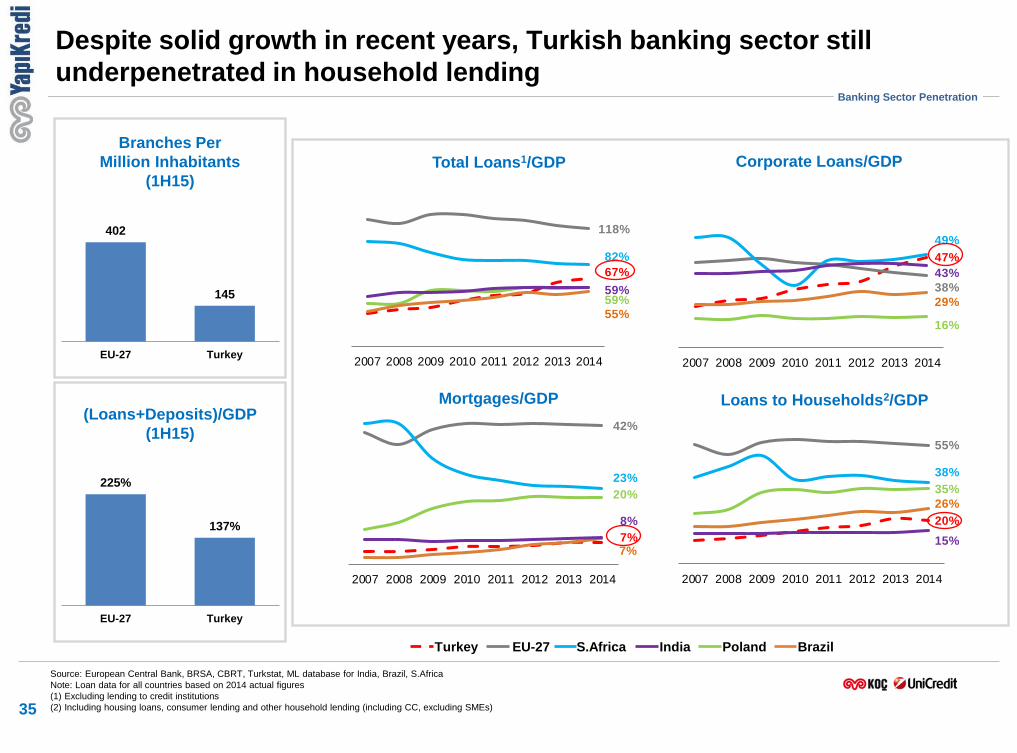
Branches Per
Million Inhabitants
(1H15)
Despite solid growth in recent years, Turkish banking sector still
underpenetrated in household lending
(Loans+Deposits)/GDP
(1H15)
Source: European Central Bank, BRSA, CBRT, Turkstat, ML database for India, Brazil, S.Africa
Note: Loan data for all countries based on 2014 actual figures
(1) Excluding lending to credit institutions
(2) Including housing loans, consumer lending and other household lending (including CC, excluding SMEs)
Corporate Loans/GDP
Mortgages/GDP
Total Loans1/GDP
35
Banking Sector Penetration
16%
47%
38%
49%
29%
43%
2007 2008 2009 2010 2011 2012 2013 2014
35%
20%
55%
38%
26%
15%
2007 2008 2009 2010 2011 2012 2013 2014
Loans to Households2/GDP
Turkey EU-27 S.Africa India Poland Brazil
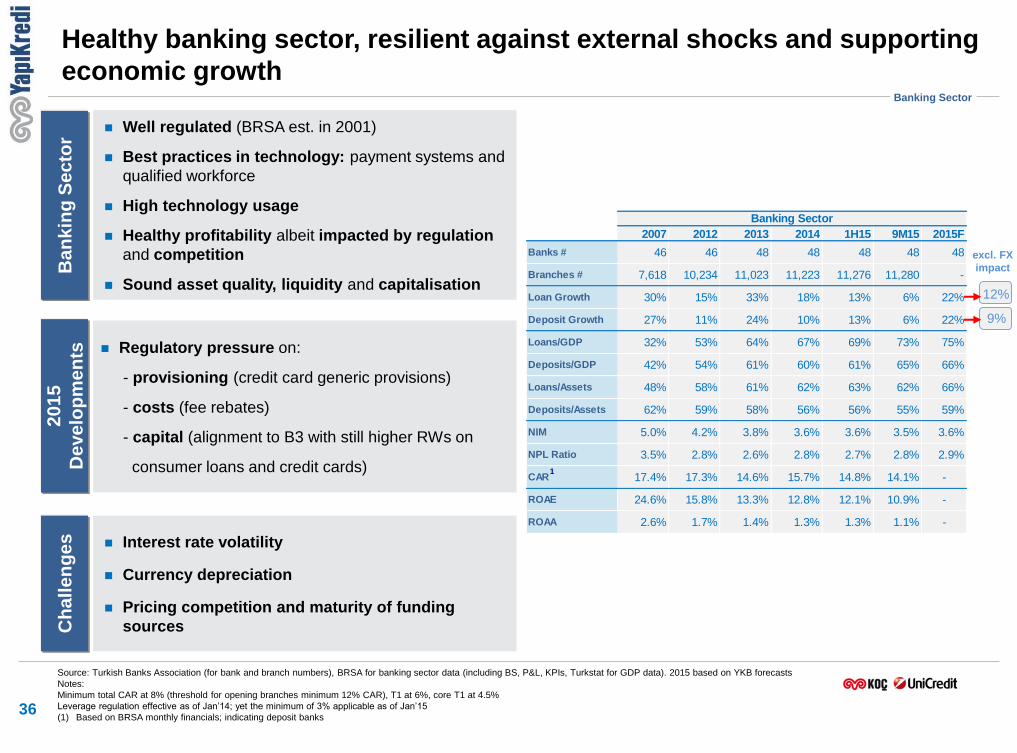
2007 2012 2013 2014 1H15 9M15 2015F
Banks # 46 46 48 48 48 48 48
Branches # 7,618 10,234 11,023 11,223 11,276 11,280 -
Loan Growth 30% 15% 33% 18% 13% 6% 22%
Deposit Growth 27% 11% 24% 10% 13% 6% 22%
Loans/GDP 32% 53% 64% 67% 69% 73% 75%
Deposits/GDP 42% 54% 61% 60% 61% 65% 66%
Loans/Assets 48% 58% 61% 62% 63% 62% 66%
Deposits/Assets 62% 59% 58% 56% 56% 55% 59%
NIM 5.0% 4.2% 3.8% 3.6% 3.6% 3.5% 3.6%
NPL Ratio 3.5% 2.8% 2.6% 2.8% 2.7% 2.8% 2.9%
CAR 17.4% 17.3% 14.6% 15.7% 14.8% 14.1% -
ROAE 24.6% 15.8% 13.3% 12.8% 12.1% 10.9% -
ROAA 2.6% 1.7% 1.4% 1.3% 1.3% 1.1% -
Banking Sector
Well regulated (BRSA est. in 2001)
Best practices in technology: payment systems and
qualified workforce
High technology usage
Healthy profitability albeit impacted by regulation
and competition
Sound asset quality, liquidity and capitalisation
Ba
nk
ing
Se
cto
r
36
Healthy banking sector, resilient against external shocks and supporting
economic growth 2
01
5
De
ve
lop
me
nts
Regulatory pressure on:
- provisioning (credit card generic provisions)
- costs (fee rebates)
- capital (alignment to B3 with still higher RWs on
consumer loans and credit cards)
Interest rate volatility
Currency depreciation
Pricing competition and maturity of funding
sources
Banking Sector
Source: Turkish Banks Association (for bank and branch numbers), BRSA for banking sector data (including BS, P&L, KPIs, Turkstat for GDP data). 2015 based on YKB forecasts
Notes:
Minimum total CAR at 8% (threshold for opening branches minimum 12% CAR), T1 at 6%, core T1 at 4.5%
Leverage regulation effective as of Jan’14; yet the minimum of 3% applicable as of Jan’15
(1) Based on BRSA monthly financials; indicating deposit banks
Ch
all
en
ge
s
1
excl. FX
impact
12%
9%
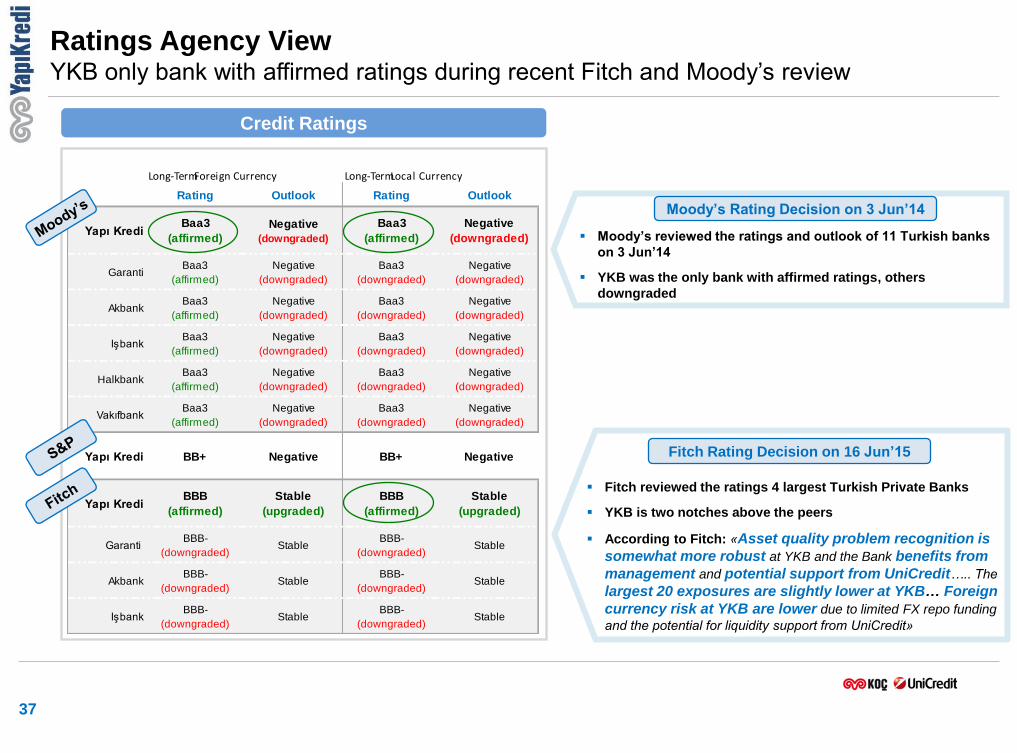
Rating Outlook Rating Outlook
Yapı KrediBaa3
(affirmed)
Negative
(downgraded)
Baa3
(affirmed)
Negative
(downgraded)
GarantiBaa3
(affirmed)
Negative
(downgraded)
Baa3
(downgraded)
Negative
(downgraded)
AkbankBaa3
(affirmed)
Negative
(downgraded)
Baa3
(downgraded)
Negative
(downgraded)
IşbankBaa3
(affirmed)
Negative
(downgraded)
Baa3
(downgraded)
Negative
(downgraded)
HalkbankBaa3
(affirmed)
Negative
(downgraded)
Baa3
(downgraded)
Negative
(downgraded)
VakıfbankBaa3
(affirmed)
Negative
(downgraded)
Baa3
(downgraded)
Negative
(downgraded)
Yapı Kredi BB+ Negative BB+ Negative
Yapı KrediBBB
(affirmed)
Stable
(upgraded)
BBB
(affirmed)
Stable
(upgraded)
Garanti BBB-
(downgraded)Stable
BBB-
(downgraded)Stable
Akbank BBB-
(downgraded)Stable
BBB-
(downgraded)Stable
IşbankBBB-
(downgraded)Stable
BBB-
(downgraded)Stable
Long-Term Foreign Currency Long-Term Local Currency
37
Credit Ratings
Ratings Agency View YKB only bank with affirmed ratings during recent Fitch and Moody’s review
Moody’s reviewed the ratings and outlook of 11 Turkish banks
on 3 Jun’14
YKB was the only bank with affirmed ratings, others
downgraded
Moody’s Rating Decision on 3 Jun’14
Fitch Rating Decision on 16 Jun’15
Fitch reviewed the ratings 4 largest Turkish Private Banks
YKB is two notches above the peers
According to Fitch: «Asset quality problem recognition is
somewhat more robust at YKB and the Bank benefits from
management and potential support from UniCredit….. The
largest 20 exposures are slightly lower at YKB… Foreign
currency risk at YKB are lower due to limited FX repo funding
and the potential for liquidity support from UniCredit»
Yapı Kredi Head Office
Yapı Kredi Plaza D Blok
Levent 34330 Istanbul - TURKEY
Tel: +90 (212) 339 73 23
Email: [email protected]
Web: http://www.yapikredi.com.tr/en/investor-relations
Contact Investor Relations
Strong Analyst Coverage
35 Equity Analysts
10 Fixed Income Analysts
> 800 fixed income meetings
> 2,400 equity meetings
and participation in >130 conferences /
roadshows in US, UK, Europe, Middle-East
and Asia over the past ~4 years
38