yarra ranges air quality
TRANSCRIPT


Yarra Ranges air quality – technical report
2
Executive summary
This report presents a review of air pollution monitoring data on PM2.5 (fine particles) and what we currently know about the air quality in the Yarra Ranges Council. The report outlines known sources of air pollution, air quality monitoring data and options to manage air pollution impacts.
Overall, the air pollution levels measured in the Yarra Ranges are low and the air quality of the region is mostly good. EPA’s air quality data shows that Yarra Ranges sometimes experiences poor air quality. The worst air quality in recent years was mostly from bushfire smoke. Communities in narrow valleys, such as Healesville and Warburton, are more likely to experience poor air quality. This is because the smoke becomes trapped when there is little or no wind, cooler temperatures and local terrain stop it from being dispersed. In the colder months, air quality is also impacted by smoke from wood heaters, residential or property burn-offs and agricultural burning.
EPA is developing a community-led smoke management program in the Yarra Ranges. This pilot program collaborates directly with local community members to help shape and develop a set of community resources to better manage local smoke events and build upon the information identified in this report.

Yarra Ranges air quality – Technical report
3
Contents
Executive summary..................................................................................................................................... 2
Introduction ................................................................................................................................................. 4
Air quality and health ................................................................................................................................. 4
Background ................................................................................................................................................. 8
The Yarra Ranges ..................................................................................................................................... 8
Sources of air pollution and impacts in the Yarra Ranges .......................................................................... 8
Topography ............................................................................................................................................... 9
Climate ...................................................................................................................................................... 9
Air pollution (PM2.5) monitoring ................................................................................................................ 12
Air pollution (PM2.5) monitoring sites ........................................................................................................ 12
Air pollution (PM2.5) monitoring results ..................................................................................................... 12
PM2.5 24-hour average concentrations .................................................................................................. 13
PM2.5 hourly concentrations .................................................................................................................. 14
PM2.5 monitoring during planned burns and bushfires in the Yarra Ranges ........................................... 15
Discussion ................................................................................................................................................. 16
Conclusion and recommendations .......................................................................................................... 17
Appendix.................................................................................................................................................... 18

Yarra Ranges air quality – technical report
4
Introduction
The Yarra Ranges region of Victoria is unique and boasts an environment that is attractive to both its residents and to visitors from around the state, Australia and the world. It has a significant national park, a mixture of mountains, valleys, open agricultural areas and numerous special features in its gardens, holiday venues, parks and wineries.
To protect and enhance the local environment in this region, we must understand the pressures on these values to enable the development and implementation of effective management approaches.
Air quality in the area is known to be impacted by smoke. Smoke can impact:
• community health
• regional agriculture for example smoke taint in wine grapes
• local economic activity such as tourism.
One approach to manage smoke impact is to develop a community-led action plan for smoke.
The first step in implementing effective management approaches is to understand the factors that contribute to producing the smoke impacts in the area.
The aim of this report is to set out what EPA understands about the state of air quality and the sources of air pollution in the Yarra Ranges Council. This will inform and guide the next stage of the community-led smoke management plan development.
The report is based on historical and recent air pollution monitoring data collected in the area. We collected this data at one long-term fixed air quality monitoring site in Mooroolbark, two short-term sites in Warburton and Healesville. We also used data collected during several periods of incident air monitoring during bushfires and planned burning.
Air quality and health
The most common air pollutant in the Yarra Ranges is smoke, which contains fine particles. Particle pollutants are a mixture of solid particles and liquid droplets; this mixture is commonly referred to as an aerosol. These particles are very small and are measured in microns or micrometers (µm). To demonstrate the relative size of these particles, they are often compared with fine beach sand and a strand of human hair as shown in Figure 1.

Yarra Ranges air quality – Technical report
5
Figure 1: Comparison between fine beach sand (90 µm), human hair (50–70 µm), PM10 and PM2.5
(US EPA 2018 epa.gov/pm-pollution/particulate-matter-pm-basics).
PM2.5 are particles that are equal to or smaller than 2.5 µm (0.0025 mm) in aerodynamic diameter. Often described as fine particles, they are up to 30 times smaller than the width of a human hair. PM2.5 is produced from the combustion of a range of materials such as fossil fuels, organic matter, rubber and plastic. Motor vehicles, power plant emissions and bushfires are all major sources of PM2.5.
Breathing in these fine particles can cause health effects such as decreased lung function, increased respiratory symptoms, increased cardiovascular and cardiopulmonary diseases, particularly for sensitive populations. People who are more sensitive to smoke can be particularly impacted. These include:
• people over 65
• children under 14
• pregnant women
• people with existing lung and heart conditions.
Sensitive people can experience health effects as the result of modest changes in air quality – even before a standard is exceeded. Extended periods of slightly elevated PM2.5 concentrations can equally cause health impacts in these sensitive people. Often these sources are due to smoke being generated by local burning. It is important to reduce smoke generating activities for the benefit of the entire community, including more sensitive members of the community.
For more information refer to EPA’s website (epa.vic.gov.au/for-community/environmental-information/air-quality/smoke/smoke-your-health).
We publish air quality data on EPA AirWatch (epa.vic.gov.au/airwatch). This information is updated hourly and reports air quality using new, nationally consistent categories for PM2.5: Good, Fair, Poor, Very Poor and Extremely Poor. Each category has general health advice, with steps that can be taken to protect individuals from the short-term effects of air pollution. These are summarised below in Table 1 and further information

Yarra Ranges air quality – technical report
6
is available about air quality categories on EPA’s website (epa.vic.gov.au/for-community/monitoring-your-environment/about-epa-airwatch/air-quality-categories).
Table 1. Air quality categories and general health advice
Category General health advice For groups sensitive to air pollution (epa.vic.gov.au/for-community/monitoring-your-environment/about-epa-airwatch/air-pollution-sensitivity)
Good No change needed to your normal outdoor activities.
N/A
Fair The air quality is okay, but it could change soon.
No change needed to your normal outdoor activities.
Reduce outdoor physical activity if you develop symptoms like a cough or shortness of breath.
Consider closing windows and doors until outdoor air quality is better.
Follow the treatment plan recommended by your doctor.
If you are concerned about symptoms call Nurse On Call (health.vic.gov.au/primary-and-community-health/primary-care/nurse-on-call) on 1300 606 024 or see your doctor.
If you or anyone in your care has trouble breathing or tightness in the chest, call 000 for an ambulance.
Poor The air is probably dusty or smoky.
Reduce outdoor physical activity if you develop symptoms like a cough or shortness of breath.
Avoid outdoor physical activity if you develop symptoms like a cough or shortness of breath.
When indoors, close windows and doors until outdoor air quality is better.
Follow the treatment plan recommended by your doctor.
If you are concerned about symptoms call Nurse On Call (health.vic.gov.au/primary-and-community-health/primary-care/nurse-on-call) on 1300 606 024 or see your doctor.
If you or anyone in your care has trouble breathing or tightness in the chest, call 000 for an ambulance.
Very poor The air is probably very dusty or smoky.
Avoid outdoor physical activity if you develop symptoms like a cough or shortness of breath.
When indoors, close windows and doors until outdoor air quality is better.
Stay indoors as much as possible with windows and doors closed until outdoor air quality is better.
If you feel that the air in your home is uncomfortable, consider going to a place with cleaner air (such as an air-conditioned building like a library or shopping centre) if it is safe to do so.
Actively monitor symptoms and follow any treatment plan recommended by your doctor.
If you are concerned about symptoms call Nurse On Call (health.vic.gov.au/primary-and-

Yarra Ranges air quality – Technical report
7
community-health/primary-care/nurse-on-call) on 1300 606 024 or see your doctor.
If you or anyone in your care has trouble breathing or tightness in the chest, call 000 for an ambulance.
Extremely poor
The air is probably extremely dusty or smoky.
Stay indoors as much as possible with windows and doors closed until outdoor air quality is better.
If you feel that the air in your home is uncomfortable, consider going to a place with cleaner air (such as an air-conditioned building like a library or shopping centre) if it is safe to do so.
Stay indoors with windows and doors closed until outdoor air quality is better and reduce indoor activity.
If you feel that the air in your home is uncomfortable, consider going to a place with cleaner air (such as an air-conditioned building like a library or shopping centre) if it is safe to do so.
Actively monitor symptoms and follow the treatment plan recommended by your doctor.
If you are concerned about symptoms call Nurse On Call (health.vic.gov.au/primary-and-community-health/primary-care/nurse-on-call)on 1300 606 024 or see your doctor.
If you or anyone in your care has trouble breathing or tightness in the chest, call 000 for an ambulance.

Yarra Ranges air quality – technical report
8
Background
The Yarra Ranges
For the purpose of this report, the Yarra Ranges is the area defined in the Yarra Ranges Council, as defined in the report Yarra Ranges Health & Wellbeing Profile, 2017 (Figure 2).
Figure 2. The geographical extent of the Yarra Ranges.
The Yarra Ranges Council has a population of just over 150,000, which is 2.5 per cent of Victoria’s total. The Council comprises a mixture of urban areas where 70 per cent of the population reside in approximately 3 per cent of the western part of the Council’s landmass and the rest in rural areas. It consists of 55 suburbs, townships, small communities and rural areas (knowyourcouncil.vic.gov.au/councils/yarra-ranges).
Air quality in the Yarra Ranges is influenced by the source of pollution and the receiving environment characteristics such as topography (local hills and valleys) and climate (prevailing temperature, winds).
Sources of air pollution and impacts in the Yarra Ranges
The air pollutant of interest in the Yarra Ranges is smoke. It is comprised of gases and particulate matter, with fine particles (PM2.5) being a dominant air pollutant. PM2.5 levels are used to measure and represent population exposure to smoke. Air pollution impacts human health in the local community, regional agriculture for example smoke taint in wine grapes and local economic activity such as tourism.
Smoke from bushfires, bushfire hazard reduction and other land burning activities can generate elevated levels of PM2.5 in the Council. Smoke can be generated from wood burners which are a common type of domestic heating, as well as residential or property burn offs during the winter months. Other agricultural activities such as frost pot burners and stubble burning can also contribute to the smoke in the region.
EPA monitors for other air pollutants in the region such as nitrogen dioxide, sulfur dioxide, ozone and carbon monoxide. They, are less common as there are no significant local sources of these pollutants, such as large industries, or large areas of dense population.

Yarra Ranges air quality – Technical report
9
Topography
The topography of an area relates to its physical form and shape. The Yarra Ranges region has a variety of landscapes, with hills, valleys and open fields. A typical rural view is shown in Figure 3. Hills and valleys can trap air pollution and reduce its dispersion during specific weather conditions.
Figure 3. View of Yarra Ranges region around Healesville (photo from Travel Victoria: Yarra Valley Visitors (travelvictoria.com.au/regions/yarravalley/).
Climate
Wind and temperature have an important effect on air quality. When wind speed is light, typically less than 5–10 km/hr, any air pollution released tends to persist and build up, as the winds are not strong enough to clear it away. Local hills and valleys also contribute to build up of air pollution by reducing the dispersion during low winds. When the temperature is cold, typically below 10 ˚C, people tend to start to use wood burners for heating producing smoke and coupled with low winds can trap the air pollution close to the ground preventing dispersion up into the air and over the ranges.
Low temperature during low winds can also trap the air pollution close to the ground preventing dispersion up into the air and over the ranges.

Yarra Ranges air quality – technical report
10
The Yarra Ranges has one long-term Bureau of Meteorology weather station at Coldstream. This provides long-term climate data that is reflective of the climate of the lower and western parts of Yarra Ranges Council. It is important to acknowledge that the local micro-climates in the eastern and northern valleys are different to that of Coldstream, as they are heavily influenced by the hills and valley. The data from the Coldstream weather station is not representative of these parts of the region but can provide an indication of likely trend of the weather.
Summary climate data for temperature and winds from Coldstream is shown in Figures 4a - 4b.
Figure 4a. Long term average minimum temperature for Coldstream, Yarra Ranges (1994 to 2020).
Figure 4b. Long term average maximum temperature for Coldstream, Yarra Ranges (1994 to 2020).
Figure 4b shows that minimum air temperatures in the region can be below 10 ˚C for 9 months of the year and below 5 ˚C for 3 months. In the core winter months, the average temperature is below 15 ˚C.

Yarra Ranges air quality – Technical report
11
The region generally has light winds, especially in the mornings and in the cooler months in autumn and winter (Figure 5a and 5b). This means that during these months, smoke from wood heaters, agricultural burning activities and any bushfires, or planned burns, are not likely to disperse well.
Figure 5a. Long term average 9 am wind speed for Coldstream, Yarra Ranges (1994 to 2020).
Figure 5b. Long term average 3 pm wind speed for Coldstream, Yarra Ranges (1994 to 2020).

Yarra Ranges air quality – technical report
12
Air pollution (PM2.5) monitoring
Air pollution (PM2.5) monitoring sites
EPA has monitored air quality at the Mooroolbark air quality monitoring station since 2017. It is generally representative of ambient air quality in the area. In 2020 we also operated two temporary air monitors in Healesville and Warburton. All three stations measure PM2.5. Their locations are demonstrated in Figure 6. Mooroolbark also monitors for PM10, ozone and visibility.
Figure 6. EPA air quality monitoring sites in Yarra Ranges in 2020.
There are global third-party air quality and air pollution websites that estimate and show air quality information for areas in Victoria, but these are very limited for the Yarra Ranges. These third-party sites derive their data from a mixture of sensors, modelling and satellite imagery, and should be regarded as indicative and for further information. We can use data from these sites to gain a better picture of what might be happening across the region. This is especially useful in assessing bushfire smoke to provide better spatial coverage. We can target hot spots for official investigations and higher quality monitoring. We use the BoM/CSIRO AQFx model for smoke impact forecasting. We provide further information regarding different types of particle sensors in Particle sensors (publication 1745) (epa.vic.gov.au/about-epa/publications/1745).
Air pollution (PM2.5) monitoring results
For the purposes of this report, we have provided both 24-hour and 1-hourly air quality data. Using both of these measurements is important for understanding smoke and air quality impacts. Smoke concentrations in the atmosphere can vary markedly within a short distance (for example 2 km) and can change rapidly over time. Twenty four-hour concentrations provide an indication of the average PM2.5 levels in the air over the past 24 hours, at a point in time. The 24-hour average does not necessarily give an accurate understanding of real-time PM2.5 concentration and this is where 1 hourly concentrations are used. For individuals wishing to make decisions about whether it is safe to exercise now for example, or over the next couple of hours, hourly PM2.5 is important. Hourly concentrations can also assist us to better understand air pollution sources. This report reviews both 24-hour average concentrations and hourly concentrations to understand air quality in the Yarra Ranges.

Yarra Ranges air quality – Technical report
13
PM2.5 24-hour average concentrations
For the purposes of this report, air pollution concentrations are plotted to show the variation in air quality overtime in the Yarra Ranges Council. Figure 7 shows 24-hour concentrations of PM2.5 measured at Mooroolbark from August 2017 to the end of 2020. It shows that PM2.5 concentrations were below the
standard of 25 g/m3 for much of the time, meaning air quality was generally good. The days above the standard can be attributed to smoke impacts from planned burning (March, April 2018), bushfires (February, November, December 2019 and January 2020) and wood heaters (July 2020).
Figure 7. 24-hour PM2.5 at Mooroolbark (red line is the air pollution standard of 25 g/m3).
Incident air monitors were temporarily installed at Healesville and Warburton. Figure 8 shows 24-hourly PM2.5 concentrations at Healesville and Figure 9 shows 24-hourly PM2.5 concentrations at Warburton. Both
Figures 8 and 9 show that PM2.5 concentrations were below the standard of 25 g/m3 for this period. The gaps in the graph are due to technical issues with the monitors. One high measurement over one hour at Warburton has been excluded due to smoke coming from an onsite BBQ located next to the monitoring unit as this is not classified as generally representative of the area.
Figure 8. 24-hour PM2.5 at Healesville (red line is the air pollution standard of 25 g/m3).

Yarra Ranges air quality – technical report
14
Figure 9. 24-hour PM2.5 at Warburton (red line is the air pollution standard of 25 g/m3).
PM2.5 hourly concentrations
The hourly PM2.5 concentrations measured at Mooroolbark, Healesville and Warburton in 2020 are shown in Figure 10. This shows higher PM2.5 concentrations measured during autumn and winter in the Council with significant variability.
Figure 10. Hourly PM2.5 at Healesville, Warburton and Mooroolbark.

Yarra Ranges air quality – Technical report
15
Further analysis of the 2020 (March-December) hourly PM2.5 data indicates that fair and poor, air quality was recorded during the night and early morning. During autumn and winter this is consistent with smoke from wood heaters.
The hourly PM2.5 data for air quality categories of Fair, Poor, Very Poor or Extremely Poor for Mooroolbark Figure A1), Healesville (Figure A2) and Warburton (Figure A3) are illustrated in the Appendix.
PM2.5 monitoring during planned burns and bushfires in the Yarra Ranges
There have been several significant bushfires and planned burns that have produced smoke affecting the Yarra Ranges region in recent years. For the purposes of informing and protecting community health, EPA deploys specific short-term particle air quality monitoring stations. For the purposes of this report this section provides a summary of these to show the effects on the region using the hourly PM2.5 air quality categories EPA AirWatch-Categories (epa.vic.gov.au/for-community/monitoring-your-environment/about-epa-airwatch/air-quality-categories).
The incidents include:
• planned burns in May 2018
• bushfires in East Gippsland in March 2019
• planned burns in April 2019
• bushfires in East Gippsland in December 2019 -January 2020.
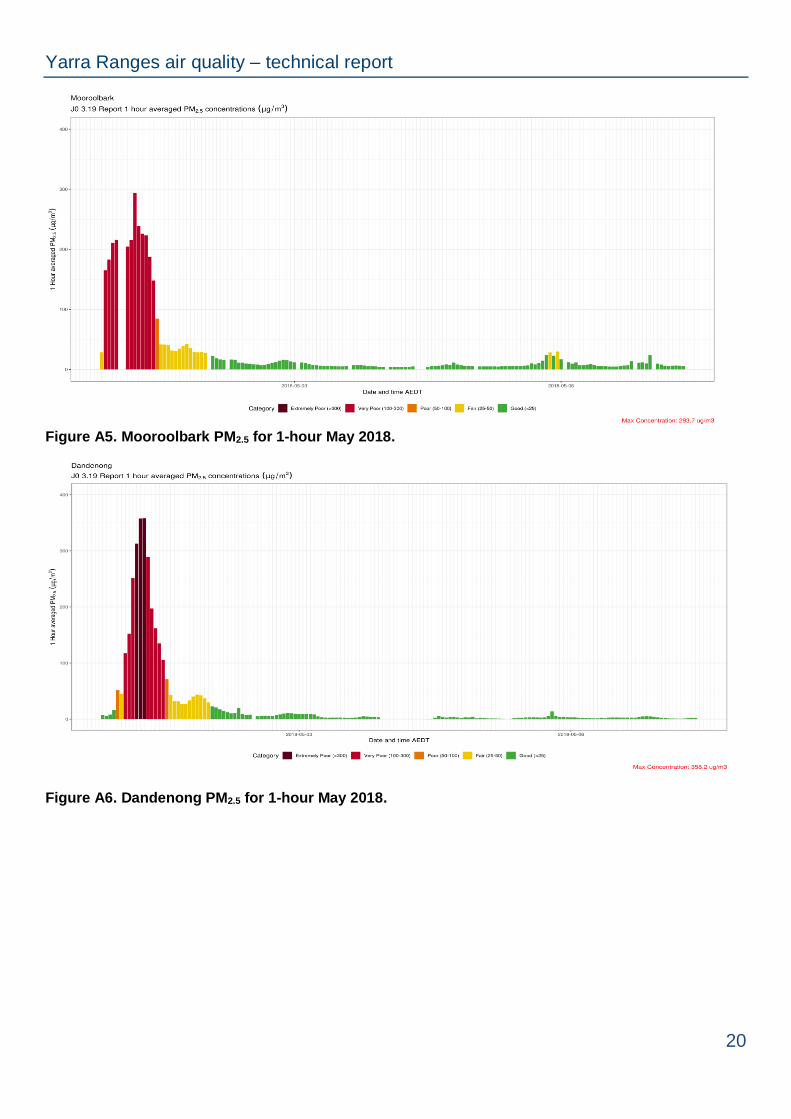
Planned burns May 2018
This was a large-scale fire event with smoke affecting Yarra Ranges and other parts of Melbourne as shown in the satellite picture in Appendix Figure A4. The intensity and extent of the smoke impact from these fires is illustrated by the several hours of PM2.5 levels at Very Poor levels as measured at Mooroolbark (Appendix Figures 14) and the Dandenong site reaching the Extremely Poor hourly category (Appendix Figure 15).
Bushfires in East Gippsland March 2019
In March 2019 bushfires affected the air quality in the Yarra Ranges. EPA deployed incident air monitors at Warburton and Woori Yallock. The data summaries in the Appendix, Figures A5-A9 show the different scale of impact with PM2.5 levels reaching the Very Poor category at Mooroolbark, Extremely Poor air quality was experienced at Warburton and Poor air quality at Woori Yallock in March 2019 (Figure A9).
Planned burns April 2019
Incident air monitors were deployed to Healesville and Warburton during April 2019 to investigate the potential of smoke impacts from potential planned burns in the area. The levels of PM2.5 measured at Healesville (Appendix Figure A10) and Warburton (Appendix Figure A11) were low indicating no significant smoke impacts.
Bushfires in East Gippsland December 2019 - January 2020
Fires throughout Victoria in late 2019 and early 2020 created vast amounts of smoke that affected many communities. Appendix Figure A12 shows PM2.5 concentrations were very high and reached the Poor, Very Poor category on several days with the highest concentrations reaching Extremely Poor category at Mooroolbark during December 2019 and January 2020. Other locations around Yarra Ranges, would have most likely experienced similar high concentrations, as did much of the whole of Melbourne and many other parts of Victoria.

Yarra Ranges air quality – technical report
16
Discussion
The data shows that overall, the PM2.5 concentrations measured in the Yarra Ranges have been low and the air quality of the region is generally good. Air quality is clearly impacted by several sources, mainly smoke from bushfires and planned burns and from human activities including wood burning for home heating and other local burning for bushfire hazard reduction and agricultural activities. The data also shows that air pollution levels reported at existing monitoring stations can vary widely depending on the time of smoke generation and corresponding local weather and topography and monitoring may not reflect concentrations in other areas of the Yarra Ranges.
The ongoing air quality monitoring site at Mooroolbark shows that the Yarra Ranges experiences elevated levels of PM2.5. Most of these elevated levels occur due to bushfires and planned burns in the Yarra Ranges. The worst of these occurred during the extensive bushfires that occurred in December 2019 -January 2020, where the conditions resulted in extremely poor air quality. Smoke impacts were widespread, and these conditions occurred throughout the eastern half of Victoria including Melbourne.
Although specific long-term monitoring in the Yarra Ranges has not been undertaken, experience suggests the narrow valleys where towns such as Warburton and Healesville are located, will likely experience higher smoke concentrations. Smoke accumulates in narrow valleys in light wind conditions. Monitoring conducted in other similar valley areas such as Bright, Myrtleford and valleys in east Gippsland confirm this. EPA’s
incident monitoring during bushfires shows that PM2.5 concentration can reach up to 1000 g/m3 at these valley sites, which is considered extremely poor air quality. Fortunately, these events rarely last more than a few hours as winds clear the smoke.
Community PM2.5 air and weather monitoring could provide a better understanding of localised smoke levels and impacts.
When burning activity occurs, communities should be prepared for elevated levels of PM2.5. Early notification of worsening air quality enables the community to take preventative action, such as seeking cleaner air spaces, sealing an indoor environment, or taking preventative medication. A discussion of the types of preparation are beyond the scope of this report, but include:
• developing good community awareness through monitoring
• action plans as advised by the Department of Health and Human Services (DHHS) and Emergency Management Victoria (EMV)
• protocols and processes to support sensitive members of the community to relocate temporarily.

Yarra Ranges air quality – Technical report
17
Managing impacts and reducing harm from smoke in regional Victorian communities is challenging and requires a multi-faceted approach that includes different approaches. There are several collaborative projects involving government groups with research groups (CSIRO, Bureau of Meteorology, University of Tasmania, University of Sydney) that are currently underway in developing ways to manage smoke impacts in Victoria. These projects are listed below.
• Better Smoke Management Program for bushfire hazard fuel reduction (Department of Environment, Land, Water and Planning).
• Safer Together project to modernise land burning permitting and lighting process (Country Fire Authority).
• Smoke forecasting and monitoring program to alert communities (EPA Victoria).
• Smoke taint on vine grapes (Wine industry and Latrobe University).
• Evaluating effectiveness of air purifiers in reducing PM2.5 levels in residences during burns and fires (EPA Victoria).
Conclusion and recommendations
This report is based primarily on climate and air pollution monitoring data that has been undertaken over the past few years. Overwhelmingly, the air pollutant of highest impact in the Yarra Ranges is smoke, containing fine particles PM2.5.
The assessment shows that the region can be subject to elevated concentrations of fine particles PM2.5. The particles are mainly in smoke from bushfires and burning activities like bushfire hazard reduction burns. In the colder months, the main cause of smoke is from wood heaters, residential or property burn offs and agricultural burning.
Smoke can, and does, build up in the valley area due to limited dispersion. Local communities should be aware of this and be prepared to undertake measures to reduce their exposure if they are sensitive to smoke.
Future work needs to include smoke management programs that involve the local community and other stakeholders. Sources of smoke impacts in the region vary and influence the magnitude, spatial extent, frequency and duration of community exposures. Developing a local smoke management program will require building a monitoring program to better understand factors influencing air quality at a local level. It will also need to assess those areas where information is currently lacking and better characterise community exposures.
Smoke management plans will then be developed to provide resources and information on reducing smoke generation. They will also include impacts and/or harm on human health and commercial activities in the region such as tourism and smoke taint on wine grapes.
A community-led action plan for smoke: Yarra Ranges pilot is under development. It is recommended local community members actively participate in its development as this will provide a set of locally relevant resources and approaches that will support and assist with smoke events.

Yarra Ranges air quality – technical report
18
Appendix
Figure A1. Hourly air quality categories Mooroolbark April-December 2020
Figure A2. Hourly air quality categories Healesville April-December 2020

Yarra Ranges air quality – Technical report
19
Figure A3. Hourly air quality categories Warburton April-December 2020
One high measurement over one hour at Warburton has been excluded due to smoke coming from an onsite BBQ located next to the monitoring unit as this is not classified as generally representative of the area.
.
Figure A4. The satellite image from 10-11 am on Tuesday 1 May 2018.
Yarra Ranges air quality – technical report
20
Figure A5. Mooroolbark PM2.5 for 1-hour May 2018.
Figure A6. Dandenong PM2.5 for 1-hour May 2018.

Yarra Ranges air quality – Technical report
21
Figure A7. Mooroolbark PM2.5 for 1-hour March 2019.
Figure A8. Warburton PM2.5 for 1-hour March 2019

Yarra Ranges air quality – technical report
22
Figure A9. Woori Yallock PM2.5 for 1-hour March 2019.
Figure A10. Healesville PM2.5 for 1-hour April 2019

Yarra Ranges air quality – Technical report
23
Figure A11. Warburton PM2.5 for 1-hour April 2019.
Figure A12. Mooroolbark PM2.5 for 1-hour December 2019-January 2020.