yc5100 2012 toyota camry le ncap draft report
TRANSCRIPT

REPORT NUMBER: NCAP-MGA-2012-027
NEW CAR ASSESSMENT PROGRAM (NCAP) Frontal Barrier Impact Test
TOYOTA MOTOR MANUFACTURING, NORTHERN KENTUCKY, INC. 2012 Toyota Camry LE 4-Dr Sedan
NHTSA No.: YC5100
MGA RESEARCH CORPORATION 5000 Warren Road
Burlington, WI 53105
Test Date: November 15, 2011
Final Report Date: December 16, 2011
FINAL REPORT
U.S. DEPARTMENT OF TRANSPORTATION National Highway Traffic Safety Administration
Office of Crashworthiness Standards Mail Code: NVS-111
1200 New Jersey Ave, SE Room W43-410
Washington, DC 20590

ii
This publication is distributed by the U.S. Department of Transportation, National Highway Traffic Safety Administration, in the interest of information exchange. The opinions, findings and conclusions expressed in this publication are those of the author(s) and not necessarily those of the Department of Transportation or the National Highway Traffic Safety Administration. The United States Government assumes no liability for its contents or use thereof. If trade or manufacturers' names or products are mentioned, it is only because they are considered essential to the object of the publication and should not be construed as an endorsement. The United States Government does not endorse products or manufacturers. Prepared by: _____________________________
Donna Janovicz, Project Manager Approved by: _____________________________
Ben Fischer, Project Engineer Approval Date: December 16, 2011 FINAL REPORT ACCEPTANCE BY OCWS: ____________________________________ Division Chief, New Car Assessment Program NHTSA, Office of Crashworthiness Standards Date: _____________________ ____________________________________ COTR, New Car Assessment Program NHTSA, Office of Crashworthiness Standards Date: _____________________

iii
Technical Report Documentation Page 1. Report No. NCAP-MGA-2012-027
2. Government Accession No.
3. Recipient's Catalog No.
5. Report Date December 16, 2011
4. Title and Subtitle Final Report of New Car Assessment Program Frontal Impact Testing of 2012 Toyota Camry LE 4-Dr Sedan, NHTSA No.: YC5100
6. Performing Organization Code MGA
7. Author(s) Donna Janovicz, Project Manager Ben Fischer, Project Engineer
8. Performing Organization Report No. NCAP-MGA-2012-027
10. Work Unit No.
9. Performing Organization Name and Address MGA Research Corporation 5000 Warren Road Burlington, WI 53105
11. Contract or Grant No. DTNH22-06-D-00028 13. Type of Report and Period Covered Final Test Report November 15 to December 16, 2011
12. Sponsoring Agency Name and Address U.S. Department of Transportation National Highway Traffic Safety Administration Office of Crashworthiness Standards 1200 New Jersey Ave, SE, Room W43-410 Washington, D.C. 20590
14. Sponsoring Agency Code NVS-111
15. Supplementary Notes
16. Abstract A 56.3 km/h NCAP Frontal Impact Test was conducted on the 2012 Toyota Camry LE 4-Dr Sedan in accordance with the specifications of the Office of Crashworthiness Standards Frontal NCAP Laboratory Test Procedure. This test was conducted to obtain data indicant of FMVSS 208, 212, 219 (partial), 301, and foot well intrusion performance. The test was conducted at MGA Research Corporation in Burlington, Wisconsin, on November 15, 2011. The impact velocity was 56.3 km/h and the ambient temperature at the barrier face at the time of impact was 21.4°C. The target vehicle post-test maximum crush was 579 mm located at the vehicle’s centerline. The test vehicle’s performance was as follows:
ThresholdMeasurement Description Units 50th 5th
Driver ATD
Passenger ATD
Head Injury Criteria (HIC15) N/A 700 700 122 398 Maximum Chest Compression mm 63 52 18 11 Nij N/A 1 1 0.33 0.34 Neck Tension N 4170 2620 1627 706 Neck Compression N 4000 2520 599 402 Left Femur Force N 10008 6805 1681 2854 Right Femur Force N 10008 6805 2434 2634
17. Key Words 35 mph Frontal Barrier Impact Test New Car Assessment Program (NCAP)
18. Distribution Statement Copies of this report are available from: National Highway Traffic Safety Administration Technical Information Services Division, NPO-411 1200 New Jersey Ave, SE, Room E12-100 Washington, DC 20590 Email: [email protected] FAX: 202-493-2833
19. Security Classification of Report Unclassified
20. Security Classification of Page Unclassified
21. No. of Pages 164
22. Price

iv
TABLE OF CONTENTS
Section Page No. 1 Purpose and Summary of Test 1 2 Occupant and Vehicle Information / Data Sheets 3 Data Sheet No. Page No. 1 General Test and Vehicle Parameter Data 4 2 Seat Adjustment, Fuel System, and Steering Wheel Data 8 3 Dummy Longitudinal Clearance Dimensions 10 4 Dummy Lateral Clearance Dimensions 11 5 Seat Belt Positioning Data 12 6 High-Speed Camera Locations and Data 13 7 Vehicle Accelerometer Data 15 8 Photographic Reference Target Locations 16 9 Load Cell Locations on Fixed Barrier 17 10 Test Vehicle Summary of Results 18 11 Post-Test Observations 19 12 Vehicle Profile Measurements 20 13 Accident Investigation Division Data 22 14 Vehicle Intrusion Measurements 23 15 Summary of FMVSS 212, 219 (Partial), and 301 Data 26 16 FMVSS 301 Static Rollover Results 28 17 Dummy/Vehicle Temperature Stabilization Data 29
Appendix A Photographs A B Dummy Response Data Traces B C Dummy Calibration and Performance Verification Data C

1
SECTION 1 PURPOSE AND SUMMARY OF TEST
PURPOSE This 56.3 km/h frontal barrier impact test is part of the Vehicle Barrier Impact Testing Program sponsored by the National Highway Traffic Safety Administration (NHTSA) under contract number DTNH22-06-D-00028. The purpose of this test was to obtain vehicle crashworthiness and occupant restraint system performance data for consumer information purposes. The 56.3 km/h frontal barrier impact was conducted in accordance with the Office of Crashworthiness Standards Frontal NCAP Laboratory Test Procedure. SUMMARY A load cell barrier was impacted by a 2012 Toyota Camry LE 4-Dr Sedan at a velocity of 56.3 kph. The test was performed at MGA Research Corporation on November 15, 2011. Pre-and post-test photographs of the vehicle and dummies can be found in Appendix A. Two real-time cameras and fourteen (14) high-speed cameras were used to document the frontal barrier impact event. Camera locations and other pertinent camera information can be found in this report. One Part 572E, 50th percentile male anthropomorphic test device (ATD), was placed in the driver seating position and one Part 572O 5th percentile female test device (ATD) was placed in the right-front passenger seating position according to dummy placement instructions specified in the Frontal NCAP Laboratory Test Procedure. Both ATDs were fully instrumented with head, chest and pelvis tri-axial accelerometers, chest displacement potentiometers, upper neck transducers, right/left femur load cells, and lower leg instrumentation. Seat belt load cells were also on the driver and passenger’s lap belts to measure dummy torso and pelvic section loading. The driver (position 1) ATD (Serial No. 351) and the right-front passenger (position 2) ATD (Serial No. 138) were calibrated previous to this test. Certification details, along with instrumentation calibration data, are found in Appendix C of this report. The 228 channels of data were recorded on an on-board data acquisition system. Appendix B contains the dummy head, chest displacement, neck, and femur response data traces. There was 100 percent windshield retention and no intrusion into the protected zone of the windshield during the event. There was no Stoddard Solvent leakage after the event or during any phase of the static rollover. The maximum static crush of the vehicle was 579 mm and both the driver and passenger side doors remained closed during the impact event and were operable after the impact.

2
The driver’s visible contact points were as follows: The driver’s head and chest contacted the airbag. The driver’s head also contacted the headrest. The driver’s knees contacted the knee airbag. The passenger’s visible contact points were as follows: The passenger’s head and chest contacted the airbag. The passenger’s head also contacted the headrest and seatback. The passenger’s knees contacted the knee airbag. The occupant data is summarized below:
ATD position HIC15 Nij Neck
Tension (N)
Neck Comp.
(N)
3ms Chest Clip (Gs)
Chest Disp. (mm)
Left Femur
(N)
Right Femur
(N)
Driver (50th) 122 0.33 1627 599 40 18 1681 2434 Passenger (5th) 398 0.34 706 402 43 11 2854 2634
The test data can be found on the NHTSA website at www.nhtsa.dot.gov.
TEST NOTES There was no valid data collected for:
Passenger Lap Belt after 18 ms. Load Cell 8-2 is questionable data. Load Cell 5-1 is questionable data from 13-15 ms and 27-32 ms.
The shoulder belt load cells for the driver and passenger were not used on this test per Form 1. Driver dummy’s hand was outside the driver side window post-test.
MGA does not endorse or certify products. The manufacturer’s name appears solely for identification purposes.

3
SECTION 2 OCCUPANT AND VEHICLE INFORMATION / DATA SHEETS

4
DATA SHEET NO. 1 GENERAL TEST AND VEHICLE PARAMETER DATA
TEST VEHICLE INFORMATION AND OPTIONS
NHTSA No. YC5100 Traction Control System (TCS) YesModel Year 2012 Auto-Leveling System No Make Toyota Automatic Door Locks (ADLs) Yes Model Camry Power Window Auto-Reverse No Body Style Sedan Other Optional Feature N/A VIN 4T4BF1FK1CR157833 Driver Front Airbag Yes Body Color Sandy Beach Metallic Driver Curtain Airbag Yes Odometer (km/mi) 119 / 74 Driver Head/Torso Airbag No Engine Displacement (L) 2.5 Driver Torso Airbag No Type/No. Cylinders 4 Driver Torso/Pelvis Airbag Yes Engine Placement Lateral Driver Pelvis Airbag No Transmission Type Automatic Driver Knee Airbag Yes Transmission Speeds 6 Pass. Curtain Airbag Yes Overdrive Yes Pass. Head/Torso Airbag No Final Drive Front Pass. Torso Airbag No Roof Rack No Pass. Torso/Pelvis Airbag Yes Sunroof/T-Top No Pass. Pelvis Airbag No Running Boards No Driver Seat Belt Pretensioner Yes Tilt Steering Wheel Yes Pass. Seat Belt Pretensioner Yes Power Seats Yes, Driver Only Driver Load Limiter Yes Anti-Lock Brakes (ABS) Yes Pass. Load Limiter Yes All-Wheel Drive (AWD) No Other Safety Restraint N/A
Does owner’s manual provide instructions to turn off automatic door locks? No
DATA FROM CERTIFICATION LABEL
VEHICLE SEATING AND WEIGHT CAPACITY DATA Measured Parameter Front Rear Third TotalType of Seats Bucket Split Bench Designated Seating Capacity (DSC) 2 3 5 Capacity Weight (VCW) (kg) 407 Cargo Weight (RCLW) (kg) 67
Test Vehicle: 2012 Toyota Camry LE 4-Dr Sedan NHTSA No.: YC5100 Test Program: NCAP Frontal Barrier Impact Test Test Date: 11/15/2011
Manufactured By Toyota Motor Manufacturing, Northern Kentucky, Inc.
GVWR (kg) 2100
Date of Manufacture 09/11
GAWR Front (kg) 1191
Vehicle Type Passenger Car
GAWR Rear (kg) 1191

5
DATA SHEET NO. 1 (CONTINUED) GENERAL TEST AND VEHICLE PARAMETER DATA
TIRE PLACARD INFORMATION Measured Parameter Front RearRecommended Cold Tire Pressure (kPa) 240 240Recommended Tire Size P205/65R16 P205/65R16
TIRE SIDEWALL INFORMATION
Measured Parameter Front RearMax. Tire Pressure (kPa) 350 350Tire Size on Vehicle 205/65R16 205/65R16 Tire Manufacturer Michelin Michelin Tire Name Energy Saver Energy Saver Tire Type Passenger Passenger Tire Width 205 205 Aspect Ratio 65 65 Radial Yes Yes Wheel Diameter 16 16 Load Index/Speed Symbol 94S 94S Treadwear 480 480 Traction Grade A A Temperature Grade B B Tire Material Rubber Rubber
Test Vehicle: 2012 Toyota Camry LE 4-Dr Sedan NHTSA No.: YC5100 Test Program: NCAP Frontal Barrier Impact Test Test Date: 11/15/2011

6
DATA SHEET NO. 1 (CONTINUED) GENERAL TEST AND VEHICLE PARAMETER DATA
TEST VEHICLE WEIGHTS
As Delivered (UVW) As Tested (ATW)
Units Front Rear Total Front Rear Total Left kg 449.6 286.7 472.5 377.6 Right kg 440.5 282.2 474.3 337.7 Ratio % 61.0 39.0 57.0 43.0 Totals kg 890.1 568.9 1459.0 946.8 715.3 1662.1
TARGET TEST WEIGHT CALCULATION
Measured Parameter Units Value Total Delivered Weight (UVW) kg 1459.0 Weight of 1 P572E ATD & 1 P572O ATD kg 140.6 Rated Cargo/Luggage Weight (RCLW) kg 67 Calculated Vehicle Target Weight (TVTW) kg 1666.6
TEST VEHICLE ATTITUDES AND CG
Units LF RF LR RR CG (aft of front axle)As Delivered mm 721 720 714 718 1082 As Tested mm 714 717 677 683 1194 Post Test mm 704 680 671 660
GENERAL TEST VEHICLE DATA
Measurement Description Units Value Total Vehicle Wheel Base mm 2774 Total Vehicle Length at Left Side mm 4662 Total Vehicle Length at Centerline mm 4809 Total Vehicle Length at Right Side mm 4662 Weight of Ballast in Cargo Area kg 55.3 Weight of Vehicle Components Removed kg 19.1 Amount of Stoddard Solvent in Fuel Tank L 60.0
List of components removed to meet test weight: Right taillight, trunk carpet, jack/tools, and spare tire.
Test Vehicle: 2012 Toyota Camry LE 4-Dr Sedan NHTSA No.: YC5100 Test Program: NCAP Frontal Barrier Impact Test Test Date: 11/15/2011

7
DATA SHEET NO. 1 (CONTINUED) GENERAL TEST AND VEHICLE PARAMETER DATA
TARGET VEHICLE STRUCTURAL MEASUREMENT
Elements Pre-Test (mm)
1 Total Length 4809
2 Total Width 1821
3 Bumper Top Height 545
4 Bumper Bottom Height 432
5 Longitudinal Member Top Height 550
6 Distance between Longitudinal Members 933
7 Longitudinal Member Width 90
8 Engine Top Height 857
9 Engine Bottom Height 170
10 Engine and Gearbox Width 980
11 Front Bumper-Engine Distance 320
12 Front Shock Absorber Fixing Height 914
13 Bonnet Leading Edge Height 758
14 Front Shock Absorber Fixing Width 1197
15 Front Bumper – Front Axle Distance 963
16 Front Axle – A-Pillar Distance 425
17 A-Pillar – B-Pillar Distance 1168
18 B-Pillar – Rear Axle Distance 1176
19 B-Pillar – C-Pillar Distance 748
20 Roof Sill Bottom Height 1130
21 Roof Sill Top Height 1514
22 Floor Sill Bottom Height 206
23 Floor Sill Top Height 352
Test Vehicle: 2012 Toyota Camry LE 4-Dr Sedan NHTSA No.: YC5100 Test Program: NCAP Frontal Barrier Impact Test Test Date: 11/15/2011

8
DATA SHEET NO. 2 SEAT ADJUSTMENT, FUEL SYSTEM, AND STEERING WHEEL DATA
NOMINAL DESIGN RIDING POSITION The driver seat back is positioned as close as possible to the manufacturer’s design angle. For the passenger seat back, seat back is adjusted following Appendix F, “Driver & Passenger Dummy Seating & Positioning Procedures” in the NCAP Test Procedure dated January 2010. SEAT BACK ANGLE Degrees Driver Seat Back Angle 3.8° on headrest post Passenger Seat Back Angle 0.8° on headrest post
SEAT FORE/AFT POSITIONS The driver and passenger seat fore/aft positions are adjusted following Appendix F, “Driver & Passenger Dummy Seating & Positioning Procedures” in the NCAP Test Procedure dated January 2010. Total Fore/Aft Travel Placed in Position # Driver Seat 280 mm 140 mm (forward-most as 0) Passenger Seat 24 detents 0 detent (forward-most as 0) SEAT BELT UPPER ANCHORAGES The seat belt upper anchorages are positioning following the manufacturer’s specified position as listed in Form 1. Total # of Positions Placed in Position #
Driver Seat 4 (1st as 1) 1 (uppermost as 0) Passenger Seat 4 (1st as 1) 1 (uppermost as 0)
Test Vehicle: 2012 Toyota Camry LE 4-Dr Sedan NHTSA No.: YC5100 Test Program: NCAP Frontal Barrier Impact Test Test Date: 11/15/2011
Upright Position
Adjuster
Inclinometer
SeatBack
Angle (Degrees)
FRONT SEAT ASSEMBLY
Seat Cushion

9
DATA SHEET NO. 2 (CONTINUED) SEAT ADJUSTMENT, FUEL SYSTEM, AND STEERING WHEEL DATA
FUEL TANK CAPACITY DATA
Liters Usable Capacity of “Standard Tank” 65.1 Usable Capacity of “Optional Tank” 92-94% of Usable Capacity 59.9 to 61.2 Actual Amount of Solvent used 60.6 1/3 of Usable Capacity 21.7
FUEL PUMP Describe the fuel pump type, its behavior, and the
location of the fuel filler pipe.
The vehicle is equipped with an electric fuel pump. No
operating instructions. The fuel pipe is on the left side.
STEERING COLUMN ADJUSTMENT Steering wheel and column adjustments are made so that the steering wheel hub is at the
geometric center of the locus it describes when moved
through its full range of motion. An aluminum plate is
placed across the rim of the steering wheel, an
inclinometer is placed on the plate and the angle is
measured.
STEERING COLUMN POSITION
Degrees Fore/Aft Position (mm) Lowermost – Position 1 68.8 220 Geometric Center – Position 2 66.6 200 Uppermost – Position 3 64.4 180 Telescoping Steering Wheel Travel 40 Test Position 66.6 200
Test Vehicle: 2012 Toyota Camry LE 4-Dr Sedan NHTSA No.: YC5100 Test Program: NCAP Frontal Barrier Impact Test Test Date: 11/15/2011
LEFT SIDE VIEW
STEERING COLUMN ASSEMBLY
1
2
3
Vapor Volume
Unusable Capacity
Filler Neck Volume
Filler Cap
VEHICLE FUEL TANK ASSEMBLY
Fuel Line
UsableCapacity

10
DATA SHEET NO. 3 DUMMY LONGITUDINAL CLEARANCE DIMENSIONS
LEFT SIDE VIEW
Driver S/N 351 Passenger S/N 138Code Measurement Description Length (mm) Angle (°) Length (mm) Angle (°)
WA° Windshield Angle 23.5 SWA° Steering Wheel Angle 66.6 SCA° Steering Column Angle 23.4 SA° Seat Back Angle (on headrest post) 3.8 0.8 HZ Head to Roof (Z) 190 90 186 90 HH Head to Header 320 25.6 271 44.2 HW Head to Windshield 692 0 656 0 NR Nose to Rim 425 12.4 CD Chest to Dash 532 425 CS Chest to Steering Hub 323 1.2 RA Rim to Abdomen 212 0
KDL Left Knee to Dash 168 30.7 86 38.2 KDR Right Knee to Dash 140 28.7 88 36.1 PA° Pelvic Angle 22.6 21.0 TA° Tibia Angle 41.6 50.7 SK Striker to Knee 616 100.5 710 101.2 ST Striker to Head 432 12.3 412 40.2 SH Striker to H-Point 315 137.3 426 121.3
Test Vehicle: 2012 Toyota Camry LE 4-Dr Sedan NHTSA No.: YC5100 Test Program: NCAP Frontal Barrier Impact Test Test Date: 11/15/2011

11
DATA SHEET NO. 4 DUMMY LATERAL CLEARANCE DIMENSIONS
FRONT VIEW OF DUMMY
Driver S/N 351 Passenger S/N 138Code Measurement Description Length (mm)
AD Arm to Door 134 64 HD H-Point to Door 155 177 HR Head to Side Header 207 230 HS Head to Side Window 335 482 KK Knee to Knee 350 230
SHY Striker to H-Point (Y Direction) 305 307 AA Ankle to Ankle 333 169
Test Vehicle: 2012 Toyota Camry LE 4-Dr Sedan NHTSA No.: YC5100 Test Program: NCAP Frontal Barrier Impact Test Test Date: 11/15/2011

12
DATA SHEET NO. 5 SEAT BELT POSITIONING DATA
Dummy’s Centerline
TBI
'D' Ring
Shoulder Belt Portion
Lap Belt Portion
1/8" Thick Aluminum
Plate
Inboard Anchorage
Floorpan
Buckle Assembly
PBL PBU
Outboard Anchor
Locking Retractor
FRONT VIEW OF DUMMY
SEAT BELT POSITIONING MEASUREMENTS
Measurement Description Units Driver Passenger PBU - Top surface of reference to belt upper edge mm 375 335PBL - Top surface of reference to belt lower edge mm 300 250
BELT LENGTH DATA
Measurement Description Units Driver Passenger Shoulder Belt Length as measured on ATD mm 895 960Lap Belt Length as measured on ATD mm 855 980 Remainder of belt on reel mm 1910 1550 Total Belt Length for Continuous Webbing Systems mm 3660 3490
Test Vehicle: 2012 Toyota Camry LE 4-Dr Sedan NHTSA No.: YC5100 Test Program: NCAP Frontal Barrier Impact Test Test Date: 11/15/2011

13
DATA SHEET NO. 6 HIGH-SPEED CAMERA LOCATIONS AND DATA
CAMERA POSITIONS FOR FRONTAL IMPACTS
Test Vehicle: 2012 Toyota Camry LE 4-Dr Sedan NHTSA No.: YC5100 Test Program: NCAP Frontal Barrier Impact Test Test Date: 11/15/2011
5
108
1 – Real-Time Camera
2
7
6
3 4
9
11
12
13
14 – Pit Camera Engine Compartment View15 – Pit Camera Fuel Tank View 16 & 17 – Frontal Airbag Deployments, Optional

14
DATA SHEET NO. 6 (CONTINUED) CAMERA LOCATIONS AND DATA
CAMERA LOCATIONS Coordinates (mm)
No. Camera View X* Y* Z*
Lens (mm)
Speed (fps)
1 Real-Time Left Overall 30
2 Driver Close-Up 1410 -6210 -1740 35 1000
3 Left Front Half 1230 -5090 -1080 24 1000
4 Left Angle 5260 -4940 -1860 50 1000
5 Steering Column - Top 520 -5230 -1240 24 1000
6 Steering Column - Bottom 490 -5200 -830 24 1000
7 Right Overall 1920 6320 -1090 20 1000
8 Passenger Close-Up 1380 6350 -1820 35 1000
9 Right Front Half 1200 5040 -1070 24 1000
10 Right Angle 5340 4980 -1890 50 1000
11 Windshield -180 0 -2810 24 1000
12 Driver Windshield 250 -450 -2030 12.5 1000
13 Passenger Windshield 250 450 -2030 12.5 1000
14 Pit Front 1290 0 3150 24 1000
15 Pit Rear 3120 0 3150 24 1000
16 Onboard Driver Side (optional)
17 Onboard Passenger Side (optional)
18 Real-Time Pan View 30
*COORDINATES:
+X = forward of impact plane +Y = right of monorail centerline +Z = below ground level
Cameras 16 & 17 were not used for this test.
Test Vehicle: 2012 Toyota Camry LE 4-Dr Sedan NHTSA No.: YC5100 Test Program: NCAP Frontal Barrier Impact Test Test Date: 11/15/2011

15
DATA SHEET NO. 7 VEHICLE ACCELEROMETER DATA
5/6 4
3 1/2/7/8
5 1/7
2/8
3/4
6
VEHICLE ACCELEROMETER PRE-TEST LOCATIONS
Measurements (mm) No. Accelerometer Location
X Y Z
1 Left Rear Accelerometer – X Direction 1897 -485 -310 2 Right Rear Accelerometer – X Direction 1897 362 -310 3 Engine Top X 4058 315 -955 4 Engine Bottom X 4083 0 -310 5 Left Brake Caliper X 3917 -708 -255 6 Right Brake Caliper X 3917 708 -255 7 Left Rear Accelerometer Redundant – X Direction 1897 -485 -310 8 Right Rear Accelerometer Redundant – X Direction 1897 362 -310
Reference Points: X - Rear Surface of Vehicle (+ forward)
Y - Vehicle Centerline (+ to right)
Z - Ground Plane (+ down)
Test Vehicle: 2012 Toyota Camry LE 4-Dr Sedan NHTSA No.: YC5100 Test Program: NCAP Frontal Barrier Impact Test Test Date: 11/15/2011

16
DATA SHEET NO. 8
PHOTOGRAPHIC REFERENCE TARGET LOCATIONS
Item Value (mm)
A 365
B 911
C 2420
D 670
E 1719
F 228
G
H 1208
I 1400
J 957
K 952
L 1500
M 1208
N 1511
O 955
P 955
Q 1388
Test Vehicle: 2012 Toyota Camry LE 4-Dr Sedan NHTSA No.: YC5100 Test Program: NCAP Frontal Barrier Impact Test Test Date: 11/15/2011
I J K
C
F
D E
A
B
B
H
M
G
L
N O P Q

17
DATA SHEET NO. 9 LOAD CELL LOCATIONS ON FIXED BARRIER
Advanced Research Load Cell Barrier
1-1 1-2 1-3 1-4 1-5 1-6 1-7 1-8 1-9 1-10 1-11 1-12 1-13 1-14 1-15 1-16
2-1 2-2 2-3 2-4 2-5 2-6 2-7 2-8 2-9 2-10 2-11 2-12 2-13 2-14 2-15 2-16
3-1 3-2 3-3 3-4 3-5 3-6 3-7 3-8 3-9 3-10 3-11 3-12 3-13 3-14 3-15 3-16
4-1 4-2 4-3 4-4 4-5 4-6 4-7 4-8 4-9 4-10 4-11 4-12 4-13 4-14 4-15 4-16
5-1 5-2 5-3 5-4 5-5 5-6 5-7 5-8 5-9 5-10 5-11 5-12 5-13 5-14 5-15 5-16
6-1 6-2 6-3 6-4 6-5 6-6 6-7 6-8 6-9 6-10 6-11 6-12 6-13 6-14 6-15 6-16
7-1 7-2 7-3 7-4 7-5 7-6 7-7 7-8 7-9 7-10 7-11 7-12 7-13 7-14 7-15 7-16
8-1 8-2 8-3 8-4 8-5 8-6 8-7 8-8 8-9 8-10 8-11 8-12 8-13 8-14 8-15 8-16
9-1 9-2 9-3 9-4 9-5 9-6 9-7 9-8 9-9 9-10 9-11 9-12 9-13 9-14 9-15 9-16
10-1 10-2 10-3 10-4 10-5 10-6 10-7 10-8 10-9 10-10 10-11 10-12 10-13 10-14 10-15 10-16
11-1 11-2 11-3 11-4 11-5 11-6 11-7 11-8 11-9 11-10 11-11 11-12 11-13 11-14 11-15 11-16
Load Cells are 121 mm x 121 mm with a 7 mm gap in between each load cell.
Test Vehicle: 2012 Toyota Camry LE 4-Dr Sedan NHTSA No.: YC5100 Test Program: NCAP Frontal Barrier Impact Test Test Date: 11/15/2011
Floor to bottom of barrier = 80 mm
Col
umn
1
Row 1
2000 mm
1370
mm
18
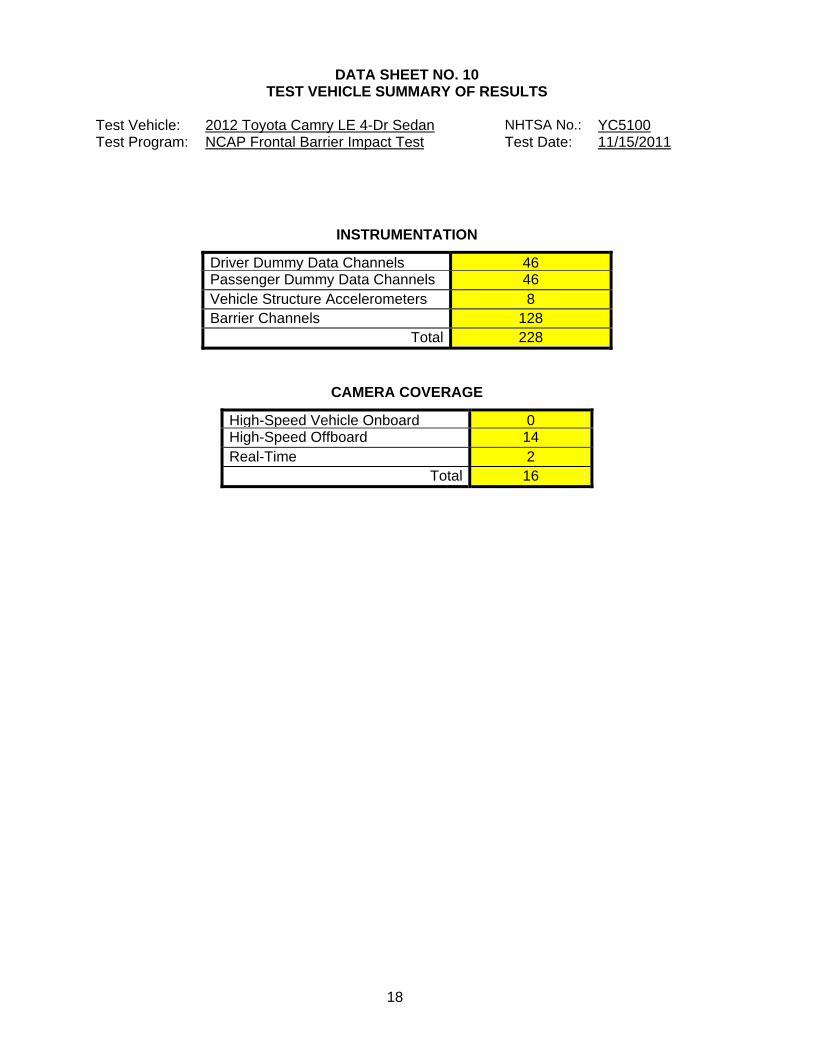
DATA SHEET NO. 10 TEST VEHICLE SUMMARY OF RESULTS
INSTRUMENTATION
Driver Dummy Data Channels 46Passenger Dummy Data Channels 46 Vehicle Structure Accelerometers 8 Barrier Channels 128
Total 228
CAMERA COVERAGE
High-Speed Vehicle Onboard 0High-Speed Offboard 14 Real-Time 2
Total 16
Test Vehicle: 2012 Toyota Camry LE 4-Dr Sedan NHTSA No.: YC5100 Test Program: NCAP Frontal Barrier Impact Test Test Date: 11/15/2011

19
DATA SHEET NO. 11 POST-TEST OBSERVATIONS
TEST DUMMY INFORMATION AND CONTACT LOCATIONS Description Driver Passenger
Dummy Type / Serial No. HIII 50% / 351 HIII 5% / 138Head Contact Airbag, Headrest Airbag, Headrest, Seat Back Upper Torso Contact Airbag Airbag Lower Torso Contact None None Left Knee Contact Airbag Airbag Right Knee Contact Airbag Airbag
DOOR OPENING AND SEAT TRACK INFORMATION
Description Driver PassengerLocked/Unlocked Doors Doors were locked Doors were locked
Front Door Opening Door remained closed and latched; Door opened without tools
Door remained closed and latched; Door opened without tools
Rear Door Opening Door remained closed and latched; Door opened without tools
Door remained closed and latched; Door opened without tools
Seat Track Shift (mm) 0 0 Seat Back Failure None None
POST TEST STRUCTURAL OBSERVATIONS
Critical Areas of Performance Observations and Conclusions Windshield Damage CrackedWindow Damage None Other Notable Effects Doors Remained Locked
VEHICLE REBOUND FROM BARRIER
Measured Parameter Units ValueLeft Side mm 790Center mm 860 Right Side mm 850 Average mm 833
SUPPLEMENTAL RESTRAINT SYSTEM INFORMATION
Left Front (Driver) P1 Right Front (Passenger) Restraint Type Mounted Deployed Mounted Deployed
Frontal Airbag Yes Yes Yes YesKnee Airbag Yes Yes Yes Yes Curtain Side Airbag Yes No Yes No Side Torso/Abdomen/Pelvis Airbag Yes No Yes No Seat Belt Pretensioner Yes Yes Yes Yes Seat Belt Load Limiter Yes Yes
Test Vehicle: 2012 Toyota Camry LE 4-Dr Sedan NHTSA No.: YC5100 Test Program: NCAP Frontal Barrier Impact Test Test Date: 11/15/2011

20
DATA SHEET NO. 12 VEHICLE PROFILE MEASUREMENTS
Test Vehicle: 2012 Toyota Camry LE 4-Dr Sedan NHTSA No.: YC5100 Test Program: NCAP Frontal Barrier Impact Test Test Date: 11/15/2011

21
DATA SHEET NO. 12 (CONTINUED) VEHICLE PROFILE MEASUREMENTS
RSOV (Rear Surface of Vehicle)
No. Measurement Description Units Pre-Test Post-Test Difference
1 Total Length of Vehicle at Centerline mm 4809 4230 579
2 RSOV to Front of Engine mm 4325 4021 304
3 RSOV to Firewall mm 3764 3660 104
4 RSOV to Upper Leading Edge of Right Door mm 3385 3383 2
5 RSOV to Upper Leading Edge of Left Door mm 3385 3380 5
6 RSOV to Lower Leading Edge of Right Door mm 3340 3340 0
7 RSOV to Lower Leading Edge of Left Door mm 3340 3340 0
8 RSOV to Upper Trailing Edge of Right Door mm 2217 2217 0
9 RSOV to Upper Trailing Edge of Left Door mm 2217 2217 0
10 RSOV to Lower Trailing Edge of Right Door mm 2228 2228 0
11 RSOV to Lower Trailing Edge of Left Door mm 2228 2226 2
12 RSOV to Bottom of “A” Post of Right Side mm 3354 3350 4
13 RSOV to Bottom of “A” Post of Left Side mm 3354 3354 0
14 RSOV to Firewall, Right Side mm 3517 3519 -2
15 RSOV to Firewall, Left Side mm 3517 3513 4
16 RSOV to Steering Column mm 2852 2873 -21
17 Center of Steering Column to “A” Post mm 397 350 47
18 Center of Steering Column to Headliner mm 428 404 24
19 RSOV to Right Side of Front Bumper mm 4662 4262 400
20 RSOV to Left Side of Front Bumper mm 4662 4298 364
21 Length of Engine Block mm 541 541 0
RD RSOV to Right Side of Dash Panel mm 3072 3071 1
CD RSOV to Center of Dash Panel mm 3204 3198 6
LD RSOV to Left Side of Dash Panel mm 3072 3070 2
Test Vehicle: 2012 Toyota Camry LE 4-Dr Sedan NHTSA No.: YC5100 Test Program: NCAP Frontal Barrier Impact Test Test Date: 11/15/2011

22
DATA SHEET NO. 13 ACCIDENT INVESTIGATION DIVISION DATA
VEHICLE INFORMATION VIN: 4T4BF1FK1CR157833 Wheelbase (mm): 2774
Vehicle Size Category: Sedan Test Weight (kg): 1662.1
ACCELEROMETER DATA Accelerometer Locations: As per measurements on Page 15
Cal. Procedure/Interval: MGA procedure / 6 month
Integration Algorithm: Trapezoidal Linearity: > 99%
Impact Velocity (km/h): 56.3
Velocity Change (km/h): 59.7
Time of Separation (msec): 88.3
CRUSH PROFILE Collision Deformation Classification: Frontal
Midpoint of Damage: Centerline
Damage Region Length (mm): 1282
Impact Mode: Frontal
No. Measurement Description Units Pre-Test Post-Test DifferenceC1 Crush zone 1 at left side mm 4662 4298 364C2 Crush zone 2 at left side mm 4745 4267 478 C3 Crush zone 3 at left side mm 4771 4240 531 C4 Crush zone 4 at right side mm 4771 4236 535 C5 Crush zone 5 at right side mm 4745 4256 489 C6 Crush zone 6 at right side mm 4662 4262 400 L C1 TO C6 mm 1282 1275 7
Test Vehicle: 2012 Toyota Camry LE 4-Dr Sedan NHTSA No.: YC5100 Test Program: NCAP Frontal Barrier Impact Test Test Date: 11/15/2011

23
DATA SHEET NO. 14 VEHICLE INTRUSION MEASUREMENTS
DOOR OPENING WIDTH
Item Description Units Pre-Test Post-Test Difference
A Left Side Upper mm 1083 1083 0
B Left Side Lower mm 935 935 0
D Right Side Upper mm 1083 1083 0
E Right Side Lower mm 935 935 0
WHEELBASE MEASUREMENTS
Item Description Units Pre-Test Post-Test Difference
C Left Side Wheelbase mm 2774 2718 56
F Right Side Wheelbase mm 2774 2722 52
C
B
A
F
E
D
Test Vehicle: 2012 Toyota Camry LE 4-Dr Sedan NHTSA No.: YC5100 Test Program: NCAP Frontal Barrier Impact Test Test Date: 11/15/2011

24
DATA SHEET NO. 14 (CONTINUED) VEHICLE INTRUSION MEASUREMENTS
DRIVER COMPARTMENT INTRUSION Item Description Units Pre-Test Post-Test Difference
AB Door Opening (Inside window jam) mm 892 890 2
CX Left Knee Bolster to X mm 263 275 -12
DX Right Knee Bolster to X mm 287 290 -3
EX Brake Pedal to X mm 594 572 22
FX Foot Rest to X mm 642 805 -163
GX Center of Steering Column Wheel Hub to X mm 60 105 -45
X = Front of Seat Track (stationary)
A B
X
G
FX
AB
CX
DX
EXGX
DRIVER COMPARTMENT
Test Vehicle: 2012 Toyota Camry LE 4-Dr Sedan NHTSA No.: YC5100 Test Program: NCAP Frontal Barrier Impact Test Test Date: 11/15/2011

25
DATA SHEET NO. 14 (CONTINUED) VEHICLE INTRUSION MEASUREMENTS
TOP VIEW THROUGH FLOOR PAN
UNDERBODY FLOORBOARD DEFORMATION
Measurement Units Pre-Test Post-Test Difference
A mm 300 300 0
B mm 300 300 0
C mm 290 290 0
D mm 300 300 0
E mm 300 300 0
F mm 300 300 0
G mm 295 295 0
H mm 295 295 0
Test Vehicle: 2012 Toyota Camry LE 4-Dr Sedan NHTSA No.: YC5100 Test Program: NCAP Frontal Barrier Impact Test Test Date: 11/15/2011
PassengerDriver
26
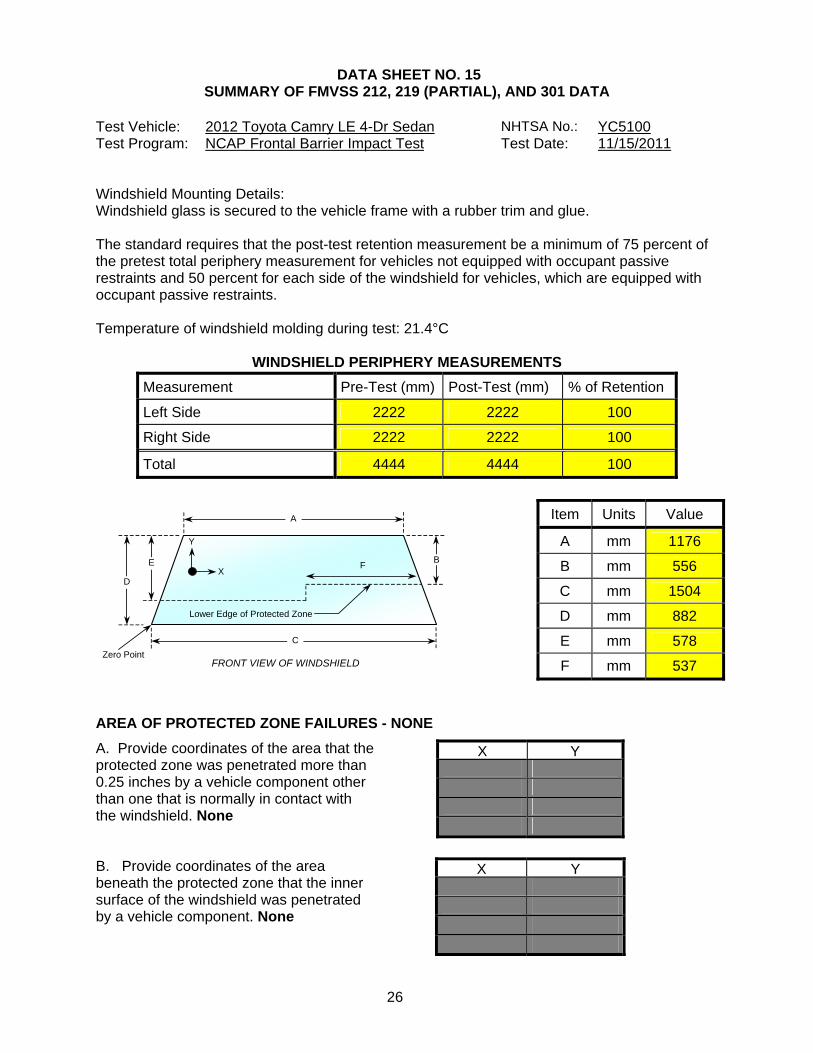
A
D
E B F
C
Lower Edge of Protected Zone
FRONT VIEW OF WINDSHIELDZero Point
Y
X
DATA SHEET NO. 15 SUMMARY OF FMVSS 212, 219 (PARTIAL), AND 301 DATA
Windshield Mounting Details: Windshield glass is secured to the vehicle frame with a rubber trim and glue. The standard requires that the post-test retention measurement be a minimum of 75 percent of the pretest total periphery measurement for vehicles not equipped with occupant passive restraints and 50 percent for each side of the windshield for vehicles, which are equipped with occupant passive restraints. Temperature of windshield molding during test: 21.4°C
WINDSHIELD PERIPHERY MEASUREMENTS
Measurement Pre-Test (mm) Post-Test (mm) % of Retention
Left Side 2222 2222 100
Right Side 2222 2222 100
Total 4444 4444 100
AREA OF PROTECTED ZONE FAILURES - NONE A. Provide coordinates of the area that the protected zone was penetrated more than 0.25 inches by a vehicle component other than one that is normally in contact with the windshield. None
X Y
B. Provide coordinates of the area beneath the protected zone that the inner surface of the windshield was penetrated by a vehicle component. None
X Y
Test Vehicle: 2012 Toyota Camry LE 4-Dr Sedan NHTSA No.: YC5100 Test Program: NCAP Frontal Barrier Impact Test Test Date: 11/15/2011
Item Units Value
A mm 1176
B mm 556
C mm 1504
D mm 882
E mm 578
F mm 537

27
DATA SHEET NO. 15 (CONTINUED) SUMMARY OF FMVSS 212, 219 (PARTIAL), AND 301 DATA
FMVSS 301 FUEL SYSTEM INTEGRITY POST IMPACT DATA
Test Time: 10:41 am Temperature: 21.4o C
A. From impact until vehicle motion ceases: 0 oz.
(Maximum Allowable = 1 ounce) B. For the 5 minute period after motion ceases: None
(Maximum allowable = 5 ounces) C. For the following 25 minutes: None
(Maximum allowable = 1 oz./minute) D. Spillage Details: None
Test Vehicle: 2012 Toyota Camry LE 4-Dr Sedan NHTSA No.: YC5100 Test Program: NCAP Frontal Barrier Impact Test Test Date: 11/15/2011

28
DATA SHEET NO. 16 FMVSS 301 STATIC ROLLOVER RESULTS
1. The specified fixture rollover rate for each 90° of rotation is 60 to 180 seconds.
2. The position hold time at each position is 300 seconds (minimum).
3. Details of Stoddard Solvent spillage: None
SOLVENT COLLECTION TIME TABLE IN SECONDS
Test Phase Rotation Time Hold Time Total Time 0° to 90° 119 300 419 90° to 180° 115 300 415 180° to 270° 108 300 408 270° to 360° 116 300 416
FMVSS 301 ROLLOVER SPILLAGE TABLE (units in ounces) Test Phase First 5 Minutes Sixth Minute Seventh Minute Eight Minute0° to 90° 0 0 0 0 90° to 180° 0 0 0 0 180° to 270° 0 0 0 0 270° to 360° 0 0 0 0
ROLLOVER SOLVENT SPILLAGE LOCATION TABLE Test Phase Spillage Location 0° to 90° 90° to 180° 180° to 270° 270° to 360°
Test Vehicle: 2012 Toyota Camry LE 4-Dr Sedan NHTSA No.: YC5100 Test Program: NCAP Frontal Barrier Impact Test Test Date: 11/15/2011

29
DATA SHEET NO. 17 DUMMY/VEHICLE TEMPERATURE STABILIZATION DATA
Test Vehicle: 2012 Toyota Camry LE 4-Dr Sedan NHTSA No.: YC5100 Test Program: NCAP Frontal Barrier Impact Test Test Date: 11/15/2011

APPENDIX A
PHOTOGRAPHS

TABLE OF PHOTOGRAPHS
Page No.
Photo No. 1. Load Cell Location A-1
Photo No. 2. Load Cell Wall A-1
Photo No. 3. Manufacturer’s Label A-2
Photo No. 4. Tire Placard A-2
Photo No. 5. 2012 Toyota Camry LE Frontal As Delivered A-3
Photo No. 6. Left Rear Three-Quarter View, As Received A-3
Photo No. 7. Pre-Test Front View of Test Vehicle A-4
Photo No. 8. Post-Test Front View of Test Vehicle A-4
Photo No. 9. Pre-Test Left View of Test Vehicle A-5
Photo No. 10. Post-Test Left View of Test Vehicle A-5
Photo No. 11. Pre-Test Right View of Test Vehicle A-6
Photo No. 12. Post-Test Right View of Test Vehicle A-6
Photo No. 13. Pre-Test Right Front Three-Quarter View A-7
Photo No. 14. Post-Test Right Front Three-Quarter View A-7
Photo No. 15. Pre-Test Left Rear Three-Quarter View A-8
Photo No. 16. Post-Test Left Rear Three-Quarter View A-8
Photo No. 17. Pre-Test Windshield View A-9
Photo No. 18. Post-Test Windshield View A-9
Photo No. 19. Pre-Test Engine Compartment View A-10
Photo No. 20. Post-Test Engine Compartment View A-10
Photo No. 21. Pre-Test Fuel Filler Cap View A-11
Photo No. 22. Post-Test Fuel Filler Cap View A-11
Photo No. 23. Pre-Test Front Underbody View A-12
Photo No. 24. Post-Test Front Underbody View A-12
Photo No. 25. Pre-Test Mid Front Underbody View A-13
Photo No. 26. Post-Test Mid Front Underbody View A-13
Photo No. 27. Pre-Test Mid Rear Underbody View A-14

Page No.
Photo No. 28. Post-Test Mid Rear Underbody View A-14
Photo No. 29. Pre-Test Rear Underbody View A-15
Photo No. 30. Post-Test Rear Underbody View A-15
Photo No. 31. Pre-Test Dummy Cable Routing A-16
Photo No. 32. Post-Test Dummy Cable Routing A-16
Photo No. 33. Pre-Test Driver Dummy Front View A-17
Photo No. 34. Post-Test Driver Dummy Front View A-17
Photo No. 35. Pre-Test Driver Dummy Window View A-18
Photo No. 36. Post-Test Driver Dummy Window View A-18
Photo No. 37. Pre-Test Driver Dummy and Vehicle Interior (Door Open) A-19
Photo No. 38. Post-Test Driver Dummy and Vehicle Interior (Door Open) A-19
Photo No. 39. Pre-Test Driver’s Seat Fore-Aft Markings A-20
Photo No. 40. Post-Test Driver’s Seat Fore-Aft Markings A-20
Photo No. 41. Pre-Test Driver Dummy Feet A-21
Photo No. 42. Post-Test Driver Dummy Feet A-21
Photo No. 43. Pre-Test Driver’s Side Knee Bolster (without dummy) A-22
Photo No. 44. Post-Test Driver’s Side Knee Bolster (without dummy) A-22
Photo No. 45. Pre-Test Driver’s Side Floorpan A-23
Photo No. 46. Post-Test Driver’s Side Floorpan A-23
Photo No. 47. Post-Test Driver Dummy Face A-24
Photo No. 48. Post-Test Driver Dummy Contact with Airbag A-24
Photo No. 49. Post-Test Driver Dummy Contact with Knee Airbag A-25
Photo No. 50. Post-Test Driver Dummy Contact with Headrest A-25
Photo No. 51. Pre-Test View of the Steering Wheel A-26
Photo No. 52. Post-Test View of the Steering Wheel A-26
Photo No. 53. Pre-Test Passenger Dummy Front View A-27
Photo No. 54. Post-Test Passenger Dummy Front View A-27
Photo No. 55. Pre-Test Passenger Dummy Window View A-28

Page No.
Photo No. 56. Post-Test Passenger Dummy Window View A-28
Photo No. 57. Pre-Test Passenger Dummy and Vehicle Interior (Door Open) A-29
Photo No. 58. Post-Test Passenger Dummy and Vehicle Interior (Door Open) A-29
Photo No. 59. Pre-Test Passenger’s Seat Fore-Aft Markings A-30
Photo No. 60. Post-Test Passenger’s Seat Fore-Aft Markings A-30
Photo No. 61. Pre-Test Passenger Dummy Feet A-31
Photo No. 62. Post-Test Passenger Dummy Feet A-31
Photo No. 63. Pre-Test Passenger’s Side Knee Bolster (without dummy) A-32
Photo No. 64. Post-Test Passenger’s Side Knee Bolster (without dummy) A-32
Photo No. 65. Pre-Test Passenger’s Side Floorpan A-33
Photo No. 66. Post-Test Passenger’s Side Floorpan A-33
Photo No. 67. Post-Test Passenger Dummy Contact with Airbag A-34
Photo No. 68. Post-Test Passenger Dummy Contact with Knee Airbag A-34
Photo No. 69. Post-Test Passenger Dummy Contact with Headrest A-35
Photo No. 70. Post-Test Passenger Dummy Contact with Seat Back A-35
Photo No. 71. Ballast Installed in Vehicle A-36
Photo No. 72. Post-Test Stoddard Solvent Spillage Location View A-36
Photo No. 73. Post-Test Speed Trap Read-Out A-37
Photo No. 74. Vehicle at 0 Degrees on Static Rollover Device A-37
Photo No. 75. Vehicle at 90 Degrees on Static Rollover Device A-38
Photo No. 76. Vehicle at 180 Degrees on Static Rollover Device A-38
Photo No. 77. Vehicle at 270 Degrees on Static Rollover Device A-39
Photo No. 78. Vehicle at 360 Degrees on Static Rollover Device A-39
Photo No. 79. 2012 Toyota Camry LE Frontal Impact Event A-40
Photo No. 80. Monroney Label A-40
Photo No. 81. Load Carrying Capacity Reduced Label A-41
Photo No. 82. Post-Test Driver Dummy Hand Out Window A-41

A-1
Load Cell Location
Load Cell Wall

A-2
Manufacturer's Label
Tire Placard

A-3
2012 Toyota Camry LE Frontal As Delivered
Left Rear Three-Quarter View, As Received

A-4
Pre-Test Front View of Test Vehicle
Post-Test Front View of Test Vehicle

A-5
Pre-Test Left View of Test Vehicle
Post-Test Left View of Test Vehicle

A-6
Pre-Test Right View of Test Vehicle
Post-Test Right View of Test Vehicle

A-7
Pre-Test Right Front Three-Quarter View
Post-Test Right Front Three-Quarter View

A-8
Pre-Test Left Rear Three-Quarter View
Post-Test Left Rear Three-Quarter View

A-9
Pre-Test Windshield View
Post-Test Windshield View

A-10
Pre-Test Engine Compartment View
Post-Test Engine Compartment View

A-11
Pre-Test Fuel Filler Cap View
Post-Test Fuel Filler Cap View

A-12
Pre-Test Front Underbody View
Post-Test Front Underbody View
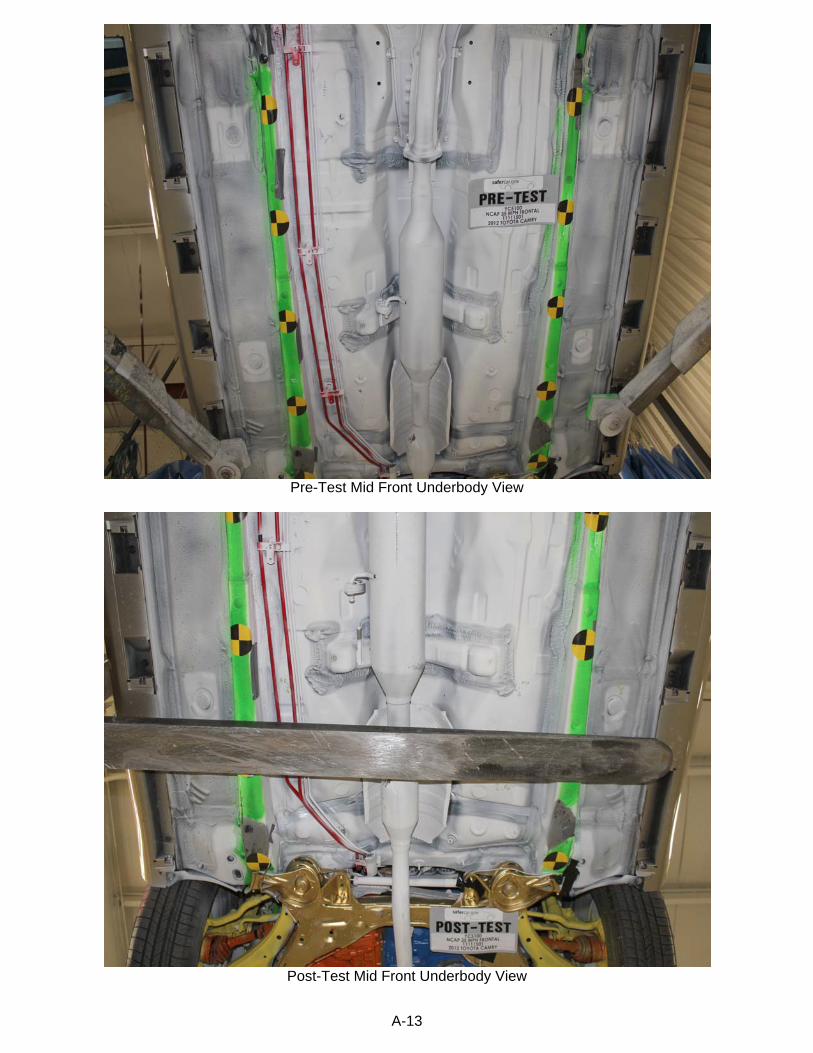
A-13
Pre-Test Mid Front Underbody View
Post-Test Mid Front Underbody View

A-14
Pre-Test Mid Rear Underbody View
Post-Test Mid Rear Underbody View

A-15
Pre-Test Rear Underbody View
Post-Test Rear Underbody View

A-16
Pre-Test Dummy Cable Routing
Post-Test Dummy Cable Routing

A-17
Pre-Test Driver Dummy Front View
Post-Test Driver Dummy Front View

A-18
Pre-Test Driver Dummy Window View
Post-Test Driver Dummy Window View

A-19
Pre-Test Driver Dummy and Vehicle Interior (Door Open)
Post-Test Driver Dummy and Vehicle Interior (Door Open)

A-20
Pre-Test Driver's Seat Fore-Aft Markings
Post-Test Driver's Seat Fore-Aft Markings

A-21
Pre-Test Driver Dummy Feet
Post-Test Driver Dummy Feet

A-22
Pre-Test Driver's Side Knee Bolster (without dummy)
Post-Test Driver's Side Knee Bolster (without dummy)

A-23
Pre-Test Driver's Side Floorpan
Post-Test Driver's Side Floorpan

A-24
Post-Test Driver Dummy Face
Post-Test Driver Dummy Contact with Airbag

A-25
Post-Test Driver Dummy Contact with Knee Airbag
Post-Test Driver Dummy Contact with Headrest

A-26
Pre-Test View of the Steering Wheel
Post-Test View of the Steering Wheel

A-27
Pre-Test Passenger Dummy Front View
Post-Test Passenger Dummy Front View
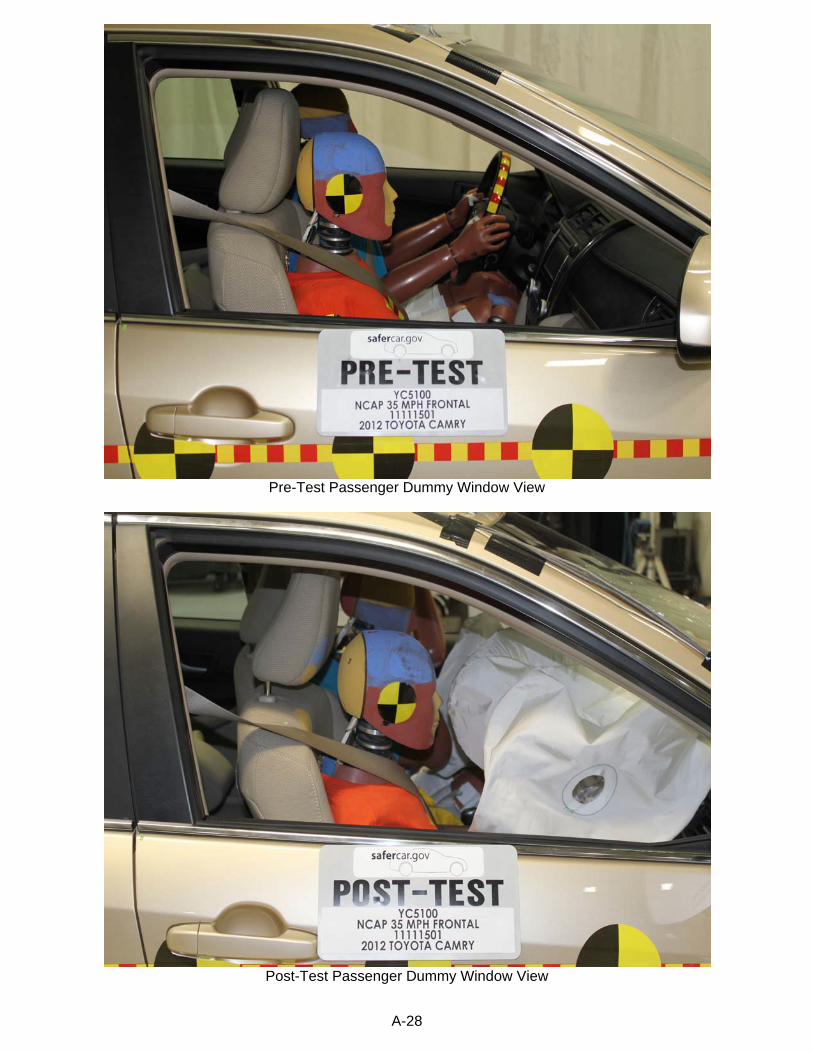
A-28
Pre-Test Passenger Dummy Window View
Post-Test Passenger Dummy Window View

A-29
Pre-Test Passenger Dummy and Vehicle Interior (Door Open)
Post-Test Passenger Dummy and Vehicle Interior (Door Open)

A-30
Pre-Test Passenger's Seat Fore-Aft Markings
Post-Test Passenger's Seat Fore-Aft Markings

A-31
Pre-Test Passenger Dummy Feet
Post-Test Passenger Dummy Feet

A-32
Pre-Test Passenger's Side Knee Bolster (without dummy)
Post-Test Passenger's Side Knee Bolster (without dummy)

A-33
Pre-Test Passenger's Side Floorpan
Post-Test Passenger's Side Floorpan

A-34
Post-Test Passenger Dummy Contact with Airbag
Post-Test Passenger Dummy Contact with Knee Airbag

A-35
Post-Test Passenger Dummy Contact with Headrest
Post-Test Passenger Dummy Contact with Seat Back

A-36
Ballast Installed in Vehicle
Post-Test Stoddard Solvent Spillage Location View

A-37
Post-Test Speed Trap Read-Out
Vehicle at 0 Degrees on Static Rollover Device

A-38
Vehicle at 90 Degrees on Static Rollover Device
Vehicle at 180 Degrees on Static Rollover Device

A-39
Vehicle at 270 Degrees on Static Rollover Device
Vehicle at 360 Degrees on Static Rollover Device

A-40
2012 Toyota Camry LE Frontal Impact Event
Monroney Label

A-41
Load Carrying Capacity Reduced Label
Post-Test Driver Dummy Hand Out Window

APPENDIX B
DUMMY RESPONSE DATA TRACES

TABLE OF DATA PLOTS
Page No.
List of Data Plots Provided in the Test Report
Figure No. 1. Driver Head X Acceleration vs. Time B-1
Figure No. 2. Driver Head Y Acceleration vs. Time B-1
Figure No. 3. Driver Head Z Acceleration vs. Time B-1
Figure No. 4. Driver Head Resultant Acceleration vs. Time B-1
Figure No. 5. Driver Chest Displacement vs. Time B-2
Figure No. 6. Driver Chest X Acceleration vs. Time B-3
Figure No. 7. Driver Chest Y Acceleration vs. Time B-3
Figure No. 8. Driver Chest Z Acceleration vs. Time B-3
Figure No. 9. Driver Chest Resultant Acceleration vs. Time B-3
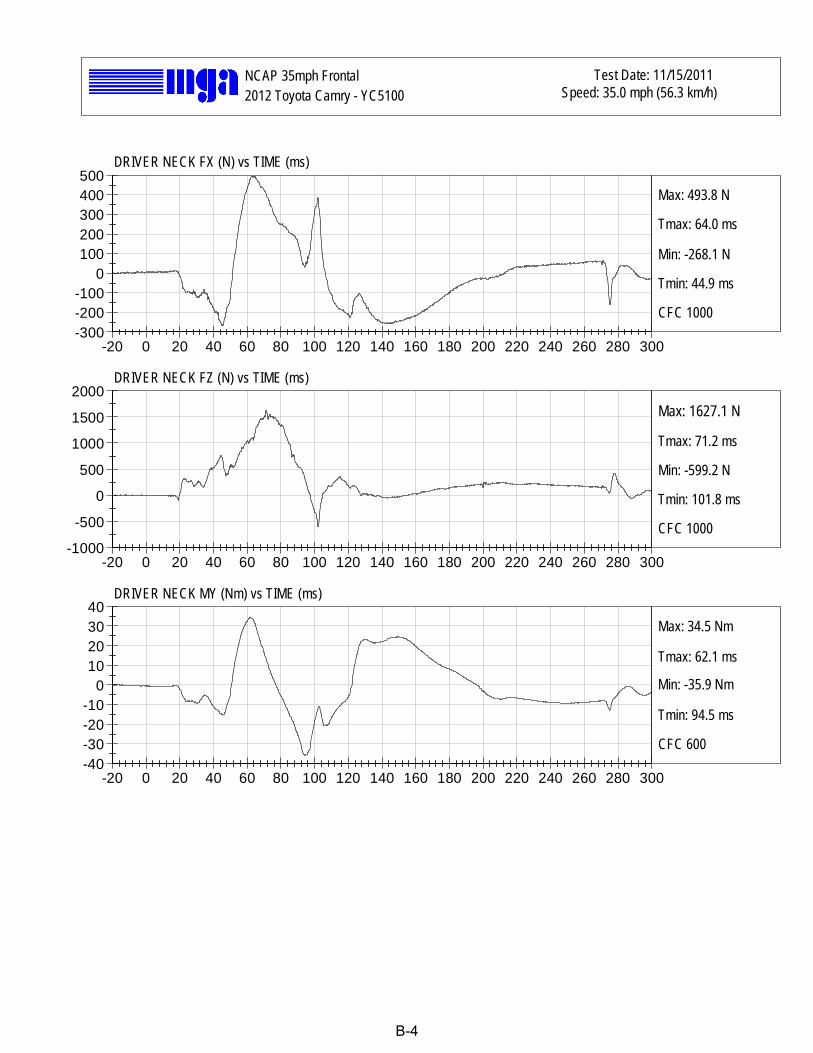
Figure No. 10. Driver Neck Force X vs. Time B-4
Figure No. 11. Driver Neck Force Z vs. Time B-4
Figure No. 12. Driver Neck Moment Y vs. Time B-4
Figure No. 13. Driver Nij (NTF) vs. Time B-5
Figure No. 14. Driver Nij (NTE) vs. Time B-5
Figure No. 15. Driver Nij (NCF) vs. Time B-5
Figure No. 16. Driver Nij (NCE) vs. Time B-5
Figure No. 17. Driver Left Femur Force vs. Time B-6
Figure No. 18. Driver Right Femur Force vs. Time B-6
Figure No. 19. Passenger Head X Acceleration vs. Time B-7
Figure No. 20. Passenger Head Y Acceleration vs. Time B-7
Figure No. 21. Passenger Head Z Acceleration vs. Time B-7
Figure No. 22. Passenger Head Resultant Acceleration vs. Time B-7
Figure No. 23. Passenger Chest Displacement vs. Time B-8
Figure No. 24. Passenger Chest X Acceleration vs. Time B-9
Figure No. 25. Passenger Chest Y Acceleration vs. Time B-9
Figure No. 26. Passenger Chest Z Acceleration vs. Time B-9
Figure No. 27. Passenger Chest Resultant Z Acceleration vs. Time B-9

Page No.
Figure No. 28. Passenger Neck Force X vs. Time B-10
Figure No. 29. Passenger Neck Force Z vs. Time B-10
Figure No. 30. Passenger Neck Moment Y vs. Time B-10
Figure No. 31. Passenger Nij (NTF) vs. Time B-11
Figure No. 32. Passenger Nij (NTE) vs. Time B-11
Figure No. 33. Passenger Nij (NCF) vs. Time B-11
Figure No. 34. Passenger Nij (NCE) vs. Time B-11
Figure No. 35. Passenger Left Femur Force vs. Time B-12
Figure No. 36. Passenger Right Femur Force vs. Time B-12
The following additional dummy and vehicle response data can be found in the R&D section of the NHTSA website at www.nhtsa.dot.gov
Driver Head X Redundant
Driver Head Y Redundant
Driver Head Z Redundant
Driver Upper Neck Force Y
Driver Upper Neck Moment X
Driver Upper Neck Moment Z
Driver Chest X Redundant
Driver Chest Y Redundant
Driver Chest Z Redundant
Driver Pelvis X
Driver Pelvis Y
Driver Pelvis Z
Driver Left Femur Redundant
Driver Right Femur Redundant
Driver Left Upper Tibia Moment X
Driver Left Upper Tibia Moment Y
Driver Left Upper Tibia Force Z
Driver Left Lower Tibia Moment X

Driver Left Lower Tibia Moment Y
Driver Left Lower Tibia Force Z
Driver Right Upper Tibia Moment X
Driver Right Upper Tibia Moment Y
Driver Right Upper Tibia Force Z
Driver Right Lower Tibia Moment X
Driver Right Lower Tibia Moment Y
Driver Right Lower Tibia Force Z
Driver Left Foot Fore Z
Driver Left Foot Aft X
Driver Left Foot Aft Z
Driver Right Foot Fore Z
Driver Right Foot Aft X
Driver Right Foot Aft Z
Driver Lap Belt Force
Driver Shoulder Belt Force (Not Installed)
Passenger Head X Redundant
Passenger Head Y Redundant
Passenger Head Z Redundant
Passenger Upper Neck Force Y
Passenger Upper Neck Moment X
Passenger Upper Neck Moment Z
Passenger Chest X Redundant
Passenger Chest Y Redundant
Passenger Chest Z Redundant
Passenger Pelvis X
Passenger Pelvis Y
Passenger Pelvis Z
Passenger Left Femur Redundant
Passenger Right Femur Redundant
Passenger Left Upper Tibia Moment X
Passenger Left Upper Tibia Moment Y
Passenger Left Upper Tibia Force Z
Passenger Left Lower Tibia Moment X
Passenger Left Lower Tibia Moment Y
Passenger Left Lower Tibia Force Z
Passenger Right Upper Tibia Moment X
Passenger Right Upper Tibia Moment Y
Passenger Right Upper Tibia Force Z
Passenger Right Lower Tibia Moment X
Passenger Right Lower Tibia Moment Y
Passenger Right Lower Tibia Force Z
Passenger Left Foot Fore Z
Passenger Left Foot Aft X
Passenger Left Foot Aft Z
Passenger Right Foot Fore Z
Passenger Right Foot Aft X
Passenger Right Foot Aft Z
Passenger Lap Belt Force
Passenger Shoulder Belt Force (Not Installed)
Left Rear Seat Crossmember X
Right Rear Seat Crossmember X
Vehicle Engine Top X
Vehicle Engine Bottom X
Vehicle Left Brake Caliper X
Vehicle Right Brake Caliper X
Left Rear Seat Crossmember Xr
Right Rear Seat Crossmember Xr
Advanced Research Load Cell Barrier – 128 channels

NCAP 35mph Frontal Test Date: 11/15/2011Speed: 35.0 mph (56.3 km/h)2012 Toyota Camry - YC5100
Max: 61.7 G's
Tmax: 275.0 ms
Min: -39.2 G's
Tmin: 85.1 ms
CFC 1000
DRIVER HEAD X (G's) vs TIME (ms)
DRIVER HEAD Y (G's) vs TIME (ms)
Max: 5.7 G's
Tmax: 124.2 ms
Min: -5.7 G's
Tmin: 274.9 ms
CFC 1000
Max: 21.9 G's
Tmax: 73.4 ms
Min: -29.2 G's
Tmin: 102.0 ms
CFC 1000
Max: 64.1 G's
Tmax: 275.0 ms
Min: 0.0 G's
Tmin: 0.0 ms
CFC 1000
DRIVER HEAD Z (G's) vs TIME (ms)
DRIVER HEAD Resultant (G's) vs TIME (ms)
-20 0 20 40 60 80 100 120 140 160 180 200 220 240 260 280 300-50
-25
0
25
50
75
-20 0 20 40 60 80 100 120 140 160 180 200 220 240 260 280 300-7.5
-5
-2.5
0
2.5
5
7.5
-20 0 20 40 60 80 100 120 140 160 180 200 220 240 260 280 300-30
-20
-10
0
10
20
30
-20 0 20 40 60 80 100 120 140 160 180 200 220 240 260 280 3000
10203040506070
B-1

NCAP 35mph Frontal Test Date: 11/15/2011Speed: 35.0 mph (56.3 km/h)2012 Toyota Camry - YC5100
Max: 0.1 mm
Tmax: 0.0 ms
Min: -18.1 mm
Tmin: 72.5 ms
CFC 600
DRIVER CHEST DISPLACEMENT (mm) vs TIME (ms)
-20 0 20 40 60 80 100 120 140 160 180 200 220 240 260 280 300-20
-17.5-15
-12.5-10
-7.5-5
-2.50
2.5
B-2

NCAP 35mph Frontal Test Date: 11/15/2011Speed: 35.0 mph (56.3 km/h)2012 Toyota Camry - YC5100
Max: 4.5 G's
Tmax: 102.3 ms
Min: -39.5 G's
Tmin: 88.1 ms
CFC 180
DRIVER CHEST X (G's) vs TIME (ms)
DRIVER CHEST Y (G's) vs TIME (ms)
Max: 13.0 G's
Tmax: 102.1 ms
Min: -5.3 G's
Tmin: 31.1 ms
CFC 180
Max: 14.0 G's
Tmax: 74.5 ms
Min: -18.3 G's
Tmin: 100.9 ms
CFC 180
Max: 40.6 G's
Tmax: 88.1 ms
Min: 0.0 G's
Tmin: 0.0 ms
CFC 180
DRIVER CHEST Z (G's) vs TIME (ms)
DRIVER CHEST Resultant (G's) vs TIME (ms)
-20 0 20 40 60 80 100 120 140 160 180 200 220 240 260 280 300-40
-30
-20
-10
0
10
-20 0 20 40 60 80 100 120 140 160 180 200 220 240 260 280 300-7.5
-5-2.5
02.5
57.510
12.515
-20 0 20 40 60 80 100 120 140 160 180 200 220 240 260 280 300-20-15-10
-505
1015
-20 0 20 40 60 80 100 120 140 160 180 200 220 240 260 280 3000
10
20
30
40
50
B-3
NCAP 35mph Frontal Test Date: 11/15/2011Speed: 35.0 mph (56.3 km/h)2012 Toyota Camry - YC5100
Max: 493.8 N
Tmax: 64.0 ms
Min: -268.1 N
Tmin: 44.9 ms
CFC 1000
DRIVER NECK FX (N) vs TIME (ms)
DRIVER NECK FZ (N) vs TIME (ms)
Max: 1627.1 N
Tmax: 71.2 ms
Min: -599.2 N
Tmin: 101.8 ms
CFC 1000
Max: 34.5 Nm
Tmax: 62.1 ms
Min: -35.9 Nm
Tmin: 94.5 ms
CFC 600
DRIVER NECK MY (Nm) vs TIME (ms)
-20 0 20 40 60 80 100 120 140 160 180 200 220 240 260 280 300-300-200-100
0100200300400500
-20 0 20 40 60 80 100 120 140 160 180 200 220 240 260 280 300-1000
-500
0
500
1000
1500
2000
-20 0 20 40 60 80 100 120 140 160 180 200 220 240 260 280 300-40-30-20-10
010203040
B-4

NCAP 35mph Frontal Test Date: 11/15/2011Speed: 35.0 mph (56.3 km/h)2012 Toyota Camry - YC5100
Max: 0.26
Tmax: 67.9 ms
Min: 0.0
Tmin: 0.0 ms
CFC 600
Drv. nij (NTF) () vs TIME (ms)
Drv. nij (NTE) () vs TIME (ms)
Max: 0.33
Tmax: 93.4 ms
Min: 0.0
Tmin: 0.0 ms
CFC 600
Max: 0.10
Tmax: 148.9 ms
Min: 0.0
Tmin: 0.0 ms
CFC 600
Max: 0.25
Tmax: 97.4 ms
Min: 0.0
Tmin: 0.0 ms
CFC 600
Drv. nij (NCF) () vs TIME (ms)
Drv. nij (NCE) () vs TIME (ms)
-20 0 20 40 60 80 100 120 140 160 180 200 220 240 260 280 3000
0.05
0.1
0.15
0.2
0.25
0.3
-20 0 20 40 60 80 100 120 140 160 180 200 220 240 260 280 3000
0.050.1
0.150.2
0.250.3
0.35
-20 0 20 40 60 80 100 120 140 160 180 200 220 240 260 280 3000
0.02
0.04
0.06
0.08
0.1
-20 0 20 40 60 80 100 120 140 160 180 200 220 240 260 280 3000
0.05
0.1
0.15
0.2
0.25
0.3
B-5

NCAP 35mph Frontal Test Date: 11/15/2011Speed: 35.0 mph (56.3 km/h)2012 Toyota Camry - YC5100
Max: 118.5 N
Tmax: 19.9 ms
Min: -1680.5 N
Tmin: 39.0 ms
CFC 600
DRIVER LEFT FEMUR (N) vs TIME (ms)
DRIVER RIGHT FEMUR (N) vs TIME (ms)
Max: 115.3 N
Tmax: 157.6 ms
Min: -2434.4 N
Tmin: 29.2 ms
CFC 600
-20 0 20 40 60 80 100 120 140 160 180 200 220 240 260 280 300-1750-1500-1250-1000
-750-500-250
0250
-20 0 20 40 60 80 100 120 140 160 180 200 220 240 260 280 300-2500
-2000
-1500
-1000
-500
0
500
B-6

NCAP 35mph Frontal Test Date: 11/15/2011Speed: 35.0 mph (56.3 km/h)2012 Toyota Camry - YC5100
Max: 14.3 G's
Tmax: 203.5 ms
Min: -59.5 G's
Tmin: 62.6 ms
CFC 1000
PASSENGER HEAD X (G's) vs TIME (ms)
PASSENGER HEAD Y (G's) vs TIME (ms)
Max: 7.2 G's
Tmax: 208.1 ms
Min: -15.0 G's
Tmin: 73.7 ms
CFC 1000
Max: 22.7 G's
Tmax: 45.9 ms
Min: -12.2 G's
Tmin: 114.4 ms
CFC 1000
Max: 62.5 G's
Tmax: 62.6 ms
Min: 0.0 G's
Tmin: 0.0 ms
CFC 1000
PASSENGER HEAD Z (G's) vs TIME (ms)
PASSENGER HEAD Resultant (G's) vs TIME (ms)
-20 0 20 40 60 80 100 120 140 160 180 200 220 240 260 280 300-60-50-40-30-20-10
01020
-20 0 20 40 60 80 100 120 140 160 180 200 220 240 260 280 300-20
-15
-10
-5
0
5
10
-20 0 20 40 60 80 100 120 140 160 180 200 220 240 260 280 300-15-10
-505
10152025
-20 0 20 40 60 80 100 120 140 160 180 200 220 240 260 280 3000
10203040506070
B-7

NCAP 35mph Frontal Test Date: 11/15/2011Speed: 35.0 mph (56.3 km/h)2012 Toyota Camry - YC5100
Max: 0.3 mm
Tmax: 0.0 ms
Min: -11.3 mm
Tmin: 67.6 ms
CFC 600
PASSENGER CHEST DISPLACEMENT (mm) vs TIME (ms)
-20 0 20 40 60 80 100 120 140 160 180 200 220 240 260 280 300-12.5
-10
-7.5
-5
-2.5
0
2.5
B-8

NCAP 35mph Frontal Test Date: 11/15/2011Speed: 35.0 mph (56.3 km/h)2012 Toyota Camry - YC5100
Max: 8.1 G's
Tmax: 155.1 ms
Min: -42.3 G's
Tmin: 73.4 ms
CFC 180
PASSENGER CHEST X (G's) vs TIME (ms)
PASSENGER CHEST Y (G's) vs TIME (ms)
Max: 2.8 G's
Tmax: 150.0 ms
Min: -4.2 G's
Tmin: 93.8 ms
CFC 180
Max: 13.6 G's
Tmax: 70.0 ms
Min: -13.6 G's
Tmin: 120.4 ms
CFC 180
Max: 43.8 G's
Tmax: 73.2 ms
Min: 0.0 G's
Tmin: 5.9 ms
CFC 180
PASSENGER CHEST Z (G's) vs TIME (ms)
PASSENGER CHEST Resultant (G's) vs TIME (ms)
-20 0 20 40 60 80 100 120 140 160 180 200 220 240 260 280 300-50
-40
-30
-20
-10
0
10
-20 0 20 40 60 80 100 120 140 160 180 200 220 240 260 280 300-5-4-3-2-10123
-20 0 20 40 60 80 100 120 140 160 180 200 220 240 260 280 300-15
-10
-5
0
5
10
15
-20 0 20 40 60 80 100 120 140 160 180 200 220 240 260 280 3000
10
20
30
40
50
B-9

NCAP 35mph Frontal Test Date: 11/15/2011Speed: 35.0 mph (56.3 km/h)2012 Toyota Camry - YC5100
Max: 744.0 N
Tmax: 68.9 ms
Min: -246.3 N
Tmin: 147.5 ms
CFC 1000
PASSENGER NECK FX (N) vs TIME (ms)
PASSENGER NECK FZ (N) vs TIME (ms)
Max: 706.1 N
Tmax: 35.9 ms
Min: -401.7 N
Tmin: 114.1 ms
CFC 1000
Max: 49.4 Nm
Tmax: 67.0 ms
Min: -18.2 Nm
Tmin: 253.2 ms
CFC 600
PASSENGER NECK MY (Nm) vs TIME (ms)
-20 0 20 40 60 80 100 120 140 160 180 200 220 240 260 280 300-400
-200
0
200
400
600
800
-20 0 20 40 60 80 100 120 140 160 180 200 220 240 260 280 300-500
-250
0
250
500
750
-20 0 20 40 60 80 100 120 140 160 180 200 220 240 260 280 300-20-10
01020304050
B-10

NCAP 35mph Frontal Test Date: 11/15/2011Speed: 35.0 mph (56.3 km/h)2012 Toyota Camry - YC5100
Max: 0.30
Tmax: 66.7 ms
Min: 0.0
Tmin: 0.0 ms
CFC 600
Pass. nij (NTF) () vs TIME (ms)
Pass. nij (NTE) () vs TIME (ms)
Max: 0.27
Tmax: 192.7 ms
Min: 0.0
Tmin: 0.0 ms
CFC 600
Max: 0.30
Tmax: 155.8 ms
Min: 0.0
Tmin: 0.0 ms
CFC 600
Max: 0.34
Tmax: 255.6 ms
Min: 0.0
Tmin: 0.0 ms
CFC 600
Pass. nij (NCF) () vs TIME (ms)
Pass. nij (NCE) () vs TIME (ms)
-20 0 20 40 60 80 100 120 140 160 180 200 220 240 260 280 3000
0.050.1
0.150.2
0.250.3
0.35
-20 0 20 40 60 80 100 120 140 160 180 200 220 240 260 280 3000
0.05
0.1
0.15
0.2
0.25
0.3
-20 0 20 40 60 80 100 120 140 160 180 200 220 240 260 280 3000
0.050.1
0.150.2
0.250.3
0.35
-20 0 20 40 60 80 100 120 140 160 180 200 220 240 260 280 3000
0.050.1
0.150.2
0.250.3
0.35
B-11

NCAP 35mph Frontal Test Date: 11/15/2011Speed: 35.0 mph (56.3 km/h)2012 Toyota Camry - YC5100
Max: 77.2 N
Tmax: 19.2 ms
Min: -2853.7 N
Tmin: 29.0 ms
CFC 600
PASSENGER LEFT FEMUR (N) vs TIME (ms)
PASSENGER RIGHT FEMUR (N) vs TIME (ms)
Max: 52.4 N
Tmax: 15.7 ms
Min: -2634.3 N
Tmin: 29.5 ms
CFC 600
-20 0 20 40 60 80 100 120 140 160 180 200 220 240 260 280 300-3000-2500-2000-1500-1000
-5000
500
-20 0 20 40 60 80 100 120 140 160 180 200 220 240 260 280 300-3000-2500-2000-1500-1000
-5000
500
B-12

APPENDIX C
DUMMY CALIBRATION AND PERFORMANCE VERIFICATION DATA

Hyb
rid II
I, 50
th E
xter
nal M
easu
rem
ents
SN
: 351
H
YB
RID
III,
PA
RT
572,
SU
BP
AR
T E
EX
TER
NA
L D
IMEN
SIO
NS
DIM
EN
SIO
N
DE
SC
RIP
TIO
N
DE
TAIL
S
ASSE
MBL
Y D
IME
NS
ION
(in
ches
)
AC
TUA
L M
EA
SU
RE
MEN
T
A
TOTA
L S
ITTI
NG
HE
IGH
T S
eat s
urfa
ce to
hig
hest
poi
nt o
n to
p of
the
head
. 34
.6–3
5.0
34.8
B
SH
OU
LDER
PIV
OT
HE
IGH
T C
ente
rline
of s
houl
der p
ivot
bol
t to
the
seat
sur
face
. 19
.9-2
0.5
20.0
C
H-P
OIN
T H
EIG
HT
Ref
eren
ce
3.3-
3.5
3.4
D
H-P
OIN
T LO
CA
TIO
N F
RO
M
BA
CK
LIN
E
Ref
eren
ce
5.3-
5.5
5.5
E S
HO
ULD
ER P
IVO
T FR
OM
B
AC
KLI
NE
C
ente
r of t
he s
houl
der c
levi
s to
the
rear
ver
tical
sur
face
of
the
fixtu
re.
3.3-
3.7
3.5
F TH
IGH
CLE
ARA
NC
E
Mea
sure
d at
the
high
est p
oint
on
the
uppe
r fem
ur
segm
ent.
5.5-
6.1
6.0
G
BA
CK
OF
ELB
OW
TO
W
RIS
T P
IVO
T ba
ck o
f the
elb
ow fl
esh
to th
e w
rist p
ivot
in li
ne w
ith th
e el
bow
and
wris
t piv
ots
11.4
-12.
0 11
.8
H
HE
AD
BA
CK
TO
BA
CK
LIN
E
Bac
k of
Sku
ll ca
p sk
in to
sea
t rea
r ver
tical
sur
face
(R
efer
ence
) 1.
6-1.
8 1.
7
I S
HO
ULD
ER T
O- E
LBO
W
LEN
GTH
Mea
sure
from
the
high
est p
oint
on
top
of th
e sh
ould
er
clev
is to
the
low
est p
art o
f the
fles
h on
the
elbo
w in
line
w
ith th
e el
bow
piv
ot b
olt.
13.0
-13.
6 13
.3
J E
LBO
W R
EST
HE
IGH
T M
easu
re fr
om th
e fle
sh b
elow
the
elbo
w p
ivot
bol
t to
the
seat
sur
face
. 7.
5-8.
3 7.
8
K B
UTT
OC
K T
O K
NE
E
LEN
GTH
Th
e fo
rwar
d m
ost p
art o
f the
kne
e fle
sh to
the
rear
ver
tical
su
rface
of t
he fi
xtur
e.
22.8
-23.
8 23
.8
L P
OP
LITE
AL
HE
IGH
T S
eat s
urfa
ce to
the
plan
e of
the
horiz
onta
l pla
ne o
f the
bo
ttom
of t
he fe
et.
16.9
-17.
9 17
.0
M
KN
EE
PIV
OT
HE
IGH
T C
ente
rline
of k
nee
pivo
t bol
t to
the
horiz
onta
l pla
ne o
f the
bo
ttom
of t
he fe
et.
19.1
-19.
7 19
.5
N
BU
TTO
CK
PO
PLI
TEA
L LE
NG
TH
The
rear
mos
t sur
face
of t
he lo
wer
leg
to th
e sa
me
poin
t on
the
rear
sur
face
of t
he b
utto
cks
used
for d
im. “
K”.
17.8
-18.
8 18
.8
C-1

H
YB
RID
III,
SU
BP
AR
T E
EX
TER
IOR
DIM
EN
SIO
NS
, con
tinue
d
DIM
EN
SIO
N
DE
SC
RIP
TIO
N
DE
TAIL
S
A
CTU
AL
ME
AS
UR
EM
ENT
O
CH
ES
T D
EP
TH W
ITH
OU
T JA
CK
ET
Mea
sure
d 16
.9-1
7.1
in. a
bove
sea
t sur
face
8.
4-9.
0 8.
5
P
FOO
T LE
NG
TH
Tip
of to
e to
rear
of h
eal
9.9-
10.5
10
.3
V
SH
OU
LDER
BR
EA
DTH
O
utsi
de e
dges
of r
ight
and
left
shou
lder
cle
vise
s 16
.3-1
7.2
16.5
W
FOO
T B
RE
ADTH
Th
e w
ides
t par
t of t
he fo
ot
3.6-
4.2
4.0
Y C
HE
ST
CIR
CU
MFE
REN
CE
(WIT
H C
HE
ST
JAC
KE
T)
Mea
sure
d 16
.9-1
7.1
in. a
bove
sea
t sur
face
38
.2-3
9.4
39.2
Z W
AIS
T C
IRC
UM
FER
ENC
E
Mea
sure
d 8.
9-9.
1 in
. abo
ve s
eat s
urfa
ce
32.9
-34.
1 33
.7
AA
RE
FER
ENC
E L
OC
ATI
ON
FO
R M
EA
SU
RE
ME
NT
OF
CH
ES
T C
IRC
UM
FER
ENC
E R
efer
ence
16
.9-1
7.1
17.0
BB
RE
FER
ENC
E L
OC
ATI
ON
FO
R M
EA
SU
RE
ME
NT
OF
WAI
ST C
IRC
UM
FER
ENC
E R
efer
ence
8.
9-9.
1 9.
0
NO
TE: T
HE
H-P
OIN
T IS
LO
CA
TED
1.8
3 IN
CH
ES
FO
RW
AR
D A
ND
2.5
7 IN
CH
ES
DO
WN
FR
OM
TH
E C
EN
TER
OF
THE
P
ELV
IS A
NG
LE R
EFE
RE
NC
E H
OLE
.
C-2

MGA RESEARCH CORPORATION
HEAD DROP TEST
HYBRID III 50TH PERCENTILE MALE
ATD Serial No: Test ID:351 D113771
Test Date11/11/11
Laboratory Technician
Approved By
Tested Parameter
Laboratory Temperature
Peak Resultant Acceleration
Laboratory Relative Humidity
Peak Lateral Acceleration G's <= +/- 15.0
Oscillations
5.6 Pass
N/A
Units
deg C
%
G's
Unimodal N/A Yes Yes Pass
within 10% of peak PassYes
Overall Test Results Pass
Specification
18.9 - 25.6
10 to 70
225 - 275
Result Pass/Fail
21.8
28
Pass
260
Pass
Pass
C-3

-25 0 25 50 75 100 1250
50
100
150
200
250
300
-25 0 25 50 75 100 125-4
-2
0
2
4
6
Test Desc: Head Drop Test Date: 11/11/11
CFC 1000
Component ID: D113771 Velocity: 0 ft/s, 0.00 m/s
Max: 259.7 G's
Xmax: 1.9 ms
Min: 0.0 G's
Xmin: -17.8 ms
CFC 1000
RESULTANT HEAD ACCELERATION (G's) vs TIME (ms)
HEAD Y (G's) vs TIME (ms)
Max: 5.6 G's
Xmax: 2.1 ms
Min: -2.7 G's
Xmin: 5.0 ms
C-4

MGA RESEARCH CORPORATION
NECK FLEXION TEST
HYBRID III 50TH PERCENTILE MALE
ATD Serial No: Test I.D:351 D113772
Test Date11/11/11
Laboratory Technician
Approved By
Tested Parameter
Laboratory Temperature
Pendulum Velocity
Laboratory Relative Humidity
Pendulum Deceleration
Peak Pendulum Deceleration After 30 ms
Deceleration Decay Time to Cross 5 G's
Maximum "D" Plane
"D" Plane Rotation Decay Time To Zero
Moment About Occipital
Positive Moment Decay Time To Zero
Units
deg C
%
m/s
G's
G's
G's
G's
ms
Degrees
ms
ms
N m
ms
ms
10 ms
20 ms
30 ms
Maximum
Time
Maximum
Time
Specification
20.6 to 22.2
10 to 70
6.89 to 7.13
22.50 to 27.50
17.60 to 22.60
12.50 to 18.50
<= 29.0
34.0 to 42.0
64.0 to 78.0
57.0 to 64.0
113.0 to 128.0
88.1 to 108.5
47.0 to 58.0
97.0 to 107.0
Rotation
Condyle
Result Pass/Fail
Overall Test Results
Crossing
Crossing
21.5
27
Pass
7.06
22.65
18.63
14.93
14.9
35.0
68.2
57.5
113.4
92.2
47.2
97.8
Pass
Pass
Pass
Pass
Pass
Pass
Pass
Pass
Pass
Pass
Pass
Pass
Pass
Pass
C-5

-50 0 50 100 150 200-5
0
5
10
15
20
25
-50 0 50 100 150 200-50
-25
0
25
50
75
Test Desc: Neck Flexion Test Date: 11/11/11
CFC 60
Component ID: D113772 Velocity: 23.15 ft/s, 7.06 m/s
Max: 24.9 G's
Xmax: 7.8 ms
Min: -3.7 G's
Xmin: 39.5 ms
CFC 60
PENDULUM DECELERATION (G's) vs TIME (ms)
NECK ROTATION (DEG.) vs TIME (ms)
Max: 68.2 DEG.
Xmax: 57.5 ms
Min: -49.1 DEG.
Xmin: 173.5 ms
C-6

-50 0 50 100 150 200-25
0
25
50
75
100
Test Desc: Neck Flexion Test Date: 11/11/11Component ID: D113772 Velocity: 23.15 ft/s, 7.06 m/s
Max: 92.2 Nm
Xmax: 47.2 ms
Min: -24.6 Nm
Xmin: 13.5 ms
CFC 600
OCCIPITAL MOMENT (Nm) vs TIME (ms)
C-7

MGA RESEARCH CORPORATION
NECK EXTENSION TEST
HYBRID III 50TH PERCENTILE MALE
ATD Serial No: Test I.D:351 D113773
Test Date11/11/11
Laboratory Technician
Approved By
Tested Parameter
Laboratory Temperature
Pendulum Velocity
Laboratory Relative Humidity
Pendulum Deceleration
Peak Pendulum Deceleration After 30 ms
Deceleration Decay Time to Cross 5 G's
Maximum "D" Plane
"D" Plane Rotation Decay Time To Zero
Moment About Occipital
Negative Moment Decay Time To Zero
Units
deg C
%
m/s
G's
G's
G's
G's
ms
Degrees
ms
ms
Nm
ms
ms
10 ms
20 ms
30 ms
Maximum
Time
Maximum
Time
Specification
20.6 to 22.2
10 to 70
5.95 to 6.19
17.20 to 21.20
14.00 to 19.00
11.00 to 16.00
<= 22.0
38.0 to 46.0
81.0 to 106.0
72.0 to 82.0
147.0 to 174.0
-52.9 to -79.9
65.0 to 79.0
120.0 to 148.0
Rotation
Condyle
Result Pass/Fail
Overall Test Results
Crossing
Crossing
21.5
27
Pass
6.12
20.27
16.06
13.99
15.4
38.3
94.1
76.4
155.9
-61.9
69.1
142.4
Pass
Pass
Pass
Pass
Pass
Pass
Pass
Pass
Pass
Pass
Pass
Pass
Pass
Pass
C-8

-50 0 50 100 150 200-5
0
5
10
15
20
25
-50 0 50 100 150 200-50
-25
0
25
50
75
100
Test Desc: Neck Extension Test Date: 11/11/11
CFC 60
Component ID: D113773 Velocity: 20.08 ft/s, 6.12 m/s
Max: 21.2 G's
Xmax: 8.4 ms
Min: -3.5 G's
Xmin: 45.0 ms
CFC 60
PENDULUM DECELERATION (G's) vs TIME (ms)
NECK ROTATION (DEG.) vs TIME (ms)
Max: 94.1 DEG.
Xmax: 76.4 ms
Min: -30.6 DEG.
Xmin: 189.5 ms
C-9

-50 0 50 100 150 200-80
-60
-40
-20
0
20
40
Test Desc: Neck Extension Test Date: 11/11/11Component ID: D113773 Velocity: 20.08 ft/s, 6.12 m/s
Max: 32.5 Nm
Xmax: 188.9 ms
Min: -61.9 Nm
Xmin: 69.1 ms
CFC 600
OCCIPITAL MOMENT (Nm) vs TIME (ms)
C-10

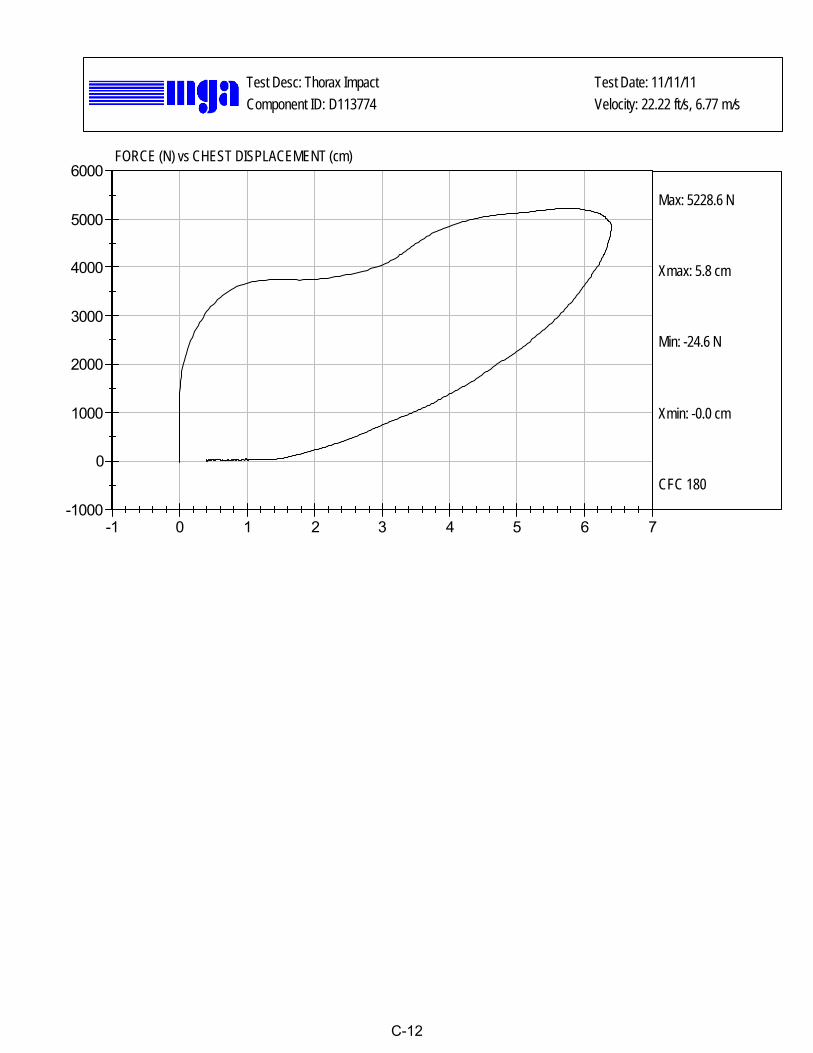
MGA RESEARCH CORPORATION
THORAX IMPACT
HYBRID III 50TH PERCENTILE MALE
ATD Serial No: Test I.D:351 D113774
Test Date11/11/11
Laboratory Technician
Approved By
Tested Parameter
Laboratory Temperature
Probe Velocity
Laboratory Relative Humidity
Peak Probe Force N 5159 to 5893
Internal Hysteresis
5,229 Pass
Pass
Units
deg C
%
m/s
Peak Sternum Displacement cm 6.35 to 7.26 6.40 Pass
% 69 to 85 71
Overall Test Results Pass
Specification
20.6 to 22.2
10 to 70
6.58 to 6.82
Result Pass/Fail
21.2
28
Pass
6.77
Pass
Pass
C-11
-1 0 1 2 3 4 5 6 7-1000
0
1000
2000
3000
4000
5000
6000
Test Desc: Thorax Impact Test Date: 11/11/11Component ID: D113774 Velocity: 22.22 ft/s, 6.77 m/s
Max: 5228.6 N
Xmax: 5.8 cm
Min: -24.6 N
Xmin: -0.0 cm
CFC 180
FORCE (N) vs CHEST DISPLACEMENT (cm)
C-12

MGA RESEARCH CORPORATION
RIGHT KNEE IMPACT TEST
HYBRID III 50TH PERCENTILE MALE
ATD Serial No: Test I.D:351 D113775
Test Date11/11/11
Laboratory Technician
Approved By
Tested Parameter
Laboratory Temperature
Probe Velocity
Laboratory Relative Humidity
Peak Probe Force Newtons 4715 to 5782
Overall Test Results
5,467 Pass
Pass
Units
deg C
%
m/s
Specification
18.9 to 25.5
10 to 70
2.07 to 2.13
Result Pass/Fail
21.7
28
Pass
2.12
Pass
Pass
C-13

-50 0 50 100 150 200-1000
0
1000
2000
3000
4000
5000
6000
Test Desc: Right Knee Test Date: 11/11/11Component ID: D113775 Velocity: 6.97 ft/s, 2.12 m/s
Max: 5466.6 N
Xmax: 27.1 ms
Min: -34.2 N
Xmin: 34.3 ms
CFC 600
FORCE (N) vs TIME (ms)
C-14

MGA RESEARCH CORPORATION
LEFT KNEE IMPACT TEST
HYBRID III 50TH PERCENTILE MALE
ATD Serial No: Test I.D:351 D113776
Test Date11/11/11
Laboratory Technician
Approved By
Tested Parameter
Laboratory Temperature
Probe Velocity
Laboratory Relative Humidity
Peak Probe Force Newtons 4715 to 5782
Overall Test Results
4,972 Pass
Pass
Units
deg C
%
m/s
Specification
18.9 to 25.5
10 to 70
2.07 to 2.13
Result Pass/Fail
21.7
28
Pass
2.12
Pass
Pass
C-15

-25 0 25 50 75 100 125 150 175 200-1000
0
1000
2000
3000
4000
5000
Test Desc: Left Knee Test Date: 11/11/11Component ID: D113776 Velocity: 6.97 ft/s, 2.12 m/s
Max: 4971.9 N
Xmax: 15.0 ms
Min: -34.4 N
Xmin: 22.7 ms
CFC 600
FORCE (N) vs TIME (ms)
C-16

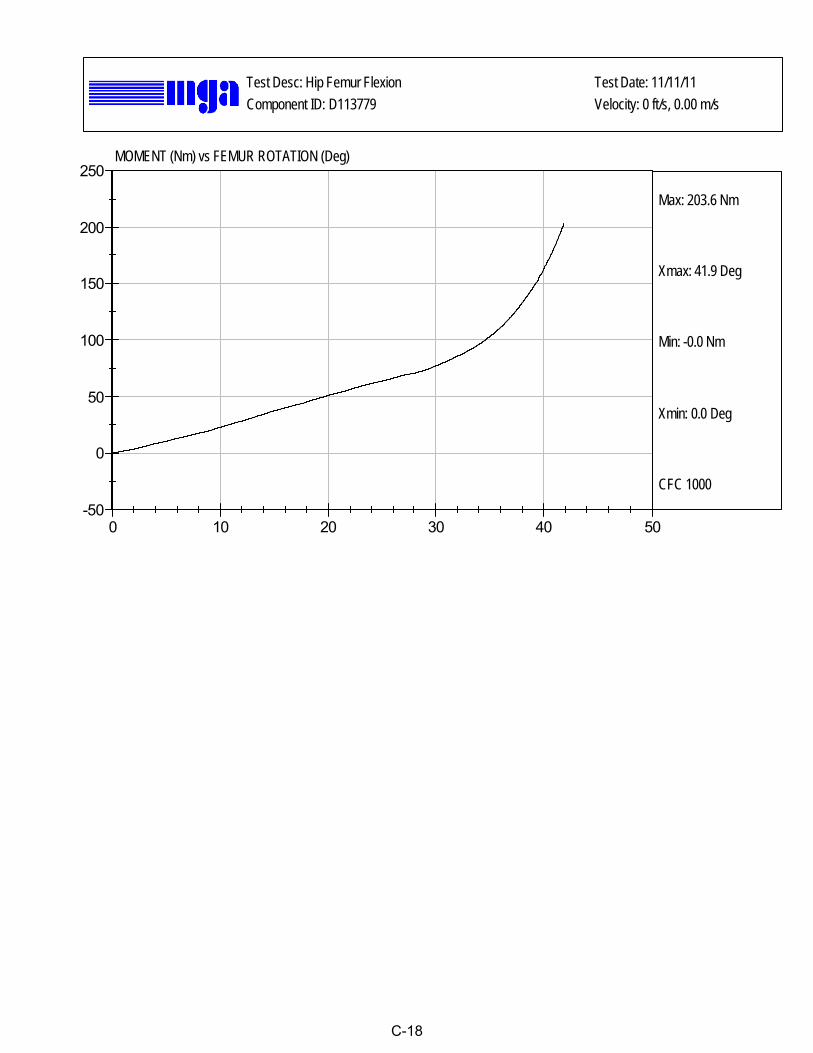
MGA RESEARCH CORPORATION
HIP-FEMUR FLEXION TEST
HYBRID III 50TH PERCENTILE MALE
ATD Serial No: Test I.D:351 D113770
Test Date11/11/11
Laboratory Technician
Approved By
Tested Parameter
Max Rotation
Laboratory Relative Humidity
Laboratory Temperature
Rotation Rate deg/s 5.0 -10.0
150 ft-lbf / 203.4 Nm
5.7 Pass
Pass
Units
Right
deg C
%
30 Degrees Nm 94.9 Nm Max 87.3 Pass
Deg40.0 - 50.0 Degree
Overall Test Results
41.1
Pass
21.3
26
5.7
76.9
41.9
Specification
18.9 to 25.6
10 to 70
Result Pass/Fail
Left
21.3
26
Pass
Pass
C-17
0 10 20 30 40 50-50
0
50
100
150
200
250
Test Desc: Hip Femur Flexion Test Date: 11/11/11Component ID: D113779 Velocity: 0 ft/s, 0.00 m/s
Max: 203.6 Nm
Xmax: 41.9 Deg
Min: -0.0 Nm
Xmin: 0.0 Deg
CFC 1000
MOMENT (Nm) vs FEMUR ROTATION (Deg)
C-18

0 10 20 30 40 50-50
0
50
100
150
200
250
Test Desc: Hip Femur Flexion Test Date: 11/11/11Component ID: D113770 Velocity: 0 ft/s, 0.00 m/s
Max: 203.6 Nm
Xmax: 41.1 Deg
Min: -0.0 Nm
Xmin: 0.1 Deg
CFC 1000
MOMENT (Nm) vs FEMUR ROTATION (Deg)
C-19

MGA RESEARCH CORPORATION
HEAD DROP TEST
HYBRID III 50TH PERCENTILE MALE
ATD Serial No: Test ID:351 D113821
Test Date11/15/11
Laboratory Technician
Approved By
Tested Parameter
Laboratory Temperature
Peak Resultant Acceleration
Laboratory Relative Humidity
Peak Lateral Acceleration G's <= +/- 15.0
Oscillations
-2.4 Pass
N/A
Units
deg C
%
G's
Unimodal N/A Yes Yes Pass
within 10% of peak PassYes
Overall Test Results Pass
Specification
18.9 - 25.6
10 to 70
225 - 275
Result Pass/Fail
21.6
30
Pass
263
Pass
Pass
C-20

-25 0 25 50 75 100 1250
50
100
150
200
250
300
-25 0 25 50 75 100 125-3
-2
-1
0
1
2
3
Test Desc: Head Drop Test Date: 11/15/11
CFC 1000
Component ID: D113821 Velocity: 0 ft/s, 0.00 m/s
Max: 263.0 G's
Xmax: 1.9 ms
Min: 0.0 G's
Xmin: 34.7 ms
CFC 1000
RESULTANT HEAD ACCELERATION (G's) vs TIME (ms)
HEAD Y (G's) vs TIME (ms)
Max: 2.4 G's
Xmax: 2.5 ms
Min: -2.4 G's
Xmin: 4.9 ms
C-21

MGA RESEARCH CORPORATION
NECK FLEXION TEST
HYBRID III 50TH PERCENTILE MALE
ATD Serial No: Test I.D:351 D113822
Test Date11/16/11
Laboratory Technician
Approved By
Tested Parameter
Laboratory Temperature
Pendulum Velocity
Laboratory Relative Humidity
Pendulum Deceleration
Peak Pendulum Deceleration After 30 ms
Deceleration Decay Time to Cross 5 G's
Maximum "D" Plane
"D" Plane Rotation Decay Time To Zero
Moment About Occipital
Positive Moment Decay Time To Zero
Units
deg C
%
m/s
G's
G's
G's
G's
ms
Degrees
ms
ms
N m
ms
ms
10 ms
20 ms
30 ms
Maximum
Time
Maximum
Time
Specification
20.6 to 22.2
10 to 70
6.89 to 7.13
22.50 to 27.50
17.60 to 22.60
12.50 to 18.50
<= 29.0
34.0 to 42.0
64.0 to 78.0
57.0 to 64.0
113.0 to 128.0
88.1 to 108.5
47.0 to 58.0
97.0 to 107.0
Rotation
Condyle
Result Pass/Fail
Overall Test Results
Crossing
Crossing
21.9
24
Pass
7.06
23.05
18.19
14.13
14.1
36.9
66.6
58.1
114.7
94.3
50.7
98.0
Pass
Pass
Pass
Pass
Pass
Pass
Pass
Pass
Pass
Pass
Pass
Pass
Pass
Pass
C-22

-50 0 50 100 150 200-5
0
5
10
15
20
25
30
-50 0 50 100 150 200-50
-25
0
25
50
75
Test Desc: Neck Flexion Test Date: 11/16/11
CFC 60
Component ID: D113822 Velocity: 23.15 ft/s, 7.06 m/s
Max: 25.5 G's
Xmax: 7.3 ms
Min: -2.4 G's
Xmin: 44.4 ms
CFC 60
PENDULUM DECELERATION (G's) vs TIME (ms)
NECK ROTATION (DEG.) vs TIME (ms)
Max: 66.6 DEG.
Xmax: 58.1 ms
Min: -43.9 DEG.
Xmin: 171.0 ms
C-23

-50 0 50 100 150 200-25
0
25
50
75
100
Test Desc: Neck Flexion Test Date: 11/16/11Component ID: D113822 Velocity: 23.15 ft/s, 7.06 m/s
Max: 94.3 Nm
Xmax: 50.7 ms
Min: -23.9 Nm
Xmin: 12.9 ms
CFC 600
OCCIPITAL MOMENT (Nm) vs TIME (ms)
C-24

MGA RESEARCH CORPORATION
NECK EXTENSION TEST
HYBRID III 50TH PERCENTILE MALE
ATD Serial No: Test I.D:351 D113823
Test Date11/16/11
Laboratory Technician
Approved By
Tested Parameter
Laboratory Temperature
Pendulum Velocity
Laboratory Relative Humidity
Pendulum Deceleration
Peak Pendulum Deceleration After 30 ms
Deceleration Decay Time to Cross 5 G's
Maximum "D" Plane
"D" Plane Rotation Decay Time To Zero
Moment About Occipital
Negative Moment Decay Time To Zero
Units
deg C
%
m/s
G's
G's
G's
G's
ms
Degrees
ms
ms
Nm
ms
ms
10 ms
20 ms
30 ms
Maximum
Time
Maximum
Time
Specification
20.6 to 22.2
10 to 70
5.95 to 6.19
17.20 to 21.20
14.00 to 19.00
11.00 to 16.00
<= 22.0
38.0 to 46.0
81.0 to 106.0
72.0 to 82.0
147.0 to 174.0
-52.9 to -79.9
65.0 to 79.0
120.0 to 148.0
Rotation
Condyle
Result Pass/Fail
Overall Test Results
Crossing
Crossing
21.9
24
Pass
6.12
18.11
15.40
12.77
13.9
38.7
92.2
78.4
155.7
-61.9
70.6
142.7
Pass
Pass
Pass
Pass
Pass
Pass
Pass
Pass
Pass
Pass
Pass
Pass
Pass
Pass
C-25
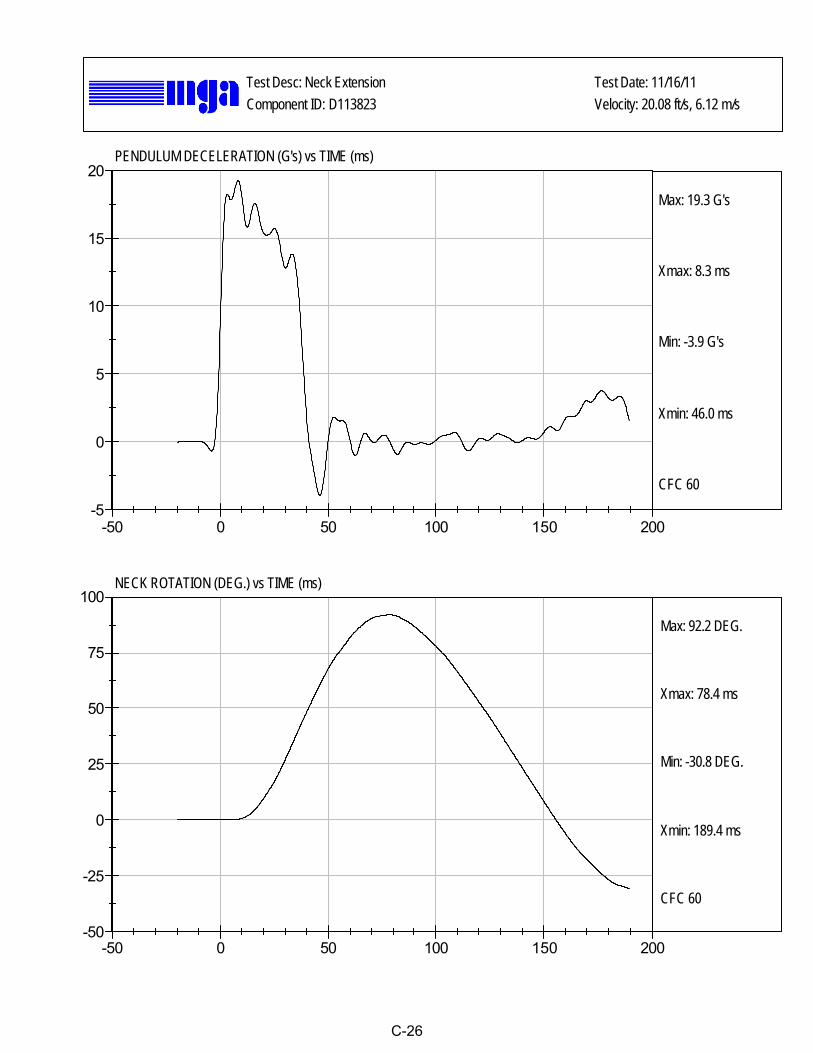
-50 0 50 100 150 200-5
0
5
10
15
20
-50 0 50 100 150 200-50
-25
0
25
50
75
100
Test Desc: Neck Extension Test Date: 11/16/11
CFC 60
Component ID: D113823 Velocity: 20.08 ft/s, 6.12 m/s
Max: 19.3 G's
Xmax: 8.3 ms
Min: -3.9 G's
Xmin: 46.0 ms
CFC 60
PENDULUM DECELERATION (G's) vs TIME (ms)
NECK ROTATION (DEG.) vs TIME (ms)
Max: 92.2 DEG.
Xmax: 78.4 ms
Min: -30.8 DEG.
Xmin: 189.4 ms
C-26

-50 0 50 100 150 200-80
-60
-40
-20
0
20
40
Test Desc: Neck Extension Test Date: 11/16/11Component ID: D113823 Velocity: 20.08 ft/s, 6.12 m/s
Max: 34.3 Nm
Xmax: 188.7 ms
Min: -61.9 Nm
Xmin: 70.6 ms
CFC 600
OCCIPITAL MOMENT (Nm) vs TIME (ms)
C-27

MGA RESEARCH CORPORATION
THORAX IMPACT
HYBRID III 50TH PERCENTILE MALE
ATD Serial No: Test I.D:351 D113824
Test Date11/15/11
Laboratory Technician
Approved By
Tested Parameter
Laboratory Temperature
Probe Velocity
Laboratory Relative Humidity
Peak Probe Force N 5159 to 5893
Internal Hysteresis
5,627 Pass
Pass
Units
deg C
%
m/s
Peak Sternum Displacement cm 6.35 to 7.26 6.37 Pass
% 69 to 85 70
Overall Test Results Pass
Specification
20.6 to 22.2
10 to 70
6.58 to 6.82
Result Pass/Fail
21.5
30
Pass
6.77
Pass
Pass
C-28

-1 0 1 2 3 4 5 6 7-1000
0
1000
2000
3000
4000
5000
6000
Test Desc: Thorax Impact Test Date: 11/15/11Component ID: D113824 Velocity: 22.22 ft/s, 6.77 m/s
Max: 5627.3 N
Xmax: 6.1 cm
Min: -202.5 N
Xmin: 0.3 cm
CFC 180
FORCE (N) vs CHEST DISPLACEMENT (cm)
C-29

MGA RESEARCH CORPORATION
RIGHT KNEE IMPACT TEST
HYBRID III 50TH PERCENTILE MALE
ATD Serial No: Test I.D:351 D113825
Test Date11/15/11
Laboratory Technician
Approved By
Tested Parameter
Laboratory Temperature
Probe Velocity
Laboratory Relative Humidity
Peak Probe Force Newtons 4715 to 5782
Overall Test Results
5,691 Pass
Pass
Units
deg C
%
m/s
Specification
18.9 to 25.5
10 to 70
2.07 to 2.13
Result Pass/Fail
21.7
30
Pass
2.12
Pass
Pass
C-30

-50 0 50 100 150 200-1000
0
1000
2000
3000
4000
5000
6000
Test Desc: Right Knee Test Date: 11/15/11Component ID: D113825 Velocity: 6.94 ft/s, 2.12 m/s
Max: 5691.3 N
Xmax: 43.3 ms
Min: -34.9 N
Xmin: 49.6 ms
CFC 600
FORCE (N) vs TIME (ms)
C-31

MGA RESEARCH CORPORATION
LEFT KNEE IMPACT TEST
HYBRID III 50TH PERCENTILE MALE
ATD Serial No: Test I.D:351 D113826
Test Date11/15/11
Laboratory Technician
Approved By
Tested Parameter
Laboratory Temperature
Probe Velocity
Laboratory Relative Humidity
Peak Probe Force Newtons 4715 to 5782
Overall Test Results
5,037 Pass
Pass
Units
deg C
%
m/s
Specification
18.9 to 25.5
10 to 70
2.07 to 2.13
Result Pass/Fail
21.7
30
Pass
2.12
Pass
Pass
C-32

-50 0 50 100 150 200-1000
0
1000
2000
3000
4000
5000
6000
Test Desc: Left Knee Test Date: 11/15/11Component ID: D113826 Velocity: 6.94 ft/s, 2.12 m/s
Max: 5037.4 N
Xmax: 17.6 ms
Min: -48.2 N
Xmin: 29.5 ms
CFC 600
FORCE (N) vs TIME (ms)
C-33

MGA RESEARCH CORPORATION
HIP-FEMUR FLEXION TEST
HYBRID III 50TH PERCENTILE MALE
ATD Serial No: Test I.D:351 D113820
Test Date11/16/11
Laboratory Technician
Approved By
Tested Parameter
Max Rotation
Laboratory Relative Humidity
Laboratory Temperature
Rotation Rate deg/s 5.0 -10.0
150 ft-lbf / 203.4 Nm
5.7 Pass
Pass
Units
Right
deg C
%
30 Degrees Nm 94.9 Nm Max 84.5 Pass
Deg40.0 - 50.0 Degree
Overall Test Results
41.5
Pass
21.8
30
5.7
73.0
41.8
Specification
18.9 to 25.6
10 to 70
Result Pass/Fail
Left
21.8
30
Pass
Pass
C-34

0 10 20 30 40 500
50
100
150
200
250
Test Desc: Hip Femur Flexion Test Date: 11/16/11Component ID: D113829 Velocity: 0 ft/s, 0.00 m/s
Max: 203.9 Nm
Xmax: 41.8 Deg
Min: 0.0 Nm
Xmin: 0.1 Deg
CFC 1000
MOMENT (Nm) vs FEMUR ROTATION (Deg)
C-35

0 10 20 30 40 50-50
0
50
100
150
200
250
Test Desc: Hip Femur Flexion Test Date: 11/16/11Component ID: D113820 Velocity: 0 ft/s, 0.00 m/s
Max: 203.7 Nm
Xmax: 41.5 Deg
Min: -0.0 Nm
Xmin: 0.0 Deg
CFC 1000
MOMENT (Nm) vs FEMUR ROTATION (Deg)
C-36

Hyb
rid II
I, 5th
Ext
erna
l Mea
sure
men
ts
SN:
138
HY
BR
ID II
I, P
AR
T 57
2, S
UB
PA
RT
O E
XTE
RN
AL
DIM
ENS
ION
S
DIM
EN
SIO
N
DE
SC
RIP
TIO
N
DE
TAIL
S
ASSE
MBL
Y D
IME
NS
ION
(m
m)
AC
TUA
L M
EA
SU
RE
MEN
T
A
TOTA
L S
ITTI
NG
HE
IGH
T S
eat s
urfa
ce to
hig
hest
poi
nt o
n to
p of
the
head
. 77
4.7-
800.
1 78
5.1
B
SH
OU
LDER
PIV
OT
HE
IGH
T C
ente
rline
of s
houl
der p
ivot
bol
t to
the
seat
sur
face
. 43
1.8-
457.
2 45
6.8
C
H-P
OIN
T H
EIG
HT
Ref
eren
ce
81.3
-86.
3 84
.0
D
H-P
OIN
T LO
CA
TIO
N F
RO
M
BA
CK
LIN
E
Ref
eren
ce
144.
8-14
9.8
146.
2
E S
HO
ULD
ER P
IVO
T FR
OM
B
AC
KLI
NE
C
ente
r of t
he s
houl
der c
levi
s to
the
rear
ver
tical
sur
face
of
the
fixtu
re.
68.6
-83.
8 78
.0
F TH
IGH
CLE
ARA
NC
E
Mea
sure
d at
the
high
est p
oint
on
the
uppe
r fem
ur
segm
ent.
119.
4-13
4.6
127.
5
G
BA
CK
OF
ELB
OW
TO
W
RIS
T P
IVO
T ba
ck o
f the
elb
ow fl
esh
to th
e w
rist p
ivot
in li
ne w
ith th
e el
bow
and
wris
t piv
ots
243.
9-25
9.1
249.
6
H
HE
AD
BA
CK
TO
BA
CK
LIN
E
Bac
k of
Sku
ll ca
p sk
in to
sea
t rea
r ver
tical
sur
face
(R
efer
ence
) 43
.2-4
8.2
45.0
I S
HO
ULD
ER T
O- E
LBO
W
LEN
GTH
Mea
sure
from
the
high
est p
oint
on
top
of th
e sh
ould
er
clev
is to
the
low
est p
art o
f the
fles
h on
the
elbo
w in
line
w
ith th
e el
bow
piv
ot b
olt.
276.
8-29
7.2
280.
2
J E
LBO
W R
EST
HE
IGH
T M
easu
re fr
om th
e fle
sh b
elow
the
elbo
w p
ivot
bol
t to
the
seat
sur
face
. 18
2.8-
203.
2 20
1.9
K B
UTT
OC
K T
O K
NE
E
LEN
GTH
Th
e fo
rwar
d m
ost p
art o
f the
kne
e fle
sh to
the
rear
ver
tical
su
rface
of t
he fi
xtur
e.
520.
7-54
6.1
526.
7
L P
OP
LITE
AL
HE
IGH
T S
eat s
urfa
ce to
the
plan
e of
the
horiz
onta
l pla
ne o
f the
bo
ttom
of t
he fe
et.
355.
6-37
6.0
362.
3
M
KN
EE
PIV
OT
HE
IGH
T C
ente
rline
of k
nee
pivo
t bol
t to
the
horiz
onta
l pla
ne o
f the
bo
ttom
of t
he fe
et.
393.
7-41
9.1
398.
0
C-37

N
BU
TTO
CK
PO
PLI
TEA
L LE
NG
TH
The
rear
mos
t sur
face
of t
he lo
wer
leg
to th
e sa
me
poin
t on
the
rear
sur
face
of t
he b
utto
cks
used
for d
im. “
K”.
414-
439.
4 43
0.5
HY
BR
ID II
I, S
UB
PA
RT
O E
XTE
RN
AL
DIM
EN
SIO
NS
, con
tinue
d
DIM
EN
SIO
N
DE
SC
RIP
TIO
N
DE
TAIL
S
ASSE
MBL
Y D
IME
NS
ION
(m
m)
AC
TUA
L M
EA
SU
RE
MEN
T
O
CH
ES
T D
EP
TH W
ITH
OU
T JA
CK
ET
Mea
sure
d 30
4.8
± 5.
1 m
m a
bove
sea
t sur
face
17
5.3-
190.
5 18
4.6
P
FOO
T LE
NG
TH
Tip
of to
e to
rear
of h
eal
218.
5-23
3.7
221.
0
Q
STA
ND
ING
HE
IGH
T
(TH
EOR
ETI
CA
L)
1501
.1
N/A
R
BU
TTO
CK
TO
KN
EE
PIV
OT
LEN
GTH
Th
e re
ar s
urfa
ce o
f the
but
tock
s to
the
knee
piv
ot b
olt
457.
2-48
2.6
472.
6
S
HE
AD
BR
EAD
TH
The
wid
est p
art o
f the
hea
d 13
7.1-
147.
3 14
1.9
T H
EA
D D
EP
TH
Bac
k of
the
head
to th
e fo
rehe
ad
177.
8-18
8.0
184.
2
U
HIP
BR
EA
DTH
Th
e w
ides
t par
t of t
he h
ip
299.
7-31
4.9
307.
4
V
SH
OU
LDER
BR
EA
DTH
O
utsi
de e
dges
of r
ight
and
left
shou
lder
cle
vise
s 35
0.5-
365.
7 36
0.5
W
FOO
T B
RE
ADTH
Th
e w
ides
t par
t of t
he fo
ot
78.8
-94.
0 85
.0
X
HE
AD
CIR
CU
MFE
REN
CE
M
easu
red
at th
e po
int a
s in
dim
. “T”
52
8.3-
548.
7 54
6.2
Y C
HE
ST
CIR
CU
MFE
REN
CE
(WIT
H C
HE
ST
JAC
KE
T)
Mea
sure
d 34
5.4
± 12
.7 m
m a
bove
sea
t sur
face
85
0.9-
881.
3 87
5.1
Z W
AIS
T C
IRC
UM
FER
ENC
E
Mea
sure
d 16
5.1
± 5.
1 m
m a
bove
sea
t sur
face
75
9.5-
789.
9 78
5.4
AA
RE
FER
ENC
E L
OC
ATI
ON
FO
R M
EA
SU
RE
ME
NT
OF
CH
ES
T C
IRC
UM
FER
ENC
E R
efer
ence
33
2.7-
358.
1 34
5.4
BB
RE
FER
ENC
E L
OC
ATI
ON
FO
R M
EA
SU
RE
ME
NT
OF
WAI
ST C
IRC
UM
FER
ENC
E R
efer
ence
16
0.1-
170.
2 16
5.1
C-38

MGA RESEARCH CORPORATION
HEAD DROP TEST
HYBRID III 5TH PERCENTILE
ATD Serial No: Test ID:138 D113621
Test Date10/28/11
Laboratory Technician
Approved By
Tested Parameter
Laboratory Temperature
Peak Resultant Acceleration
Laboratory Relative Humidity
Peak Lateral Acceleration G's +/- 15
Oscillations
-7.5 Pass
N/A
Units
deg C
%
G's
Unimodal N/A Yes Yes Pass
within 10% of peak PassYes
Overall Test Results Pass
Specification
18.9 to 25.6
10 to 70
250 to 300
Result Pass/Fail
21.0
28
Pass
277
Pass
Pass
C-39

-0.025 0 0.025 0.05 0.075 0.1 0.1250
50
100
150
200
250
300
-0.025 0 0.025 0.05 0.075 0.1 0.125-8
-6
-4
-2
0
2
Test Desc: Head Drop Test Date: 10/28/11
CFC 1000
Component ID: D113621 Velocity: 0 ft/s, 0 m/s
Max: 276.6 G's
Xmax: 0.0 s
Min: 0.0 G's
Xmin: -0.0 s
CFC 1000
RESULTANT HEAD ACCELERATION (G's) vs TIME (s)
HEAD Y (G's) vs TIME (s)
Max: 1.1 G's
Xmax: 0.0 s
Min: -7.5 G's
Xmin: 0.0 s
C-40

MGA RESEARCH CORPORATION
NECK FLEXION TEST
HYBRID III 5TH PERCENTILE
ATD Serial No: Test I.D:138 D113622
Test Date
10/31/11
Laboratory Technician
Approved By
Tested Parameter
Laboratory Temperature
Pendulum Speed
Laboratory Relative Humidity
Pendulum Pulse
D Plane Rotation
Occipital Condyle Moment within Deflection Corridor
Positive Moment Time Curve Decay to 10 Nm
Overall Results Pass
Units
deg C
%
m/s
m/s
m/s
m/s
deg
Nm
ms
Max
20 ms
30 ms
Specification
20.6 to 22.2
10 to 70
6.89 to 7.13
2.1 to 2.5
4.0 to 5.0
5.8 to 7.0
77 to 91
69 to 83
80 to 100
Result Pass/Fail
20.7
35
Pass
7.06
2.2
4.2
5.8
79
76
87
Pass
Pass
Pass
Pass
Pass
Pass
Pass
Pass
10 ms
C-41

-0.05 0 0.05 0.1 0.15 0.2-1
0
1
2
3
4
5
6
7
8
-0.05 0 0.05 0.1 0.15 0.2-75
-50
-25
0
25
50
75
100
Test Desc: Neck Flexion Test Date: 10/31/11
CFC 60
Component ID: D113622 Velocity: 23.15 ft/s, 7.06 m/s
Max: 7.7 m/s
Xmax: 0.2 s
Min: -0.0 m/s
Xmin: -0.0 s
CFC 180
PENDULUM VELOCITY (m/s) vs TIME (s)
NECK ROTATION (DEG) vs TIME (s)
Max: 78.6 DEG
Xmax: 0.0 s
Min: -51.8 DEG
Xmin: 0.2 s
C-42

-0.05 0 0.05 0.1 0.15 0.2-40
-20
0
20
40
60
80
Test Desc: Neck Flexion Test Date: 10/31/11Component ID: D113622 Velocity: 23.15 ft/s, 7.06 m/s
Max: 75.8 Nm
Xmax: 0.0 s
Min: -22.2 Nm
Xmin: -0.0 s
CFC 600
OCCIPITAL MOMENT (Nm) vs TIME (s)
C-43
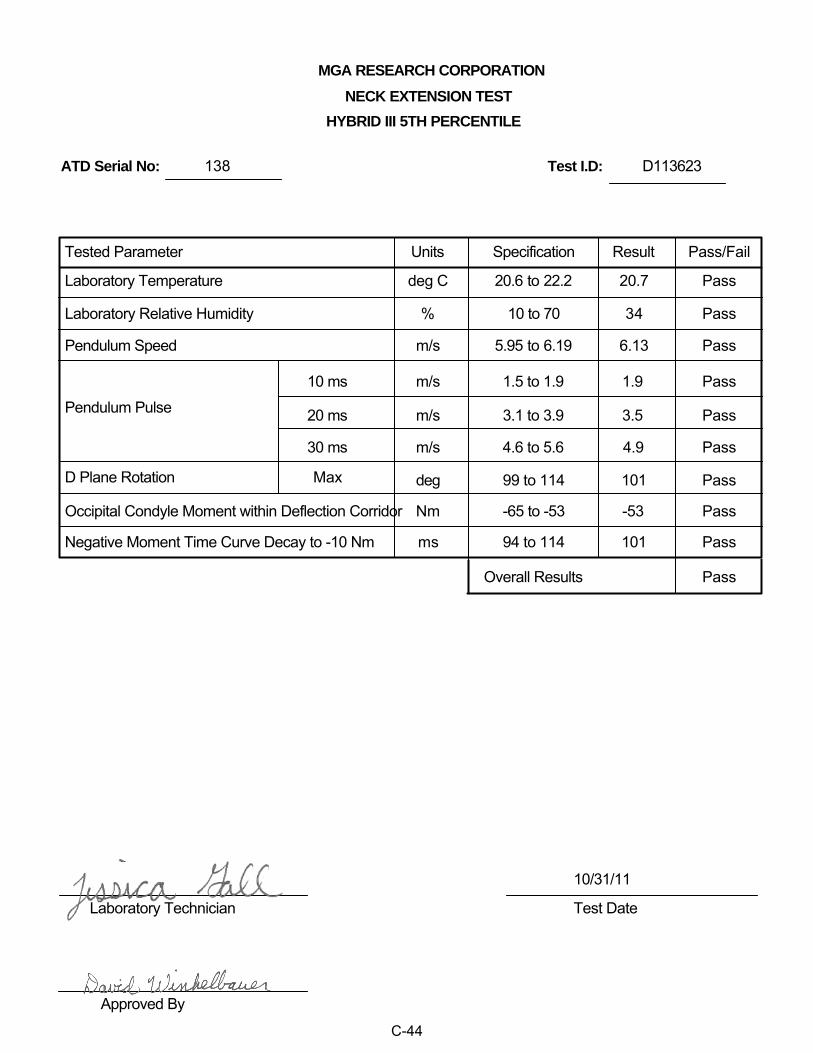
MGA RESEARCH CORPORATION
NECK EXTENSION TEST
HYBRID III 5TH PERCENTILE
ATD Serial No: Test I.D:138 D113623
Test Date
10/31/11
Laboratory Technician
Approved By
Tested Parameter
Laboratory Temperature
Pendulum Speed
Laboratory Relative Humidity
Pendulum Pulse
D Plane Rotation
Occipital Condyle Moment within Deflection Corridor
Negative Moment Time Curve Decay to -10 Nm
Overall Results Pass
Units
deg C
%
m/s
m/s
m/s
m/s
deg
Nm
ms
Max
20 ms
30 ms
Specification
20.6 to 22.2
10 to 70
5.95 to 6.19
1.5 to 1.9
3.1 to 3.9
4.6 to 5.6
99 to 114
-65 to -53
94 to 114
Result Pass/Fail
20.7
34
Pass
6.13
1.9
3.5
4.9
101
-53
101
Pass
Pass
Pass
Pass
Pass
Pass
Pass
Pass
10 ms
C-44

-0.05 0 0.05 0.1 0.15 0.2-1
0
1
2
3
4
5
6
7
-0.05 0 0.05 0.1 0.15 0.2-50
-25
0
25
50
75
100
125
Test Desc: Neck Extension Test Date: 10/31/11
CFC 60
Component ID: D113623 Velocity: 20.10 ft/s, 6.13 m/s
Max: 6.4 m/s
Xmax: 0.2 s
Min: -0.0 m/s
Xmin: -0.0 s
CFC 180
PENDULUM VELOCITY (m/s) vs TIME (s)
NECK ROTATION (DEG) vs TIME (s)
Max: 101.3 DEG
Xmax: 0.0 s
Min: -31.4 DEG
Xmin: 0.2 s
C-45

-0.05 0 0.05 0.1 0.15 0.2-60
-50
-40
-30
-20
-10
0
10
20
30
Test Desc: Neck Extension Test Date: 10/31/11Component ID: D113623 Velocity: 20.10 ft/s, 6.13 m/s
Max: 22.8 Nm
Xmax: 0.2 s
Min: -53.2 Nm
Xmin: 0.0 s
CFC 600
OCCIPITAL MOMENT (Nm) vs TIME (s)
C-46

MGA RESEARCH CORPORATION
THORAX IMPACT
HYBRID III 5TH PERCENTILE
ATD Serial No: Test I.D:138 D113624
Test Date10/31/11
Laboratory Technician
Approved By
Tested Parameter
Temperature
Probe Speed
Relative Humidity
Peak Deflection mm 50 to 58
Internal Hysteresis
55 Pass
Pass
Units
deg C
%
m/s
Peak Resistive Force w/in Deflection Corridor kN 3.9 to 4.4 4.07 Pass
% 69 to 85
<= 4,600 N
70
PassPeak Force 18 mm - 50 mm N 4004
Overall Test Results Pass
Specification
20.6 to 22.2
10 to 70
6.59 to 6.83
Result Pass/Fail
21.4
34
Pass
6.77
Pass
Pass
C-47

0 10 20 30 40 50 60-1
0
1
2
3
4
5
Test Desc: Thorax Impact Test Date: 10/31/11Component ID: D113624 Velocity: 22.22 ft/s, 6.77 m/s
Max: 4.1 kN
Xmax: 51.9 mm
Min: -0.0 kN
Xmin: 0.1 mm
CFC 180
FORCE (kN) vs CHEST DISP (mm)
C-48
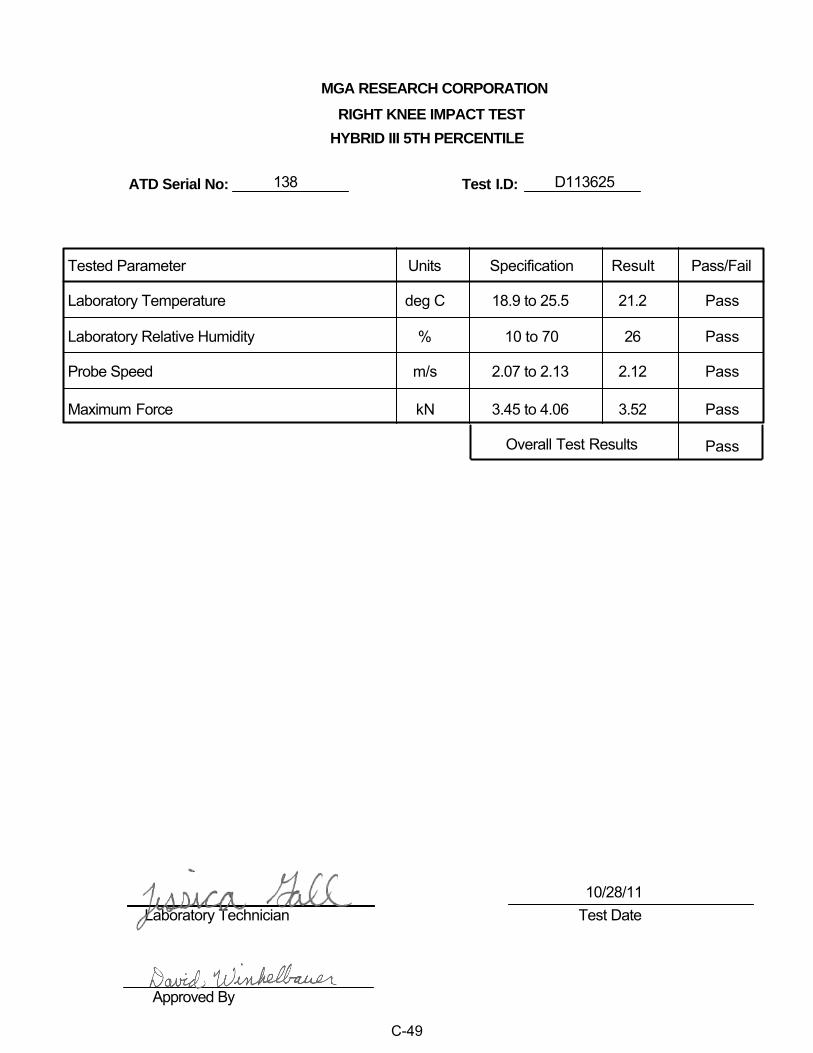
MGA RESEARCH CORPORATION
RIGHT KNEE IMPACT TEST
HYBRID III 5TH PERCENTILE
ATD Serial No: Test I.D:138 D113625
Test Date10/28/11
Laboratory Technician
Approved By
Tested Parameter
Laboratory Temperature
Probe Speed
Laboratory Relative Humidity
Maximum Force kN 3.45 to 4.06
Overall Test Results
3.52 Pass
Pass
Units
deg C
%
m/s
Specification
18.9 to 25.5
10 to 70
2.07 to 2.13
Result Pass/Fail
21.2
26
Pass
2.12
Pass
Pass
C-49

-0.05 0 0.05 0.1 0.15 0.2-0.5
0
0.5
1
1.5
2
2.5
3
3.5
4
Test Desc: Right Knee Test Date: 10/28/11Component ID: D113625 Velocity: 6.97 ft/s, 2.12 m/s
Max: 3.5 kN
Xmax: 0.0 s
Min: -0.0 kN
Xmin: 0.0 s
CFC 600
FORCE (kN) vs TIME (s)
C-50

MGA RESEARCH CORPORATION
LEFT KNEE IMPACT TEST
HYBRID III 5TH PERCENTILE
ATD Serial No: Test I.D:138 D113626
Test Date10/28/11
Laboratory Technician
Approved By
Tested Parameter
Laboratory Temperature
Probe Speed
Laboratory Relative Humidity
Maximum Force kN 3.45 to 4.06
Overall Test Results
3.59 Pass
Pass
Units
deg C
%
m/s
Specification
18.9 to 25.5
10 to 70
2.07 to 2.13
Result Pass/Fail
21.2
26
Pass
2.12
Pass
Pass
C-51

-0.05 0 0.05 0.1 0.15 0.2-0.5
0
0.5
1
1.5
2
2.5
3
3.5
4
Test Desc: Left Knee Test Date: 10/28/11Component ID: D113626 Velocity: 6.97 ft/s, 2.12 m/s
Max: 3.6 kN
Xmax: 0.0 s
Min: -0.0 kN
Xmin: 0.0 s
CFC 600
FORCE (kN) vs TIME (s)
C-52

MGA RESEARCH CORPORATION
TORSO FLEXION TEST
HYBRID III 5TH PERCENTILE
ATD Serial No: Test I.D:138 D113627
Test Date10/28/11
Laboratory Technician
Approved By
Tested Parameter
Laboratory Temperature
Initial Angle
Laboratory Relative Humidity
Return Angle deg +/- 8
Upper Torso Deflection Rate
6 Pass
Deg/sec
Units
deg C
%
deg
Force at 45 deg N 320 to 390 380 Pass
0.5 to 1.5 1.0 Pass
Overall Result Pass
Specification
18.9 to 25.6
10 to 70
0 to 20
Result Pass/Fail
21.3
27
Pass
14
Pass
Pass
C-53

MGA RESEARCH CORPORATION
HEAD DROP TEST
HYBRID III 5TH PERCENTILE
ATD Serial No: Test ID:138 D113831
Test Date11/15/11
Laboratory Technician
Approved By
Tested Parameter
Laboratory Temperature
Peak Resultant Acceleration
Laboratory Relative Humidity
Peak Lateral Acceleration G's +/- 15
Oscillations
-3.4 Pass
N/A
Units
deg C
%
G's
Unimodal N/A Yes Yes Pass
within 10% of peak PassYes
Overall Test Results Pass
Specification
18.9 to 25.6
10 to 70
250 to 300
Result Pass/Fail
21.5
30
Pass
288
Pass
Pass
C-54

-0.025 0 0.025 0.05 0.075 0.1 0.1250
50
100
150
200
250
300
-0.025 0 0.025 0.05 0.075 0.1 0.125-4
-3
-2
-1
0
1
Test Desc: Head Drop Test Date: 11/15/11
CFC 1000
Component ID: D113831 Velocity: 0 ft/s, 0 m/s
Max: 287.5 G's
Xmax: 0.0 s
Min: 0.0 G's
Xmin: 0.1 s
CFC 1000
RESULTANT HEAD ACCELERATION (G's) vs TIME (s)
HEAD Y (G's) vs TIME (s)
Max: 1.0 G's
Xmax: 0.0 s
Min: -3.4 G's
Xmin: 0.0 s
C-55

MGA RESEARCH CORPORATION
NECK FLEXION TEST
HYBRID III 5TH PERCENTILE
ATD Serial No: Test I.D:138 D113832
Test Date
11/16/11
Laboratory Technician
Approved By
Tested Parameter
Laboratory Temperature
Pendulum Speed
Laboratory Relative Humidity
Pendulum Pulse
D Plane Rotation
Occipital Condyle Moment within Deflection Corridor
Positive Moment Time Curve Decay to 10 Nm
Overall Results Pass
Units
deg C
%
m/s
m/s
m/s
m/s
deg
Nm
ms
Max
20 ms
30 ms
Specification
20.6 to 22.2
10 to 70
6.89 to 7.13
2.1 to 2.5
4.0 to 5.0
5.8 to 7.0
77 to 91
69 to 83
80 to 100
Result Pass/Fail
21.7
26
Pass
7.06
2.4
4.4
6.0
78
82
86
Pass
Pass
Pass
Pass
Pass
Pass
Pass
Pass
10 ms
C-56

-0.05 0 0.05 0.1 0.15 0.2-1
0
1
2
3
4
5
6
7
8
-0.05 0 0.05 0.1 0.15 0.2-75
-50
-25
0
25
50
75
100
Test Desc: Neck Flexion Test Date: 11/16/11
CFC 60
Component ID: D113832 Velocity: 23.15 ft/s, 7.06 m/s
Max: 7.9 m/s
Xmax: 0.2 s
Min: -0.0 m/s
Xmin: -0.0 s
CFC 180
PENDULUM VELOCITY (m/s) vs TIME (s)
NECK ROTATION (DEG) vs TIME (s)
Max: 77.6 DEG
Xmax: 0.0 s
Min: -54.2 DEG
Xmin: 0.1 s
C-57

-0.05 0 0.05 0.1 0.15 0.2-25
0
25
50
75
100
Test Desc: Neck Flexion Test Date: 11/16/11Component ID: D113832 Velocity: 23.15 ft/s, 7.06 m/s
Max: 81.8 Nm
Xmax: 0.0 s
Min: -20.5 Nm
Xmin: -0.0 s
CFC 600
OCCIPITAL MOMENT (Nm) vs TIME (s)
C-58

MGA RESEARCH CORPORATION
NECK EXTENSION TEST
HYBRID III 5TH PERCENTILE
ATD Serial No: Test I.D:138 D113833
Test Date
11/16/11
Laboratory Technician
Approved By
Tested Parameter
Laboratory Temperature
Pendulum Speed
Laboratory Relative Humidity
Pendulum Pulse
D Plane Rotation
Occipital Condyle Moment within Deflection Corridor
Negative Moment Time Curve Decay to -10 Nm
Overall Results Pass
Units
deg C
%
m/s
m/s
m/s
m/s
deg
Nm
ms
Max
20 ms
30 ms
Specification
20.6 to 22.2
10 to 70
5.95 to 6.19
1.5 to 1.9
3.1 to 3.9
4.6 to 5.6
99 to 114
-65 to -53
94 to 114
Result Pass/Fail
21.7
26
Pass
6.12
1.8
3.3
4.7
101
-55
109
Pass
Pass
Pass
Pass
Pass
Pass
Pass
Pass
10 ms
C-59
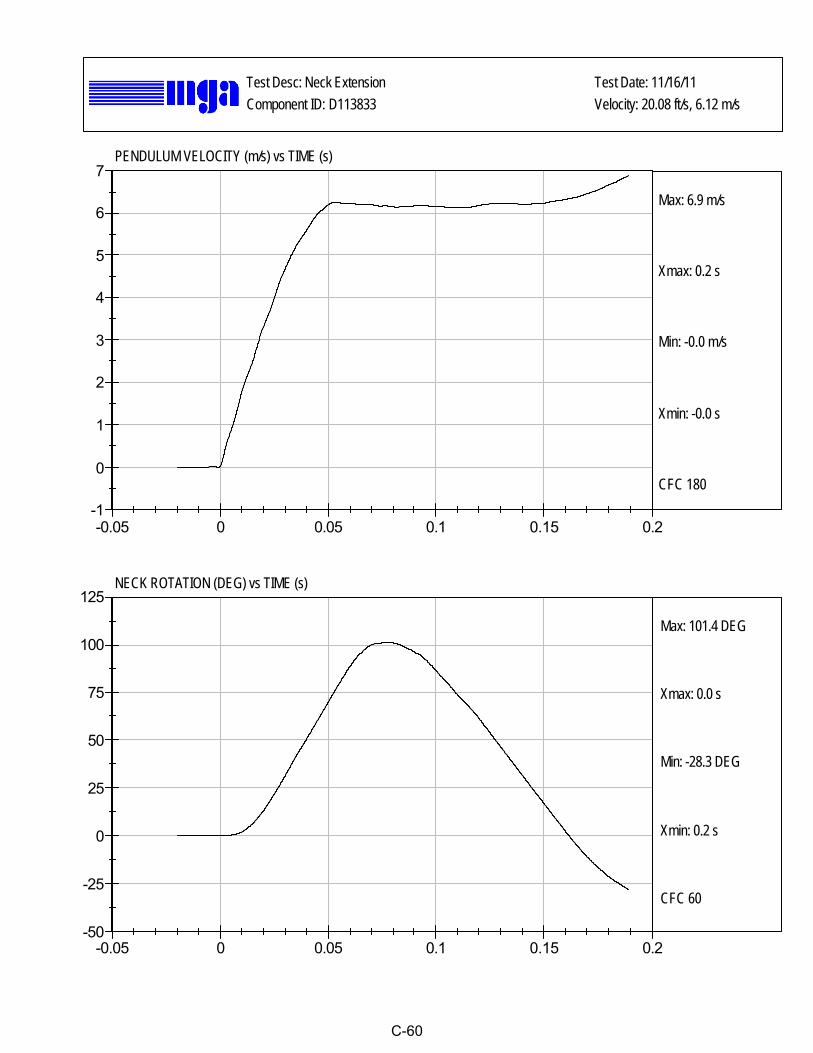
-0.05 0 0.05 0.1 0.15 0.2-1
0
1
2
3
4
5
6
7
-0.05 0 0.05 0.1 0.15 0.2-50
-25
0
25
50
75
100
125
Test Desc: Neck Extension Test Date: 11/16/11
CFC 60
Component ID: D113833 Velocity: 20.08 ft/s, 6.12 m/s
Max: 6.9 m/s
Xmax: 0.2 s
Min: -0.0 m/s
Xmin: -0.0 s
CFC 180
PENDULUM VELOCITY (m/s) vs TIME (s)
NECK ROTATION (DEG) vs TIME (s)
Max: 101.4 DEG
Xmax: 0.0 s
Min: -28.3 DEG
Xmin: 0.2 s
C-60

-0.05 0 0.05 0.1 0.15 0.2-60
-50
-40
-30
-20
-10
0
10
20
30
Test Desc: Neck Extension Test Date: 11/16/11Component ID: D113833 Velocity: 20.08 ft/s, 6.12 m/s
Max: 22.0 Nm
Xmax: 0.2 s
Min: -54.7 Nm
Xmin: 0.0 s
CFC 600
OCCIPITAL MOMENT (Nm) vs TIME (s)
C-61

MGA RESEARCH CORPORATION
THORAX IMPACT
HYBRID III 5TH PERCENTILE
ATD Serial No: Test I.D:138 D113834
Test Date11/15/11
Laboratory Technician
Approved By
Tested Parameter
Temperature
Probe Speed
Relative Humidity
Peak Deflection mm 50 to 58
Internal Hysteresis
51 Pass
Pass
Units
deg C
%
m/s
Peak Resistive Force w/in Deflection Corridor kN 3.9 to 4.4 4.2 Pass
% 69 to 85
<= 4,600 N
70
PassPeak Force 18 mm - 50 mm N 4203
Overall Test Results Pass
Specification
20.6 to 22.2
10 to 70
6.59 to 6.83
Result Pass/Fail
21.7
30
Pass
6.77
Pass
Pass
C-62

0 10 20 30 40 50 60-1
0
1
2
3
4
5
Test Desc: Thorax Impact Test Date: 11/15/11Component ID: D113834 Velocity: 22.22 ft/s, 6.77 m/s
Max: 4.2 kN
Xmax: 48.7 mm
Min: -0.0 kN
Xmin: 0.0 mm
CFC 180
FORCE (kN) vs CHEST DISP (mm)
C-63

MGA RESEARCH CORPORATION
RIGHT KNEE IMPACT TEST
HYBRID III 5TH PERCENTILE
ATD Serial No: Test I.D:138 D113835
Test Date11/15/11
Laboratory Technician
Approved By
Tested Parameter
Laboratory Temperature
Probe Speed
Laboratory Relative Humidity
Maximum Force kN 3.45 to 4.06
Overall Test Results
3.60 Pass
Pass
Units
deg C
%
m/s
Specification
18.9 to 25.5
10 to 70
2.07 to 2.13
Result Pass/Fail
21.6
30
Pass
2.12
Pass
Pass
C-64

-0.05 0 0.05 0.1 0.15 0.2-0.5
0
0.5
1
1.5
2
2.5
3
3.5
4
Test Desc: Right Knee Test Date: 11/15/11Component ID: D113835 Velocity: 6.97 ft/s, 2.12 m/s
Max: 3.6 kN
Xmax: -0.0 s
Min: -0.0 kN
Xmin: -0.0 s
CFC 600
FORCE (kN) vs TIME (s)
C-65

MGA RESEARCH CORPORATION
LEFT KNEE IMPACT TEST
HYBRID III 5TH PERCENTILE
ATD Serial No: Test I.D:138 D113836
Test Date11/15/11
Laboratory Technician
Approved By
Tested Parameter
Laboratory Temperature
Probe Speed
Laboratory Relative Humidity
Maximum Force kN 3.45 to 4.06
Overall Test Results
3.51 Pass
Pass
Units
deg C
%
m/s
Specification
18.9 to 25.5
10 to 70
2.07 to 2.13
Result Pass/Fail
21.6
30
Pass
2.12
Pass
Pass
C-66

-0.05 0 0.05 0.1 0.15 0.2-0.5
0
0.5
1
1.5
2
2.5
3
3.5
4
Test Desc: Left Knee Test Date: 11/15/11Component ID: D113836 Velocity: 6.97 ft/s, 2.12 m/s
Max: 3.5 kN
Xmax: 0.0 s
Min: -0.0 kN
Xmin: 0.0 s
CFC 600
FORCE (kN) vs TIME (s)
C-67

MGA RESEARCH CORPORATION
TORSO FLEXION TEST
HYBRID III 5TH PERCENTILE
ATD Serial No: Test I.D:138 D113837
Test Date11/15/11
Laboratory Technician
Approved By
Tested Parameter
Laboratory Temperature
Initial Angle
Laboratory Relative Humidity
Return Angle deg +/- 8
Upper Torso Deflection Rate
7 Pass
Deg/sec
Units
deg C
%
deg
Force at 45 deg N 320 to 390 378 Pass
0.5 to 1.5 1.0 Pass
Overall Result Pass
Specification
18.9 to 25.6
10 to 70
0 to 20
Result Pass/Fail
21.8
29
Pass
13
Pass
Pass
C-68