year 10 maths schemes of work 2019-20...year 10 maths schemes of work 2019-20 (sep - jul)...
TRANSCRIPT

YEAR 10 MATHS SCHEMES OF WORK 2019-20 (Sep - Jul)
SOW: We follow the Edexcel GSCE two -year model for Foundation and Higher tiers
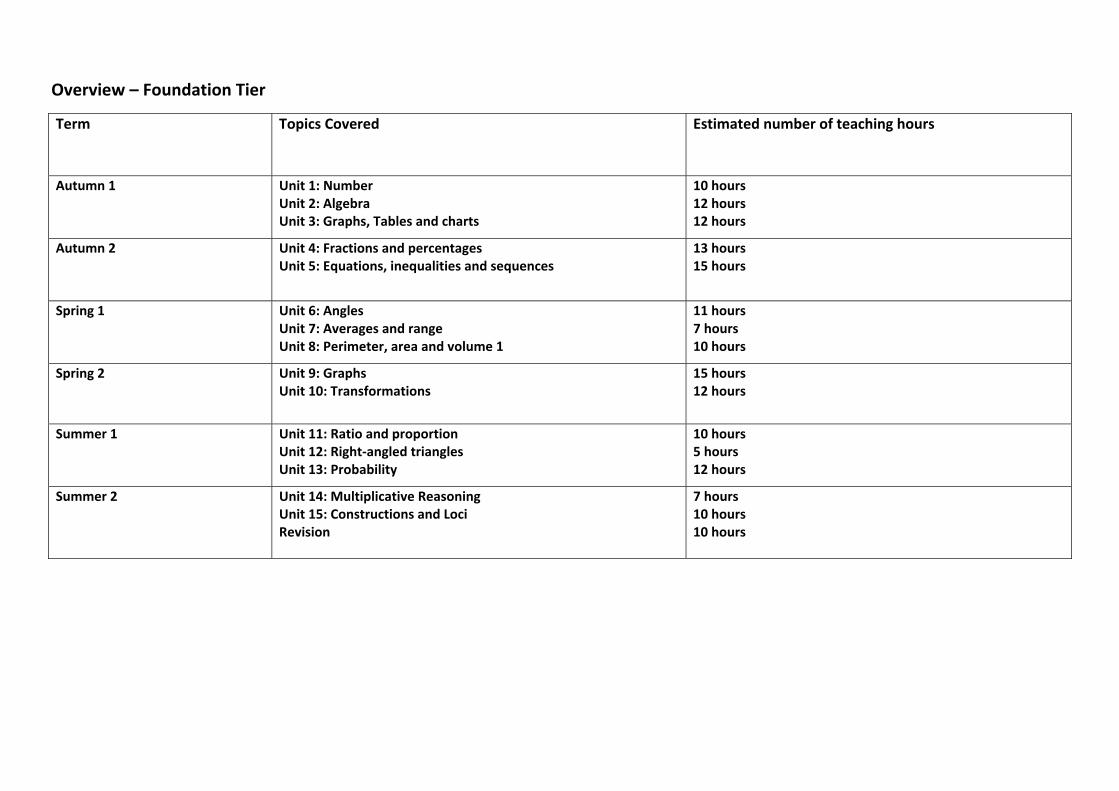
Overview – Foundation Tier
Term Topics Covered Estimated number of teaching hours
Autumn 1 Unit 1: Number Unit 2: Algebra Unit 3: Graphs, Tables and charts
10 hours 12 hours 12 hours
Autumn 2 Unit 4: Fractions and percentages Unit 5: Equations, inequalities and sequences
13 hours 15 hours
Spring 1 Unit 6: Angles Unit 7: Averages and range Unit 8: Perimeter, area and volume 1
11 hours 7 hours 10 hours
Spring 2 Unit 9: Graphs Unit 10: Transformations
15 hours 12 hours
Summer 1 Unit 11: Ratio and proportion Unit 12: Right-angled triangles Unit 13: Probability
10 hours 5 hours 12 hours
Summer 2 Unit 14: Multiplicative Reasoning Unit 15: Constructions and Loci Revision
7 hours 10 hours 10 hours
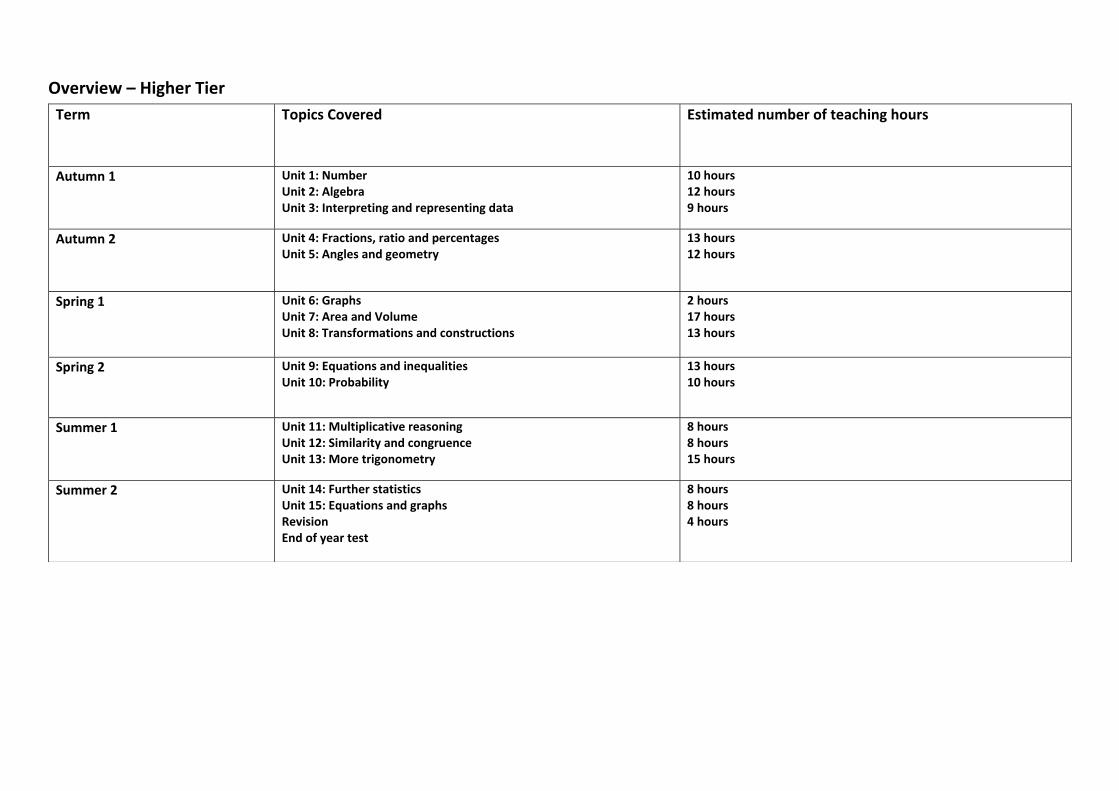
Overview – Higher Tier
Term Topics Covered Estimated number of teaching hours
Autumn 1 Unit 1: Number Unit 2: Algebra Unit 3: Interpreting and representing data
10 hours 12 hours 9 hours
Autumn 2 Unit 4: Fractions, ratio and percentages Unit 5: Angles and geometry
13 hours 12 hours
Spring 1 Unit 6: Graphs Unit 7: Area and Volume Unit 8: Transformations and constructions
2 hours 17 hours 13 hours
Spring 2 Unit 9: Equations and inequalities Unit 10: Probability
13 hours 10 hours
Summer 1 Unit 11: Multiplicative reasoning Unit 12: Similarity and congruence Unit 13: More trigonometry
8 hours 8 hours 15 hours
Summer 2 Unit 14: Further statistics Unit 15: Equations and graphs Revision End of year test
8 hours 8 hours 4 hours
Foundation Tier
Unit Topic Learning Objectives Possible Success Criteria
Keywords
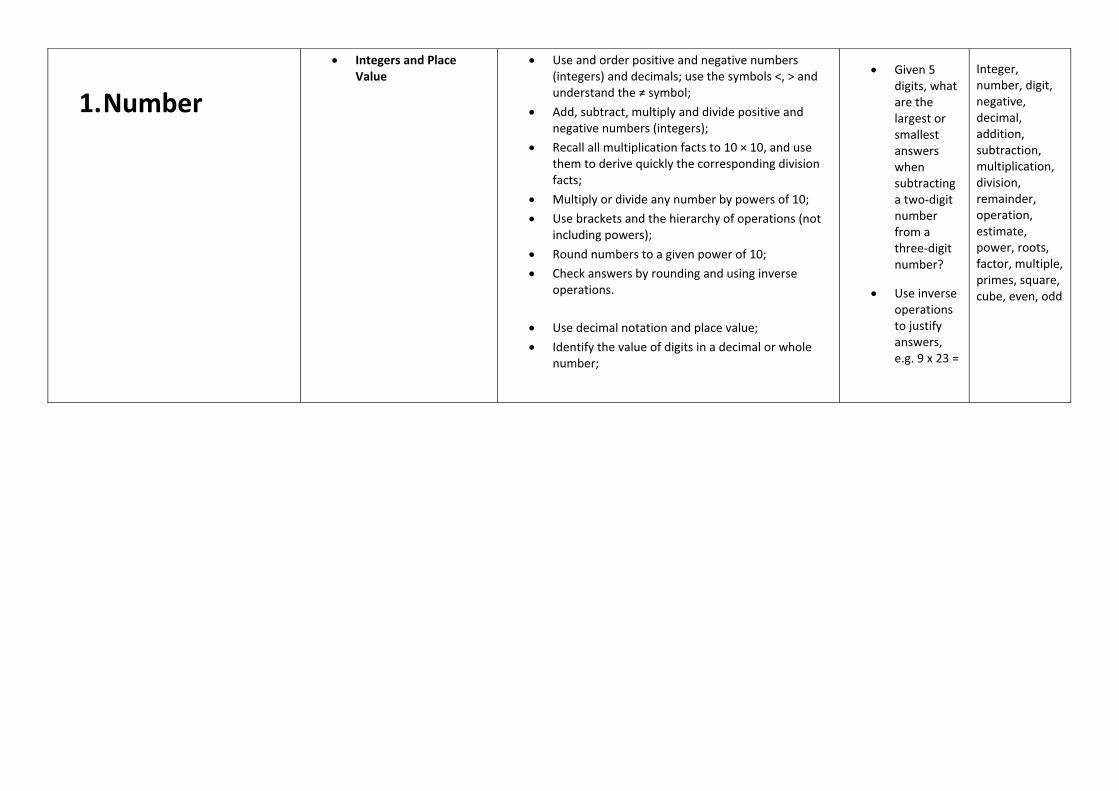
1. Number
� Integers and Place Value
� Use and order positive and negative numbers (integers) and decimals; use the symbols <, > and understand the ≠ symbol;
� Add, subtract, multiply and divide positive and negative numbers (integers);
� Recall all multiplication facts to 10 × 10, and use them to derive quickly the corresponding division facts;
� Multiply or divide any number by powers of 10; � Use brackets and the hierarchy of operations (not
including powers); � Round numbers to a given power of 10; � Check answers by rounding and using inverse
operations.
� Use decimal notation and place value; � Identify the value of digits in a decimal or whole
number;
� Given 5 digits, what are the largest or smallest answers when subtracting a two-digit number from a three-digit number?
� Use inverse operations to justify answers, e.g. 9 x 23 =
Integer, number, digit, negative, decimal, addition, subtraction, multiplication, division, remainder, operation, estimate, power, roots, factor, multiple, primes, square, cube, even, odd
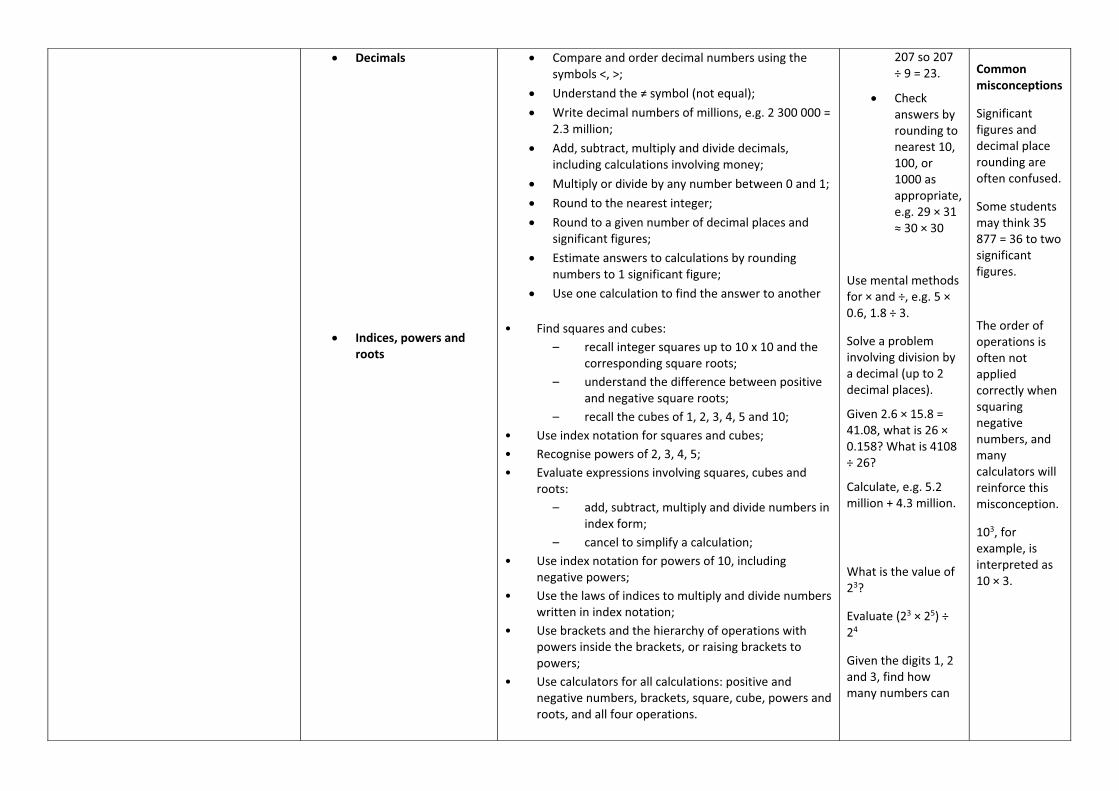
� Decimals
� Indices, powers and roots
� Compare and order decimal numbers using the symbols <, >;
� Understand the ≠ symbol (not equal); � Write decimal numbers of millions, e.g. 2 300 000 =
2.3 million; � Add, subtract, multiply and divide decimals,
including calculations involving money; � Multiply or divide by any number between 0 and 1; � Round to the nearest integer; � Round to a given number of decimal places and
significant figures; � Estimate answers to calculations by rounding
numbers to 1 significant figure; � Use one calculation to find the answer to another
• Find squares and cubes:
– recall integer squares up to 10 x 10 and the corresponding square roots;
– understand the difference between positive and negative square roots;
– recall the cubes of 1, 2, 3, 4, 5 and 10; • Use index notation for squares and cubes; • Recognise powers of 2, 3, 4, 5; • Evaluate expressions involving squares, cubes and
roots: – add, subtract, multiply and divide numbers in
index form; – cancel to simplify a calculation;
• Use index notation for powers of 10, including negative powers;
• Use the laws of indices to multiply and divide numbers written in index notation;
• Use brackets and the hierarchy of operations with powers inside the brackets, or raising brackets to powers;
• Use calculators for all calculations: positive and negative numbers, brackets, square, cube, powers and roots, and all four operations.
207 so 207 ÷ 9 = 23.
� Check answers by rounding to nearest 10, 100, or 1000 as appropriate, e.g. 29 × 31 ≈ 30 × 30
Use mental methods for × and ÷, e.g. 5 × 0.6, 1.8 ÷ 3.
Solve a problem involving division by a decimal (up to 2 decimal places).
Given 2.6 × 15.8 = 41.08, what is 26 × 0.158? What is 4108 ÷ 26?
Calculate, e.g. 5.2 million + 4.3 million.
What is the value of 23?
Evaluate (23 × 25) ÷ 24
Given the digits 1, 2 and 3, find how many numbers can
Common misconceptions
Significant figures and decimal place rounding are often confused.
Some students may think 35 877 = 36 to two significant figures.
The order of operations is often not applied correctly when squaring negative numbers, and many calculators will reinforce this misconception.
103, for example, is interpreted as 10 × 3.
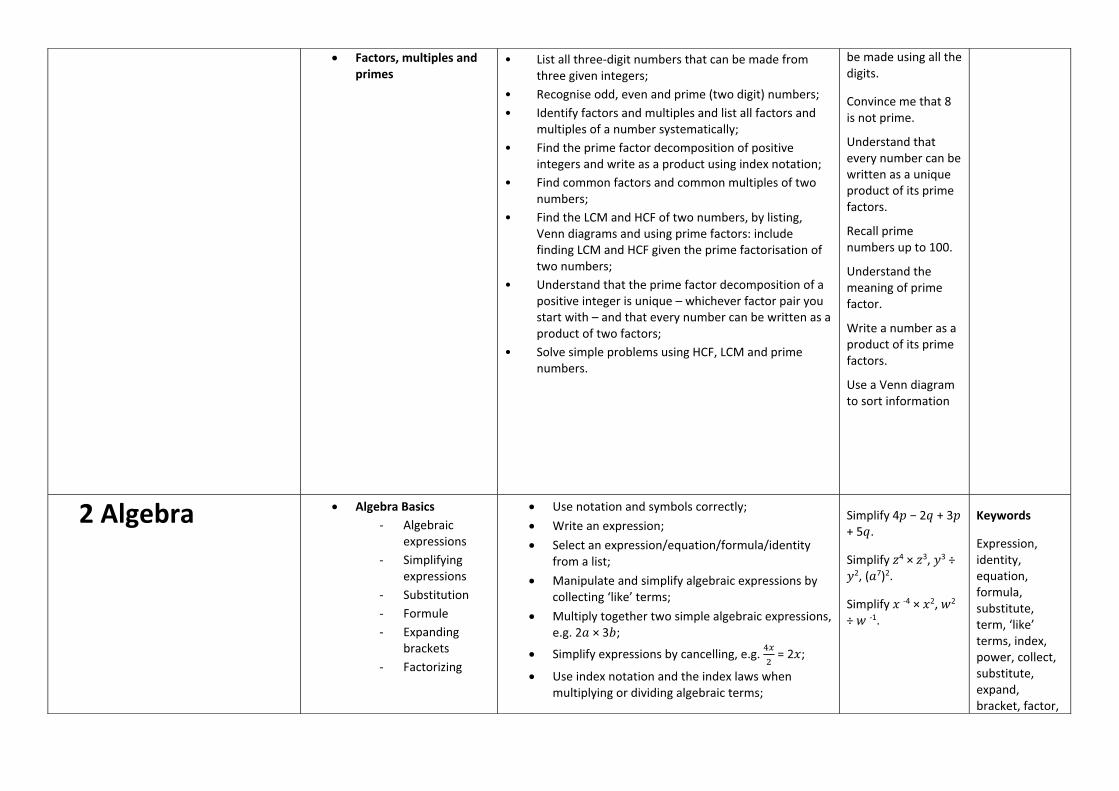
� Factors, multiples and primes
• List all three-digit numbers that can be made from three given integers;
• Recognise odd, even and prime (two digit) numbers; • Identify factors and multiples and list all factors and
multiples of a number systematically; • Find the prime factor decomposition of positive
integers and write as a product using index notation; • Find common factors and common multiples of two
numbers; • Find the LCM and HCF of two numbers, by listing,
Venn diagrams and using prime factors: include finding LCM and HCF given the prime factorisation of two numbers;
• Understand that the prime factor decomposition of a positive integer is unique – whichever factor pair you start with – and that every number can be written as a product of two factors;
• Solve simple problems using HCF, LCM and prime numbers.
be made using all the digits.
Convince me that 8 is not prime.
Understand that every number can be written as a unique product of its prime factors.
Recall prime numbers up to 100.
Understand the meaning of prime factor.
Write a number as a product of its prime factors.
Use a Venn diagram to sort information
2 Algebra � Algebra Basics - Algebraic
expressions - Simplifying
expressions - Substitution - Formule - Expanding
brackets - Factorizing
� Use notation and symbols correctly; � Write an expression; � Select an expression/equation/formula/identity
from a list; � Manipulate and simplify algebraic expressions by
collecting ‘like’ terms; � Multiply together two simple algebraic expressions,
e.g. 2� × 3�;
� Simplify expressions by cancelling, e.g. ���
= 2�;
� Use index notation and the index laws when multiplying or dividing algebraic terms;
Simplify 4� − 2 + 3� + 5.
Simplify 4 × 3, �3 ÷ �2, (�7)2.
Simplify � -4 × �2, �2 ÷ � -1.
Keywords
Expression, identity, equation, formula, substitute, term, ‘like’ terms, index, power, collect, substitute, expand, bracket, factor,

- Using expressions and formulae
• Expression and
substitution into formulae
� Understand the ≠ symbol and introduce the identity ≡ sign;
• Multiply a single number term over a bracket; • Write and simplify expressions using squares and
cubes; • Simplify expressions involving brackets, i.e. expand
the brackets, then add/subtract; • Argue mathematically to show algebraic expressions
are equivalent;
• Recognise factors of algebraic terms involving single brackets;
• Factorise algebraic expressions by taking out common factors;
• Write expressions to solve problems representing a situation;
• Substitute numbers into simple algebraic expressions; • Substitute numbers into expressions involving
brackets and powers; • Substitute positive and negative numbers into
expressions; • Derive a simple formula, including those with squares,
cubes and roots; • Substitute numbers into a (word) formula;
Expand and simplify 3( − 1).
Understand 6� + 4 ≠ 3(� + 2).
Argue mathematically that 2(� + 5) = 2� + 10.
Evaluate the expressions for different values of �: 3�2 + 4 or 2�3.
factorise, linear, simplify
Common Misconceptions
3(� + 4) = 3� + 4.
The convention of not writing a coefficient with a single value, i.e. � instead of 1�, may cause confusion.
Some students may think that it is always true that � = 1, � = 2, � = 3.
If � = 2 sometimes students interpret 3� as 32.
Making mistakes with negatives, including the squaring of
negative numbers.
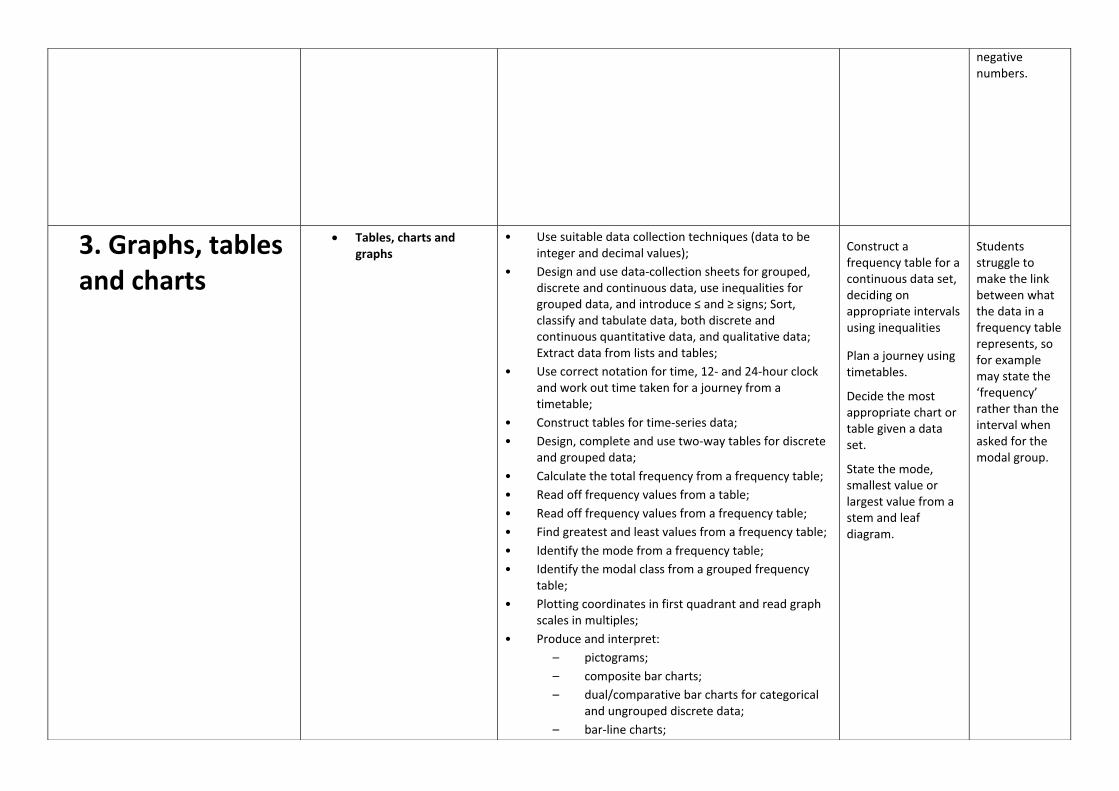
3. Graphs, tables and charts
� Tables, charts and graphs
• Use suitable data collection techniques (data to be integer and decimal values);
• Design and use data-collection sheets for grouped, discrete and continuous data, use inequalities for grouped data, and introduce ≤ and ≥ signs; Sort, classify and tabulate data, both discrete and continuous quantitative data, and qualitative data; Extract data from lists and tables;
• Use correct notation for time, 12- and 24-hour clock and work out time taken for a journey from a timetable;
• Construct tables for time-series data; • Design, complete and use two-way tables for discrete
and grouped data; • Calculate the total frequency from a frequency table; • Read off frequency values from a table; • Read off frequency values from a frequency table; • Find greatest and least values from a frequency table; • Identify the mode from a frequency table; • Identify the modal class from a grouped frequency
table; • Plotting coordinates in first quadrant and read graph
scales in multiples; • Produce and interpret:
– pictograms; – composite bar charts; – dual/comparative bar charts for categorical
and ungrouped discrete data; – bar-line charts;
Construct a frequency table for a continuous data set, deciding on appropriate intervals using inequalities
Plan a journey using timetables.
Decide the most appropriate chart or table given a data set.
State the mode, smallest value or largest value from a stem and leaf diagram.
Students struggle to make the link between what the data in a frequency table represents, so for example may state the ‘frequency’ rather than the interval when asked for the modal group.

• Pie Charts • Scatter Graphs
– vertical line charts; – line graphs; – line graphs for time-series data; – histograms with equal class intervals; – stem and leaf (including back-to-back);
• Calculate total population from a bar chart or table; • Find greatest and least values from a bar chart or
table; • Find the mode from a stem and leaf diagram; • Identify the mode from a bar chart; • Recognise simple patterns, characteristic and
relationships in bar charts and line graphs; • Interpret and discuss any data. • Interpret tables; represent data in tables and charts; • Know which charts to use for different types of data
sets; • Draw circles and arcs to a given radius; • Know there are 360 degrees in a full turn, 180 degrees
in a half turn, and 90 degrees in a quarter turn; • Measure and draw angles, to the nearest degree;
Construct pie charts for categorical data and discrete/continuous numerical data;
• Interpret simple pie charts using simple fractions and percentages; �
�, �� and multiples of 10% sections;
• From a pie chart: – find the mode; – find the total frequency;
• Understand that the frequency represented by corresponding sectors in two pie charts is dependent upon the total populations represented by each of the pie charts.
• Draw scatter graphs; • Interpret points on a scatter graph; • Identify outliers and ignore them on scatter graphs;
From a simple pie chart identify the frequency represented by �
� and
�
� sections.
From a simple pie chart identify the mode.
Find the angle for one item
Justify an estimate they have made
Lines of best fit are often forgotten, but correct answers still obtained by sight.
Interpreting scales of
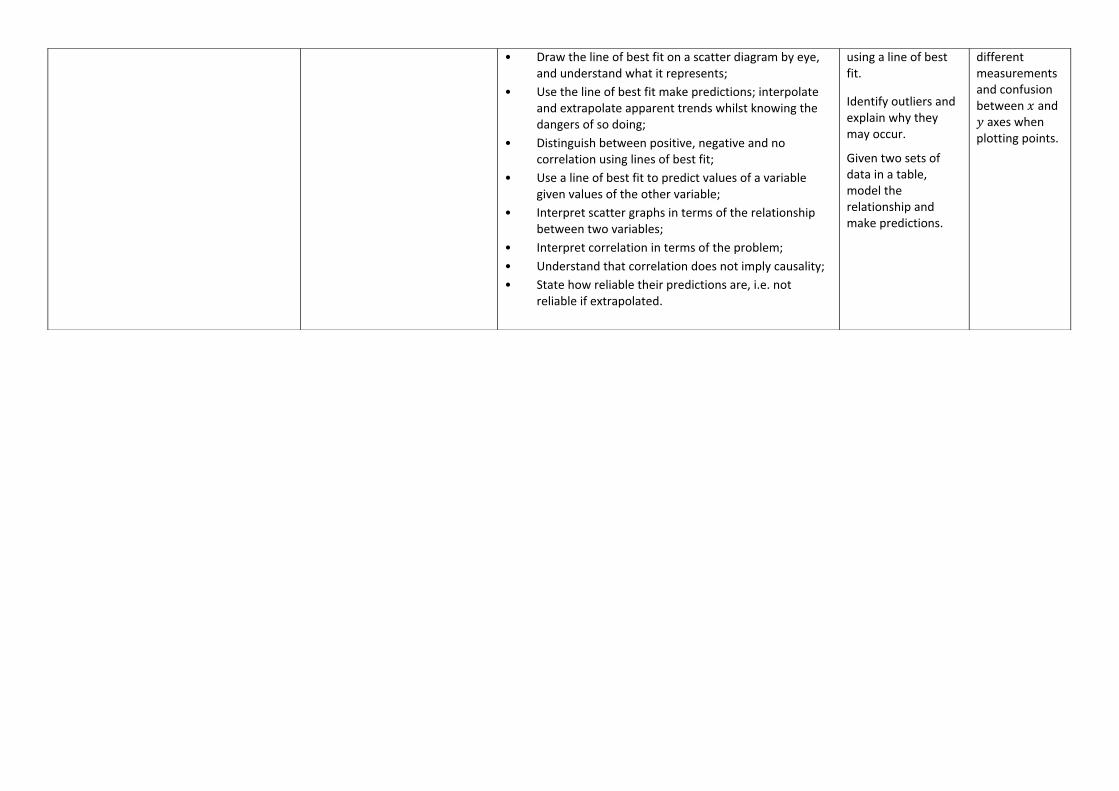
• Draw the line of best fit on a scatter diagram by eye, and understand what it represents;
• Use the line of best fit make predictions; interpolate and extrapolate apparent trends whilst knowing the dangers of so doing;
• Distinguish between positive, negative and no correlation using lines of best fit;
• Use a line of best fit to predict values of a variable given values of the other variable;
• Interpret scatter graphs in terms of the relationship between two variables;
• Interpret correlation in terms of the problem; • Understand that correlation does not imply causality; • State how reliable their predictions are, i.e. not
reliable if extrapolated.
using a line of best fit.
Identify outliers and explain why they may occur.
Given two sets of data in a table, model the relationship and make predictions.
different measurements and confusion between � and � axes when plotting points.
4. Fractions and percentages
� Fractions, decimals and percentages
- Working with fractions
- Operations and fractions
- Multiplying fractions
- Dividing fractions
- Fractions and decimals
- Calculating percentages
• Use diagrams to find equivalent fractions or compare fractions;
• Write fractions to describe shaded parts of diagrams; • Express a given number as a fraction of another, using
very simple numbers, some cancelling, and where the fraction is both < 1 and > 1;
• Write a fraction in its simplest form and find equivalent fractions;
• Order fractions, by using a common denominator; • Compare fractions, use inequality signs, compare unit
fractions; • Convert between mixed numbers and improper
fractions; • Add and subtract fractions; • Add fractions and write the answer as a mixed
number; • Multiply and divide an integer by a fraction; • Multiply and divide a fraction by an integer, including
finding fractions of quantities or measurements, and apply this by finding the size of each category from a pie chart using fractions;
• Understand and use unit fractions as multiplicative inverses;
• Multiply fractions: simplify calculations by cancelling first;
Express a given number as a fraction of another, including where the fraction > 1.
Simplify ������
.
�
� × 15, 20 × �
�.
�
� of 36 m, �
� of £20.
Find the size of each category from a pie chart using fractions.
Calculate: �� × �
�, �� ÷ 3.
Write terminating decimals (up to 3 d.p.) as fractions.
Convert between fractions, decimals and percentages, common ones such as �
�, ���
, ��, �� and �
��.
Keywords
Decimal, percentage, inverse, addition, subtraction, multiplication, division, fractions, mixed, improper, recurring, integer, decimal, terminating, percentage, VAT, increase, decrease, multiplier, profit, loss

• Percentages
- Fractions and percentages
- Calculating percentages 1
- Calculating percentages 2
• Divide a fraction by a whole number and another fraction;
• Recall the fraction-to-decimal conversion and convert fractions to decimals;
• Convert a fraction to a decimal to make a calculation easier, e.g. 0.25 × 8 = �
� × 8, or �
� × 10 = 0.375 × 10;
• Recognise recurring decimals and convert fractions such as �
�, �� and �
� into recurring decimals;
• Compare and order fractions, decimals and integers, using inequality signs;
• Understand that a percentage is a fraction in hundredths;
• Express a given number as a percentage of another number;
• Convert between fractions, decimals and percentages; • Order fractions, decimals and percentages, including
use of inequality signs.
• Express a given number as a percentage of another number;
• Find a percentage of a quantity without a calculator: 50%, 25% and multiples of 10% and 5%;
• Find a percentage of a quantity or measurement (use measurements they should know from Key Stage 3 only);
• Calculate amount of increase/decrease; • Use percentages to solve problems, including
comparisons of two quantities using percentages; • Percentages over 100%; • Use percentages in real-life situations, including
percentages greater than 100%: – Price after VAT (not price before VAT); – Value of profit or loss; – Simple interest; – Income tax calculations;
• Use decimals to find quantities;
Order integers, decimals and fractions.
What is 10%, 15%, 17.5% of £30?
Common misconceptions
The larger the denominator the larger the fraction.
Incorrect links between fractions and decimals, such as thinking that �
� = 0.15, 5% =
0.5, 4% = 0.4, etc.
It is not possible to have a percentage greater than 100%.

• Find a percentage of a quantity, including using a multiplier;
• Use a multiplier to increase or decrease by a percentage in any scenario where percentages are used;
• Understand the multiplicative nature of percentages as operators.
5. Equations, inequalities and sequences
� Equations and inequalities
-
• Select an expression/equation/formula/identity from a list;
• Write expressions and set up simple equations including forming an equation from a word problem;
• Use function machines; • Solve simple equations including those:
– with integer coefficients, in which the unknown appears on either side or on both sides of the equation;
– which contain brackets, including those that have negative signs occurring anywhere in the equation, and those with a negative solution;
– with one unknown, with integer or fractional coefficients;
• Rearrange simple equations; • Substitute into a formula, and solve the resulting
equation; • Find an approximate solution to a linear equation
using a graph; • Solve angle or perimeter problems using algebra. • Show inequalities on number lines;
Solve: � + 5 = 12, � − 6 = 3, �
� = 5, 2� − 5
=19, 2� + 5 = 8� − 7
Given expressions for the angles on a line or in a triangle in terms of �, find the value of �.
Given expressions for the sides of a rectangle and the perimeter, form and solve an equation to find missing values.
Solve −3 < 2� + 1 and show the solution set on a number line.
State the whole numbers that satisfy a given inequality.
Keywords
Arithmetic, geometric, function, sequence, �th term, derive, quadratic, triangular, cube, square, odd, even, solve, change, subject, inequality, represent, substitute, bracket, expand, linear, equation, balance, accuracy
• Sequences
- Generating sequences
- Using the nth term of a sequence
• Write down whole number values that satisfy an inequality;
• Solve an inequality such as −3 < 2� + 1 < 7 and show the solution set on a number line;
• Solve two inequalities in �, find the solution sets and compare them to see which value of � satisfies both;
• Use the correct notation to show inclusive and exclusive inequalities;
• Construct inequalities to represent a set shown on a number line;
• Solve simple linear inequalities in one variable, and represent the solution set on a number line;
• Round answers to a given degree of accuracy; • Use inequality notation to specify simple error
intervals due to truncation or rounding.
• Recognise sequences of odd and even numbers, and other sequences including Fibonacci sequences;
• Use function machines to find terms of a sequence; • Write the term-to-term definition of a sequence in
words; • Find a specific term in the sequence using position-to-
term or term-to-term rules; • Generate arithmetic sequences of numbers, triangular
number, square and cube integers and sequences derived from diagrams;
• Recognise such sequences from diagrams and draw the next term in a pattern sequence;
• Find the next term in a sequence, including negative values;
• Find the �th term – for a pattern sequence; – a linear sequence; – of an arithmetic sequence;
• Use the �th term of an arithmetic sequence to – generate terms;
Recognise that measurements given to the nearest whole unit may be inaccurate by up to one half in either direction.
Common misconceptions
Rules of adding and subtracting negatives.
Inverse operations can be misapplied.
When solving inequalities, students often state their final answer as a number quantity and either exclude the inequality or change it to =.

– decide if a given number is a term in the sequence, or find the first term over a certain number;
– find the first term greater/less than a certain number;
• Continue a geometric progression and find the term-to-term rule, including negatives, fraction and decimal terms;
• Continue a quadratic sequence and use the �th term to generate terms;
• Distinguish between arithmetic and geometric sequences.
Given a sequence, ‘Which is the 1st term greater than 50?’
What is the amount of money after � months saving the same amount or the height of tree that grows 6 m per year?
What are the next terms in the following sequences?
1, 3, 9, … 100, 50, 25, … 2, 4, 8, 16, …
Write down an expression for the �th term of the arithmetic sequence 2, 5, 8, 11, …
Is 67 a term in the sequence 4, 7, 10, 13, …?
6. Angles � Properties of shapes, parallel lines and angle facts
- Properties of shapes
- Angles in parallel lines
- Angles in triangles
- Geometrical problems
• Estimate sizes of angles; • Measure angles using a protractor; • Use geometric language appropriately; • Use letters to identify points, lines and angles; • Use two-letter notation for a line and three-letter
notation for an angle; • Describe angles as turns and in degrees and
understand clockwise and anticlockwise; • Know that there are 360° in a full turn, 180° in a half
turn and 90° in a quarter turn; • Identify a line perpendicular to a given line on a
diagram and use their properties; • Identify parallel lines on a diagram and use their
properties; • Find missing angles using properties of corresponding
and alternate angles; • Understand and use the angle properties of parallel
lines. • Recall the properties and definitions of special types
of quadrilaterals, including symmetry properties; • List the properties of each special type of
quadrilateral, or identify (name) a given shape; • Draw sketches of shapes; • Classify quadrilaterals by their geometric properties
and name all quadrilaterals that have a specific property;
• Identify quadrilaterals from everyday usage; • Given some information about a shape on coordinate
axes, complete the shape; Understand and use the angle properties of quadrilaterals;
• Use the fact that angle sum of a quadrilateral is 360°; • Recall and use properties of angles at a point, angles
at a point on a straight line, right angles, and vertically opposite angles;
• Distinguish between scalene, equilateral, isosceles and right-angled triangles;
Name all quadrilaterals that have a specific property.
Use geometric reasoning to answer problems giving detailed reasons.
Find the size of missing angles at a point or at a point on a straight line.
Convince me that a parallelogram is a rhombus.
Keywords
Quadrilateral, angle, polygon, interior, exterior, proof, tessellation, rotational symmetry, parallel, corresponding, alternate, co-interior, vertices, edge, face, sides, triangle, perpendicular, isosceles, scalene, clockwise, anticlockwise, hexagons, heptagons, octagons, decagons, obtuse, acute, reflex, quadrilateral, triangle, regular, irregular, two-dimensional, three-dimensional, measure, line, angle, order, intersecting

• Interior and exterior
angles of polygons - Exterior and
interior angles - More exterior and
interior angles
• Derive and use the sum of angles in a triangle; • Find a missing angle in a triangle, using the angle sum
of a triangle is 180°; • Understand and use the angle properties of triangles,
use the symmetry property of isosceles triangle to show that base angles are equal;
• Use the side/angle properties of isosceles and equilateral triangles;
• Understand and use the angle properties of intersecting lines;
• Understand a proof that the exterior angle of a triangle is equal to the sum of the interior angles at the other two vertices; Use geometrical language appropriately, give reasons for angle calculations and show step-by-step deduction when solving problems.
• Recognise and name pentagons, hexagons, heptagons, octagons and decagons;
• Understand ‘regular’ and ‘irregular’ as applied to polygons;
• Use the sum of angles of irregular polygons; • Calculate and use the sums of the interior angles of
polygons; • Calculate and use the angles of regular polygons; • Use the sum of the interior angles of an �-sided
polygon; • Use the sum of the exterior angles of any polygon is
360°; • Use the sum of the interior angle and the exterior
angle is 180°; • Identify shapes which are congruent (by eye); • Explain why some polygons fit together and others do
not;
Deduce and use the angle sum in any polygon.
Derive the angle properties of regular polygons.
Given the size of its exterior angle, how many sides does the polygon have?
Common Misconceptions
Multi-step “angle chasing” style problems that involve justifying how students have found a specific angle.
Geometrical problems involving algebra whereby equations can be formed and solved allow students the opportunity to make and use connections with different parts of mathematics.
What is the same, and what is different between families of polygons?
Pupils may believe, incorrectly, that all polygons are regular.
7. Averages and Range
� Statistics, sampling and the averages
- Mean and range
- Mode, median and range
- Types of Average
- Estimating the mean
- Sampling
• Specify the problem and: – plan an investigation; – decide what data to collect and what
statistical analysis is needed; – consider fairness;
• Recognise types of data: primary secondary, quantitative and qualitative;
• Identify which primary data they need to collect and in what format, including grouped data;
• Collect data from a variety of suitable primary and secondary sources;
• Understand how sources of data may be biased and explain why a sample may not be representative of a whole population;
• Understand sample and population. • Calculate the mean, mode, median and range for
discrete data; • Interpret and find a range of averages as follows:
– median, mean and range from a (discrete) frequency table;
Explain why a sample may not be representative of a whole population.
Carry out a statistical investigation of their own and justify how sources of bias have been eliminated.
Show me an example of a situation in which biased data would result.
State the median, mode, mean and range from a small data set.
Extract the averages from a stem and leaf diagram.
Keywords
Mean, median, mode, range, average, discrete, continuous, qualitative, quantitative, data, sample, population, stem and leaf, frequency, table, sort, pie chart, estimate, primary, secondary, interval, midpoint, survey

– range, modal class, interval containing the median, and estimate of the mean from a grouped data frequency table;
– mode and range from a bar chart; – median, mode and range from stem and leaf
diagrams; – mean from a bar chart;
• Understand that the expression 'estimate' will be used where appropriate, when finding the mean of grouped data using mid-interval values;
• Compare the mean, median, mode and range (as appropriate) of two distributions using bar charts, dual bar charts, pictograms and back-to-back stem and leaf;
• Recognise the advantages and disadvantages between measures of average
Estimate the mean from a table.
Common misconceptions
The concept of an unbiased sample is difficult for some students to understand.
Often the ∑(� × �) is divided by the number of classes rather than ∑� when estimating the mean.
8. Perimeter, area and volume 1
� Perimeter, area and volume
- Rectangles, parallelograms, triangles
- Trapezia and changing units
- Area of compound shapes
- Surface are of 3D solids
- Volume of prisms
- Compound measures
• Indicate given values on a scale, including decimal value;
• Know that measurements using real numbers depend upon the choice of unit;
• Convert between units of measure within one system, including time and metric units to metric units of length, area and volume and capacity e.g. 1ml = 1cm3;
• Make sensible estimates of a range of measures in everyday settings;
• Measure shapes to find perimeters and areas using a range of scales;
• Find the perimeter of – rectangles and triangles; – parallelograms and trapezia; – compound shapes;
• Recall and use the formulae for the area of a triangle and rectangle;
• Find the area of a trapezium and recall the formula; • Find the area of a parallelogram; • Calculate areas and perimeters of compound shapes
made from triangles and rectangles;
Find the area/perimeter of a given shape, stating the correct units.
Justify whether a certain number of small boxes fit inside a larger box.
Calculate the volume of a triangular prism with correct units.
Keywords
Triangle, rectangle, parallelogram, trapezium, area, perimeter, formula, length, width, prism, compound, measurement, polygon, cuboid, volume, symmetry, vertices, edge, face, units, conversion
• Estimate surface areas by rounding measurements to 1 significant figure;
• Find the surface area of a prism; • Find surface area using rectangles and triangles; • Identify and name common solids: cube, cuboid,
cylinder, prism, pyramid, sphere and cone; • Sketch nets of cuboids and prisms; • Recall and use the formula for the volume of a cuboid; • Find the volume of a prism, including a triangular
prism, cube and cuboid; • Calculate volumes of right prisms and shapes made
from cubes and cuboids; • Estimate volumes etc by rounding measurements to 1
significant figure;
Common misconceptions
Shapes involving missing lengths of sides often result in incorrect answers.
Students often confuse perimeter and area.
Volume often gets confused with surface area.
9. Graphs � Real-life graphs - Coordinates - Real-life graphs - Distance-time
graphs - Proportion and
graphs
• Use input/output diagrams; • Draw, label and scale axes; • Use axes and coordinates to specify points in all four
quadrants in 2D; • Identify points with given coordinates and coordinates
of a given point in all four quadrants; • Find the coordinates of points identified by
geometrical information in 2D (all four quadrants); • Find the coordinates of the midpoint of a line
segment; Read values from straight-line graphs for real-life situations;
• Draw straight line graphs for real-life situations, including ready reckoner graphs, conversion graphs, fuel bills graphs, fixed charge and cost per unit;
• Draw distance-time graphs and velocity-time graphs; • Work out time intervals for graph scales;
Interpret a description of a journey into a distance-time or speed-time graph.
Keywords
Linear, graph, distance, time, coordinate, quadrant, real-life graph, gradient, intercept, function, solution, parallel
• Straight-line graphs
- Coordinates - Linaer graphs - Gradient - y=mx + c - distance-time
graphs - more real-life
graphs
• Interpret distance-time graphs, and calculate: the speed of individual sections, total distance and total time;
• Interpret information presented in a range of linear and non-linear graphs;
• Interpret graphs with negative values on axes; • Find the gradient of a straight line from real-life
graphs; • Interpret gradient as the rate of change in distance-
time and speed-time graphs, graphs of containers filling and emptying, and unit price graphs.
• Use function machines to find coordinates (i.e. given the input �, find the output �);
• Plot and draw graphs of � = �, � = �, � = � and � = −�; • Recognise straight-line graphs parallel to the axes; • Recognise that equations of the form � = �� + �
correspond to straight-line graphs in the coordinate plane;
• Plot and draw graphs of straight lines of the form � = �� + � using a table of values;
• Sketch a graph of a linear function, using the gradient and �-intercept;
• Identify and interpret gradient from an equation � = �� + �;
• Identify parallel lines from their equations; • Plot and draw graphs of straight lines in the form �� +
�� = �; • Find the equation of a straight line from a graph; • Find the equation of the line through one point with a
given gradient; • Find approximate solutions to a linear equation from a
graph.
Plot and draw the graph for � = 2� − 4.
Which of these lines are parallel: � = 2� + 3, � = 5� + 3, � = 2� − 9, 2� = 4� − 8
Common misconceptions
With distance-time graphs, students struggle to understand that the perpendicular distance from the �-axis represents distance.
When not given a table of values, students rarely see the relationship between the coordinate axes.
10.Transformations � Transformations - Translation - Reflection - Rotation - Enlargement - Describing
enlargement - Combining
transformations -
• Identify congruent shapes by eye; • Understand that rotations are specified by a centre,
an angle and a direction of rotation; • Find the centre of rotation, angle and direction of
rotation and describe rotations fully using the angle, direction of turn, and centre;
• Rotate and draw the position of a shape after rotation about the origin or any other point including rotations on a coordinate grid;
• Identify correct rotations from a choice of diagrams; • Understand that translations are specified by a
distance and direction using a vector; • Translate a given shape by a vector; • Use column vectors to describe and transform 2D
shapes using single translations on a coordinate grid; • Understand that distances and angles are preserved
under rotations and translations, so that any figure is congruent under either of these transformations;
• Understand that reflections are specified by a mirror line;
• Identify correct reflections from a choice of diagrams; • Identify the equation of a line of symmetry; • Transform 2D shapes using single reflections
(including those not on coordinate grids) with vertical, horizontal and diagonal mirror lines;
• Describe reflections on a coordinate grid;
Understand that translations are specified by a distance and direction (using a vector).
Describe and transform a given shape by either a rotation or a translation.
Describe and transform a given shape by a reflection.
Convince me the scale factor is, for example, 2.5.
Keywords
Transformation, rotation, reflection, enlargement, translation, single, combination, scale factor, mirror line, centre of rotation, centre of enlargement, column vector, vector, similarity, congruent, angle, direction, coordinate, describe

• Scale a shape on a grid (without a centre specified); • Understand that an enlargement is specified by a
centre and a scale factor; • Enlarge a given shape using (0, 0) as the centre of
enlargement, and enlarge shapes with a centre other than (0, 0);
• Find the centre of enlargement by drawing; • Describe and transform 2D shapes using enlargements
by: – a positive integer scale factor; – a fractional scale factor;
• Identify the scale factor of an enlargement of a shape as the ratio of the lengths of two corresponding sides, simple integer scale factors, or simple fractions;
• Understand that distances and angles are preserved under reflections, so that any figure is congruent under this transformation;
• Understand that similar shapes are enlargements of each other and angles are preserved – define similar in this unit.
•
Common misconceptions
The directions on a column vector often get mixed up.
Student need to understand that the ‘units of movement’ are those on the axes, and care needs to be taken to check the scale.
Correct language must be used: students often use ‘turn’ rather than ‘rotate’.
11. Ratio and proportion
� Ratio - Writing ratios - Using ratio - Ratios and
measures - Comparing
using ratios -
• Proportion
- Using proportion - Proportion and
graphs - Proportion
problems - Direct and inverse
proportion -
• Understand and express the division of a quantity into a of number parts as a ratio;
• Write ratios in their simplest form; • Write/interpret a ratio to describe a situation; • Share a quantity in a given ratio including three-part
ratios; • Solve a ratio problem in context:
– use a ratio to find one quantity when the other is known;
– use a ratio to compare a scale model to a real-life object;
– use a ratio to convert between measures and currencies;
– problems involving mixing, e.g. paint colours, cement and drawn conclusions;
• Compare ratios; • Write ratios in form 1 : � or � : 1; • Write a ratio as a fraction; • Write a ratio as a linear function; • Write lengths, areas and volumes of two shapes as
ratios in simplest form; • Express a multiplicative relationship between two
quantities as a ratio or a fraction.
• Understand and use proportion as equality of ratios; • Solve word problems involving direct and inverse
proportion; • Work out which product is the better buy; • Scale up recipes; • Convert between currencies; • Find amounts for 3 people when amount for 1 given; • Solve proportion problems using the unitary method; • Recognise when values are in direct proportion by
reference to the graph form;
• Write a ratio to describe a situation such as 1 blue for every 2 red, or 3 adults for every 10 children.
• Recognise that two paints mixed red to yellow 5 : 4 and 20 : 16 are the same colour.
• Express the statement ‘There are twice as many girls as boys’ as the ratio 2 : 1 or the linear function � = 2�, where � is the number of boys and � is the number of girls.
Recognise that two paints mixed red to yellow 5 : 4 and 20 : 16 are the same colour.
If it takes 2 builders 10 days to build a
Keywords
Ratio, proportion, share, parts, fraction, function, direct proportion, inverse proportion, graphical, linear, compare
Common misconceptions
Students find three-part ratios difficult.
Using a ratio to find one quantity when the other is known often results in students ‘sharing’ the known amount.
• Understand inverse proportion: as � increases, � decreases (inverse graphs done in later unit);
• Understand direct proportion → relationship � = ��.
wall, how long will it take 3 builders?
Scale up recipes and decide if there is enough of each ingredient.
Given two sets of data in a table, are they in direct proportion?
12. Right-angled triangles
� Pythagoras and trigonometry
- Pythagoras theorem
- Trigonometry sine ratio 1
- Trigonometry sine ratio 2
- Cosine ratio - Tangent Ratio - Finding lengths
and angles using trigonometry
• Understand, recall and use Pythagoras’ Theorem in 2D, including leaving answers in surd form and being able to justify if a triangle is right-angled or not;
• Calculate the length of the hypotenuse and of a shorter side in a right-angled triangle, including decimal lengths and a range of units;
• Apply Pythagoras’ Theorem with a triangle drawn on a coordinate grid;
• Calculate the length of a line segment AB given pairs of points;
• Understand, use and recall the trigonometric ratios sine, cosine and tan, and apply them to find angles and lengths in general triangles in 2D figures;
• Use the trigonometric ratios to solve 2D problems including angles of elevation and depression;
• Round answers to appropriate degree of accuracy, either to a given number of significant figures or
• Keywords
Triangle, right angle, angle, Pythagoras’ Theorem, sine, cosine, tan, trigonometry, opposite, hypotenuse, adjacent, ratio, elevation, depression, length, accuracy
decimal places, or make a sensible decision on rounding in context of question;
• Know the exact values of sin � and cos � for � = 0°, 30°, 45°, 60° and 90°; know the exact value of tan � for � = 0°, 30°, 45° and 60°.
Common misconceptions
Does 2, 3, 6 give a right angled triangle?
Justify when to use Pythagoras’ Theorem and when to use trigonometry.
13. Probability � Probability - Calculating
probability - Two events - Experimental
probability - Venn diagrams - Tree diagrams - More tree
diagrams -
• Distinguish between events which are impossible, unlikely, even chance, likely, and certain to occur;
• Mark events and/or probabilities on a probability scale of 0 to 1;
• Write probabilities in words or fractions, decimals and percentages;
• Find the probability of an event happening using theoretical probability;
• Use theoretical models to include outcomes using dice, spinners, coins;
• List all outcomes for single events systematically; • Work out probabilities from frequency tables,
frequency trees, and two way tables; • Record outcomes of probability experiments in tables; • Add simple probabilities; • Identify different mutually exclusive outcomes and
know that the sum of the probabilities of all outcomes is 1;
• Using 1 − � as the probability of an event not occurring where � is the probability of the event occurring;
Mark events on a probability scale and use the language of probability.
If the probability of outcomes are �, 2�, 4�, 3� calculate �.
Calculate the probability of an event from a two-way table or frequency table.
Decide if a coin, spinner or game is fair.
Understand the use of the 0-1 scale to measure probability.
Keywords
Probability, dependent, independent, conditional, tree diagrams, sample space, outcomes, theoretical, relative frequency, fairness, experimental
• Find a missing probability from a list or table including algebraic terms;
• Find the probability of an event happening using relative frequency;
• Estimate the number of times an event will occur, given the probability and the number of trials – for both experimental and theoretical probabilities;
• List all outcomes for combined events systematically; • Use and draw sample space diagrams; • Work out probabilities from Venn diagrams to
represent real-life situations and also ‘abstract’ sets of numbers/values;
• Use union and intersection notation; • Compare experimental data and theoretical
probabilities; • Compare relative frequencies from samples of
different sizes; • Find the probability of successive events, such as
several throws of a single dice; • Use tree diagrams to calculate the probability of two
independent events; • Use tree diagrams to calculate the probability of two
dependent events.
List all the outcomes for an experiment.
Know and apply the fact that the sum of probabilities for all outcomes is 1.
Draw a Venn diagram of students studying French, German or both, and then calculate the probability that a student studies French given that they also study German
•
Common misconceptions
Not using fractions or decimals when working with probability trees.
14. Multiplicative reasoning
� Multiplicative reasoning - Percentages - Growth and
Decay - Compound
measures - Distance, time
and speed - Direct and
inverse proportion
• Understand and use compound measures: – density; – pressure; – speed:
• convert between metric speed measures;
• read values in km/h and mph from a speedometer;
• calculate average speed, distance, time – in miles per hour as well as metric measures;
• use kinematics formulae to calculate speed, acceleration (with formula provided and variables defined in the question);
• change d/t in m/s to a formula in km/h, i.e. d/t × (60 × 60)/1000 – with support;
• Express a given number as a percentage of another number in more complex situations;
• Calculate percentage profit or loss; • Make calculations involving repeated percentage
change, not using the formula; • Find the original amount given the final amount after
a percentage increase or decrease; • Use compound interest; • Use a variety of measures in ratio and proportion
problems: – currency conversion; – rates of pay; – best value;
• Set up, solve and interpret the answers in growth and decay problems;
• Understand that � is inversely proportional to � is equivalent to � is proportional to �
;
• Interpret equations that describe direct and inverse proportion.
Know that measurements using real numbers depend upon the choice of unit, with speedometers and rates of change.
Change m/s to km/h.
Understand direct proportion as: as � increase, � increases.
Understand inverse proportion as: as � increases, � decreases.
Keywords
Ratio, proportion, best value, proportional change, compound measure, density, mass, volume, speed, distance, time, density, mass, volume, pressure, acceleration, velocity, inverse, direct
Common misconceptions
Some students may think that compound interest and simple interest are the same method of calculating interest.
Incomplete methods when using multipliers, i.e. reduce £80 by 15% = 80 × 0.15.
15. Construction, loci and bearings
• Plans and elevations - 3D solids - Plans and elevations - Accurate drawings
• Constructions, loci and
bearings - Accurate drawings - Scale drawings and
maps - Constructions - Loci and regions - Bearings -
• Understand clockwise and anticlockwise; • Draw circles and arcs to a given radius or given the
diameter; • Measure and draw lines, to the nearest mm; • Measure and draw angles, to the nearest degree; • Know and use compass directions; • Draw sketches of 3D solids; • Know the terms face, edge and vertex; • Identify and sketch planes of symmetry of 3D solids; • Make accurate drawings of triangles and other 2D
shapes using a ruler and a protractor; • Construct diagrams of everyday 2D situations
involving rectangles, triangles, perpendicular and parallel lines;
• Understand and draw front and side elevations and plans of shapes made from simple solids;
Given the front and side elevations and the plan of a solid, draw a sketch of the 3D solid. • Understand congruence, as two shapes that are the
same size and shape; • Visually identify shapes which are congruent; • Use straight edge and a pair of compasses to do
standard constructions: – understand, from the experience of
constructing them, that triangles satisfying SSS, SAS, ASA and RHS are unique, but SSA triangles are not;
– construct the perpendicular bisector of a given line;
– construct the perpendicular from a point to a line;
Be able to estimate the size of given angles.
Convert fluently between metric units of length.
Use bearings in a real-life context to describe the bearing between two towns on a map.
Sketch the locus of point on a vertex of a rotating shape as it moves along a line, i.e. a point on the circumference or at the centre of a wheel.
Keywords
Construct, circle, arc, sector, face, edge, vertex, two-dimensional, three-dimensional, solid, elevations, congruent, angles, regular, irregular, bearing, degree, bisect, perpendicular, loci, map, scale, plan, region
Common misconceptions
Some pupils may use the wrong scale of a protractor. For example, they measure an obtuse angle as 60° rather than as 120°.
Often 5 sides only are drawn for a cuboid.

– construct the bisector of a given angle; – construct angles of 90°, 45°;
• Draw and construct diagrams from given instructions, including the following:
– a region bounded by a circle and an intersecting line;
– a given distance from a point and a given distance from a line;
– equal distances from two points or two line segments;
– regions may be defined by ‘nearer to’ or ‘greater than’;
• Find and describe regions satisfying a combination of loci;
• Use constructions to solve loci problems (2D only); • Use and interpret maps and scale drawings; • Estimate lengths using a scale diagram; • Make an accurate scale drawing from a diagram; • Use three-figure bearings to specify direction; • Mark on a diagram the position of point ! given its
bearing from point "; • Give a bearing between the points on a map or scaled
plan; • Given the bearing of a point " from point !, work out
the bearing of ! from "; • Use accurate drawing to solve bearings problems; • Solve locus problems including bearings.
Higher Tier
Unit Topic Learning Objectives Possible Success Criteria Keywords
1. Number � Calculations, checking and rounding
- Number problems and reasoning
- Place value and estimating
� Add, subtract, multiply and divide decimals, whole numbers including any number between 0 and 1;
� Put digits in the correct place in a decimal calculation and use one calculation to find the answer to another;
� Use the product rule for counting (i.e. if there are � ways of doing one task and for each of these, there are � ways of doing another task, then the total number of ways the two tasks can be done is � × � ways);
� Round numbers to the nearest 10, 100, 1000, the nearest integer, to a given number of decimal places and to a given number of significant figures;
� Estimate answers to one- or two-step calculations, including use of rounding numbers and formal estimation to 1
Given 5 digits, what is the largest even number, largest odd number, or largest or smallest answers when subtracting a two-digit number from a three-digit number?
Given 2.6 × 15.8 = 41.08 what is 26 × 0.158? What is 4108 ÷ 26?
What is the value of 25?
Prove that the square root of 45 lies between 6 and 7.
Integer, number, digit, negative, decimal, addition, subtraction, multiplication, division, remainder, operation, estimate, power, roots, factor, multiple, primes, square, cube, even, odd, surd, rational, irrational standard form, simplify
� Indices, roots, reciprocals and hierarchy of operations
- HCF and LCM - Calculating with
powers - Zero, negative
and fractional indices
significant figure: mainly whole numbers and then decimals.
• Use index notation for integer powers of 10, including negative powers;
• Recognise powers of 2, 3, 4, 5; • Use the square, cube and power keys on a
calculator and estimate powers and roots of any given positive number, by considering the values it must lie between, e.g. the square root of 42 must be between 6 and 7;
• Find the value of calculations using indices including positive, fractional and negative indices;
• Recall that �0 = 1 and �−1 = ��
for positive
integers � as well as, �#$ = √� and �
#& = �√�
for any positive number �; • Understand that the inverse operation of
raising a positive number to a power � is raising the result of this operation to the power �
�;
• Use index laws to simplify and calculate the value of numerical expressions involving multiplication and division of integer powers, fractional and negative powers, and powers of a power;
• Solve problems using index laws; • Use brackets and the hierarchy of operations
up to and including with powers and roots inside the brackets, or raising brackets to powers or taking roots of brackets;
• Use an extended range of calculator functions, including +, -, ×, ÷, �², √�,
memory, �', �#*, brackets;
Evaluate (23 × 25) ÷ 24, 40, 8 +$&.
Work out the value of � in 40 = 5 × 2 �.
Common misconceptions
The order of operations is often not applied correctly when squaring negative numbers, and many calculators will reinforce this misconception.
� Factors, multiples, primes, standard from and surds
- Powers f 10 and standard form
- Surds -
• Use calculators for all calculations: positive and negative numbers, brackets, powers and roots, four operations.
• Identify factors, multiples and prime
numbers; • Find the prime factor decomposition of
positive integers – write as a product using index notation;
• Find common factors and common multiples of two numbers;
• Find the LCM and HCF of two numbers, by listing, Venn diagrams and using prime factors – include finding LCM and HCF given the prime factorisation of two numbers;
• Solve problems using HCF and LCM, and prime numbers;
• Understand that the prime factor decomposition of a positive integer is unique, whichever factor pair you start with, and that every number can be written as a product of prime factors;
• Convert large and small numbers into standard form and vice versa;
• Add, subtract, multiply and divide numbers in standard form;
• Interpret a calculator display using standard form and know how to enter numbers in standard form;
• Understand surd notation, e.g. calculator gives answer to sq rt 8 as 4 rt 2;
• Simplify surd expressions involving squares (e.g. √12 = ,(4 × 3) = √4 × √3 = 2√3).
Know how to test if a number up to 120 is prime.
Understand that every number can be written as a unique product of its prime factors.
Recall prime numbers up to 100.
Understand the meaning of prime factor.
Write a number as a product of its prime factors.
Use a Venn diagram to sort information.
Write 51080 in standard form.
Write 3.74 x 10⁻⁶ as an ordinary number.
Simplify √8.
Convert a ‘near miss’, or any number, into standard form; e.g. 23 × 107.
1 is a prime number.
Particular emphasis should be made on the definition of “product” as multiplication, as many students get confused and think it relates to addition.
Some students may think that any number multiplied by a power of ten qualifies as a number written in standard form.
When rounding to significant figures some students may think, for example, that 6729 rounded to one significant figure is 7.
2. Algebra • Algebra: the basics, setting up, rearranging and solving equations
- Algebraic indices - Expanding and
factorizing - Equations - Formulae
� Use algebraic notation and symbols correctly;
� Know the difference between a term, expression, equation, formula and an identity;
� Write and manipulate an expression by collecting like terms;
� Substitute positive and negative numbers into expressions such as 3� + 4 and 2�3 and then into expressions involving brackets and powers;
� Substitute numbers into formulae from mathematics and other subject using simple linear formulae, e.g. - × �, . = / + � ;
� Simplify expressions by cancelling, e.g. ���
= 2�;
� Use instances of index laws for positive integer powers including when multiplying or dividing algebraic terms;
� Use instances of index laws, including use of zero, fractional and negative powers;
� Multiply a single term over a bracket and recognise factors of algebraic terms involving single brackets and simplify expressions by factorising, including subsequently collecting like terms;
� Expand the product of two linear expressions, i.e. double brackets working up to negatives in both brackets and also similar to (2� + 3�)(3� − �);
� Know that squaring a linear expression is the same as expanding double brackets;
� Factorise quadratic expressions of the form ��2 + �� + �;
� Factorise quadratic expressions using the difference of two squares;
� Set up simple equations from word problems and derive simple formulae;
Simplify 4� − 22 + 1 − 3� + 52.
Evaluate 4�2 − 2� when � = −5.
Simplify 4 × 3, �3 ÷ �2, (�7)2,
(8����)#&.
Expand and simplify 3( − 1) + 57.
Factorise 15�2� − 35�2�2.
Expand and simplify (3� + 2)(4� − 1).
Factorise 6�2 − 7� + 1.
A room is 2 m longer than it is wide. If its area is 30 m2 what is its perimeter?
Use fractions when working in algebraic situations.
Substitute positive and negative numbers into formulae.
Be aware of common scientific formulae.
Know the meaning of the ‘subject’ of a formula.
Change the subject of a formula when one step is required.
Change the subject of a formula when two steps are required.
Keywords
Expression, identity, equation, formula, substitute, term, ‘like’ terms, index, power, negative and fractional indices, collect, substitute, expand, bracket, factor, factorise, quadratic, linear, simplify, approximate, arithmetic, geometric, function, sequence, �th term, derive
Common misconceptions
When expanding two linear expressions, poor number skills involving negatives and times tables will become evident.
Hierarchy of operations applied in the wrong order

� Understand the ≠ symbol (not equal), e.g. 6� + 4 ≠ 3(� + 2), and introduce identity ≡ sign;
� Solve linear equations, with integer coefficients, in which the unknown appears on either side or on both sides of the equation;
� Solve linear equations which contain brackets, including those that have negative signs occurring anywhere in the equation, and those with a negative solution;
� Solve linear equations in one unknown, with integer or fractional coefficients;
� Set up and solve linear equations to solve a problem;
� Derive a formula and set up simple equations from word problems, then solve these equations, interpreting the solution in the context of the problem;
� Substitute positive and negative numbers into a formula, solve the resulting equation including brackets, powers or standard form;
� Use and substitute formulae from mathematics and other subjects, including the kinematics formulae . = / + � , .2 − /2 = 2�0, and 0 = / + �
� � 2;
� Change the subject of a simple formula, i.e. linear one-step, such as � = 4�;
� Change the subject of a formula, including cases where the subject is on both sides of the original formula, or involving fractions and small powers of the subject;
� Simple proofs and use of ≡ in “show that” style questions; know the difference between an equation and an identity;
� Use iteration to find approximate solutions to equations, for simple
when changing the subject of a formula.
�0 = 0.
3�� and 5�� are different “types of term” and cannot be “collected” when simplifying expressions.
The square and cube operations on a calculator may not be similar on all makes.
Not using brackets with negative numbers on a calculator.
Not writing down all the digits on the display.
� Sequences - Linear
sequences - Non-linear
sequences
equations in the first instance, then quadratic and cubic equations.
• Recognise simple sequences including at the most basic level odd, even, triangular, square and cube numbers and Fibonacci-type sequences (including those involving numbers in standard form or index form);
• Generate sequences of numbers, squared integers and sequences derived from diagrams;
• Describe in words a term-to-term sequence and identify which terms cannot be in a sequence;
• Generate specific terms in a sequence using the position-to-term rule and term-to-term rule;
• Find and use (to generate terms) the �th term of an arithmetic sequence;
• Use the �th term of an arithmetic sequence to decide if a given number is a term in the sequence, or find the first term above or below a given number;
• Identify which terms cannot be in a sequence by finding the �th term;
• Continue a quadratic sequence and use the �th term to generate terms;
• Find the �th term of quadratic sequences; • Distinguish between arithmetic and
geometric sequences; • Use finite/infinite and ascending/descending
to describe sequences; • Recognise and use simple geometric
progressions (5� where � is an integer, and 5 is a rational number > 0 or a surd);
• Continue geometric progression and find term to term rule, including negative, fraction and decimal terms;
Given a sequence, ‘which is the 1st term greater than 50?’
Be able to solve problems involving sequences from real-life situations, such as:
• 1 grain of rice on first square, 2 grains on second, 4 grains on third, etc (geometric progression), or person saves £10 one week, £20 the next, £30 the next, etc;
• What is the amount of money after � months saving the same amount, or the height of tree that grows 6 m per year;
• Compare two pocket money options, e.g. same number of £ per week as your age from 5 until 21, or starting with £5 a week aged 5 and increasing by 15% a year until 21.
Solve problems involving sequences from real life situations
3. Interpreting and representing data
• Averages and range - Averages and
range
• Design and use two-way tables for discrete and grouped data;
• Use information provided to complete a two-way table;
• Sort, classify and tabulate data and discrete or continuous quantitative data;
• Calculate mean and range, find median and mode from a small data set;
• Use a spreadsheet to calculate mean and range, and find median and mode;
• Recognise the advantages and disadvantages between measures of average;
• Construct and interpret stem and leaf diagrams (including back-to-back diagrams):
– find the mode, median, range, as well as the greatest and least values from stem and leaf diagrams, and compare two distributions from stem and leaf diagrams (mode, median, range);
• Calculate the mean, mode, median and range from a frequency table (discrete data);
Be able to state the median, mode, mean and range from a small data set.
Extract the averages from a stem and leaf diagram.
Estimate the mean from a table.
Keywords
Mean, median, mode, range, average, discrete, continuous, qualitative, quantitative, data, scatter graph, line of best fit, correlation, positive, negative, sample, population, stem and leaf, frequency, table, sort, pie chart, estimate
� Representing and interpreting data and scatter graphs
- Statistical diagrams 1
- Time series - Scatter graphs - Line of best
• Construct and interpret grouped frequency tables for continuous data:
– for grouped data, find the interval which contains the median and the modal class;
– estimate the mean with grouped data;
– understand that the expression ‘estimate’ will be used where appropriate, when finding the mean of grouped data using mid-interval values.
• Know which charts to use for different types of data sets;
• Produce and interpret composite bar charts; • Produce and interpret comparative and dual
bar charts; • Produce and interpret pie charts:
– find the mode and the frequency represented by each sector;
– compare data from pie charts that represent different-sized samples;
• Produce and interpret frequency polygons for grouped data:
– from frequency polygons, read off frequency values, compare distributions, calculate total population, mean, estimate greatest and least possible values (and range);
• Produce frequency diagrams for grouped discrete data:
– read off frequency values, calculate total population, find greatest and least values;
• Produce histograms with equal class intervals:
Use a time-series data graph to make a prediction about a future value.
Explain why same-size sectors on pie charts with different data sets do not represent the same number of items, but do represent the same proportion.
Make comparisons between two data sets.
Be able to justify an estimate they have made using a line of best fit.
Identify outliers and explain why they may occur.
Given two sets of data in a table, model the relationship and make predictions
Common misconceptions
Students often forget the difference between continuous and discrete data.
Often the ∑(� × �) is divided by the number of classes rather than ∑� when estimating the mean.
Students often forget the difference between continuous and discrete data.
Lines of best fit are often forgotten, but correct answers still obtained by sight.

– estimate the median from a histogram with equal class width or any other information, such as the number of people in a given interval;
• Produce line graphs: – read off frequency values, calculate
total population, find greatest and least values;
• Construct and interpret time-series graphs, comment on trends;
• Compare the mean and range of two distributions, or median or mode as appropriate;
• Recognise simple patterns, characteristics relationships in bar charts, line graphs and frequency polygons;
• Draw and interpret scatter graphs in terms of the relationship between two variables;
• Draw lines of best fit by eye, understanding what these represent;
• Identify outliers and ignore them on scatter graphs;
• Use a line of best fit, or otherwise, to predict values of a variable given values of the other variable;
• Distinguish between positive, negative and zero correlation using lines of best fit, and interpret correlation in terms of the problem;
• Understand that correlation does not imply causality, and appreciate that correlation is a measure of the strength of the association between two variables and that zero correlation does not necessarily imply ‘no relationship’ but merely ‘no linear correlation’;
• Explain an isolated point on a scatter graph; • Use the line of best fit make predictions;
interpolate and extrapolate apparent trends whilst knowing the dangers of so doing.
4. Fractions, ratio and percentages
• Fractions and percentages - Fractions - Percentages - Fractions, decimals
and percentages
� Express a given number as a fraction of another;
� Find equivalent fractions and compare the size of fractions;
� Write a fraction in its simplest form, including using it to simplify a calculation, e.g. 50 ÷ 20 = ��
�� = �
� = 2.5;
� Find a fraction of a quantity or measurement, including within a context;
� Convert a fraction to a decimal to make a calculation easier;
� Convert between mixed numbers and improper fractions;
� Add and subtract fractions, including mixed numbers;
� Multiply and divide fractions, including mixed numbers and whole numbers and vice versa;
� Understand and use unit fractions as multiplicative inverses;
� By writing the denominator in terms of its prime factors, decide whether fractions can be converted to recurring or terminating decimals;
� Convert a fraction to a recurring decimal and vice versa;
� Find the reciprocal of an integer, decimal or fraction;
� Convert between fractions, decimals and percentages;
� Express a given number as a percentage of another number;
� Express one quantity as a percentage of another where the percentage is greater than 100%
� Find a percentage of a quantity; � Find the new amount after a percentage
increase or decrease;
Express a given number as a fraction of another, including where the fraction is, for example, greater than 1, e.g. ���
��� = 1 �
�� = 1�
�.
Answer the following: James delivers 56 newspapers. �
� of the
newspapers have a magazine. How many of the newspapers have a magazine?
Prove whether a fraction is terminating or recurring.
Convert a fraction to a decimal including where the fraction is greater than 1.
Be able to work out the price of a deposit, given the price of a sofa is £480 and the deposit is 15% of the price, without a calculator.
Find fractional percentages of amounts, with and without using a calculator.
Convince me that 0.125 is ��.
Keywords
Addition, subtraction, multiplication, division, fractions, mixed, improper, recurring, reciprocal, integer, decimal, termination, percentage, VAT, increase, decrease, multiplier, profit, loss, ratio, proportion, share, parts
Common misconceptions
The larger the denominator, the larger the fraction.
Incorrect links between fractions and decimals, such as thinking that �
� =
0.15, 5% = 0.5, 4% = 0.4, etc.
It is not possible to have a
� Ratio and proportion - Ratios - Ratio and
proportion
� Work out a percentage increase or decrease, including: simple interest, income tax calculations, value of profit or loss, percentage profit or loss;
� Compare two quantities using percentages, including a range of calculations and contexts such as those involving time or money;
� Find a percentage of a quantity using a multiplier and use a multiplier to increase or decrease by a percentage in any scenario where percentages are used;
• Express the division of a quantity into a
number parts as a ratio; • Write ratios in form 1 : � or � : 1 and to
describe a situation; • Write ratios in their simplest form, including
three-part ratios; • Divide a given quantity into two or more
parts in a given part : part or part : whole ratio;
• Use a ratio to find one quantity when the other is known;
• Write a ratio as a fraction and as a linear function;
• Identify direct proportion from a table of values, by comparing ratios of values;
• Use a ratio to compare a scale model to real-life object;
• Use a ratio to convert between measures and currencies, e.g. £1.00 = €1.36;
• Scale up recipes; • Convert between currencies.
Write/interpret a ratio to describe a situation such as 1 blue for every 2 red …, 3 adults for every 10 children …
Recognise that two paints mixed red to yellow 5 : 4 and 20 : 16 are the same colour.
When a quantity is split in the ratio 3:5, what fraction does each person get?
Find amounts for three people when amount for one given.
Express the statement ‘There are twice as many girls as boys’ as the ratio 2 : 1 or the linear function � = 2�, where � is the number of boys and � is the number of girls.
percentage greater than 100%.
Students often identify a ratio-style problem and then divide by the number given in the question, without fully understanding the question.

5. Angles and trigonometry
• Polygons, angles and parallel lines
- Angle properties of triangles and quadrilaterals
- Interior angles of a polygon
- Exterior angles of a polygon
• Classify quadrilaterals by their geometric properties and distinguish between scalene, isosceles and equilateral triangles;
• Understand ‘regular’ and ‘irregular’ as applied to polygons;
• Understand the proof that the angle sum of a triangle is 180°, and derive and use the sum of angles in a triangle;
• Use symmetry property of an isosceles triangle to show that base angles are equal;
• Find missing angles in a triangle using the angle sum in a triangle AND the properties of an isosceles triangle;
• Understand a proof of, and use the fact that, the exterior angle of a triangle is equal to the sum of the interior angles at the other two vertices;
• Explain why the angle sum of a quadrilateral is 360°; use the angle properties of quadrilaterals and the fact that the angle sum of a quadrilateral is 360°;
• Understand and use the angle properties of parallel lines and find missing angles using the properties of corresponding and alternate angles, giving reasons;
• Use the angle sums of irregular polygons; • Calculate and use the sums of the interior
angles of polygons; use the sum of angles in a triangle and use the angle sum in any polygon to derive the properties of regular polygons;
• Use the sum of the exterior angles of any polygon is 360°;
• Use the sum of the interior angles of an �-sided polygon;
• Use the sum of the interior angle and the exterior angle is 180°;
• Find the size of each interior angle, or the size of each exterior angle, or the number of
Name all quadrilaterals that have a specific property.
Given the size of its exterior angle, how many sides does the polygon have?
What is the same, and what is different between families of polygons?
Keywords
Quadrilateral, angle, polygon, interior, exterior, proof, tessellation, symmetry, parallel, corresponding, alternate, co-interior, vertices, edge, face, sides, Pythagoras’ Theorem, sine, cosine, tan, trigonometry, opposite, hypotenuse, adjacent, ratio, elevation, depression, segment, length

• Pythagoras theorem and
trigonometry - Pythagoras
theorem 1 - Pythagoras
theorem 2 - Trigonometry 1 - Trigonometry 2
sides of a regular polygon, and use the sum of angles of irregular polygons;
• Calculate the angles of regular polygons and use these to solve problems;
• Use the side/angle properties of compound shapes made up of triangles, lines and quadrilaterals, including solving angle and symmetry problems for shapes in the first quadrant, more complex problems and using algebra;
• Use angle facts to demonstrate how shapes would ‘fit together’, and work out interior angles of shapes in a pattern.
• Understand, recall and use Pythagoras’
Theorem in 2D; • Given three sides of a triangle, justify if it is
right-angled or not; • Calculate the length of the hypotenuse in a
right-angled triangle (including decimal lengths and a range of units);
• Find the length of a shorter side in a right-angled triangle;
• Calculate the length of a line segment "! given pairs of points;
• Give an answer to the use of Pythagoras’ Theorem in surd form;
• Understand, use and recall the trigonometric ratios sine, cosine and tan, and apply them to find angles and lengths in general triangles in 2D figures;
• Use the trigonometric ratios to solve 2D problems;
• Find angles of elevation and depression; • Know the exact values of sin � and cos � for
� = 0°, 30°, 45°, 60° and 90°; know the exact value of tan � for � = 0°, 30°, 45° and 60°.
Does 2, 3, 6 give a right-angled triangle?
Justify when to use Pythagoras’ Theorem and when to use trigonometry.
Common misconceptions
Answers may be displayed on a calculator in surd form.
Students forget to square root their final answer, or round their answer prematurely.
6. Graphs • Graphs: the basics and real-life graphs
- Graphing rates of change
- Real-life graphs - Line segments - More graphs
. Linear graphs and coordinate geometry
- Linear graphs - More linear graphs - Line segments
• Identify and plot points in all four quadrants; • Draw and interpret straight-line graphs for
real-life situations, including ready reckoner graphs, conversion graphs, fuel bills, fixed charge and cost per item;
• Draw distance-time and velocity-time graphs; • Use graphs to calculate various measures (of
individual sections), including: unit price (gradient), average speed, distance, time, acceleration; including using enclosed areas by counting squares or using areas of trapezia, rectangles and triangles;
• Find the coordinates of the midpoint of a line segment with a diagram given and coordinates;
• Find the coordinates of the midpoint of a line segment from coordinates;
• Calculate the length of a line segment given the coordinates of the end points;
• Find the coordinates of points identified by geometrical information.
• Find the equation of the line through two given points
• Plot and draw graphs of � = �, � = �, � = �
and � = −�, drawing and recognising lines parallel to axes, plus � = � and � = −�;
• Identify and interpret the gradient of a line segment;
• Recognise that equations of the form � = �� + � correspond to straight-line graphs in the coordinate plane;
Interpret a description of a journey into a distance-time or speed-time graph.
Calculate various measures given a graph.
Calculate an end point of a line segment given one coordinate and its midpoint.
Find the equation of the line passing through two coordinates by calculating the gradient first.
Understand that the form � = �� + � or �� + �� = � represents a straight line.
Keywords
Coordinate, axes, 3D, Pythagoras, graph, speed, distance, time, velocity, quadratic, solution, root, function, linear, circle, cubic, approximate, gradient, perpendicular, parallel, equation
Common misconceptions
Where line segments cross the �-axis, finding midpoints and lengths of segments is particularly challenging as students have to deal with negative numbers
Students can find visualisation of a question difficult, especially when dealing with gradients resulting from
� Quadratic, cubic and other graphs
- Quadratic graphs
• Identify and interpret the gradient and �-intercept of a linear graph given by equations of the form � = �� + �;
• Find the equation of a straight line from a graph in the form � = �� + �;
• Plot and draw graphs of straight lines of the form � = �� + � with and without a table of values;
• Sketch a graph of a linear function, using the gradient and �-intercept (i.e. without a table of values);
• Find the equation of the line through one point with a given gradient;
• Identify and interpret gradient from an equation �� + �� = �;
• Find the equation of a straight line from a graph in the form �� + �� = �;
• Plot and draw graphs of straight lines in the form �� + �� = �;
• Interpret and analyse information presented in a range of linear graphs:
• Explore the gradients of parallel lines and lines perpendicular to each other;
• Interpret and analyse a straight-line graph and generate equations of lines parallel and perpendicular to the given line;
• Select and use the fact that when � = �� + � is the equation of a straight line, then the gradient of a line parallel to it will have a gradient of � and a line perpendicular to this line will have a gradient of − �
6.
• Recognise a linear, quadratic, cubic,
reciprocal and circle graph from its shape; • Generate points and plot graphs of simple
quadratic functions, then more general quadratic functions;
Select and use the correct mathematical techniques to draw linear, quadratic, cubic and reciprocal graphs.
Identify a variety of functions by the shape of the graph.
negative coordinates.

- Cubic and reciprocal graphs
- Other graphs
• Find approximate solutions of a quadratic equation from the graph of the corresponding quadratic function;
• Interpret graphs of quadratic functions from real-life problems;
• Draw graphs of simple cubic functions using tables of values;
• Interpret graphs of simple cubic functions, including finding solutions to cubic equations;
• Draw graphs of the reciprocal function � = �
�
with � ≠ 0 using tables of values; • Draw circles, centre the origin, equation �2 +
�2 = 52.
7. Area and volume
� Perimeter, area and circles
- Perimeter and area
- Circles - Sectors of
circles
• Calculate the area of compound shapes made from triangles, rectangles, trapezia and parallelograms using a variety of metric measures;
• Find the perimeter of a rectangle, trapezium and parallelogram using a variety of metric measures;
• Calculate the perimeter of compound shapes made from triangles and rectangles;
• Estimate area and perimeter by rounding measurements to 1 significant figure to check reasonableness of answers;
• Recall the definition of a circle and name and draw parts of a circle;
• Recall and use formulae for the circumference of a circle and the area enclosed by a circle (using circumference = 275 = 79 and area of a circle = 752) using a variety of metric measures;
• Use 7 ≈ 3.142 or use the 7 button on a calculator;
• Calculate perimeters and areas of composite shapes made from circles and parts of circles (including semicircles, quarter-circles, combinations of these and also incorporating other polygons);
• Calculate arc lengths, angles and areas of sectors of circles;
Calculate the area and/or perimeter of shapes with different units of measurement.
Understand that answers in terms of 7 are more accurate.
Calculate the perimeters and/or areas of circles, semicircles and quarter-circles given the radius or diameter and vice versa.
Keywords
Triangle, rectangle, parallelogram, trapezium, area, perimeter, formula, length, width, prism, compound, measurement, polygon, cuboid, volume, nets, isometric, symmetry, vertices, edge, face, circle, segment, arc, sector, cylinder, circumference, radius, diameter, pi, composite, sphere, cone, capacity, hemisphere, segment, frustum, bounds, accuracy, surface area
� 3D forms and volume, cylinders, cones and spheres
- Prisms - Cylinders and
spheres - Pyramids and
cones
• Find radius or diameter, given area or circumference of circles in a variety of metric measures;
• Give answers to an appropriate degree of accuracy or in terms of 7;
• Form equations involving more complex shapes and solve these equations.
• Find the surface area of prisms using the
formulae for triangles and rectangles, and other (simple) shapes with and without a diagram;
• Draw sketches of 3D solids and identify planes of symmetry of 3D solids, and sketch planes of symmetry;
• Recall and use the formula for the volume of a cuboid or prism made from composite 3D solids using a variety of metric measures;
• Convert between metric measures of volume and capacity, e.g. 1 ml = 1 cm3;
• Use volume to solve problems; • Estimating surface area, perimeter and
volume by rounding measurements to 1 significant figure to check reasonableness of answers;
• Use 7 ≈ 3.142 or use the 7 button on a calculator;
• Find the volume and surface area of a cylinder;
Given dimensions of a rectangle and a pictorial representation of it when folded, work out the dimensions of the new shape.
Work out the length given the area of the cross-section and volume of a cuboid.
Understand that answers in terms of 7 are more accurate.
Given two solids with the same volume and the dimensions of one, write and solve an equation in terms of 7 to find the dimensions of the other, e.g. a sphere is melted down to make ball bearings of a given radius, how many will it make?
Common misconceptions
Students often get the concepts of area and perimeter confused.
Shapes involving missing lengths of sides often result in incorrect answers.
Diameter and radius are often confused, and recollection of area and circumference of circles involves incorrect radius or diameter.
� Accuracy and bounds - Units and
accuracy - Accuracy
-
• Recall and use the formula for volume of pyramid;
• Find the surface area of a pyramid; • Use the formulae for volume and surface
area of spheres and cones; • Solve problems involving more complex
shapes and solids, including segments of circles and frustums of cones;
• Find the surface area and volumes of compound solids constructed from cubes, cuboids, cones, pyramids, spheres, hemispheres, cylinders;
• Give answers to an appropriate degree of accuracy or in terms of 7;
• Form equations involving more complex shapes and solve these equations.
• Calculate the upper and lowers bounds of
numbers given to varying degrees of accuracy;
• Calculate the upper and lower bounds of an expression involving the four operations;
• Find the upper and lower bounds in real-life situations using measurements given to appropriate degrees of accuracy;
• Find the upper and lower bounds of calculations involving perimeters, areas and volumes of 2D and 3D shapes;
• Calculate the upper and lower bounds of calculations, particularly when working with measurements;
Use inequality notation to specify an error interval due to truncation or rounding
Round 16,000 people to the nearest 1000.
Round 1100 g to 1 significant figure.
Work out the upper and lower bounds of a formula where all terms are given to 1 decimal place.
Be able to justify that measurements to the nearest whole unit may be inaccurate by up to one half in either direction.
Students readily accept the rounding for lower bounds, but take some convincing in relation to upper bounds.

8. Transformations and constructions
� Transformations - Reflection and
rotation - Enlargement - Transformations
and combinations of transformations
• Distinguish properties that are preserved under particular transformations;
• Recognise and describe rotations – know that they are specified by a centre and an angle;
• Rotate 2D shapes using the origin or any other point (not necessarily on a coordinate grid);
• Identify the equation of a line of symmetry; • Recognise and describe reflections on a
coordinate grid – know to include the mirror line as a simple algebraic equation, � = �, � = �, � = �, � = −� and lines not parallel to the axes;
• Reflect 2D shapes using specified mirror lines including lines parallel to the axes and also � = � and � = −�;
• Recognise and describe single translations using column vectors on a coordinate grid;
• Translate a given shape by a vector; • Understand the effect of one translation
followed by another, in terms of column vectors (to introduce vectors in a concrete way);
• Enlarge a shape on a grid without a centre specified;
Recognise similar shapes because they have equal corresponding angles and/or sides scaled up in same ratio.
Understand that translations are specified by a distance and direction (using a vector).
Recognise that enlargements preserve angle but not length.
Understand that distances and angles are preserved under rotations, reflections and translations so that any shape is congruent to its image.
Understand that similar shapes are enlargements of each other and angles are preserved.
Keywords
Rotation, reflection, translation, transformation, enlargement, scale factor, vector, centre, angle, direction, mirror line, centre of enlargement, describe, distance, congruence, similar, combinations, single, corresponding, constructions, compasses, protractor, bisector, bisect, line segment, perpendicular, loci, bearing
� Constructions, loci and bearings
- 3D solids - Bearings and
scale drawings - Constructions - loci
• Describe and transform 2D shapes using enlargements by a positive integer, positive fractional, and negative scale factor;
• Know that an enlargement on a grid is specified by a centre and a scale factor;
• Identify the scale factor of an enlargement of a shape;
• Enlarge a given shape using a given centre as the centre of enlargement by counting distances from centre, and find the centre of enlargement by drawing;
• Find areas after enlargement and compare with before enlargement, to deduce multiplicative relationship (area scale factor); given the areas of two shapes, one an enlargement of the other, find the scale factor of the enlargement (whole number values only);
• Use congruence to show that translations, rotations and reflections preserve length and angle, so that any figure is congruent to its image under any of these transformations;
• Describe and transform 2D shapes using combined rotations, reflections, translations, or enlargements;
• Describe the changes and invariance achieved by combinations of rotations, reflections and translations.
• Understand and draw front and side
elevations and plans of shapes made from simple solids;
• Given the front and side elevations and the plan of a solid, draw a sketch of the 3D solid;
• Use and interpret maps and scale drawings, using a variety of scales and units;
• Read and construct scale drawings, drawing lines and shapes to scale;
• Estimate lengths using a scale diagram;
Able to read and construct scale drawings.
When given the bearing of a point " from point !, can work out the bearing of ! from ".
Know that scale diagrams, including bearings and maps, are ‘similar’ to the real-life examples.
Common misconceptions
Students often use the term ‘transformation’ when describing transformations instead of the required information.
Lines parallel to the coordinate axes often get confused
Correct use of a protractor may be an issue

• Understand, draw and measure bearings; • Calculate bearings and solve bearings
problems, including on scaled maps, and find/mark and measure bearings
• Use the standard ruler and compass constructions:
– bisect a given angle; – construct a perpendicular to a given
line from/at a given point; – construct angles of 90°, 45°; – perpendicular bisector of a line
segment; • Construct:
– a region bounded by a circle and an intersecting line;
– a given distance from a point and a given distance from a line;
– equal distances from two points or two line segments;
– regions which may be defined by ‘nearer to’ or ‘greater than’;
• Find and describe regions satisfying a combination of loci, including in 3D;
• Use constructions to solve loci problems including with bearings;
Know that the perpendicular distance from a point to a line is the shortest distance to the line
Able to sketch the locus of point on a vertex of a rotating shape as it moves along a line, of a point on the circumference and at the centre of a wheel.
9. Equations and inequalities
� Solving quadratic and simultaneous equations
- Solving quadratic equations
- Completing the square
- Solving simple simultaneous equations
- More simultaneous equations
- Solving linear and quadratic simultaneous equations
� Inequalities - Solving linear
equations
• Factorise quadratic expressions in the form ��2 + �� + �;
• Set up and solve quadratic equations; • Solve quadratic equations by factorisation
and completing the square; • Solve quadratic equations that need
rearranging; • Solve quadratic equations by using the
quadratic formula; • Find the exact solutions of two simultaneous
equations in two unknowns; • Use elimination or substitution to solve
simultaneous equations; • Solve exactly, by elimination of an unknown,
two simultaneous equations in two unknowns:
– linear / linear, including where both need multiplying;
– linear / quadratic; – linear / �2 + �2 = 52;
• Set up and solve a pair of simultaneous equations in two variables for each of the above scenarios, including to represent a situation;
• Interpret the solution in the context of the problem;
• Show inequalities on number lines; • Write down whole number values that satisfy
an inequality;
Solve 3�2 + 4 = 100.
Know that the quadratic formula can be used to solve all quadratic equations, and often provides a more efficient method than factorising or completing the square.
Have an understanding of solutions that can be written in surd form
Keywords
Quadratic, solution, root, linear, solve, simultaneous, inequality, completing the square, factorise, rearrange, surd, function, solve, circle, sets, union, intersection
Common misconceptions
Using the formula involving negatives can result in incorrect answers.
If students are using calculators for the quadratic formula, they can come to rely on them and miss the fact that some solutions can be left in surd form.
10. Probability
� Probability - Combined
events - Mutually
exclusive events - Experimental
probability - Independent
events and tree diagrams
- Conditional probability
- Venn diagrams and notation
• Solve simple linear inequalities in one variable, and represent the solution set on a number line;
• Solve two linear inequalities in �, find the solution sets and compare them to see which value of � satisfies both solve linear inequalities in two variables algebraically;
• Use the correct notation to show inclusive and exclusive inequalities.
• Write probabilities using fractions,
percentages or decimals; • Understand and use experimental and
theoretical measures of probability, including relative frequency to include outcomes using dice, spinners, coins, etc;
• Estimate the number of times an event will occur, given the probability and the number of trials;
• Find the probability of successive events, such as several throws of a single dice;
• List all outcomes for single events, and combined events, systematically;
• Draw sample space diagrams and use them for adding simple probabilities;
Use inequality symbols to compare numbers.
Given a list of numbers, represent them on a number line using the correct notation.
Solve equations involving inequalities.
If the probability of outcomes are �, 2�, 4�, 3�, calculate �.
Draw a Venn diagram of students studying French, German or both, and then calculate the probability that a student studies French given that they also study German.
When solving inequalities students often state their final answer as a number quantity, and exclude the inequality or change it to =.
Probability without replacement is best illustrated visually and by initially working out probability ‘with’ replacement.
• Know that the sum of the probabilities of all outcomes is 1;
• Use 1 − � as the probability of an event not occurring where � is the probability of the event occurring;
• Work out probabilities from Venn diagrams to represent real-life situations and also ‘abstract’ sets of numbers/values;
• Use union and intersection notation; • Find a missing probability from a list or two-
way table, including algebraic terms; • Understand conditional probabilities and
decide if two events are independent; • Draw a probability tree diagram based on
given information, and use this to find probability and expected number of outcome;
• Understand selection with or without replacement;
• Calculate the probability of independent and dependent combined events;
11. Multiplicative Reasoning
� Multiplicative reasoning - Percentages - Growth and
decay - Compound
measures - Distance, speed
and time - Direct and
inverse proportion
• Express a multiplicative relationship between two quantities as a ratio or a fraction, e.g. when ":! are in the ratio 3:5, " is �
�!. When
4� = 7�, then � = �:�
or �:� is 7:4;
• Solve proportion problems using the unitary method;
• Work out which product offers best value and consider rates of pay;
• Work out the multiplier for repeated proportional change as a single decimal number;
• Represent repeated proportional change using a multiplier raised to a power, use this to solve problems involving compound interest and depreciation;
• Understand and use compound measures and:
– convert between metric speed measures;
– convert between density measures; – convert between pressure
measures; • Use kinematics formulae from the formulae
sheet to calculate speed, acceleration, etc (with variables defined in the question);
• Calculate an unknown quantity from quantities that vary in direct or inverse proportion;
• Recognise when values are in direct proportion by reference to the graph form, and use a graph to find the value of � in � = ��;
• Set up and use equations to solve word and other problems involving direct proportion (this is covered in more detail in unit 19);
• Relate algebraic solutions to graphical representation of the equations;
• Recognise when values are in inverse proportion by reference to the graph form;
Change g/cm3 to kg/m3, kg/m2 to g/cm2, m/s to km/h.
Solve word problems involving direct and inverse proportion.
Understand direct proportion as: as � increases, � increases.
Understand inverse proportion as: as � increases, � decreases.
Keywords
Ratio, proportion, best value, unitary, proportional change, compound measure, density, mass, volume, speed, distance, time, density, mass, volume, pressure, acceleration, velocity, inverse, direct, constant of proportionality
12. Similarity and Congruence
� Similarity and congruence in 2D and 3D
- Congruence - Geometric
proof and congruence
- Similarity - Similarity in 3D
solids
• Set up and use equations to solve word and other problems involving inverse proportion, and relate algebraic solutions to graphical representation of the equations.
• Understand and use SSS, SAS, ASA and RHS
conditions to prove the congruence of triangles using formal arguments, and to verify standard ruler and pair of compasses constructions;
• Solve angle problems by first proving congruence;
• Understand similarity of triangles and of other plane shapes, and use this to make geometric inferences;
• Prove that two shapes are similar by showing that all corresponding angles are equal in size and/or lengths of sides are in the same ratio/one is an enlargement of the other, giving the scale factor;
• Use formal geometric proof for the similarity of two given triangles;
• Understand the effect of enlargement on angles, perimeter, area and volume of shapes and solids;
• Identify the scale factor of an enlargement of a similar shape as the ratio of the lengths of two corresponding sides, using integer or fraction scale factors;
• Write the lengths, areas and volumes of two shapes as ratios in their simplest form;
• Find missing lengths, areas and volumes in similar 3D solids;
• Know the relationships between linear, area and volume scale factors of mathematically similar shapes and solids;
• Use the relationship between enlargement and areas and volumes of simple shapes and solids;
Recognise that all corresponding angles in similar shapes are equal in size when the corresponding lengths of sides are not.
Understand that enlargement does not have the same effect on area and volume.
Understand, from the experience of constructing them, that triangles satisfying SSS, SAS, ASA and RHS are unique, but SSA triangles are not.
Keywords
Congruence, side, angle, compass, construction, shape, volume, length, area, volume, scale factor, enlargement, similar, perimeter, frustum
13. More trigonometry
� Graphs of trigonometric functions
- Graph of the sine function
- Graph of the cosine function
- The tangent function
- Transforming trigonometric graphs1
- Transforming trigonometric graphs 2
� Further trigonometry - Calculating
areas and the sine rule
- The cosine rule and 2D trigonometric problems
- Solving problems in 3D
• Recognise, sketch and interpret graphs of the trigonometric functions (in degrees) � = sin �, � = cos � and � = tan � for angles of any size.
• Know the exact values of sin � and cos � for � = 0°, 30°, 45° , 60° and 90° and exact value of tan � for � = 0°, 30°, 45° and 60° and find them from graphs.
• Apply to the graph of � = f(�) the transformations � = −f(�), � = f(−�) for sine, cosine and tan functions f(�).
• Apply to the graph of � = f(�) the transformations � = f(�) + �, � = f(� + �) for sine, cosine and tan functions f(�).
• Know and apply Area = ���� sin ; to calculate
the area, sides or angles of any triangle. • Know the sine and cosine rules, and use to
solve 2D problems (including involving bearings).
• Use the sine and cosine rules to solve 3D problems.
• Understand the language of planes, and recognise the diagonals of a cuboid.
• Solve geometrical problems on coordinate axes.
• Understand, recall and use trigonometric relationships and Pythagoras’ Theorem in right-angled triangles, and use these to solve problems in 3D configurations.
• Calculate the length of a diagonal of a cuboid. • Find the angle between a line and a plane.
Match the characteristic shape of the graphs to their functions and transformations.
Find the area of a segment of a circle given the radius and length of the chord.
Justify when to use the cosine rule, sine rule, Pythagoras’ Theorem or normal trigonometric ratios to solve problems.
Keywords
Axes, coordinates, sine, cosine, tan, angle, graph, transformations, side, angle, inverse, square root, 2D, 3D, diagonal, plane, cuboid
Common misconceptions
Not using the correct rule, or attempting to use ‘normal trig’ in non-right-angled triangles.
When finding angles students will be unable to rearrange the cosine rule or fail to find the inverse of cos �.
14. Further statistics
� Collecting data - Sampling
� Cumulative frequency, box plots and histograms
• Specify the problem and plan: – decide what data to collect and
what analysis is needed; – understand primary and secondary
data sources; – consider fairness;
• Understand what is meant by a sample and a population;
• Understand how different sample sizes may affect the reliability of conclusions drawn;
• Identify possible sources of bias and plan to minimise it;
• Write questions to eliminate bias, and understand how the timing and location of a survey can ensure a sample is representative (see note);
• By the end of the sub-unit, students should
be able to: • Use statistics found in all graphs/charts in
this unit to describe a population;
Explain why a sample may not be representative of a whole population.
Carry out their own statistical investigation and justify how sources of bias have been eliminated
Construct cumulative frequency graphs, box plots and histograms from frequency tables.
Keywords
Sample, population, fraction, decimal, percentage, bias, stratified sample, random, cumulative frequency, box plot, histogram, frequency density, frequency, mean, median, mode, range, lower quartile, upper quartile, interquartile range, spread, comparison, outlier
- Cumulative frequency
- Box plots - Drawing
histograms - Interpreting
histograms - Comparing and
describing populations
• Know the appropriate uses of cumulative frequency diagrams;
• Construct and interpret cumulative frequency tables, cumulative frequency graphs/diagrams and from the graph:
– estimate frequency greater/less than a given value;
– find the median and quartile values and interquartile range;
• Compare the mean and range of two distributions, or median and interquartile range, as appropriate;
• Interpret box plots to find median, quartiles, range and interquartile range and draw conclusions;
• Produce box plots from raw data and when given quartiles, median and identify any outliers;
• Know the appropriate uses of histograms; • Construct and interpret histograms from
class intervals with unequal width; • Use and understand frequency density; • From histograms:
– complete a grouped frequency table;
– understand and define frequency density;
• Estimate the mean and median from a histogram with unequal class widths or any other information from a histogram, such as the number of people in a given interval.
Compare two data sets and justify their comparisons based on measures extracted from their diagrams where appropriate in terms of the context of the data.
Common misconceptions
Labelling axes incorrectly in terms of the scales, and also using ‘Frequency’ instead of ‘Frequency Density’ or ‘Cumulative Frequency’.
Students often confuse the methods involved with cumulative frequency, estimating the mean and histograms when dealing with data tables.
15. Equations and graphs
� Quadratics, expanding more than two brackets, sketching graphs, graphs of circles, cubes and quadratics
- Solving simultaneous equations graphically
- Representing inequalities graphically
- Graphs of quadratic functions
- Solving quadratic equations graphically
- Graphs of cubic functions
• Sketch a graph of a quadratic function, by factorising or by using the formula, identifying roots, �-intercept and turning point by completing the square;
• Be able to identify from a graph if a quadratic equation has any real roots;
• Find approximate solutions to quadratic equations using a graph;
• Expand the product of more than two linear expressions;
• Sketch a graph of a quadratic function and a linear function, identifying intersection points;
• Sketch graphs of simple cubic functions, given as three linear expressions;
• Solve simultaneous equations graphically: – find approximate solutions to
simultaneous equations formed from one linear function and one quadratic function using a graphical approach;
– find graphically the intersection points of a given straight line with a circle;
– solve simultaneous equations representing a real-life situation graphically, and interpret the solution in the context of the problem;
• Solve quadratic inequalities in one variable, by factorising and sketching the graph to find critical values;
• Represent the solution set for inequalities using set notation, i.e. curly brackets and ‘is an element of’ notation;
– for problems identifying the solutions to two different inequalities, show this as the intersection of the two solution sets,
Expand �(� − 1)(� + 2).
Expand (� − 1)3.
Expand (� + 1)(� + 2)(� − 1).
Sketch � = (� + 1)2(� − 2).
Interpret a pair of simultaneous equations as a pair of straight lines and their solution as the point of intersection.
Be able to state the solution set of �² − 3� − 10 < 0 as {�: � < −3} ∪ {�: � > 5}.
Keywords
Sketch, estimate, quadratic, cubic, function, factorising, simultaneous equation, graphical, algebraic
Common misconceptions
When estimating values from a graph, it is important that students understand it is an ‘estimate’.
It is important to stress that when expanding quadratics, the � terms are also collected together.
Quadratics involving negatives sometimes cause numerical errors.
i.e. solution of �² − 3� − 10 < 0 as {�: −3 < � < 5};
• Solve linear inequalities in two variables graphically;
• Show the solution set of several inequalities in two variables on a graph;
Use iteration with simple converging sequences