year 3 of: irrigating the soil to maximize the crop
TRANSCRIPT
YEAR 3 OF: IRRIGATING THE SOIL TO MAXIMIZE THE CROP
Ole Wendroth (PI), University of Kentucky, College of Agriculture, Food and Environment, Department of Plant & Soil Sciences, PH: (859) 257-4768; E-mail: [email protected] Javier Reyes (Graduate Student, Ph.D.), College of Agriculture, Food and Environment,
Department of Plant & Soil Sciences, E-mail: [email protected] Chad Lee (Co-PI), University of Kentucky, College of Agriculture, Food and Environment,
Department of Plant & Soil Sciences, PH: (859) 257-3203; E-mail: [email protected] Project Report Year 3: With this document, we submit our research report on the accomplishments during year 3 of this 3-year project. YEAR-3 SUMMARY Despite sufficient total annual rainfall in Kentucky, irrigation for efficient crop production and for securing high yields becomes increasingly relevant because draught periods often occur at times and crop growth stages when the water is needed. Due to geomorphology of our Kentuckian landscapes, farmers’ field soils exhibit substantial spatial variability of properties. Within the same field, the soil type can vary between silt loam and silty clay loam, or clay loam due to erosion processes that have caused former B-horizons that were rich in clay to now become the top horizon. These geomorphological processes have triggered a pattern of soil heterogeneity with different soil hydraulic properties. Due to this heterogeneity, we can find zones with locally differing water infiltration behavior. We hypothesize that these zones and their different soil functions need to be considered for irrigation management. Zones with high clay contents cannot take up water at the same rate as zones with silt loam soil can. Irrigation rate needs to be adapted for the spatial variability of infiltration capacity in order to avoid unintended water losses. In this report, we show how the locations of different functional zones within a
farmer’s field can be derived from other information sources. According to the purpose of this project, with the results presented here, we demonstrate “a strategy for deriving a map of functional soil water characteristics based on easily obtainable land surface observations”. The purpose of this project is to develop a strategy for deriving a map of functional soil water characteristics based on easily obtainable land surface observations. The objectives are
• to derive a field-scale characterization of soil hydraulic properties for better irrigation management,
• to implement this information and sporadic soil and crop measurements into a computer model for describing the annual water status in different zones across the field while taking into account crop growth, and
• to evaluate different sources of land surface remotely sensed information as a basis for upscaling detailed information and knowledge to improve irrigation management at a regional scale.

REPORT ON ACCOMPLISHMENTS DURING YEAR 3
Fig. 1. VERIS 3100 device for measuring electrical conductivity. Small photo shows one of the six disc coulters. Photo: Ole Wendroth
Our research Project is conducted at Hillview Farms (Trevor Gilkey) in Princeton, Caldwell County, KY. The Hargis field is equipped with a center pivot irrigation system which covers a total area of approximately 70 acres. Over the past three years, we have been taking numerous soil and crop data sets, many of which typically can be taken under farm conditions without extreme experimental efforts and laboratory
SUMMARY OF RESULTS OBTAINED IN YEAR 2: • Electrical Conductivity (EC) measurements with the VERIS 3100 (Figure 1) supported the
estimation of a clay content map with low, affordable one-time soil sampling effort (1 sample per 5 acres).
• The EC-based clay content map together with satellite-based NDVI and airborne LIDAR-based slope of the land surface are effective variables for management zone delineation that can be used for the right irrigation rate if a variable rate irrigation system is available or if the irrigation rate can be modified through the pivot speed.
• The readily existing information from satellite and LIDAR-based elevation data in combination with a one-time EC scanning and relatively low soil sampling effort manifest an efficient combination of variables that are helpful to farmers to delineate their fields in different mapping zones for irrigation management.

analyses. In the following, we briefly describe the source of information for different maps and how helpful these different measurements or surveys are in delineating mapping zones for site-specific or variable-rate irrigation management.
Fig. 2. Maps of spatial distribution of clay content at 0-8 inches, and 8-16 inches, NDVI June 2015, organic matter, total nitrogen, extractable phosphorous, slope, topographic wetness index, and
apparent electrical conductivity at a shallow depth (0-12 inches). Black dots represent the soil sampling grid.

In Figure 2, the upper row of panels shows from left to right, soil clay content between 0-8 inch, and 8-16 inch depth, respectively, and an NDVI map obtained in June 2015. Soil clay content maps were based on soil cores in combination with an electrical conductivity (EC) map obtained with a Veris 3100 device. EC depends on many different soil properties, such as soil clay content, soil water content, bulk density, soil organic matter and nutrient content. Therefore, an interpretation of an EC map is only possible if additional measurements of these soil properties are available. Also, if we took EC measurements during different times of the year, the result would differ. Under farm conditions, there are only two time periods when an EC scan can be conducted, i.e., after harvest and before planting. In late summer or fall after harvest, when the soil is dry, EC is usually lower than in spring time before planting when the soil is moist and water between the clay particles causes a high EC. After harvest, crop residue may impede a good penetration of the coulters and maintaining a constant appropriate working depth becomes problematic if not impossible. For many reasons, we recommend spring time as suitable for a good EC map because the soil is moist enough to allow good contact between the soil and the disc coulters while it is dry enough to prevent soil compaction by the pulling tractor. As results of this project revealed, we can obtain the clay content map as shown above by taking only one soil sample every 5 acres and combine it with EC data in a spatial estimation procedure called cokriging. In other words, the clay maps shown in Figure 2 are based on 12 sampling points. Notice that such a measurement would not have to be repeated annually. Once a set of soil samples is taken and analyzed, the data and the maps can be used for many years. In the right hand side of the upper panel, the NDVI map is shown. NDVI is a crop index based on canopy reflectance at two wavelengths, i.e., near infrared (NIR) and red (RED) light:
REDNIRREDNIRNDVI
+−
=
The index varies between zero and 1. It reflects the activity of a growing canopy. A growing crop with sufficient water supply shows a higher NDVI than a crop that is short in water or nitrogen or that is close to or at maturity. NDVI reflects vitality of the plant. NDVI or related Indices can be measured with crop sensors that are mounted to tractors or sprayers for site-specific nitrogen fertilization, e.g., the Green Seeker or the HydroN Sensor; or they can be obtained from satellite images. Data at a resolution of approximately 98 by 98 feet are in the public domain for no charge. The Landsat-8 satellite delivers a new scene approximately every two weeks. However, data can only be used if there are no or only very few clouds when the satellite passes the area of interest. The data underlying this NDVI map were downloaded from the Landsat-8 website and then interpolated to a finer resolution. Results obtained in this project and not shown here indicate a good agreement between GreenSeeker and Landsat-8. The second row of panels in Figure 1 presents maps of soil organic matter, total nitrogen and extractable P. These maps are based on a one-time snapshot of soil sampling at 96 points at a 164 by 164 feet grid. These data are relatively laborious to obtain at a representative level for a field of this size. The left and middle maps in the lower row of panels in Figure 2 depict slope and topographic wetness index (TWI). Both of these maps are based on an airborne LIDAR scan that is available at the Kentucky State Government at a resolution of approximately 5 feet in the horizontal direction. The slope gives a hint to geomorphologic processes that happened in the past and it shows where we might have to expect surface runoff. The combination of slope and clay content can tell a lot about limited water infiltration and potential surface runoff. The topographic wetness index is an important landform classifier. It shows us where in a farmer’s field we can expect zones where water may accumulate fed by lateral surface or subsurface flow. Those zones may be the higher yielding ones in dry years. The longer a slope, the larger is the local catchment of water. We may

expect to see similarities between the TWI map and the flow pattern of water observable in a farmer’s field at the end of winter when long rainfall periods have caused surface runoff, and water has carried crop residue along the slope to lower landscape positions where residues settles and accumulates. In the right hand side of the lower row of panels, a map of EC is shown for the lower soil depth, i.e., representing the upper 8 inches of soil. Visually comparing all these maps, we can see similarities in patterns at least in some parts of the maps. Both clay content maps, EC, NDVI and Slope show similar spatial behavior. In the following, a clustering method was applied to select combinations of different variables to delineate the soil in this field into functional subunits or mapping zones. Two different clustering systems were evaluated. One is called FANNY, the other CLARA. They are based on different technicalities regarding the identification of variables that are considered effective to delineate a field into different management zones. In Figure 3, the results are shown for the two different clustering methods first for some principal components in the upper pair of panels, then in panel C and D for the variable combination of soil clay content in the upper 8 inches depth, soil organic matter content and TWI. When looking for a combination of four variables, upper and lower layer soil clay content, NDVI and slope were efficient combinations dividing the field up into three
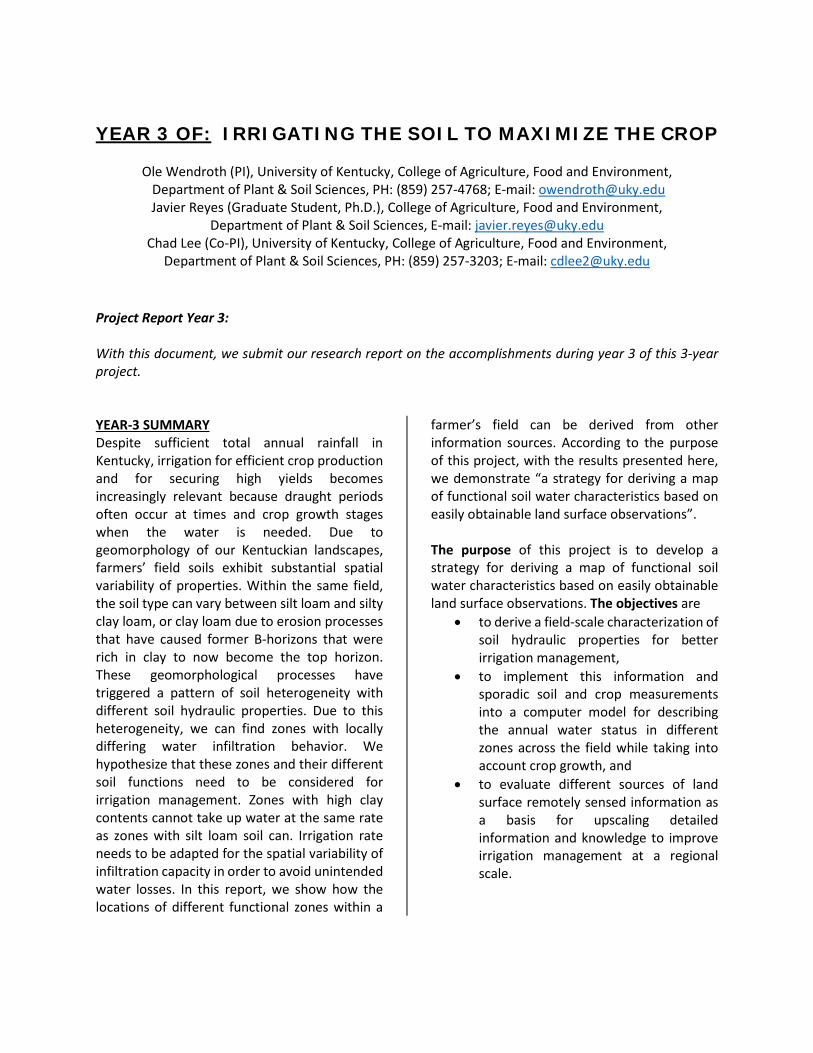
functional zones, as shown in Figure 3E and F. These zones 1, 2, and 3 reveal differences in their soil water dynamics and should be considered for different irrigation management. Based on measurements in three locations, one in each of the three zones, we demonstrate here the water dynamics by showing the typical soil water tension behavior over time in Figure 4. In the three panels, the black bars represent daily precipitation. The red, blue and green lines are soil water tension measured on an hourly basis at 8, 16 and 24 inches depth, respectively. The higher the soil water tension, the drier the soil becomes. We see that clusters 1 and 2 do not differ as strongly from each other as cluster 3 does from clusters 1 and 2. Remember, cluster 3 is in the area that is characterized by the highest clay contents. The soil dries out faster in the clayey area than in the more silty clusters 1 and 2. On the other hand, rainfall or irrigation cause a faster response of tension in the upper layer of the clayey zone, however only in that layer because the water only slowly redistributes to deeper soil layers and therefore excessive water application from irrigation or natural rainfall might cause surface runoff. We conclude that a common high rate of 7/10 inch should not be applied over the entire field. This rate would definitely be too high for cluster 3, and possibly too large for cluster 2 whereas the infiltration capacity would be sufficient in cluster 1. Lower, more frequent irrigation paths are appropriate for cluster 3 and probably in cluster 2.

Fig. 3. Maps of delineated management zones. Based on maps of principal components factor scores by using A) FANNY and B) CLARA; based on Clay content at 0-20 cm, Organic matter and Topographic
wetness index by using C) FANNY and D) CLARA; based on Clay at 0-20 cm and 20-40 cm, NDVI at June 2015, and Slope by using E) FANNY and F) CLARA.
Clay upper +Clay lower+NDVI June +Slope
Clay upper + OM+ TWI
FANNY
FANNY
FANNY
PC1+PC2+PC3
CLARA
CLARA
CLARA
A
C
E
B
D
F
Fig. 4. Soil water tension and precipitation at different cluster areas. Moreover, in order to increase the infiltration capacity in clusters 2 and 3, we recommend to manage crop residue carefully, i.e., avoid surface runoff that would erode the crop residue downhills, and maintain the soil surface as rough as possible to increase the surface area that is open to let water infiltrate. OUTLOOK By the time, we submit this report, the project is not completed. Javier Reyes, one of the graduate students will finish his thesis in spring 2018, Xi Zhang, the other graduate student is expected to finish by the end of 2018. Expected outcomes are finalizing the delineation procedure to provide a ready-to-use algorithm for the clustering and
delineation computations. Another outcome will be an improved system for indirectly estimating soil water permeability from other already existing information such as soil textural composition to adequately characterize the infiltration capacity of soils. ACKNOWLEDGEMENT We gratefully acknowledge the support of this project by the Kentucky Corn Growers’ Association, the Kentucky Small Grain Growers’ Association, and the Kentucky Soybean Board as well as the College of Agriculture, Food and Environment and the Department of Plant & Soil Sciences.
4/18/2016 5/2/2016 5/16/2016 5/30/2016 6/13/2016
Precipitation (mm
)
0
10
20
30
40
50
Soil
wat
er te
nsio
n (K
Pa)
0
20
40
60
80
100
120Precipitation20 cm 40 cm 60 cm
4/18/2016 5/2/2016 5/16/2016 5/30/2016 6/13/2016
0
10
20
30
40
50
Soil
wat
er te
nsio
n (K
Pa)
0
20
40
60
80
100
120Precipitation 20 cm 40 cm 60 cm
4/18/2016 5/2/2016 5/16/2016 5/30/2016 6/13/2016
0
10
20
30
40
50So
il w
ater
tens
ion
(KPa
)
0
20
40
60
80
100
120
Precipitation20 cm 40 cm 60 cm
Cluster 1 Cluster 2 Cluster 3